
Hotel Industry Trends & Predictions 1 - Presented by Stephen Rushmore Jr., MAI, CRE, FRICS President...
24
-1- Presented by Stephen Rushmore Jr., MAI, CRE, FRICS President and CEO of HVS Hotel Industry Trends & Predictions
Transcript of Hotel Industry Trends & Predictions 1 - Presented by Stephen Rushmore Jr., MAI, CRE, FRICS President...

- 1 -
Presented by Stephen Rushmore Jr., MAI, CRE, FRICS
President and CEO of HVS
Hotel Industry Trends & Predictions

- 2 -
The Last Ten Years

- 3 -
The Next Four Years
- 4 -
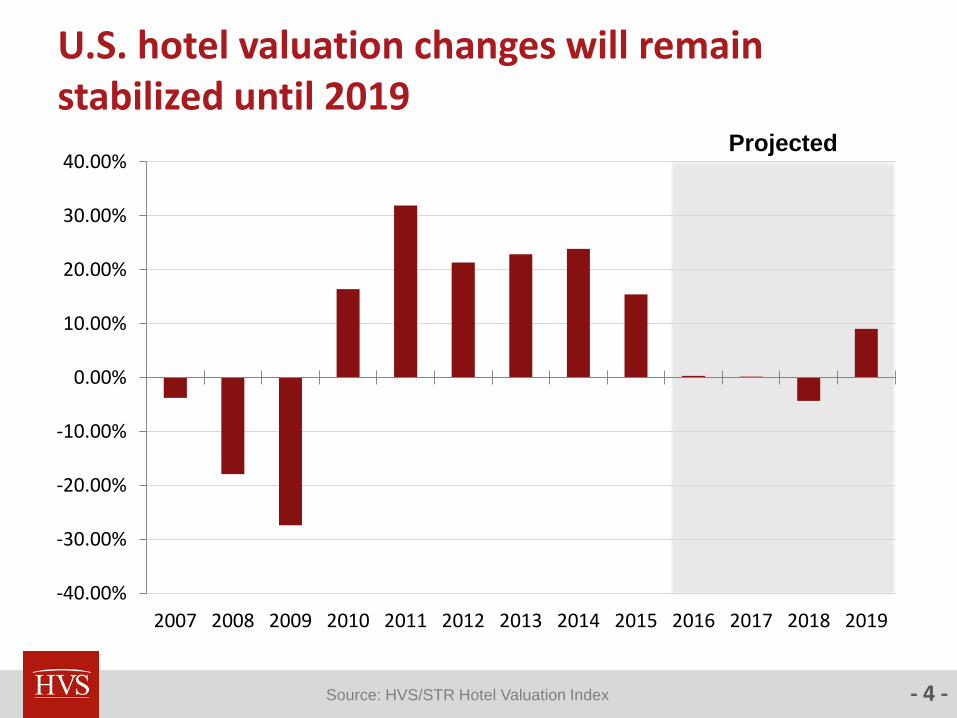
U.S. hotel valuation changes will remain stabilized until 2019
Projected
Source: HVS/STR Hotel Valuation Index
-40.00%
-30.00%
-20.00%
-10.00%
0.00%
10.00%
20.00%
30.00%
40.00%
2007 2008 2009 2010 2011 2012 2013 2014 2015 2016 2017 2018 2019

- 5 -
The HVI measures changes in value and provides a tool for identifying hotel acquisition and disposition opportunities
The 2016 HVS-STR Hotel Valuation Index (HVI)

- 6 -
Oakland and San Jose markets appreciated the most in value during 2015
Source: HVS/STR Hotel Valuation Index
0% 5% 10% 15% 20% 25% 30%
Oakland
San Jose
Tampa
Phoenix
Salt Lake City
Richmond
Portland
San Diego
Sacramento
Savannah
United States
- 7 -
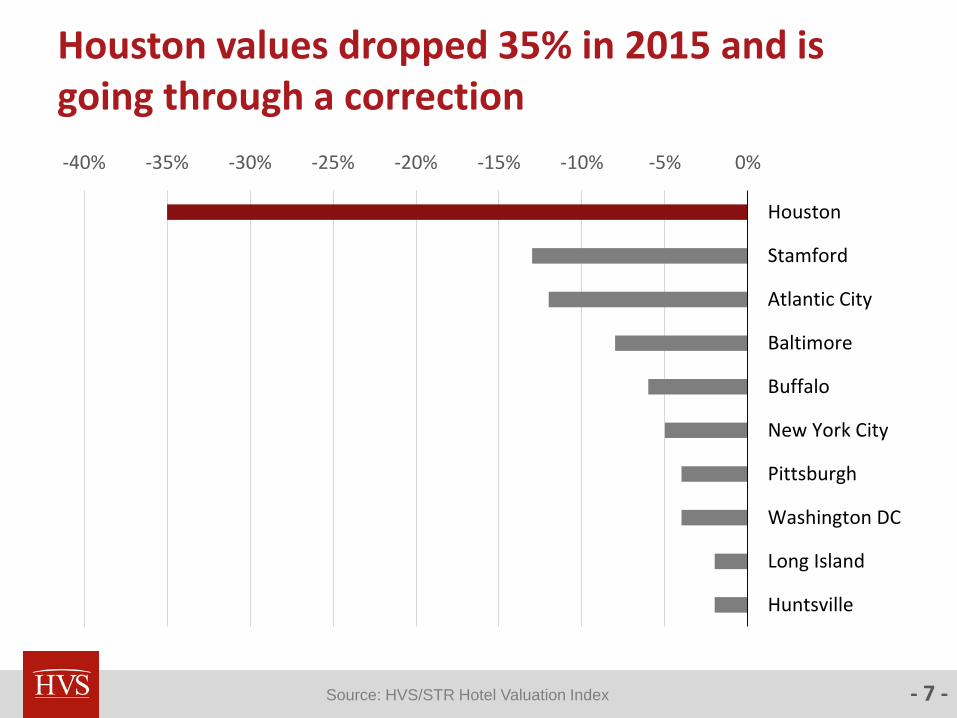
Houston values dropped 35% in 2015 and is going through a correction
Source: HVS/STR Hotel Valuation Index
-40% -35% -30% -25% -20% -15% -10% -5% 0%
Houston
Stamford
Atlantic City
Baltimore
Buffalo
New York City
Pittsburgh
Washington DC
Long Island
Huntsville

- 8 -
Huntsville and San Francisco predicted to show largest value appreciation through 2019
0% 5% 10% 15% 20% 25% 30%
Huntsville
San Francisco
Sacramento
Boston
San Diego
Los Angeles
Las Vegas
Winston-Salem
Oakland
Charlotte
United States
Source: HVS/STR Hotel Valuation Index

- 9 -
New York City and Tallahassee expected to decline in value by 12% through 2019
Source: HVS/STR Hotel Valuation Index
-14% -12% -10% -8% -6% -4% -2% 0% 2% 4% 6%
New York City
Tallahassee
Miami
Hartford
Salt Lake City
Cleveland
Denver
Minneapolis
Milwaukee
Atlantic City

- 10 -
Nashville and NYC will see the largest supply increases by 2019
0.00% 5.00% 10.00% 15.00% 20.00% 25.00%
Nashville
NYC
Charleston
Milwaukee
Cleveland
New Orleans
Indianapolis
Columbus
Houston
Dallas
United States
Source: HVS/STR Hotel Valuation Index
- 12 -
Transactions
- 13 -
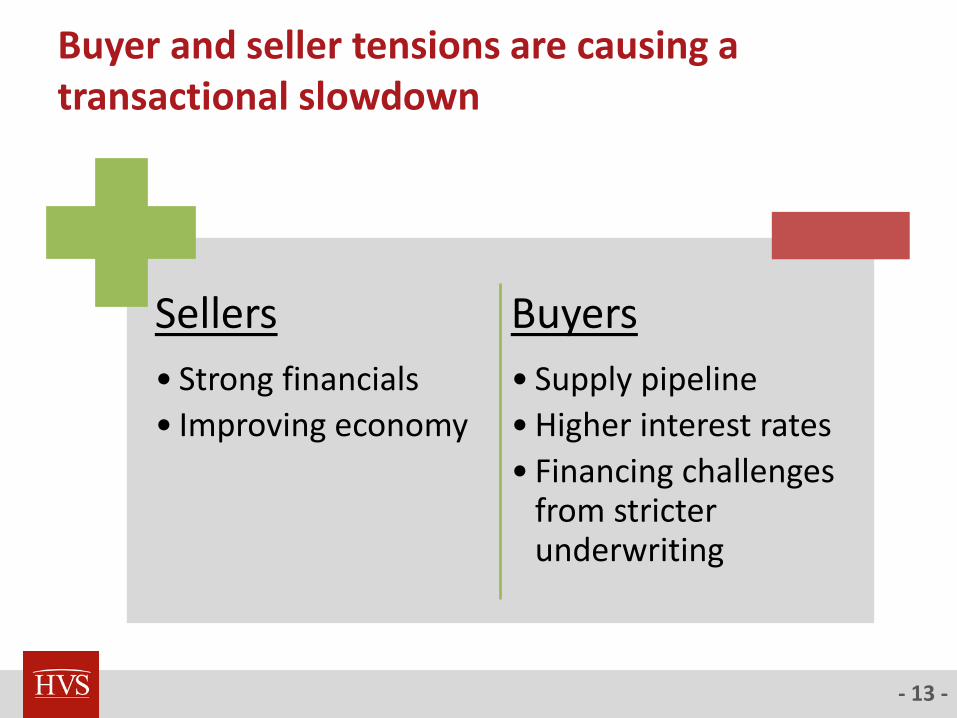
Buyer and seller tensions are causing a transactional slowdown
Sellers
• Strong financials
• Improving economy
Buyers
• Supply pipeline
•Higher interest rates
• Financing challenges from stricter underwriting

- 14 -
Transactional slowdown won’t rebound for a couple more years
0
100
200
300
400
500
6002
01
4 Q
1
20
14
Q2
20
14
Q3
20
14
Q4
20
15
Q1
20
15
Q2
20
15
Q3
20
15
Q4
20
16
Q1
Source: RCA

- 15 -
Average cap rates have increased an average of 50 basis points from last year
9.50%
8.50%
7.50%
5.0% 6.0% 7.0% 8.0% 9.0% 10.0%
Limited Service
Select Service
Full Service
Source: HVS

- 16 -
In summary…
Most markets Values will be stabilized and will rebound in 2019 due to newsupply financing constraints
Nashville Significant supply increase through 2019
New York City Significant supply increase through 2019. Values will decline slightly over next four years.
San Francisco High valuation appreciation through 2019
Huntsville Long-term opportunity for value growth
Houston Going through a correction, but it will recover over the next four years
- 17 -
Miami

- 18 -
New supply will impact Miami’s performance over the next four years
-6.00%
-4.00%
-2.00%
0.00%
2.00%
4.00%
6.00%
8.00%
10.00%
12.00%
2007 2008 2009 2010 2011 2012 2013 2014 2015 2016 2017 2018 2019
Supply Demand
Projected
Source: HVS & STR

- 19 -
Hotel values projected to decrease Miami through 2018 and rebounding in 2019
-40.00%
-30.00%
-20.00%
-10.00%
0.00%
10.00%
20.00%
30.00%
2007 2008 2009 2010 2011 2012 2013 2014 2015 2016 2017 2018 2019
Projected
Source: HVS/STR Hotel Valuation Index

- 20 -
2016 Q4 Reservations on the books showing decline from previous year
Source: TravelClick
-2.5% ADR
-4.2% Occupancy

- 21 -
REVPAR is expected to decline through 2018 as new supply is absorbed and dollar remains strong
-25.00%
-20.00%
-15.00%
-10.00%
-5.00%
0.00%
5.00%
10.00%
15.00%
20.00%
2007 2008 2009 2010 2011 2012 2013 2014 2015 2016 2017 2018 2019
Projected
Source: HVS & STR

- 22 -
Median cap rate 7.9% 2016 YTD
Transactions for YTD 2016 Price/Room
The Sagamore, Miami Beach $677,419
The Confidante, Miami Beach 603,718
Marriott Vacation Club, Miami Beach 462,184
Viceroy, Brickell (conversion to W) 435,811
Sadigo Court, Miami Beach 432,833
Holiday Inn, Coral Gables 283,871
Staybridge Suites Miami, Doral 187,500
Holiday Inn Miami, Doral 155,039
Best Western on the Bay 118,110
Source: HVS & RCA

- 23 -
Opportunities still exist in Miami, but be cautious
Threats
New supply, especially in upscale tier
New supply in Brickell and Downtown submarkets
Strong dollar impact on rate
Opportunities
Development of convention-oriented hotels in Downtown or Miami Beach
Development opportunities in the Airport and the Design District
Globally, the price per room is relatively inexpensive
- 24 -
Stephen Rushmore Jr., MAI, CRE, FRICS
+1 617-868-6840@HVS_Consulting