Hotel Guest Room Controls Final · Hotel Guest Room Energy Controls Final Report 12/04/08 CLTC and...
33
Hotel Guest Room Energy Controls Final Report 12/04/08 CLTC and WCEC with ETA San Diego Gas & Electric ® Emerging Technologies Program Hotel Guest Room Energy Controls Issued: December 2008 Project Manager: AY Ahmed San Diego Gas & Electric ® Prepared by: Theresa Pistochini, California Lighting Technology Center Kristin Heinemeier Western Cooling Efficiency Center Daryl DeJean Emerging Technologies Associates, Inc. ©2010 San Diego Gas & Electric Company. All copyright and trademark rights reserved
Transcript of Hotel Guest Room Controls Final · Hotel Guest Room Energy Controls Final Report 12/04/08 CLTC and...

Hotel Guest Room Energy Controls Final Report 12/04/08
CLTC and WCEC with ETA
San Diego Gas & Electric®
Emerging Technologies Program
Hotel Guest Room Energy Controls
Issued: December 2008 Project Manager: AY Ahmed San Diego Gas & Electric® Prepared by: Theresa Pistochini,
California Lighting Technology Center Kristin Heinemeier Western Cooling Efficiency Center Daryl DeJean Emerging Technologies Associates, Inc.
©2010 San Diego Gas & Electric Company. All copyright and trademark rights reserved

Hotel Guest Room Energy Controls Final Report 12/04/08
CLTC and WCEC with ETA
Table of Contents Preface............................................................................................................................................. 3 Acknowledgements......................................................................................................................... 3 Executive Summary ........................................................................................................................ 1 1. Project Background................................................................................................................. 3
1.1. Project Overview.............................................................................................................. 3 1.2. Technological Overview .................................................................................................. 3 1.3. Market Overview.............................................................................................................. 3
2. Project Objectives ................................................................................................................... 3 3. Methodology........................................................................................................................... 4
3.1. Host Sites.......................................................................................................................... 4 3.1.1. Hampton Inn Del Mar............................................................................................... 4 3.1.2. Navy Lodge............................................................................................................... 4 3.1.3. Doubletree Hotel....................................................................................................... 4 3.1.4. US Grant Hotel ......................................................................................................... 4
3.2. Control Systems ............................................................................................................... 6 3.2.1. Onity Energy Management Control System............................................................. 6 3.2.2. Watt Stopper PW-100 Occupancy Sensors............................................................... 6 3.2.3. Energy Ey Energy Management Control System ..................................................... 6 3.2.4. Inncom Management Control System ...................................................................... 7
3.3. Monitoring Plan............................................................................................................ 8 3.3.1. Instrumentation ......................................................................................................... 8 3.3.2. Sampling period and interval .................................................................................... 9 3.3.3. Calculation Methods ............................................................................................... 10
4. Project Results and Discussion ............................................................................................. 10 4.1. HVAC Study - Monitoring Period Analysis .................................................................. 10 4.2. HVAC Study - Cooling and Heating Regressions............................................................. 14 4.3. HVAC Study – Fan Energy Use ........................................................................................ 23 4.4. HVAC Study - Economic Performance............................................................................. 23 4.5. Lighting Study - Economic Performance .......................................................................... 27
5. Discussion............................................................................................................................. 28 6. Conclusions........................................................................................................................... 29

Hotel Guest Room Energy Controls Final Report 12/04/08
CLTC and WCEC with ETA
Preface California Lighting Technology Center, Western Cooling and Efficiency Center, and Emerging Technology Associates provided monitoring, data collection, and data analysis services for a study on occupancy based hotel guest room energy controls under contract to the Emerging Technologies Program of San Diego Gas & Electric® (SDG&E®). The project compared occupancy based controls that reduce HVAC use in unoccupied hotel guest rooms to existing controls.
Acknowledgements This project was funded by the Emerging Technologies Program of SDG&E®. The project would not have been possible without the support of SDG&E® and all participating manufacturers including Energy Eye, Inncom, and Onity and the host demonstration sites including Hampton Inn Del Mar, Navy Lodge, Doubletree Mission Valley, and US Grant.

Hotel Guest Room Energy Controls Final Report 12/04/08
CLTC and WCEC with ETA Page 1 of 30
Executive Summary The UC Davis California Lighting Technology Center (CLTC) and the Western Cooling Efficiency Center (WCEC), in partnership with Emerging Technology Associates, conducted a study at four hotels in the San Diego area utilizing three brands of occupancy controlled guest room thermostat products. The study was funded by SDG&E®. The main objective of this assessment was to compare the energy use of the emerging technology with the existing technology. The adoption of advanced control systems in the hotel industry has been slow due to high labor cost of installing systems, maintaining the post installation integrity of the system, and lack of verified energy savings. The introduction of wireless versions may make advanced controls more economically feasible. Analysis of energy used in hotel rooms utilizing advanced occupancy-based control systems has demonstrated significant energy savings. Energy use was measured in four hotels, two with packaged terminal air conditioning units and two with fan coil units, in roughly equal numbers of rooms with conventional thermostat control and advanced controls. Although the data represented only a partial year, significant savings were observed in heating, cooling and fan energy use. Most of the energy savings occurred during unoccupied hours. This is expected, as the controls are nominally the same during occupied hours, and the primary benefit occurs when the occupants are gone. Most commercial buildings show a fairly clear linear relationship between daily energy use and daily minimum or maximum temperature, but in many of the hotels studied this was not the case. Individual behavior tends to drive energy use in hotel guest rooms. In most cases, there was a more coherent relationship between energy use and temperature in the rooms with advanced controls, showing that the impact of occupant behavior is minimized. By correlating daily energy use with daily minimum or maximum temperatures, correlations were developed that could be applied to the part of the year that was not monitored. This enabled calculation of annual energy savings for a typical year in climate zone 7, rather than for the particular year when the buildings were monitored. It also enabled calculation of savings in other climate zones, although such extrapolations are only estimates and should be used carefully. In climate zone 7, savings from 346-2,641 kWh and 7-40 therms per room per year were achieved with a resulting payback of 0.9-8.2 years, depending on the hotel and installed system (Table 1). Table 1 - Summary of Energy Savings from Occupancy Based Hotel Guest Room HVAC Controls
Site 1 Site 2 Site 3 Site 4 Total kWh Savings (rm/yr)¹ 346 462 1,437 2,641
Total Therms Savings 9rm/yr)¹ N/A N/A 7 40 Operating Cost Savinngs (rm/yr) $44 $59 $191 $378 Estimated System Cost (per rm) $365 $300 $350 $350 Simple Payback (Years)² 8.2 5.1 1.8 0.9 ¹Measurements were recorded for a partial in Climate Zone 7 and results are extrapolated for the remainder of the year ²Simple payback assumes average California energy costs from the Energy Information Adminstration ($0.128 per kWh and $0.99 per Therm)

Hotel Guest Room Energy Controls Final Report 12/04/08
CLTC and WCEC with ETA Page 2 of 30
While the available data are limited, it is clear that these technologies have the potential to produce energy savings in this relatively untapped market, and more research is clearly warranted to better understand the interactions between HVAC and lighting, and the impacts of occupant behavior on energy savings. The networking capabilities of these systems would facilitate such research, and enable more advanced optimization and demand response. Networked systems would also allow hotel management to identify equipment malfunctions quickly at the system level and assure that expected energy performance is being met. In addition to the HVAC study, a small lighting study was simultaneously conducted at one hotel to assess the potential savings from occupancy based guest room lighting controls. The analysis showed that shutting off all of the guest room lighting when the room is unoccupied would save $27 per year for a hotel with incandescent sources and $7 per year for a hotel with CFL sources. Lighting controls would need to be very inexpensive to achieve a reasonable payback at current electricity prices. In the same hotel, analysis of an occupancy controlled light switch in two bathrooms showed a 44% energy savings compared to two baseline rooms. Although the percentage savings is significant this equates to a savings of $7.15 per year and a resulting payback of 17 years (Table 10).
Hotel Guest Room Energy Controls Final Report 12/04/08
CLTC and WCEC with ETA Page 3 of 30
1. Project Background
1.1. Project Overview Hotel guest room energy management control systems are widely used throughout the world, but currently have limited acceptance in the United States. An increased market penetration of such systems could significantly reduce hotel energy use. The UC Davis California Lighting Technology Center (CLTC) and the Western Cooling Efficiency Center (WCEC), in partnership with Emerging Technology Associates, conducted a study at four hotels in the San Diego area utilizing three brands of occupancy controlled guest room thermostat products. The study is funded by San Diego Gas & Electric (SDG&E). The main objective of this assessment is to compare the energy use of the emerging technology with the existing technology. The original scope of this project was to complete the assessment and evaluation by December 31, 2007 of both lighting controls and HVAC controls and the test plan was developed accordingly. However, test site and logistical constraints, installation and data logging issues were discovered during the installation process that required modification of the scope to extend the testing period until September 17, 2008 and to focus only on HVAC control technologies. A limited lighting study on the economic feasibility of lighting controls was conducted for one hotel.
1.2. Technological Overview The control products tested in this study are retrofit thermostat products that include occupancy sensing using a passive infrared sensor incorporated into the thermostat or mounted on the ceiling. All the systems studied also use a magnetic door position sensor that communicates wirelessly with the thermostat. When the system identifies that the door is opened, it will search for an occupant. Once the thermostat senses the occupant, it assumes the room remains occupied until door is opened again, at which time another search is conducted. When the system concludes the room is unoccupied it puts the HVAC system in an energy conserving mode. While the room is occupied the guest has control over the thermostat and room temperature. This is accomplished differently by the three products tested. These products are also capable of networking to a front desk system and more complicated whole building control, including demand response, although these features were not tested in this study. In two rooms at one hotel, an occupancy sensing automatic off light switch was also installed and studied.
1.3. Market Overview The hospitality industry is one of the top industries in the State of California. The adoption of advanced control systems in the hotel industry has been slow due to high labor cost of installing systems, maintaining the post installation integrity of the system, and lack of verified energy savings. The introduction of wireless versions may make advanced controls more economically feasible.
2. Project Objectives The objective of this study is to quantify annual energy savings for occupancy controlled guest room thermostats in San Diego climate zones. SDG&E will evaluate the results of this project to determine feasibility of developing a fixed incentive amount for the technology. The California Energy Commission (CEC) is considering incorporating the technology in the Codes and Standards base for the entire California hotel industry. The results from this study will be utilized
Hotel Guest Room Energy Controls Final Report 12/04/08
CLTC and WCEC with ETA Page 4 of 30
in the statewide Codes and Standards Enhancement (CASE) study undertaken by SDG&E and SoCalGas for setting building standards in the 2011 revision of California Title 24 Code Revision, Section 121(c). A secondary objective is to study the potential savings that could be achieved with lighting controls in guest rooms.
3. Methodology
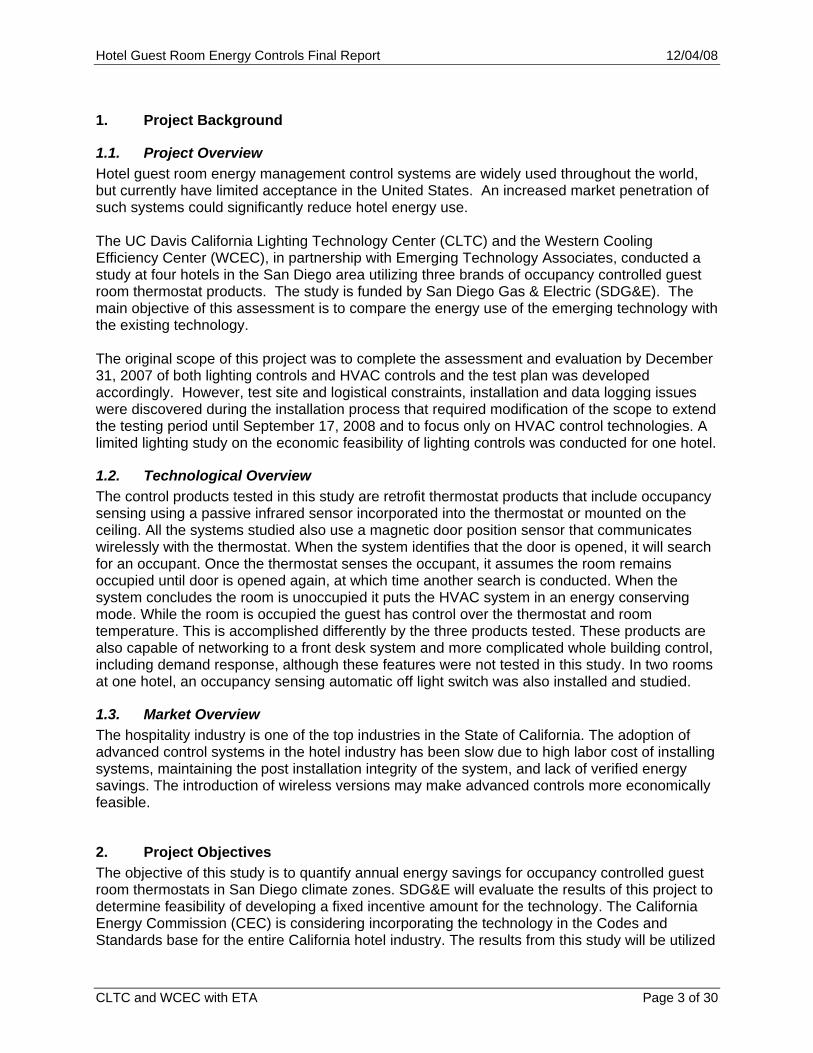
3.1. Host Sites The technology was investigated in four hotels in the San Diego area: Hampton Inn Del Mar (Figure 1, A), Navy Lodge (Figure 1, B), Doubletree (Figure 1, C), and US Grant (Figure 1, D). All are within California Climate Zone 7 and the SDG&E service territory. Three of the four are located in San Diego proper while the Hampton Inn is just north of San Diego in the Del Mar area. Specific hotel properties are available in Table 2.
3.1.1. Hampton Inn Del Mar The Hampton Inn Del Mar, constructed in 2000, has 129 guest rooms in the Sorrento Valley area near Del Mar (Figure 3). The rooms have packaged terminal air conditioning (PTAC) units at the window. Ten south facing guest rooms were selected for the study with five monitored as baseline rooms and five rooms retrofitted with controls. Lighting usage in four guest rooms was also monitored.
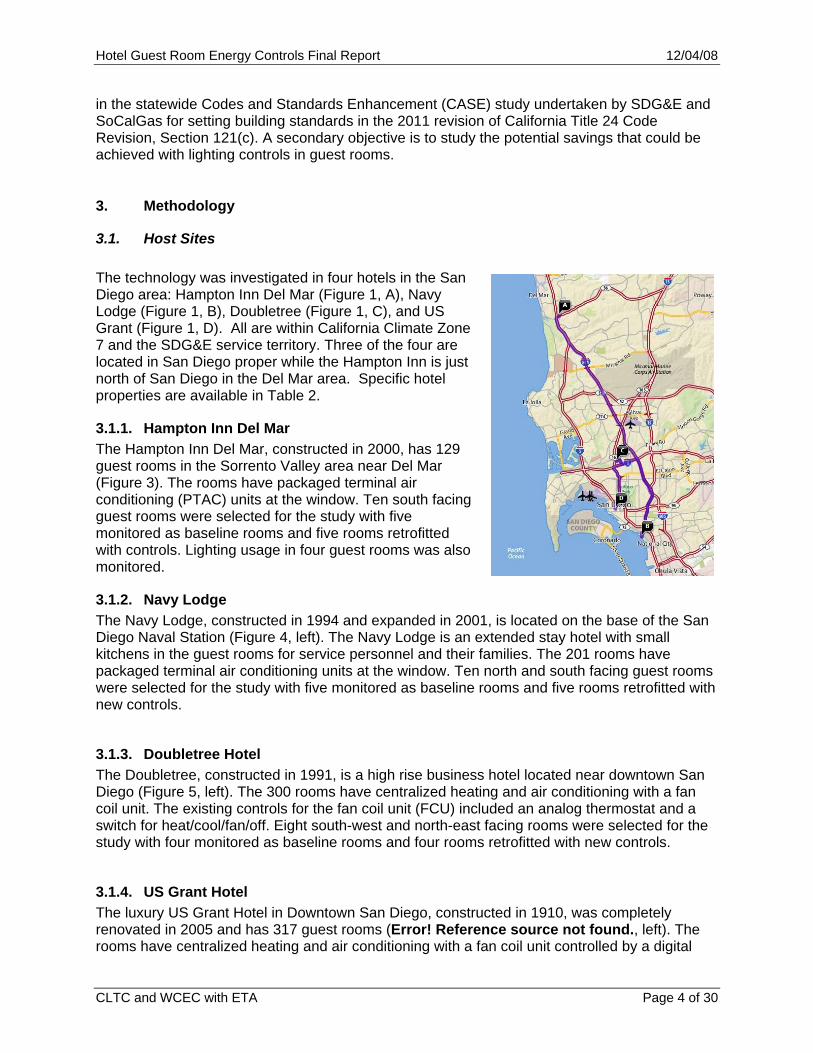
3.1.2. Navy Lodge The Navy Lodge, constructed in 1994 and expanded in 2001, is located on the base of the San Diego Naval Station (Figure 4, left). The Navy Lodge is an extended stay hotel with small kitchens in the guest rooms for service personnel and their families. The 201 rooms have packaged terminal air conditioning units at the window. Ten north and south facing guest rooms were selected for the study with five monitored as baseline rooms and five rooms retrofitted with new controls.
3.1.3. Doubletree Hotel The Doubletree, constructed in 1991, is a high rise business hotel located near downtown San Diego (Figure 5, left). The 300 rooms have centralized heating and air conditioning with a fan coil unit. The existing controls for the fan coil unit (FCU) included an analog thermostat and a switch for heat/cool/fan/off. Eight south-west and north-east facing rooms were selected for the study with four monitored as baseline rooms and four rooms retrofitted with new controls.
3.1.4. US Grant Hotel The luxury US Grant Hotel in Downtown San Diego, constructed in 1910, was completely renovated in 2005 and has 317 guest rooms (Error! Reference source not found., left). The rooms have centralized heating and air conditioning with a fan coil unit controlled by a digital
Hotel Guest Room Energy Controls Final Report 12/04/08
CLTC and WCEC with ETA Page 5 of 30
controls system. Ten west facing rooms were selected for the study. Five were equipped with new control systems.
Figure 1: Hampton Inn Del Mar
Figure 2: Navy Lodge (left) and Doubletree Inn (right)

Hotel Guest Room Energy Controls Final Report 12/04/08
CLTC and WCEC with ETA Page 6 of 30
3.2. Control Systems
3.2.1. Onity Energy Management Control System Onity energy management control system includes a digital thermostat to control the HVAC unit and an occupancy sensing system (Figure 3, left). When the room is unoccupied, the allowable room temperature is set back to 68-76 degrees.
3.2.2. Watt Stopper PW-100 Occupancy Sensors An occupancy sensing light switch (Watt Stopper PW-100) with automatic shut off after a 30 minute unoccupied period (Figure 3, right).
Figure 3 – Onity energy management control system (right), standard wall switch controls (middle), Wattstopper PW-100 wall switch occupancy sensor (right)
3.2.3. Energy Eye Energy Management Control System Energy Eye energy management control system includes an occupancy sensing system that shuts off the HVAC unit when the room is unoccupied. If the room temperature drifts outside of the pre-set temperature range of 63-75 degrees, theHVAC unit is turned on for a short duty cycle. When the room is occupied, the guest uses the existing controls on the HVAC unit.
Figure 4 - Energy Eye energy management control system

Hotel Guest Room Energy Controls Final Report 12/04/08
CLTC and WCEC with ETA Page 7 of 30
3.2.4. Inncom Management Control System Inncom energy management control system includes a digital thermostat to control the HVAC unit and an occupancy sensing system. When the room is unoccupied, the allowable room temperature is set back to +/- 5 degrees from the last set point programmed by the occupant.
Figure 5 –Inncom energy management control system Table 2: Characteristics of Host Sites A: Hampton Inn Del Mar (Climate Zone: 7)
System Type PTAC Monitoring Period 1/26/08 – 9/15/08
Input and Output Input: Cooling: 1333 W, Heating: 2500 W
Output: Cooling: 12,000 BTU/hr, Heating: 10,700 BTU/hr
Efficiency Rating Cooling EER = 9.0 Heating COP = 2.8
Baseline controls Push button controls for low heat, high heat, low cool, high cool, fan only, off. Dial thermostat.
Rooms Monitored 10 Rooms: 320-328. The first five rooms are the test rooms, the last five rooms are the baseline rooms.
B: Navy Lodge (Climate Zone: 7)
System Type PTAC Monitoring Period 2/1/08 – 9/15/08
Input and Output Input: Cooling: 795 W, Heating: 705 W
Output: Cooling: 9,000 BTU/hr, Heating: 8,400 BTU/hr
Efficiency Rating Cooling EER = 11.3 Heating COP = 3.5
Baseline controls PTAC controls, touch pad with digital thermostat
Rooms Monitored 10 Rooms: 162-166 ( test rooms) and 170, 171, 172, 174, 175 (baseline rooms)
C: Double Tree Mission Valley (Climate Zone: 7)
System Type Four Pipe Fan Coil Units Monitoring Period 7/30/08 – 9/15/08
Input and Output Input: 135/100/65 W (high/med/low fan)
Output: Cooling: 15,300 BTU/hr, Heating: 25,100-37,700 BTU/hr (depends on water flow).
Efficiency Rating Assumed Cooling efficiency - 0.1 kWh/kBTU Assumed Heating efficiency - 0.02 Therms/kBTU
Baseline controls Manual switch control for off/low/med/high and heat/cool/off and dial thermostat.

Hotel Guest Room Energy Controls Final Report 12/04/08
CLTC and WCEC with ETA Page 8 of 30
Rooms Monitored 8 Rooms: Baseline: 205, 206, 318, and 330. Test: 324, 326, 325, and 327.
D: US Grant Hotel (Climate Zone: 7)
System Type Four Pipe Fan Coil Units Monitoring Period 5/15/08 – 9/15/08
Input and Output Input: unknown Output: Unknown
Efficiency Rating Assumed Cooling efficiency - 0.1 kWh/kBTU Assumed Heating efficiency - 0.02 Therms/kBTU
Baseline controls Inncom control system. Digital thermostat with occupancy sensing in disabled mode.
Rooms Monitored 10 Rooms: 608 & 609-625 (odd numbers only). The first five rooms are the test rooms, the last five rooms are the baseline rooms.
3.3. Monitoring Plan Monitoring equipment was deployed to study energy use of the HVAC system in all guest rooms under study. The equipment was used to discern occupancy sensors, interior conditions (temperature/humidity), HVAC status and energy consumption of the HVAC system. The following general procedure to calculate energy use:
1. Energy use was calculated only for the sample of rooms under study and not for the entire hotel. For the hotels with FCUs (which circulate hot and cold water to the individual rooms) typical central plant efficiency was assumed.
2. All data was evaluated for inclusion in the data set. Some data was excluded because of monitoring sensor failure. Additional data of the test systems was excluded if the system failed during the study.
3. The energy use of baseline and test rooms was aggregated into one data set for the two groups in each hotel. The rooms are assumed to be identical and data is assigned only to a group (baseline or test) and not a specific room number.
4. Energy use per room day is calculated in cooling, heating, and fan modes.
5. Average occupancy over the study period and the percentage of energy used during occupied and unoccupied times was determined. Energy use during the study period for the baseline and test rooms should not be directly compared because of excluded data and the anticipated outside temperature dependence. For example, the baseline group may have slightly more warm days in the data set than the test group.
6. The outside temperature dependence per room day of HVAC energy use in cooling, heating, and fan modes was determined.
7. The energy use per room day was used to the estimate annual energy use for a typical meteorological year in the climate zone for the hotel and four additional San Diego climate zones.
Monitoring equipment was also deployed to study lighting usage in one hotel. The fixtures monitored include lamps by the bedside, on the desk, in the entry area, in a separate sitting area, and the bathroom vanity. The only electric lighting not monitored in the room was the CFL downlight in the entry way. The same room occupancy data gathered in the HVAC study was correlated to lighting use. Occupancy status in the bathroom was unknown and not correlated to bathroom lighting use.
3.3.1. Instrumentation For monitoring the HVAC systems, different instrumentation was used depending on if the system was a PTAC or a FCU. For the PTAC units, the following instrumentation was used:

Hotel Guest Room Energy Controls Final Report 12/04/08
CLTC and WCEC with ETA Page 9 of 30
1. Room Temperature: Hobo model U12-011 or U10-003 placed behind the nightstand (Hobo model U12-011 or U10-003).
2. Supply Temperature: Hobo model TMC6-HD placed in the PTAC outlet.
3. Room Occupancy: Door switch occupancy detection system manufactured by Energy Eye. The output (occupied/unoccupied) was stored in a state logger (Hobo model U9-001).
4. Supply Current at the PTAC: Measured by a current transducer (Hobo model CTV-A/B) and stored in a data logger (Hobo U12-006).
5. Outside temperature from local weather station For the FCU units, the following instrumentation was used:
1. Room Temperature: Hobo model U12-011 or U10-003 placed behind the nightstand (Hobo model U12-011 or U10-003).
2. Return Temperature/Humidity: Hobo model TMC6-HD orU12-011 placed in the return air duct.
3. Supply Temperature/Humidity: Hobo model TMC6-HD or U12-011 placed in the supply air duct.
4. Room Occupancy: Door switch occupancy detection system manufactured by Energy Eye. The output (occupied/unoccupied) was stored in a state logger (Hobo model U9-001).
5. Supply Current of the fan: Measured by a current transducer (Hobo model CTV-A/B) and stored in a data logger (Hobo U12-006).
6. Outside temperature from local weather station
At the US Grant, the hotel could not accommodate installation of the occupancy sensing system and the schedule allowed the full installation of energy monitoring equipment in only two of the ten rooms. Therefore, a central collection system was set up to collect the room occupancy and current mode (heat/cool/fan speed) information directly from the thermostat. The data from the fully instrumented rooms was used to calculate energy use per hour of system run time in all modes. This was used to obtain energy use for all 10 rooms in the study.
For monitoring lighting usage, plug load loggers from Watts Up? Pro were used to log guest room lighting usage. The bathroom light status was monitored with a Hobo model U9-002.
3.3.2. Sampling period and interval For the HVAC study, the Navy Lodge and Hampton Inn were monitored from 2/1/08-9/15/08 so cooler outdoor temperatures were observed. The Double Tree was studied from 7/31/08-9/15-08 and the US Grant from 6/4/08-9/15/08, so heating data for these two hotels is very limited. The number of rooms days collected is 440/425 (baseline/test) at the Hampton Inn, 406/460 (baseline/test) at the Navy Lodge, 188/141 (baseline/test) at the Doubletree, and 397/353 at the US Grant. The 2992 total room days were studied at 15-minute instantaneous samples, resulting in over 280,000 analysis points. For the lighting study, guest room lighting loads were measured in five minute increments from 5/16/08-9/15/08 and correlated to occupancy data gathered during the same period. The bathroom study was conducted later from 9/16/08-12/15/08.
Hotel Guest Room Energy Controls Final Report 12/04/08
CLTC and WCEC with ETA Page 10 of 30
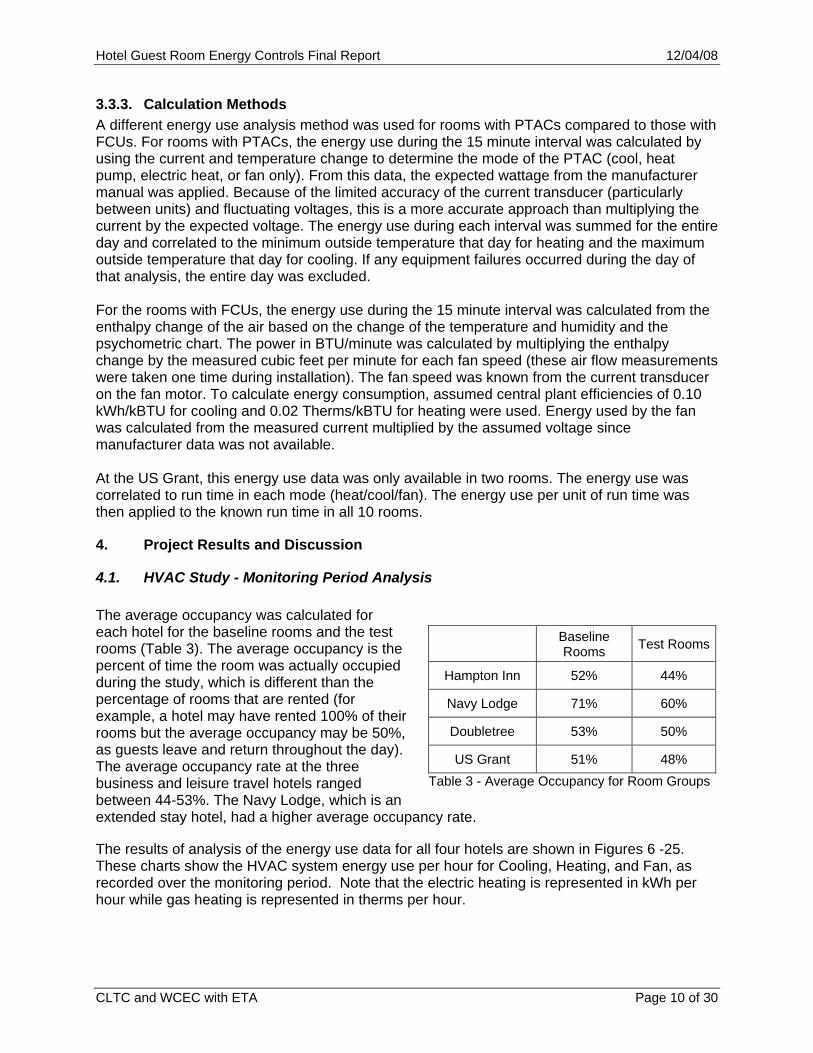
3.3.3. Calculation Methods A different energy use analysis method was used for rooms with PTACs compared to those with FCUs. For rooms with PTACs, the energy use during the 15 minute interval was calculated by using the current and temperature change to determine the mode of the PTAC (cool, heat pump, electric heat, or fan only). From this data, the expected wattage from the manufacturer manual was applied. Because of the limited accuracy of the current transducer (particularly between units) and fluctuating voltages, this is a more accurate approach than multiplying the current by the expected voltage. The energy use during each interval was summed for the entire day and correlated to the minimum outside temperature that day for heating and the maximum outside temperature that day for cooling. If any equipment failures occurred during the day of that analysis, the entire day was excluded. For the rooms with FCUs, the energy use during the 15 minute interval was calculated from the enthalpy change of the air based on the change of the temperature and humidity and the psychometric chart. The power in BTU/minute was calculated by multiplying the enthalpy change by the measured cubic feet per minute for each fan speed (these air flow measurements were taken one time during installation). The fan speed was known from the current transducer on the fan motor. To calculate energy consumption, assumed central plant efficiencies of 0.10 kWh/kBTU for cooling and 0.02 Therms/kBTU for heating were used. Energy used by the fan was calculated from the measured current multiplied by the assumed voltage since manufacturer data was not available. At the US Grant, this energy use data was only available in two rooms. The energy use was correlated to run time in each mode (heat/cool/fan). The energy use per unit of run time was then applied to the known run time in all 10 rooms.
4. Project Results and Discussion
4.1. HVAC Study - Monitoring Period Analysis The average occupancy was calculated for each hotel for the baseline rooms and the test rooms (Table 3). The average occupancy is the percent of time the room was actually occupied during the study, which is different than the percentage of rooms that are rented (for example, a hotel may have rented 100% of their rooms but the average occupancy may be 50%, as guests leave and return throughout the day). The average occupancy rate at the three business and leisure travel hotels ranged between 44-53%. The Navy Lodge, which is an extended stay hotel, had a higher average occupancy rate. The results of analysis of the energy use data for all four hotels are shown in Figures 6 -25. These charts show the HVAC system energy use per hour for Cooling, Heating, and Fan, as recorded over the monitoring period. Note that the electric heating is represented in kWh per hour while gas heating is represented in therms per hour.
Baseline Rooms Test Rooms
Hampton Inn 52% 44%
Navy Lodge 71% 60%
Doubletree 53% 50%
US Grant 51% 48% Table 3 - Average Occupancy for Room Groups

Hotel Guest Room Energy Controls Final Report 12/04/08
CLTC and WCEC with ETA Page 11 of 30
Note also that for the Hampton Inn and the Navy Lodge the reported “Cooling” and “Heating” energy use figures represent the entire system energy use while in these modes; thus, they also include fan energy use. “Fan” represents the energy used by the system when it is in Fan Only mode. In contrast, for the Double Tree and the US Grant, “Cooling” represents only the cooling energy use, and “Heating” represents only the heating energy use, although the fan is using energy at those times as well. For each mode, energy use is shown during occupied and unoccupied hours, for the baseline rooms and the rooms with the test controls. One expects to see little difference between baseline and test rooms during occupied hours (when the controls nominally perform similarly), and to see energy reduce dramatically during unoccupied hours for the rooms with test controls. Figure 6, for the Hampton shows this pattern clearly for cooling: energy use for the test room is similar to the baseline room during occupied hours, but during unoccupied hours, both sets of rooms have reduced energy use, but the reduction in the room with test controls is much more significant. For heating, the energy use is actually increased in the rooms with test controls, although the magnitude is much less, and is less significant. The most dramatic savings are seen when the system is in fan only mode: during occupied hours, the energy use is cut almost in half. During unoccupied hours, fan energy use is virtually eliminated. This appears to be the most significant impact of this technology. Figure 7, for the Navy Lodge, shows the same analysis. In this case, the energy use in fan-only mode was not discernable from the measurement equipment and is excluded from the results. Cooling energy during occupied hours was higher in the rooms with test controls than the baseline rooms. The reason for this is unknown. During unoccupied hours, however, the savings are dramatic. Again, heating energy use is much smaller, although it does show savings for the rooms with the test controls. Figure 8, showing the analysis for the Double Tree, we can see that cooling clearly dominates during the summer months studied. Cooling energy savings from the baseline to test control rooms are clearly evident even during occupied hours, and cooling energy is even more dramatically reduced during unoccupied hours. This same pattern is seen for the fan, although the magnitude is less. Figure 9, shows a similar pattern for the US Grant hotel.

Hotel Guest Room Energy Controls Final Report 12/04/08
CLTC and WCEC with ETA Page 12 of 30
0.00
0.02
0.04
0.06
0.08
0.10
0.12
0.14
Cooling(kWh)
Heating(kWh)
Fan(kWh)
Ave
rage
Ene
rgy/
Hou
r
Energy/Occ Hour - Baseline
Energy/Occ Hour - Test Controls
Energy/Unoccupied Hour - Baseline
Energy/Unoccupied Hour - Test Controls
Figure 6: Summary of Monitoring Period Energy Analysis at Hampton Inn
-
0.050
0.100
0.150
0.200
0.250
0.300
Cooling(kWh)
Heating(kWh)
Ave
rage
Ene
rgy/
Hou
r
Energy/Occ Hour - Baseline
Energy/Occ Hour - Test Controls
Energy/Unoccupied Hour - Baseline
Energy/Unoccupied Hour - Test Controls
Figure 7: Summary of Monitoring Period Energy Analysis at Navy Lodge

Hotel Guest Room Energy Controls Final Report 12/04/08
CLTC and WCEC with ETA Page 13 of 30
0.00
0.05
0.10
0.15
0.20
0.25
0.30
0.35
0.40
Cooling(kWh)
Heating(Therms)
Fan(kWh)
Ave
rage
Ene
rgy/
Hou
r
BTU/Occ Hour - Baseline
BTU/Occ Hour - Test Controls
BTU/Unoccupied Hour - Baseline
"BTU/Unoccupied Hour - Test Controls"
Figure 8: Summary of Monitoring Period Energy Analysis at Doubletree
0.00
0.05
0.10
0.15
0.20
0.25
Cooling(kWh)
Heating(therms)
Fan(kWh)
Ave
rage
Ene
rgy/
Hou
r
Energy/Occ Hour - Baseline
Energy/Occ Hour - Test Controls
Energy/Unoccupied Hour - Baseline
Energy/Unoccupied Hour - Test Controls
Figure 9: Summary of Monitoring Period Energy Analysis at US Grant

Hotel Guest Room Energy Controls Final Report 12/04/08
CLTC and WCEC with ETA Page 14 of 30
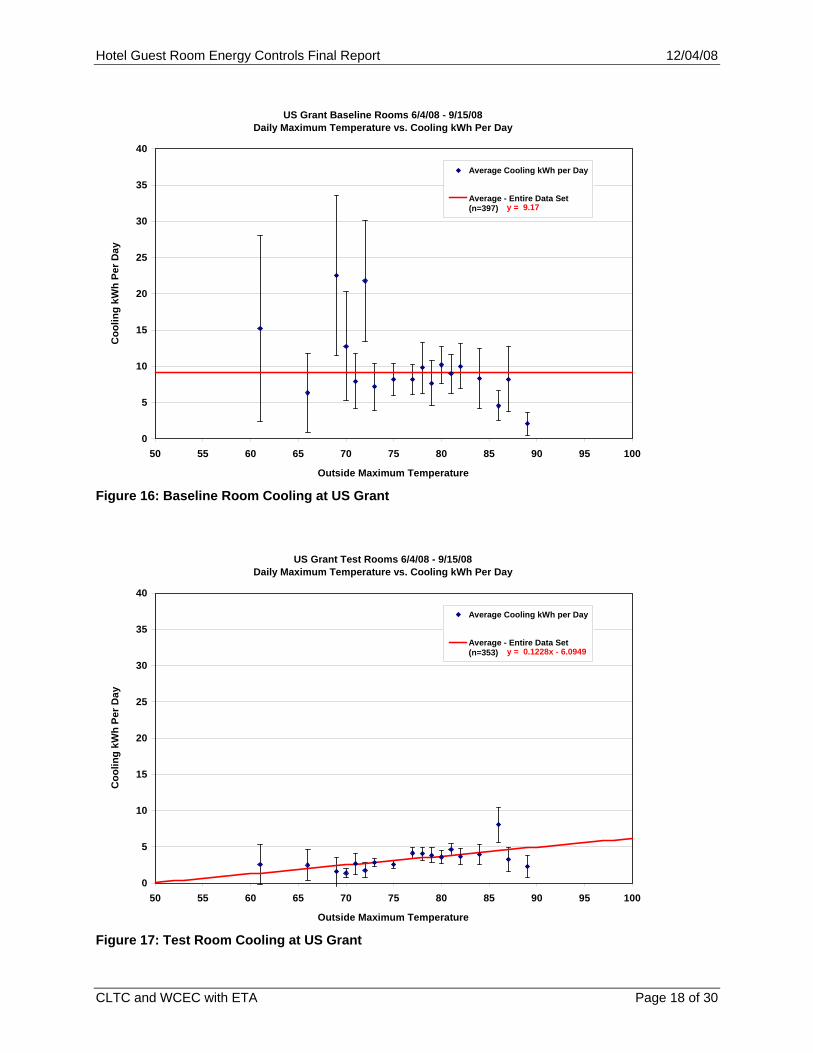
4.2. HVAC Study - Cooling and Heating Regressions Figures 11 through 26 show regression charts for 1) cooling in baseline rooms, 2) cooling in test rooms, 3) heating in baseline rooms, and 4) heating in test rooms. Each chart of energy use vs. outdoor air temperature shows the regression line that represents the best-fit to all of the 15-minute data, for all rooms, including both occupied and unoccupied hours. These regressions will be used to estimate annual impacts. The temperature data that are shown are the daily minimum temperatures for heating, and the daily maximum temperatures for cooling. Also shown on these charts is the average energy use for each one-degree temperature bin (across all rooms and days), and error bars indicating the 95% confidence interval. Figures 11 and 12, showing the Hampton Inn baseline and test room cooling energy use, respectively, show clear temperature dependence. The range of energy use for any particular temperature bin is much smaller for the test rooms, and significant energy savings are seen at the higher temperatures. Figures 13 and 14, for the Navy Lodge, shows a similar profile for baseline and test room cooling energy use at lower temperatures, while at higher temperatures the cooling energy use actually goes down for both sets of rooms. The test rooms have very high energy use in a number of temperature bins. Very little cooling energy savings are seen for the Navy Lodge. Figures 15 and 16 for the Double Tree shows more dramatic cooling savings. The energy use is quite temperature dependent for the baseline rooms, while it is fairly flat for the test rooms. The baseline rooms also show a wider range of energy use in any particular temperature bin. For the US Grant there was no discernible temperature correlation for the baseline rooms, so the average energy use across all temperatures was used for the analysis, rather than a temperature regression (Figure 17). For the controlled rooms, a slight temperature dependence was seen (Figure 18). There was a much smaller range of the energy use in each temperature bin, and energy savings are quite large. Figures 19 through 26 show a similar analysis for the heating regressions. For some buildings, no temperature correlation was evident from the data that were available, and an average value was used. Figure 19 and 20, for the Hampton Inn, shows a decent correlation for the rooms with the test controls, although at colder temperatures there is quite a range in energy use. Interestingly, the baseline rooms showed no heating energy use at higher temperatures, while the test rooms did show temperature dependent heating, even at relatively high temperatures. Figures 21 and 22, for the Navy Lodge, show a good correlation. The Doubletree, shown in Figures 23 and 24, indicate that very little data were available at low temperatures, and the energy use at higher temperatures showed little temperature correlation. The range in energy use was somewhat higher for the baseline rooms. Figures 25 and 26 for the US Grant show dramatic energy savings for the room with test controls.

Hotel Guest Room Energy Controls Final Report 12/04/08
CLTC and WCEC with ETA Page 15 of 30
Hampton Inn Baseline Rooms 1/26/08 - 9/15/08Daily Maximum Temperature vs. Cooling kWh Per Day
0
2
4
6
8
10
12
14
16
18
20
50 55 60 65 70 75 80 85 90 95 100
Outside Maximum Temperature
Coo
ling
kWh
Average Daily Cooling Energy at MaximumTemperature, Error Bars at CI=0.95
Best Linear Fit - Entire Data Set (n=440)y = 0.155x - 9.1796
Figure 10: Baseline Room Cooling at Hampton Inn
Hampton Inn Test Rooms 1/26/08 - 9/15/08Daily Maximum Temperature vs. Cooling kWh Per Day
0
2
4
6
8
10
12
14
16
18
20
50 55 60 65 70 75 80 85 90 95 100
Outside Maximum Temperature
Coo
ling
kWh
Average Daily Cooling Energy at MaximumTemperature, Error Bars at CI=0.95
Best Linear Fit - Entire Data Set (n=425)y = 0.08459 x - 4.4609
Figure 11: Test Room Cooling at Hampton Inn

Hotel Guest Room Energy Controls Final Report 12/04/08
CLTC and WCEC with ETA Page 16 of 30
Navy Lodge Baseline Rooms 2/1/08 - 9/17/08Daily Maximum Temperature vs. Cooling kWh Per Day
0
2
4
6
8
10
12
14
16
18
50 55 60 65 70 75 80 85 90 95 100
Outside Maximum Temperature
Coo
ling
kWh
Average Daily Cooling Energy at MaximumTemperature, Error Bars at CI=0.95
Best Linear Fit - Entire Data Set (n=406)y = 0.14853x - 6.9666
Figure 12: Baseline Room Cooling at Navy Lodge
Navy Lodge Test Rooms 2/1/08 - 9/16/08Daily Maximum Temperature vs. Cooling kWh Per Day
0
2
4
6
8
10
12
14
16
18
50 55 60 65 70 75 80 85 90 95 100
Outside Maximum Temperature
Coo
ling
kWh
Average Daily Cooling Energy at MaximumTemperature, Error Bars at CI=0.95
Best Linear Fit - Entire Data Set (n=460)y = 0.16465x - 8.54527
Figure 13: Test Room Cooling at Navy Lodge

Hotel Guest Room Energy Controls Final Report 12/04/08
CLTC and WCEC with ETA Page 17 of 30
Doubletree Baseline Rooms 7/31/08 - 9/15/08Daily Maximum Temperature vs. Cooling kWh Per Room Per Day
0
2
4
6
8
10
12
14
16
18
20
50 55 60 65 70 75 80 85 90 95 100
Outside Maximum Temperature
Coo
ling
kWh
Con
sum
ed p
er R
oom
per
Day
Average Daily Cooling BTUs at MaximumTemperature, Error Bars at CI=0.95
Best linear fit - Entire Data Set (n=188)y = 0.25x - 11.7
Figure 14: Baseline Room Cooling at Doubletree
Double Tree Test Rooms 7/31/08 - 9/15/08Daily Maximum Temperature vs. Cooling kWh Consumed per Room per Day
0
2
4
6
8
10
12
14
16
18
20
50 55 60 65 70 75 80 85 90 95 100
Outside Maximum Temperature
Coo
ling
kWh
Con
sum
ed p
er R
oom
per
Day
Average Daily Cooling BTUs at MaximumTemperature, Error Bars at CI=0.95
Best Linear Fit - Entire Data Set (n=141)y = 0.0363x + 0.1174
Figure 15: Test Room Cooling at Doubletree
Hotel Guest Room Energy Controls Final Report 12/04/08
CLTC and WCEC with ETA Page 18 of 30
US Grant Baseline Rooms 6/4/08 - 9/15/08Daily Maximum Temperature vs. Cooling kWh Per Day
0
5
10
15
20
25
30
35
40
50 55 60 65 70 75 80 85 90 95 100
Outside Maximum Temperature
Coo
ling
kWh
Per D
ay
Average Cooling kWh per Day
Average - Entire Data Set(n=397) y = 9.17
Figure 16: Baseline Room Cooling at US Grant
US Grant Test Rooms 6/4/08 - 9/15/08Daily Maximum Temperature vs. Cooling kWh Per Day
0
5
10
15
20
25
30
35
40
50 55 60 65 70 75 80 85 90 95 100
Outside Maximum Temperature
Coo
ling
kWh
Per D
ay
Average Cooling kWh per Day
Average - Entire Data Set(n=353) y = 0.1228x - 6.0949
Figure 17: Test Room Cooling at US Grant

Hotel Guest Room Energy Controls Final Report 12/04/08
CLTC and WCEC with ETA Page 19 of 30
Hampton Inn Baseline Rooms 1/26/08 - 9/15/08Daily Minimum Temperature vs. Heating kWh Per Day
0.0
0.5
1.0
1.5
2.0
2.5
3.0
3.5
35 40 45 50 55 60 65 70 75
Outside Minimum Temperature
Hea
ting
kWh
Average Daily Heating Energy at MinimumTemperature, Error Bars at CI=0.95
Best Linear Fit - Entire Data Set (n=440)
Figure 18: Baseline Room Heating at Hampton Inn
Hampton Inn Test Rooms 1/26/08 - 9/15/08Daily Minimum Temperature vs. Heating kWh Per Day
0.0
0.5
1.0
1.5
2.0
2.5
3.0
3.5
35 40 45 50 55 60 65 70 75
Outside Minimum Temperature
Hea
ting
kWh
Average Daily Heating Energy at MinimumTemperature, Error Bars at CI=0.95
Best Linear Fit - Entire Data Set (n=425)y = -0.200x + 1.4655
Figure 19: Test Room Heating at Hampton Inn

Hotel Guest Room Energy Controls Final Report 12/04/08
CLTC and WCEC with ETA Page 20 of 30
Navy Lodge Baseline Rooms 2/1/08 - 9/17/08Daily Minimum Temperature vs. Heating kWh Per Day
0
2
4
6
8
10
12
14
35 40 45 50 55 60 65 70 75
Outside Minimum Temperature
Hea
ting
kWh
Average Daily Heating Energy at Minimum Temperature, ErrorBars at CI=0.95
Best Linear Fit Entire Data Set (n=724)
Figure 20: Baseline Room Heating at Navy Lodge
Navy LodgeTest Rooms 2/1/08 - 9/16/08Daily Minimum Temperature vs. Heating kWh Per Day
0
2
4
6
8
10
12
14
35 40 45 50 55 60 65 70 75
Outside Minimum Temperature
Hea
ting
kWh
Average Daily Heating Energy at Minimum Temperature,Error Bars at CI=0.95
Best Linear Fit, Entire Data Set (n=460)y = -0.12551x + 7.16525 (x<57), y=0.3721 (x>=57)
Figure 21: Test Room Heating at Navy Lodge
y = -0.116352 + 6.9396 (x<=57), y=0 (x>57)

Hotel Guest Room Energy Controls Final Report 12/04/08
CLTC and WCEC with ETA Page 21 of 30
Doubletree Baseline Rooms 7/31/08 - 9/15/08Daily Minimum Temperature vs. Heating Therms Consumed per Room per Day
0
0.1
0.2
0.3
0.4
0.5
0.6
0.7
0.8
0.9
1
35 40 45 50 55 60 65 70 75
Outside Minimum Temperature
Hea
ting
Ther
ms
Con
sum
ed p
er R
oom
per
Day
Average Daily Heating BTUs at MinimumTemperature, Error Bars at CI=0.95
Average - Entire Data Set (n=188)y = 0.12
Figure 22: Baseline Room Heating at Doubletree
Double Tree Test Rooms 7/31/08 - 9/15/08Daily Minimum Temperature vs. Heating Therms Consumed per Room per Day
0
0.1
0.2
0.3
0.4
0.5
0.6
0.7
0.8
0.9
1
35 40 45 50 55 60 65 70 75
Outside Minimum Temperature
Hea
ting
Ther
ms
Con
sum
ed p
er R
oom
per
Day
Average Daily Heating BTUs at MinimumTemperature, Error Bars at CI=0.95
Average - Entire Data Set (n=141)y = 0.1
Figure 23: Test Room Heating at Doubletree

Hotel Guest Room Energy Controls Final Report 12/04/08
CLTC and WCEC with ETA Page 22 of 30
US Grant Baseline Rooms 6/4/08 - 9/15/08Daily Maximum Temperature vs. Heating Therms Per Day
0.0
0.5
1.0
1.5
2.0
40 45 50 55 60 65 70 75
Outside Minimum Temperature
Hea
ting
Ther
ms
Per D
ay
Average Heating Therms perDay
Average - Entire Data Set(n=397) y = 0.14
Figure 24: Baseline Room Heating at US Grant
US Grant Test Rooms 6/4/08 - 9/15/08Daily Maximum Temperature vs. Heating Therms Per Day
0.0
0.5
1.0
1.5
2.0
40 45 50 55 60 65 70 75
Outside Minimum Temperature
Hea
ting
Ther
ms
Per D
ay
Average Heating Therms perDay
Average - Entire Data Set(n=397) y = 0.03
Figure 25: Test Room Heating at US Grant

Hotel Guest Room Energy Controls Final Report 12/04/08
CLTC and WCEC with ETA Page 23 of 30
Table 4: Fan Energy Use Average
kWh/Day Hampton Inn Baseline Rooms 1.25 Test Rooms 0.44 Percent Savings 64.8% Doubletree Baseline Rooms 0.51 Test Rooms 0.14 Percent Savings 72.5% US Grant Baseline Rooms 1.52 Test Rooms 0.71 Percent Savings 53.2%
4.3. HVAC Study – Fan Energy Use Since the fan energy use was not temperature dependent, only averages are provided. Table 4 provides the average fan energy use per day for each set of rooms. Note that no data are shown for the Navy Lodge, because the energy use by the fan could not be discerned. The energy savings for each building are evident and range from 53-72%.
4.4. HVAC Study - Economic Performance Although all of the hotels monitored in the study were located in California Climate Zone 7 and were for partial years, the results are extrapolated to annual energy use and for other climate zones, by applying the same regression models to different climate zone annual climate data. The results of annualization of the data collected over the test period are shown in Tables 5 through 8 for several different Climate Zones located in the SDG&E territory. The regressions from the previous figures are used along with Typical Meteorological Year (TMY2) weather data for one year (daily minimum and maximum values, respectively, for heating and cooling). The annual energy use, energy savings, and percent savings are all shown in these tables for each end use and for total energy (when units allow). These tables are also summarized in Figures 27, 28 and 29. Savings range across the different climate zones and across properties. Cooling savings range from 7% at the Navy Lodge in Climate Zone 10 to 72% at the US Grant in Climate Zone 6. Lower savings at the Navy Lodge are expected, since it is extended stay lodging, and has fewer unoccupied hours in which to generate savings. Heating savings range from -122% at the Hampton Inn in Climate Zone 14 to 79% at the US Grant (in all Climate zones, due to the lack of a significant temperature correlation). Fan savings range from 53% at the US Grant to 73% at the Double Tree. Simple payback for each system in each climate zone is calculated using the estimated system cost and average California energy costs published by the United States Energy Information Administration of $0.128 per kWh and $0.99 per Therm. The estimated system cost is reported by the manufacturer for the wireless equipment, installation, and commissioning on a per room basis. Estimated cost is $300 for the Energy Eye system, $350 for the Inncom system, and $365 for the Onity system. The payback varies by climate zone, and is from 2-9 years.

Hotel Guest Room Energy Controls Final Report 12/04/08
CLTC and WCEC with ETA Page 24 of 30
Table 5: Climate Zone Analysis for Site 1 Climate Zone 6 71 8 10 14
Baseline 653 726 908 1,115 1,051
Test Controls 551 594 692 795 729
Savings 102 131 216 320 321
% Sav 16% 18% 24% 29% 31%
Baseline 75 67 75 87 91
Test Controls 142 140 147 167 203
Savings (67) (73) (72) (79) (111)
% Sav -89% -109% -97% -91% -122%
Baseline 447 447 447 447 447
Test Controls 160 160 160 160 160
Savings 287 287 287 287 287
% Sav 64% 64% 64% 64% 64%
322 346 430 527 498
$41 $44 $55 $68 $64
$365 $365 $365 $365 $365
8.9 8.2 6.6 5.4 5.71 Measurements were recorded for a partial in Climate Zone 7 and results are extrapolated for the remainder of the year and additional climate zones.2 Simple payback assumes average California energy costs from the Energy Information Adminstration ($0.128 per kWh)
Heating kWh/rm/yr
Fan kWh/rm/yr
Cooling kWh/rm/yr
Total kWh Savings (rm/yr)
Operating Cost Savings (rm/yr)
Estimated System Cost (per rm)
Simple Payback (Years)2
Table 6: Climate Zone Analysis for Site 2
6 71 8 10 14
Baseline 1,284 1,360 1,532 1,712 1,587
Test Controls 1,123 1,207 1,398 1,598 1,467
Savings 161 153 134 114 120
% Sav 13% 11% 9% 7% 8%
Baseline 293 300 336 432 661
Test Controls 212 222 258 359 605
Savings 81 78 78 73 56
% Sav 28% 26% 23% 17% 9%
Baseline 1,576 1,660 1,867 2,143 2,248
Test Controls 1,335 1,429 1,655 1,957 2,072
Savings 242 231 212 186 177
% Sav 15% 14% 11% 9% 8%
483 462 424 373 353
$62 $59 $54 $48 $45
$300 $300 $300 $300 $300
4.8 5.1 5.5 6.3 6.6
Cooling kWh/rm/yr
Heating therm/rm/yr
Fan kWh/rm/yr
Climate Zone
Total kWh Savings (rm/yr)
Operating Cost Savings (rm/yr)
Estimated System Cost (per rm)
Simple Payback (Years)2
1 Measurements were recorded for a partial in Climate Zone 7 and results are extrapolated for the remainder of the year and additional climate zones.2 Simple payback assumes average California energy costs from the Energy Information Adminstration ($0.128 per kWh)

Hotel Guest Room Energy Controls Final Report 12/04/08
CLTC and WCEC with ETA Page 25 of 30
Table 7: Climate Zone Analysis for Site 3 6 71 8 10 14
Baseline 2,170 2,299 2,587 2,890 2,681
Test Controls 978 997 1,039 1,083 1,052
Savings 1,192 1,302 1,549 1,808 1,629
% Sav 55% 57% 60% 63% 61%
Baseline 44 44 44 44 44
Test Controls 37 37 37 37 37
Savings 7 7 7 7 7
% Sav 17% 17% 17% 17% 17%
Baseline 186 186 186 186 186
Test Controls 51 51 51 51 51
Savings 135 135 135 135 135
% Sav 73% 73% 73% 73% 73%
1327 1437 1684 1943 1764
7 7 7 7 7
$177 $191 $223 $256 $233
$350 $350 $350 $350 $350
2.0 1.8 1.6 1.4 1.5
Operating Cost Savings (rm/yr)
Estimated System Cost (per rm)
Simple Payback (Years)2
1 Measurements were recorded for a partial in Climate Zone 7 and results are extrapolated for the remainder of the year and additional climate zones.2 Simple payback assumes average California energy costs from the Energy Information Adminstration ($0.128 per kWh and $0.99 per Therm)
Heating therm/rm/yr
Fan kWh/rm/yr
Cooling kWh/rm/yr
Climate Zone
Total kWh Savings (rm/yr)
Total Therms Savings (rm/yr)
Table 8: Climate Zone and Economic Analysis for Site 4
6 71 8 10 14
Baseline 3,347 3,347 3,347 3,347 3,347
Test Controls 939 1,002 1,144 1,293 1,192
Savings 2,408 2,345 2,203 2,054 2,155
% Sav 72% 70% 66% 61% 64%
Baseline 51 51 51 51 51
Test Controls 11 11 11 11 11
Savings 40 40 40 40 40
% Sav 79% 79% 79% 79% 79%
Baseline 555 555 555 555 555
Test Controls 259 259 259 259 259
Savings 296 296 296 296 296
% Sav 53% 53% 53% 53% 53%
2704 2641 2499 2350 2450
40 40 40 40 40
$350 $350 $350 $350 $350
0.9 0.9 1.0 1.0 1.0
Total Therms Savings (rm/yr)
Estimated System Cost (per rm)
Simple Payback (Years)2
1 Measurements were recorded for a partial in Climate Zone 7 and results are extrapolated for the remainder of the year and additional climate zones.2 Simple payback assumes average California energy costs from the Energy Information Adminstration ($0.128 per kWh and $0.99 per Therm)
Heating therm/rm/yr
Fan kWh/rm/yr
Cooling kWh/rm/yr
Climate Zone
Total kWh Savings (rm/yr)

Hotel Guest Room Energy Controls Final Report 12/04/08
CLTC and WCEC with ETA Page 26 of 30
Energy Savings: Cooling
0%
10%
20%
30%
40%
50%
60%
70%
80%
6 7 8 10 14
Climate Zone
Perc
ent S
avin
gs HamptonNavy LodgeDoubleTreeUS Grant
Figure 26: Cooling Energy Savings for SDG&E Climate Zones
Energy Savings: Heating
-150%
-100%
-50%
0%
50%
100%
6 7 8 10 14
Climate Zone
Perc
ent S
avin
gs Hampton
Navy Lodge
DoubleTree
US Grant
Figure 27: Heating Energy Savings for SDG&E Climate Zones
Energy Savings: Fan
0%
10%
20%
30%
40%
50%
60%
70%
80%
6 7 8 10 14
Climate Zone
Perc
ent S
avin
gs HamptonNavy LodgeDoubleTreeUS Grant
Figure 28: Fan Energy Savings for SDG&E Climate Zones
Hotel Guest Room Energy Controls Final Report 12/04/08
CLTC and WCEC with ETA Page 27 of 30
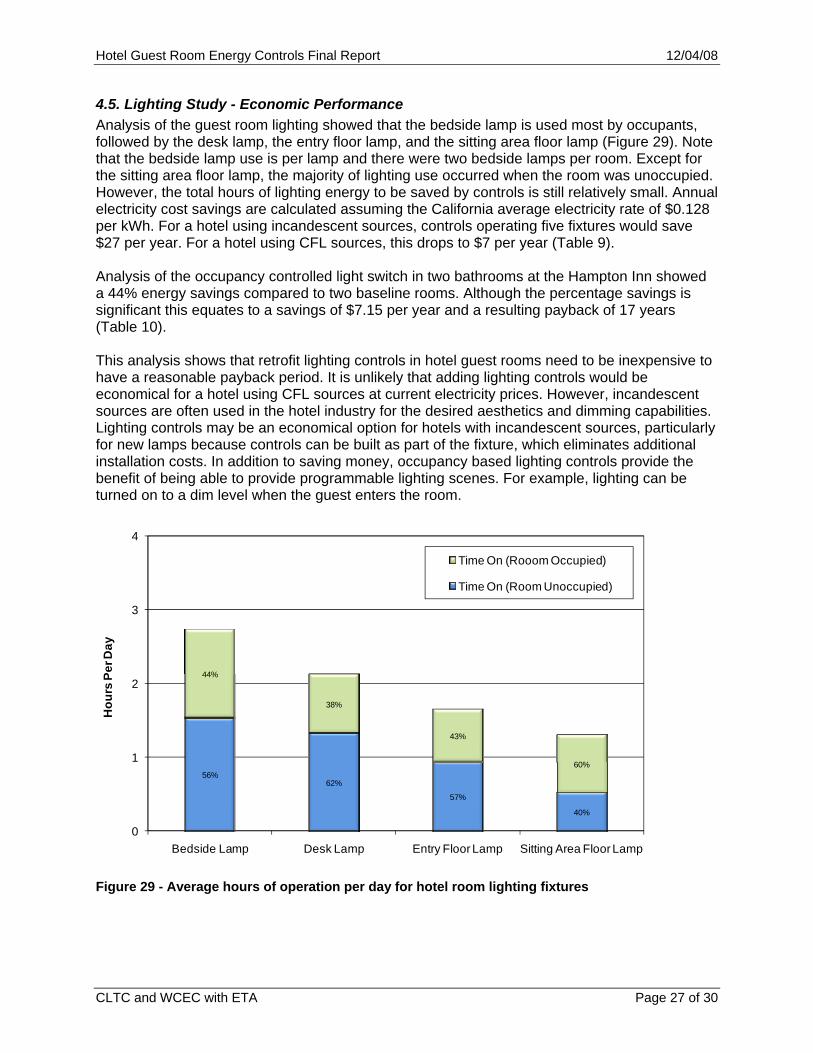
4.5. Lighting Study - Economic Performance Analysis of the guest room lighting showed that the bedside lamp is used most by occupants, followed by the desk lamp, the entry floor lamp, and the sitting area floor lamp (Figure 29). Note that the bedside lamp use is per lamp and there were two bedside lamps per room. Except for the sitting area floor lamp, the majority of lighting use occurred when the room was unoccupied. However, the total hours of lighting energy to be saved by controls is still relatively small. Annual electricity cost savings are calculated assuming the California average electricity rate of $0.128 per kWh. For a hotel using incandescent sources, controls operating five fixtures would save $27 per year. For a hotel using CFL sources, this drops to $7 per year (Table 9). Analysis of the occupancy controlled light switch in two bathrooms at the Hampton Inn showed a 44% energy savings compared to two baseline rooms. Although the percentage savings is significant this equates to a savings of $7.15 per year and a resulting payback of 17 years (Table 10). This analysis shows that retrofit lighting controls in hotel guest rooms need to be inexpensive to have a reasonable payback period. It is unlikely that adding lighting controls would be economical for a hotel using CFL sources at current electricity prices. However, incandescent sources are often used in the hotel industry for the desired aesthetics and dimming capabilities. Lighting controls may be an economical option for hotels with incandescent sources, particularly for new lamps because controls can be built as part of the fixture, which eliminates additional installation costs. In addition to saving money, occupancy based lighting controls provide the benefit of being able to provide programmable lighting scenes. For example, lighting can be turned on to a dim level when the guest enters the room.
56%62%
57%
40%
44%
38%
43%
60%
0
1
2
3
4
Bedside Lamp Desk Lamp Entry Floor Lamp Sitting Area Floor Lamp
Hou
rs P
er D
ay
Time On (Rooom Occupied)
Time On (Room Unoccupied)
Figure 29 - Average hours of operation per day for hotel room lighting fixtures

Hotel Guest Room Energy Controls Final Report 12/04/08
CLTC and WCEC with ETA Page 28 of 30
Table 9 - Potential for electricity and cost savings from guest room lighting controls.
Bedside Lamp (kWh)
Desk Lamp (kWh)
Entry Floor Lamp (kWh)
Sitting Area Floor Lamp
(kWh) Total1
(kWh) Annual Cost
Savings1
Incandescent Lighting Average Annual Savings per Room 56 48 34 19 214 $27
CFL Lighting Average Annual Savings per Room 14 12 9 5 53 $7
1 The total and annual cost savings includes two bedside lamps, and one desk lamp, entry floor lamp, and sitting area floor lamp. Annual cost savings assumes the California average electricity rate of $0.128 per kWh. Table 10 - Summary of bathroom lighting savings from occupancy based controls Baseline Controlled Lighting usage (hours) 679 383 Room days measured 182 182 Lighting usage (hours/day) 3.7 2.1 Expected annual usage (hours/room/year)
1363 769
Lighting load controlled (Watts) 94 94 Energy Consumed per Year (kWh) 128 72 Savings (kWh) 56 Savings ($/Room/Year) $7.15 Simple payback (years) 17
5. Discussion Achieving the reported energy savings for occupancy based guest room thermostats requires proper installation and maintenance. In this study, data was removed from the analysis because of improperly installed equipment. The energy savings is only reported for functional systems. At the Hampton Inn, two of the five thermostats had the incorrect door switch installed so the system assumed the room was occupied the entire time and never entered energy saving mode. This was not discovered until the conclusion of the study. The manufacturer corrected the problem for the future performance of the system. At the US Gant, two of five thermostats had the door switch installed incorrectly so that the system assumed the room was always occupied. This was discovered early on in the study and the problems were promptly fixed by the manufacturer. The malfunction prompted the hotel staff to run the quick door switch test on all the rooms in the hotel, since the system had been installed hotel wide. The hotel found a 40% failure rate on the installation of the system. All problems were corrected by the manufacturer, who had contracted the original installer. The Doubletree, did not experience installation problems. This project illustrates the importance of properly trained installers and that the hotel must adapt to check the performance of the system as part of regular maintenance.
Hotel Guest Room Energy Controls Final Report 12/04/08
CLTC and WCEC with ETA Page 29 of 30
Although energy savings was achieved in all installations the results were varied. The Navy Lodge and Hampton Inn had the lowest savings with approximately 300-500 kWh/room/year. The high room occupancy rates in the Navy Lodge extended stay hotel attributed to lower energy savings in that hotel. It is notable that these two hotels were the ones with PTAC systems. The baseline energy consumption hotels with PTAC systems was significantly less (600-1500 kWh/rm/yr) compared to the baseline energy consumption in hotels with fan coil systems (2100-3300 kWh/rm/yr). It is possible that there is significantly more savings glean from a fan coil system than a PTAC system. One reason for this could be is that the PTAC operation is generally very noticeable and noisy, while the fan coil system is less so. The occupant or housekeeping may be more likely to turn off the PTAC in an unoccupied room. Fan coil systems may also have achieved greater energy savings because of the larger unoccupied setback, which is +/- 5 degrees from the last set point, compared to systems which always maintain the room temperature between 68-76 degrees. The temperature setback range is selectable by the hotel and can be adjusted on either manufacturer’s products. While a larger setback range is expected to achieve greater energy savings, this must be balanced with guest comfort so that the room temperature is at least acceptable when the occupant enters. While guests were not formally surveyed, no guest complaints were received by any of the hotels regarding the thermostat system. More sophisticated networked controls with an energy management system allow larger setbacks when the room is not rented. When the guest checks in, the setback decreases so the room is more comfortable upon entering.
6. Conclusions Analysis of energy used in hotel rooms utilizing advanced occupancy-based control systems has demonstrated significant energy savings. Energy use was measured in four hotels, two with packaged terminal air conditioning units and two with fan coil units, in roughly equal numbers of rooms with conventional thermostat control and advanced controls. Although the data were somewhat limited, and represented only a partial year, we were able to identify significant savings in heating, cooling and fan energy use. Most of the energy savings occurred during unoccupied hours. This is expected, as the controls are nominally the same during occupied hours, and the primary benefit occurs when the occupants are gone. Most commercial buildings show a fairly clear linear relationship between daily energy use and daily minimum or maximum temperature, but in many of the hotels studied this was not the case. Individual behavior tends to drive energy use in hotel guest rooms. In most cases, there was a more coherent relationship between energy use and temperature in the rooms with advanced controls, showing that the impact of behavior is minimized. By correlating daily energy use with daily minimum or maximum temperatures, correlations were developed that could be applied to the part of the year that was not monitored. This enabled calculation of annual energy savings for a typical year, rather than for the particular year when the buildings were monitored. It also enabled calculation of savings in other climate zones, although such extrapolations are only estimates and should be used carefully. A large range of energy savings was calculated from 7% to 72% for cooling, from -122% to 79% for heating, and from 53% to 73% for fans. This savings equated to between 300 and 2,600 kWh per hotel room per year and 7-40 therms per hotel room per year. While the available data were limited, it is clear that these technologies have the potential to produce energy savings in this relatively untapped market, and more research is clearly warranted to better understand the interactions between HVAC and lighting, and the impacts of occupant behavior on energy savings. The networking capabilities of these systems would

Hotel Guest Room Energy Controls Final Report 12/04/08
CLTC and WCEC with ETA Page 30 of 30
facilitate such research, and enable more advanced optimization and demand response. Networked systems would also allow hotel management to identify equipment malfunctions quickly at the system level and assure that expected energy performance is being met.