Hotel Distribution Study Switzerland: Results for the ... · Hotel Distribution Study Switzerland:...
46
Institute of Tourism Page 1 Hotel Distribution Study Switzerland: Results for the Reference Year 2015 May 10, 2016 Roland Schegg Institute of Tourism, HES‐SO Valais (Sierre, Switzerland) [email protected]
Transcript of Hotel Distribution Study Switzerland: Results for the ... · Hotel Distribution Study Switzerland:...

Institute of TourismPage 1
Hotel Distribution Study Switzerland: Results for the Reference Year 2015
May 10, 2016
Roland ScheggInstitute of Tourism, HES‐SO Valais
(Sierre, Switzerland) [email protected]
Institute of TourismPage 2
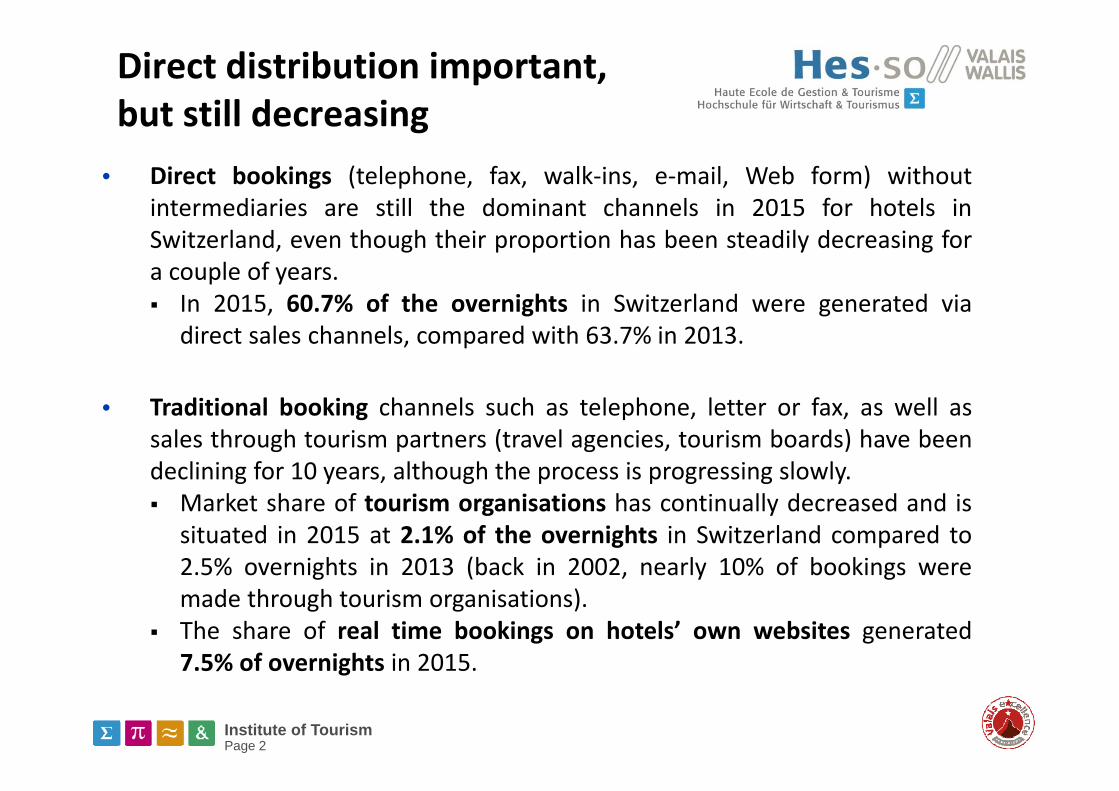
Direct distribution important, but still decreasing
• Direct bookings (telephone, fax, walk‐ins, e‐mail, Web form) withoutintermediaries are still the dominant channels in 2015 for hotels inSwitzerland, even though their proportion has been steadily decreasing fora couple of years. In 2015, 60.7% of the overnights in Switzerland were generated via
direct sales channels, compared with 63.7% in 2013.
• Traditional booking channels such as telephone, letter or fax, as well assales through tourism partners (travel agencies, tourism boards) have beendeclining for 10 years, although the process is progressing slowly. Market share of tourism organisations has continually decreased and is
situated in 2015 at 2.1% of the overnights in Switzerland compared to2.5% overnights in 2013 (back in 2002, nearly 10% of bookings weremade through tourism organisations).
The share of real time bookings on hotels’ own websites generated7.5% of overnights in 2015.

Institute of TourismPage 3
Growing Shares of Online Distribution Channels
• Online distribution has become an important channel for the Swiss hotelindustry. Overall, nearly one third of overnights are generated real‐timethrough online channels (OTA, GDS). OTAs are clearly dominant (20.6% ofovernights). They have multiplied their market shares in the last few yearsand seem to grow continuously.
• 27% of the hotels generate more than 30% of overnights via OTA and everysixth hotel has OTA sales of more than 40% of overnights underlining thestrong dependency of many operators in Switzerland on theseintermediaries.

Institute of TourismPage 4
Growing Shares of Online Distribution Channels
• OTA market shares by hotel segment 5 star hotels have a significant lower OTA share (11%) than all other hotel
categories. There is only a small difference between business (19.5%) and leisure
(21.6%) hotels. Hotels in bigger cities (>50’000 inhabitants) tend to have higher OTA
shares (>23%) than hotels in smaller cities and villages (<20%). Chain hotels have smaller OTA shares (15%) than independent hotels
(20.7) or properties from hotel cooperations (22.4%).

Institute of TourismPage 5
The OTA‐hotel commercial relationship
• 95% of the surveyed Swiss hotels say that they have not received anyreductions of OTA commissions since summer 2015.
• Based on responses of 121 hotels, the share of OTA commissions in theoverall cost structure could be estimated. The average OTA distributioncosts are at 9.3% (median value at 6%) which is a substantial proportionwhen compared to the 42% costs for the staff. For 31.4% of properties thesecosts are between 10% and 20%.
• Nearly two third of hotel owners (64.1%) have seen an increase indistribution costs in the last 5 years, whereas one third of the respondentsreport a stable situation. Actually only 3.2% of the hotels have seen adecrease in distribution costs.
• The OTA commission rates have been increasing for 37.8% of hotels in oursample within the last 5 years, whereas 58% report a stable situation.

Institute of TourismPage 6
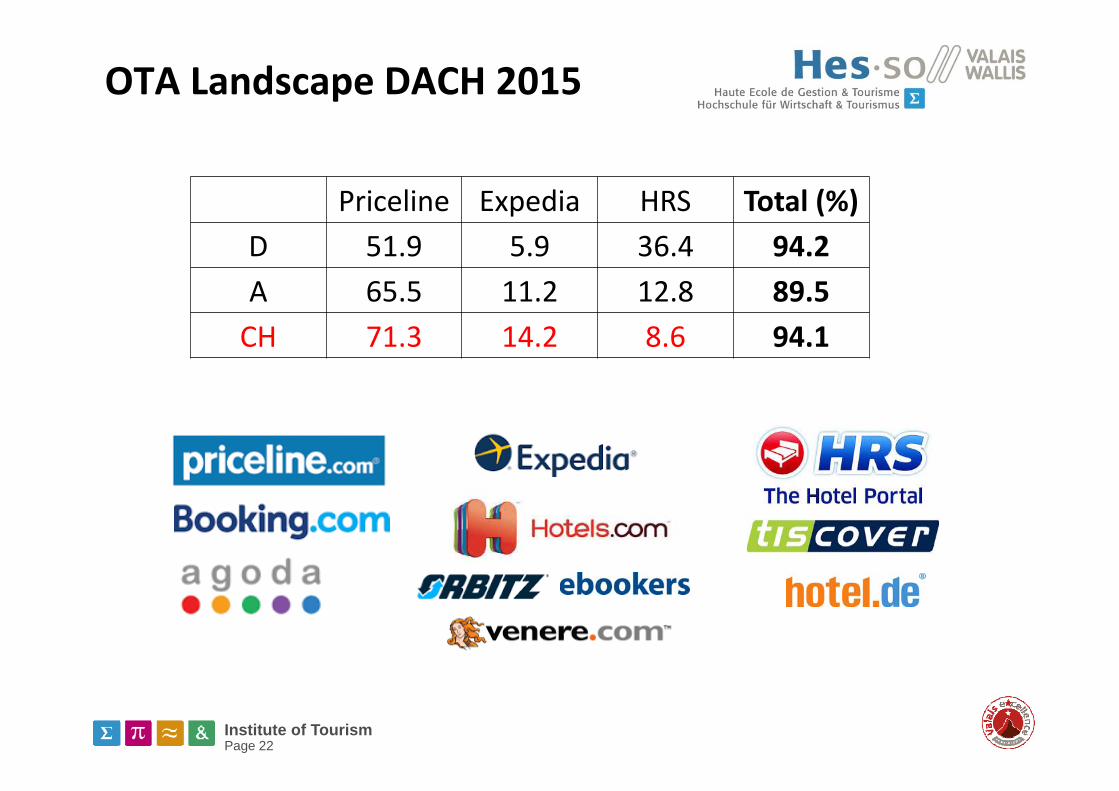
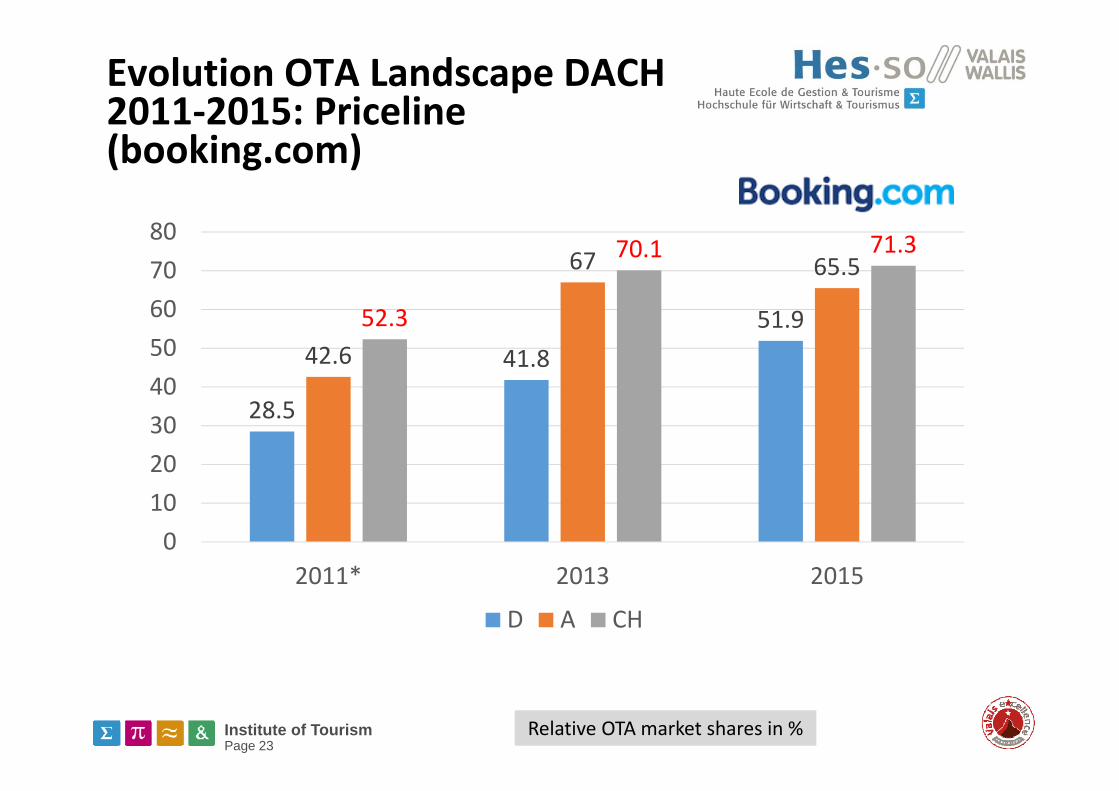
On average, we estimate that in 2015 already more than one out of fiveovernights was generated by Online Booking Agencies (OTA), mainlythrough Priceline (booking.com, Agoda), Expedia (incl. eBookers,hotels.com, Orbitz, Venere) and HRS (incl. hotel.de, Tiscover) whichtogether account for 94.1% of this market.
Priceline has 71.3% of the OTA market in Switzerland, Expedia 14.2% andHRS 8.6%.
• Relative OTA market shares of Priceline, Expedia and HRS in different hotelsegments: Priceline has higher market shares within the OTA market in leisure
(76.4%) than business (65%) hotels, whereas the situation is the oppositefor HRS (14% business versus 4% leisure) and Expedia (17% businessversus 12% leisure).
HRS (11%) and Expedia (27%) are more popular with chain hotels thanindependent hotels, whereas Priceline is more used by independenthotels (74%) than by chain hotels (57%).
The OTA landscape in Switzerland

Institute of TourismPage 7
Distribution Technology: Channel Management
• Two third of Swiss hotels use a channel manager and one third a CRSsystem to maintain rates and availabilities in the different distributionchannels.
• Yet nearly one of four hotels (23.5%) still manages distribution channels in amanual way. This proportion is higher in the 1‐3 star hotels and inindependent hotels than other hotel segments.
• Chain hotels and properties associated with hotel cooperations use mainlychannel managers and/or CRS systems.
• There is no significant difference between business and leisure hotels.

Institute of TourismPage 8
Distribution Technology: Meta‐Search Engines
• About half of the hotels have a direct junction / interface with meta‐searchengines such as Kayak or Tripadvisor. Nearly one out five hotels does notknow this option whereas the rest of the respondants is not interested bythis option.
• TripAdvisor (70.1%), Trivago (52.3%) and Google (Hotel Ads) are the mainplayers in this field.

Institute of TourismPage 9
The survey

Institute of TourismPage 10
The survey: background
• In order to draw a more precise picture of the current situationof distribution (online as well as offline) within the Europeanhotel industry, especially in relation to the role of online travelagencies (OTA), HOTREC, the umbrella association of Hotels,Restaurants and Cafés in Europe, has decided to conduct anonline survey together with hotel associations from HOTRECmember countries (e.g. hotelleriesuisse and Gastrosuisse forSwitzerland) across Europe for the reference year 2015.
• In Switzerland, the survey is mainly based on responses frommembers of hotelleriesuisse and to a smaller extent on asample from GastroSuisse.

Institute of TourismPage 11
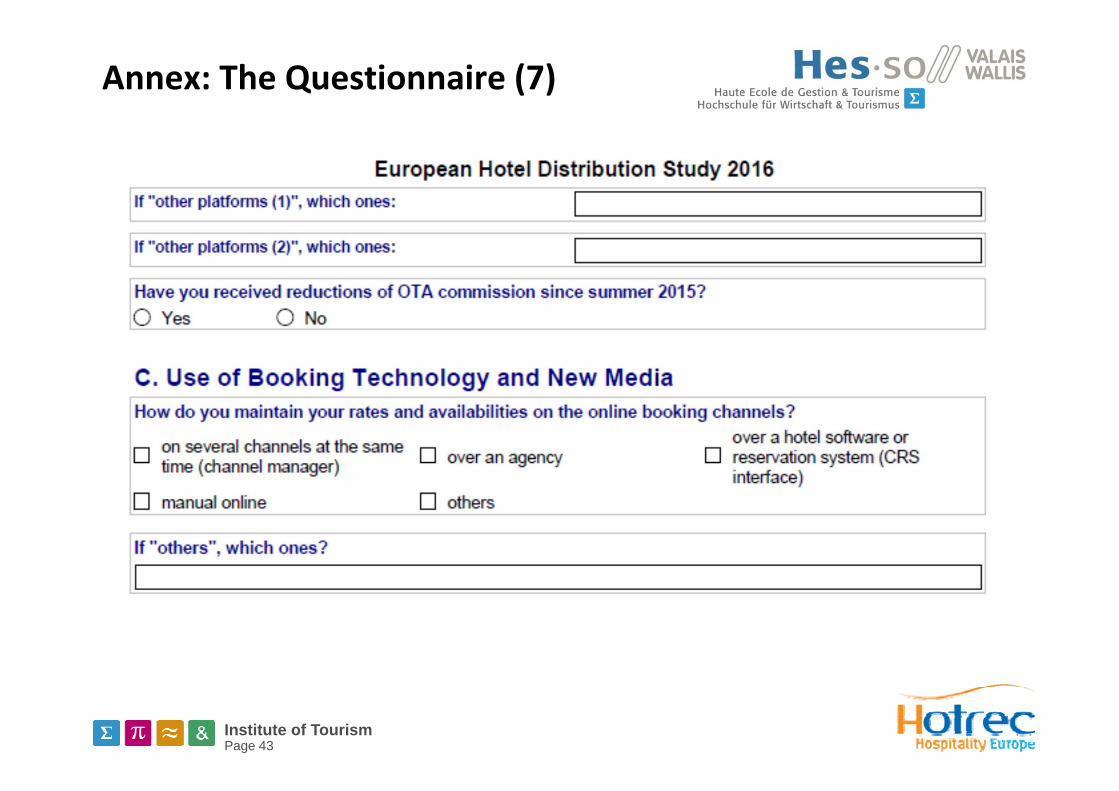
The questionnaire
• The online questionnaire asked for market shares of differentdirect and indirect distribution channels (in terms of overnightsas in our former study for the reference year 2013) as well asthe specific market shares of the OTAs (such as Booking.com,Expedia, and HRS).
• Further questions queried how hoteliers manage onlinedistribution channels and the use of interfaces with meta‐search engines.
• The final part comprises questions covering characteristics ofthe hotel property (star rating, the size of the hotel in terms ofrooms offered, amount of overnight stays, its location, maintarget group, etc.)
See annex for a copy of the questionnaire

Institute of TourismPage 12
Methodological remarks: sampling• The Institute of Tourism (ITO) of the University of Applied
Sciences Western Switzerland Valais (HES‐SO Valais) in Sierreconducted an online survey in order get insights intodistribution trends in the hospitality sector in Switzerland.
• The online survey for the reference year 2015 was conducted inMarch‐April 2016 among 1986 member hotels ofhotelleriesuisse and 542 members of Gastrosuisse
• The results presented here are based on 230 responses (206hotels from hotelleriesuisse members and 24 responses fromGastrosuisse members). This corresponds to an overall responserate of 9% (10.4% hotelleriesuisse, 4.4% Gastrosuisse).
• The sample reflects the structure of members ofhotelleriesuisse regarding the classification of hotels.

Institute of TourismPage 13
• As not all hotels have answered all the questions, the indicated total number of observations changes from one question to another.
• Measure of accuracyo A confidence interval gives an estimated range of values which is likely
to include an unknown population parameter, the estimated range being calculated from a given set of sample data. (Definition from Valerie J. Easton and John H. McColl's Statistics Glossary v1.1). ‐> A confidence interval tell you the most likely range of the unknown population average.
o We used the bootstrap approach with a 95% confidence interval: This gives the probability that the interval produced by the bootstrap method includes the true value of the parameter in the population.
o We used: Wessa P., (2015), Bootstrap Plot for Central Tendency (v1.0.14) in Free Statistics Software (v1.1.23‐r7), Office for Research Development and Education, URL http://www.wessa.net/rwasp_bootstrapplot1.wasp/
Methodological remarks: confidence intervals

Institute of TourismPage 14
Distribution channels

Institute of TourismPage 15
Unweighted sample: n=226 Market share
Direct - Phone 19.9 19.0 20.8Direct - Mail / fax 2.0 1.7 2.3Direct - Walk-In (persons without reservation) 4.7 4.3 5.1Direct - Contact form on own website (without availability check) 5.0 4.4 5.6Direct - Email 21.6 20.7 22.5Direct - real time booking over own website with availability check 7.5 6.9 8.0Destination Marketing Organization (DMO) / trade associations 1.4 1.2 1.6National Tourism Organization (NTO) 0.7 0.6 0.9Tour operator / Travel agency 4.6 4.0 5.2Hotel chains and cooperations with CRS 1.1 0.7 1.5Wholesaler (e.g. Hotelbeds, Tourico, Gulliver, Transhotel, etc.) 2.3 2.0 2.6Event and Congress organizer 2.3 2.0 2.6Online Booking Agency (OTA) 20.6 19.5 21.7Globale Distributionssysteme (GDS) 3.4 2.9 3.8Social Media Channels 0.4 0.1 0.7other distribution channels 2.5 2.5 2.2 2.8
60.7
2.1
10.3
24.3
confidence interval (bootstrap)
Market shares (overnights) of distribution channels 2015
Confidence intervals are stated at the 95% level. Market shares in % of overnights.
Institute of TourismPage 16
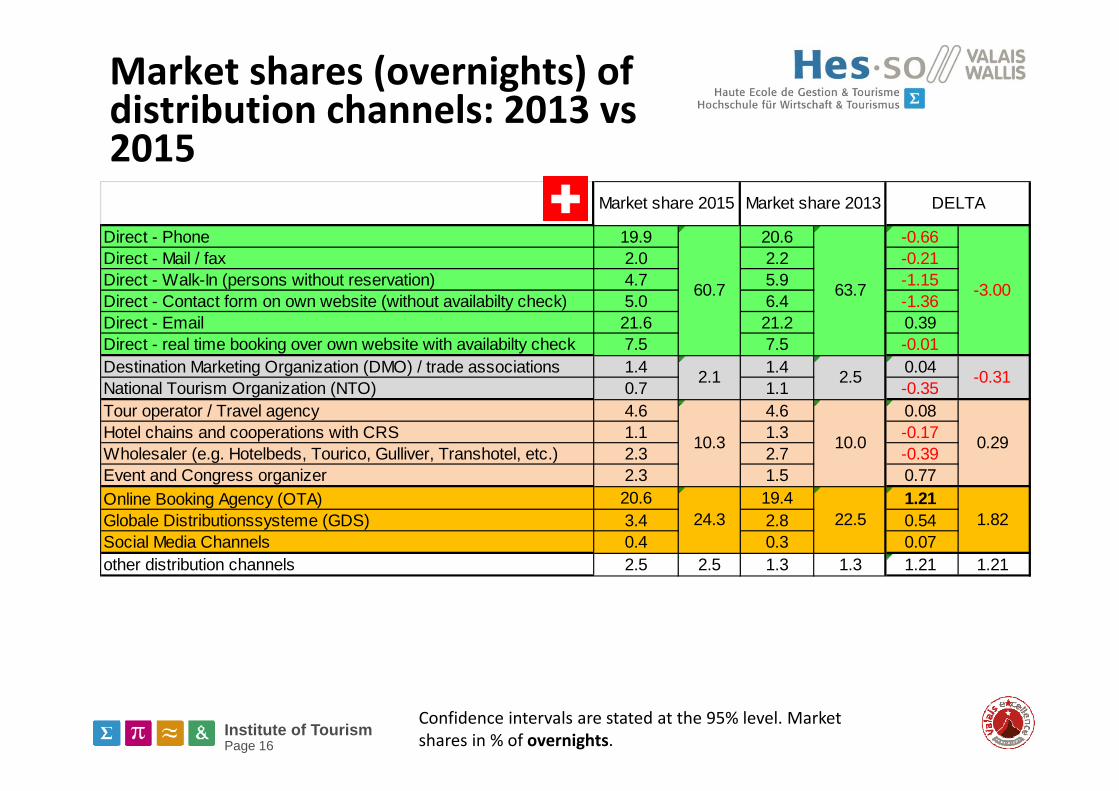
Market shares (overnights) of distribution channels: 2013 vs 2015
Direct - Phone 19.9 20.6 -0.66 Direct - Mail / fax 2.0 2.2 -0.21 Direct - Walk-In (persons without reservation) 4.7 5.9 -1.15 Direct - Contact form on own website (without availabilty check) 5.0 6.4 -1.36 Direct - Email 21.6 21.2 0.39Direct - real time booking over own website with availabilty check 7.5 7.5 -0.01 Destination Marketing Organization (DMO) / trade associations 1.4 1.4 0.04National Tourism Organization (NTO) 0.7 1.1 -0.35 Tour operator / Travel agency 4.6 4.6 0.08Hotel chains and cooperations with CRS 1.1 1.3 -0.17 Wholesaler (e.g. Hotelbeds, Tourico, Gulliver, Transhotel, etc.) 2.3 2.7 -0.39 Event and Congress organizer 2.3 1.5 0.77Online Booking Agency (OTA) 20.6 19.4 1.21Globale Distributionssysteme (GDS) 3.4 2.8 0.54Social Media Channels 0.4 0.3 0.07other distribution channels 2.5 2.5 1.3 1.3 1.21 1.21
24.3 22.5 1.82
2.1 2.5 -0.31
10.3 10.0 0.29
Market share 2015 Market share 2013 DELTA
60.7 63.7 -3.00
Confidence intervals are stated at the 95% level. Market shares in % of overnights.

Institute of TourismPage 17
Trends in Booking Channels in Swiss Hotels 2002‐2015
Attention: Market shares in % of bookings for 2002‐2012 & 2014 and in % of overnights in *2013 and *2015 !
0% 10% 20% 30% 40% 50% 60% 70% 80% 90%
Direct Bookings (E-mail, telephone…)
Online Travel Agency (OTA)
Tour operators / TA & Wholesaler
Tourism organisations (DMO)
Event and conference organizers
Global distribution systems - GDS
Hotel chain & affiliation with CRS
Social media channels & others
*2015 (n=226)2014 (n=250)*2013 (n=279)2012 (n=200)2011 (n=196)2010 (n=211)2009 (n=198)2008 (n=184)2006 (n=100)2005 (n=94)2002 (n=202)

Institute of TourismPage 18
Trends in Booking Channels in Swiss Hotels 2006‐2015
0% 10% 20% 30% 40% 50% 60% 70% 80%
Tradit. channels (telephone, fax, letter, walk-in), E-Mail & Web form
Online Travel Agency (OTA)
Tour operators / TA & Wholesaler
Realtime booking (own website)
Tourism organisations (DMO)
Event and conference organiszers
Global distribution systems - GDS
Hotel chain & affiliation with CRS
Social media channels & others
*2015 (n=226)2014 (n=250)*2013 (n=279)2012 (n=200)2011 (n=196)2010 (n=211)2009 (n=198)2008 (n=184)2006 (n=100)
Attention: Market shares in % of bookings for 2002‐2012 & 2014 and in % of overnights in *2013 and *2015 !

Institute of TourismPage 19
Distribution Trends in the Swiss Hotel Sector 2002‐2015
60.7%
24.3%
15.0%
0% 10% 20% 30% 40% 50% 60% 70% 80% 90%
Direct Bookings (hotel-guest)
Online booking intermediairies (OTA,GDS, social media)
Tourism partners (tour operators,wholesaler, DMO national-local, event &
conference organizers, hotel chain,others) *2015 (n=226)
2014 (n=250)*2013 (n=279)2012 (n=200)2011 (n=196)2010 (n=211)2009 (n=198)2008 (n=184)2006 (n=100)2005 (n=94)2002 (n=202)
Attention: Market shares in % of bookings for 2002‐2012 & 2014 and in % of overnights in *2013 and *2015 !

Institute of TourismPage 20
Distribution Trends in the Swiss Hotel Sector 2002‐2015
Attention: Market shares in % of bookings for 2002‐2012 & 2014 and in % of overnights in *2013 and *2015 !
0% 10% 20% 30% 40% 50% 60% 70% 80% 90% 100%
2002 (n=202)
2005 (n=94)
2006 (n=100)
2008 (n=184)
2009 (n=198)
2010 (n=211)
2011 (n=196)
2012 (n=200)
* 2013 (n=279)
2014 (n=250)
* 2015 (n=226)
Direct Bookings (hotel‐guest) Indirect Booking (via intermediairy)
Institute of TourismPage 21
OTA Landscape
Institute of TourismPage 22
OTA Landscape DACH 2015
Priceline Expedia HRS Total (%)D 51.9 5.9 36.4 94.2A 65.5 11.2 12.8 89.5CH 71.3 14.2 8.6 94.1
Institute of TourismPage 23
Evolution OTA Landscape DACH 2011‐2015: Priceline (booking.com)
28.5
41.851.9
42.6
67 65.5
52.3
70.1 71.3
01020304050607080
2011* 2013 2015
D A CH
Relative OTA market shares in %

Institute of TourismPage 24
Evolution OTA Landscape DACH 2011‐2015: Expedia
Relative OTA market shares in %
7.6 8.2
5.97.4 7.9
11.2
8.5
11.5
14.2
02468
10121416
2011* 2013 2015
D A CH

Institute of TourismPage 25
Evolution OTA Landscape DACH 2011‐2015: HRS
Relative OTA market shares in %
50.6
41.636.4
25.9
15.3 12.813.79.8 8.6
0
10
20
30
40
50
60
2011* 2013 2015
D A CH

Institute of TourismPage 26
Distribution Costs as Percentage of Total Costs
43
30
38
5
5
0 10 20 30 40 50
<5%
5-10%
10-20%
20-30%
>30%Average distribution costs: 9.3%
Median: 6%

Institute of TourismPage 27
Evolution of Distribution Costs in the last Five Years
119
60
6
0 20 40 60 80 100 120 140
increasing
stable
decreasing

Institute of TourismPage 28
Evolution of OTA Commission Rates in the last Five Years
71
109
8
0 20 40 60 80 100 120
increasing
stable
decreasing

Institute of TourismPage 29
Have you received a reduction of OTA Commission Rates since summer 2015
10
185
0 50 100 150 200
Yes
No

Institute of TourismPage 30
Distribution channel management

Institute of TourismPage 31
How do you maintain your rates and availabilities on the online booking channels?
Question with multiple answers, total can be > 100%
0%
1%
23%
32%
65%
1%
1%
44%
23%
44%
0% 10% 20% 30% 40% 50% 60% 70%
others
over an agency
manual online
over a hotel software or reservationsystem (CRS interface)
on several channels at the same time(channel manager)
2013 2015
Institute of TourismPage 32
Use of meta‐search engines

Institute of TourismPage 33
Are your rates and availabilities accessible with a direct interface with a meta‐search engine?
17%
35%
48%
45%
18%
30%
0% 10% 20% 30% 40% 50% 60%
No, I do not know this option
No, this is of no interest for our hotel
Yes, with the help of a permanentconnection to the own hotel booking
system
2013 2015

Institute of TourismPage 34
Used meta‐search engines
12%
13%
41%
52%
70%
9%
9%
50%
34%
71%
0% 10% 20% 30% 40% 50% 60% 70% 80%
Others
Kayak
Google (Hotel Ads)
Trivago
TripAdvisor
2013 2015
Question with multiple answers, total can be > 100%

Institute of TourismPage 35
Contact
Prof. Roland ScheggUniversity of Applied Sciences of Western Switzerland Valais (HES‐SO Valais)School of Management & TourismInstitute of Tourism (ITO)TechnoPôle 3CH‐3960 Sierre/Siders, SwitzerlandTel: +41 (0)27 606 90 83Mail: [email protected] Twitter: @RolandScheggLinkedIn: ch.linkedin.com/in/rolandschegg/
Web: www.hevs.ch / www.etourism‐monitor.ch / www.tourobs.ch
Bachelor of Science HES‐SO in Tourism in German, French and Englishhttp://tourism.hevs.ch
EMBA en innovation touristique: innovation‐touristique.com

Institute of TourismPage 36
Glossary of Used Terms and Abbrevations
CRS Central Reservation SystemDMO Destination Management OrganisationDMS Destination Management System such as TOMAS or Deskline (Feratel)GDS Global Distribution System (e.g. Amadeus or Sabre)hs hotelleriesuisse (trade organisation of the Swiss hotel sector)
HRS Hotel Reservation ServiceIDS Internet Distribution SystemS Supplier
LTO Local Tourism OrganisationNTO National Tourism OrganisationOTA Online Travel AgencyPMS Property Management SystemRTO Regional Tourism OrganisationSEM Search Engine MarketingSEO Search Engine OptimisationSTC Switzerland Travel Centre (national booking system in Switzerland)

Institute of TourismPage 37
Annex: The Questionnaire (1)

Institute of TourismPage 38
Annex: The Questionnaire (2)

Institute of TourismPage 39
Annex: The Questionnaire (3)

Institute of TourismPage 40
Annex: The Questionnaire (4)

Institute of TourismPage 41
Annex: The Questionnaire (5)

Institute of TourismPage 42
Annex: The Questionnaire (6)
Institute of TourismPage 43
Annex: The Questionnaire (7)

Institute of TourismPage 44
Annex: The Questionnaire (8)

Institute of TourismPage 45
Annex: The Questionnaire (9)

Institute of TourismPage 46
Annex: The Questionnaire (10)