Hot Ductility and Deformation Behavior of C-Mn/Nb ... · Hot Ductility and Deformation Behavior of...
10
Hot Ductility and Deformation Behavior of C-Mn/Nb-Microalloyed Steel Related to Cracking During Continuous Casting H.A. Lanjewar, Pranavkumar Tripathi, M. Singhai, and P.K. Patra (Submitted April 16, 2014; in revised form June 14, 2014; published online July 18, 2014) Hot ductility studies have been performed on C-Mn and C-Mn-Nb steels with an approach to simulate the effect of cooling conditions experienced by steel in secondary cooling zone during continuous casting. Thermal oscillations prior to tensile straining deteriorate hot ductility of steel by deepening and widening the hot ductility trough. C-Mn steels are found to exhibit ductility troughs in three distinct zones whereas C-Mn-Nb steel shows drop in ductility only at low temperature in the vicinity of ferrite transformation temperatures. Start of ferrite transformation in steels causes yield ratio to increase while work hardening rates and strength coefficient decrease with decrease in test temperature in presence of thermal oscillation prior to tensile testing. Inhibition of recrystallization due to build-up of AlN particles along with the presence of MnS particles in structure and low work hardening rates causes embrittlement of steel in austenitic range. Alloying elements enhancing work hardening rates in austenitic range can be promoted to improve hot ductility. The presence of low melting phase saturated with impurities along the austenitic grain boundaries causes intergranular fracture at high temperature in C-Mn steels. Keywords cracking in continuous casting, deformation behavior, hot ductility 1. Introduction Continuous casting is the most widely used manufacturing method to process liquid steel owing to reduced operation cost, improved product uniformity and quality. However, continuous cast products suffer from surface defects which can be attributed to the complex thermal and mechanical stresses developed in cast section; and aspects of mechanical behavior of steel in the continuous casting process. Defects like longitudinal and transverse corner cracks, longitudinal and transverse face cracks, internal tears, etc., may result owing to stress- or stain-induced on account of thermal strains and bending strains during plastic bending (Ref 1, 2). Hot ductility tests on laboratory scale have been a very useful tool in determining crack susceptibility of steel at various temperatures prevailing during continuous casting operation. Conventional hot ductility tests consist of solution-treating the steel to dissolve all the alloying and grain refining additions and to produce sufficiently coarse grain structure. Post-solutioniza- tion test consists of cooling specimen to the test temperature and isothermal tensile testing until failure. However, a lot of modifications have been reported over the years to close the gap between the laboratory hot tensile tests and commercial casting conditions experienced by steel. The variations include in situ melting of specimen to redissolve, high melting temperature microalloying precipitates/MnS inclusions and cooling down to the test temperature. But even laboratory scale melting and casting does not produce the interdendritic segregation pattern and columnar cast structure as observed in commercial casting processes. Therefore, a new tensile test method was developed by Deprez et al. (Ref 3, 4) to reproduce the continuously cast structure before tensile testing. But, the work of Revaux et al. (Ref 4) shows that change in hot ductility with temperature displays same trends for both in situ melted and conventional hot test, even if former samples shows lower ductility values. In previous studies similar results have been discussed (Ref 5-7). Calvo et al. (Ref 8) showed that in situ melting in addition resulted in slightly wider hot ductility troughs. The cooling patterns applied in laboratory testing are also very different to those existing in actual casting processes. Post- solutionization, cooling to T min and reheating to the test temperature rather than cooling directly to it, widens the ductility trough (Ref 9, 10). Similarly, when thermal oscilla- tions were applied during cooling to the test temperature, ductility trough deepened and widened compared to the conventional tests without oscillation (Ref 11). After solution- izing, Spradbery and Mintz (Ref 12) applied an undercooling step prior to reheating the specimen to test temperature, in order to simulate more complex commercial cooling conditions, which caused widening of trough due to enhancement in precipitation fineness. In a recent study, Banks et al. (Ref 13) employed various thermal cycles at the temperature of mini- mum hot ductility, i.e., 800 °C and for C-Mn as well as microalloyed steels solution treating and cooling to the test H.A. Lanjewar and Pranavkumar Tripathi, Research & Devel- opment and Scientific Services, JSW Steel Ltd., Vijaynagar Works, Toranagallu, Bellary, Karnataka, India; and M. Singhai and P.K. Patra Research & Development, JSW Steel Ltd., Dolvi Works, Raigad, Maharashtra, India. Contact e-mails: harish.lanjewar@gmail. com, [email protected], [email protected], and [email protected]. JMEPEG (2014) 23:3600–3609 ÓASM International DOI: 10.1007/s11665-014-1151-0 1059-9495/$19.00 3600—Volume 23(10) October 2014 Journal of Materials Engineering and Performance
Transcript of Hot Ductility and Deformation Behavior of C-Mn/Nb ... · Hot Ductility and Deformation Behavior of...
Hot Ductility and Deformation Behaviorof C-Mn/Nb-Microalloyed Steel Relatedto Cracking During Continuous Casting
H.A. Lanjewar, Pranavkumar Tripathi, M. Singhai, and P.K. Patra
(Submitted April 16, 2014; in revised form June 14, 2014; published online July 18, 2014)
Hot ductility studies have been performed on C-Mn and C-Mn-Nb steels with an approach to simulate theeffect of cooling conditions experienced by steel in secondary cooling zone during continuous casting.Thermal oscillations prior to tensile straining deteriorate hot ductility of steel by deepening and wideningthe hot ductility trough. C-Mn steels are found to exhibit ductility troughs in three distinct zones whereasC-Mn-Nb steel shows drop in ductility only at low temperature in the vicinity of ferrite transformationtemperatures. Start of ferrite transformation in steels causes yield ratio to increase while work hardeningrates and strength coefficient decrease with decrease in test temperature in presence of thermal oscillationprior to tensile testing. Inhibition of recrystallization due to build-up of AlN particles along with thepresence of MnS particles in structure and low work hardening rates causes embrittlement of steel inaustenitic range. Alloying elements enhancing work hardening rates in austenitic range can be promoted toimprove hot ductility. The presence of low melting phase saturated with impurities along the austeniticgrain boundaries causes intergranular fracture at high temperature in C-Mn steels.
Keywords cracking in continuous casting, deformation behavior,hot ductility
1. Introduction
Continuous casting is the most widely used manufacturingmethod to process liquid steel owing to reduced operation cost,improved product uniformity and quality. However, continuouscast products suffer from surface defects which can beattributed to the complex thermal and mechanical stressesdeveloped in cast section; and aspects of mechanical behaviorof steel in the continuous casting process. Defects likelongitudinal and transverse corner cracks, longitudinal andtransverse face cracks, internal tears, etc., may result owing tostress- or stain-induced on account of thermal strains andbending strains during plastic bending (Ref 1, 2).
Hot ductility tests on laboratory scale have been a veryuseful tool in determining crack susceptibility of steel at varioustemperatures prevailing during continuous casting operation.Conventional hot ductility tests consist of solution-treating thesteel to dissolve all the alloying and grain refining additions andto produce sufficiently coarse grain structure. Post-solutioniza-tion test consists of cooling specimen to the test temperature
and isothermal tensile testing until failure. However, a lot ofmodifications have been reported over the years to close the gapbetween the laboratory hot tensile tests and commercial castingconditions experienced by steel. The variations include in situmelting of specimen to redissolve, high melting temperaturemicroalloying precipitates/MnS inclusions and cooling down tothe test temperature. But even laboratory scale melting andcasting does not produce the interdendritic segregation patternand columnar cast structure as observed in commercial castingprocesses. Therefore, a new tensile test method was developedby Deprez et al. (Ref 3, 4) to reproduce the continuously caststructure before tensile testing. But, the work of Revaux et al.(Ref 4) shows that change in hot ductility with temperaturedisplays same trends for both in situ melted and conventionalhot test, even if former samples shows lower ductility values. Inprevious studies similar results have been discussed (Ref 5-7).Calvo et al. (Ref 8) showed that in situ melting in additionresulted in slightly wider hot ductility troughs.
The cooling patterns applied in laboratory testing are alsovery different to those existing in actual casting processes. Post-solutionization, cooling to Tmin and reheating to the testtemperature rather than cooling directly to it, widens theductility trough (Ref 9, 10). Similarly, when thermal oscilla-tions were applied during cooling to the test temperature,ductility trough deepened and widened compared to theconventional tests without oscillation (Ref 11). After solution-izing, Spradbery and Mintz (Ref 12) applied an undercoolingstep prior to reheating the specimen to test temperature, in orderto simulate more complex commercial cooling conditions,which caused widening of trough due to enhancement inprecipitation fineness. In a recent study, Banks et al. (Ref 13)employed various thermal cycles at the temperature of mini-mum hot ductility, i.e., 800 �C and for C-Mn as well asmicroalloyed steels solution treating and cooling to the test
H.A. Lanjewar and Pranavkumar Tripathi, Research & Devel-opment and Scientific Services, JSW Steel Ltd., Vijaynagar Works,Toranagallu, Bellary, Karnataka, India; andM. Singhai and P.K. PatraResearch & Development, JSW Steel Ltd., Dolvi Works, Raigad,Maharashtra, India. Contact e-mails: [email protected], [email protected], [email protected], [email protected].
JMEPEG (2014) 23:3600–3609 �ASM InternationalDOI: 10.1007/s11665-014-1151-0 1059-9495/$19.00
3600—Volume 23(10) October 2014 Journal of Materials Engineering and Performance

temperature have been recommended. For steels with widerductility trough behavior, small differences in ductility betweenspecimen given oscillations and those without, would notjustify application of such complex thermal profiles. Hence, inthe present study, conventional hot ductility tests have beenapplied to test the specimen at different temperatures. Since,undercooling step before tensile straining at test temperatureleads to deepening and widening of ductility trough, it has beenincorporated in the thermal cycle, simulating the effect ofextreme cooling conditions experienced by steel during sec-ondary cooling in continuous casting.
In previous studies, little effort has been put to correlate thehot ductility observed in steel with its mechanical behavior athigh temperature which can assist in determining the causes ofembrittlement in steel at different stages of solidification. Theobjective of the present investigation is twofold:
(i) To understand fracture mechanisms associated with thehot ductility at different temperatures.
(ii) To correlate hot ductility with high temperature mechan-ical/deformation behavior of steel and highlight thecauses of steel embrittlement.
2. Experimental
Cylindrical steel samples of length 121.5 and 10 mmdiameter were machined from 50 mm cast thin slab withlongitudinal axis of sample aligned along the casting direction.The chemical composition of the steels investigated is as givenin Table 1. Two types of steels were undertaken in presentstudy, viz. C-Mn steel and C-Mn-Nb-microalloyed steel. Theschematics of the different thermal cycles applied to differentsteels are shown in Fig. 1. Steel 1 was tested using conven-tional hot tensile test; while in order to study the hot ductilitydeterioration owing to undercooling and reheating cycle, Steel2 and 3 were given an undercooling step before reheating to thetest temperature. C-Mn steels were solution treated at suffi-ciently high temperature, i.e., 1400 �C for 30 s to dissolve allthe MnS and AlN particles and generate coarse grain structure.As a result, grains of the order of millimeter size were observedin steel samples with worst ductility. Nb-microalloyed steel wassolutionized at 1300 �C for a longer duration, i.e., 2 min toattain complete dissolution of Nb(CN), and AlN particles. Hotductility tests were performed at various temperatures rangingfrom 700 to 1400 �C. After solution treatment, Steel 2 and3 samples were rapidly cooled to Tmin which was 100 �C belowthe test temperature and a constant strain rate of 59 10�3 s�1
was used for tensile deformation. Vacuum environment wasmaintained during entire testing to avoid any scale formation.
Hot ductility tests were conducted in Gleeble 3800 thermo-mechanical simulator. Hot steel grips with free span of 25 mmwere used to hold and heat the test specimen using resistance
heating. Use of these grips helped in maintaining uniformtemperature within the free span zone and thus ensuring tensilefailure at the center of the test specimen. Temperaturemeasurement and control was done through Pt-Pt + 13% Rhthermocouple, spot welded on to the sample surface.
Fractured surface characterization was performed usingscanning electron microscope, and EDX was used to performcompositional analysis of precipitate particles on fracturedsurfaces. Tensile straining data obtained from Gleeble wereused for analyzing mechanical behavior of steel, which is morerelevant, to correlate it with steel fracture and associated hotductility, instead of performing separate tensile tests. Sincefailure occurred in the center of the specimen which wasmaintained at isothermal test temperature at all times during thehot ductility test, it is safe to use this tensile data. Such analysishelped in directly correlating the variation in hot ductilityobserved with changes in high temperature mechanical prop-erties of steel. Continuous cooling phase transformationmodeling was done using JMatPro for all steels.
Table 1 Chemical composition of steel (wt.%)
Steel no. C Mn Si P S N Nb Al Ca Mn/S Modified Mn/S
1 0.18 0.87 0.1 0.01 0.005 0.006 … 0.03 0.0025 174 4642 0.18 1.3 0.17 0.01 0.005 0.0065 … 0.025 0.0025 260 6933 0.06 0.82 0.14 0.01 0.005 0.0115 0.015 0.025 0.0025 164 437
Fig. 1 Schematic of thermal cycles applied to different steel speci-men; (a) Steel 1, (b) Steel 2
Journal of Materials Engineering and Performance Volume 23(10) October 2014—3601

3. Results
3.1 Hot Ductility
Reduction of area (R of A) is plotted as a function oftemperature as shown in Fig. 2. Under the experimental testingconditions, to ensure freedom from cracking during commercialcasting, minimum 40% R of A is required (Ref 2). In case ofSteel 1, having tested using conventional test without underco-oling step, loss of ductility is observed at 800 �C. Hot ductilitydecreases from about 85% at 850 �C to 67% at 800 �C andcontinues until 700 �C. Though ductility always remains over40% critical limit, second trough occurs between 900 and1100 �C, and finally above 1300 �C. Different zones of hotductility drops observed in present steel are as identified inFig. 2(c). Steel 2 shows loss of ductility below 900 �C andcontinues until 800 �C in zone I. Zone II extends from 1050 to1150 �C, while zone III is observed above 1350 �C. Underco-oling introduced in thermal cycle causes deepening andwidening of ductility trough in Steel 2. Trough deepens byalmost 35% R of A and widens by 150 �C toward highertemperature in zone I. However, width of zone II is reduced andzone III shifts by 50 �C to higher temperature.
The presence of S in steel causes segregation of fine sulfidesalong the grain boundaries and weakens them, thereby reducingthe hot ductility of steel. However, higher Mn/S ratio or Catreatment of steel is found to improve the hot ductility (Ref 2).Ca is added to avoid/modify MnS particles in steel andassuming that all Ca effectively binds S, the resulting modifiedMn/S ratios are as reported in Table 1 along with Mn/S ratio. Inthe present study, in spite of better Mn/S ratio, hot ductility isinferior in Steel 2. Steel 3 shows the presence of only zone Iwhere loss of ductility is observed at 900 �C and ductilityrecovery starts below 800 �C.
3.2 Fractography
3.2.1 Steel 1. Fractured surface of samples of Steel 1 is asshown in Fig. 3. Solution treatment generated a very coarsegrain structure as observed at 700 �C, thus ensuring crackingtendencies similar to that present in cast structure. At 700 �C,surface shows intergranular nature of failure, marked withsliding steps along the grain boundaries as well as large amountof dimples and voids. The presence of sliding steps along thegrain boundaries indicates that small amount of deformationhappened before tearing of deformed grains. Dimples on grainboundary surfaces suggest occurrence of ferrite nucleationalong the austenite grain boundary and deformation concen-trated in these ferrite bands leading to decohesion with thematrix and subsequent failure. Intergranular failure is observedat 800 �C also, but surface is distinct from that observed at700 �C. Fractured surface shows small voids similar to thoseobserved at 700 �C along with extremely large voids of theorder of 100 lm or more. Smaller voids and craters appeartogether with sliding steps. Fractured surface at 800 �C isdevoid of flat facets and dimples, indicating growth dominantfracture at 800 �C in contrast to nucleation dominant fracture at700 �C.
Samples fractured at 850 �C shows intergranular failure,with the presence of large voids having very thin edges inaddition to considerable proportion of microvoids in the sizerange of 5-10 lm. The absence of sliding steps near void edgesindicates continuous material flow and eventual ductile neck-
ing. Mn and Al containing spherical inclusion particles are alsofound at grain boundary triple junctions. SEM image ofsamples fractured at both 1050 and 1200 �C indicates trans-granular nature of failure, with the presence of completelydeformed grain structure.
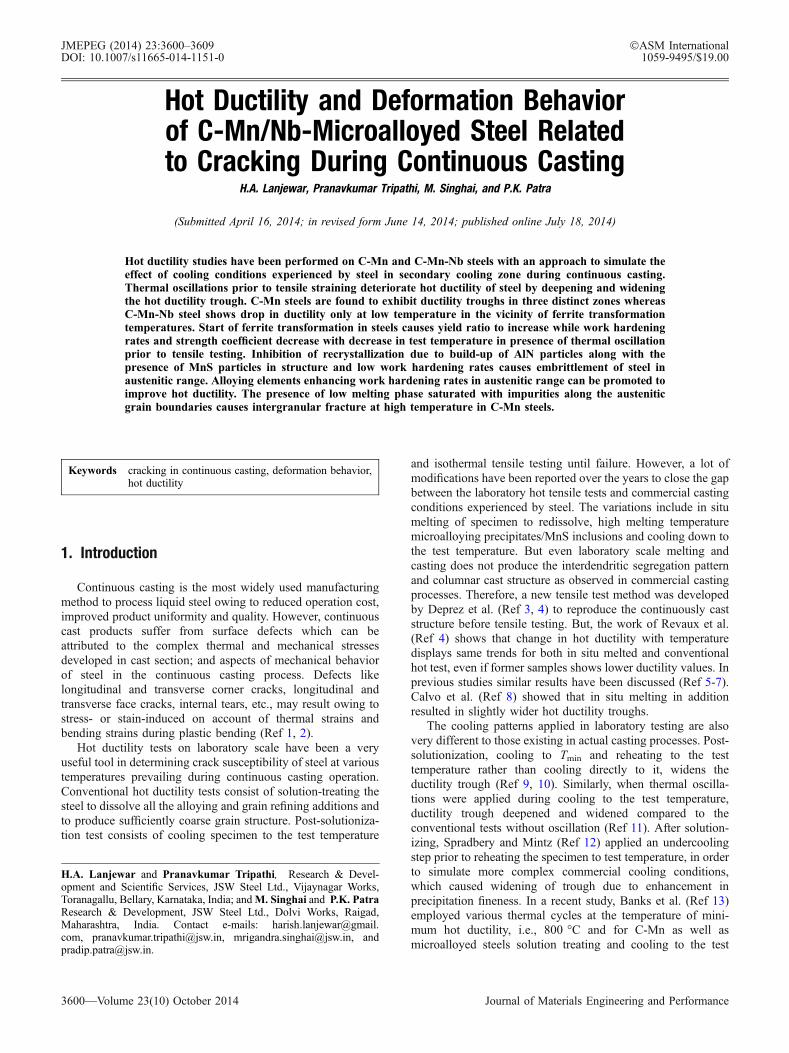
3.2.2 Steel 2. Figure 4 shows fractured surfaces of Steel2. Fractured surface at 800 �C shows sufficiently large areahaving flat facets of the order of millimeter size, considered tobe the cause of worst ductility. Similar flat facets are exhibitedby smaller grains in the range of 100-300 lm indicatingintergranular failure devoid of any deformation. At 850 �C,fracture is intergranular in nature with grains in the range of100-200 lm, showing flat facets as well as large amount ofsliding marks indicating grain boundary sliding. Grain bound-aries display the presence of small amount of shallow craterswith inclusion particles embedded at few locations. Fracture at900 �C exhibit mixed nature of failure surfaces. Failed surfaceconsists of smooth facets, microvoids, localized necking at
Fig. 2 Reduction of area as a function of temperature for; (a) Steel1 and 2, (b) Steel 3, and (c) schematic showing different zones ofhot ductility drops
3602—Volume 23(10) October 2014 Journal of Materials Engineering and Performance

grain boundaries indicating substantial deformation beforefailure. Intergranular fracture at 950 �C is observed withsubstantial decrease in flat facets and considerable amount ofelongated grains owing to large necking before failure.Transgranular failure is observed at 1000 �C with grain sizesin the range of 50-150 lm and hence the high ductility. Similarfailure characteristics are observed at 1050 and 1200 �C, withhighly deformed grains.
At 1300 �C, fractured surfaces are smooth with slightsliding marks along with spherical-embedded inclusion parti-cles largely containing Mn, Si, and occasionally Al. The grainboundaries and fracture surfaces are smoother and devoid ofany deformation at 1400 �C with significant number ofinclusion particles present at the grain boundaries. Theinclusion particles or area adjacent to the grain boundarieswere found to be rich with oxides and/or sulfides, mainlycontaining Mn and Si. Wedge-shaped cracks were found attriple-point junctions. Fracture at high temperature indicatedfailure due to grain boundary sliding at c-c interface withoutany deformation. The presence of inclusion particles along thegrain boundary indicates particle-stimulated grain boundarysliding and hence lower ductility.
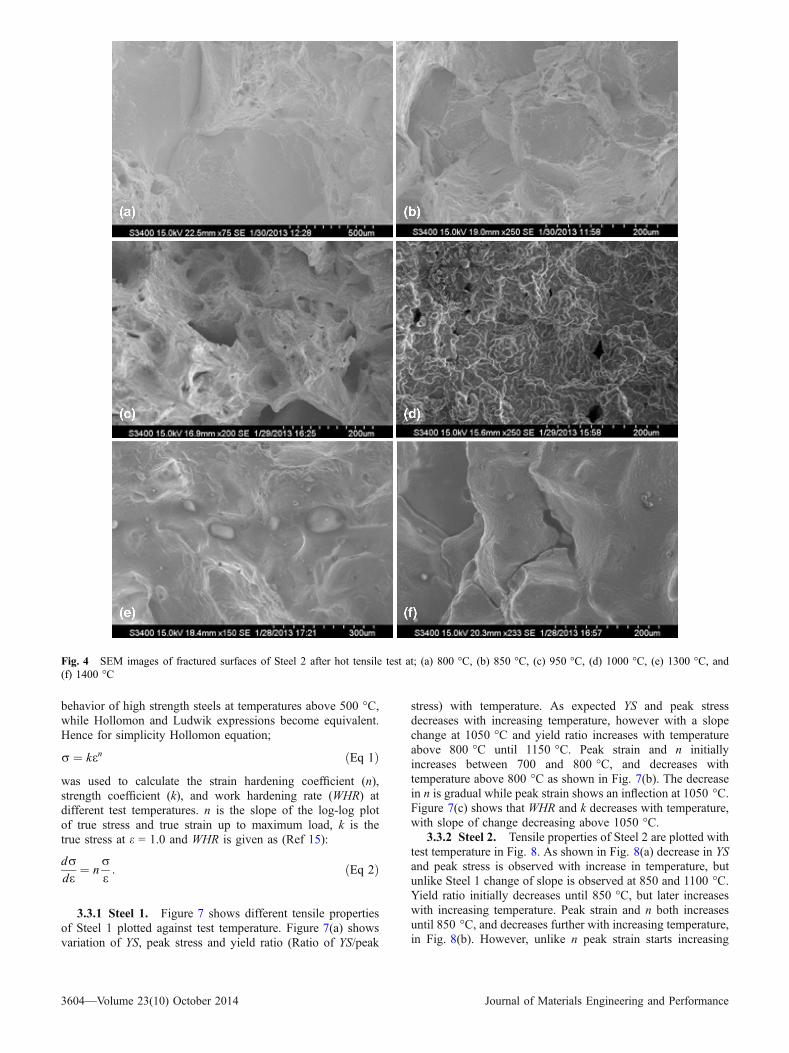
3.2.3 Steel 3. Tensile fracture surfaces of Steel 3 are shownin Fig. 5. Intergranular fracture characteristics are observed at800 �C, in addition to the significant amount of large cratersindicating formation of ferrite nuclei, void generation at a-cinterface and subsequent void coalescence leading to failure.Features observed at 850 �C are almost similar to those observedat 800 �C including the presence of sliding marks, except cratersare comparatively shallow at higher temperature. This indicateslesser amount of ferrite presence at 850 �C. At 900 �C, failurealong the grain boundary is devoid of any craters. The fracture
surface shows flat facets, grain sliding marks, and microvoidsformed due to dislodgement of embedded particles. Elongatedgrains and necking at grain boundaries indicate large amount ofdeformation at 950 �C before failure. Microvoids are alsoobserved in the size range of 5-20 lm indicative of priorpresence of inclusion particles dislodged during deformation.However, at 1150 �C even though sample showed very goodductility, fractured surface exhibited mixed mode of failure, i.e.,with intergranular/transgranular nature. Similarly, at 1300 �Cintergranular failure is observed with high ductility. Wedgecracks at triple junctions are present with sliding marks along thegrain boundaries indicating grain boundary sliding.
In all the steels, failure is intergranular in nature correspond-ing to inferior hot ductility at low temperatures in zone I. Withincrease in temperature, failuremode transforms to amixedmodemarked with elongated grains and finally to transgranular natureat intermediate temperatures in austenitic range. At hightemperatures, fractures are intergranular in nature, distinct fromthose observed at low temperature, owing to the presence ofsmooth surfaces and wedge-type cracks at triple junctions.
3.3 Mechanical Properties
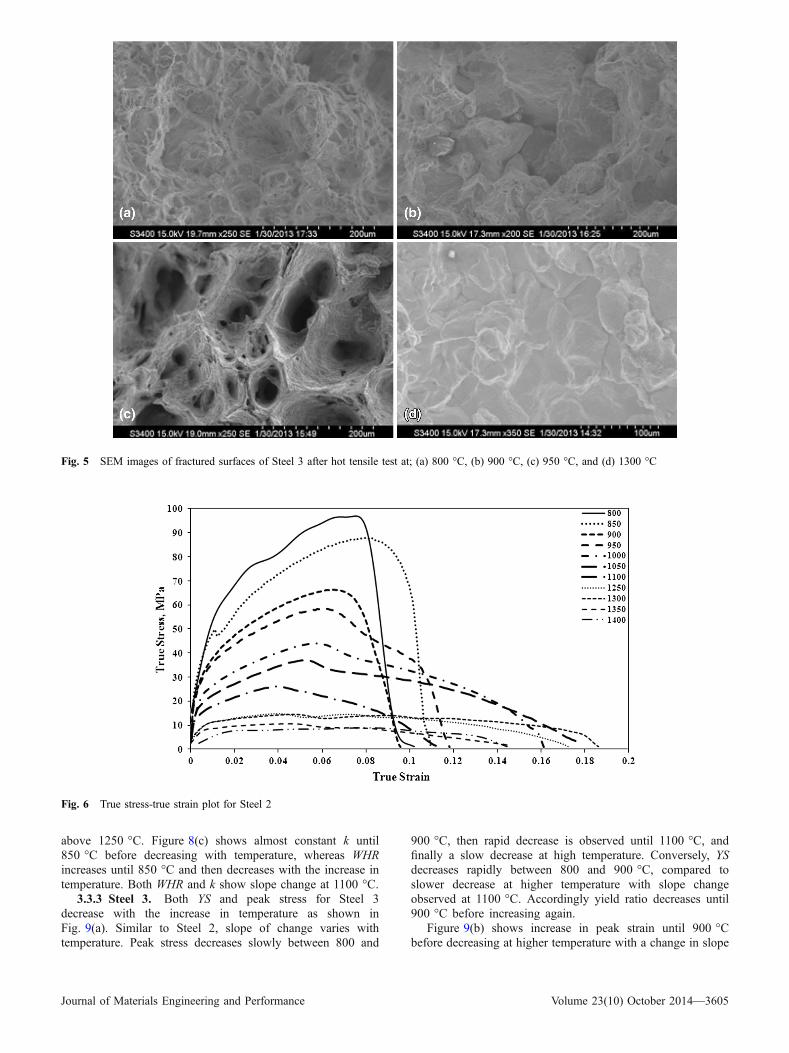
True stress-strain plot for Steel 2 is shown in Fig. 6. Truestress-true strain plots for investigated steels show character-istics hump and/or multiple peaks indicating start of recovery/recrystallization in steel at 850 �C for Steel 1, and 950 �C forSteel 2 and 3. Yield stress (YS) of steels is determined using0.2% offset method due to continuous yielding of steel at hightemperature whereas peak stress corresponds to the max. truestress. Mishra et al. (Ref 14) found that the Swift equationprovides better correlation coefficient for strain hardening
Fig. 3 SEM images of fractured surfaces of Steel 1 after hot tensile test at; (a) 700 �C, (b) 800 �C, (c) 850 �C, and (d) 1200 �C
Journal of Materials Engineering and Performance Volume 23(10) October 2014—3603
behavior of high strength steels at temperatures above 500 �C,while Hollomon and Ludwik expressions become equivalent.Hence for simplicity Hollomon equation;
r ¼ ken ðEq 1Þ
was used to calculate the strain hardening coefficient (n),strength coefficient (k), and work hardening rate (WHR) atdifferent test temperatures. n is the slope of the log-log plotof true stress and true strain up to maximum load, k is thetrue stress at e = 1.0 and WHR is given as (Ref 15):
drde¼ n
re: ðEq 2Þ
3.3.1 Steel 1. Figure 7 shows different tensile propertiesof Steel 1 plotted against test temperature. Figure 7(a) showsvariation of YS, peak stress and yield ratio (Ratio of YS/peak
stress) with temperature. As expected YS and peak stressdecreases with increasing temperature, however with a slopechange at 1050 �C and yield ratio increases with temperatureabove 800 �C until 1150 �C. Peak strain and n initiallyincreases between 700 and 800 �C, and decreases withtemperature above 800 �C as shown in Fig. 7(b). The decreasein n is gradual while peak strain shows an inflection at 1050 �C.Figure 7(c) shows that WHR and k decreases with temperature,with slope of change decreasing above 1050 �C.
3.3.2 Steel 2. Tensile properties of Steel 2 are plotted withtest temperature in Fig. 8. As shown in Fig. 8(a) decrease in YSand peak stress is observed with increase in temperature, butunlike Steel 1 change of slope is observed at 850 and 1100 �C.Yield ratio initially decreases until 850 �C, but later increaseswith increasing temperature. Peak strain and n both increasesuntil 850 �C, and decreases further with increasing temperature,in Fig. 8(b). However, unlike n peak strain starts increasing
Fig. 4 SEM images of fractured surfaces of Steel 2 after hot tensile test at; (a) 800 �C, (b) 850 �C, (c) 950 �C, (d) 1000 �C, (e) 1300 �C, and(f) 1400 �C
3604—Volume 23(10) October 2014 Journal of Materials Engineering and Performance
above 1250 �C. Figure 8(c) shows almost constant k until850 �C before decreasing with temperature, whereas WHRincreases until 850 �C and then decreases with the increase intemperature. Both WHR and k show slope change at 1100 �C.
3.3.3 Steel 3. Both YS and peak stress for Steel 3decrease with the increase in temperature as shown inFig. 9(a). Similar to Steel 2, slope of change varies withtemperature. Peak stress decreases slowly between 800 and
900 �C, then rapid decrease is observed until 1100 �C, andfinally a slow decrease at high temperature. Conversely, YSdecreases rapidly between 800 and 900 �C, compared toslower decrease at higher temperature with slope changeobserved at 1100 �C. Accordingly yield ratio decreases until900 �C before increasing again.
Figure 9(b) shows increase in peak strain until 900 �Cbefore decreasing at higher temperature with a change in slope
Fig. 5 SEM images of fractured surfaces of Steel 3 after hot tensile test at; (a) 800 �C, (b) 900 �C, (c) 950 �C, and (d) 1300 �C
Fig. 6 True stress-true strain plot for Steel 2
Journal of Materials Engineering and Performance Volume 23(10) October 2014—3605
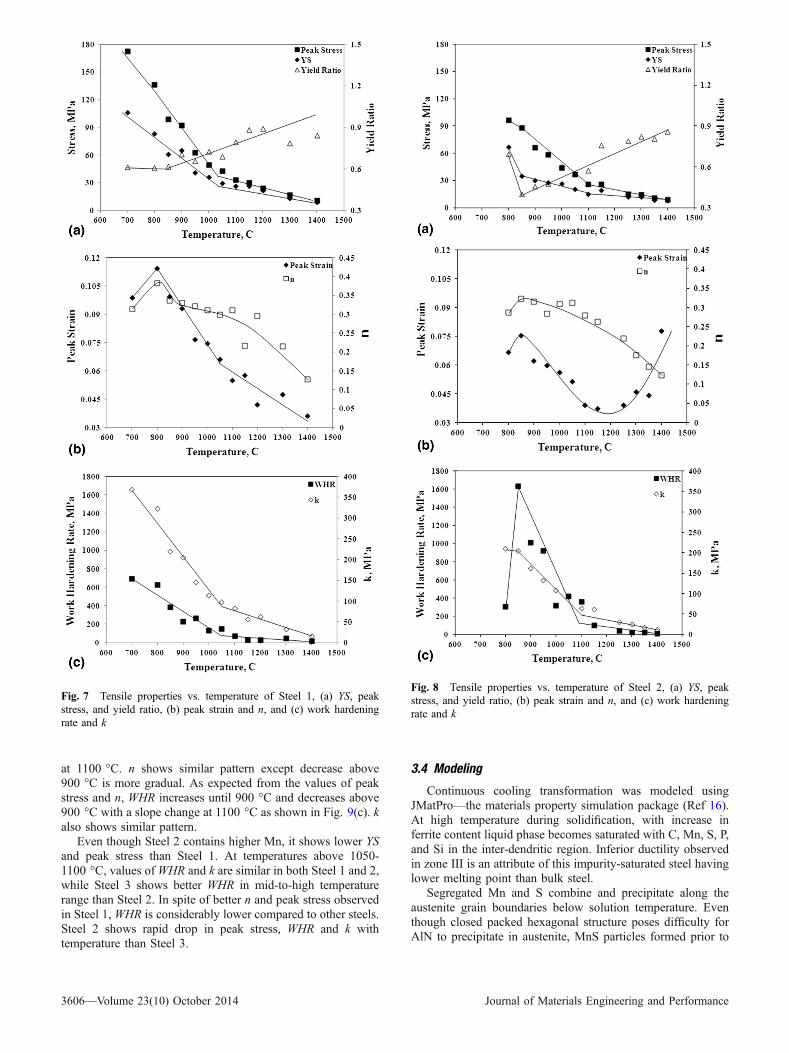
at 1100 �C. n shows similar pattern except decrease above900 �C is more gradual. As expected from the values of peakstress and n, WHR increases until 900 �C and decreases above900 �C with a slope change at 1100 �C as shown in Fig. 9(c). kalso shows similar pattern.
Even though Steel 2 contains higher Mn, it shows lower YSand peak stress than Steel 1. At temperatures above 1050-1100 �C, values ofWHR and k are similar in both Steel 1 and 2,while Steel 3 shows better WHR in mid-to-high temperaturerange than Steel 2. In spite of better n and peak stress observedin Steel 1, WHR is considerably lower compared to other steels.Steel 2 shows rapid drop in peak stress, WHR and k withtemperature than Steel 3.
3.4 Modeling
Continuous cooling transformation was modeled usingJMatPro—the materials property simulation package (Ref 16).At high temperature during solidification, with increase inferrite content liquid phase becomes saturated with C, Mn, S, P,and Si in the inter-dendritic region. Inferior ductility observedin zone III is an attribute of this impurity-saturated steel havinglower melting point than bulk steel.
Segregated Mn and S combine and precipitate along theaustenite grain boundaries below solution temperature. Eventhough closed packed hexagonal structure poses difficulty forAlN to precipitate in austenite, MnS particles formed prior to
Fig. 7 Tensile properties vs. temperature of Steel 1, (a) YS, peakstress, and yield ratio, (b) peak strain and n, and (c) work hardeningrate and k
Fig. 8 Tensile properties vs. temperature of Steel 2, (a) YS, peakstress, and yield ratio, (b) peak strain and n, and (c) work hardeningrate and k
3606—Volume 23(10) October 2014 Journal of Materials Engineering and Performance

AlN act as nucleation sites for AlN precipitation (Ref 17, 18).In the present investigation also Al was found associated withMn and Si containing particles along the grain boundary asshown in Fig. 10. Figure 11 shows on-cooling phase transfor-mation modeling results for Steel 1. On-cooling phase trans-formation simulation predicts almost complete MnSprecipitation for all the three steels by the time temperaturereaches 1150 �C, whereas AlN precipitation shows nearcompletion at about 900 �C for Steel 3 and 950 �C for Steel1 and 2. Nb(C,N) precipitation for Steel 3 is predicted below1080 �C.
4. Discussion
Hot ductility results indicate deterioration of ductility insteel when given undercooling and reheating treatment, thecondition to which continuously cast steel products are exposedin the secondary cooling zone. Even with high Mn/S ratio inSteel 2, ductility recovery is delayed at high temperature end oftrough. Both Steel 1 and 2 exhibit drop in ductility at mid-temperature range of 900-1100 and 1050-1150 �C, respectively,and finally at high temperature. However, Nb-microalloyedsteel shows ductility drop only at lower temperature in thevicinity of ferrite transformation range. Suzuki et al. (Ref 6)found that zone I embrittlement is caused by intergranularprecipitation, pro-eutectoid film formation along the austenitegrain boundaries, and grain boundary sliding. Intergranularprecipitation of sulfides and oxides along the grain boundariesis thought to cause zone II embrittlement, while liquid phaseembrittlement is the reason for cracking in zone III.
In the present case, steel with zone I embrittlement showsthe presence of flat facets, dimples, and shallow cratersindicating ferrite nucleation, which leads to intergranularfailure due to void formation at ferrite followed by voidcoalescence and failure. The presence of sliding steps indicatesgrain boundary sliding before tearing of deformed grains occur.The start of ferrite nucleation is indicated by change inmechanical behavior of steel. Yield ratio decreases withdecreasing temperature, accommodating more deformationbefore fracture, but starts increasing again due to nucleationof ferrite in the structure. This effect is more prominent in Steel2 and 3 which can be ascribed to the undercooling andreheating thermal treatment. As expected peak strain and n, onthe other hand, increases with decreasing temperature but startsdropping owing to ferrite transformation. YS, peak stress, WHR
Fig. 9 Tensile properties vs. temperature of Steel 3, (a) YS, peakstress, and yield ratio, (b) peak strain and n, and (c) work hardeningrate and k
Fig. 10 EDX analysis of particle at grain boundary indicating the presence of majorly Mn, Si, Fe, and Al
Journal of Materials Engineering and Performance Volume 23(10) October 2014—3607

and k suggests start of ferrite transformation in Steel 2 and 3,but not in Steel 1, an attribute of different thermal historiesemployed. Thus, ferrite transformation is observed at andbelow 800, 850, and 900 �C for Steel 1, Steel 2, and Steel 3,respectively.
Using relations from literature, Ar3 for Steel 1 and Ac3temperatures for Steel 2 and 3, are calculated as shown inTable 2 (Ref 19-26). For Steel 1, relation from Shiga et al. andKariya et al. gives nearest results while Kasatkin�s relationgives consistent results to those observed in present study forboth Steel 2 and 3. Mintz et al. recently published a relation topredict un-deformed Ar3 (Ar3U), which includes cooling rate incorrelation (Ref 27). However, cooling rates used in the presentstudy for Steel 1 are much higher than those applicable inabove relation. Though Ac3 temperatures lie slightly above Ar3temperatures, Steel 2 contains higher Mn than Steel 1 whichhas a decreasing effect on transformation temperature. Consid-ering that, appreciable differences between ferrite transforma-tion temperatures of Steel 1 and 2 can be justified on account ofenhancement of ferrite transformation in Steel 2 owing toundercooling and reheating cycle.
Appearance of zone II in Steel 1 and 2 is due to twoparameters; namely inferior work hardening capacity ofaustenite and absence of recrystallization. WHRs of Steel 1and 2 in zone II are inferior to Steel 3 which shows the absenceof zone II embrittlement. Decrease in slope of change observedin YS, peak stress, peak strain, WHR, and k plots, above1050 �C in Steel 1 and 1100 �C in Steel 2 and 3, is due to theonset of recrystallization as witnessed by multiple peaks in truestress-true strain curve. Hence, above 1050 �C in Steel 1 and1100 �C in Steel 2, ductility recovers on account of recrystal-lization until finally dropping again in zone III. Alloyingelements enhancing work hardening rates in austenitic rangecan be promoted to discourage steel embrittlement in zone II.
Phase transformation modeling results show near comple-tion MnS precipitation at 1150 �C during cooling in all thethree steels, whereas disappearance of recrystallization isobserved at slightly lower temperatures. Hence, recrystalliza-tion is thought to be affected only after sufficient build-up ofAlN particles along with MnS particles in the structure. Suzukiet al. (Ref 7) have termed Al as a debatable element in terms ofits effect on hot ductility of steel. However, Al in its nitrideform seems to have a retarding effect on recrystallization andthus deleteriously affects the hot ductility of steel as observed inthe present study. Therefore, zone II embrittlement in Steel 1and 2 is caused by both inferior work hardening capacity ofaustenite as well as suppression of recrystallization due to thepresence of AlN and MnS particles along the austenite grainboundaries.
Zone III is a high temperature region nearing melting pointwhere the presence of low melting phase in interdendriticregion causes embrittlement along the grain boundary andhence lower strength and ductility is observed.
5. Conclusion
Hot ductility study of C-Mn and C-Mn-Nb steel has beenperformed with/without thermal oscillation and change inmechanical behavior with test temperature has been investi-gated. The conclusions drawn are as follows:
1. Ductility troughs are observed in three distinct zones inC-Mn steels, whereas C-Mn-Nb steel shows loss of duc-tility only at lower temperature.
2. In presence of undercooling and reheating cycle ana-logues to secondary cooling in continuous casting, hotductility of steel deteriorates as compared to when ther-mal oscillation is absent. Thermal oscillation is found toenhance the ferrite transformation in C-Mn and C-Mn-Nbsteels.
3. In presence of thermal oscillation, ferrite nucleationcauses increase in yield ratio and accordingly peak strainand n decreases, thus limiting the elongation before fail-ure initiation; whereas WHR and k demonstrate a declinewith the start of ferrite transformation.
4. Embrittlement in zone I is attributed to the start of ferritetransformation, with subsequent void nucleation at ferriteband and void coalescence leading to intergranular fail-ure. Ductility drop in zone II through austenitic range isdue to very low work hardening rates with the absenceof any ductility recovery by way of recrystallization. Hotductility of austenite recovers only after appearance ofrecrystallization. Zone III embrittlement is caused by theFig. 11 Phase fraction modeling for Steel 1
Table 2 Ar3 and Ac3 temperatures calculated using relations from literature (Ref 19-26)
References
Calculated Ar3temperature
References
Calculated Ac3temperature
Steel 1 Steel 2 Steel 3
Shiga et al. (Ref 19) 797 Hougardy (Ref 23) 845 880Choquet et al. (Ref 20) 759 Kasatkin et al. (Ref 24) 838 887Pickering (Ref 21) 855 Park et al. (Ref 25) 870 924Kariya et al. (Ref 22) 802 Trzaska et al. (Ref 26) 826 873
3608—Volume 23(10) October 2014 Journal of Materials Engineering and Performance

presence of impurity enriched low melting phase alongthe austenite grain boundary resulting in intergranularfracture.
5. In spite of recovery, recrystallization is inhibited in au-stenitic range after sufficient build-up of AlN particlesalong with MnS precipitates next to the austenitic grainboundary.
6. Alloying elements enhancing work hardening rates in au-stenitic range can be promoted to discourage steel embrit-tlement in zone II.
References
1. W.T. Lankford, Jr., Some Considerations of Strength and Ductility inthe Continuous-Casting Process, Metall. Trans., 1972, 3, p 1331–1357
2. B. Mintz, The Influence of Composition on the Hot Ductility of Steelsand to the Problem of Transverse Cracking, ISIJ Int., 1999, 39(9),p 833–855
3. P. Deprez, J.P. Bricout, and J. Oudin, A New Tensile Test on In SituSolidified Notched Specimens: Hot Ductility Analysis of ContinuousCasting Steels, J. Mater. Process. Technol., 1992, 32(1–2), p 325–334
4. T. Revaux, P. Deprez, J.P. Bricout, and J. Oudin, In Situ Solidified HotTensile Test and Hot Ductility of Some Plain Carbon Steels andMicroalloyed Steels, ISIJ Int., 1994, 34(6), p 528–535
5. G.A. Wilber, R. Batra, W.F. Savage, and W.J. Childs, The Effects ofThermal History and Composition on the Hot Ductility of Low CarbonSteels, Metall. Trans. A, 1975, 6A, p 1727–1735
6. H.G. Suzuki, S. Nishimura, and S. Yamaguchi, Characteristics of HotDuctility in Steels Subjected to the Melting and Solidification, Trans.ISIJ, 1982, 22, p 48–56
7. H.G. Suzuki, S. Nishimura, J. Imamura, and Y. Nakamura, Embrittle-ment of Steels Occurring in the Temperature Range from 1000 to600 �C, Trans. ISIJ, 1984, 24, p 169–177
8. J. Calvo, A. Rezaeian, J.M. Cabrera, and S. Yue, Effect of the ThermalCycle on the Hot Ductility and Fracture Mechanisms of a C-Mn Steel,Anales de Mecanica De La Fractura, 2005, 22, p 184–189
9. C. Ouchi and K. Matsumoto, Hot Ductility in Nb-Bearing High-Strength Low-Alloy Steels, Transactions ISIJ, 1982, 22, p 181–189
10. K. Cho, D. Mun, M. Kang, J. Lee, J. Park, and Y. Koo, Effect ofThermal Cycle and Nitrogen Content on the Hot Ductility of Boron-Containing Steel, ISIJ Int., 2010, 50(6), p 839–846
11. B. Mintz, J.M. Stewart, and D.N. Crowther, The Influence of CyclicTemperature Oscillations on Precipitation and Hot Ductility of a C-Mn-Nb-Al Steel, Trans. ISIJ, 1987, 27, p 959–964
12. C. Spradbery and B. Mintz, Influence of Undercooling Thermal Cycleon Hot Ductility of C-Mn-Al-Ti and C-Mn-Al-Nb-Ti Steels, Ironmak.Steelmak., 2005, 32(4), p 319–324
13. K.M. Banks, A. Tuling, and B. Mintz, Influence of Thermal History onHot Ductility of Steel and Its Relationship to the Problem of Crackingin Continuous Casting, Mat. Sci. Technol., 2012, 28(5), p 536–542
14. N.S. Mishra, S. Mishra, and V. Ramaswamy, Analysis of theTemperature Dependence of Strain-Hardening Behavior in High-Strength Steel, Metall. Trans., 1989, 20A, p 2819–2829
15. G.E. Dieter, Mechanical Metallurgy, 3rd ed., McGraw-Hill Book Co.,New York, 1988, p 287
16. JMatPro V.6.2. User�s Manual17. Y. Li, D.N. Crowther, P.S. Mitchell, and T.N. Baker, The Evolution of
Microstructure During Thin Slab Direct Rolling Processing in Vana-dium Microalloyed Steels, ISIJ Int., 2002, 42(6), p 636–644
18. J.S. Park, M. Ajmal, and R. Priestner, Tensile Properties of SimulatedThin Slab Cast and Direct Rolled Low Carbon Steel Microalloyed withNb, V and Ti, ISIJ Int., 2000, 40(4), p 380–385
19. C. Shiga, T. Hatomura, J. Kudoh, A. Kamada, K. Hirose, and T.Sekine, Development of Large Diameter High Strength Line Pipes forLow Temperature Services, Kawasaki Steel Technical Report No. 4,1981, p 97–109
20. P. Choquet, A. LeBon, and C. Perdix, Mathematical Model forPredictions of Austenite and Ferrite Microstructures in Hot RollingProcesses, IRSID Report, St. Germain-en-Laye, France, 1985, p 7
21. F.B. Pickering, Steel Metallurgical Principles: Encyclopedia of Mate-rials Science and Engineering, Vol 6, The MIT Press, Cambridge, 1986
22. N. Kariya et al., High Carbon Hot-Rolled Steel Sheet and Method forProduction Thereof. European Patent Application EP 2.103.697 A1, 23Sept 2009, p 15
23. H.P. Hougardy, Werkstoffkunde Stahl Band 1 - Grundlagen, VerlagStahleisen GmbH, Dusseldorf, 1984, p 229 [in German]
24. O.G. Kasatkin, B.B. Vinokur, and V.L. Pilyushenko, CalculationModels for Determining the Critical Points of Steel, Met. Sci. HeatTreat., 1984, 26(1–2), p 27–31
25. S.H. Park et al., Development of Ductile Ultra-High Strength HotRolled Steels, POSCO Technical Report, 1996, p 50–128
26. J. Trzaska et al., Modelling of CCT Diagrams for Engineering andConstructional Steels, J. Mater. Process. Technol., 2007, 192–193, p504–510
27. B. Mintz, J.R. Banerjee, and K.M. Banks, Regression Equation for Ar3Temperature for Coarse Grained as Cast Steels, Ironmak. Steelmak.,2011, 38(3), p 197–203
Journal of Materials Engineering and Performance Volume 23(10) October 2014—3609