Hosted by: Colorado Department of Education
111
Unified Improvement Planning: Diving into New Data Hosted by: Colorado Department of Education Provided by : Center for Transforming Learning and Teaching
-
Upload
judith-england -
Category
Documents
-
view
25 -
download
1
description
Unified Improvement Planning: Diving into New Data. Hosted by: Colorado Department of Education Provided by : Center for Transforming Learning and Teaching. Introductions. Session Purpose. - PowerPoint PPT Presentation
Transcript of Hosted by: Colorado Department of Education

Unified Improvement Planning:
Diving into New Data
Hosted by: Colorado Department of Education
Provided by : Center for Transforming Learning and Teaching

Introductions
Center for Transforming Learning and Teaching
Julie Oxenford-O’BrianMary Beth Romke
Colorado Department of Education
Bill BonkJudy HuddlestonErin LoftenLisa MedlerSomoh Supharukchinda

Session Purpose
Ensure participants are prepared to
update local capacity building related to data analysis for
unified improvement planning.

Making the most of the day. . .• Assumptions
– Participants are familiar with data analysis for UIP.
– Participants need information about updates and revisions.
– Materials should be immediately usable with local audiences.
• What does participation look like?– Learning about what has been revised.
– Planning for bringing this content back to your district (Planning to Build Data Analysis Capacity).

Introductions
Share:
– Name, Job Title, School/District
– Your role in facilitating unified improvement planning
– Your most important outcome for this session

Materials

The materials used during this session were developed in partnership with the Center for Transforming Learning and Teaching in the School of Education and Human Development at the University of Colorado Denver.

Norms
The standards of behavior by which we
agree to operate while we are
engaged in learning together.

Session Outcomes• Explain how and why data analysis, as part of Unified
Improvement Planning, has changed.
• Explain the role and identify critical components of the data narrative .
• Appropriately identify school accountability status and where performance did not meet expectations.
• Describe the magnitude of the school performance challenge.
• Analyze state performance measures and metrics, including: frequently misinterpreted metrics, new metrics, and new required reports.
• Describe how to identify “notable” performance trends.
• Identify priority performance challenges consistent with the magnitude of the school’s overall performance challenge.
• Learn from other districts’ experiences in building local data analysis capacity.
• Plan local data analysis capacity building.
Engage in hands-on learning activities and dialogue with colleagues.
Access additional resources.
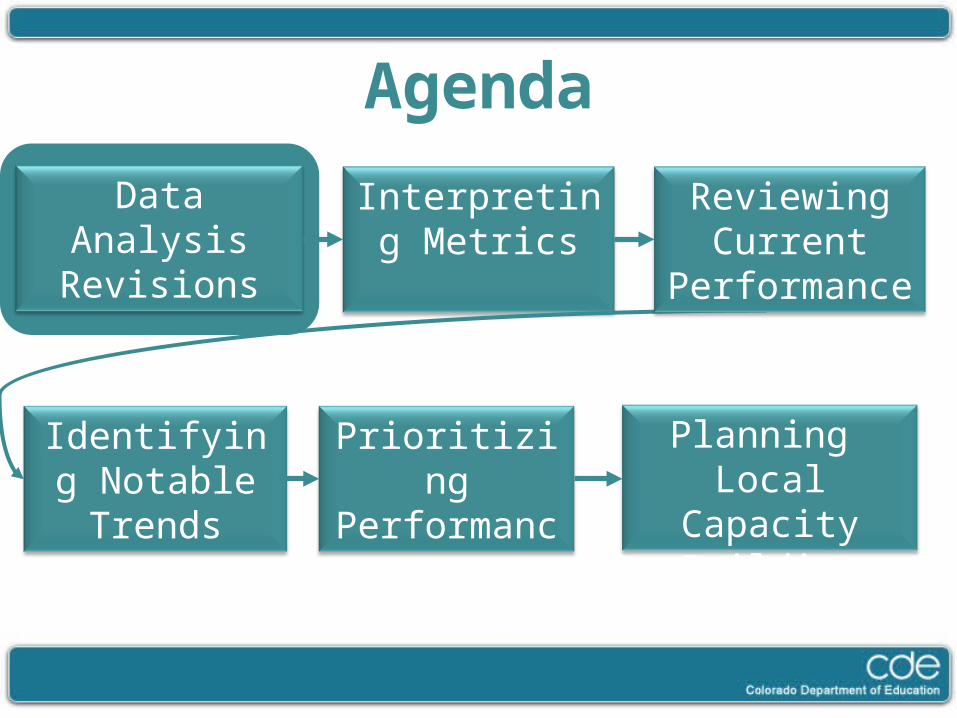
Agenda
Data Analysis Revisions
Interpreting Metrics
Identifying Notable Trends
Prioritizing Performanc
e Challenges
Planning Local Capacity
Building
Reviewing Current
Performance

In general, revisions to UIP data analysis include. . .
• Clarification regarding the role of the Data Narrative
• Two additional metrics on the SPF/DPF and UIP Template
• Removal of AYP and Educator Qualification from UIP Template
• Additional required reports in the UIP

Sources of changes. . .
• Colorado’s successful waiver from certain ESEA provisions
• Lessons learned through 2012 CDE staff review of Turnaround/Priority Improvement UIPs
• District UIP Needs Assessment Survey

Consider the revisions. . .
• Turn to: Sources of Revision to Data Analysis (p. 3)
• Work with a partner to:
– Identify the most important revisions related to data analysis.
– Identify questions/concerns you have about the revisions.

Data Narrative Components1. Description of the school/district
2. UIP process and who participated
3. The school/district accountability status (where expectations were NOT at least met) and the magnitude of school/district performance challenges over-all
4. How current performance compares to targets
5. Notable performance trends
6. Priority performance challenges
7. Root cause(s)

Data Narrative Components, Part 1
• Consider the UIP Handbook, Data Narrative (p. 10), and Quality Criteria (p. 38)and Data Narrative Outline (Toolkit, p. 7)
• Work with a partner to clarify what should be included in each component of the data narrative (Capture notes on the Data Narrative Notecatcher.)

Data Narrative Components, Part 2
• Working with a partner, use your notes in the Data Narrative Outline (Toolkit, p. 7)
• Take out the data narrative from a school plan from your district to use as an example (or use the narrative from Example Middle School)
• In the example data narrative:• Underline/highlight each component of the data
narrative that is included.• Note any missing components.
• With your table, identify themes in missing components

Moving up the Data Continuum
Brieter & Light, Light, Wexlar, Heinze, 2004

Planning to Build Local Capacity
• Turn to Planning to Build Local Data Analysis Capacity (Toolkit, p. 35)
• Make notes about how you will help local stakeholders understand the role and key components of the data narrative:– What will you do?– With whom? When?– What tools will you use?

Agenda
Data Analysis Revisions
Interpreting Metrics
Identifying Notable Trends
Prioritizing Performanc
e Challenges
Planning Local Capacity
Building
Reviewing Current
Performance

Updating Interpretation of Student Performance Metrics
1. Correcting Misconceptions
2. Analyzing and interpreting new metrics
3. Analyzing and interpreting data presented in required reports

Interpreting Metrics

Reviewing Academic Growth Metrics

Percentage vs. Percentile

Percentiles
Percentiles• Range from 1 - 99• Indicate the relative
standing of a student’s score to the norm group (i.e. how a particular compares with all others).
Growth Percentiles• Indicate a student’s
standing relative to their academic peers, or students with a similar score history (how his/her recent change in scores compares to others’ change in scores).

Explain Student Growth Percentiles
• Capture your “elevator speech” about what a student growth percentile is on an index card.
– Define academic peers.
– Explain how this is different from achievement.
• Find someone you haven’t talked with today.
– Share elevator speeches.
– Capture new ideas you heard from your partner.

Comparing SGP & CUKUMU
• Student Growth Percentiles– Normative– Compare student progress to that of their
academic peers• Adequate growth/Catch-up, Keep-up, Move-
up– Growth to standard– Compare student growth to how much growth
they need to reach or stay proficient

Adequate Growth Review (CSAP/TCAP)
• What is adequate growth?
• Based on catch-up and keep-up growth
• Set targets on catch-up and keep-up growth
• So. . . a quick refresher on catch-up and keep-up growth

Catch Up GrowthTo be eligible to make catch-up growth:
• The student scores below proficient (unsatisfactory or partially proficient) in the previous year.
To make catch-up growth:
• The student demonstrates growth adequate to reach proficient performance within the next three years or by tenth grade, whichever comes first.

Calculating Catch-Up Growth
2011 2012 2013 2014 2015
95
Proficient
Not Proficient
7th grade 8th grade 9th grade 10th grade6th grade
55

2011 2012 2013 2014 2015
Not Proficient
7th grade 8th grade 9th grade 10th grade6th grade
85
85
Proficient
Calculating Catch-Up Growth

Calculating Catch-Up Growth
2011 2012 2012 2014 2015
Not Proficient
7th grade 8th grade 9th grade 10th grade6th grade
8080
80
Proficient

Calculating Catch-Up Growth
2011 2012 2013 2014 2015
Not Proficient
7th grade 8th grade 9th grade 10th grade6th grade
7676
7676
Proficient

Calculating Catch-Up Growth
2011 2012 2013 2014 2015
95
Not Proficient
7th grade 8th grade 9th grade 10th grade6th grade
85
8580
80
80
7676
7676
76 is the minimum-this student’s adequate growth percentile.
Proficient

Adequate Growth Percentile for Catch Up
• For students eligible to make catch-up growth (those who scored unsatisfactory or partially proficient in the previous year).
• Adequate Growth Percentile = the minimum growth percentile he/she would have needed to make catch-up growth.

Calculating Catch-Up Growth
2011 2012 2013 2014 2015
Not Proficient
7th grade 8th grade 9th grade 10th grade6th grade
7676
7676
Proficient

Calculating Catch-Up Growth
2011 2012 2013 2014 2015
Not Proficient
7th grade 8th grade 9th grade 10th grade6th grade
7676
7676
5555
55
55
55th percentile growth will not be enough for this student to catch up – she did not make catch-up growth.
Proficient

Keep Up GrowthTo be eligible to make Keep-Up growth:
• The student scores at the proficient or advanced level in the previous year.
To make keep-up growth:
• The student demonstrates growth adequate to maintain proficiency for the next three years or until tenth grade, whichever comes first.

Calculating Keep Up Growth
2011 2012 2013 2014 2015
12
Not Proficient
7th grade 8th grade 9th grade 10th grade6th grade
79 Proficient

Calculating Keep Up Growth
2011 2012 2013 2014 2015
Not Proficient
7th grade 8th grade 9th grade 10th grade6th grade
25
25
Proficient

Calculating Keep Up Growth
2011 2012 2013 2014 2015
Not Proficient
7th grade 8th grade 9th grade 10th grade6th grade
3838
38Proficient

Calculating Keep Up Growth
2011 2012 2013 2014 2015
Not Proficient
7th grade 8th grade 9th grade 10th grade6th grade
50
5050
50Proficient

Calculating Keep Up Growth
2011 2012 2013 2014 2015
12
Not Proficient
7th grade 8th grade 9th grade 10th grade6th grade
25
25 3838
38
50
5050
50
50 is the maximum -this student’s adequate growth percentile
Proficient

Adequate Growth for Keep-Up
• For students eligible to make keep-up growth (those who scored proficient or advanced in the previous year).
• Adequate Growth Percentile = the maximum of the growth percentiles needed for each of the next three years (or until 10th grade) he/she needed to score at least proficient for the next three years.

Calculating Keep Up Growth
2011 2012 2013 2014 2015
Not Proficient
7th grade 8th grade 9th grade 10th grade6th grade
50
5050
50Proficient

Calculating Keep Up Growth
2011 2012 2013 2014 2015
Not Proficient
7th grade 8th grade 9th grade 10th grade6th grade
50
5050
50
79 7979
79
Proficient79th percentile growth will be enough for this student to keep up – he made keep-up growth.

Calculating Median Adequate Growth Percentiles for CSAP/TCAP
AGP Sorted AGPs Median AGP4578993211915567431077
Median Adequate Growth for this school is 55
Search for the middle value…
Adequate growth percentiles for all catch-up and keep-up students
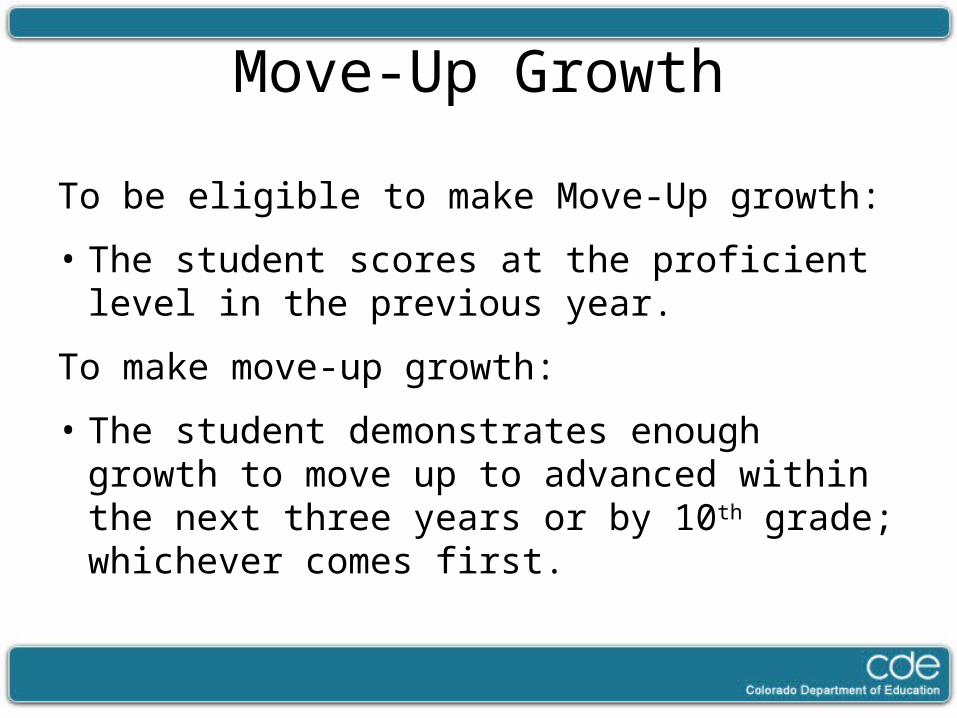
Move-Up Growth
To be eligible to make Move-Up growth:
• The student scores at the proficient level in the previous year.
To make move-up growth:
• The student demonstrates enough growth to move up to advanced within the next three years or by 10th grade; whichever comes first.

Catch-up ● Keep-up ● Move-Up
• Check your understanding. . .– Which students could make catch-up growth?
– Which students could make keep-up growth?
– Which students could make move-up growth?
• Draw a Venn diagram to show if/how these groups overlap.

Catch-up ● Keep-up ● Move-Up
Eligible to make Keep-Up GrowthEligible to make
Catch-Up Growth
Eligible to make Move-Up Growth

Percent Making Catch-Up Growth• Denominator: The number of students who scored below
proficient (unsatisfactory or partially proficient) in the previous year (i.e. students eligible for catch-up growth).
• Numerator: The number of students who made catch-up growth (i.e. demonstrated enough growth to reach proficient performance within the next three years or by tenth grade, whichever comes first).
• Performance is improving if:– The denominator is getting smaller (approaching zero)– The numerator is increasing – The percent is increasing(approaching 100)

Percent Making Keep-Up Growth• Denominator: The number of students who scored proficient
or advanced in the previous year (i.e. students eligible to make keep-up growth).
• Numerator: The number of students who made keep-up growth (i.e. demonstrated enough growth to maintain proficiency for the next three years or until tenth grade, whichever comes first).
• Performance is improving if:– The numerator is increasing– The percent is increasing (approaching 100)

Percent Making Move-Up Growth• Denominator: The number of students who scored proficient
in the previous year (i.e. students eligible to make move-up growth).
• Numerator: The number of students who made move-up growth (i.e. demonstrated enough growth to move up to advanced within the next three years or by tenth grade, whichever comes first).
• Performance is improving if:– The numerator is increasing (approaching 100)

Catch-up ● Keep-up ● Move-Up
Does the sum of these percentages add up to 100?
•The percent of students making catch-up growth
•The percent of students making keep-up growth
•The percent of students making move-up growth

Catch-Up in Different Contexts• School or District Growth Summary Reports:
– The percent of students in the school/district making catch-up growth
– Number of students making catch-up growth/the number of students eligible to make catch-up growth
• SPF or DPF– For students eligible to make catch-up growth– Median Growth Percentile– Median Adequate Growth Percentile

Interpreting Academic Growth Metrics
• Take out: Interpreting the School Growth Summary Report, the School Growth Summary Report for Example Middle School, and the SPF for Example Middle School
• Work in a triad to answer the questions on the Interpreting School Growth Summary Reports chart.
• Consider: How could you use this activity to clarify common misconceptions about Academic Growth Metrics?
• Make notes in Planning to Build Data Analysis Capacity

Academic Growth Gaps
• Consider the definition of “Academic Growth Gaps” in the UIP Handbook Glossary (p. 27)
• Talk with a partner:– Is this definition consistent with the interpretation
of “growth gaps” used in your district?– If not, how is it different?– How could trends in growth gaps be described
using this defintion? What data is needed?

Adequate Growth Percentiles Over Time
• Used in conjunction with median growth percentiles over time for disaggregated groups (School Growth Summary Report) to describe growth gap trends.
• Accessed through: – www.schoolview.org, data lab (see job aide)
– SPF reports over time.

Practice Identifying Growth Gaps
• Take out: Example Middle School Reports (School Growth Summary, Adequate Growth Percentiles Over Time)
• Work in triads:– Identify at least 3 trends in Academic Growth Gaps
for this school.

Planning to Build Local Capacity
• Turn to Planning to Build Local Data Analysis Capacity (Toolkit, p. 35)
• Make notes about how you will help local stakeholders correct misconceptions about adequate growth, catch-up/keep-up/move-up growth and growth gaps:– What will you do?– With whom? When?– What tools will you use?

Interpreting Metrics

New Metrics included on SPF/DPF and UIP
• English Language Proficiency– Academic Growth (English Language)– The Colorado Growth Model applied to CELApro – Median Growth Percentile (CELApro)– Median Adequate Growth Percentile
• Disaggregated Graduation Rates– Postsecondary and Workforce Readiness– 4,5,6,7 year Graduation Rates – Disaggregated groups: Minority, FRL, ELL, IEP

CELApro Proficiency Levels• There are 5 proficiency levels identified for CELApro
– Level 1- lowest level
– Level 5- considered proficient in English
• CELApro proficiency levels do not measure– how much growth each student has made – how much growth is necessary to get to level 5 in a
reasonable amount of time

Measuring Growth of English Language Development
• Using CELApro as the measure (instead of TCAP/CSAP)
• Applies the Colorado Growth Model methodology to CELApro results
• Reported only for schools/districts with 20 or more ELLs
• Measure of how much normative growth a student has made towards attaining English proficiency, over time
• Indicates how much normative growth a student needs to attain English proficiency

Growth metric comparison: CELApro vs. CSAP/TCAP
• Take out the CELApro to CSAP/TCAP Growth Metric Comparison table (Toolkit, p. 21).
• Work with a partner to answer these questions:– How are these two applications of the Colorado
Growth Model similar?– How are they different?– How is adequate growth defined for CELApro?

CELApro Adequate Growth Percentile Targets
Current Proficiency Level
Desired Proficiency Level
Time Line
1 2 1 year
2 3 1 year
3 4 2 years
4 5 2 years

Interpreting CELApro Growth Metrics
CELApro Growth Summary: Elementary School
N MGP AGP
Overall 376 47 37
CELA 1 23 12 34
CELA 2 66 23 34.5
CELA 3 128 46 33
CELA 4 138 60 45
CELA 5 21 84 53

Practice Interpreting CELApro Growth Metrics
• Take out Interpreting CELApro Growth Metrics Practice (Toolkit, p. 23)
• Work with a partner to answer the questions on the practice sheet.
• Which of these questions were difficult to answer?
• What additional questions do you now have about CELApro Growth?

Accessing CELApro Growth Data• Districts can download reports via CEDAR (by June).
– Student-level files: all students, enrolled in a school/district at time of testing, who had a score anywhere in Colorado the prior year
– School, district, state-level summary files: Title III Contacts, ELL Coordinators, District Assessment Coordinators, and District Accountability Contacts
• For last year’s, e-mail [email protected] or follow instructions at: http://www.cde.state.co.us/cdeassess/documents/cela/cela_growth.html
• Will include MGPs and AGPs• FAQs are available at:
http://www.cde.state.co.us/assessment/CELA-Growth_FAQ.asp

Disaggregated Graduation RatesConsider the definition of Graduation Rate in the UIP Handbook, Appendix A: Planning Terminology (p. 28) and the SPF Scoring Guides and Reference Data (Toolkit, p. 15)
•How are 4,5,6,7 year graduation rates calculated?
•Which disaggregated groups are included in the SPF/DPF disaggregated graduation rates?
•What disaggregated graduation rate meets expectations?

Disaggregated Graduation Rates
4-year 5- year 6- year 7-year
Number of students graduating in 4 years
+ number of students from the base year who graduated early
4-year rate + number of students graduating in 5 years
5-year rate + number of students graduating in 6 years
6-year rate + number of students graduating in 7 years
Number of students in 9th grade in the base year+ Transfers in
- Transfers out

Planning to Build Local Capacity• Turn to Planning to Build Local Data Analysis
Capacity• Make notes about how you will help local
stakeholders access, analyze and interpret CELApro Growth and Disaggregated Graduation Rates:– What will you do?– With whom? When?– What tools will you use?

Interpreting Metrics

CDE’s History on Equitable Distribution of Teachers Analysis
District State District State4 (High Poverty) 100.00% 96.98% Gap between 1 (low) and 4 (high) NA 1.05%3 81.40% 97.58% Gap between 1 (low) and 3 NA 0.44%2 NA 97.97% Gap between 2 and 4 (high) NA 0.99%1 (Low Poverty) NA 98.02%
District State District State4 (High Minority) 100.00% 97.11% Gap between 1 (low) and 4 (high) NA 0.56%3 100.00% 97.77% Gap between 1 (low) and 3 NA -0.10%2 81.40% 98.13% Gap between 2 and 4 (high) -18.60% 1.02%1 (Low Minority) NA 97.67%
Highlighted fields indicate a gap larger than the state averageHighlighted fields indicates a gap greater than 2%.
District State District State4 (High Poverty) 19.09% 29.30% Gap between 1 (low) and 4 (high) NA -9.33%3 0.00% 24.36% Gap between 1 (low) and 3 NA -4.39%2 NA 20.17% Gap between 2 and 4 (high) NA -9.13%1 (Low Poverty) NA 19.97%
District State District State4 (High Minority) 14.29% 30.15% Gap between 1 (low) and 4 (high) NA -9.11%3 19.79% 22.22% Gap between 1 (low) and 3 NA -1.19%2 0.00% 19.07% Gap between 2 and 4 (high) -14.29% -11.07%1 (Low Minority) NA 21.03%
Highlighted fields indicate a gap larger than the state average
NCLB Teacher Gap Analysis In ColoradoAccording to NCLB, the state is required to ensure that poor and minority children are not taught by inexperienced, unqualified, or out-of-field teachers at higher rates than their white or more affluent peers. This report is for informational purposes and indicates that your district has a teacher gap (as measured by the percent of classrooms taught by a highly qualified teacher or the average years of teaching experience) in relation to the state average, between low and high poverty schools and/or low and high minority schools.
District Name LAMAR RE-2
Highly Qualified Data GapAll schools in the state w ere divided into four quartiles- the 1st quartile being the schools w ith the low est percentage of students eligible for free or reduced lunch, and the 4th being the highest. Districts may not have schools in each of the quartiles depending on the district's size and demographics.
PovertyPercent of teachers HQ
PovertyHQ equity gap
Percent of teachers with less than 3 years of experience
All schools in the state w ere divided into four quartiles- the 1st quartile being the schools w ith the low est percentage of non-w hite students, and the 4th being the highest. Districts may not have schools in each of the quartiles depending on the district's size and demographics.
MinorityPercent of teachers HQ
MinorityHQ equity gap
MinorityPercent of teachers with less
than 3 years of experience MinorityPercent of teachers with less
than 3 years of experience
Teacher Experience Data GapTeacher experience data ref lects the percent of teachers w ho have been teaching for less than 3 years. This is the same data reported in the School Accountability Reports.
PovertyPercent of teachers with less
than 3 years of experience Poverty
• All districts expected to update Equitable Distribution of Teachers analysis through consolidated application.
Moving to UIP now
• CDE would prepare reports for districts with higher gaps.
All required data is now available on SchoolView.org.

ESEA Definition of Equitable Distribution of Teachers
ESEA requires that LEAs “ensure…that low-income students and minority students are not taught at higher rates than other students by unqualified, out-of-field, or inexperienced teachers.” (NCLB, Sec 1112(c)(1)(L))

Colorado’s Approach to EDT
Limitations Colorado’s EnhancementsRequired Metrics• Highly qualified requirements
largely attained (no real gaps)• Biased against novice teachers• Performance neutral
• Add SPF overall growth rating for performance measure
Ease of Analysis•Many variables to consider at once. It is confusing.•Isolated analysis leads to little action.
•Interactive quadrant display in SchoolView.•Inclusion in UIP to provide relevance with improvement planning.


SchoolView: Understanding the EDT Graph
1
2
3
4
5
6
The y-axis represents percentage of novice teachers, those less than three years of total teaching experience.
The horizontal blue line represents the state’s mean percentage of notice teachers.
The red line represents the average percentage of novice teachers within your district.
The x-axis represents percentage of free and reduced lunch students, a proxy for poverty.
The vertical red line represents the top quartile for poverty for secondary schools.
The dots represent schools. The colors represent the overall growth rating on SPF.
1
2
3
4
5
6

Understanding Each Quadrant
Schools within this quadrant have a high percentage of novice teachers and are serving a lower percentage of FRL students.
Schools within this quadrant have a low percentage of novice teachers and are serving a lower percentage of FRL students.
Schools within this quadrant have a low percentage of novice teachers and are serving a high percentage of FRL students.
1
23
4
Schools within this quadrant have a high percentage of novice teachers and are serving a high percentage of FRL students. The graph focuses attention on this quadrant.


Equitable Distribution of Teachers Practice
• Turn to: Interpreting Equitable Distribution of Teachers Data Practice (Toolkit, p. 25)
• The first two pages are a reminder about how to interpret this data.
• Work with a partner to complete the Practice questions.
• The graphic will be on the next slide (in color), so wait for it


What about small districts?

Recommendations for Small Districts
• The EDT analysis is still required, but may not always be as enlightening as for larger districts.
• Look at the distribution by school level.• Compare average years of staff experience to
the state.

What is expected by CDE?
• Update of EDT analysis included in UIP Data Narrative each year.
• If no problems, just provide a brief summary to indicate that it was considered.
• If problems are identified, include – Detail in data narrative– Provide strategies that will address the issue (e.g.,
using Title IIA funds to strengthen induction program)

Planning to Build Local Capacity• Turn to Planning to Build Local Data Analysis
Capacity (Toolkit, p. 35)• Make notes about how you will help local
stakeholders access, analyze and interpret Equitable Distribution of Teachers data:– What will you do?– With whom? When?– What tools will you use?
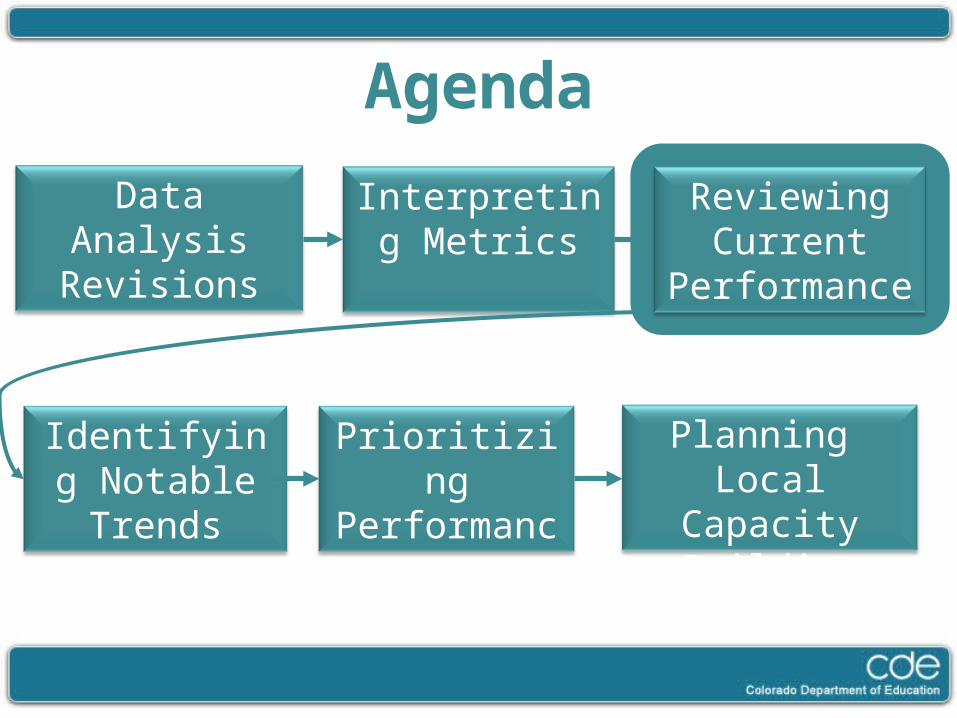
Agenda
Data Analysis Revisions
Interpreting Metrics
Identifying Notable Trends
Prioritizing Performanc
e Challenges
Planning Local Capacity
Building
Reviewing Current
Performance

Reviewing Current Performance1. Use the SPF to identify and describe:
– School or District accountability status
– Indicators (and sub-indicators) where performance did not at least meet state/federal expectations
– Magnitude of the over-all school/district performance challenge.
2. Describe how current performance compares to the prior year’s plan (using the Progress Monitoring of Prior Year’s Performance Targets Worksheet)

Review SPF Report1. Answer the following questions for Example Middle
School
– What was this school’s state accountability status?
– In which indicator areas did this school not at least meet state expectations?
– In which sub-indicators did this school not at least meet state expectations?
2. Use the Data Narrative Note catcher Example to capture this information for Example Middle School

Magnitude . . .
• Schools must identify priority performance challenges and root causes that “reflect the magnitude” of the school’s overall performance challenge.
• What does this mean?
• How will planning teams know?

Identifying the magnitude of the performance challenge
• All students or around 15% of students (RTI)
• Disaggregated groups of students? Which ones?
• All content areas, one or two content areas? Which ones.
• The magnitude reflects all of these factors.

Practice Identifying the Magnitude of Performance Challenge
• Consider: Identifying the Magnitude Practice, Example SPFs (example middle school + 2 others)
• Work with a triad to:– Answer the questions on the practice sheet for each school.
– Summarize the magnitude of the performance challenge for each school.
• Find another triad and compare how you summarized the magnitude of the performance challenges for each school.

Describing Performance in Relationship to Prior Year’s Targets
• Enter the schools annual performance targets for last year in the Progress Monitoring of Prior Year’s Performance Targets Worksheet.
• Consider the end-of-year performance results. Were the annual targets met?
• If yes:
– Is this worth celebration? Was the target(s) rigorous enough?
– How does this correlate with our improvement efforts?
• If No: Should this be a priority for the current year?

Agenda
Data Analysis Revisions
Interpreting Metrics
Identifying Notable Trends
Prioritizing Performanc
e Challenges
Planning Local Capacity
Building
Reviewing Current
Performance

What are performance trends?
• Review
– Step Three: Identify Notable Trends UIP Handbook, p. 12
– UIP Quality Criteria, Section III, Trends.
• Discuss:
– What are the most critical things to remember about performance trends?
– How can we determine if a trend is notable?
– What are some examples of “notable” performance trends?

Trends• Include all performance indicator areas.
• Include at least three years of data.
• Consider data beyond that included in the school performance framework (grade-level data).
• Include positive and negative performance patterns.
• Identify where the school did not at least meet state and federal expectations.
• Include information about what makes the trend notable.

Trend Statements• Measure/Metric
• Content Area
• Which students (grade-levels, disaggregated groups)
• Direction
• Amount
• Time period
• What makes the trend notable

What makes a trend notable?• In comparison to what . ..
• Criterion-based: How did we compare to a specific expectation?– Minimum state expectations– Median adequate growth percentiles
• Normative: How did we compare to others?– District or state trends for the same metric over the
same time period.– For disaggregated groups, to the school over-all– By standard to the content area over-all

Examples of Notable Trends• The percent of 4th grade students who scored proficient
or advanced on math TCAP/CSAP declined from 70% to 55% to 48% between 2009 and 2011 dropping well below the minimum state expectation of 71%.
• The median growth percentile of English Language learners in writing increased from 28 to 35 to 45 between 2009 and 2011,meeting the minimum expectation of 45 and exceeding the district trend over the same time period.
• The dropout rate has remained relatively stable (15, 14, 16) and much higher than the state average between 2009 and 2011.

Writing Trend StatementsConsider “Developing Trend Statements” (template and examples)
1.Identify the measure/metrics.
2.Describe for which students (grade level and disaggregated group).
3.Describe the time period.
4.Describe the trend (e.g. increasing, decreasing, flat).
5.Identify for which performance indicator the trend applies.
6.Determine if the trend is notable and describe why.

Practice writing notable trend statements
• Take out: Developing Trend Statements (examples and template) and Example Middle School reports.
• Work with a partner to:– Write notable trend statements for Example Middle
School for Academic Achievement, Academic Growth and Academic Growth Gaps.
– Consider how you could improve upon the trend statements that Example Middle School included in their 2012 UIP.
– Capture in the Developing Trend Statement Template

Planning to Build Local Capacity• Turn to Planning to Build Local Data
Analysis Capacity
• Make notes about how you will help local stakeholders identify notable trends and determine what makes trends notable:– What will you do?– With whom? When?– What tools will you use?

Agenda
Data Analysis Revisions
Interpreting Metrics
Identifying Notable Trends
Prioritizing Performanc
e Challenges
Planning Local Capacity
Building
Reviewing Current
Performance

Priority Performance Challenges• Review
– Step Four: Prioritize Performance Challenges in the UIP Handbook, p. 14.
– UIP Quality Criteria, Section III, Priority Performance Challenges.
• Discuss:– What are the most critical things to remember about
priority performance challenges? Why do we prioritize performance challenges?
– How do performance challenges relate to trends?– How do priority performance challenges relate to the
magnitude of the over-all school challenges?

Prioritizing Performance Challenges1. Review where priorities must be identified and the
magnitude of the performance challenge.
2. Consider all negative trends.
3. Focus the list, combining related trends.
4. Identify trends that are most urgent to act on.
5. Do a reality check.
6. Evaluate the degree to which the proposed priority performance challenges reflect the magnitude of the over-all school/district performance challenge.
7. Achieve consensus on the top three or four priorities.

Practice Combining Related Trends
• Consider the trend statements you wrote for Example Middle School.
• Do any of these trends address the same performance challenge (e.g. growth and achievement trends for the same students in the same content area)?
• Write one “combined” trend statement – that includes more than one metric for the same students.

Aligning Priorities to Magnitude• Read, “How to determine the appropriate level
for a priority performance challenge”, (UIP Handbook, p. 15-16)
• Work with a partner to:– What does it mean to say the priority performance
challenge is aligned to the magnitude of the overall performance challenges for the school?
– For School A and B (example SPFs), identify an example of a priority performance challenge that would not be aligned to the magnitude of the over-all performance challenge.

Planning to Build Local Capacity• Turn to Planning to Build Local Data
Analysis Capacity
• Make notes about how you will help local stakeholders prioritize performance challenges that combine similar trends and reflect the appropriate magnitude:– What will you do?– With whom? When?– What tools will you use?

Agenda
Review UIP
processes
Review Current
Performance
Identify Performance
Trends
Prioritize Performanc
e Challenges
Planning for data
analysis

Building Local Capacity: Learning from Each Other
• Turn back to Planning to Build Local Data Analysis Capacity to make any additional notes about your plans.
• Form a triad with two people from different districts with whom you have not worked today.
• Do a round robin, sharing the critical components of your plans for building local capacity.

Give us Feedback!!• Written: Use sticky notes
–+ the aspects of this session that you liked or worked for you.
The things you will change in your practice or that you would change about this session.
– ? Question that you still have or things we didn’t get to today.
– Ideas, ah-has, innovations.• Oral: Share one ah-ha!