Host-Pathogen Interactions in Mycobacterial Infections · Host-Pathogen Interactions in...
31
Host-Pathogen Interactions in Mycobacterial Infections Genetic aspects Olivier Neyrolles Institute of Pharmacology & Structural Biology CNRS – University of Toulouse - France
Transcript of Host-Pathogen Interactions in Mycobacterial Infections · Host-Pathogen Interactions in...

Host-Pathogen Interactions in Mycobacterial Infections
Genetic aspects
Olivier Neyrolles
Institute of Pharmacology & Structural Biology
CNRS – University of Toulouse - France

Why (host) genetics matters in infectious disease?
The ability of a microbe to induce a disease is most often not absolute, and
depends on the status of the host, which relies, at least in part, on genetic factors
(e.g. TB & leprosy / BCG infection in children)
Long co-existence of men and microbes had, and still has, a huge impact on
human populations, and on the human genome
The identification of predisposition/protection alleles may help define better
knowledge-based strategies for treatment and prevention at the level of the
community
The efficacy of drugs and vaccines may rely on
genetic factors (e.g. TB meningitis)

Outline
Host genes in microbial pathogenesis
Infectious diseases: transmission & global health issues
Host genes in treatment outcome
Outline
Host genes in microbial pathogenesis
Infectious diseases: transmission & global health issues
Host genes in treatment outcome

The bad date
Host Microbe
Environment
Vector
Susceptible

Infectious diseases rely on the immune status of the host
Host response (immunity)
Insufficient number of
immune effector cells
and/or molecules to prevent
host damage
Overproduction of
inflammatory mediators /
tissue fibrosis / malignant
transformation
Damage
e.g. Genetic immune deficiency
(IFNγ Rmut, IL12Rmut, STAT1mut…)
e.g. Complex genetic susceptibility
(allele combination)
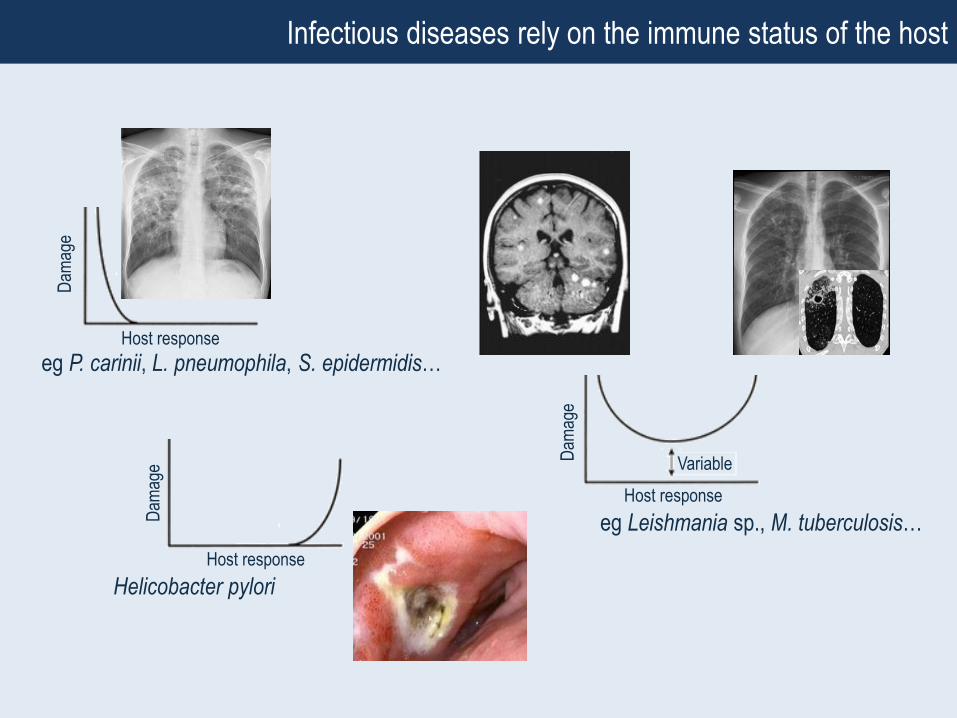
eg P. carinii, L. pneumophila, S. epidermidis…
Dam
age
Host response
Helicobacter pylori
Dam
age
Host responseD
amag
e
Host response
Variable
Infectious diseases rely on the immune status of the host
eg Leishmania sp., M. tuberculosis…

• Severe genetic immune deficiencies
BCG (M. bovis BCG) & mildly virulent mycobacteria (e.g. M. avium)
• Complex genetic susceptibility
Leprosy (M. leprae)
Tuberculosis & TB meningitis (M. tuberculosis)
Host genetics & infectious diseases: Mycobacteria provide a framework

From Casanova & Abel, 2004 Nature Rev Immunol 4, 55-66
Mendelian susceptibility to mycobacterial infections

Nature Genetics 1999
D/+ D/+
+/+D/D
Severe M. avium infection
Mendelian susceptibility to mycobacterial infections

Mycobacterium leprae (Hansen, 1873)
≈220,000 cases in 2009
Wide spectrum of clinical manifestations
Tuberculoid vs lepromatous leprosy
Host genetics is most likely involved
Complex susceptibility to mycobacterial infections: the case of leprosy
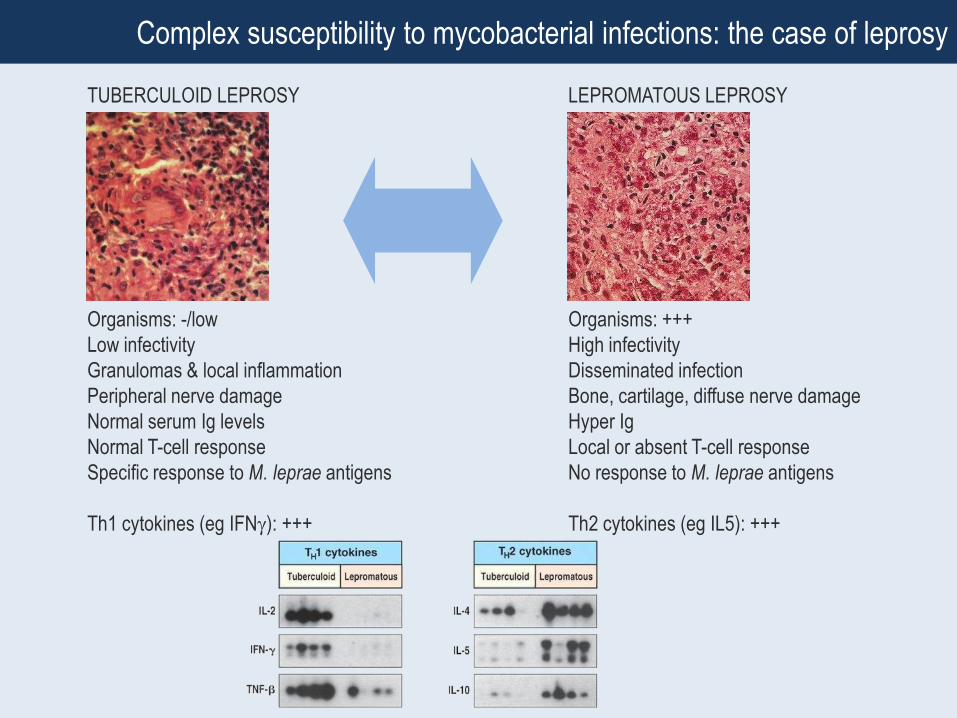
TUBERCULOID LEPROSY LEPROMATOUS LEPROSY
Organisms: -/low
Low infectivity
Granulomas & local inflammation
Peripheral nerve damage
Normal serum Ig levels
Normal T-cell response
Specific response to M. leprae antigens
Th1 cytokines (eg IFN): +++
Organisms: +++
High infectivity
Disseminated infection
Bone, cartilage, diffuse nerve damage
Hyper Ig
Local or absent T-cell response
No response to M. leprae antigens
Th2 cytokines (eg IL5): +++
Complex susceptibility to mycobacterial infections: the case of leprosy

Complex susceptibility to mycobacterial infections: the case of leprosy
TUBERCULOID (TT) LEPROMATOUS (LL)
BORDERLINE
TUBERCULOID (BT) BORDERLINE (BB)
BORDERLINE
LEPROMATOUS (BL)
PAUCIBACILLARY
LEPROMIN+
TH1
MULTIBACILLARY
LEPROMIN-
TH2

Complex susceptibility to mycobacterial infections: the case of leprosy
TLR2 Bochud et al. A TLR2 polymorphism that is associated
with lepromatous leprosy is unable to mediate
mycobacterial signaling (2003) J Immunol
+ several others…
TLR1 Johnson et al. A common polymorphism impairs cell
surface trafficking and functional responses of TLR1 but
protects against leprosy. (2007) J Immunol
+ several others…
LTA Alcais et al. Stepwise replication identifies a low
producing lymphotoxin-alpha allele as a major risk factor
for early-onset leprosy. (2007) Nat Genet
+ several others…
PARK2/PACRG Mira et al. Susceptibility to leprosy is associated with
PARK2 and PACRG. (2004) Nature
+ a few others…
+ several others…
TNF
TLR2 (Arg677Trp)
×
TLR2
Microbial signal

TB: The hidden enemy
T
B
Primary TB (~5%)
Latency (95%)
Secondary TB (~5%)
Latency (90%) On a global level, the immune system copes
very well with M. tuberculosis !
However this makes a reservoir of ≈2 billion individuals !

PLoS Med 2006
Lancet 2000
Am J Hum Genet 2000
• Nutritional status & hygiene
• HIV co-infection
• Gender & Age
• Infecting strain (virulence)
• Host genetic factors
Complex susceptibility to mycobacterial infections: the case of tuberculosis

Vitamin D Receptor
Lancet 2000
Genotype & status TB contacts (n=42) TB patients (n=71) p Odds ratio (95% CI)
Non-tt & deficient
Yes 10 (24%) 33 (46%) 0.017 2.8 (1.2-6.5)
No 32 (76%) 38 (54%)

Genes may matter in gender-related susceptibility to TB? The case of TLR8
Tlr8
Female Male
(In males)
dbSNP Alleles Cases Contacts p OR (95% CI)
rs3764879 G/C
rs3788935 G/A
rs3761624 G/A
rs3764880 G/A 1069 (79.7%) 997 (76.3%) 0.03 1.2 (1.02-1.48)
(In females)
dbSNP Case:Control p
GG GA AA
rs3764880 78:87 48:56 14:9 0.43

DC-SIGN
From Figdor et al. 2002 Nat ImmunolTailleux et al. 2003 J Exp Med
Tailleux et al. 2005 PLoS Med
Tanne et al. 2009 J Exp Med

Barreiro et al. 2006 PLoS Med
DC-SIGN L-SIGN⁄⁄19p13.2-3
-336A/G -871A/G
DC-SIGN

SNPs & miRNA regulation…
242 VO LU M E 43 | N U M BER 3 | M ARCH 2011 NATU RE G EN ETIC S
L E TTE R S
Susceptibility to Crohn’s disease, a complex inflammatory
disease, is influenced by common variants at many loci.
The common exonic synonymous SNP (c.313C>T) in IRGM,
found in strong linkage disequilibrium with a deletion
polymorphism, has been classified as non-causative because
of the absence of an alteration in the IRGM protein sequence
or splice sites. Here we show that a family of microRNAs
(miRNAs), miR-196, is overexpressed in the inflammatory intestinal epithelia of individuals with Crohn’s disease and
downregulates the IRGM protective variant (c.313C) but
not the risk-associated allele (c.313T). Subsequent loss of
tight regulation of IRGM expression compromises control of
intracellular replication of Crohn’s disease–associated adherent
invasive Escherichia coli by autophagy. These results suggest
that the association of IRGM with Crohn’s disease arises from
a miRNA-based alteration in IRGM regulation that affects
the efficacy of autophagy, thereby implicating a synonymous
polymorphism as a likely causal variant.
The IRGM region contains multiple polymorphisms that cause tissue-
specific variation in IRGM expression1–3. A synonymous variant
within the IRGM coding region (rs10065172, NM_001145805.1,
c.313C>T) in perfect linkage disequilibrium (r2 = 1.0) with a 20-kb
deletion upstream of IRGM has been strongly associated with
Crohn’s disease in individuals of European descent1,4,5. A recent
study proposed that allelic differences in the promoter region might
be involved in Crohn’s disease pathogenesis1, as the deletion, and
other copy number variants, closely juxtapose several transcription
factor binding sites2. An alternative hypothesis is that the synonymous
exonic (CTG>TTG, leucine) variant might affect protein expres-
sion. In this regard, recent evidence that a polymorphism can alter
miRNA-directed repression of mRNA in a 3 untranslated region6,7 is
of particular interest. Thus, we investigated whether miRNA binding
to IRGM mRNA could be defective in subjects with the T allele and
consequently lead to abnormal regulation of IRGM expression.
For this purpose, we assessed binding of miRNAs to the different
forms of IRGM mRNA in silico using SnipMir, RegRNA and Patrocles
software (see URLs). We observed a predicted loss in binding of two
miRNAs, miR-196A and miR-196B, to the risk haplotype carrying the T allele (Fig. 1a). Indeed, the c.313C>T polymorphism of IRGM is
located within the ‘seed’ region, where mRNA-miRNA forms a complex
within RISC (RNA-induced silencing complex), which is important
for mRNA regulation. Two pre–miR-196A genes (MIR196A1 and
MIR196A2) encode the same mature miR-196A, whereas miR-196B
(MIR196B) is unique within the genome (Supplementary Note).
Both miRNAs share the same ‘seed’ region and target specificity.
Moreover, tandem affinity purification of miRNA target mRNA
(TAP-Tar)8 showed higher binding of miR-196 to IRGM c.313C mRNA
(hereafter IRGMC) than to IRGM c.313T mRNA (hereafter IRGMT),
confirming in silico predictions (Fig. 1b). In HEK293 cells (C/C for
rs10065172), miR-196 transfection decreased protein expression from
a FLAG-tagged IRGMC construct as well as endogenous IRGM pro-
tein levels, whereas expression from a FLAG-tagged IRGMT construct
remained constant (Fig. 1c). Using a modified miR-196 (miR-196MOD)
with a compensatory c.3G>A mutation (Supplementary Note), we
observed stronger binding to IRGMT than to IRGMC and a concomi-
tant decrease in protein expression from the FLAG-tagged IRGMT
construct (Supplementary Fig. 1). Together, these results indicate that
the Crohn’s disease–associated risk (T allele) and protective (C allele)
haplotypes confer differences in IRGM expression under the control
of miR-196. Notably, the miR-196 family and the miR-196 binding site
within the coding sequence of IRGM family members are conserved in
A synonymous variant in IRGM alters a binding site for miR-196 and causes deregulation of IRGM-dependent xenophagy in Crohn’s disease
Patrick Brest1,2, Pierre Lapaquette3,4, Mouloud Souidi5,6, Kevin Lebrigand2,7, Annabelle Cesaro1,2, Valérie Vouret-Craviari1,2, Bernard Mari2,7, Pascal Barbry2,7, Jean-François Mosnier8, Xavier Hébuterne1,2,9, Annick Harel-Bellan5,6, Baharia Mograbi1,2, Arlette Darfeuille-M ichaud3,4,12 & Paul Hofman1,2,10–12
1INSERM ERI-21, EA4319, Faculty of Medicine, Nice, France. 2University of Nice Sophia Antipolis, Nice, France. 3Clermont Université, Université d’Auvergne,
Jeune Equipe JE 2526, Clermont-Ferrand, France. 4INRA, Institut de Recherche Agronomique, Unité sous contrat USC-2018, Clermont-Ferrand, France. 5Université
Paris-Sud 11, Epigenetics and Cancer, FRE 3239, Villejuif, France. 6Centre National de la Recherche Scientifique (CNRS), Villejuif, France. 7CNRS UMR 6097,
Institut de Pharmacologie Moléculaire et Cellulaire, Valbonne, France. 8EA4273, University of Nantes, Nantes, France. 9Centre Hospitalier Universitaire de Nice, Hôpital de l’Archet, Service de Gastroentérologie, Nice, France. 10Centre Hospitalier Universitaire de Nice, Hôpital Pasteur, Tumorothèque, Centre de Ressource Biologique
INSERM, Nice, France. 11Centre Hospitalier Universitaire de Nice, Hôpital Pasteur, Laboratoire de Pathologie Clinique et Expérimentale, Nice, France. 12These authors
contributed equally to this work. Correspondence should be addressed to P.H. ([email protected]) or A.D.-M. ([email protected]).
Received 1 October 2010; accepted 10 January 2011; published online 30 January 2011; doi:10.1038/ng.762
© 2
011 N
atu
re A
meri
ca, In
c. A
ll r
igh
ts r
eserv
ed
.
Nat Genet 2011
NATU RE G EN ETIC S VO LU M E 43 | N U M BER 3 | M ARCH 2011 243
L E TTE R S
different species, suggesting that control of IRGM protein expression by
miR-196 is under evolutionary constraint (Supplementary Fig. 2).
To correlate in silico and in vitro data with the pathophysiology of
Crohn’s disease, we analyzed expression of miR-196 in human biopsies
using in situ hybridization and fractional laser capture microdissec-
tion followed by quantitative PCR. Increased expression of miR-196
was restricted to intestinal epithelial cells within inflamed ileum
and colon in individuals with Crohn’s disease compared to healthy
controls, as shown by representative images of global staining for miR-
196 by in situ hybridization (Fig. 2a and Supplementary Fig. 3). To
confirm these data, we determined expression levels of miR-196A and
miR-196B in epithelial and lamina propria fractions isolated by laser
capture microdissection (Supplementary Fig. 4). Notably, expression
of miR-196A and miR-196B in the epithelium (relative to that in the
lamina propria) was lower in healthy tissue from control individuals
or individuals with Crohn’s disease and was progressively increased in
quiescent and inflamed tissues from individuals with Crohn’s disease
(Fig. 2b and Supplementary Fig. 5) independently of IRGM c.313C or
c
2.0 P = 0.05
IRGMC mRNA
IRGMT mRNA
1.8
1.6
1.4
1.2
1.0
0.8
0.6
0.4
0.2
0
Biot-m
iR-196
B
Biot-m
iR-2
0IP strep
TA
P-T
ar (r
ela
tive a
ffin
ity)
b
a5 3 IRGM c.313C
3 5 miR-196A
5 3 IRGM c.313T
3 5 miR-196A
5 3 IRGM c.313C
3 5 miR-196B
5 3 IRGM c.313T
3 5 miR-196B
IRGM and miR-196 binding predictions
P = 0.04
P = 0.038
IRGMC
IRGMT
IRGM
IRGM
+ miR
-196
BNT
IRGM
IRGM
+ miR
-196
BNT
1.4
FLA
G-tagged IR
GM
expre
ssio
nE
ndogenous IR
GM
expre
ssio
n
1.2
1.0
0.8
0.6
0.4
0.2
0
1.4
1.2
1.0
0.8
0.6
0.4
0.2
0
+ miR-196B
NT
IRGM-FLAG
IRGM
Actin
IRGMC
IRGMT
IRGMC
IRGMT
Figure 1 Allele-specific regulation of IRGM by miR-196. (a) In silico
prediction of miR-196 and IRGM mRNA interactions showed differences in
binding within the seed region. (b) IRGMC mRNA was significantly enriched
in miR-196B complexes. Extracts of cells expressing FLAG-tagged-AGO1
and transfected with biotinylated miR-196B or control miR-20 as indicated
and then with IRGMC or IRGMT plasmids were submitted to tandem
affinity purification (immunoprecipitation with FLAG antibodies followed
by affinity purification on streptavidin beads). IRGM mRNA variants were
quantified using quantitative RT-PCR; results are presented as the ratio
between miR-196B and miR-20 (non-relevant miRNA) pull-downs and
the mean of three independent experiments standard deviation (s.d.).
IP strep, immunoprecipitation straptavidine. (c) HEK293 cells (IRGMC/C)
were transfected with either FLAG-tagged IRGMC or FLAG-tagged IRGMT
plasmids and co-transfected with miR-196B. Immunoblotting with an IRGM
antibody revealed the specificity of the downregulation effect mediated
by the miRNA IRGM mRNA interaction. Quantification of the immunoblot
signals are presented as IRGM expression relative to actin (mean of at least
three independent experiments s.d.).
a10
8
6
4
P = 0.049
P = 0.013
P = 0.009 miR-196A
miR-196B
P = 0.023
2
–2
Log2 incre
ase, E v
s L
P
0
Healthy Quiescent Inflamed
CD
b
P = 0.047 P = 0.011
Positive c
ell density (cells
/mm
2)
0
50
150
250
350
300
200
100
Healthy
C/C C/CC/T C/T C/TC/C
Quiescent Inflamed
CD
d
c Healthy mucosa Healthy mucosaIRGMC/C
Inflamed mucosa Inflamed mucosa
IRG
M
IRG
M
LPLP
LP
LP
L
LL
L
IRGMC/T
Healthy mucosa Inflamed mucosa
LP
LP
miR
-196
miR
-196
miR
-196
miR
-196
LP
LP
LP
LP
LPL
L L
L
L
L
L
L
IRGMC/C
Healthy mucosa Inflamed mucosaIRGMC/T
Figure 2 miR-196 overexpression in inflamed mucosa correlates with decreased expression of the IRGM c.313C variant ex vivo. (a) Representative in situ
hybridization of frozen sections obtained from colon biopsies of genotyped healthy controls (n = 40) or individuals with Crohn’s disease (CD) (n = 67) without
or with active inflammation and labeled for miR-196A. (L, lumen; LP, lamina propria). Scale bars in the upper panel, 25 m; scale bars in the lower panel,
10 m. (b) Epithelial or laminal fractions were captured from sections of biopsies of healthy controls (n = 8) or individuals with Crohn’s disease with no
inflammation (n = 16), quiescent (defined as low-grade inflammation) (n = 8) or acute inflammation (n = 8) using laser capture microdissection. After
RNA extraction, miR-196A (black bars) and miR-196B (white bars) relative expression was analyzed using RNU19, 44 and U6. To overcome possible inter-
individual bias, the lamina propria fraction value was used for relative quantification. Due to high differences in expression between healthy and inflamed
tissues, the results are presented as a log2-fold ratio. Error bars indicate the s.d. of the Ct values. (c) Representative in situ staining for IRGM of TMAs
from colon biopsies of healthy individuals or individuals with Crohn’s disease with a defined genotype in a healthy non-inflamed or an acute inflamed phase.
Scale bars, 32 m. (d) Mean (black line), s.e.m. (white box) and 95% CI of the mean of the IRGM expression level for 40 healthy subjects (32 individuals
with C/C and 8 individuals with C/T) and 67 individuals with Crohn’s disease (45 with C/C and 22 with C/T) with quiescent or inflamed colon mucosa.
We performed statistical analysis using ANOVA (P = 0.0015) and an unpaired Student’s t-test (the one tail P value is indicated on the figure).
© 2
011 N
atu
re A
meri
ca, In
c. A
ll r
igh
ts r
eserv
ed
.
C CCU G G 3’-IRGM c313CACAAC GGA AACUACCU UGUUG CCU UUGAUGGA
GGGU U U 5’-miR-196B
C CCU G U G 3’-IRGM c313TACAAC GGA AACUAC UUGUUG CCU UUGAUG A
GGGU U G U 5’-miR-196B
244 VO LU M E 43 | N U M BER 3 | M ARCH 2011 NATU RE G EN ETIC S
L E TTE R S
T allelic status (Supplementary Note and Supplementary Table 1).
We investigated whether the increase in miRNA expression could be
a consequence of stimulation by bacterial components or cytokines,
as previously reported for various cell lines9–12. However, in vitro
experiments indicated no variation in either miR-196A or miR-196B
under pro-inflammatory cytokine stimulation (IFN- ) or infection
of HEK293 cells with Crohn’s disease–associated adherent invasive
E. coli (AIEC) bacteria (Supplementary Fig. 6).
Next, we analyzed the correlation between miR-196 and IRGM pro-
tein expression in epithelial cells within the human intestinal mucosa
in tissue microarrays (TMAs) from individuals with Crohn’s disease.
Representative immunostaining images from colons of individuals
with Crohn’s disease are shown in Figure 2c. In healthy mucosa, IRGM
basal expression was strongly positive in epithelial cells independent
of genotype and only weakly positive in the lamina propria. Notably,
in active mucosa, a decrease in IRGM expression was restricted to
epithelial cells of individuals with the IRGMC/C genotype. However,
when the T allele was present in individuals with Crohn’s disease,
IRGM expression was maintained under inflammatory conditions
(Fig. 2c,d, Supplementary Note and Supplementary Figs. 3,7 and 8).
Thus, our findings show that miR-196 expression in inflammatory
conditions correlates with downregulated IRGM expression in human
epithelial cells. Of note, IRGM staining was maintained at a high level
in Paneth cells (Fig. 2c and Supplementary Fig. 9), indicating a pos-
sible difference in IRGM regulation in these cells. Together with a
previous report showing that the levels of autophagy-related proteins
ATG16L1 and ATG5 were critical in maintaining normal granule
biogenesis13, we hypothesize that alternative mechanisms regulating
autophagy-related events could exist in Paneth cells.
IRGM encodes an autophagic protein that plays an important role in
innate immunity against intracellular pathogens like Mycobacterium
tuberculosis, Salmonella typhimurium and Crohn’s disease–associated
AIEC bacteria1,14,15. Compelling evidence indicates that a critical
threshold of IRGM can regulate the efficiency of the autophagic pro-
cess1,14, but the mechanism of regulation of human IRGM expression
remains unknown3,16. Thus, we investigated whether miR-196 and sub-
sequently modified IRGM expression might influence basal autophagic
flux by monitoring LC3-II conversion. LC3-II levels decrease during
prolonged autophagy due to its degradation after autophagosomal-
lysosomal fusion, so we measured the flux through the autophagic
system by comparing LC3-II levels in the presence or absence of
lysosomal inhibitors that partially (pepstatin + E64D) or completely
(bafilomycin A1) prevent LC3-II degradation. Notably, miR-196, which
reduced IRGM expression (Fig. 1), induced a significant decrease in
LC3-II conversion (Fig. 3a,b; P = 0.02). Moreover, when autophagy
was blocked with lysosomal inhibitors, miR-196 inhibited the accu-
mulation of LC3-II (Fig. 3a,b), which suggests strongly that miR-196
overexpression inhibits the autophagic process at the initiation step.
To determine the effect of the increase in miR-196 expression
observed in individuals with Crohn’s disease, we examined the
autophagic flux in response to Crohn’s disease–associated AIEC infec-
tion. In response to AIEC bacterial infection, we observed increased
formation of LC3-II (Fig. 3c). When we blocked lysosomal LC3-II
degradation, we observed a larger increase in LC3-II in AIEC-infected
P = 0.010
P = 0.028
P = 0.024
P = 0.020
0
2
4
6
8
10
12
14Ctl
4 h0miR-196
Ctl
6 h
Time post infection
0
2.5
1.5
– AIEC
+ AIEC
0.5
1.0
2.0
3.0
% o
f LC3-a
ssocia
ted b
acte
ria
LC3-II / actin (fo
ld incre
ase)
Ctl
Ctl + Inh
miR-196
miR-196
c d
Ctl
g
IRGM
P = 0.005
02468
101214161820
4 h0 6 h
Time post infection
% o
f LC3-a
ssocia
ted b
acte
ria
Ctl
IRGM
12
10
8
6
4 P = 0.02
P = 0.040
P = 0.014
2
0Quantification L
C3-ll / actin
Control
Control + B
af
Control + InhIR
GM
IRGM
+ Baf
IRGM
+ Inh
miR-196
miR-196 +
Baf
miR-196 +
Inh
silRGM
silRGM
+ Baf
silRGM
+ Inh
b
0
2.5
1.5
– AIEC
+ AIEC
0.5
1.0
2.0
3.0
LC3-II / actin (fold
incre
ase)
Ctl
IRGM
Ctl + Inh
IRGM
+ Inh
fP = 0.028
0
1 h
8 h
1.5
0.5
1.0
2.0
Intracellu
lar AIE
C b
acte
ria
(fold
incre
ase)
Ctl
IRGM
hP = 0.00570
60
50
40
30
20
10
0
% A
IEC-c
onta
inin
gacid
ic v
acuole
s
Ctl
IRGM
iP = 0.030
0
4.0
3.51 h
8 h
2.5
1.5
0.5
1.0
2.0
3.0
Intracellu
lar AIE
C b
acte
ria
(fold
incre
ase)
Ctl
miR-196
miR-196
sci
e
Untreated Bafilomycin A1
LC3-II
LC3-II
Actin
Control
Control
IRGM
IRGM
miR1
96
miR1
96
silRGM
silRGM
a
Figure 3 IRGM expression and miR-196 affect autophagic flux and AIEC-bacteria–mediated autophagy. (a) The basal flux of autophagy is affected
by IRGM expression level. HEK293 cells transfected with an IRGM-expressing plasmid, miR-196 or siIRGM were treated with bafilomycin A1 for 2 h
and processed for immunoblotting with anti-LC3B. (b) Quantification of LC3-II relative to actin (mean of three independent experiments s.d.).
(c) Downregulation of IRGM expression by miR-196 abrogates AIEC-mediated autophagy in cells treated with autophagic inhibitors (Inh) or transfected
with miR-196B and infected for 4 h with AIEC LF82 (mean of three independent experiments s.d.). (d) Confocal microscopic examination of LC3
revealed a significant decrease in the percentage of LC3-associated (red) LF82 bacteria (green) in miR-196 transfected cells compared to control
cells (mean s.d.). (e) miR-196 transfection leads to increased intracellular LF82 replication. Results are expressed as a fold increase s.e.m.
of intracellular bacteria. (f) IRGM overexpression did not inhibit autophagic flux and it increased LC3-II accumulation slightly in response to AIEC
infection. HEK293 cells were transfected with IRGM-expressing plasmid, treated with autophagic inhibitors and infected with AIEC bacteria for 4 h
(mean of three independent experiments s.d.). (g) Confocal microscopic examination showed an increased percentage of LC3-associated AIEC
bacteria in IRGM cells compared to control cells (mean s.d.). (h) IRGM overexpression led to a high rate of intracellular replication of LF82 bacteria.
(i) Most of the bacteria reside in non-acidic vacuoles, as shown with lysotracker at 8 h post infection (means of three independent experiments s.d.).
© 2
011 N
atu
re A
meri
ca, In
c. A
ll r
igh
ts r
eserv
ed
.

Cell 2010
ITA4H

T/C
TB (Vietnam) OR=0.71, padj=0.011
MB Leprosy (Nepal) OR=0.62, padj=0.001 T/G
TB (Vietnam) OR=0.64, padj=0.0003
MB Leprosy (Nepal) OR=0.70, padj=0.021
ITA4H

• 20% long-exposed individuals never become TST+ (although not anergic)
• Suggests T cell-independent resistance to TB
• Strong heritability
Innate resistance to TB?
J Exp Med 2009

Take-home
Complex susceptibility to infectious agents is mostly due to combinations of both
common and rare variants, each with relatively minor effects, in important, although
not « key » , immunity-related genes (e.g. NRAMP1, DC-SIGN, TLR2, VDR etc.)
Fatal cases of infection with poorly virulent microbes are mostly due to rare
mendalian mutations in key immunity-related genes (e.g. IFNγ R, IL-12R etc.)

Outline
Host genes in microbial pathogenesis
Infectious diseases: transmission & global health issues
Host genes in treatment outcome

1
10
100
1000
WB
C/µ
L C
SF
C/C C/T T/T
A B C
0.4
0.6
0.8
1.0
Su
rviv
al
No DEX (68)
DEX (114)
0 100 200 300 400
Days after enrollment
EGenotype
P = 0.006
C/T (27)
C/C (27)
T/T (12)P = 0.042
0.4
0.6
0.8
1.0
Su
rviv
al
0 100 200 300 400
Days after enrollment
P = 0.005
C/T (46)
C/C (55)
T/T (13)
0.4
0.6
0.8
1.0
Su
rviv
al
0 100 200 300 400
Days after enrollment
No DEX DEX
00.6
0.7
0.8
0.9
1.0
Surv
iva
l
P = 0.02
Days after enrollment
100 200 300 400
D
P = 0.2All Genotypes
C/T (73)
T/T (25)
C/C (84)All Patients
How your genes may save (or kill !) you upon treatment: ITA4H in TB meningitis
Cell 2012

T ⁄ TC ⁄ TC ⁄ C
ITA4H
LTB4
LXA4
TNF
Poor inflammation
Bacterial proliferation
Strong inflammation
Tissue injury
rs1978331
MtbMtb
TNF
DEX
TNF
DEX
TNFMtb
How your genes may save (or kill !) you upon treatment: ITA4H in TB meningitis

1
10
100
1000
WB
C/µ
L C
SF
C/C C/T T/T
A B C
0.4
0.6
0.8
1.0
Su
rviv
al
No DEX (68)
DEX (114)
0 100 200 300 400
Days after enrollment
EGenotype
P = 0.006
C/T (27)
C/C (27)
T/T (12)P = 0.042
0.4
0.6
0.8
1.0
Su
rviv
al
0 100 200 300 400
Days after enrollment
P = 0.005
C/T (46)
C/C (55)
T/T (13)
0.4
0.6
0.8
1.0
Su
rviv
al
0 100 200 300 400
Days after enrollment
No DEX DEX
00.6
0.7
0.8
0.9
1.0
Surv
iva
l
P = 0.02
Days after enrollment
100 200 300 400
D
P = 0.2All Genotypes
C/T (73)
T/T (25)
C/C (84)All Patients
How your genes may save (or kill !) you upon treatment: ITA4H in TB meningitis
Tobin et al. 2012 Cell
1
10
100
1000
WB
C/µ
L C
SF
C/C C/T T/T
A B C
0.4
0.6
0.8
1.0
Su
rviv
al
No DEX (68)
DEX (114)
0 100 200 300 400
Days after enrollment
EGenotype
P = 0.006
C/T (27)
C/C (27)
T/T (12)P = 0.042
0.4
0.6
0.8
1.0
Su
rviv
al
0 100 200 300 400
Days after enrollment
P = 0.005
C/T (46)
C/C (55)
T/T (13)
0.4
0.6
0.8
1.0
Su
rviv
al
0 100 200 300 400
Days after enrollment
No DEX DEX
00.6
0.7
0.8
0.9
1.0S
urv
iva
l
P = 0.02
Days after enrollment
100 200 300 400
D
P = 0.2All Genotypes
C/T (73)
T/T (25)
C/C (84)All Patients
TREATED
1
10
100
1000
WB
C/µ
L C
SF
C/C C/T T/T
A B C
0.4
0.6
0.8
1.0
Su
rviv
al
No DEX (68)
DEX (114)
0 100 200 300 400
Days after enrollment
EGenotype
P = 0.006
C/T (27)
C/C (27)
T/T (12)P = 0.042
0.4
0.6
0.8
1.0
Su
rviv
al
0 100 200 300 400
Days after enrollment
P = 0.005
C/T (46)
C/C (55)
T/T (13)
0.4
0.6
0.8
1.0
Su
rviv
al
0 100 200 300 400
Days after enrollment
No DEX DEX
00.6
0.7
0.8
0.9
1.0
Surv
iva
l
P = 0.02
Days after enrollment
100 200 300 400
D
P = 0.2All Genotypes
C/T (73)
T/T (25)
C/C (84)All Patients
UNTREATED

Genes matter in TB treatment: the case of VDR
Lancet 2011
Days of treatment
Spu
tum
cultu
re n
egat
ive
(%)
Nr patients Median time 95% CI p
to sputum
conversion
+Vitamin D 62 36 31.8-40.2
Placebo 64 43.5 36.5-50.5 0.41
VDR genotype Hazard ratio 95% CI p
TaqI tt 8.09 1.36-48.01 0.02
TaqI Tt 0.85 0.45-1.63 0.63
TaqI TT 1.13 0.60-2.10 0.71

Some references…
Rappuoli. 2004. From Pasteur to genomics: progress and challenges in infectious
diseases. Nature Medicine 10:1174
Morens et al. 2004. The challenge of emerging and re-emerging infectious diseases.
Nature 430:242
Wolfe et al. 2007. Origins of major human infectious diseases. Nature 447:279
Quintana-Murci et al. 2007. Immunology in natura: clinical, epidemiological and
evolutionary genetics of infectious diseases. Nat Immunol 8:1165
Okeke & Wain. 2008. Post-genomic challenges for collaborative research in infectious
diseases. Nat Rev Microbiol 6:858
http://www.who.int