Hospitals’ Negotiating Leverage with Health Plans: How...
28
Hospitals’ Negotiating Leverage with Health Plans: How and Why Has It Changed? Kelly J. Devers, Lawrence P. Casalino, Liza S. Rudell, Jeffrey J. Stoddard, Linda R. Brewster, and Timothy K. Lake Objective. To describe how hospitals’ negotiating leverage with managed care plans changed from 1996 to 2001 and to identify factors that explain any changes. Data Sources. Primary semistructured interviews, and secondary qualitative (e.g., newspaper articles) and quantitative (i.e., InterStudy, American Hospital Association) data. Study Design. The Community Tracking Study site visits to a nationally representa- tive sample of 12 communities with more than 200,000 people. These 12 markets have been studied since 1996 using a variety of primary and secondary data sources. Data Collection Methods. Semistructured interviews were conducted with a purposive sample of individuals from hospitals, health plans, and knowledgeable market observers. Secondary quantitative data on the 12 markets was also obtained. Principal Findings. Our findings suggest that many hospitals’ negotiating leverage significantly increased after years of decline. Today, many hospitals are viewed as having the greatest leverage in local markets. Changes in three areas——the policy and purchasing context, managed care plan market, and hospital market——appear to explain why hospitals’ leverage increased, particularly over the last two years (2000–2001). Conclusions. Hospitals’ increased negotiating leverage contributed to higher payment rates, which in turn are likely to increase managed care plan premiums. This trend raises challenging issues for policymakers, purchasers, plans, and consumers. Key Words. Managed care, markets, health plans, hospitals, costs Despite efforts to reduce hospital utilization and length of stay, hospital care continues to account for a substantial portion of total health care expenses (Levit et al. 2002; Agency for Healthcare Research and Quality 2000). In addition, spending on hospital care is on the rise once again. In 2000, hospital inpatient and outpatient services accounted for 43 percent of the growth in total health care spending, more than twice the share of the 1999 increase (Strunk, Ginsburg, and Gabel 2001). Over the past three decades, public and private purchasers turned to managed care plans to stimulate greater hospital competition and reduce 419
Transcript of Hospitals’ Negotiating Leverage with Health Plans: How...

Hospitals’ Negotiating Leverage withHealth Plans: How and Why Has ItChanged?Kelly J. Devers, Lawrence P. Casalino, Liza S. Rudell,Jeffrey J. Stoddard, Linda R. Brewster, and Timothy K. Lake
Objective. To describe how hospitals’ negotiating leverage with managed care planschanged from 1996 to 2001 and to identify factors that explain any changes.Data Sources. Primary semistructured interviews, and secondary qualitative (e.g.,newspaper articles) and quantitative (i.e., InterStudy, American Hospital Association)data.Study Design. The Community Tracking Study site visits to a nationally representa-tive sample of 12 communities with more than 200,000 people. These 12 markets havebeen studied since 1996 using a variety of primary and secondary data sources.Data Collection Methods. Semistructured interviews were conducted with apurposive sample of individuals from hospitals, health plans, and knowledgeablemarket observers. Secondary quantitative data on the 12 markets was also obtained.Principal Findings. Our findings suggest that many hospitals’ negotiating leveragesignificantly increased after years of decline. Today, many hospitals are viewed ashaving the greatest leverage in local markets. Changes in three areas——the policy andpurchasing context, managed care plan market, and hospital market——appear to explainwhy hospitals’ leverage increased, particularly over the last two years (2000–2001).Conclusions. Hospitals’ increased negotiating leverage contributed to higher paymentrates, which in turn are likely to increase managed care plan premiums. This trend raiseschallenging issues for policymakers, purchasers, plans, and consumers.
Key Words. Managed care, markets, health plans, hospitals, costs
Despite efforts to reduce hospital utilization and length of stay, hospital carecontinues to account for a substantial portion of total health care expenses(Levit et al. 2002; Agency for Healthcare Research and Quality 2000). Inaddition, spending on hospital care is on the rise once again. In 2000, hospitalinpatient and outpatient services accounted for 43 percent of the growth intotal health care spending, more than twice the share of the 1999 increase(Strunk, Ginsburg, and Gabel 2001).
Over the past three decades, public and private purchasers turned tomanaged care plans to stimulate greater hospital competition and reduce
419

hospital expenditures and costs.1 Two techniques managed care plans used toachieve these goals were selective contracting and utilization management. Aswe discuss further in the background section, these techniques and othermarket dynamics weakened hospitals’ negotiating leverage with plans.
The purpose of this paper is to provide a recent but longitudinaldescription of managed care plan–hospital contracting. In particular, thepaper focuses on hospitals’ market power in contract negotiations with plans.2
Plan–hospital negotiations continue to be a critical nexus where competitivemarket forces meet in the managed care world, with significant implicationsfor the organizations involved, the patients and communities they serve, andhealth care expenses.
Market power is defined as the degree of control or influence anorganization has over another organization (Scott 1987; Emerson 1962).3
Control or influence is shaped by the willingness and ability of oneorganization to sanction (i.e., punish or reward) another organization that itinteracts with to attain key goals, such as survival, growth, or increasedmargins. The origin of market power is the dependency one organization hason the resources controlled by another.
Two specific questions about hospitals’ market power are addressed inthis paper. First, how has hospitals’ negotiating leverage with managed careplans changed from 1996 to 2000? Second, what factors explain any changesin hospitals’ negotiating leverage between 1996 and 2000?
Our findings suggest that many hospitals’ negotiating leverage increasedsignificantly since 1996, with the largest gains occurring over last two years.While almost all hospitals were ‘‘contract takers’’ in 1996, some hospitals arenow ‘‘contract makers or breakers.’’ The negotiating leverage of otherhospitals has improved as well, although less dramatically.
Two types of evidence support this conclusion. First, serious contractdisputes were much more frequently reported in 2000 compared with 1996.The prevalence of these disputes across diverse markets signals hospitals’
This research was conducted as part of the Center for Studying Health System Change’sCommunity Tracking Study (CTS), which is funded by the Robert Wood Johnson Foundation.
Address correspondence to Kelly J. Devers, Ph.D., Health Researcher, Center for Studying HealthSystem Change, 600 Maryland Ave. SW, Suite 550, Washington, DC 20024-2512. Lawrence P.Casalino, M.D., Ph.D., is with the University of Chicago. Liza S. Rudell, B.A., Harvard School ofPublic Health, Master’s Degree Candidate, and Jeffrey J. Stoddard, M.D., MedImmune Inc.,Gaithersburg, MD, were both with the Center for Studying Health System Change when theresearch was conducted. Linda R. Brewster, M.B.A., is with the Center for Studying Health SystemChange. Timothy K. Lake, Ph.D., is with Mathematica Policy Research, Inc., in Cambridge, MA.
420 HSR: Health Services Research 38:1, Part II (February 2003)

increased willingness to exercise market power, as well as their assessment thatthey have the ability to do so given current market conditions. We observedcontentious disputes in 7 out of 12 markets, and reports of other seriouscontract disputes throughout the country have appeared in the trade literature(for example, see Benko and Bellandi 2001). In some cases, hospitalsterminated contracts, a behavior unheard of in the mid-1990s. Second,different types of respondents all perceived that hospitals were ‘‘winning’’disputes. They noted that hospitals have been able to secure payment rateincreases and significantly influence other contract terms. While there isvariation across markets and within the hospital sector, a major change overthe past five years is that many hospitals are now willing, and successfully able,to exercise market power in contract negotiations.
We argue that between 1996 and 2000, significant changes in three areasconverged to increase hospitals’ market power: the policy and purchasingcontext in which plan–provider contract negotiations take place, the managedcare plan market, and the hospital market. We identify specific changes ineach of these three areas noted by interview respondents and largelysupported by secondary quantitative data and describe how they impacthospitals’ negotiating leverage with plans.
Our findings are consistent with prior research. Many previous studiesdocumented factors that result in plans’ increased negotiating leverage withhospitals. This recent, longitudinal study shows that many of these factorsare still important but that the direction of change has reversed, shiftingmarket power back to many hospitals. These findings also provide insightinto why hospitals are now more willing to exercise market power; hospitalsmay have had some ability to exercise market power several years ago butthey did not use it. Recently, hospitals’ increased financial distress anda sense of opportunity converged, leading them to exercise their leveragewith plans.
BACKGROUND
Over the past fifteen years, much has been learned about how managed careaffects plan–hospital contracting and hospital prices.4 Following is a briefreview of the literature.
Selective contracting was one of the major innovations of managed carethat changed competitive dynamics in the hospital sector and increased plans’negotiating leverage with hospitals. Under selective contracting, plans would
Hospitals’ Negotiating Leverage with Health Plans 421

contract with a subset of hospitals in the market and, through a variety oftechniques, strongly encourage physicians and members to only utilize thosefacilities. In short, the plan would channel most of its members to a smallernumber of hospitals. Several studies based on data from the late 1980s andearly 1990s found that managed care plans contracted with less than half of thehospitals in their markets (Zwanziger and Meirowitz 1998; Feldman et al.1990).
The threat of a plan excluding a hospital from a contract, and channelinglarge blocks of patients elsewhere, changed hospital competition and plan–hospital negotiations in several important ways. First, hospital competitionshifted from a physician/patient driven phenomenon to more of a payer/plandriven phenomenon. A hospital first had to secure a contract with a planbefore competing for individual physicians and patients. Second, pricebecame a much more important dimension on which hospitals competed.Purchasers were more sensitive to insurance premium increases thanindividual consumers were to hospital charges because they bore a greaterportion of the costs. Therefore, they pressed plans to negotiate better contracts(i.e., lower payment rates, more favorable terms) with providers. Third, othermanaged care techniques, such as utilization review and management,reduced inpatient length-of-stay (LOS) and shifted more care to outpatientsettings, resulting in a relative oversupply of hospital beds. This excesscapacity in the market enhanced plans’ ability to move large numbers ofpatients from one hospital to another if the hospital did not agree to the plans’contract terms.
A recent review of the literature concludes that through selectivecontracting, plans have been able to slow the rate of hospital price, andpresumably cost, increases (Morrisey 2001). The author also draws severalother tentative conclusions by extrapolating from two national studies of theeffects of managed care and hospital competition on costs (Gaskin and Hadley1997; Bamezai et. al. 1999). First, health maintenance organization (HMO)penetration has a greater retarding effect on hospital cost growth thanpreferred provider organization (PPO) penetration, although the effects ofHMO and PPO penetration are additive. Second, and related, less restrictiveforms of managed care require greater levels of market penetration to achievethe same effects on hospital costs.
Several other characteristics of managed care plan and hospital marketsaffect plan–provider negotiations, and ultimately hospital prices (Melnicket al. 1992). First, the larger the percent of a hospital’s total patient daysaccounted for by a plan, the greater the leverage the plan has with the hospital.
422 HSR: Health Services Research 38:1, Part II (February 2003)

However, beyond a certain point there are diminishing returns. When a planbecomes relatively dependent upon a hospital (i.e., a relatively large share of aplan’s patients use a single hospital), the plan pays higher prices. Second, planspay even higher prices if the hospital market is less competitive (i.e., morehighly concentrated). Finally, higher hospital occupancy rates marketwideresult in higher prices. Plans’ threat to channel large numbers of patientselsewhere is less credible when there is less idle capacity.
To summarize, high HMO penetration, low hospital concentration, andlow marketwide occupancy rates decrease hospitals’ leverage with plans andresult in lower hospital prices. Hospitals, however, are aware of this formulaand may pursue a variety of strategies in response, including mergers andacquisitions.
Whether horizontal mergers among hospitals lead to greater negotiatingleverage and higher prices remains a hotly contested issue. Findings fromexisting studies differ markedly. Some studies conclude that mergers result inhigher prices, potentially blunting savings achieved through managed care(Simpson and Shin 1998; Keeler, Melnick, and Zwanziger 1999). Otherstudies find that mergers lower prices, consistent with the thesis that they leadto economies of scale and the reduction of excess capacity (Connor andFeldman 1998; Connor, Feldman, and Dowd 1998). Various studies alsoreport conflicting findings about whether the profit-status of the two merginghospitals affects prices (see for example Lynk [1995] and responses byDranove and Ludwick [1999], Keeler, Melnick, and Zwanziger [1999], andSimpson and Shin [1998]).
Methodological differences between the studies may explain theseinconsistent results (Morrisey 2001). For example, studies use differentapproaches to measuring mergers and do not control for case mix, whichmay be correlated with increased system size. Studies also differ in termsof the time-period examined (i.e., specific years, cross-sectional ratherthan longitudinal data), examination of the effect of actual mergers as opposedto simulated ones, and the extent to which other organizational characteristicsof the merging hospitals (e.g., occupancy rates, level of expenses) areconsidered.
Less is known about the impact of vertical integration on hospitalcompetition and prices. Current thinking is that vertical consolidationbetween hospitals and physicians (or between insurers and providers) hasthe potential to enhance efficiency but also to enhance the market power ofhealth care organizations in markets with significant barriers to entry (Haas-Wilson and Gaynor 1998). There is a relative absence of empirical work,
Hospitals’ Negotiating Leverage with Health Plans 423
however, on the benefits and costs of different types of vertical integration (seeGreenberg 1998 for a case study).
There is still a great deal to learn about the impact of managed care onplan–hospital negotiations. Managed care and hospital markets continue toevolve at a rapid pace, yet much of our current knowledge is based on datafrom the mid-1990s or earlier. However, many quantitative data andmethodological challenges remain, limiting and slowing further research inthis area (Bernstein and Gauthier 2001).
DATA AND METHODS
This study utilizes data from the Community Tracking Study (CTS),specifically longitudinal case studies of 12 nationally representative commu-nities with more than 200,000 people. Since 1996, 50 to 90 semistructuredinterviews have been conducted every two years with health care leadersin each community (685 interviews in round one, 649 in round two, and895 in round three). The third round of CTS site visits took place betweenJune 2000 and March 2001. Further information about the CTS studydesign and data collection and analysis methods can be found in severalarticles (Lesser, Ginsburg, and Devers 2003; Ginsburg et al. 2000; Kemperet. al 1996).
Interview respondents most relevant for this paper include leaders ofhospitals, managed care plans, trade associations, and general marketobservers (e.g., local journalists and academics). In the case of hospitals, weidentified the three largest systems or freestanding hospitals, a safety netsystem or hospital if not included among the three largest, and a smallersystem or hospital (often in the surrounding suburban areas).5 In the foursmallest communities (less than 1.5 million people), we were able to interviewrepresentatives from all of the major systems or hospitals. In our medium- tolarge-sized markets, the four systems we interviewed typically controlled themajority of hospital market share.
The types of individuals we interviewed from systems and hospitalsincluded: chief executive officer (CEO), vice president for planning, directorof managed care contracting, director of physician–hospital integration, andmedical director.
Five types of managed care plans were targeted for study in eachcommunity: a large national plan, a large Blue Cross Blue Shield plan, a largelocal or regional plan, and two additional plans. Individuals we typically
424 HSR: Health Services Research 38:1, Part II (February 2003)

interviewed from each of these plans included: the chief executive officer(CEO), the medical director, and executives responsible for network develop-ment and contracting, marketing, Medicare, utilization or care management, andpharmacy.
Topics covered in all three rounds of interviews include: criteria plansuse to select hospitals for their networks; predominant type of paymentarrangement between plans and hospitals; general payment rate levels (e.g.,percent of Medicare) and trends (e.g., increasing or decreasing, by whatpercent); included or excluded services (e.g., mental health) and benefits (e.g.,pharmacy); other features of plan–hospital contract terms (e.g., existence ofall-product clauses); nature of plan–provider relationships, including contractdisputes; and, views about which market actors currently have the greatestmarket power.
Interview notes were written-up by the primary interviewers, frequentlywith the aid of an additional note-taker who accompanied them during theinterview (Lesser, Ginsburg, and Devers 2003). In all three rounds, syntheseswere written immediately following each site visit and were also available foranalysis. These syntheses were based on the raw interview data and provided asummary of key findings from the market.
In addition to the interview data and syntheses, secondary qualitativedata (e.g., local newspaper articles, annual reports from hospitals or plans)were used to track developments in the 12 markets.
Secondary quantitative data from InterStudy and the American HospitalAssociation are also used to obtain descriptive statistics on health plan andhospital market characteristics. We used this data to assess the magnitude ofchange in the plan and hospital markets since 1996. Finally, we compared thisdata with local market participants’ assessments of changes in plan andhospital market characteristics.
A variety of well-established techniques were used to draw and verifyconclusions from the raw interview and other qualitative data (Lesser,Ginsburg, and Devers 2003; Devers 1999; Miles and Huberman 1984).
There are four major strengths to this study design. First, no otherresearch has described the evolution of plan–hospital contracting over a five-year period in a nationally representative sample of markets. The 12 marketsvary on a variety dimensions and the study is recent, yet longitudinal in nature.Second, this research uses a broad definition of market power (i.e., increasedcontrol or influence over another organization in a key area) as well as whyand how an organization exercises market power. Third, the semistructuredinterviews help us better understand why and how hospitals’ negotiating
Hospitals’ Negotiating Leverage with Health Plans 425

leverage is changing. Finally, the study utilizes descriptive quantitative data,which provides greater insight than using qualitative data alone.
There are four weaknesses of the study. First, we do not have detailedinformation on specific plan–hospital contracts (including payment rates) andhospital costs over time. The absence of current, detailed information aboutplan–hospital contracts, payment rates, and hospital costs is a commonproblem in research in this substantive area (Bernstein and Gauthier 2001).However, the general information we collected about payment rates andcontract terms from knowledgeable and diverse interview respondentsallowed us to detect important changes in hospitals’ negotiating leverage.Second, we were unable to explain current variation across markets andwithin the hospital sector. We attempted to use qualitative comparativeanalysis (Ragin 1999) to identify combinations of market conditions that led tocontract disputes or higher payment increases in 2000–2001, but we werehampered by a number of data and technical problems.6 Third, and related,we were unable to quantitatively test whether and how changes over time inthree factors (i.e., the policy and purchasing context, the managed care planmarket, and hospital market) affect hospital market power. The number ofmarkets and hospitals in the study, as well as the absence of hospital data oncontracts and prices noted above, prevented such analysis. Finally, wetypically spoke with the largest systems and hospitals that are likely to havemore market power. Although we purposively sought out a smaller system orhospital, and interviewed other respondents with knowledge of hospitalsgenerally (e.g., plan executives responsible for network development andcontracting), we were unable to completely avoid this bias.
RESULTS
From ‘‘Contract Takers’’ to ‘‘Contract Makers or Breakers’’
In 1996, hospitals’ market leverage with plans was decreasing, and somewould argue at a historic low relative to its height during the fee-for-serviceyears. By all respondents’ accounts, hospitals were ‘‘contract takers.’’ Hospitalprices were flat or declining and hospitals were beginning to accept greaterfinancial risk from health plans. Two papers based on the CommunitySnapshots Project, the precursor of the Community Tracking Study, provide ahistorical description and record of hospitals decreasing market power justprior to this period (Duke 1996; Miller 1996).7
426 HSR: Health Services Research 38:1, Part II (February 2003)

Despite the significant downward pressure on hospital prices and newpayment arrangements, there were no major plan–provider contracting disputesreported in the CTS markets during our site visits in 1996–1997. We define plan–provider contracting disputes as extremely contentious (i.e., one or both sidesthreatens to terminate a contract or actually does so), prolonged, and sometimeshighly public. Hospitals felt that they had to sign unfavorable managed carecontracts because they feared exclusion from plan provider networks. Exclusionwould have had an immediate and measurable effect on hospitals, as well asuncertain long-term implications. Anticipating significant managed care growth,hospitals sought to learn more about how to function in such an environmentand to establish business relationships with growing managed care plans. Theyalso consolidated horizontally and vertically (with plans and physicians) in aneffort to improve their negotiating leverage (Kohn 2000).
Hospitals’ market power remained relatively weak during our secondround of site visits in 1998, despite increased consolidation. Some hospitalshad achieved ‘‘must-have’’ status in plan networks and increased theirnegotiating leverage, but most continued to experience flat or decliningpayment rates during this period (Lesser and Brewster 2001). Consolidationprimarily helped hospitals stave off deeper discounts and more unfavorablecontract terms. In addition, respondents did not report any instances ofplan–provider contract disputes. Many hospitals in the 12 CTS markets stillanticipated managed care growth and remained in a relatively defensivecontracting position. They also were preoccupied with implementinghorizontal and vertical integration strategies.
During the 2002–2001 site visits, a dramatic reversal in hospitals’negotiating leverage with plans was reported. Hospitals in 7 of the 12 CTSmarkets became ‘‘contract makers or breakers’’ rather than ‘‘takers.’’ Thesehospitals took very aggressive negotiating stances with managed care plans,frequently demanding price increases two to three times more than plansoffered and seeking other favorable contract changes as well. Hospitals alsoattempted to win consumer support via direct communication (e.g., letters,telephone hotlines, conversations with hospital employed or affiliatedphysicians) and public relations efforts. For the first time, hospitals were willingto terminate contracts, potentially disrupting patient care, unless their demandswere met. Table 1 indicates in which markets these contract disputes occurred,the number of plans and hospitals involved, and the general outcomes.
Several features of these plan–provider showdowns are worth noting.First, contract disputes occurred in all four of the large markets but were lesscommon in the medium and small markets. Although not explicitly
Hospitals’ Negotiating Leverage with Health Plans 427

commented on by respondents, possible reasons for this pattern include: therelatively larger number of plans and hospitals (i.e., more alternatives ifcontract negotiations failed); greater tension between plans and providers due
Table 1: Contract Disputes, 2000–2001
CTS Market
ContractDisputes(Yes/No)
No. of PlansInvolved
No. Systems orHospitalsInvolved Outcome(s)
Large Markets(Populationgreater than2.251 Million)
Boston Y 3 1 Rate increases——approximately9% per year
Phoenix Y 3 2 Rate increases——low doubledigits
‘‘Terminate then Renegotiate’’——approximately 3% per year
TerminationOrange County Y 14 1 ‘‘Terminate then Renegotiate’’
——Approximately mid double-digits
TerminationSeattle Y 3 3 Rate increases——approximately
8% per yearTermination
Medium Markets(Populationbetween 1.5 and2.251 Million)
Cleveland NIndianapolis NMiami Y 4 4 Rate increases——low to mid
double digitsNorthern New Jersey Y 1 1 Rate increases——approximately
9% per year
Small Markets(Population lessthan 1.5 million)
Greenville Y 2 2 Rate increases——low doubledigits
Lansing NLittle Rock NSyracuse N
Source: CTS site visit interviews, 2000–2001
428 HSR: Health Services Research 38:1, Part II (February 2003)
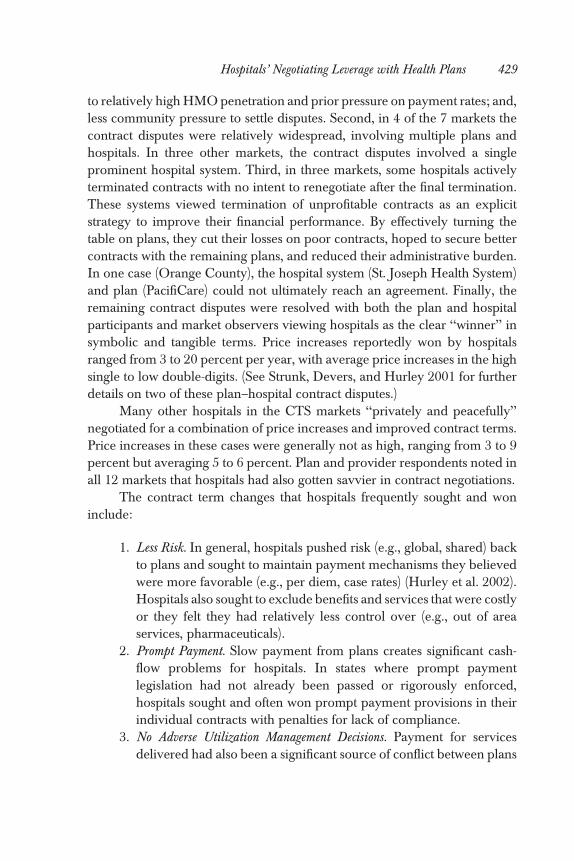
to relatively high HMO penetration and prior pressure on payment rates; and,less community pressure to settle disputes. Second, in 4 of the 7 markets thecontract disputes were relatively widespread, involving multiple plans andhospitals. In three other markets, the contract disputes involved a singleprominent hospital system. Third, in three markets, some hospitals activelyterminated contracts with no intent to renegotiate after the final termination.These systems viewed termination of unprofitable contracts as an explicitstrategy to improve their financial performance. By effectively turning thetable on plans, they cut their losses on poor contracts, hoped to secure bettercontracts with the remaining plans, and reduced their administrative burden.In one case (Orange County), the hospital system (St. Joseph Health System)and plan (PacifiCare) could not ultimately reach an agreement. Finally, theremaining contract disputes were resolved with both the plan and hospitalparticipants and market observers viewing hospitals as the clear ‘‘winner’’ insymbolic and tangible terms. Price increases reportedly won by hospitalsranged from 3 to 20 percent per year, with average price increases in the highsingle to low double-digits. (See Strunk, Devers, and Hurley 2001 for furtherdetails on two of these plan–hospital contract disputes.)
Many other hospitals in the CTS markets ‘‘privately and peacefully’’negotiated for a combination of price increases and improved contract terms.Price increases in these cases were generally not as high, ranging from 3 to 9percent but averaging 5 to 6 percent. Plan and provider respondents noted inall 12 markets that hospitals had also gotten savvier in contract negotiations.
The contract term changes that hospitals frequently sought and woninclude:
1. Less Risk. In general, hospitals pushed risk (e.g., global, shared) backto plans and sought to maintain payment mechanisms they believedwere more favorable (e.g., per diem, case rates) (Hurley et al. 2002).Hospitals also sought to exclude benefits and services that were costlyor they felt they had relatively less control over (e.g., out of areaservices, pharmaceuticals).
2. Prompt Payment. Slow payment from plans creates significant cash-flow problems for hospitals. In states where prompt paymentlegislation had not already been passed or rigorously enforced,hospitals sought and often won prompt payment provisions in theirindividual contracts with penalties for lack of compliance.
3. No Adverse Utilization Management Decisions. Payment for servicesdelivered had also been a significant source of conflict between plans
Hospitals’ Negotiating Leverage with Health Plans 429

and hospitals. As a result, hospitals sought and frequently won newcontract language that prohibited retroactive denials of claims or the‘‘downgrading’’ of inpatient days from a higher to a lower payingservice category.
4. Shorter or Longer Contract Length. Hospitals attempted to move awayfrom the commonly used 2- to 3-year contract duration. Some soughtgreater flexibility through year-to-year contracts while othersnegotiated payment rate increases for a 5- or 6-year period.
Two concluding interview questions asked of a subset of respondents(n5 228) in round three were: (1) ‘‘Which actors——purchasers, plans,providers, or consumers——currently have the greatest leverage in (specificmarket)?’’ and; (2) ‘‘How has the balance of power between these actorschanged over the last two years, if at all?’’
Table 2 summarizes the number and percent of respondents mentioningthat a particular group——purchasers, plans, providers (hospitals), or con-sumers——currently had greatest leverage in the market.8 As the table shows, 70percent of the respondents specifically stated that hospitals or providersgenerally (hospitals and physicians) currently have the greatest leverage in themarket. Plans were mentioned frequently also (51 percent), with somerespondents indicating that both plans and providers had power. Overall,however, respondents from different types of organizations noted thathospitals and providers had ‘‘momentum.’’ Purchasers and consumers weremuch less frequently mentioned as having leverage.
The following quotes provide a flavor of respondents’ answers.
Two years ago, plans had the greatest leverage. Now providers have organizedand there is a more level playing field. We have gotten some concessions.[Hospital respondent, P106: 45, 462–8]
The providers have prevailed over the last two years. [Benefit consultant, P246: 52,552–3]
Table 2: Group with Greatest Leverage in the Market
Respondents (N5228)No. Respondents
Mentioning Group% Respondents
Mentioning Group
Providers——Hospitals 166 70%Plans 121 51%Purchasers 43 18%Consumers 8 3%
Source: CTS site visit interviews, 2000–2001.
430 HSR: Health Services Research 38:1, Part II (February 2003)

Right now, providers are on top, winning the public relations battle. There is agrowing alliance between the people and the providers, and it is hard to beat thispolitically. It is also hard for the employers to step into the battle. [Employerrespondent, P242: 40, 507–17]
Power has shifted more toward the provider side, given the managed carebacklashyProviders are no longer fearful of being left behind if they are not partof a network. They are willing to say ‘‘no’’ to contractors, not willing to be rushedto get on board with managed care. This is different, especially compared to fiveyears ago. [Plan respondent, P18: 27, 299–305]
In sum, a significant shift in hospitals’ negotiating leverage took placebetween 1996 and 2000. Hospitals are more aggressively negotiating withplans, securing price increases and improved contract terms. In many of theCTS markets, these increases are well beyond what plans sought to pay, andwere sometimes achieved through contentious contract disputes.
Factors Explaining Change in Hospitals’ Increased Market Power
Key changes in three general areas noted by respondents directly or identifiedby comparing and contrasting interview responses from 1996–1997 to 2000–2001, explain increased hospital negotiating leverage since 1996. These threeareas are: the policy and purchasing context in which plan–hospitalnegotiations take place; the characteristics of the plan market; and thecharacteristics of the hospital market. Table 3 summarizes significant changesin each of these areas and their impact on hospitals’ negotiating leverage withplans.
Policy and Purchasing Context
Since 1996, three key changes in the policy and purchasing context haveoccurred that weakened managed care plans’ negotiating leverage withhospitals. Two of these three changes reflect the growing backlash againstmanaged care. First, managed care plans faced increased regulation (e.g., anywilling provider laws) at the state level (see Draper et al. 2002; Marsteller et al.1997) and the possibility of legislation at the federal level (i.e., patients’ bill ofrights). This legislative environment has reduced plans’ ability to selectivelycontract and to aggressively manage utilization, increasing hospitals’negotiating leverage with plans.
Second, employers were more sensitive to employees’ concerns aboutmanaged care and demanded plan products that offered greater consumerchoice (Trude et al. 2002; Christianson and Trude 2003). A tight labor market
Hospitals’ Negotiating Leverage with Health Plans 431

and rising corporate profits shifted employers’ attention from controlling coststo retaining employees by maintaining or improving their health insurancebenefits. During plan–provider contract disputes, employers either pressedplans to settle the dispute so employees’ health care was not disrupted orremained absent from the fray. This type of employer behavior is markedlydifferent from that in 1996, when employers were viewed as the primarydriver of plans’ aggressive cost-cutting strategies.
The third key change was in public programs (i.e., Medicare andMedicaid). Fewer beneficiaries than anticipated enrolled in the Medicare1Choice program and many private plans exited both the Medicare andMedicaid markets. Hospitals’ once faced the prospect of private managed careplans controlling the flow of an increasing number of public beneficiaries aswell as private, commercial enrollees but this was no longer the case by 2000.
Table 3: Key Changes Effecting Hospitals’ Negotiating Leverage with Plans,1996–2000
Increases——Hospitals’Leverage
Decreases——Hospitals’Leverage
Policy and Purchasing ContextHealth plan regulation XEmployer/employee demand for ‘‘Choice’’ XFlat or declining enrollment in Medicare andMedicaid managed care programs
X
Characteristics of Plan MarketLess HMO growth than anticipated XLess restrictive HMO Products: X
Less selective contractingLess risk-contractingLooser UM practices
Ability to absorb hospital payment rateincreases due to rising premiums
Xn
Plan consolidation X
Characteristics of Hospital MarketConsolidation XBrand name identity XPhysician integration XCapacity constraints located in keygeographic submarket
X
Financial pressure Xn
nIncreases hospital willingness to exercise leverage.
Source: CTS site visits, 1996–2001
432 HSR: Health Services Research 38:1, Part II (February 2003)

Characteristics of the Health Plan Market
Health plans responded to changes in the policy and purchasing context byoffering less-restrictive managed care products (Draper et al. 2002). As Table 4indicates, in four CTS markets (Seattle, Miami, Lansing, and Syracuse) HMOenrollment declined between 1996 and 2000, and grew most dramatically inmarkets with low HMO enrollment initially.9 In addition, HMO products aremore loosely managed than they were in 1996.
One of the central ways managed care plans became less restrictive wasby offering broad provider networks, which means less selective contractingwith providers by managed care plans. When asked what criteria plans use to
Table 4: Plan Market Characteristics
HMOPenetration
2000
% HMOPenetration
Change1996–2000
No.1 ofPlans2000
Change inNo. of Plans1996–2000
HMO2
HHI2000
% Change inHMO HHI1996–2000
Boston 43.1 16.8 9 � 3 2,600 � 10.3Northern NJ 31.5 49.3 9 � 4 1,800 � 5.3Orange
County34.7 16.3 18 � 2 1,400 127.3
Seattle 19.2 � 7.7 5 � 4 3,500 0Cleveland 30.6 54.5 15 � 1 1,300 � 31.6Indianapolis 21.9 8.4 11 13 2,300 14.5Miami 43.8 � 17.2 16 � 1 1,200 17.7Phoenix 34.7 4.8 8 � 1 1,300 0Greenville 11.2 100.0 6 0 4,800 � 18.7Lansing 33.4 � 15.4 5 � 1 4,900 153.1Little Rock 21.7 19.9 5 0 3,500 116.7Syracuse 15.5 � 13.9 6 � 1 3,000 � 6.7CTS Market
Average28.4 18 9.4 1.25 3,500 13.1
CTS MarketRange
11.2–43.8 (� 17.2)–(1100)
5–18 (� 4)–(13) 1,200–4,900 (� 1.6)–(153.1)
1The number of plans was adjusted from those reported by InterStudy Competitive Edge (11.1,July 1, 2000). Medicaid-only plans were excluded and subsidiaries of the same parent organizationwere combined.2Figures calculated from InterStudy Competitive Edge data (11.1, July 1, 2000, and 7.1, June 1997).They report an index of competition for each MSA that is 1-Herfindahl Hirschman Index (HHI).We subtracted the index of competition value from 1 to get the HHI. We were unable to adjust theBoston MSA figures to the CTS market area. A market with an HHI of less than 1,000 isconsidered unconcentrated; those between 1,000 and 1,800 are considered modestly concen-trated; and those greater than 1,800 are considered highly concentrated (U.S. Department ofJustice and Federal Trade Commission, ‘‘Horizontal Merger Guidelines.’’ Issued April 2, 1992;revised April 8, 1997. Section 1.5).
Hospitals’ Negotiating Leverage with Health Plans 433

select providers for their network in 2000–2001, respondents often stated, ‘‘noone is excluded.’’ Respondents noted plans’ increasing emphasis on widegeographic coverage and the fact that many HMO plan networks overlapsignificantly.
The inclusiveness of plan networks changed plan–hospital contractnegotiations and leverage in three significant ways. First, the threat ofexcluding a hospital if contract terms could not be agreed upon was lesscredible. A narrower hospital network would make the plan product lessattractive to purchasers and consumers, so plans had more of an incentive toinclude providers in the network. Second, even if the threat was credible,exclusion may have had less impact on the hospital overall because thepercentage of the hospitals’ admissions coming from a single plan may havebeen declining due to less selective contracting and broad provider networks.In addition, some hospital respondents reported they were paid more if apatient not covered under a contract was admitted to their hospital. Finally,hospitals began adjusting their pricing in light of the fact that managed careplans could no longer guarantee greater patient volume. Hospital respondentsrealized they had continued to give plans discounts despite plans’ reducedability to channel patients to their facilities.
A second key change in the plan market was rising premiums. Plans inthe 12 CTS markets were increasing premiums in the high single to lowdouble-digit percent range, allowing them to better tolerate hospital priceincreases if necessary. Hospital respondents viewed this period as anopportunity to press for reimbursement increases and argued that a significantportion of these relatively high premium increases should be used just to‘‘restore and re-set’’ what they characterized as low, unsustainable paymentrates.
The third key change in the health plan market noted by respondentswas consolidation in the health plan market. Unlike the two otherdevelopments in the health plan market, the decline in the number of planscan potentially curb hospitals’ negotiating leverage. Table 4 indicates that thenumber of operating HMOs declined in 9 of the 12 markets between 1996 and2000.10
However, the decline in the number of HMOs was generally notaccompanied by an increase in consolidation as measured by the HerfindahlHirschman Index (HHI).11 As the change in the last column of Table 3indicates, there was a substantial increase in HMO consolidation in only threemarkets (Orange County, Lansing, and Little Rock). The level of HMOconsolidation remained the same or declined in 7 of the 12 markets despite a
434 HSR: Health Services Research 38:1, Part II (February 2003)

number of plan exits. This is most likely due to the exit of plans with smallmarket shares from the markets.
Overall, developments in the plan market weakened plans’ negotiatingleverage with hospitals. As managed care products became less restrictive, theprevalence of selective contracting declined. In addition, competition in theplan market remained relatively stable or increased only slightly. Finally, theup-tick in plan premiums was viewed by hospitals as a critical opportunity tonegotiate reimbursement rate increases and plans were better able to absorbsuch increases if necessary.
Characteristics of the Hospital Market
During our site visits in 1996, hospitals were launching a number of strategiesto respond to the anticipated growth of managed care and strengthen theirnegotiating leverage. The concept of organized or integrated delivery systemsunderlay many of the specific strategies hospitals pursued (Shortell, Gillies,and Anderson, 1996). The assumption was that HMOs would become thepredominant type of insurance, as would several tools associated with it(selective contracting and capitation). As a result, freestanding hospitalsneeded to transform themselves from organizations providing acute careservices into systems capable of managing both financial risk and thecontinuum of care for a defined population of patients (e.g., covered lives). Torealize this vision, hospitals pursued horizontal and vertical integrationstrategies with other hospitals, physicians, and health care organizations (e.g.,health plans, nursing homes). These horizontal and vertical integrationstrategies also have the potential to increase hospitals’ market power.12
One of the key changes in the hospital sector since 1996 is the level ofconsolidation. In 1996, 17 mergers were underway in 10 CTS markets, and thevast majority of them (14) involved local not-for-profit hospitals (Lesser andBrewster 2001). Since that time, additional mergers and closures haveoccurred in the CTS markets. The number of systems operating in eachmarket is now quite small, with 3.5 hospital systems operating in each marketon average and a substantial number of all hospitals in the market participatingin these systems (see Table 5).
In contrast to the plan sector, the decline in the number of systems andhospitals operating in the market was accompanied by an increase in hospitalconcentration, as measured by the HHI. On average, the level of hospitalconsolidation increased by 34 percent. This relatively large increase ispartially because the hospital market was less consolidated than the plan
Hospitals’ Negotiating Leverage with Health Plans 435
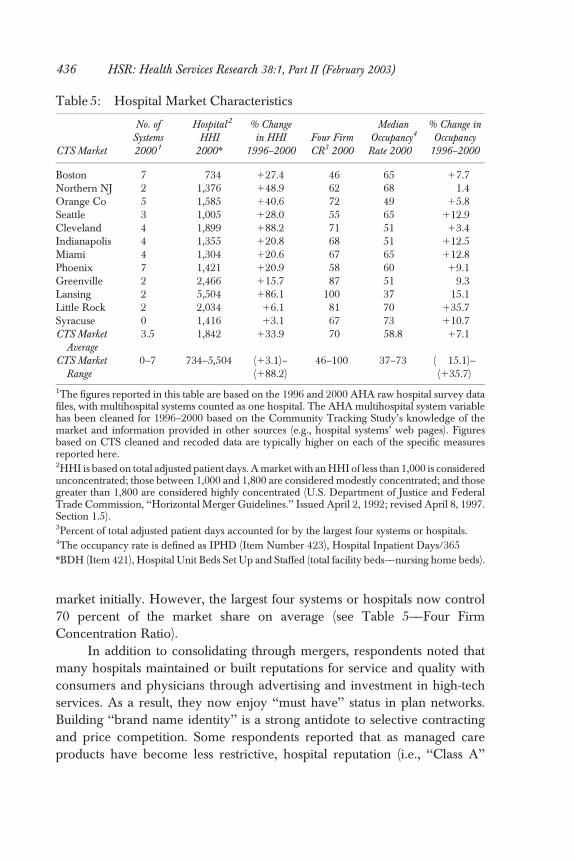
market initially. However, the largest four systems or hospitals now control70 percent of the market share on average (see Table 5——Four FirmConcentration Ratio).
In addition to consolidating through mergers, respondents noted thatmany hospitals maintained or built reputations for service and quality withconsumers and physicians through advertising and investment in high-techservices. As a result, they now enjoy ‘‘must have’’ status in plan networks.Building ‘‘brand name identity’’ is a strong antidote to selective contractingand price competition. Some respondents reported that as managed careproducts have become less restrictive, hospital reputation (i.e., ‘‘Class A’’
Table 5: Hospital Market Characteristics
CTS Market
No. ofSystems2000 1
Hospital2
HHI2000n
% Changein HHI
1996–2000Four FirmCR3 2000
MedianOccupancy4
Rate 2000
% Change inOccupancy
1996–2000
Boston 7 734 127.4 46 65 17.7Northern NJ 2 1,376 148.9 62 68 � 1.4Orange Co 5 1,585 140.6 72 49 15.8Seattle 3 1,005 128.0 55 65 112.9Cleveland 4 1,899 188.2 71 51 13.4Indianapolis 4 1,355 120.8 68 51 112.5Miami 4 1,304 120.6 67 65 112.8Phoenix 7 1,421 120.9 58 60 19.1Greenville 2 2,466 115.7 87 51 � 9.3Lansing 2 5,504 186.1 100 37 � 15.1Little Rock 2 2,034 16.1 81 70 135.7Syracuse 0 1,416 13.1 67 73 110.7CTS Market
Average3.5 1,842 133.9 70 58.8 17.1
CTS MarketRange
0–7 734–5,504 (13.1)–(188.2)
46–100 37–73 (� 15.1)–(135.7)
1The figures reported in this table are based on the 1996 and 2000 AHA raw hospital survey datafiles, with multihospital systems counted as one hospital. The AHA multihospital system variablehas been cleaned for 1996–2000 based on the Community Tracking Study’s knowledge of themarket and information provided in other sources (e.g., hospital systems’ web pages). Figuresbased on CTS cleaned and recoded data are typically higher on each of the specific measuresreported here.2HHI is based on total adjusted patient days. A market with an HHI of less than 1,000 is consideredunconcentrated; those between 1,000 and 1,800 are considered modestly concentrated; and thosegreater than 1,800 are considered highly concentrated (U.S. Department of Justice and FederalTrade Commission, ‘‘Horizontal Merger Guidelines.’’ Issued April 2, 1992; revised April 8, 1997.Section 1.5).3Percent of total adjusted patient days accounted for by the largest four systems or hospitals.4The occupancy rate is defined as IPHD (Item Number 423), Hospital Inpatient Days/365nBDH (Item 421), Hospital Unit Beds Set Up and Staffed (total facility beds——nursing home beds).
436 HSR: Health Services Research 38:1, Part II (February 2003)

versus ‘‘Class B’’ hospitals) has become more important since plan membersstill enjoy first dollar coverage regardless of which hospital they use (Devers,Brewster, and Casalino 2003).
Another key change was the level of hospitals’ vertical integration withphysicians (e.g., physician practice acquisition, formation of intermediaryorganizations such as physician–hospital organizations). Greater hospital–physician alignment strengthened hospitals’ negotiating leverage andweakened plans’ options. Many hospitals had implemented a range ofphysician-integration strategies, becoming a critical gateway for plans tophysicians in the market. In many of the contract disputes noted above, planswere negotiating with hospital–physician organizations for physician profes-sional services as well. In at least one case, the plan attempted to ‘‘divide andconquer’’ by contracting with physicians directly but the physicians remainedaligned with the hospital system. Although physician-integration strategiesoften have not achieved some of their intended goals (e.g., greater clinicalintegration), hospitals have retrenched them rather than abandon themcompletely (Lake et al. 2003). Concern about the impact of dissolvinghospital–physician organizations on the hospitals’ negotiating leverage andcompetitive position has motivated hospitals to maintain these physicianorganizations and relationships.
In addition to horizontal and vertical integration and strengtheningreputation, two other developments in the hospital sector affected hospitals’willingness and ability to exercise leverage in negotiations with plans. The firstwas mounting financial pressure, which prompted hospitals to test theirnegotiating leverage with private plans. Cutbacks in Medicare reimbursementrates that resulted from the Balanced Budget Act of 1997 (BBA) were beingimplemented and limited hospitals’ ability to shift costs to public payers. At thesame time, hospital costs were rising due to newly emerging labor shortages,new technologies (including investment in information systems), andpharmaceuticals. Mounting financial pressure was one of the primary reasonsrespondents gave for hospitals’ more recent, aggressive negotiating stances.Several respondents noted that the hospital sector had been relativelyconsolidated (horizontally and vertically) for some time, but systems had notpreviously attempted to ‘‘flex their muscle.’’ One hospital respondentarticulated the sentiment well, noting ‘‘[h]ospitals shook out of theircomplacency and got tough.’’
Second, hospital capacity constraints reportedly developed in somemarkets and submarkets. The most visible sign of capacity constraintswas the increasing frequency of emergency room diversions, however, these
Hospitals’ Negotiating Leverage with Health Plans 437

constraints exist in other hospital departments and units because of priordownsizing and reconfiguration and current labor force shortages (Brewster,Rudell, and Lesser 2001).13 Secondary quantitative data from AHA suggeststhat hospital capacity is tightening but does not fully support interviewrespondents’ assessments. As Table 5 shows, the median hospital occupancyrate remained relatively low in the 12 markets (58.8 percent), although it hadincreased in 9 of the 12 CTS markets between 1996 and 2000. However, theserates may not fully reflect recent market developments (e.g., hospital laborshortages) that may restrict hospitals’ ability to utilize existing capacity, orvariation within markets (i.e., hospitals with virtual monopolies in geographicsubmarkets and high occupancy). For example, the low median occupancyrate in Lansing (37 percent) reflects the presence of several small ruralhospitals with extremely low occupancy (e.g., 26 percent).
DISCUSSION
While there are a number of limitations to this research, our findings stronglysuggest that many hospitals are asserting their power in local markets acrossthe nation, a dramatic reversal from their market position when the studybegan in 1996. In addition, our research suggests that a variety of factors havechanged and converged over the past five years to improve hospitals’ marketpower (see Table 3).
Results of this study are consistent with existing literature on the impactof HMO penetration and selective contracting on hospital prices, although thedirection of change has reversed. As HMO enrollment and selectivecontracting decreased, and broad provider networks have become the norm,hospital prices have risen. This trend seems to hold even in the eight marketswhere the HMO market is highly consolidated.
There has been much debate as to whether horizontal consolidation inhospital markets leads to higher prices, particularly among nonprofit hospitals.Our findings suggest that hospital mergers result in higher payment rates,although we cannot control for all the confounding factors, including risinghospital costs. Many respondents indicated that consolidation was one of themost significant changes since round one, and that without the current level ofconsolidation, hospitals would not have secured such high payment rateincreases from plans.
Vertically integrated hospitals and systems, particularly those that haveformed strong alliances with physicians, also appear to be able to exercise
438 HSR: Health Services Research 38:1, Part II (February 2003)

greater market power. Joint hospital–physician contracting and practiceownership prevents plans from undermining hospitals’ negotiating leverageby going directly to physicians. In addition, physicians are the key link topatients and consumers, so their allegiance with hospitals in contract disputesis critical.
Tight hospital capacity due to hospital staff shortages or location inimportant geographic submarkets also appears to increase hospitals’ marketpower. The threat of a plan excluding a hospital or system from its networkand channeling a large volume of patients elsewhere is less credible undersuch conditions.
Finally, mounting financial pressure within the hospital sector spurredhospitals to test their market power with private plans. Hospitals have beenunder financial pressure for some time. However, over the past two years theyexperienced declining margins or losses because of flat or decliningreimbursement rates from both private and public payers while facing risingcosts. As a result, they attempted to aggressively negotiate with plans anddiscovered their market power.
One respondent summarized the shift in hospital strategies by stating,‘‘we’ve gotten about all we can out of cost-reduction strategies. We have to turnto revenue enhancement strategies.’’ As the prevalence of contract disputesand terminations indicates, revenue-enhancing strategies can include nego-tiating higher payment rates, more favorable contract terms, or termination.Moreover, as hospitals ‘‘win’’ these disputes and survive terminations, theymay be emboldened to continue taking aggressive stances in contractnegotiations. Other hospitals may also attempt to follow these hospitals’leads, although they might not have the same ability to exercise market poweras those that have been successful to date. As noted, there is some variation inhospitals’ ability to exercise market power across and within markets.
The short-term implications of these findings for policymakers are clear.Increased hospital market power will drive hospital expenditures higher andfurther reduce enrollment in more tightly managed HMO products.A significant portion of managed care plan savings previously were generatedfrom ‘‘gutting the hospital,’’ specifically reducing hospital reimbursement ratesand shifting care to other settings (Reinhardt 1996). Now, with increasedpressure from hospitals, plans may have to raise their premiums to employersfurther or shift more of the burden onto employees, both of which make theplan and product less popular. While employers want to maintain broadchoice and access for employees, someone needs to pay for it. Plan–providercontract disputes are also likely to continue occurring in the short term,
Hospitals’ Negotiating Leverage with Health Plans 439
resulting in consumer concerns about access to providers of choice andcontinuity of care (see Short, Mays, and Lake 2001 on the impact of plannetwork instability for consumers). Plans now operating in a very differentmarket context than in 1996, must determine how to respond. Contractdisputes and terminations can result in membership losses and negativepublicity, but the price of peace can also be very costly.
The long-term implications of hospitals’ increasing market power areless clear. While the level of hospital consolidation is unlikely to decrease, thefactors outlined in Table 3 may change and new ones may emerge. Threefactors are likely to have a significant impact on whether hospital marketpower continues to increase in the future. The first is purchasers’ response torising premiums, in particular whether their distaste for restrictive managedcare provider networks will continue in the face of double-digit premiumincreases. The second factor is plans’ response to increased hospital leverage,particularly the viability of ‘‘tiered network’’ products. Based on the sameprinciple as three-tier pharmaceutical benefits, plans in two CTS markets(Boston, Orange County) announced plans to offer plan products with‘‘tiered’’ hospital networks, requiring consumers to pay part of added cost forgoing to a higher cost, and perhaps higher quality, hospital. The third factor isprivate purchasers’ and policymakers’ reaction to hospitals’ aggressivenegotiating tactics over time. Some employers and purchasing groups arealready attempting to take steps to minimize the disruption of care toconsumers when contract disputes occur. If these approaches are not effective,state and federal policymakers may take other steps to curb hospitals’ marketpower or prevent further hospital consolidation (Bazzoli and Luft 1998;Hellinger 1998).
These findings suggest a number of fruitful areas for further quantitative,qualitative, and mixed methods research. First, recent studies of the impact ofplan consolidation and mix of HMOs and other managed care plan products(e.g., PPOs) on plan–hospital negotiations would be extremely valuable.Similarly, recent studies of the impact of horizontal and vertical integration inthe hospital industry are much needed. Second, further research on thevariation between and within markets is needed. Although this researchstrongly suggests that the general trend between 1996 and 2000 was increasedhospital market power, some hospitals continue to have little negotiatingleverage. The factors outlined in this paper, and Table 3, suggest dimensionsresearchers might consider when examining variation between markets aswell as over time. Third, additional longitudinal studies of hospital–plancontracting are needed. A relatively small number of large plans and
440 HSR: Health Services Research 38:1, Part II (February 2003)

integrated systems (i.e., oligopolies) are now interacting repeatedly in localmarkets, suggesting the need for empirical case studies that draw on othertheories besides neoclassical economics (Robinson 2001). Given theimportant implications of plan–provider contracting for policymakers andconsumers, further research in this area is needed.
NOTES
1. We use the terms spending, expenses, and expenditures to refer to the total amountspent on health or hospital care. Hospital costs to refer to what it costs the hospitalto provide the service.
2. We use the term plans to refer to managed care plans specifically throughout themanuscript unless otherwise noted. We also use the terms market power andnegotiating leverage interchangeably, since we focus on hospitals’ ability toexercise market power in contract negotiations.
3. This sociological definition highlights why and how an organization exercisesmarket power, as well as the outcome (i.e., increased control or influence overanother organization in a key area). As such, this definition of market power isbroader than those used in economics, which focus primarily on the ability of anorganization to influence price. For example, Carlton and Perloff (1994) definemarket power as the ability of a firm to charge a price above that which wouldprevail under perfect competition, usually taken to be marginal cost.
4. We use the terms price and payment rate(s) interchangeably to refer to the dollaramount(s) at which hospitals agree to provide specific services to plans and theirmembers, except when reviewing the literature that distinguishes between them.We recognize that actual payment (i.e., what the hospital is ultimately paid) mayvary from the negotiated price or payment rate due to differences in contractinterpretation and enforcement, but do not make this distinction throughout thepaper.
5. Overall, 47.3 percent of all hospitals in the 12 CTS markets are members of asystem, which is significantly below the national average of markets of similar size(i.e., more than 250,000 which is the closest census level comparison group to theCTS markets that are representative of markets with more than 200,000 people).Nationally, 59.8 percent of all hospitals in markets with more than 250,000 peopleare in systems. However, the sample of hospitals in the 12 CTS markets isrepresentative of hospitals found in similar size markets on a variety of otherimportant dimensions, including: urban/rural, bed size, for-profit/nonprofit, andteaching/nonteaching.
6. Further information about these data and technical problems are available fromthe corresponding author upon request.
7. Only four of the communities in the Snapshot project are part of the CommunityTracking Study (Boston, MA; Indianapolis, IN; Orange County, CA; southFlorida, now Miami). However, these papers generally capture hospitals’ marketposition relative to plans at the time.
Hospitals’ Negotiating Leverage with Health Plans 441

8. The total number of responses (n5 338) is more than the total number of interviewrespondents answering the question (n5 228) because some respondents indicatedthat more than one group had power (i.e., purchasers and plans, plans andhospitals) or power between two groups was equal. When a respondent stated thatmore than one group had power, or that power between two groups was equal,both groups were counted.
9. This trend is consistent with national survey data that shows that HMO enrollmentdeclined from 29 percent in 2000 to 23 percent in 2001 (Kaiser Family Foundationand Health Education and Research Trust 2001).
10. The HMOs are most important for this paper. However, it is important to note thatthe number of plans in the market, and the level of plan consolidation, may varywhen other types of insurers and plan products (e.g., indemnity and PPO) areconsidered.
11. The Herfindahl Hirshman Index ranges from 0 to 10,000, with zero representing aperfectly competitive market and 10,000 representing a monopoly. A market witha HHI of less than 1,000 is considered unconcentrated; those between 1,000 and1,800 are considered modestly concentrated; and those greater than 1,800 areconsidered highly concentrated (U.S. Department of Justice and Federal TradeCommission, Horizontal Merger Guidelines, Issued April 2, 1992; revised April 8,1997. Section 1.5)
12. See Dranove, Simon, and White (2002) on consolidation in the hospital sectorbetween 1981 and 1994 and the role that managed care played in thatconsolidation as well as the commentary by Vistnes (2002) on the strengths andlimits of the findings and the policy implications.
13. Other recent reports by the Health Care Advisory Board (2001a; 2001b) suggestthat capacity constraints are occurring nationally.
ACKNOWLEDGMENTS
The authors thank the interview respondents for their time and Paul Ginsburg,Cara Lesser, and the anonymous reviewers for their valuable comments onthis manuscript.
REFERENCES
Agency for Healthcare Research and Quality. 2000. Distribution of Health Care ExpensesMedical Expenditure Panel Survey (MEPS) Highlights no. 11. Publicationno. 00-0024. Rockville, MD: Agency for Healthcare Research and Quality.
American Hospital Association. 1996 and 2000. Annual Survey of Hospitals Database.Chicago: American Hospital Association.
442 HSR: Health Services Research 38:1, Part II (February 2003)
Bamezai, A., J. Zwanziger, G. A. Melnick, and J. M. Mann. 1999. ‘‘Price Competitionand Hospital Cost Growth in the United States (1989–1994).’’ Health Economics8 (3): 233–43.
Bazzoli, G. J., and H. S. Luft, eds. 1998. ‘‘Examining the Role of Regulation inan Evolving Health Care Marketplace.’’ Health Services Research 33 (5, part 2):1403–1562.
Benko, L. B., and D. Bellandi. 2001. ‘‘The Rough and Tumble of It: Hospitals FlexingTheir Muscles in Contract Disputes with Insurers.’’ Modern Healthcare, specialreport, March 19.
Berstein, A. B., and A. K. Gauthier, eds. 2001. ‘‘Data Needs for Studies of Competitionin Market Areas.’’ Health Services Research 36 (1, part 2): 177–308.
Brewster, L., L. Rudell, and C. Lesser. 2001. Emergency Room Diversions: A Symptom ofHospitals under Stress. Issue brief no. 38. Washington, DC: Center for StudyingHealth System Change.
Carlton, D. W., and J. M. Perloff, eds. 1997. Modern Industrial Organization. New York:HarperCollins.
Christianson, J., and S. Trude. 2003. ‘‘Managing Costs, Managing Benefits: The Impactof Employer Decisions on Local Health Care Markets.’’ Health Services Research38 (1, part 2): 355–71.
Connor, R. A., and R. D. Feldman. 1988. The Effects of Horizontal Mergers on NonmergingHospitals, pp. 164–91. Washington, DC: AEI Press.
Connor, R. A., R. D. Feldman, and B. E. Dowd. 1998. ‘‘The Effects of MarketConcentration and Horizontal Mergers on Hospital Costs and Prices.’’International Journal of the Economics of Business 5 (2): 159–80.
Devers, K. J. 1999. ‘‘How Will We Know ‘Good’ Qualitative Research When We SeeIt?: Beginning the Dialogue in Health Services Research.’’ Health Services Research34 (5, part 2): 1153–89.
Devers, K. J., L. Brewster, and L. Casalino. 2003. ‘‘Changes in Hospital CompetitiveStrategy: A New Medical Arms Race?’’ Health Services Research 38 (1, part 2):445–86.
Devers, K. J., C. Lesser, B. Strunk, and A. Short. Under review. ‘‘Managing andAnalyzing Qualitative Data: Practical Lessons from the Community TrackingStudy Site Visits.’’
Dranove, D., and R. Ludwick. 1999. ‘‘Competition and Pricing in NonprofitHospitals: A Reassessment of Lynk’s Analysis.’’ Journal of Health Economics 18(1): 87–98.
Dranove, D., C. J. Simon, and W. D. White. 2002. ‘‘Is Managed Care Leadingto Consolidation in Health-care Markets.’’ Health Services Research 37 (3):573–94.
Draper, D., R. Hurley, C. Lesser, and B. Strunk. 2002. ‘‘The Changing Face ofManaged Care.’’ Health Affairs 21 (1): 11–23.
Duke, K. S. 1996. ‘‘Hospitals in a Changing Health Care System.’’ Health Affairs 15 (2):49–61.
Emerson, R. M. 1962. ‘‘Power–Dependence Relations.’’ American Sociological Review27 (1): 31–41.
Hospitals’ Negotiating Leverage with Health Plans 443

Feldman, R., H. C. Chan, J. Kralewski, B. Dowd, and J. Shapiro. 1990. ‘‘Effects ofHMOs on the Creation of Competitive Markets for Hospital Services.’’ Journal ofHealth Economics 9 (2): 207–22.
Gaskin, D. J., and J. Hadley. 1997. ‘‘The Impact of HMO Penetration on the Rate ofHospital Cost Inflation, 1985–1993.’’ Inquiry 34 (3): 205–16.
Ginsburg, P. B., P. Kemper, R. Baxter, and L. T. Kohn. 2000. ‘‘The CommunityTracking Study Analyses of Market Change: Introduction.’’ Health ServicesResearch 35 (1, part 1): 7–10.
Greenberg, W. 1998. ‘‘Marshfield Clinic, Physician Networks, and the Exercise ofMonopoly Power.’’ Health Services Research 33 (5, part 2): 1461–76.
Haas-Wilson, D., and M. Gaynor. 1998. ‘‘Increasing Consolidation in HealthcareMarkets: What Are the Antitrust Policy Implications?’’ Health Services Research33 (5, part 2): 1403–19.
Health Care Advisory Board. 2001a. The New Economics of Care: Briefing for the Board andHealth System. Publication number HCB-100-108 Washington, DC.
Health Care Advisory Board. 2001b. A Delicate Balance: Managing the InpatientEnterprise for Profitable Growth. Publication number HCB-100-107 Washington,DC.
Hellinger, F. J. 1998. ‘‘Antitrust Enforcement in the Healthcare Industry: TheExpanding Scope of State Activity.’’ Health Services Research 33 (5, part 2):1477–94.
Kaiser Family Foundation and Health Education and Research Trust. 2001. EmployerSurvey of Benefits. Menlo Park, CA and Chicago: Henry J. Kaiser FamilyFoundation and Health Research and Educational Trust.
Keeler, E. B., G. Melnick, and J. Zwanziger. 1999. ‘‘The Changing Effects ofCompetition on Non-profit and For-profit Hospital Pricing Behavior.’’ Journal ofHealth Economics 18 (1): 69–86.
Kemper, P., D. Blumenthal, J. J. Corrigan, P. J. Cunningham, S. M. Felt, J. J. Grossman,L. T. Kohn, C. E. Metcalf, R. F. St.Peter, R. C. Strouse, and P. B. Ginsburg.1996. ‘‘The Design of the Community Tracking Study: A LongitudinalStudy of Health System Change and Its Effects on People.’’ Inquiry 33 (2):195–206.
Kohn, L. T. ‘‘Organizing and Managing Care in a Changing Health System.’’ HealthServices Research 35 (1, part 1): 37–52.
Lake, T., K. Devers, L. Brewster, and L. Casalino. 2003. ‘‘Something Old, SomethingNew: Recent Developments in Hospital–Physician Relationships.’’ HealthServices Research 38 (1, part 2): 469–86.
Lesser, C., and L. R. Brewster. 2001. ‘‘Hospital Mergers and Their Impact on LocalCommunities.’’ In Understanding Health System Change, edited by L. L. Wolf,pp. 19–36. Washington, DC: Health Administration Press.
Lesser, C., P. Ginsburg, and K. Devers. 2003. ‘‘The End of an Era: What Became ofthe ‘Managed Care Revolution’ in 2001?’’ Health Services Research 38 (1, part 2):333–56.
Levit, K., C. Smith, C. Cowan, H. Lazenby, and A. Martin. 2002. ‘‘Inflation SpursHealth Spending in 2000.’’ Health Affairs 21 (1): 172–81.
444 HSR: Health Services Research 38:1, Part II (February 2003)

Lynk, W. J. 1995. ‘‘Nonprofit Hospital Mergers and the Exercise of Market Power.’’Journal of Law and Economics 38 (2): 437–61.
Marsteller, J. A., R. R. Bovbjerg, L. Nichols, and D. K. Verrilli. 1997. ‘‘The Resurgenceof Selective Contracting Restrictions.’’ Journal of Health Policy, Politics, and Law22 (5): 1133–89.
Melnick, G. A., and J. Zwanziger. 1988. ‘‘Hospital Behavior under Competition andCost-Containment Policies: The California Experience, 1980 to 1985.’’ Journal ofthe American Medical Association 260 (18): 2669–75.
Melnick, G. A., J. Zwanziger, A. Bamezai, and R. Pattison. 1992. ‘‘The Effects of MarketStructure and Bargaining Position on Hospital Prices.’’ Journal of the AmericanMedical Association 260 (18): 2669–75.
Miles, M. B., and A. M. Huberman. 1994. Qualitative Data Analysis, 2d ed. ThousandOaks, CA: Sage.
Miller, R. H. 1996. ‘‘Competition in the Health System: Good News and Bad News.’’Health Affairs 15 (2): 107–20.
——————. 1996. ‘‘Health System Integration: A Means to an End.’’ Health Affairs 15 (2):92–106.
Morrisey, M. A. 2001. ‘‘Competition in Hospital and Health Insurance Markets: AReview and Research Agenda.’’ Health Services Research 36 (1, part 2): 191–221.
Muhr, T. 1997. ATLAS.ti: Visual Qualitative Data Analysis Management and Model Building.Berlin: Scientific Software Development.
Ragin, C. 1999. ‘‘Using Qualitative Comparative Analysis to Study Causal Complex-ity.’’ Health Services Research 34 (5, part 2): 1225–40.
Reinhardt, U. E. 1996. ‘‘Spending More through ‘Cost Control’: Our Obsessive Questto Get the Hospital.’’ Health Affairs 15 (2): 145–54.
Robinson, J. C. 2001. ‘‘Organizational Economics and Health Care Markets.’’ HealthServices Research 36 (1, part 2): 177–89.
Scott, W. R. 1987. Organizations: Rational, Natural, and Open Systems, 2d ed. EnglewoodCliffs, NJ: Prentice-Hall.
Short, A., G. Mays, and T. Lake. 2001. Provider Network Instability: Implications for Choice,Costs, and Continuity of Care. Issue brief no. 39. Washington, DC: Center forStudying Health System Change.
Shortell, S. M., R. Gillies, and D. A. Anderson. 1996. Remaking Health Care in America:Building Organized Delivery Systems. San Francisco, CA: Jossey-Bass.
Simpson, J., and R. Shin. 1998. ‘‘Do Nonprofit Hospitals Exercise Market Power?’’International Journal of the Economics of Business 5 (2): 141–58.
Strunk, B., P. Ginsburg, and J. Gabel. 2001. Tracking Health Care Costs: Hospital Care KeyCost Driver in 2000. Data bulletin no. 21 revised. Washington, DC: Center forStudying Health System Change.
Strunk, B., K. Devers, and R. Hurley. 2001. Health Plan–Provider Showdowns onthe Rise. Issue brief no. 40. Washington, DC: Center for Studying Health SystemChange.
Trude, S., J. Christianson, C. Lesser, C. Watts, and A. Benoit. 2002. ‘‘Employer-Sponsored Health Insurance: Pressing Problems, Incremental Changes.’’ HealthAffairs 21 (1): 66–75.
Hospitals’ Negotiating Leverage with Health Plans 445

U.S. Department of Justice and Federal Trade Commission. 1997. Horizontal MergerGuidelines. Issued April 2, 1992; revised April 8, 1997. Section 1.5. Washington,DC: U.S. Department of Justice and Federal Trade Commission.
Vistnes, G. 2002. ‘‘Commentary on ‘Is Managed Care Leading to Consolidation inHealth-care Markets?’.’’ Health Services Research 37 (3): 595–609.
Zwanziger, J., and A. Meirowitz. 1998. ‘‘Strategic Factors in Hospital Selection forHMO and PPO Networks.’’ In Managed Care and Changing Health Care Markets,edited by M. A. Morrisey, pp. 77–94. Washington, DC: AEI Press.
446 HSR: Health Services Research 38:1, Part II (February 2003)