HOSPITALITY PROPERTY FUND · 2018-05-11 · 1 September 2016) increased the portfolio value to over...
152
INTEGRATED ANNUAL REPORT 2016
Transcript of HOSPITALITY PROPERTY FUND · 2018-05-11 · 1 September 2016) increased the portfolio value to over...

HO
SPIT
ALIT
Y P
RO
PER
TY
FUN
D IN
TEG
RAT
ED A
NN
UA
L REPO
RT FO
R THE YEAR EN
DED
30 JUN
E 2016
INTEGRATED ANNUAL REPORT
2016

The Board acknowledges its responsibility for the preparation and the integrity of the integrated annual report (“IAR”). The report conforms to the requirements of the Companies Act, 71 of 2008 and the JSE Limited Listings Requirements. The International Integrated Reporting Framework (“IRF”) has been used as a guide to structure the report. King III has also been applied. The annual financial statements (pages 67 to 132), which comply with the International Financial Reporting Standards were audited by KPMG Inc. Their unqualified audit report can be found on page 75 to 77.
In line with the IRF on materiality, the report includes all such information about matters that substantively affect the Company’s ability to create and sustain value over the short-, medium- and long- term.
Hospitality continues to improve and refine its IAR reporting to ensure that the information remains relevant to all stakeholders. The aim is to provide an integrated view of the Company’s strategy and business model, as well as the underlying value drivers in order for all stakeholders to monitor progress against strategic objectives.
As the only specialised hotel Real Estate Investment Trust (“REIT”) in South Africa, Hospitality’s performance is directly impacted by real estate fundamentals as well as the state of the hospitality and leisure market, and accordingly it has provided commentary on both sectors.
The 2016 report includes discussions relating to the REIT capital restructure, the restructure of the Company’s dual-class share capital structure to a single-class share capital structure and the Tsogo transaction, all of which place the Company’s on a stronger footing to deliver on its strategic objectives going forward.
SCOPE OF THIS REPORT
The report once again provides a sensitivity analysis to changing occupancy, room rates and profitability margins. A detailed review of risks facing the Company, presents further insights to stakeholders, including the current and planned controls to manage these risks.
The report includes commentary on Hospitality’s operational performance in the business environment and its delivery on growth strategies.
The “social” commentary discusses its impact on all stakeholders comprising Hospitality’s management and employees, suppliers, customers and shareholders as well as the communities in which its hotels and resorts conduct their business.
The “environmental” commentary outlines the physical environment in which the hotels and resorts operate. “Economic and financial” commentaries provide an overview of the Company’s portfolio, which aims to deliver positive returns for shareholders and bondholders.
This 2016 IAR provides a transparent account of the Company’s activities against the reality of the business environment, whilst disclosing new and proactive initiatives that have been implemented to create value for all stakeholders and to deliver a sustainable business, which is a material contributor to the property investment and hospitality sectors in South Africa.
This integrated annual report covers the activities of Hospitality Property Fund Limited (“Hospitality”, “the Company” or “the Fund”) during the financial year ended 30 June 2016.
Arabella Hotel and Spa, Kleinmond
HOSPITALITY PROPERTY FUND INTEGRATED ANNUAL REPORT 2016IFC
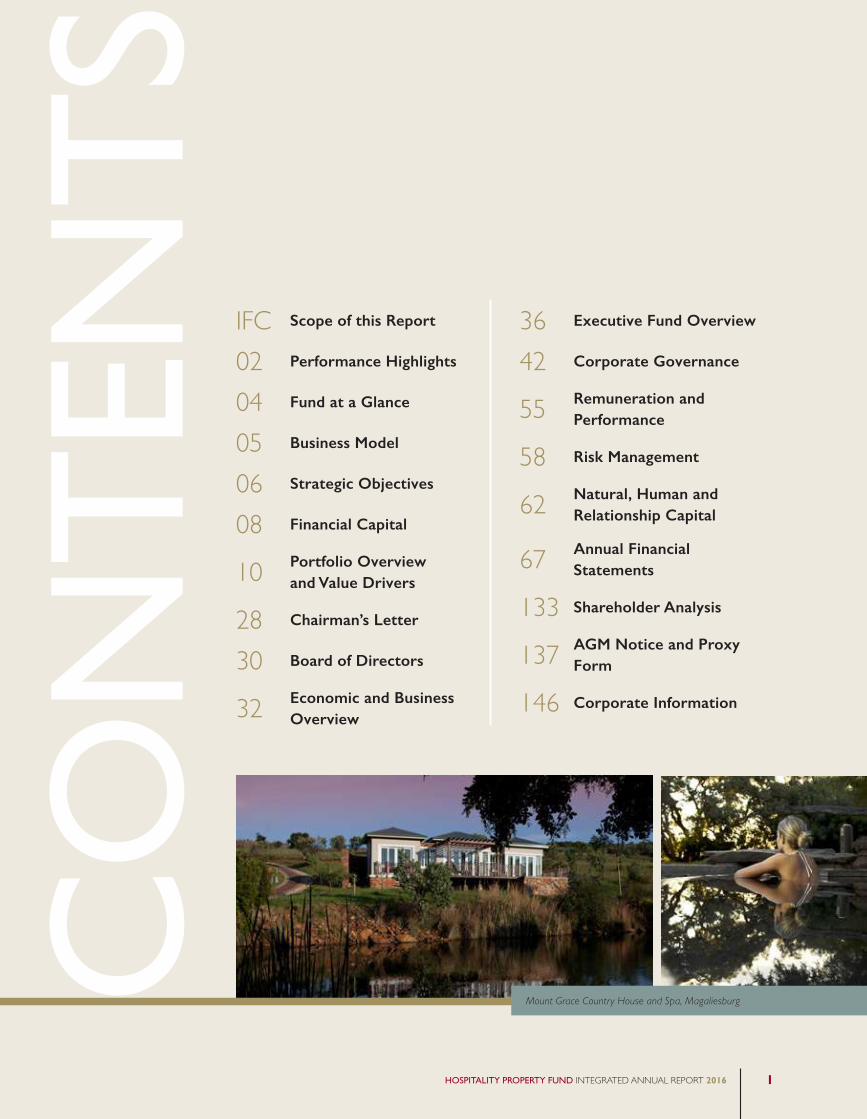
IFC Scope of this Report
02 Performance Highlights
04 Fund at a Glance
05 Business Model
06 Strategic Objectives
08 Financial Capital
10 Portfolio Overview and Value Drivers
28 Chairman’s Letter
30 Board of Directors
32 Economic and Business Overview
CO
NT
ENT
S36 Executive Fund Overview
42 Corporate Governance
55 Remuneration and Performance
58 Risk Management
62 Natural, Human and Relationship Capital
67 Annual Financial Statements
133 Shareholder Analysis
137 AGM Notice and Proxy Form
146 Corporate Information
Mount Grace Country House and Spa, Magaliesburg
HOSPITALITY PROPERTY FUND INTEGRATED ANNUAL REPORT 2016 1

PERFORMANCE HIGHLIGHTS
ADR (AVERAGE DAILY RATE (R))(REFER TO NOTES 1 AND 2)
0
300
600
900
1 200
1 500
1211 13 14 15 16
913 97
1
1 02
0 1 16
2
1 23
7
1 45
7
OCCUPANCY % (REFER TO NOTES 1 AND 2)
0
10
20
30
40
50
60
70
80
1211 13 14 15 16
51
57
60 61 62
69
31%Ahead 37% of the industry average
REVPAR GROWTH OF
THE WESTINLocation: CAPE TOWN
Grading: LUXURYNo. of rooms:
483Valuation:
R1 626 000 000
HOSPITALITY PROPERTY FUND INTEGRATED ANNUAL REPORT 20162
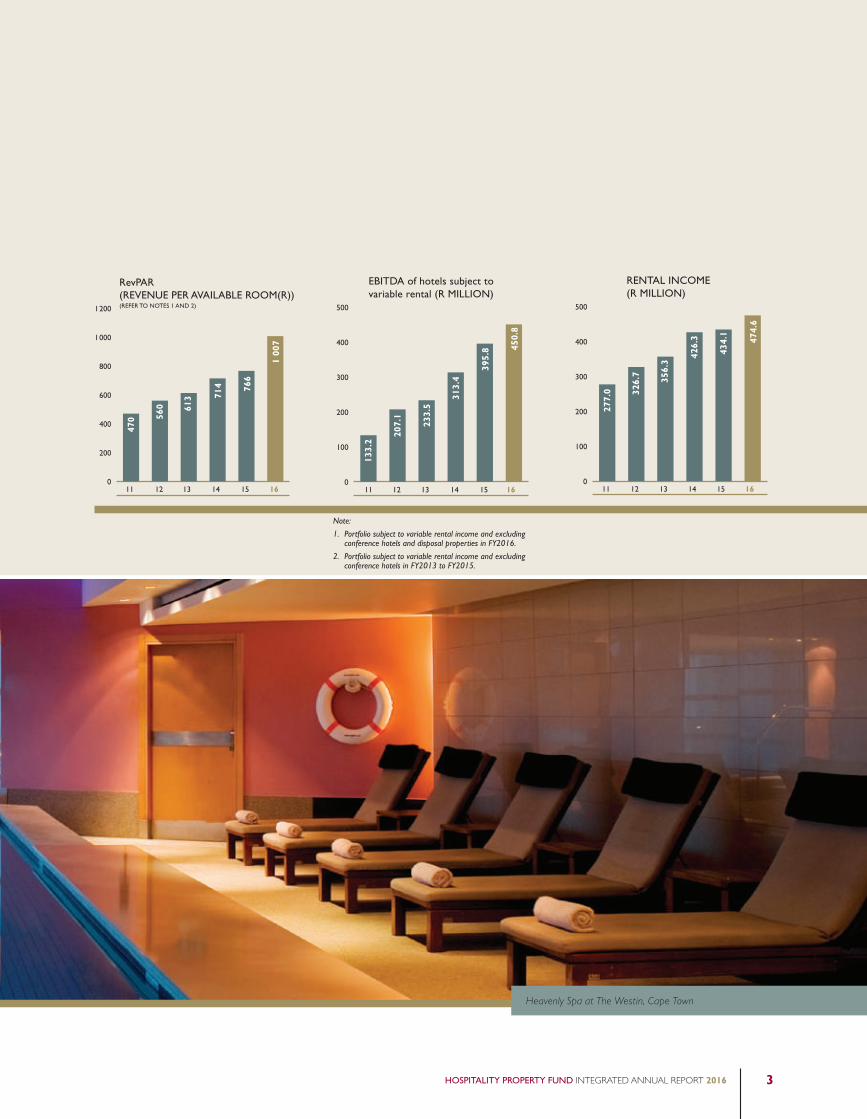
RENTAL INCOME (R MILLION)
0
100
200
300
400
500
1211 13 14 15 16
277.
0 326.
7
356.
3
426.
3
434.
1
474.
6
RevPAR (REVENUE PER AVAILABLE ROOM(R))(REFER TO NOTES 1 AND 2)
0
200
400
600
800
1 000
1 200
1211 13 14 15 16
470 56
0 613 71
4 766
1 00
7EBITDA of hotels subject to variable rental (R MILLION)
0
100
200
300
400
500
1211 13 14 15 16
133.
2
207.
1
233.
5
313.
4
395.
8 450.
8Note:
1. Portfolio subject to variable rental income and excluding conference hotels and disposal properties in FY2016.
2. Portfolio subject to variable rental income and excluding conference hotels in FY2013 to FY2015.
Heavenly Spa at The Westin, Cape Town
HOSPITALITY PROPERTY FUND INTEGRATED ANNUAL REPORT 2016 3

FUND AT A GLANCE
Hospitality is the only specialised REIT investing solely in the hospitality sector. The Fund offers investors exposure to the growth potential of both the hospitality and property industries. This is achieved through:
• Investment in a select portfolio of hotel and leisure properties, increasingly focusing on well located, large hotel properties in metropolitan centres, with strong brands and diverse source markets.
• Implementing an active asset management strategy.
• Ensuring that revenues derived from the hotel operations, which flow through to the Fund as rental income, are optimised.
Hospitality’s strategic objectives are to optimally grow shareholder returns while diversifying and managing risk and at the same time maintaining high standards of corporate citizenship and sustainable development.
Mission and strategy
Birchwood Hotel and OR Tambo Conference Centre, Boksburg
HOSPITALITY PROPERTY FUND INTEGRATED ANNUAL REPORT 20164

Hospitality is a REIT, offering investors a unique investment vehicle in the hospitality sector through the ownership of hotel properties. Hospitality is a publicly traded company and is listed on the Main Board of the JSE Limited (JSE) under the “Financials – Speciality REIT” sector.
The Company comprises 15 hotel and resort properties valued at R5.3 billion, located throughout South Africa. Its portfolio is highly diversified in terms of geographic location, hotel grading, brands and market mix.
The acquisition of 10 additional properties from Tsogo Sun (effective 1 September 2016) increased the portfolio value to over R7.1 billion.
Hospitality caters to the requirements of a wide-ranging domestic and international target market, including business travel, leisure travel and conferencing markets. Well-located, quality properties with strong brands offering a superior guest experience are the key differentiators which enables the Fund to generate positive returns for shareholders.
Hospitality is the largest hotel owner of multi branded/operated properties in South Africa and has built strong partnerships with well-recognised local and international hotel brands. Through these long-term partnerships, the Fund leverages the value of its portfolio.
BUSINESS MODEL
The Fund’s profits are distributed free from withholding tax to South African tax residents shareholders are consequently taxed according to their individual tax status.
At year-end the Company comprised a total of 144.3 million A-shares and 144.3 million B-shares, which are traded on the JSE under the codes HPA and HPB, respectively. Until such time that the restructure of Hospitality’s dual-class share capital structure to a single-class share capital structure (“the Restructure”) is implemented on 11 October 2016, A-shares have a preferential claim to earnings with capped growth at the lesser of growth in the Consumer Price Index (“CPI”) or 5%. The B‑shares receive the balance of the earnings.
Following the implementation of the Restructure, earnings will be distributed equally between shareholders.
As at 30 June 2016 the net asset value was R12.93 per share.
Ethical values and open stakeholder communication underpins the Company’s management philosophy.
Sustainable development is core and the Company continues to implement new and expand on existing measures in place, in order to reduce its environmental impact.
HOSPITALITY PROPERTY FUND LIMITED
Strategy Financing and Regulatory Compliance
BoardCommittees
Tenant/Hotel Operator
AssetManagement
Hotels
HPF Properties (Pty) Ltd* (property owner)
HPF Management (Pty) Ltd*
(Internal Asset Manager)
HospitalityBoard
* Wholly owned by Hospitality Property Fund Ltd
HOSPITALITY PROPERTY FUND INTEGRATED ANNUAL REPORT 2016 5

STRATEGIC OBJECTIVES
FUND STRATEGYObjective Delivery in 2016
Optimally grow shareholder returns while diversifying and managing risk
The Fund delivered a strong performance despite the uncertain global and domestic economies, underpinned by its strategic hotel investment properties in major metropolitan centres.
Maintaining high standards of corporate citizenship and sustainable development
Continuous enhancement of policies.Risk management process embedded into the Group.
Diversification of financing structureSuccessfully engaged with financial institutions to refinance R230 million of notes and to raise R100 million for capital expenditure.
Sustainable capital structureObtained shareholder approval to restructure the dual-class share structure into a single-class share structure.
Obtain REIT status Shareholder approval obtained to complete REIT conversion.
PORTFOLIO STRATEGY
Objective Delivery in 2016
Diversification of hotel management companies
Tsogo Sun acquired the existing leases and commenced operating The Crowne Plaza Johannesburg – The Rosebank and the Holiday Inn Sandton – Rivonia Road with effect from 1 March 2016.
Focus on enhancing the quality of property portfolio through:
• Acquisitions: Large hotel properties in metropolitan areas with diverse source markets and strong brands
• Ongoing evaluation of long-term growth and investment opportunities.
• Tsogo transaction increases Hospitality’s portfolio with the addition of 10 successful and established hotels effective 1 September 2016.
• Opportunities for growth through the acquisition of additional properties from Tsogo.
• Three additional units at the Radisson Blu Waterfront for R14.3 million, bringing its total interest in the property rental pool to 55.8%.
• Disposals: Non-core properties that do not fit Hospitality’s investment profile
• Disposal of seven properties with net proceeds of R189.9 million: these include Protea Hotel The Richards; Protea Hotel Hluhluwe and Safaris; Premier Hotel King David, Protea Hotel Imperial, Protea Hotel The Winkler, The Bayshore Inn and the Protea Hotel Richards Bay.
Continuous investment in existing properties to enhance value proposition of portfolio objectives
• Thirty additional rooms were developed at Protea Hotel The Edward, at a total cost of R19.8 million increasing the number of rooms to 131.
• R14.0 million was spent at the Birchwood Hotel and OR Tambo Conference Centre on the refurbishment of 82 rooms that now forms part of the Silverbirch hotel section.
• At Champagne Sports Resorts R14.0 million was spent on acquiring all movable assets from the tenant.
HOSPITALITY PROPERTY FUND INTEGRATED ANNUAL REPORT 20166

RADISSON BLULocation: WATERFRONT
Grading: LUXURYNo. of rooms:
177Valuation:
R454 000 000
Business Lounge – Radisson Blu Waterfront
FINANCIAL CAPITAL
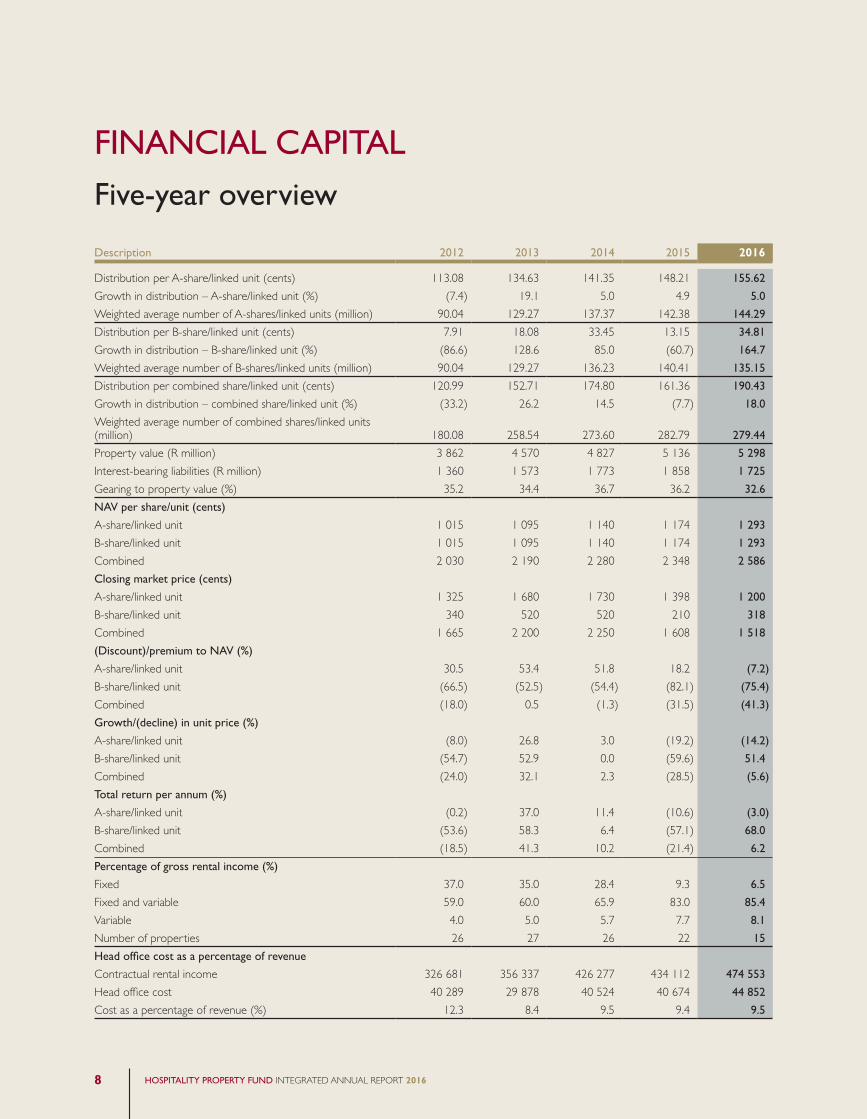
Five-year overview
Description 2012 2013 2014 2015 2016
Distribution per A-share/linked unit (cents) 113.08 134.63 141.35 148.21 155.62
Growth in distribution – A-share/linked unit (%) (7.4) 19.1 5.0 4.9 5.0
Weighted average number of A-shares/linked units (million) 90.04 129.27 137.37 142.38 144.29
Distribution per B-share/linked unit (cents) 7.91 18.08 33.45 13.15 34.81
Growth in distribution – B-share/linked unit (%) (86.6) 128.6 85.0 (60.7) 164.7
Weighted average number of B-shares/linked units (million) 90.04 129.27 136.23 140.41 135.15
Distribution per combined share/linked unit (cents) 120.99 152.71 174.80 161.36 190.43
Growth in distribution – combined share/linked unit (%) (33.2) 26.2 14.5 (7.7) 18.0
Weighted average number of combined shares/linked units (million) 180.08 258.54 273.60 282.79 279.44
Property value (R million) 3 862 4 570 4 827 5 136 5 298
Interest-bearing liabilities (R million) 1 360 1 573 1 773 1 858 1 725
Gearing to property value (%) 35.2 34.4 36.7 36.2 32.6
NAV per share/unit (cents)
A-share/linked unit 1 015 1 095 1 140 1 174 1 293
B-share/linked unit 1 015 1 095 1 140 1 174 1 293
Combined 2 030 2 190 2 280 2 348 2 586
Closing market price (cents)
A-share/linked unit 1 325 1 680 1 730 1 398 1 200
B-share/linked unit 340 520 520 210 318
Combined 1 665 2 200 2 250 1 608 1 518
(Discount)/premium to NAV (%)
A-share/linked unit 30.5 53.4 51.8 18.2 (7.2)
B-share/linked unit (66.5) (52.5) (54.4) (82.1) (75.4)
Combined (18.0) 0.5 (1.3) (31.5) (41.3)
Growth/(decline) in unit price (%)
A-share/linked unit (8.0) 26.8 3.0 (19.2) (14.2)
B-share/linked unit (54.7) 52.9 0.0 (59.6) 51.4
Combined (24.0) 32.1 2.3 (28.5) (5.6)
Total return per annum (%)
A-share/linked unit (0.2) 37.0 11.4 (10.6) (3.0)
B-share/linked unit (53.6) 58.3 6.4 (57.1) 68.0
Combined (18.5) 41.3 10.2 (21.4) 6.2
Percentage of gross rental income (%)
Fixed 37.0 35.0 28.4 9.3 6.5
Fixed and variable 59.0 60.0 65.9 83.0 85.4
Variable 4.0 5.0 5.7 7.7 8.1
Number of properties 26 27 26 22 15
Head office cost as a percentage of revenue
Contractual rental income 326 681 356 337 426 277 434 112 474 553
Head office cost 40 289 29 878 40 524 40 674 44 852
Cost as a percentage of revenue (%) 12.3 8.4 9.5 9.4 9.5
HOSPITALITY PROPERTY FUND INTEGRATED ANNUAL REPORT 20168

0
50
100
150
200
12 13 14 15 16
113.
08 134.
63
141.
35
148.
21
148.
2115
5.62
0
5
10
15
20
25
30
35
12 13 14 15 16
7.91
18.0
8
33.4
5
13.1
5
34.8
1
DISTRIBUTION PER B-LINKED UNIT (CENTS)
0
50
100
150
200
12 13 14 15 16
120.
99
152.
71 174.
80
161.
36
190.
43
(10)
(5)
0
5
10
15
20
12 13 14 15 16
5.0
7.4
19.1
5.0
4.9
5.0
12 13 14 15 16
GROWTH IN DISTRIBUTIONB-LINKED UNIT (%)
(100)
(50)
0
50
100
150
200
86.6
128.
6
85.0
164.
7
60.7
(35)
(28)
(21)
(14)
(7)
0
7
14
21
28
35
12 13 14 15 16
GROWTH IN DISTRIBUTIONCOMBINED LINKED UNIT (%)
33.2
26.2
14.5
7.7
18.0
0
1 000
2 000
3 000
4 000
5 000
6 000
12 13 14 15 16
3 86
2 4 57
0
4 82
7
5 13
6
PROPERTY VALUE (R MILLION)
5 29
8
0
5
10
15
20
25
30
35
40
12 13 14 15 16
35.2
34.4 36
.7
36.2
32.6
GEARING TO PROPERTY VALUE (%)
0
300
600
900
1 200
1 500
12 13 14 15 16
1 01
5
1 09
5
1 14
0
1 17
4 1 29
3
NAV PER UNIT (CENTS)
DISTRIBUTION PER A-LINKED UNIT/SHARE (CENTS)
GROWTH IN DISTRIBUTION A-LINKED UNIT/SHARE (%)
PROPERTY VALUE (R MILLION)
DISTRIBUTION PER B-LINKED UNIT/SHARE (CENTS)
GROWTH IN DISTRIBUTION B-LINKED UNIT/SHARE (%)
NAV PER UNIT/SHARE(CENTS)
DISTRIBUTION PER COMBINED LINKED UNIT/SHARE (CENTS)
DISTRIBUTION PER COMBINED LINKED UNIT/SHARE (CENTS)
GEARING TO PROPERTY VALUE (%)
HOSPITALITY PROPERTY FUND INTEGRATED ANNUAL REPORT 2016 9

PORTFOLIO OVERVIEW
RADISSON BLU WATERFRONT
47.7%
BIRCHWOOD HOTEL AND OR TAMBO CONFERENCE CENTRE
CHAMPAGNE SPORTS RESORT
PROTEA HOTEL HAZYVIEW
CROWNE PLAZA JOHANNESBURG THE ROSEBANK
MOUNT GRACECOUNTRY HOUSE AND SPA
ARABELLA HOTEL AND SPA
PROTEA HOTEL EDWARD
PROTEA HOTEL VICTORIA JUNCTION
94%
FIXED LEASE AGREEMENTS(Fixed rentals with inflation linked escalations)
1
F&V LEASE AGREEMENTS(Rentals approximately 50% fixed with inflation linked escalations. Approximately 50% variable = 90% to 98% of EBITDA less fixed lease component)
2
VARIABLE LEASE AGREEMENTS(Rentals = EBITDA)
3RADISSON BLU GAUTRAIN
SANDTON
PROTEA HOTEL MARINE
HOLIDAY INN SANDTON – RIVONIA ROAD
THE WESTIN CAPE TOWN
HOSPITALITY PROPERTY FUND INTEGRATED ANNUAL REPORT 201610

Hospitality % ownership* Acquired with effect from 1 September 2016
as part of the Tsogo transaction
GARDEN COURT KIMBERLEY*
GARDEN COURT POLOKWANE*
GARDEN COURT OR TAMBO*GARDEN COURT MILPARK* GARDEN COURT SOUTH BEACH*
SUNSQUARE CAPE TOWN*STAYEASY RUSTENBURG* SOUTHERN SUN NEWLANDS*SOUTHERN SUN BLOEMFONTEIN*
STAYEASY CENTURY CITY HOTEL*
KOPANONG HOTEL AND CONFERENCE CENTRE
79.0%
INN ON THE SQUARE
HOSPITALITY PROPERTY FUND INTEGRATED ANNUAL REPORT 2016 11

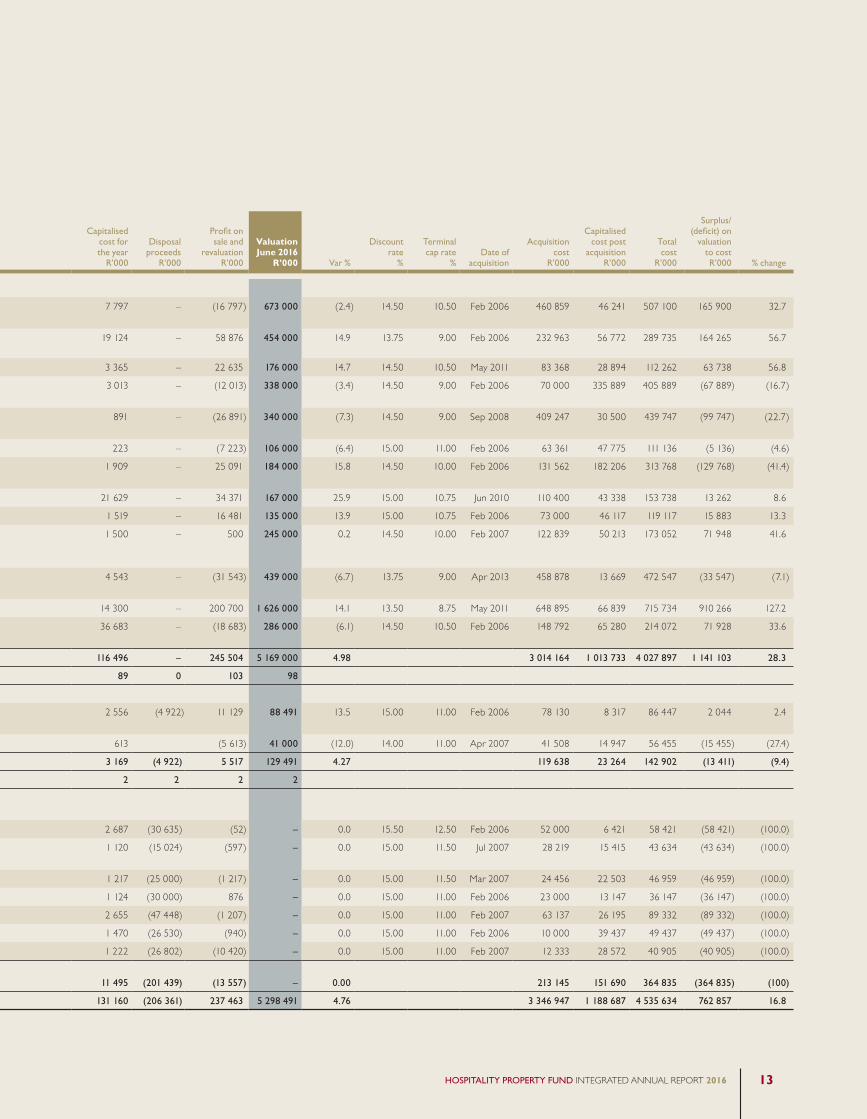
Property title HPF ownership Property locationLeasetype Grading
Numberof rooms
Bookvalue
30 June2015
R’000
Acquisi-tions
R’000
Refurbish-mentsR’000
CAPEXfor
the yearR’000
Capitalisedcost forthe year
R’000
Disposalproceeds
R’000
Profit onsale and
revaluationR’000
ValuationJune 2016
R’000 Var %
Discountrate
%
Terminalcap rate
%Date of
acquisition
Acquisitioncost
R’000
Capitalisedcost post
acquisitionR’000
Totalcost
R’000
Surplus/(deficit) on
valuationto costR’000 % change
Core portfolio
Birchwood Hotel and OR Tambo Conference Centre
Freehold Direct (450 owned) Boksburg F&V Economy 665 682 000 – 235 7 562 7 797 – (16 797) 673 000 (2.4) 14.50 10.50 Feb 2006 460 859 46 241 507 100 165 900 32.7
Radisson Blu Waterfront Freehold Sectional title units (55.8% of rental pool)
Cape Town F&V Luxury 177 376 000 14 252 – 4 872 19 124 – 58 876 454 000 14.9 13.75 9.00 Feb 2006 232 963 56 772 289 735 164 265 56.7
Arabella Hotel and Spa Freehold Direct Kleinmond F&V Luxury 145 150 000 – – 3 365 3 365 – 22 635 176 000 14.7 14.50 10.50 May 2011 83 368 28 894 112 262 63 738 56.8
Crowne Plaza Johannesburg – The Rosebank
Freehold Direct Rosebank F&V Midscale 318 347 000 – – 3 013 3 013 – (12 013) 338 000 (3.4) 14.50 9.00 Feb 2006 70 000 335 889 405 889 (67 889) (16.7)
Holiday Inn Sandton – Rivonia Road
Freehold Direct Sandton F&V Midscale 301 366 000 – – 891 891 – (26 891) 340 000 (7.3) 14.50 9.00 Sep 2008 409 247 30 500 439 747 (99 747) (22.7)
Inn on the Square Freehold Direct Cape Town F&V Economy 165 113 000 – – 223 223 – (7 223) 106 000 (6.4) 15.00 11.00 Feb 2006 63 361 47 775 111 136 (5 136) (4.6)
Mount Grace Country House and Spa
Freehold Direct Magaliesberg F&V Luxury 121 157 000 – 78 1 831 1 909 – 25 091 184 000 15.8 14.50 10.00 Feb 2006 131 562 182 206 313 768 (129 768) (41.4)
Protea Hotel Edward Freehold Direct Durban F&V Midscale 131 111 000 – 19 765 1 864 21 629 – 34 371 167 000 25.9 15.00 10.75 Jun 2010 110 400 43 338 153 738 13 262 8.6
Protea Hotel Marine Freehold Direct Port Elizabeth F&V Midscale 114 117 000 – – 1 519 1 519 – 16 481 135 000 13.9 15.00 10.75 Feb 2006 73 000 46 117 119 117 15 883 13.3
Protea Hotel Victoria Junction
Freehold Sectional title units (94% of units in the scheme)
Cape Town F&V Midscale 172 243 000 – – 1 500 1 500 – 500 245 000 0.2 14.50 10.00 Feb 2007 122 839 50 213 173 052 71 948 41.6
Radisson Blu Gautrain Sandton
Freehold Sectional title (100% of hotel units)
Sandton F&V Luxury 220 466 000 – – 4 543 4 543 – (31 543) 439 000 (6.7) 13.75 9.00 Apr 2013 458 878 13 669 472 547 (33 547) (7.1)
The Westin Cape Town Leasehold Direct Cape Town F&V Luxury 483 1 411 000 – – 14 300 14 300 – 200 700 1 626 000 14.1 13.50 8.75 May 2011 648 895 66 839 715 734 910 266 127.2
Champagne Sports Resort Freehold Combined share block and direct
Central Berg Fixed Midscale 152 268 000 14 000 – 22 683 36 683 – (18 683) 286 000 (6.1) 14.50 10.50 Feb 2006 148 792 65 280 214 072 71 928 33.6
Total core portfolio 3 164 4 807 000 28 252 20 078 68 166 116 496 – 245 504 5 169 000 4.98 3 014 164 1 013 733 4 027 897 1 141 103 28.3
% core of total portfolio 78 94 100 100 82 89 0 103 98
Non-core portfolio
Kopanong Hotel and Conference Centre
Freehold Sectional title (79% of scheme)
Benoni F&V Economy 183 79 728 – – 2 556 2 556 (4 922) 11 129 88 491 13.5 15.00 11.00 Feb 2006 78 130 8 317 86 447 2 044 2.4
Protea Hotel Hazyview Freehold Direct Hazyview F&V Economy 87 46 000 – – 613 613 (5 613) 41 000 (12.0) 14.00 11.00 Apr 2007 41 508 14 947 56 455 (15 455) (27.4)
Total non-core portfolio 270 125 728 – – 3 169 3 169 (4 922) 5 517 129 491 4.27 119 638 23 264 142 902 (13 411) (9.4)
% non‑core of total portfolio 7 2 0 0 4 2 2 2 2
Non-core portfolio disposals
Premier King David Freehold Direct East London Fixed Economy 80 28 000 – – 2 687 2 687 (30 635) (52) – 0.0 15.50 12.50 Feb 2006 52 000 6 421 58 421 (58 421) (100.0)
Protea Hotel Hluhluwe and Safaris
Freehold Direct Hluhluwe F&V Economy 77 14 500 – – 1 120 1 120 (15 024) (597) – 0.0 15.00 11.50 Jul 2007 28 219 15 415 43 634 (43 634) (100.0)
Protea Hotel Imperial Freehold Direct Pietermaritzburg F&V Economy 70 25 000 – – 1 217 1 217 (25 000) (1 217) – 0.0 15.00 11.50 Mar 2007 24 456 22 503 46 959 (46 959) (100.0)
Protea Hotel Richards Bay Freehold Direct Richards Bay F&V Economy 66 28 000 – – 1 124 1 124 (30 000) 876 – 0.0 15.00 11.00 Feb 2006 23 000 13 147 36 147 (36 147) (100.0)
Protea Hotel – The Richards Freehold Direct Richards Bay F&V Midscale 135 46 000 – – 2 655 2 655 (47 448) (1 207) – 0.0 15.00 11.00 Feb 2007 63 137 26 195 89 332 (89 332) (100.0)
Protea Hotel – The Winkler Freehold Direct White River F&V Economy 87 26 000 – – 1 470 1 470 (26 530) (940) – 0.0 15.00 11.00 Feb 2006 10 000 39 437 49 437 (49 437) (100.0)
The Bayshore Inn Freehold Direct Richards Bay F&V Economy 102 36 000 – – 1 222 1 222 (26 802) (10 420) – 0.0 15.00 11.00 Feb 2007 12 333 28 572 40 905 (40 905) (100.0)
Total non-core portfolio disposals 617 203 500 – – 11 494 11 495 (201 439) (13 557) – 0.00 213 145 151 690 364 835 (364 835) (100)
Grand total 4 051 5 136 228 28 252 20 078 82 830 131 160 (206 361) 237 463 5 298 491 4.76 3 346 947 1 188 687 4 535 634 762 857 16.8
Property portfolio
HOSPITALITY PROPERTY FUND INTEGRATED ANNUAL REPORT 201612
Property title HPF ownership Property locationLeasetype Grading
Numberof rooms
Bookvalue
30 June2015
R’000
Acquisi-tions
R’000
Refurbish-mentsR’000
CAPEXfor
the yearR’000
Capitalisedcost forthe year
R’000
Disposalproceeds
R’000
Profit onsale and
revaluationR’000
ValuationJune 2016
R’000 Var %
Discountrate
%
Terminalcap rate
%Date of
acquisition
Acquisitioncost
R’000
Capitalisedcost post
acquisitionR’000
Totalcost
R’000
Surplus/(deficit) on
valuationto costR’000 % change
Core portfolio
Birchwood Hotel and OR Tambo Conference Centre
Freehold Direct (450 owned) Boksburg F&V Economy 665 682 000 – 235 7 562 7 797 – (16 797) 673 000 (2.4) 14.50 10.50 Feb 2006 460 859 46 241 507 100 165 900 32.7
Radisson Blu Waterfront Freehold Sectional title units (55.8% of rental pool)
Cape Town F&V Luxury 177 376 000 14 252 – 4 872 19 124 – 58 876 454 000 14.9 13.75 9.00 Feb 2006 232 963 56 772 289 735 164 265 56.7
Arabella Hotel and Spa Freehold Direct Kleinmond F&V Luxury 145 150 000 – – 3 365 3 365 – 22 635 176 000 14.7 14.50 10.50 May 2011 83 368 28 894 112 262 63 738 56.8
Crowne Plaza Johannesburg – The Rosebank
Freehold Direct Rosebank F&V Midscale 318 347 000 – – 3 013 3 013 – (12 013) 338 000 (3.4) 14.50 9.00 Feb 2006 70 000 335 889 405 889 (67 889) (16.7)
Holiday Inn Sandton – Rivonia Road
Freehold Direct Sandton F&V Midscale 301 366 000 – – 891 891 – (26 891) 340 000 (7.3) 14.50 9.00 Sep 2008 409 247 30 500 439 747 (99 747) (22.7)
Inn on the Square Freehold Direct Cape Town F&V Economy 165 113 000 – – 223 223 – (7 223) 106 000 (6.4) 15.00 11.00 Feb 2006 63 361 47 775 111 136 (5 136) (4.6)
Mount Grace Country House and Spa
Freehold Direct Magaliesberg F&V Luxury 121 157 000 – 78 1 831 1 909 – 25 091 184 000 15.8 14.50 10.00 Feb 2006 131 562 182 206 313 768 (129 768) (41.4)
Protea Hotel Edward Freehold Direct Durban F&V Midscale 131 111 000 – 19 765 1 864 21 629 – 34 371 167 000 25.9 15.00 10.75 Jun 2010 110 400 43 338 153 738 13 262 8.6
Protea Hotel Marine Freehold Direct Port Elizabeth F&V Midscale 114 117 000 – – 1 519 1 519 – 16 481 135 000 13.9 15.00 10.75 Feb 2006 73 000 46 117 119 117 15 883 13.3
Protea Hotel Victoria Junction
Freehold Sectional title units (94% of units in the scheme)
Cape Town F&V Midscale 172 243 000 – – 1 500 1 500 – 500 245 000 0.2 14.50 10.00 Feb 2007 122 839 50 213 173 052 71 948 41.6
Radisson Blu Gautrain Sandton
Freehold Sectional title (100% of hotel units)
Sandton F&V Luxury 220 466 000 – – 4 543 4 543 – (31 543) 439 000 (6.7) 13.75 9.00 Apr 2013 458 878 13 669 472 547 (33 547) (7.1)
The Westin Cape Town Leasehold Direct Cape Town F&V Luxury 483 1 411 000 – – 14 300 14 300 – 200 700 1 626 000 14.1 13.50 8.75 May 2011 648 895 66 839 715 734 910 266 127.2
Champagne Sports Resort Freehold Combined share block and direct
Central Berg Fixed Midscale 152 268 000 14 000 – 22 683 36 683 – (18 683) 286 000 (6.1) 14.50 10.50 Feb 2006 148 792 65 280 214 072 71 928 33.6
Total core portfolio 3 164 4 807 000 28 252 20 078 68 166 116 496 – 245 504 5 169 000 4.98 3 014 164 1 013 733 4 027 897 1 141 103 28.3
% core of total portfolio 78 94 100 100 82 89 0 103 98
Non-core portfolio
Kopanong Hotel and Conference Centre
Freehold Sectional title (79% of scheme)
Benoni F&V Economy 183 79 728 – – 2 556 2 556 (4 922) 11 129 88 491 13.5 15.00 11.00 Feb 2006 78 130 8 317 86 447 2 044 2.4
Protea Hotel Hazyview Freehold Direct Hazyview F&V Economy 87 46 000 – – 613 613 (5 613) 41 000 (12.0) 14.00 11.00 Apr 2007 41 508 14 947 56 455 (15 455) (27.4)
Total non-core portfolio 270 125 728 – – 3 169 3 169 (4 922) 5 517 129 491 4.27 119 638 23 264 142 902 (13 411) (9.4)
% non‑core of total portfolio 7 2 0 0 4 2 2 2 2
Non-core portfolio disposals
Premier King David Freehold Direct East London Fixed Economy 80 28 000 – – 2 687 2 687 (30 635) (52) – 0.0 15.50 12.50 Feb 2006 52 000 6 421 58 421 (58 421) (100.0)
Protea Hotel Hluhluwe and Safaris
Freehold Direct Hluhluwe F&V Economy 77 14 500 – – 1 120 1 120 (15 024) (597) – 0.0 15.00 11.50 Jul 2007 28 219 15 415 43 634 (43 634) (100.0)
Protea Hotel Imperial Freehold Direct Pietermaritzburg F&V Economy 70 25 000 – – 1 217 1 217 (25 000) (1 217) – 0.0 15.00 11.50 Mar 2007 24 456 22 503 46 959 (46 959) (100.0)
Protea Hotel Richards Bay Freehold Direct Richards Bay F&V Economy 66 28 000 – – 1 124 1 124 (30 000) 876 – 0.0 15.00 11.00 Feb 2006 23 000 13 147 36 147 (36 147) (100.0)
Protea Hotel – The Richards Freehold Direct Richards Bay F&V Midscale 135 46 000 – – 2 655 2 655 (47 448) (1 207) – 0.0 15.00 11.00 Feb 2007 63 137 26 195 89 332 (89 332) (100.0)
Protea Hotel – The Winkler Freehold Direct White River F&V Economy 87 26 000 – – 1 470 1 470 (26 530) (940) – 0.0 15.00 11.00 Feb 2006 10 000 39 437 49 437 (49 437) (100.0)
The Bayshore Inn Freehold Direct Richards Bay F&V Economy 102 36 000 – – 1 222 1 222 (26 802) (10 420) – 0.0 15.00 11.00 Feb 2007 12 333 28 572 40 905 (40 905) (100.0)
Total non-core portfolio disposals 617 203 500 – – 11 494 11 495 (201 439) (13 557) – 0.00 213 145 151 690 364 835 (364 835) (100)
Grand total 4 051 5 136 228 28 252 20 078 82 830 131 160 (206 361) 237 463 5 298 491 4.76 3 346 947 1 188 687 4 535 634 762 857 16.8
HOSPITALITY PROPERTY FUND INTEGRATED ANNUAL REPORT 2016 13

Value drivers
MACRO-ECONOMYAlthough Hospitality invests solely in South Africa, it is vital to monitor not only the local macro-economic factors, but to also analyse the global and regional economic activity in order to identify trends early on. This not only guides the decisions in future investments but also in the sales and marketing focus and in adapting operationally.
LOCATIONThe key to sustainable property investment remain prime locations. Visibility, accessibility and proximity to major business hubs or points of leisure interest are important demand drivers.
BRAND AFFILIATIONA strong, local or international brand underpins the hotel’s competitiveness within its chosen product segment.
OPERATIONS AND MANAGEMENTHotel operations require specialist expertise and are highly management and labour intensive. Leadership and involvement in all layers of the business lead to customer and employee satisfaction essentially resulting in sustainable profitability.
COMPETITION – CURRENT/NEW SUPPLYKnowledge of the competitive landscape and the dynamics of each market is essential to ensure sustainable profitability.
HOTEL ECONOMIC CYCLEThe hotel economic cycle is generally closely tied to the macro-economic phases moving through either the expansionary phase, the contractionary phase or the switchover phase. Understanding each phase of the hotel economic cycle and the business impact thereof is vital to limiting risk exposure in the respective markets.
1
3
5
4
6
2
HOSPITALITY PROPERTY FUND INTEGRATED ANNUAL REPORT 201614

DEVELOPMENTS AND INVESTMENTSA constant focus on improvement and development for each hotel is necessary in order to maintain a strong market position.
LEASE STRUCTUREFixed or variable lease structures or a combination of the two are available in the hotel industry. Both the fixed and variable lease structures which the Fund uses are adopted to suit each property/tenant and are designed to mitigate risk.
ASSET MANAGEMENTAsset management in the hotel industry requires both an in-depth understanding of hotel operations and asset management in order to optimise returns.
Hospitality’s value drivers
form the basis of its vision and choice
of investment.
7
9
8
HOSPITALITY PROPERTY FUND INTEGRATED ANNUAL REPORT 2016 15
KEY HOTEL PROFIT DRIVERSThe management of a hotel property is a complex undertaking. A hotel is made up of several business units with the core unit being the rooms department and auxiliary units comprising of food and beverage outlets, banqueting, safari, spa, and/or golf. The configuration of business units within a particular hotel is selected after careful consideration of each component of the hotel business model. A successful property needs the right combination providing the ideal product offering that meets the needs of the target market as later changes may be costly.
In traditional hotel properties, the rooms department is the largest contributor to gross revenue with the food and beverage department being the second largest. The majority of auxiliary unit revenue is typically driven by the number of room nights sold assuming that guests staying at the hotel will spend on food and beverage or other offerings. Exceptions to the rule exist; a non-traditional hotel property such as the Birchwood Hotel and OR Tambo Conference Centre can generate over 64% of gross revenue through the food and beverage department since its business model is targeted at providing large scale conferencing with rooms as an “auxiliary offering”.
VALUE DRIVERS
INCREASED REVENUES SMARTER INVESTMENTS DECREASED COSTS REDUCED RISK
Productivity essential to value growth
The composition of rooms revenue contains multi-faceted layers of business, conference and leisure sales. Every day is vital in achieving budgeted RevPAR. It requires that the respective management team has an in-depth understanding of the hotel’s market dynamics and is quick in responding to changes. Similar to the airline industry, a hotel applies yield management to realise the maximum in revenues while providing the desired product to the right customer.
In simplified terms, a hotel manager has three tools with which to increase hotel profits: increase occupancy, increase average daily rate (ADR) or increase profitability through cost reduction. Each of these tools requires a distinct approach and varies in its impact on the overall business.
In a case study each of the three tools has been applied independently to an average sized hotel property within the Fund’s portfolio. The outcome of each scenario is presented in the example below. The base case assumes a 350 room hotel with an ADR of R1 000 and an occupancy of 66.7% resulting in RevPAR of R667 for the year. Base case EBITDA amounts to R31.7 million.
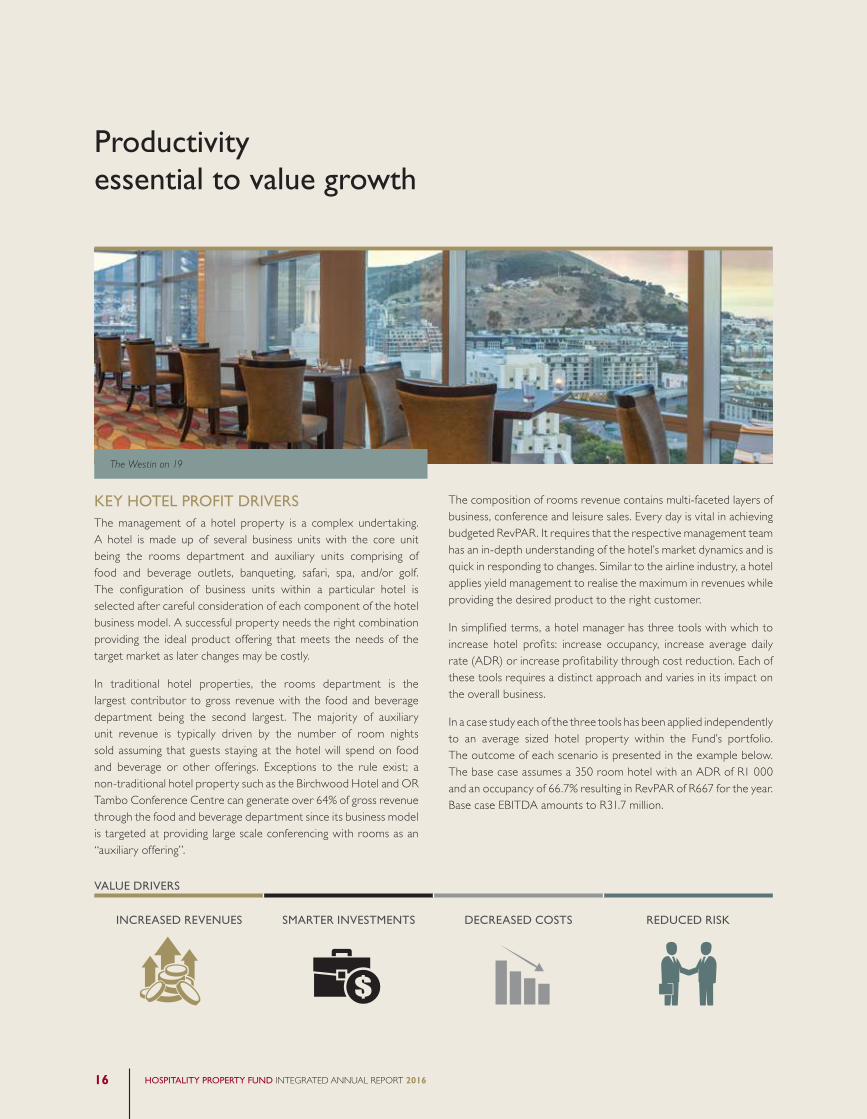
The Westin on 19
HOSPITALITY PROPERTY FUND INTEGRATED ANNUAL REPORT 201616
GROWTH IN OCCUPANCY BY 5%A 5% growth in occupancy results in an increase of R4.3 million in Total Revenue while EBITDA increases by R2.8 million. As occupancy increases so do variable expenses such as guest supplies, cleaning materials, casual staff and electricity resulting in a conversion of additional revenue into EBITDA of 66.5%.
GROWTH IN ADR BY 5%A 5% growth in ADR also results in an increase of R4.3 million in Total Revenue, however, EBITDA increases by R3.4 million (80.2% conversion). An increase in ADR does influence variable expenses but not to the same extent as an increase in occupancy. Management fees and marketing fees increase in line with the respective percentage as per the management agreement.
BASE CASE
Number of rooms 350
Occupancy (%) 66.7
ADR (Rand) 1 000
RevPAR (Rand) 667
Total revenue (Rm) 120.0
MCP (Rm) 41.3
EBITDA (Rm) 31.7
5%GROWTH
IN ADRGROWTH
(%) VARIANCE
Number of rooms 350
Occupancy (%) 66.7 0.0
ADR (Rand) 1 050 5.0
RevPAR (Rand) 700 5.0
Total revenue (Rm) 124.3 3.5 4.3
MCP (Rm) 45.1 9.2 3.7
EBITDA (Rm) 35.1 10.8 3.4
Conversion (%) 80.2
5%GROWTH IN
OCCUPANCYGROWTH
(%) VARIANCE
Number of rooms 350
Occupancy (%) 70.0 5.0
ADR (Rand) 1 000 0.0
RevPAR (Rand) 700 5.0
Total revenue (Rm) 124.2 3.5 4.3
MCP (Rm) 44.4 7.7 3.3
EBITDA (Rm) 34.4 8.9 2.8
Conversion (%) 66.5
5%GROWTH IN
PROFITABILITYGROWTH
(%) VARIANCE
Number of rooms 350
Occupancy (%) 66.7 0.0
ADR (Rand) 1 000 0.0
RevPAR (Rand) 667 0.0
Total revenue (Rm) 120.0 0.0
MCP (Rm) 43.3 5.0 2.1
EBITDA (Rm) 33.6 6.0 1.9
Conversion (%) 92.0
GROWTH IN PROFITABILITY BY 5%A 5% growth in profitability (increase in MCP) does not require any additional revenue to be generated. It results in a R1.9 million increase to EBITDA. Improving profit margins should always be a focus. It can be a very effective tool especially in economic downturns as it carries little risk and can be fully controlled by management unlike an increase in occupancy and ADR which depends on customer choice. Management needs to be mindful nevertheless that costs are not cut to the detriment of the customer experience as this may have a negative impact on occupancy and ADR.
GLOSSARY
MCP – Management controllable profit
ADR – Average daily rate
RevPAR – Revenue per available room
EBITDA – Earnings before interest, tax, depreciation and amortisation
HOSPITALITY PROPERTY FUND INTEGRATED ANNUAL REPORT 2016 17

1 Arabella Hotel and Spa
2 Birchwood Hotel and OR Tambo Conference Centre
3 Champagne Sports Resort
4 Crowne Plaza Johannesburg – The Rosebank
5 Garden Court Kimberley*
6 Garden Court Milpark*
7 Garden Court OR Tambo*
8 Garden Court Polokwane*
9 Garden Court South Beach*
10 Holiday Inn Sandton – Rivonia Road
11 Inn on the Square
12 Kopanong Hotel and Conference Centre
13 Mount Grace Country House and Spa
14 Protea Hotel Edward
15 Protea Hotel Hazyview
16 Protea Hotel Marine
17 Protea Hotel Victoria Junction
18 Radisson Blu Gautrain Sandton
19 Radisson Blu Waterfront
20 StayEasy Century City Hotel*
21 StayEasy Rustenburg*
22 SunSquare Cape Town*
23 Southern Sun Bloemfontein*
24 Southern Sun Newlands*
25 The Westin Cape Town
* Acquired with effect from 1 September 2016 as part of the Tsogo transaction.
WESTERN CAPE
NORTHERN CAPE
2022
25
11724
19
11
PROPERTY VALUE BY LOCALITY(excluding Tsogo* properties and disposal properties)
Gauteng 39% Western Cape 49%KwaZulu-Natal 9%
Eastern Cape 3%Mpumalanga 2%
GROSS RENTAL INCOME BY LOCALITY(including disposal properties)
Gauteng 37%Western Cape 48%KwaZulu-Natal 11%
Eastern Cape 3%Mpumalanga 1%
Geographical map
HOSPITALITY PROPERTY FUND INTEGRATED ANNUAL REPORT 201618

NORTH WEST
FREE STATE
EASTERN CAPE
KWAZULU-NATAL
MPUMALANGA
LIMPOPO
16
14
3
9
15
13
2
7
18
6
4
21
10
12
(RICHARDS BAY)
(DURBAN)
(PORT ELIZABETH)
8
5
23
GAUTENG
HOSPITALITY PROPERTY FUND INTEGRATED ANNUAL REPORT 2016 19

Management and administration
AFRICAN HOTELS AND ADVENTURES (“AHA”)AHA Hotels and Lodges is the property management Company of Tourvest’s Accommodation and Activities division. The Company manages and operates 42 hotels and lodges in South Africa, Botswana, Zimbabwe, Zambia and Zanzibar. AHA drives business into its hotels and lodges through its dedicated sales, marketing and reservations team. Tourvest also owns a number of inbound operators and Travel Services companies, which are incentivised to drive business into AHA owned lodges and hotels. AHA is the tenant and hotel management Company at Kopanong Hotel and Conference Centre and the Inn on the Square for Hospitality.
BIRCHWOODThe Birchwood property is managed and leased by The Birchwood Hotel and OR Tambo Conference Centre (Pty) Ltd. The key role-players in the executive team have managed the property since its inception and have continued operations through its nine expansion phases. The exclusive focus of the management company is the management of the Birchwood.
CHAMPAGNE SPORTS RESORTThe tenant and management company of Champagne Sports Resort has been involved with the development and operations of the resort since inception. The management company also manages the timeshare component of the resort on behalf of the Champagne Shareblock company.
HOSPITALITY PROPERTY FUND INTEGRATED ANNUAL REPORT 201620
CARLSON REZIDORCarlson Rezidor Hotel Group is one of the world’s largest and most dynamic hotel groups and includes 1 400 hotels in operation and under development with more than 220 000 rooms and a footprint spanning 115 countries and territories. The Carlson Rezidor portfolio includes a powerful set of global brands: Quorvus Collection, Radisson Blu®, Radisson®, Radisson RED, Park Plaza®, Park Inn® by Radisson and Country Inns and Suites By CarlsonSM. In most hotels, guests can benefit from Club CarlsonSM, one of the 2015 – 2016 “Top Three Hotel Rewards Programmes” as ranked by U.S. News and World Report. Carlson Rezidor Hotel Group and its brands employ 90 000 people worldwide and is headquartered in Minneapolis, Minnesota and Brussels, Belgium. For more information, visit www.carlsonrezidor.com and follow on Twitter @carlsonrezidor.
TSOGOEffective 1 March 2016, Tsogo Sun acquired Majormatic (Pty) Ltd (“Majormatic”) which operates the management agreements and leases for both the Crowne Plaza Rosebank and the Holiday Inn Sandton. These two properties are effectively managed and leased by Tsogo Sun via Majormatic with a retention of the franchise agreements for the Holiday Inn and Crowne Plaza brands.
Tsogo Sun is Southern Africa’s premier gaming, hotel and entertainment group. Tsogo Sun’s portfolio proudly comprises over 90 hotels with more than 14 600 hotel rooms across all sectors of the market, from luxury to budget in South Africa, Nigeria, Kenya, Tanzania, Zambia, Mozambique, the United Arab Emirates and the Seychelles; 14 premier gaming and entertainment destinations in six provinces of South Africa; theatres, cinemas, restaurants and bars; and over 280 conference and banqueting facilities, including the Sandton Convention Centre.
HOSPITALITY PROPERTY FUND INTEGRATED ANNUAL REPORT 2016 21

Management and administration continued
PROTEA HOTELS BY MARRIOTT®
Protea Hotels by Marriott is the largest hospitality brand in Africa with over 100 hotels across eight countries and growing. Named as the “Coolest Hotel Brand” in South Africa for the last seven years, it garners strong awareness and loyalty with its unique approach to design and personalised service. The portfolio comprises two brands, namely the Protea Hotels by Marriott brand including the lifestyle brand Protea Hotels Fire & Ice by Marriott and the luxury African Pride Hotels brand.
Protea Hotels was bought by Marriott International Inc. (NASDAQ: MAR) in April 2014 and forms part of Marriott’s global brand portfolio of more than 4 500 hotels in 87 countries. Marriott International operates and franchises hotels and licences vacation ownership resorts under 19 brands globally and also manages the award-winning guest loyalty programme, Marriott Rewards® and The Ritz-Carlton Rewards® programme, which together comprise more than 56 million members.
Protea Hotels operates the Arabella Hotel and Spa and Mount Grace Country House and Spa under the African Pride Hotels brand. Protea Hotel by Marriott Port Elizabeth Marine, Protea Hotel by Marriott Durban Edward, Protea Hotel by Marriott Hazyview and Protea Hotel by Marriott Cape Town Victoria Junction are managed under the Protea Hotels by Marriott brand for Hospitality.
STARWOOD HOTELS AND RESORTS WORDLWIDEStarwood Hotels and Resorts Worldwide, Inc. is one of the leading hotel and leisure companies in the world with more than 1 300 properties in some 100 countries and approximately 188 000 employees at its owned and managed properties. Starwood is a fully integrated owner, operator and franchisor of hotels, resorts and residences under the renowned brands: St. Regis®, The Luxury Collection®, W®, Westin®, Le Méridien®, Sheraton®, Tribute Portfolio™, Four Points® by Sheraton, Aloft®, and Element®, along with an expanded partnership with Design Hotels™. The company also boasts one of the industry’s leading loyalty programmes, Starwood Preferred Guest (SPG®). Effective 23 September 2016, Marriott International Inc. acquired Starwood. Visit www.starwoodhotels.com for more information and stay connected @starwoodbuzz on Twitter and Instagram and facebook.com/Starwood.
HOSPITALITY PROPERTY FUND INTEGRATED ANNUAL REPORT 201622

GROSS RENTAL INCOME BY LEASE TYPE*
Fixed 6% F&V 86% Variable 8%
PROPERTY VALUE BY LEASE TYPE#
Fixed 5% F&V 86% Variable 9%
GROSS RENTAL INCOME BY STAR GRADING*
Economy 19% Midscale 29% Upscale 52%
PROPERTY VALUE BY STAR GRADING#
Economy 17% Midscale 29% Upscale 54%
GROSS RENTAL INCOME BY LEASE EXPIRY PERIOD∆
1-5 years 42% 6-10 years 16%
11-20 years 13% 21-30 years 29%
PROPERTY VALUE BY LEASE EXPIRY PERIOD#
1-5 years 39% 6-10 years 17%
11-20 years 13% 21-30 years 31%
Sectoral spread
* Includes disposal properties# Excludes disposal properties� Includes disposals at 0 months to expiry
HOSPITALITY PROPERTY FUND INTEGRATED ANNUAL REPORT 2016 23

2012 2013 2014 2015 2016R’000 % R’000 % R’000 % R’000 % R’000 %
Revenue 862 263 100 948 496 100 1 179 005 100 1 499 518 100 1 571 026 100
Rooms 541 909 63 606 867 64 765 235 65 886 832 59 961 300 61
Food and beverage 248 488 29 270 937 29 334 500 28 515 527 34 507 478 32
Spa and beauty salon 17 899 2 15 318 2 16 228 1 17 125 1 16 915 1
Golf and Safari 14 559 2 13 287 1 16 163 1 19 812 1 19 741 1
Other 39 408 5 42 087 4 46 879 4 60 222 4 65 592 4
Departmental profit (% departmental revenue) 530 269 61 583 331 62 734 054 62 933 663 62 998 261 64
Rooms 415 560 77 466 279 77 595 233 78 690 446 78 760 674 79
Food and beverage 82 325 33 90 325 33 110 576 33 206 513 40 197 140 39
Spa and beauty salon 5 139 1 5 049 1 5 188 1 5 389 1 5 596 1
Golf and Safari 3 484 1 3 205 1 3 468 0 6 393 1 7 215 1
Other 23 761 4 18 473 3 19 589 3 24 922 3 27 636 3
Other hotel expenses 233 524 27 253 156 27 312 739 27 381 192 25 384 111 24
Administration and general 96 794 11 108 112 11 123 893 11 151 742 10 149 381 10
Sales and marketing 60 831 7 65 097 7 85 360 7 102 451 7 105 656 7
Heat, light and power 37 788 4 40 452 4 51 881 4 63 516 4 66 700 4
Repairs and maintenance 38 111 4 39 495 4 51 605 4 63 483 4 62 374 4
Management controllable profit 296 744 34 330 177 35 421 313 36 552 471 37 614 150 39
Fixed expenses 45 574 5 47 211 5 48 401 4 74 757 5 71 290 5
Management and incentive fees 44 030 5 49 496 5 59 538 5 81 955 5 92 083 6
EBITDA 207 140 24 233 470 25 313 375 27 395 759 26 450 777 29
Fixed rental 92 772 11 99 677 11 139 836 12 193 208 13 197 278 13
Variable rental 113 112 13 131 904 14 165 350 14 200 686 13 246 642 16
F&V/Variable lease income 205 884 24 231 581 24 305 186 26 393 894 26 443 920 28
Rental income reconciliation
F&V/Variable lease income 205 884 63 231 580 65 305 186 72 393 894 91 443 920 94
Fixed lease rental income 120 797 37 124 756 35 121 091 28 40 218 9 30 633 6
Total rental income 326 681 100 356 336 100 426 277 100 434 112 100 474 553 100
Statistics
Number of properties 26 27 27 22 15
Rooms profitability % 77 77 78 78 79
Food and beverage profitability % 33 33 33 40 39
Operating profitability % 61 62 62 62 64
Management controllable profit % 34 35 36 37 39
EBITDA % 24 25 27 26 29
Consolidated hotel income statement for F&V and variable leased properties
HOSPITALITY PROPERTY FUND INTEGRATED ANNUAL REPORT 201624

Occupancy, ADR and RevPAR analysis
Occupancy FY2011 FY2012 FY2013 FY2014 FY2015 FY2016*
Traditional portfolio 51% 57% 59% 61% 61% 68%
Conference portfolio 46% 44% 45% 48% 44% 50%
Total 50% 54% 56% 58% 58% 64%
Economy 45% 46% 48% 51% 50% 54%
Midscale 52% 58% 59% 59% 61% 66%
Upscale 59% 61% 64% 66% 64% 70%
ADR FY2011 FY2012 FY2013 FY2014 FY2015 FY2016*
Traditional portfolio 915 978 1 022 1 159 1 225 1 454
Conference portfolio 674 612 659 695 751 852
Total 860 912 960 1 081 1 152 1 337
Economy 623 593 619 671 705 804
Midscale 875 856 906 975 998 1 080
Upscale 1 561 1 424 1 482 1 670 1 829 1 980
RevPAR FY2011 FY2012 FY2013 FY2014 FY2015 FY2016*
Traditional portfolio 466 554 603 701 750 986
Conference portfolio 308 271 294 334 333 429
Total 426 492 536 627 666 850
Economy 280 272 297 344 351 438
Midscale 455 494 536 576 612 712
Upscale 918 872 948 1 103 1 179 1 380
* Excludes disposal properties.
HOSPITALITY PROPERTY FUND INTEGRATED ANNUAL REPORT 2016 25

Lease expiry profile (years)
Champagne Sports Resort
Kopanong Hotel & Conference Centre
Radisson Blu Waterfront
Inn on the Square
Protea Hotel Edward
Protea Hotel Marine
Crowne Plaza Johannesburg – The Rosebank
Holiday Inn Sandton – Rivonia Road
Arabella Hotel & Spa
Protea Hotel Hazyview
Mount Grace Country House & Spa
Birchwood Executive Hotel & OR Tambo Conference Centre
Protea Hotel Victoria Junction
Radisson Blu Gautrain Sandton
Westin Cape Town
Initial period
0 5 2515 20
Option period(s)
10
HOSPITALITY PROPERTY FUND INTEGRATED ANNUAL REPORT 201626

Mount Grace Country House and Spa, Magaliesburg

CHAIRMAN’S LETTER
Hospitality delivered a considerably improved financial performance in 2016 under the leadership of the new management team performing slightly ahead of the South African hospitality industry despite the challenging domestic economy and global uncertainty.
The results throughout the hospitality sector were supported by the poor Rand exchange rate, with more international travellers visiting and more South Africans holidaying in South Africa rather than abroad.
The major milestone for the year was obtaining shareholder approval for the simplified capital structure and concluding the Tsogo transaction. The dual share capital structure is a factor which held Hospitality’s growth back in recent years due to conflicting shareholder objectives. The vote in favour of the capital restructuring was the culmination of a long engagement process with a large number of shareholders over an extended time period. The process was difficult to manage due to the sometimes disparate objectives of our A and B shareholders.
The final impetus for the capital restructure was the transaction with Tsogo, which became effective on 1 September 2016. The transaction should have significant long‑term benefits for the Fund. It will immediately increase Hospitality’s property portfolio with 10 successful and established hotels without the Fund having to acquire individual assets or incur any additional gearing. The properties being injected by Tsogo also improve the spread of the Fund’s assets across the hotel grading spectrum, broadening its earnings base. With this new portfolio, the Fund’s earnings base should become more stable through the exposure to the relatively predictable cash flows generated by the Tsogo portfolio. Ultimately, the single share structure should also facilitate the Fund’s ability to acquire additional properties in the future, from Tsogo as well as third parties. The Board and Management believe that these long‑term benefits significantly outweigh the potential short term dilution of net income distributions to A shareholders.
HOSPITALITY PROPERTY FUND INTEGRATED ANNUAL REPORT 201628

I am pleased to welcome Tsogo nominated non-executive directors John Copelyn, Zibusiso Kganyago, Laurelle McDonald, Rob Nicolella and Marcel von Aulock to the Board with effect from 1 September 2016.
The introduction of new visa requirements for visitors to South Africa as well as the more stringent entry requirements for minors, was the subject of intense debate and was widely cited as one of the major factors leading to the 6.8% decline in foreign visitors to South Africa in 2015. While the merits of these requirements, especially the protection of minors, were never in question, the process of communicating these changes was left too late and the implementation was fraught with challenges because the necessary infrastructure in the main countries affected had not been set in place to administer the changes. The South African government finally conceded to industry pressure and is in the process of modifying these regulations. In light of the weakening Rand, this should benefit the hospitality industry with increased numbers of foreign visitors.
During the year, the Board maintained its commitment to the highest standards of corporate governance. However, it was disappointing to see mounting evidence that politicians, both in South Africa and globally appear to be more focused on personal agendas than their responsibilities of improving the lot of all constituents, especially the poorer segments of their societies. It is incumbent on the private sector to encourage politicians to focus on the greater good of communities, especially in South Africa where there is so much need for the upliftment of people. Private sector, and more specifically the hotel and tourism sector, which provides about one in every 12 jobs in South Africa, is playing an important role in job creation. However, it is important that government supports these initiatives, through the implementation of policies; responsible spending of taxpayer receipts and by creating a more conducive environment for domestic and foreign private sector investment.
Internally to the Fund, the risk management process implemented in 2015 has been embedded into the group and is delivering benefits. Measures have been taken to strengthen the risk policies and the Board will continue to play an oversight role to ensure that they continue to work well for the Fund.
Throughout the year, we followed through with our more open and transparent attitude with the team at Hospitality. Under the leadership of the new CEO, Vincent Joyner, two-way communication has improved and a second climate survey carried out recently indicated a substantially improved environment in the business. This remains a high focus area, together with employee wellness given our cognisance that a positive work environment is a critical
enabler for the team to operate at its full potential. The Board has welcomed Vincent’s candid and regular disclosure of operational progress, with all directors voicing their approval that the Company is now being managed for the benefit of all stakeholders. The new management team was fully bedded down during the year, and a recent restructuring of the asset management function bodes well for the year ahead.
Riaan Erasmus, who assumed the role of Hospitality’s acting CFO in August 2015, has carried his responsibilities to a high standard. Mara de Lima was appointed as permanent Financial Director with effect from 30 September 2016. Riaan will continue in the role of Senior Group Financial and Treasury Manager.
I extend my heartfelt gratitude to all our stakeholders for your patience – the capital restructure and conclusion of the Tsogo transaction has been a long process but this was necessary to deliver the optimal capital growth solution for the fund.
I specifically acknowledge our shareholders for your support in the capital restructure and your willingness to constantly engage with Hospitality. This was crucial in reaching a sustainable resolution to the long-standing capital structure challenge. Without your support, this would not have been possible.
To my fellow Board members, a special note of thanks for your wise counsel during the past year. We made significant progress strategically and I look forward to continuing to work with you all in 2017.
Every member of the Hospitality team, under the leadership of Vincent Joyner, has played a positive role in Hospitality’s growth during 2016, and more importantly, the significant progress made towards simplifying our capital structure and increasing the size of the Fund. I thank each of you for your loyalty and commitment to the Fund.
Looking ahead, we are on a strong footing and well placed to move forward. Hospitality is in a much stronger position than a year ago, and I encourage the Hospitality team to continue with “business as usual” as we bring in the new Tsogo properties. The focus for the year ahead is to bed down the larger portfolio and continue delivering positive returns for all shareholders.
Don BowdenChairman
HOSPITALITY PROPERTY FUND INTEGRATED ANNUAL REPORT 2016 29

BOARD OF DIRECTORS*
1
2
3
4
5
1 2 3 54
DON BOWDEN (57)ChairmanBCom (Economics), BACC (Wits), CA(SA)
Don was appointed to the board in August 2012. Don is a non-executive director of Foord Unit Trusts and The Fruitways Group and a trustee of Molteno Brothers Trust, a charitable trust. Don was a financial services partner at Deloitte & Touche before joining BoE in 1998. At BoE he managed the investor relations, communications, and marketing and human resources portfolios for the banking group. Following the merger of BoE with Nedcor in 2002, Don assumed responsibility for communications and human resources on the Nedcor integration and restructuring team, before starting Tier I Investor Relations in 2003. Don was appointed as Chairman of the Board on 30 June 2013.
VINCENT JOYNER (48)Chief Executive OfficerBA (Honours) from Galway-Mayo Institute of Technology (Ireland)Joint Masters in International Hospitality Management from Cornell University (USA) and ESSEC (France)
Vincent was appointed as Chief Executive Officer (“CEO”) and a member of the Board of Hospitality with effect from 15 September 2016. Vincent has a successful career in the hospitality industry spanning over 29 years. He spent almost 20 years of his career within the Accor hospitality group, with the last six years of his tenure as Accor Group CEO, Southern Africa. In 2009, Vincent formed an African hospitality consulting and investment firm, Hospitality Investment Partners Africa. At the same time, he established a not‑for‑profit venture, the Zazida Institute of Entrepreneurship, an accredited Private Higher Education Institution.
LINDA DE BEER (47)Independent non-executiveCA(SA), Chartered Director (SA), Masters (Taxation)
Linda is an independent director and a reporting and governance advisor. She is also a director on the boards of Royal Bafokeng Platinum Limited, Sasfin Bank Limited, Sasfin Holdings Limited and Aspen Finance (Pty) Ltd. She, inter alia, serves on the King Committee on Corporate Governance and chairs the JSE’s Financial Reporting Investigation Panel. Linda was appointed a director of Hospitality on 17 August 2011. She is the Chairman of the Audit and Risk Committee and a member of the Nomination Committee.
SYD HALLIDAY (69)Independent non-executiveCAIB (SA), ACIS
Syd retired from Nedbank in 2004 where he had held various senior credit risk management positions in the property finance divisions of Nefic, Syfrets, Nedcor Investment Bank and Nedbank. Post retirement he served as the independent Chairman of Nedbank Corporate Property Finance’s main property lending Committee up to December 2012. Syd also serves on the Board of Dipula Income Fund Limited as an independent non-executive director and as a trustee of National Empowerment Property Investment Trust. He also consults to Sasfin Bank’s Property Private Equity Fund. Syd joined the Board of Hospitality as a non-executive director on 30 June 2013.
DR ZUKO KUBUKELI (43)Independent non-executivePhD (Human Biology) (UCT), BSc (Medicine) (Hons) (UCT), BSc (Biochemistry and Microbiology) (UCT)
Zuko started his career as a regional property manager of Atlas Property Services (Pty) Limited, the management company of Atlas Properties Limited. From there he went on to work for Brait Specialised Funds, the hedge fund of funds unit, where he later became an executive director. Thereafter he became executive director at Pan-African Capital Holdings
HOSPITALITY PROPERTY FUND INTEGRATED ANNUAL REPORT 201630

The Board comprises the skills, knowledge
and expertise to lead the Company and to provide
management with strategic direction.
68
7
9
96 7 8
where he co‑founded the principal investment programme and the first clean tech fund on the continent, Evolution One Fund. Zuko is currently the CEO of PAPE fund managers which manages three private equity funds, PAPE funds. He was appointed as an independent non-executive director of the board of Hospitality in June 2008.
ZOLA MALINGA (38)Independent non-executiveCA(SA), BCom (Accounting)
Zola qualified as a Chartered Accountant (SA) in 2003 after having completed a Postgraduate Diploma in Accounting at the University of Natal (Durban) and a Bachelor of Commerce degree at the University of Cape Town. She is the founder and an executive director of Jade Capital Partners. Zola was previously a director of Standard Bank Group Limited’s Real Estate Finance division, heading up its New Business team and an investment banker, having held roles in Standard Bank’s B-BBEE Finance division and in Corporate Finance at Investec Bank Limited. She is the past chair of the Women’s Property Network (Gauteng) and a member of SAPOA, SAIBPP and SAICA. She was appointed to the board of Hospitality as an independent non-executive director on 8 July 2013 and serves as a member of the Audit and Risk Committee.
GERALD NELSON (61)Non-executiveBSc Building (Wits)
Gerald stepped down as the chief executive officer of Hospitality on 30 June 2013, but remains on the Board as a non-executive director. He was first appointed to the Board prior to the listing of the Company in 2006. He conceptualised and was actively involved with the setup of the Company. Prior to 2006, Gerald was managing director of Sycom Property Fund Managers Limited and a past Chairman of the Association of Property Unit Trust. He has more than 36 years’ experience in activities related to property with specific expertise in development, asset management as well as listed and directly held investment property vehicles, with a specific
focus on the hotel and leisure industry for the past eight years. Gerald was a non-executive director at year‑end, and fulfilled the role of acting CEO for the company up until the appointment of Vincent Joyner as CEO on 15 September 2015.
WILLY ROSS (71) Independent non-executiveCTA, CA(SA)
Willy has more than 32 years’ merchant and investment banking experience and was, until his retirement, responsible for the project and structured finance and private equity departments of Nedcor Investment Bank Limited as well as its risk and compliance functions. Post his retirement Willy has for the past 10 years served as Chairman or director on the Boards of a number of listed and unlisted companies including Kagiso Media Limited, Vunani Limited and Capital Property Fund (Chairman). Willy was appointed as an independent non-executive director in April 2007.
RIAAN ERASMUS (32) Acting Chief Financial Officer#
BCom (Accounting), CTA, CA(SA)
Riaan is a registered qualified chartered accountant and the acting chief financial officer of Hospitality. He was employed at SA French Limited and KPMG Inc. prior to joining Hospitality on 18 October 2010 as the Group financial manager.
* John Copelyn, Zibusiso Kganyago, Laurelle McDonald, Rob Nicolella and Marcel von Aulock were appointed to the Board with effect from 1 September 2016. Mara de Lima was appointed as Financial Director with effect from 30 September 2016. A brief CV of each of the newly appointed directors can be found on Hospitality’s website on http://www.hpf.co.za.
# Not a director of Hospitality Property Fund Limited.
HOSPITALITY PROPERTY FUND INTEGRATED ANNUAL REPORT 2016 31

According to the World Bank, global economic growth accelerated marginally to 3.1% in calendar year 2015 (2014: 2.6%). Growth was, however, negatively impacted in the second half of the year by softer economic activity in major economies, specifically the USA, Japan and other advanced Asian countries. The US and Eurozone recorded economic growth of 1.9% and 1.6% respectively while emerging market and overall economic activity in developing economies rose by 4.0% in 2015. This was driven largely by China whose economy was up 6.9% and India growing 7.3% in 2015.
In South Africa, the economy remained stagnant in 2015, with the GDP increasing by 1.3% (2014: 1.5%). This was due to a number of factors including a weak currency, a tighter monetary and fiscal policy and low commodity prices. Furthermore, political uncertainty, rising unemployment and weak consumer spending as well as low business confidence negatively affected the domestic economy and fixed direct investment in the country.
The South Africa Monetary Policy Committee’s (“MPC”) interest rate hiking cycle persisted through the year with four repurchase rate increases of 25 basis points. The rate rose from 5.75% on 1 July 2015 to 7.0% on 30 June 2016. A final 25 basis point rate hike is expected in the last two quarters of the calendar year, marking the top of the interest rate cycle. The MPC also revised its 2016 growth forecast for South Africa down from 0.9% in January 2016 to 0% at its July 2016 meeting.
International tourist arrivals were up 4.0% worldwide in 2015 (2014: 4.4%), with some 50 million more overnight tourists than in 2014, as reported by the United Nations World Tourism Organisation. This represents the sixth consecutive year of above average growth, driven by exchange rate fluctuations, lower oil prices and other commodities which released disposable income for travel in certain geographies. Emerging market tourism arrivals grew at about 4% while advanced destinations, including Europe, the Americas and Asia were up 5%. The WTO estimates that tourist arrivals to Africa and the Middle East were up by 3%.
Statistics South Africa reported that foreign tourist arrivals to South Africa in 2015 bucked the global growth trend, contracting for the first time since 2009. The number of foreign tourists travelling to South Africa in 2015 dropped by 6.8% (2014: +0.1%). However, the average length of stay was up 10.5% compared to 2014, rising to 9.5 days and revenue from international tourism grew 6.2% to R68.2 billion.
Factors influencing the downturn in visitor numbers included the new visa requirements that were implemented during the year. This made it difficult for visitors from countries where there are few South African visa processing centres such as India and China. A comparison of foreign arrivals between June 2014 and June 2015, showed that tourist arrivals from the top 10 countries was down with the exception of France. Following the public outcry regarding the impact of these regulations, government eased its new visa requirements and is in the process of modifying them. However, long lead times on international travel have meant that some of the negative impacts are still being felt on industry growth.
The trend reversed in the first quarter of 2016, with the number of tourists arriving in South Africa up 15%, reflecting benefits of the weaker Rand and relaxation of certain visa requirements.
Despite the lower foreign arrivals in 2015, Hospitality delivered a solid performance, underpinned by its well located portfolio of properties, with the weakening currency resulting in domestic tourists opting for local holidays and travel becoming more affordable for international tourists.
Visitors from the United Kingdom were once again the largest source of non‑African visitors to South Africa, increasing marginally by 1.4% (2014: (7.0%)), followed by visitors from the United States which shrank 3.8% in 2015 (2014: (10.9%)). China, with foreign arrivals increasing by 2.2% in 2015, was the only other top 10 country which showed positive growth in arrivals during the year.
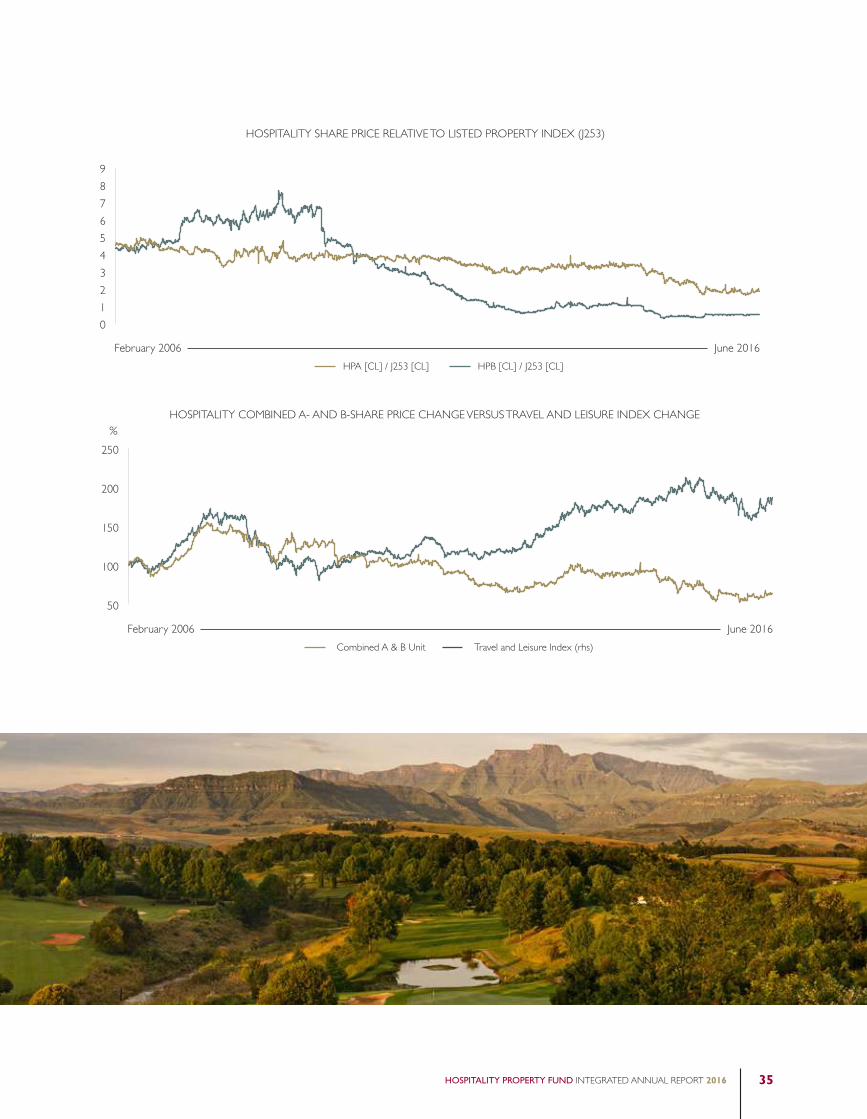
ECONOMIC AND BUSINESS OVERVIEWThe listed property sector significantly outperformed South African equities1 in the year to 30 June 2016 with SA Listed Property reflecting total returns of 11.04% versus the JSE ALSI’s 3.83%. This performance was driven by lower bonds yields and strong interest in property as an asset class among investors.
1 Measured by the return of the All Share Index.
HOSPITALITY PROPERTY FUND INTEGRATED ANNUAL REPORT 201632

The number of available hotel rooms in South Africa has been stable, with a cumulative increase of only 1% in the last four years as the industry consolidated following the rapid increase in supply in the run up to the 2010 Soccer World Cup. Against the backdrop of lower international arrivals and the tough domestic economy, average room rates in South Africa increased 6.5% in 2015 (2014: 7.0%), but are expected to rise by 9.4% in 2016. Occupancies edged up marginally to 59.6% (2014: 59.0%) and are expected to increase to 61.2% in 2016 (source: PwC).
Hotels in South Africa
Available rooms (000s)
2009 2010 2011 2012 2013 2014 2015 2016e 2017e 2018e 2019e 2020e
53.7 58.8 60.5 60.4 60.9 60.8 61.1 61.2 62 62.6 63.4 63.7
Source: PricewaterhouseCoopers LLP, Wilkofsky Gruen Associates.
Arabella Hotel and Spa, Kleinmond
PwC reported that despite lower foreign tourism, domestic travel increased in 2015, resulting in an 8.1% increase in stay unit nights. PwC projects that stay unit nights are on track to continue rising, but that the supply of rooms is unlikely to keep pace, leading to occupancy increasing from 59.6% in 2015 to 62.6% in 2020. Overall occupancies in South Africa for all hotels for the 12 months ended 30 June 2016 increased by 3.2% to 64.6% compared to the previous year, according to the Smith Travel Research (STR) Global South Africa Hotel Review. For the period under review, the average daily rate (ADR) increased by 8.0% to R1 133. Accordingly, RevPAR rose 11.4% to R733.
Hotel room revenue in South Africa, Nigeria, Mauritius, Kenya and Tanzania (R million)
2010 2011 2012 2013 2014 2015 2016 2017 2018 2019 2020
2016– 2020CAGR
South Africa 10 317 9 594 10 688 12 249 13 100 14 165 15 844 16 958 18 105 19 296 20 586
% change (7.0) 11.4 14.6 6.9 8.1 11.9 7.0 6.8 6.6 6.7 7.8
Nigeria 2 867 3 555 3 899 4 243 4 154 4 090 4 001 4 180 4 689 5 543 6 460
% change 24.0 9.7 8.8 (2.1) (1.5) (2.2) 4.5 12.2 18.2 16.5 9.6
Mauritius 6 867 7 432 7 715 7 037 7 376 7 870 8 874 9 651 10 696 11 813 13 000
% change 8.2 3.8 (8.8) 4.8 6.7 12.8 8.8 10.8 10.4 10.0 10.6
Kenya 5 518 7 161 6 664 6 537 6 053 6 422 6 524 6 601 7 110 7 849 8 627
% change 29.8 (6.9) (1.9) (7.4) 6.1 1.6 1.2 7.7 10.4 9.9 6.1
Tanzania 1 542 2 039 2 192 2 408 2 472 2 829 3 173 3 390 3 810 4 243 4 727
% change 32.2 7.5 9.9 2.7 14.4 12.2 6.8 12.4 11.4 11.4 10.8
Total hotel revenue 27 111 29 781 31 158 32 474 33 155 35 376 38 146 40 780 44 410 48 744 53 400
% change 9.8 4.6 4.2 2.1 6.7 8.6 6.2 8.9 9.8 9.6 8.6
Source: PricewaterhouseCoopers LLP, Wilkofsky Gruen Associates.
HOSPITALITY PROPERTY FUND INTEGRATED ANNUAL REPORT 2016 33

ECONOMIC AND BUSINESS OVERVIEW continued
The IMF estimates that global economic growth in 2016 will match 2015 levels, having recently adjusted its forecast slightly downwards following the outcome of the Brexit vote in the United Kingdom to leave the European Union. The IMF revised its expectation for that region to 1.7% for this year. Global economic activity is anticipated to improve in 2017 with 3.4% GDP growth. Meanwhile the economy in South Africa is expected to continue going sideways, according to MPC expectations, although the maturity shown by voters in the recent municipal elections could lead to improved business confidence.
LISTED PROPERTY SECTOR OVERVIEW
The South African-listed property sector saw several new listings in the year under review, bringing the number of listed property funds to 37, with a combined market capitalisation of R537 billion at the end of June 2016.
The listed property sector significantly outperformed equities in the year to 30 June 2016. This return was underpinned by bond yields, which remained low as well as better than anticipated earnings from property counters. However, investors are increasingly cautious that the momentum of distribution growth could be slowing.
Share prices in the listed property sector were temporarily impacted by several systemic shocks during the year, including the sudden dismissal of the South African Finance Minister in December 2015
and the unexpected outcome of the Brexit vote in the last few days of the financial year. These led to sudden drops in the index, however, values quickly corrected and the listed property sector’s return was almost threefold the return of the JSE All Share sector for the 12 months to 30 June 2016.
12 months
Asset classto June
2015to June
2016
SA Listed Property1 26.98% 11.04%Cash4 6.27% 6.85%
Bonds3 8.21% 5.24%
Equities2 4.79% 3.83%
Source: Catalyst Fund Managers, RMB Credit Research1 SA Listed Property Index2 All Share Index3 All Bond Index4 STEFI
For the 12 months to June 2016, SA Listed Property recorded the highest total return of 11.04%, compared to 26.98% in the prior 12-month period. SA Equities did not fare as well with a total return of 3.83% to June 2016 compared to 4.79% in the prior 12‑month period. SA Bonds and cash achieved returns of 5.24% and 6.85% for the 12 months to June 2016 respectively.
Champagne Sports Resort, Drakensberg
HOSPITALITY PROPERTY FUND INTEGRATED ANNUAL REPORT 201634
February 2006 June 2016
HOSPITALITY SHARE PRICE RELATIVE TO LISTED PROPERTY INDEX (J253)
0
1
2
3
4
5
6
7
8
9
HPA [CL] / J253 [CL] HPB [CL] / J253 [CL]
February 2006 June 2016
HOSPITALITY COMBINED A- AND B-SHARE PRICE CHANGE VERSUS TRAVEL AND LEISURE INDEX CHANGE
50
100
150
200
250
Combined A & B Unit Travel and Leisure Index (rhs)
%
HOSPITALITY PROPERTY FUND INTEGRATED ANNUAL REPORT 2016 35
EXECUTIVE FUND OVERVIEW
INTRODUCTIONThe 2016 financial year was positive for Hospitality, with all key financial metrics moving in the right direction. Rental income rose 9.3% to R474.6 million and distributable earnings increased by 16.8% to R271.9 million.
The achievement of several key milestones enhanced the long-term sustainability of the Fund and its ability to deliver on strategic objectives. These included the disposal of seven non-core properties for net proceeds of R189.9 million and obtaining shareholder approval for the simplification of the dual share structure into a single share.
Having obtained clearance from the Competition and having fulfilled certain administrative conditions precedent, the Tsogo transaction became effective on 1 September 2016 and is now on track for implementation during the first week of October. The transaction will increase Hospitality’s portfolio by 10 well-located properties, which will broaden the rental income pool through greater diversification.
TRADING ENVIRONMENTDespite the uncertain global and domestic economies, Hospitality delivered a pleasing performance for the year, with the combined distribution per A‑ and B‑share improving 18.0% (2015: down 14.44%) to 190.43 cents (2015: 161.36 cents) compared to the prior year. This comprises the A‑share distribution, which is up 5.0% to 155.62 cents (2015: 148.21 cents) and in line with the A‑share distribution policy as well as the B-share distribution of 34.81 cents (2015: 13.15 cents), reflecting an increase of 164.7%.
Trading conditions remain challenging, however the tourism sector has seen some improved growth, in particular in the Cape Town node. This was driven mainly by an increase in international leisure and local travellers as a result of the weaker Rand.
The STR Global South Africa Hotel Review reflected improved occupancies and room rates for the hotel industry during the year under review. Occupancy levels increased year-on-year for the same period by 3.2% to 64.6% and average daily rates (“ADR”) improved by 8.0% to R1 133. Revenue per available room (“RevPAR”) grew 11.4% for the year ended 30 June 2016 to R733.
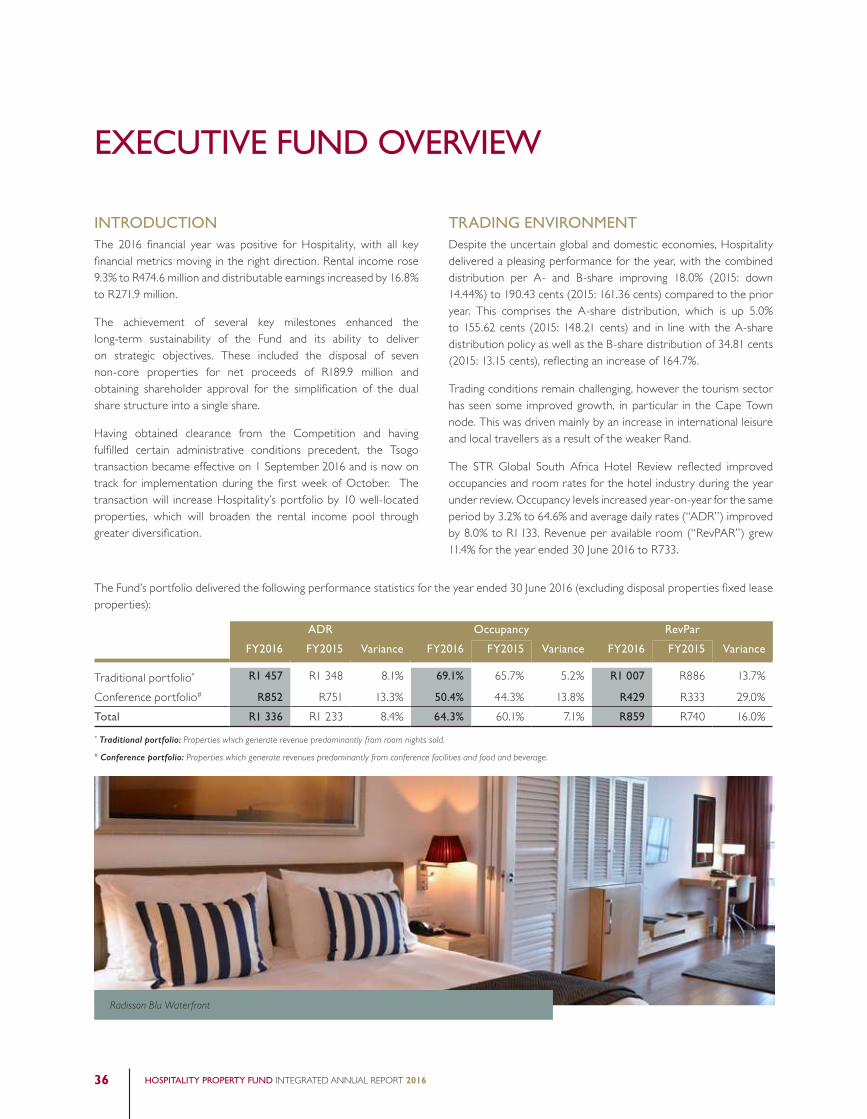
The Fund’s portfolio delivered the following performance statistics for the year ended 30 June 2016 (excluding disposal properties fixed lease properties):
ADR Occupancy RevPar
FY2016 FY2015 Variance FY2016 FY2015 Variance FY2016 FY2015 Variance
Traditional portfolio* R1 457 R1 348 8.1% 69.1% 65.7% 5.2% R1 007 R886 13.7%
Conference portfolio# R852 R751 13.3% 50.4% 44.3% 13.8% R429 R333 29.0%Total R1 336 R1 233 8.4% 64.3% 60.1% 7.1% R859 R740 16.0%* Traditional portfolio: Properties which generate revenue predominantly from room nights sold.
# Conference portfolio: Properties which generate revenues predominantly from conference facilities and food and beverage.
Radisson Blu Waterfront
HOSPITALITY PROPERTY FUND INTEGRATED ANNUAL REPORT 201636

PROPERTIES AND LEASESHospitality’s properties are categorised as traditional, conference and properties held for sale.
Traditional portfolio
The Fund’s traditional property portfolio comprises of 13 properties namely: Radisson Blu Waterfront, Arabella Hotel and Spa, Crowne Plaza Johannesburg – The Rosebank, Holiday Inn Sandton – Rivonia Road, Inn on the Square, Mount Grace Country House and Spa, Protea Hotel Edward, Protea Hotel Marine, Protea Hotel Victoria Junction, Radisson Blu Gautrain, Westin Cape Town and Champagne Sports Resort.
The traditional property portfolio recorded gross rental income of R410.3 million, accounting for 86% of total rental income.
Conference portfolio
The Fund’s conference property portfolio comprises two properties namely: Birchwood Hotel and OR Tambo Conference Centre and Kopanong Hotel and Conference Centre.
Both conferencing properties have F&V leases.
The conference property portfolio recorded gross rental income of R64.3 million, accounting for 14% of total rental income.
Properties held for sale
At year-end, the Fund held for sale two properties, namely the Protea Hotel Hazyview and Kopanong Hotel and Conference Centre. During the year, the Fund disposed of its interests in seven other for sale properties, namely the Protea Hotel The Richards; Protea Hotel Hluhluwe and Safaris; Premier Hotel King David and Protea Hotel Imperial: Protea Hotel The Winkler, The Bayshore Inn and the Protea Hotel Richards Bay properties for net proceeds of R189.9 million.
Both the remaining properties held for sale, have F&V leases in place. Their total gross rental income for the year ended 30 June 2016 amounted to R13.5 million or 3% of total rental income.
RESULTSRental income for the Fund increased 9.3% to R474.6 million (2015: R434.1 million), including the impact of the seven non‑core properties disposed of during the year and the disposal of the Fund’s 50% interest in the Courtyard portfolio in the prior year. Like‑for‑like rental income (adjusted for the impact of disposals) grew 13.7% to R462.8 million.
The Fund’s rental income growth was bolstered by its well-located hotel properties in the Western Cape that continue to appeal to domestic and international travellers alike, with overall rental income growth of 31.4% compared to the prior year. Furthermore, Mount Grace Country House and Spa showed a significant improvement as the management company bedded down its sales and marketing strategies with positive results, delivering a rental income growth of 68.1% to R15.3 million. The new fixed lease at Champagne Sports Resort, which commenced on 1 July 2015, dampened the overall growth in rental income by R6.2 million.
Hospitality’s overall expenses increased 10.3% to R44.9 million (2015: R40.7 million). The major impact was the staff incentive bonus provision of R5.8 million, reflecting the improved performance of the Fund. Increases in other expenses were largely in line with inflation. When excluding staff incentive bonuses, Fund expenses remained flat year-on-year.
Mario Monica – Group Facilities Manager and Leon Meyer – Vice President Asset Management
HOSPITALITY PROPERTY FUND INTEGRATED ANNUAL REPORT 2016 37

EXECUTIVE FUND OVERVIEW continued
Facility(R’s)
Drawn down(R’s) Interest rate
Repaymentdate
Nedbank – Property FacilityLoan 1 176 300 000 176 300 000 3-month JIBAR plus 2.67% Feb 2020
Loan 2 400 000 000 346 070 000 3-month JIBAR plus 2.8% Oct 2019
Loan 3 30 250 000 30 250 000 3-month JIBAR plus 2.85% Oct 2018
Loan 4 150 000 000 150 000 000 3-month JIBAR plus 2.38% Feb 2018
Loan 7 67 000 000 35 248 080 3-month JIBAR plus 2.38% July 2018
Loan 8 (Revolving loan) 150 000 000 14 995 143 3-month JIBAR plus 2.75% July 2018
Loan 9 (Annexed facility) 100 000 000 2 200 000 3-month JIBAR plus 2.78% April 2019
1 073 550 000 755 063 223
Corporate bondsSecured – HPF 04.1 300 000 000 300 000 000 3-month JIBAR plus 2.0% Feb 2017Secured – HPF 04.2 100 000 000 100 000 000 3-month JIBAR plus 2.0% Feb 2017Secured – HPF 05 200 000 000 200 000 000 Fixed at 9.89% Feb 2017Secured – HPF 06 60 000 000 60 000 000 3-month JIBAR plus 2.8% Feb 2020Secured – HPF 07 80 000 000 80 000 000 3-month JIBAR plus 2.25% Aug 2017Unsecured – HPF 08 80 000 000 80 000 000 3-month JIBAR plus 3.00% April 2019
Secured – HPF 09 150 000 000 150 000 000 3-month JIBAR plus 2.25% April 2019
970 000 000 970 000 000
Total facilities/debt 2 043 550 000 1 725 063 223
Swaps/Fixed loansNedbank swap 1 150 000 000 150 000 000 Collar swap – Floor 6.0%/Ceiling 9.09% Sep 2016
Nedbank swap 2 150 000 000 150 000 000 Vanilla swap – 6.4% Oct 2016
Nedbank swap 3 100 000 000 100 000 000 Vanilla swap – 7.05% Sep 2017
RMB swap 4 100 000 000 100 000 000 Vanilla swap – 7.05% Sep 2017
RMB swap 5 250 000 000 250 000 000 Vanilla swap – 7.88% Feb 2019
RMB swap 6 346 667 000 346 667 000 Vanilla swap – 6.66% Jun 2018
Secured – HPF 05 200 000 000 200 000 000 Fixed at 9.89% Feb 2017
1 296 667 000 1 296 667 000
% hedged of total debt 63% 75%
The following table reflects the operating financial results for the year ended 30 June 2016 compared to the previous financial period:
Summary of operating results for the year ended 30 June 2016
Actual2016
(R’000)
Actual2015
(R’000)Variance
(R’000)Variance
(%)
Contractual rental income 474 553 434 112 40 441 9.3Fund expenses (44 852) (40 674) (4 178) 10.3Net finance cost (158 085) (160 888) 2 803 (1.7)HPF Employee Incentive Trust net effects – 178 (178) (100.0)Taxation (9) (116) 107 (92.2)
Income from associates 264 203 61 30.0
Profit before distribution/debenture interest 271 871 232 815 39 056 16.8
Distribution to shareholders/linked-unit holders (271 871) (232 815) (39 056) 16.8
A-share distribution (224 539) (213 845) (10 694) 5.0
B-share distribution (47 332) (18 970) (28 362) 149.5
HOSPITALITY PROPERTY FUND INTEGRATED ANNUAL REPORT 201638

0
100
200
300
400
500
600
700
Nedbank Secured note Unsecured note
DEBT MATURITY (CALENDAR YEAR)
Q4:
2016
Q2:
2017
Q1:
2017
Q4:
2017
Q3:
2017
Q2:
2018
Q1:
2018
Q4:
2018
Q3:
2018
Q2:
2019
Q1:
2019
Q4:
2019
Q3:
2019
Q1:
2020
DEBT PROFILE AS AT 30 JUNE 2016
Hedged 63% Unhedged 37%
Net finance costs decreased marginally to R158.1 million (2015: R160.9 million) due to the application of proceeds from the sale of properties to reduce debt.
FUNDINGThe Group’s debt facilities with financial institutions as at 30 June 2016 amounted to R2.04 billion. Total drawn facilities were R1.73 billion resulting in a loan to value (LTV) ratio (total interest-bearing liabilities/investment properties plus properties held for sale) of 32.6% (2015: 36.2%). The interest cover ratio improved to 2.72 times (2015: 2.45 times), well above the minimum required debt covenant level of 2.00 times.
The weighted average cost of borrowings (WACC) was 9.58% (2015: 9.12%) for the period under review, with 63.5% of the Group’s borrowings hedged.
In order to replace an existing swap that expired February 2016, the Fund entered into a new interest rate swap of R250 million at a rate of 7.88%, commencing February 2016.
The Fund is currently engaging with financial institutions and potential investors to refinance notes to the total value of R600 million, to replace the current notes of the same value, expiring in February 2017.
When issuing new debt the Group endeavours to optimally spread the maturity to minimise its exposure to large debt maturities in any single year.
REIT CAPITAL STRUCTUREIn order to comply with REITs gearing requirement in terms of the JSE Limited Listing Requirements, restructuring of the Company’s linked unit capital structure to a simple “all share” structure, by way of a scheme of arrangement in terms of sections 114 and 115 of the Companies Act, 71 of 2008 (“the Act”) and the adoption of a new Memorandum of Incorporation to take account of the change in the Company’s capital structure, received the requisite approval from both A- and B-linked unitholders at Special General Meetings (“SGMs”) held on 21 August 2015.
DISSENTING SHAREHOLDER APPRAISAL RIGHTSSubsequent to the SGMs, shareholders representing 2.8% of total shares in issue or 8 320 397 B-shares (“the appraisal shares”) exercised their appraisal rights and demanded fair value for their shares in terms of section 164(5) of the Act.
The Board determined a fair value of R2.90 per appraisal share, which amounts to a total fair value of R24.1 million. In terms of section 164(14)(b), the dissenting shareholders have applied to the court to determine a fair value. In-line with section 164(9), the appraisal shares have no further rights, other than to be paid their fair value and as a result, the appraisal shares are now considered treasury shares by the Company for accounting treatment purposes.
HOSPITALITY PROPERTY FUND INTEGRATED ANNUAL REPORT 2016 39

Had appraisal rights not been exercised, the B-share distribution, for the period under review, would have amounted to 15.93 cents, as opposed to declared distribution no. 21 of 17.94 cents and would have amounted to an increase of 293.7%, instead of the declared increase of 345.2%.
TSOGO TRANSACTION AND CAPITAL RESTRUCTURESalient terms
The acquisition by Hospitality from Southern Sun Hotels Proprietary Limited (“SSH”), (a wholly owned subsidiary of Tsogo Sun Holdings Limited (“Tsogo”)) of a portfolio of 10 hotel properties valued at R1.78 billion (“the Transaction”) through the acquisition of 100% of the issued shares of a newly incorporated company, and the restructure of Hospitality’s dual-class share capital structure to a single-class share capital structure (“the Restructure”), was approved in general meeting by the requisite majority of shareholders. The applied ratio of shares being issued in the Restructure is one ordinary share for every one A-share held and one ordinary share for every 3.5 B‑shares held.
The transaction received Competition Tribunal approval on 10 August 2016, subject to conditions accepted by both Hospitality and Tsogo and became effective on 1 September 2016.
The purchase consideration will be settled through the issue of 145 million Hospitality shares (“consideration shares”). On completion of the transaction, Tsogo’s holding will increase to more than 50% of Hospitality’s ordinary shares.
Rationale
The Transaction presents an attractive acquisition of 10 successful and established hotel properties for Hospitality, all of which are well located within their respective nodes. The Transaction will contribute to a diversification of Hospitality’s earnings base and should introduce an additional element of stability to earnings, through exposure to the relatively predictable cash flows generated by the Tsogo Portfolio. As the Tsogo Portfolio will be acquired free of any debt, the Transaction will also bring about a reduction of Hospitality’s gearing ratio from 32.6% as at 30 June 2016 to 24.4%, which together with Hospitality’s greater scale and inclusion as part of the Tsogo group, is expected to both enhance Hospitality’s B-BBEE ownership and credit rating. This should in turn reduce the Fund’s future cost of funding.
The simplified capital structure will enable Hospitality to more fully deliver on its strategic objectives in the longer-term. It is also anticipated that the Transaction will see Hospitality forming the platform for Tsogo’s stated strategy of growing a hospitality-focused REIT. It therefore provides Hospitality with exciting future growth prospects and an attractive pipeline of acquisitions in the medium-term.
EXECUTIVE FUND OVERVIEW continued
PROPERTY PORTFOLIOThe Fund’s portfolio comprises interests in 15 hotel and resort properties in South Africa. The weighted average lease expiry period is 10.72 years. As at 30 June 2016, the carrying amount of the portfolio was R5.3 billion and the net asset value (NAV) per combined A‑ and B‑share amounted to R12.93, an increase of 10.1% from 2015. The market value per combined A‑ and B‑share at the end of the financial year traded at a 41.3% discount to the NAV.
Acquisitions and disposals
To date, the Fund’s investment strategy has been to invest in well-located, large hotels in major urban centres with strong brands and diverse source markets and to dispose of certain properties which do not meet these criteria. The Fund also continues to investigate long-term growth and investment opportunities. The Tsogo transaction will provide additional scale to the current portfolio and present opportunities for further growth in line with the Fund’s property investment strategy.
The Fund had previously identified several non‑core properties for disposal. In the past 12 months, seven properties were disposed of amounting to a total net consideration of R189.9 million. These included the Protea Hotel The Richards; Protea Hotel Hluhluwe and Safaris; Premier Hotel King David and Protea Hotel Imperial; Protea Hotel The Winkler, Bayshore Inn and the Protea Hotel Richards Bay properties. The Protea Hotel Hazyview and Kopanong Hotel and Conference Centre remain on the disposal list.
During the year, the Fund acquired three additional units at the Radisson Blu Waterfront for R14.3 million, bringing its total interest in the property rental pool to 55.8%.
PROPERTY DEVELOPMENTS AND CAPITAL PROJECTSIn order to maintain the appeal of its hotels, the Fund continually upgrades and invests in its properties. During the year, the total capital expenditure amounted to R102.9 million, which included:
• Thirty additional rooms were developed at the Protea Hotel Edward, at a total cost of R19.8 million increasing the number of rooms to 131.
• At Birchwood Hotel R14.0 million was spent on the refurbishment of 82 rooms that now forms part of the Silverbirch hotel section.
• At Champagne Sports Resorts, R14.0 million was spent on acquiring all movable assets from the tenant.
The Fund is cognisant of future refurbishment projects that will require additional capital investment and continues to investigate options to deal with this on a long-term sustainable basis.
HOSPITALITY PROPERTY FUND INTEGRATED ANNUAL REPORT 201640

PORTFOLIO AND ASSET MANAGEMENTHospitality’s portfolio is diversified (page 12 to 13) in terms of geographic location, grading, fixed and variable income, lease expiry profile, market mix and brands. However, it is the Fund’s portfolio and asset management expertise which ensures its long-term ability to deliver on the return potential of these assets whilst mitigating the inherent risks.
Selection of the tenant, management company and hotel brand, best suited to a specific property, is crucial to effectively manage the operational risks and maximising the performance of each hotel. Conclusion of leases with tenants is preceded by a formal process to establish the best fit between the hotel property, tenant and brand to ensure optimal performance of the property. Proposals are initially obtained from selected tenants and are evaluated by the Investment Committee who makes a recommendation to the Board for final approval.
Tenant default is a potential financial risk to the Fund, but can be effectively mitigated by monitoring the property’s underlying trading conditions with regular and formal engagement. Ingrained in Hospitality’s operating model is its philosophy of building long-term relationships with tenants to develop an intimate understanding of their businesses and performance. The Fund engages regularly with its tenants through meetings and formal reports. In addition, extensive peer group benchmarking, statistical analysis and reviews of economic trends are conducted by the Fund and the findings are shared with tenants to optimise the performance of the properties.
Among the challenges in the current operating environment are the substantial increases in overhead costs, particularly administered prices such as electricity, water and municipal rates. As these costs are not under the control of the Fund, the focus is on proactively managing consumption through energy and water-saving initiatives. The management of labour costs, especially against the backdrop of prevailing wage settlement levels, generally exceeding inflation, is an ongoing challenge.
Centralised procurement platforms have been formalised at most of the hotels to negotiate bulk supply arrangements with major suppliers to minimise the cost of consumables.
During the year though, Hospitality adopted a more focused approach to managing its hotel portfolio. This is in line with the strategic direction provided by the Board and led by its operational requirements and asset management objectives. In the year ahead the operational responsibilities at its hotel properties will be fully borne by the management companies, allowing Hospitality to concentrate more specifically on strategic performance metrics.
As a result of this streamlining, two positions in the asset management team became redundant, namely one (of two) Vice President Asset Management and the Revenue Manager, effective 29 July 2016. The impact of these redundancies on the Fund’s ability to effectively manage its portfolio and generate shareholder returns has been
well assessed. Management is confident that this change will not impact the quality and professionalism of its daily operations.
SHARE TRADING LIQUIDITYDuring the period under review, 20.8% of the A‑shares/linked units and 78.0% of the B‑shares/linked units were traded on the JSE. Of the total number B‑shares/linked unit traded, 55.0% related to open market acquisitions by Tsogo, as disclosed on SENS on 26 August 2015.
PROSPECTSDespite the local currency stabilised after the end of the financial year, the overall weakening of the Rand buoyed the South African hospitality sector, despite the weak domestic economy. South Africa has become a more affordable destination for international tourists and there has been an increase in domestic travellers. The corporate sector while under pressure have shown resilience. Although public sector spending remains under continued pressure, this is partially offset by the approval of increased rates on travel budgets.
Inflation is expected to rise as a consequence of the weaker Rand and the drought impact, putting upward pressure on hotel operating costs.
Looking ahead, the Fund is well-positioned, with upside potential for rates in hotels located in high tourist areas particularly the Western Cape from the international leisure sector. The domestic business and leisure sector is expected to be stable. Public sector conferencing, which slowed in the run up to the municipal elections, is expected to normalise.
Kim Irmler – Vice President Investments
HOSPITALITY PROPERTY FUND INTEGRATED ANNUAL REPORT 2016 41

Responsibility for governance
The Board maintains control of the Company and is responsible for its performance and compliance. The Board is the focal point of corporate governance for the Group. It takes responsibility and ensures that the necessary structures and processes are in place to create a governance framework for responsible leadership and the sustainable success of the Group. It recognises that strategy, risk, sustainability and performance are interlinked.
CORPORATE GOVERNANCE
The guiding principles set in King III are continuously considered for application throughout the Group. Existing policies and procedures are reviewed and where necessary new policies are adopted and implemented in order to strengthen governance and its processes within the Group. The Group’s application of the King III principles is set out further below.
Natural reserve usage Environmental management
Pollution prevention
Communication Standard of living
Education Human capital
community
Profit Growth
Cost management Strategy and
structure
Environmental
EconomicSocial
SUSTAINABILITY
Equal opportunity
IDENTIFY
MEASURE
ASSESS
MANAGE
HOSPITALITY PROPERTY FUND INTEGRATED ANNUAL REPORT 201642

HOSPITALITY PROPERTY FUND INTEGRATED ANNUAL REPORT 2016 43
The Board and its Committees
CHANGES IN BOARD COMPOSITION
Mr Vincent Joyner was appointed as the Chief Executive Officer (“CEO”) of the Company on 15 September 2015. Mr Riaan Erasmus, the former Group Financial Manager, took on the role as acting Financial Director (“FD”) from Mr Ridwaan Asmal, who resigned on 12 August 2015. Mr Erasmus has not been appointed to the Board. On request from the Board, the JSE Limited granted Hospitality extension to 30 September 2016 to appoint a FD. Mrs Mara de Lima was appointed as permanent FD with effect from 30 September 2016. Mr Erasmus will continue in the role of Senior Group Financial and Treasury Manager.
COMPOSITION, ROLES, RESPONSIBILITIES AND FOCUS AREAS
At year-end the Board comprised six independent non-executive directors, one non-executive director and one executive director.
The Board meets at least four times a year and holds an annual strategy session. During the 2016 financial year, the Board met seven times.
BOARD AND COMMITTEE COMPOSITION
The Board and Board Committee operates within their defined terms of reference and the Fund’s Memorandum of Incorporation (“MOI”). A copy of the most recent MOI can be found on the Company’s website at http://www.hpf.co.za.
Terms of references are reviewed annually by the Board in order to ensure compliance with best practice and alignment with changing legislation. The Board and each Board Committee is chaired by an independent non-executive director. Committee Chairmen report back to the Board at its quarterly Board meetings.
BOARD OF DIRECTORS
Finance team External audit Analyst team
Internal audit
Audit and Risk Committee
Nomination Committee
Investment Committee
Remuneration Committee
Executive Committee
Company Secretary
Stakeholders
Social and Ethics Committee
Governance framework
HOSPITALITY PROPERTY FUND INTEGRATED ANNUAL REPORT 2016 43

AUDIT ANDRISK COMMITTEE
L de Beer (Chairman)SA HallidayZN Malinga
Board and committee composition
Independent non-executiveDG Bowden (Chairman) ZN MalingaL de Beer WC RossSA HallidayZN Kubukeli
ExecutiveVM Joyner# (Chief Executive Officer)
Non-executiveGA Nelson�
NOMINATIONCOMMITTEE
DG Bowden (Chairman)L de Beer
ZN KubukeliGA Nelson
SOCIAL ANDETHICS COMMITTEE
ZN Kubukeli (Chairman)R ErasmusVM JoynerG Nelson
INVESTMENTCOMMITTEE
WC Ross (Chairman)SA HallidayZN KubukeliGA Nelson
REMUNERATIONCOMMITTEE
WC Ross (Chairman)DG BowdenGA Nelson
BOARD OF DIRECTORS
# Appointed 15 September 2015.� Mr Nelson served as Acting CEO from 12 August 2015 to 31 December 2015. Since then he has had involvement only with specific projects and will be reclassified by the Board as
independent with effect from 1 January 2017.
CORPORATE GOVERNANCE continued
HOSPITALITY PROPERTY FUND INTEGRATED ANNUAL REPORT 201644

The table below contains summaries of the roles and responsibilities of the Board and the Board Committees as well as key focus areas for 2017. Key focus areas which were addressed during the 2016 financial year included:
1. The restructure of the Fund’s dual-class share capital structure to a single-class share capital structure (“the Restructure”), which was approved by the requisite majority of shareholders at a general meeting held on 11 April 2016. The Restructure, which will be implemented on 11 October 2016, will align previously opposing shareholder objectives and will introduce an element of stability to shareholder distributions. Details of the Restructure can be found on page 40.
2. The enhancement of the risk identification and risk management processes, further details of which can be found in the Risk Report on page 58.
A review and expansion of the Group’s procurement policies and processes. BDO South African was contracted to assess the existing policies and processes and to make recommendations on the documenting and implementation of enhanced policies and processes.
Summary of roles and responsibilities Members
Meetingattendance(includes a
strategicsession)
Hospitality Board(“the Board”)
Role and responsibilities of the Chairman• Provide leadership to the Board and the Company.• Responsible for the effective functioning of the Board and its committees.• Acts as a direct liaison between the Board and the management of the
Company, through the CEO.• Directors and management have unrestricted access to the Chairman.
Role and responsibilities of the Board• Accountable to shareholders and acts in the best interest of the Company.• Exercises control of the Group and provides leadership and strategic
direction.• Monitors the implementation of strategies by management in order to
create sustainable results.• Sets the ethical standard of conduct for the Group.• Ensures the implementation of a Group risk management framework.• Monitors the Group’s performance.
Key focus areas for 2017• Diversifying the Fund’s financing structure.• Monitor the level of hedging and debt maturity profile of the Fund.• Consider the current size of the Board, its composition and the
requirement for specific skills on its respective committees.• Monitor the integration of 10 Tsogo properties and any other potential
Tsogo hotel assets into the Hospitality portfolio.• Oversee shareholder and stakeholder relationships.
DG Bowden (Chairman)L de BeerSA HallidayVM Joyner#
ZN KubukeliGA NelsonZN MalingaW C Ross
7 of 77 of 77 of 76 of 67 of 77 of 76 of 77 of 7
HOSPITALITY PROPERTY FUND INTEGRATED ANNUAL REPORT 2016 45

Summary of roles and responsibilities Members
Meetingattendance(includes a
strategicsession)
Audit and Risk Committee(“ARC”)
Role and responsibilities of the Committee• Reviews the Group’s financial statements and oversees integrated
reporting.• Carries out its statutory duties set out in section 90 of the Companies
Act, 2008.• Satisfies itself of the expertise and experience of the FD and the Fund’s
finance function.• Considers and recommends the risk policy, framework and plan to the
Board for approval and monitor the implementation thereof.• Assists the Social and Ethics Committee with its responsibility of
monitoring ethics by overseeing the Company’s fraud and anti-corruption policy and process.
• Interacts with the external auditor.
The ARC report can be found on page 69.
Meetings and conduct• The Chairman of the Board, CEO, FD, Group Financial Manager and
external auditor attend Committee meetings by invitation.• The external auditor has unrestricted access to the Committee and its
Chairman.• The external auditor meets with the members of the Committee
biannually to report their findings to the Committee without members of the executive Committee in attendance.
Key focus areas for 2017• Continue to monitor the risk management and risk identification
processes.• Expanding the reach and independence of an internal audit function.• Reviews IT governance, controls and infrastructure and assess potential
cyber security risks.
L de Beer (Chairman)SA HallidayZN Malinga
5 of 55 of 55 of 5
Investment Committee(“Investco”)
Role and responsibilities of the Committee• Considers the viability of capital projects, strategic and operational plans,
structuring of borrowings, acquisitions and disposals of property in-line with the Company’s strategy and objectives and the effect it may have on the Fund.
• Authorises and approves transactions and projects and to recommend feasible proposals to the Board for ratification.
Meetings and conduct• The CEO, FD and Vice-President Asset Management attend meetings
by invitation.
WC Ross (Chairman)SA HallidayZN KubukeliGA Nelson
4 of 43 of 43 of 44 of 4
CORPORATE GOVERNANCE continued
HOSPITALITY PROPERTY FUND INTEGRATED ANNUAL REPORT 201646
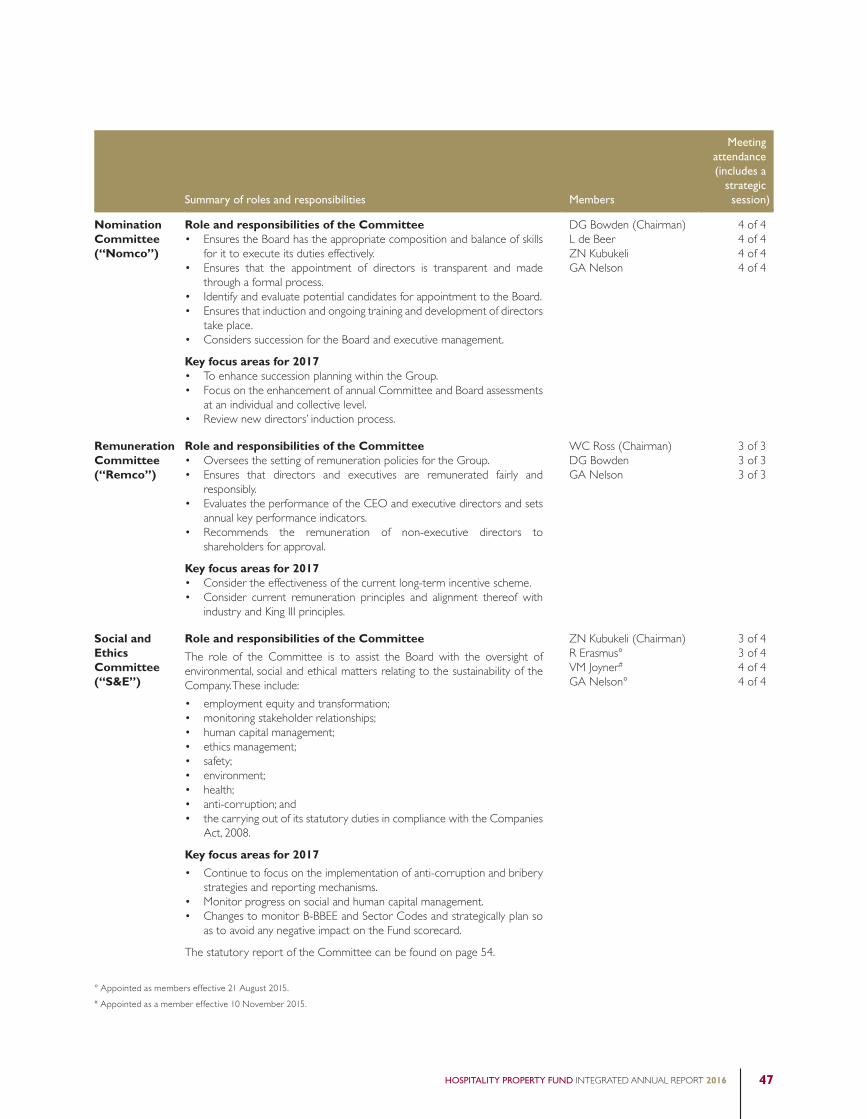
Summary of roles and responsibilities Members
Meetingattendance(includes a
strategicsession)
Nomination Committee(“Nomco”)
Role and responsibilities of the Committee• Ensures the Board has the appropriate composition and balance of skills
for it to execute its duties effectively.• Ensures that the appointment of directors is transparent and made
through a formal process.• Identify and evaluate potential candidates for appointment to the Board.• Ensures that induction and ongoing training and development of directors
take place.• Considers succession for the Board and executive management.
Key focus areas for 2017• To enhance succession planning within the Group.• Focus on the enhancement of annual Committee and Board assessments
at an individual and collective level.• Review new directors’ induction process.
DG Bowden (Chairman)L de BeerZN KubukeliGA Nelson
4 of 44 of 44 of 44 of 4
Remuneration Committee(“Remco”)
Role and responsibilities of the Committee• Oversees the setting of remuneration policies for the Group.• Ensures that directors and executives are remunerated fairly and
responsibly.• Evaluates the performance of the CEO and executive directors and sets
annual key performance indicators.• Recommends the remuneration of non-executive directors to
shareholders for approval.
Key focus areas for 2017• Consider the effectiveness of the current long-term incentive scheme.• Consider current remuneration principles and alignment thereof with
industry and King III principles.
WC Ross (Chairman)DG BowdenGA Nelson
3 of 33 of 33 of 3
Social and Ethics Committee(“S&E”)
Role and responsibilities of the Committee
The role of the Committee is to assist the Board with the oversight of environmental, social and ethical matters relating to the sustainability of the Company. These include:
• employment equity and transformation;• monitoring stakeholder relationships;• human capital management;• ethics management;• safety;• environment;• health;• anti-corruption; and• the carrying out of its statutory duties in compliance with the Companies
Act, 2008.
Key focus areas for 2017
• Continue to focus on the implementation of anti-corruption and bribery strategies and reporting mechanisms.
• Monitor progress on social and human capital management.• Changes to monitor B-BBEE and Sector Codes and strategically plan so
as to avoid any negative impact on the Fund scorecard.
The statutory report of the Committee can be found on page 54.
ZN Kubukeli (Chairman)R Erasmus°VM Joyner#
GA Nelson°
3 of 43 of 44 of 44 of 4
° Appointed as members effective 21 August 2015.# Appointed as a member effective 10 November 2015.
HOSPITALITY PROPERTY FUND INTEGRATED ANNUAL REPORT 2016 47

COMPANY SECRETARYThe Company Secretary is responsible for the statutory administration of the Group and ensures that all regulations and governance codes are observed. She supports the Board in performing its functions and ensures that Board and committee processes and procedures are implemented. She provides guidance to Management and the Board on governance, compliance and their fiduciary duties.
Directors have unrestricted access to the advice and services of the Company Secretary.
Rosa van Onselen is the appointed Company Secretary. She has 17 years’ experience in company secretariat, which includes 11 years with listed entities.
She is not a member of the Board and the Board is therefore satisfied that an arm’s length relationship exists between the Board of Directors, the executive team, individual directors and the Company Secretary.
The Board is satisfied that the Company Secretary is competent and has the appropriate qualifications and experience required by the Group.
SEGREGATION OF DUTIES AND INTERNAL CONTROLSThe Group has established and maintains financial and operational systems of internal control to support the reliability of financial statements, ensure that transactions are concluded in accordance with management’s authority, are accurately recorded and that the Group’s assets are appropriately protected against material losses, unauthorised disposals or acquisitions.
These systems include policies and procedures regarding authorisation and the segregation of duties.
The internal controls, including internal financial controls are documented and assessed by Management and considered by the ARC. In the current financial year, the external audit scope was expanded in order to test internal financial controls which had been enhanced and adopted during the 2016 financial year to deal with any control deficiencies recognised in the 2015 financial year.
The Board takes responsibility for the Company’s internal controls. At this point in time no written independent assessment of internal controls is obtained as internal audit functions are only operational at individual hotel level. The Fund does not have an internal audit function. In 2016, focus will be placed on expanding the internal audit function, as reported above.
DELEGATION OF AUTHORITYThe formal delegation of authorities is set out in the terms of reference of each committee of the Board as well as to Management. Authority limits to conduct the daily operations of the Company have been approved by the Board and management acts within these authorities.
WHISTLE BLOWINGA whistle-blowing channel is in place at Group and hotel operator levels and is independently managed by Deloitte. All tip-offs are investigated, followed up, resolved and reported to the ARC and/or the Social and Ethics Committee.
CODE OF ETHICSThe ethical character and morals of Hospitality are set by the Board and flows through to management, who are tasked to lead by example.
The code of ethics adopted by the Board, is underpinned by supporting policies which include the conflicts of interest and share dealing policies.
ASSURANCE OF THE INTEGRATED REPORTThe Board has reviewed and approved the integrated report after satisfying itself of the integrity of the report insofar as it highlights matters material to the Fund and provides a balanced view of the Fund’s strategy to maintain and create value in a sustainable manner over the long term.
The process of integrated reporting continues to evolve and at this early stage the Group has not sought external verification of the content or part thereof apart from the annual financial statements, which the external auditor, KPMG Inc. has provided assurance on, as confirmed in the independent auditor’s report.
APPLICATION OF KING IIIIn compliance with the guidance note on corporate governance, issued by the JSE Limited on 31 January 2013, the report below addresses the application of all the principles contained in Chapter 2of the King Code and highlights areas of non or partial compliance.
Every one of the 75 King principles are addressed in the form of a register on the Hospitality website http://wwww.hpf.co.za.
CORPORATE GOVERNANCE continued
HOSPITALITY PROPERTY FUND INTEGRATED ANNUAL REPORT 201648
APPLICATION OF KING III
Principle Status Application
Boards and directors
2.1 The Board should act as the focal point for and custodian of corporate governance.
Applied (Refer to page 42 – Governance)
2.2 The Board should appreciate that strategy, risk, performance and sustainability are inseparable.
Applied (Refer to page 42 – Governance)The Board controls the Group and provides strong leadership, with the purpose that the fulfilment of its strategies will create sustainable results for its stakeholders.
2.3 The Board should provide effective leadership based on an ethical foundation.
Applied (Refer to pages 42 and 48 – Governance). The ethical character and morals of the Group are set by the Board and flows through to management, who are tasked to lead by example.
The code of ethics adopted by the Board, is underpinned by supporting policies which include the conflicts of interest and share dealing policies.
The Group has an independently managed whistle-blowing channel and stakeholders are motivated to report any form of misconduct, bribery or corruption.
2.4 The Board should ensure that the Company is and is seen to be a responsible corporate citizen.
Applied (Refer to page 54 – Social and Ethics report).
2.5 The Board should ensure that the Company’s ethics are managed effectively.
Applied See principle 2.3 and 2.4
2.6 The Board should ensure that the Company has an effective and independent Audit Committee.
Applied (Refer to page 46 – Governance Report). The Board is comfortable with the effectiveness of the Group’s ARC. The Committee’s report can be found on page 69 and confirms that the Committee has fulfilled its duties as set out in the Companies Act, its terms of reference and King III.
2.7 The Board should be responsible for the governance of risk.
Applied (Refer to page 58 – Risk Report). Key risk areas have been identified by the Board. These risks are assessed and revised as part of the Group’s strategy and as changes occur in the economic and business environment in which it operates.
2.8 The Board should be responsible for information technology (“IT”) governance.
Partially applied The ARC oversees the governance of information technology as part of its monitoring of the Group’s risk framework.
A Protection of Personal Information Act, 2013 (“POPI”) specialist had been engaged to advise on the implementation requirements and impact on the Fund and its individual properties and in this regard a detailed review of Hospitality’s leases was undertaken. The Fund’s lease agreements provide for tenants to apply and comply with all applicable legislation. Tenant have been requested to document their POPI compliance to Hospitality. In the event of partial or non-compliance, tenants have been requested to provide an action plan and timeline for implementation.
Training on POPI will be conducted at Head Office.
Due to the hotels being in possession of extensive customer information, policies and procedures have been implemented to protect this data.
Management is responsible for the monitoring of information technology governance at head office level and also reviews information technology governance at its hotels and report back to the ARC thereof.
Emphasis will be placed on IT governance as part of internal audit. Reporting on IT governance to the ARC will be further refinement.
HOSPITALITY PROPERTY FUND INTEGRATED ANNUAL REPORT 2016 49

Principle Status Application
2.9 The Board should ensure that the Company complies with applicable laws and considers adherence to non-binding rules, codes and standards.
Partially applied The Group’s ARC assists the Board in ensuring compliance with applicable laws and regulations. Although the Group has no dedicated compliance function, each department takes responsibility for ensuring compliance with relevant laws, codes and standards.
Reporting to the Board is being refined through the implementation of the Group’s Integrated Risk Management Approach (“IRMA”), as set out under the Risk Report on page 58.
2.10 The Board should ensure that there is an effective risk-based internal audit.
Partially applied (Refer to page 48 – Governance Report and page 60 – Risk Report). Limited scope internal audit functions have been implemented at hotels and are monitored by management and reported on to the ARC. Currently internal audit focus mainly on operational and financial risks. This will be expanded on in future.
2.11 The Board should appreciate that stakeholders’ perceptions affect the Company’s reputation.
Applied (Refer to page 66 – Stakeholder Engagement).
2.12 The Board should ensure the integrity of the Company’s integrated report.
Applied (Refer to page 48 – Governance Report).
2.13 The Board should report on the effectiveness of the Company’s system of internal controls.
Partially applied (Refer to page 48 – Governance Report). The Board is comfortable that internal controls are in place. At this point in time no written independent assessment of internal controls is obtained.
2.14 The Board and its directors should act in the best interests of the Company.
Applied Directors act within the Company’s terms of reference and code of ethics. The Company Secretary ensures that the directors are aware of their fiduciary duties. Directors declare any conflicts of interest they may have in any particular transaction and/or decision and are recused from all discussions and involvement pertaining to such transactions and/or decisions. Directors may only deal in the Company’s securities in accordance with the Group’s share dealing policy and directors’ independence is assessed annually.
2.15 The Board should consider business rescue proceedings or other turnaround mechanisms as soon as the Company is financially distressed as defined in the Companies Act.
Applied (Refer principle 2.14). The ARC and Board monitor the solvency and liquidity and going-concern status of the Group quarterly. Management constantly monitors debtor levels and report thereon quarterly to the ARC. The Group has to remain within specific financial covenants in terms of facility agreements in place with its bankers. Management constantly monitors risks and report thereon to the ARC. (Refer to page 58 – Risk Management). The ARC reports quarterly to the Board.
2.16 The Board should elect a Chairman of the Board who is an independent non-executive director. The CEO of the Company should not also fulfil the role of Chairman of the Board
Applied (Refer to page 44 – Governance Report).
2.17 The Board should appoint the chief executive officer and establish a framework for the delegation of authority.
Applied The chief executive officer has been appointed by the Board.
2.18 The Board should comprise a balance of power, with a majority of non-executive directors. The majority of non-executive directors should be independent.
Applied (Refer to 2016 Integrated Report, page 44 – Governance Report).
2.19 Directors should be appointed through a formal process.
Applied (Refer to page 47 – Governance Report).
2.20 The induction and ongoing training and development of directors should be conducted through formal processes.
Applied (Refer to page 47 – Governance Report).
CORPORATE GOVERNANCE continued
HOSPITALITY PROPERTY FUND INTEGRATED ANNUAL REPORT 201650

Principle Status Application
2.21 The Board should be assisted by a competent, suitably qualified and experienced Company Secretary.
Applied (Refer to page 48 – Governance Report).
2.22 The evaluation of the Board, its committees and the individual directors should be performed every year.
Applied (Refer to page 43 – Governance Report).
2.23 The Board should delegate certain functions to well-structured committees but without abdicating its own responsibilities.
Applied (Refer to pages 46 and 57 – Governance Report).
2.24 A governance framework should be agreed between the Group and its subsidiary Boards.
Applied The same governance structure has been adopted by each of the Hospitality group of companies. The Group structure can be found on page 43.
2.25 Companies should remunerate directors and executives fairly and responsibly.
Applied (Refer to page 55 – Remuneration Report). Hospitality’s remuneration philosophy is set out in its remuneration report.
2.26 Companies should disclose the remuneration of each individual director and certain senior executives.
Applied The remuneration of each individual director and any prescribed officer is disclosed in this report. (Refer to page 116).
2.27 Shareholders should approve the Company’s remuneration policy.
Applied The Group’s remuneration policy is proposed to shareholders for a non-binding advisory vote at the AGM. The Group’s remuneration policy was endorsed by shareholders at its prior AGM.
HOSPITALITY PROPERTY FUND INTEGRATED ANNUAL REPORT 2016 51

Hospitality applies the mandatory principles contained in paragraph 3.84 of the JSE Limited Listings Requirements as follows:
Requirement Principle Approach
3.84(a) There must be a policy detailing the procedures for the appointment to the Board.
Appointments must be formal and transparent and a matter for the Board as a whole, assisted where appropriate by a Nomination Committee.
If a Nomination Committee is appointed, such committee must only constitute non-executive directors and the majority must be independent. The committee must be chaired by the Chairman of the Board.
The policy for Board appointments is set out in the terms of reference of the Nomination Committee.
Appointments to the Board are dealt with in a formal and transparent manner by the Board as a whole. Appointments are made on recommendations by the Nomination Committee, following an assessment of any prospective director’s qualifications, abilities and experience so as to make a meaningful contribution to the Board and its committees.
The composition of the Nomination Committee is set out on page 47. The Committee is chaired by the Chairman of the Board.
3.84(b) There must be a policy evidencing a clear balance of power and authority at Board level to ensure that no one director has unfettered powers.
Our Board Charter and MOI demonstrates that there is a clear balance of power and authority at Board level and that no one director has unfettered powers. Decisions, if not unanimous, are taken by a simple majority with one vote per director. The Chairman does not have a deciding vote.
Authority limits to conduct the daily operations of the Company have been approved by the Board and management acts within these authorities.
3.84(c) Issuers must have a CEO and a Chairman and these positions must not be held by the same person.
The Chairman must either be an independent director or the issuer must appoint a lead independent director as defined in the King Code.
The CEO and Chairman positions are held by different individuals. The Chairman is an independent non-executive director.
3.84(d) Issuers must appoint an Audit Committee in compliance with the King Code.
Hospitality has a combined ARC. Its composition is set out on page 46. The Committee currently has three members, all of whom are independent non-executive directors, as set out in the King Code. The Chairman of the Board is invited to attend Committee meetings.
Issuers must appoint a Remuneration Committee in compliance with the King Code.
Hospitality’s Remuneration Committee has three members, two of whom are independent non-executive directors. Details of the Committee’s composition, role and responsibilities can be found on page 47.
Where appropriate, issuers must appoint a Risk and Nomination Committee.
Hospitality has a combined ARC and a Nomination Committee. Details of the Committee’s composition, role and responsibilities can be found on pages 46 and 47.
The composition of such Committees, a brief description of their mandates, the number of meetings held and any other relevant information must be disclosed in the annual report.
Brief descriptions of the mandates of these Committees and the number of meetings held during the year are available on pages 46 and 47.
3.84(e) Brief CV of each director standing for election or re-election must accompany relevant notice of meeting.
Brief CVs of every director can be found on pages 30 and 31.
CORPORATE GOVERNANCE continued
HOSPITALITY PROPERTY FUND INTEGRATED ANNUAL REPORT 201652

Requirement Principle Approach
3.84(f) Capacity of directors in relation to executive, non-executive and independent must be categorised and disclosed in the relevant documentation.
Board and committee composition can be found on page 44. The composition of our Committees is in accordance with the requirements of the Companies Act and King III.
3.84(g) Issuers must have a full time executive financial director. Mr Ridwaan Asmal resigned as FD on 12 August 2015. Mr Riaan Erasmus, the previous Group Financial Manager, was appointed as Acting CFO. On request from the Board, The JSE Limited granted Hospitality extension to 30 September 2016 to appoint a FD. Mrs Mara de Lima was appointed as permanent Financial Director with effect from 30 September 2016. Mrs Erasmus will continue in the role of Senior Group Financial and Treasury Manager.
3.84(h) The Audit Committee must consider on an annual basis, and satisfy itself of the appropriateness of the expertise and experience of the financial director and report thereon in the annual report.
The ARC annually considers and satisfies itself of the appropriateness of the expertise and experience of the FD and finance team and has reported on its findings in its ARC report on page 69 of the annual financial statements.
3.84(i) The provision deals with the competence, qualifications and experience of the Company Secretary and the Board of Directors’ responsibility in relation thereto.
Refer to page 48.
3.84(j) The provision deals with the arm’s length relationship between the Board of Directors’ and the Company Secretary and the Board of Directors’ responsibility in relation thereto.
Refer to page 48.
Ziyaad Laher – Assistant Company Secretary and Rosa van Onselen – Company Secretary
HOSPITALITY PROPERTY FUND INTEGRATED ANNUAL REPORT 2016 53

SOCIAL AND ETHICS COMMITTEEWhile this report is designed primarily to meet the reporting requirement placed on the Social and Ethics Committee, the Human Capital Report on page 65 contains information on Hospitality’s efforts to develop its existing and future employees.
The Committee is required to report to shareholders on matters within its mandate at the Company’s AGM. Any specific questions in this regard may be submitted to the Company Secretary prior to the AGM.
The Committee ensures that the Fund focuses its efforts on the following:
• Maintaining good relations with consumers.• Maintaining good relations with employees and achieving
employment equity.• Promoting and protecting the environment, health and safety.• Preventing and combating bribery and corruption.• Being a good corporate citizen.
The Group through its Social and Ethics Committee endeavours to ensure that its ethical tone is shared and implemented by its contracted hotel operators and aims to act responsibly in the societies in which it operates. Focus has been placed on reducing the impact of the Group on natural resources, having implemented various water and energy-saving programmes across its property portfolio. Information on environment, health and safety can be found in the Social and Environmental report on page 62.
Communication with its employees and stakeholders is open and honest and without prejudice and is supported by a disclosure of information policy. Information on shareholder communication and stakeholder engagement can be found on page 66. An employee wellness programme is available to staff, free of any cost, for bereavement counselling, financial guidance, legal advice and mentoring, amongst other matters.
Whistle-blowing and anti-corruption procedures are in place. Stakeholders are encouraged, to report, if necessary, through an independently conducted ethics hotline, the actions and individuals that compromise or threaten the Company’s values, reputation and Code of Ethics. Specific emphasis will be placed on suppliers in 2017 to report any misconduct. Investigations are carried out and findings reported, and disciplinary, civil or criminal action taken as and when appropriate. The ARC provides an additional level of oversight to support the Social and Ethics Committee in these matters.
During the year under review, five cases were reported through Fund’s ethics hotline. Issues related mainly to perceived conflicts of interest, unfair treatment and favouritism and one incident of potential fraud risk. The Fund will continue to drive awareness of the whistle-blowing line through various initiatives during the 2017 year.
Hospitality achieved a Level 4 B‑BBEE status in the 2016 financial year.
The composition, role and responsibilities of the Committee can be found on page 47.
The Westin – The heavenly Spa pool
HOSPITALITY PROPERTY FUND INTEGRATED ANNUAL REPORT 201654

REMUNERATION AND PERFORMANCE
REMUNERATION PHILOSOPHYHospitality’s philosophy is to remunerate fairly, responsibly and competitively in order to:• Attract, reward and retain executives and staff of the requisite
calibre, with the appropriate knowledge, attributes, skills and experience to allow them to add meaningful value to the Company;
• Align the behaviour and performance of executives with the Company’s strategic goals, in the overall interests of shareholders and stakeholders;
• Promote a culture that supports enterprise and innovation with appropriate short and long-term rewards that are reasonable and achievable; and
• Encourage internal development of talent, whilst remaining responsive to market pressures.
REMUNERATIONGuaranteed remuneration
Guaranteed remuneration includes base salary structured on a cost-to-company basis and benchmarked against the industry and independent market data. For purposes of comparisons to market, the median level of remuneration for a specific position is used as the point of departure.
The Remuneration Committee reviews the guaranteed packages for executive directors, taking into consideration the rate of inflation, affordability, the outcome of benchmarking, the individuals’ experience and current levels of performance.
The Remuneration Committee reviewed the guaranteed remuneration of the Chief Executive Officer and the Acting Chief Financial Officer and approved a general increase of 7% to guaranteed remuneration with effect from 1 July 2016.
Details of the guaranteed remuneration paid to the executive directors and prescribed officers during the 2016 financial year are set out on page 116 of this report.
SHORT-TERM INCENTIVESShort-term incentives are offered to all executives as an annual bonus payment and are calculated as a percentage of annual guaranteed remuneration, capped at two thirds of that guaranteed remuneration, however, due to the eroded value of the Fund’s current employee incentive scheme, the short-term incentive of the CEO appointed 15 September 2015 is capped at a maximum of 12 months Cost to Company (“CTC”).
The criteria for payment of short-term incentives are divided between Company financial and operational and Personal Key performance indicators (“KPIs”)/Company non‑financial components.
FINANCIAL AND OPERATIONAL COMPONENTFor executive directors the financial and operational component comprises 60% of the bonus scorecard. Calculation of this element is based on the Company’s actual performance relative to predetermined sliding scale targets for achieving or exceeding budgeted rental income (contributes 36% towards the 60% financial and operational component) and distribution (contributes 24% towards the 60% financial and operational component).
PERSONAL KPI/COMPANY NON-FINANCIAL COMPONENTSPersonal KPIs comprise 40% of the annual bonus scorecard and is measured on meeting personal predetermined targets, which are agreed and approved by the Remuneration Committee. Annual bonus payments made to executive directors are set out on page 116 of this report.
LONG-TERM INCENTIVESThe Hospitality Employee Incentive Trust (“the Trust”) was implemented in 2013. Through the Trust, tranches of B-shares amounting to a total of 1 969 710 B shares were acquired in the open market at an average cost of R5.07 each and were allocated to beneficiaries as trust units. To date, B‑shares amounting to R10 million have been acquired and allocated to the Chief Executive Officer and the Financial Director and management at the time. Both executive directors had left the employment of the Company prior to the vesting of the units, which allocations reverted back to the Trust.
The Trust units vest in equal parts over a period of three years, commencing 30 September 2016. At the time of vesting, beneficiaries have the option to take up their portion thereof at cost, plus outstanding loan interest, less distributions payments received toward loan payments. Due to the eroded value of the units, none of the beneficiaries have elected to take up their options.
The current Trust units were acquired during 2013 at an average cost of R5.07 each. It is the Company’s intention to restructure its current long-term incentive scheme.
HOSPITALITY PROPERTY FUND INTEGRATED ANNUAL REPORT 2016 55

ROTATION OF DIRECTORSOne-third of all executive and non-executive directors retire from office by rotation at the Company’s Annual General Meeting and if eligible may offer themselves for re-election.
EXECUTIVE DIRECTORSService contracts and terms of employment
The Chief Executive Officer and the Acting Chief Financial Officer are both full‑time salaried employees of HPF Management Proprietary Limited, a wholly owned subsidiary of Hospitality. Their employment contracts are in accordance with the Fund’s standard terms and conditions of employment and subject to three and one months’ notice periods, respectively.
The termination of an executive director’s contract of employment will result in a concomitant termination of his Board appointment.
Subsequent to the Tsogo transaction becoming effective on 1 September 2016 and as announced on SENS on 21 September 2016, Tsogo nominated a new CEO and full time FD for the Company, which nominations were approved by the Board. The appointments are effective 1 January 2017 and 30 September 2016 respectively.
In-line with the Change of Control clause contained in the CEO’s contract of employment, Vincent Joyner’s term as CEO and a member of the board of Hospitality was terminated by the Board with effect from 31 December 2016.
NON-EXECUTIVE DIRECTORSService contracts and terms of employment
Non‑executive directors are not subject to fixed terms of employment other than the conditions contained in the Company’s MOI and, as such, no service contracts have been entered into with the Company.
Hospitality’s remuneration mix for non-executive directors comprises a basic fee in the form of an annual retainer in respect of their membership of the Board, Audit and Risk and Social and Ethics Committees and, if applicable, a per meeting fee for actual attendance for the members of the Investment, Nomination and Remuneration Committees. Hourly fees may also be paid, subject to prior Board approval, to non-executives for ad-hoc work which may be required of them.
No share options or other incentive awards geared to share price or corporate performance are made to non-executive directors. Non-executive directors’ fees are approved in advance by shareholders by special resolution at the Company’s Annual General Meeting, at intervals of no longer than two years at a time.
Remuneration
The increase to non-executive directors’ fees for 2016 was approved by shareholders at the 2015 AGM at a maximum of 8%, subject to Board approval. However, the Board, on recommendation by the Remuneration Committee agreed a 7% inflationary increase for the period 1 July 2016 to 30 June 2017.
Details of remuneration paid to non-executive directors can be found on page 116.
HOSPITALITY PROPERTY FUND INTEGRATED ANNUAL REPORT 201656
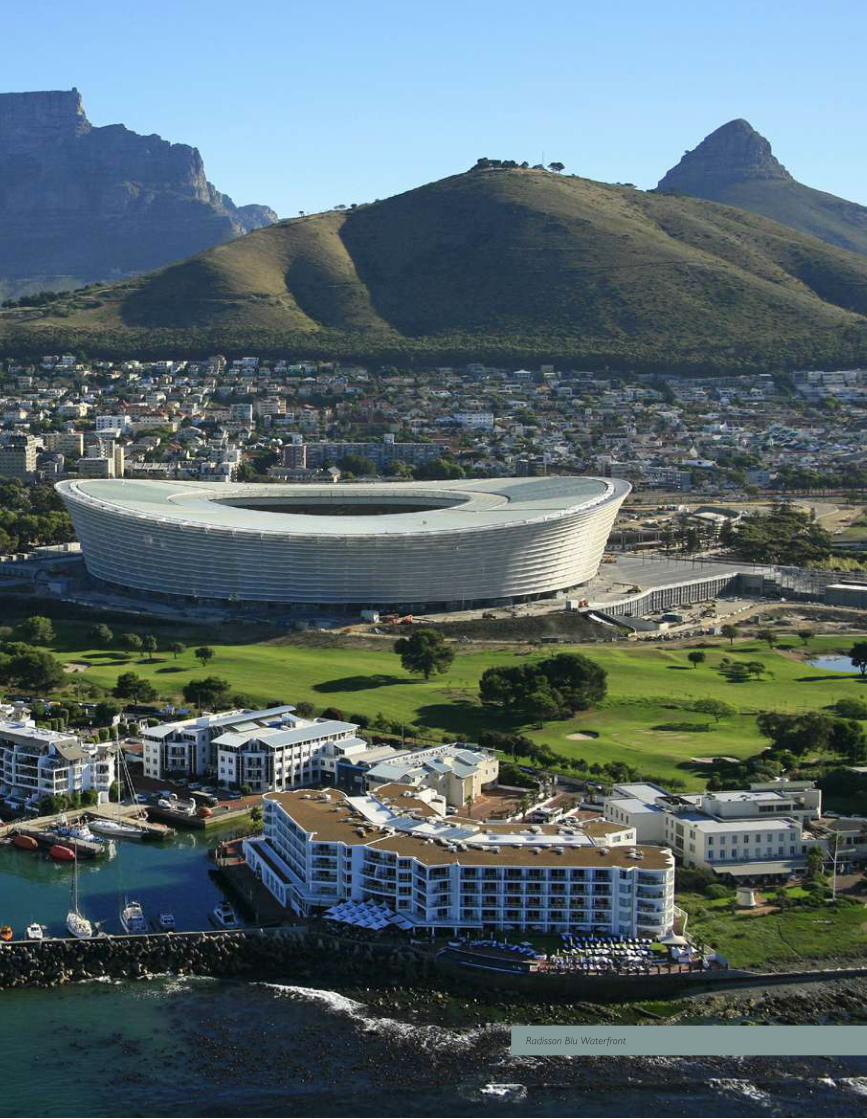
Radisson Blu Waterfront

RISK MANAGEMENT
THE GOVERNANCE OF RISKThe Board has overall responsibility for the governance of risk. The Audit and Risk Committee ("the Committee") is mandated to ensure that the responsibilities delegated to the Risk Management Committee, represented by executive management, are carried out in accordance with the Risk Governance Framework approved by the Board. The Committee recommends the Risk Governance Framework, Risk Policy, Risk Management Plan and Top Risks to the Board for approval at least annually. It then oversees that risks are appropriately managed and reported. The Fund’s risk register comprises risk events which may have an effect on the Fund’s strategic objectives as identified by various Risk owners in the area of their responsibility and expertise, these include revenue and cost management, finance and treasury management, to name a few. Risk events identified at property level, by the responsible Risk owner which may have an effect on the Fund’s strategic objectives are raised and monitored on an ongoing basis.
Hospitality is of the view that effective risk governance is essential to its sustainable business performance and the realisation of its strategic management and operational objectives.
The three tiers of the Fund’s risk governance framework are illustrated in the graphic below:
The Board is responsible for the governance of risk as set out in the Board Charter.
The RISKCO is responsible for:• Preparation of the risk governance framework.
• Risk management policy.
• Risk management plan to the Committee for review and approval.
• Identifies the risks, the relevant controls, treatment plan and monitors the management thereof.
• Reports to the identified risks, controls and treatment plans.
The Committee is mandated to monitor the management of risk by the RISKCO, represented by the executive management team.
BOARD
AUDIT AND RISK COMMITTEE
RISKCO
THE RISK MANAGEMENT APPROACHThe Group’s risk management approach is primarily based on the principles and guidelines of ISO 31000 Risk Management Architecture adapted, where necessary, to the needs of the organisation and complemented, where appropriate, by the Risk and Insurance Management Society Risk Maturity Model. This approach is designed to:
• create and protect value in the context of the social and cultural factors facing the organisation;• suit the environment of each business area and integrate with the business operations;• support decision making based on best available and timely information;• deal with uncertainty through being dynamic, responsive, and iterative;• facilitate continual improvement and develop organisational capacity;• be transparent, inclusive, relevant; and• risks have been identified per property level and have been aligned with the Fund’s strategic objectives.
HOSPITALITY PROPERTY FUND INTEGRATED ANNUAL REPORT 201658

THE FOLLOWING GRAPHIC ILLUSTRATES THE IRMA RISK MANAGEMENT PROCESS
The External ContextThe Internal ContextThe Risk Management ContextDevelop Criteria and Define the Structure
Identify Existing ControlsDetermine LikelihoodDetermine ConsequencesDetermine Level of Risk
Identify optionsAssess optionsPrepare and implement treatment optionsAnalyse and evaluate residual risk
Compare the Criteria – Set the priorities
What can happen, when, where, how and why?
Establishing the Context
Risk Assessment
Risk Identification
Risk Identification
Risk Evaluation
Risk Treatment
Treat RiskYES
NO
CO
MM
UN
ICA
TIO
N A
ND
CO
NSU
LTAT
ION
MO
NIT
OR
AN
D R
EVIEW
MILESTONES ACHIEVED IN THE YEARIn our FY2015 Integrated Annual Report we advised that the risk assessment phase will be completed in FY2016 and treatment plans will be developed and implemented on a priority basis for the most significant risks. In addition to completing these, we have identified risk owners and introduced individual risk registers, which has resulted in risk management being fully integrated into the operations, the Fund’s Appetite and Tolerance levels were reviewed, risks have been identified per property level and have been aligned where applicable to the strategic objectives of the Fund.
Seve
rity
Major
High
Significant
Moderate
Low
Exceptional Rare Occasional Probable Frequent
Likelihood
HOSPITALITY PROPERTY FUND INTEGRATED ANNUAL REPORT 2016 59

RISK MANAGEMENT continued
TOP RISKSAt the time of this report, the following top risks were identified at Fund level:
No. 1. 2. 3. 4. 5. 6. 7. 8. 9. 10. 11. 12.
Risk
Capital structure
Lack of capital investment in critical infrastructure upkeep Terrorism Refinancing risk
Compliance with laws, regulations and policies Credit risk Interest rate risk
Underperformance of Hotel operator/ tenant
Unreliable supply of water, electricity and other utilities
Destruction or damage of property Investment risk Valuation risk
Risk
Des
crip
tion
Due to variable rentals affected by the cyclical nature of the hotel industry and the growth in distribution by the lower of 5% or CPI on the A-share, the distribution and share price of the B-share is highly volatile.
The capital intensive nature of HPF’s assets results in a higher capital spend requirement in comparison to other REITs. Failure to maintain properties to their star grading standards will result in loss of profits and associated reputational damage over time.
International terrorism threat to tourist destinations.
On expiry of loans, refinancing is subject to financial institution and note investors’ internal credit policies and risk assessment of HPF’s business which may result in loans/notes not being refinanced or refinanced at unfavourable terms to HPF.
New and amended legislation is continually being introduced, e.g. POPI, B-BBEE, REIT, which are increasing in complexity. This leads to a greater risk of non-compliance.
Tenant default Volatility in interest rates.
Potential loss of revenue due to poor sales and marketing strategies implemented by the Hotel Operator/tenant.
Properties not being adequately maintained by the Hotel Operator/tenant, affecting guest experience and causing brand reputational damage.
Deteriorating local infrastructure such as, power stations, water treatment plants and the road and rail network may result in the non-supply of utilities to properties.
Partial or total destruction of a hotel and infrastructure resulting in hotels not being operational, which will cause loss of income to tenant and rental income to the Fund.
Making poor investments or acquiring property with latent defaults including structural faults, land and other claims against the property and/or other regulatory non-compliance matters.
Properties are measured and reported at incorrect fair values, resulting in a misstatement of assets.
Cur
rent
Con
trols
Executive management continues to actively engage with major shareholders on the capital structure.
Additional R100 million Nedbank loan concluded in April 2016 to fund capex for FY2017. Rolling 12-month cash flow is reviewed by the Committee.
Maintaining levels of awareness of current affairs.
Engagement with and review of hotel operator/tenants security protocols.
High cost of funding reducing distributable income.
Negative impact on reputation.
Negative impact on operations such as the upkeep of the properties.
Unable to refinance expired loans and debt resulting in the company being unable to settle its liabilities.
Engage with training providers or consultants on new laws and regulations.
Engage with legal advisors.
Deposits and bank guarantees are in place.
Monthly meetings held to review tenants’ financial performance and continuous engagement to identify inability to service of rentals. Tenant diversification.
Managing market risk through interest rate swaps and fixed rate loans to reduce interest rate risk.
The loan-to-value ratio is limited to 40%.
Maintaining strong relationships with major hotel brands,
Diversification of hotel management companies.
Continuous management of the operators.
Introduction of generators, sewerage treatment plants and water storage vessels.
Assets are insured at replacement cost, business interruption and riots insurance held with reputable underwriters, with a strong credit rating insurance. Policies are in place and reviewed annually.
A formal due diligences is performed by expert services providers prior to final acquisition.
Thereafter the Investment Committee considers and approves all investments.
HPF engages the services of an Independent Professional Associate (JHI) to perform the valuation on the property portfolio on an annual basis.
Resid
ual
Risk
Ra
ting
I II II II II II II II III III III IV
Plan
ned
Con
trols
The capital restructure as approved by shareholders (with the Tsogo transaction), which will result in a single class share structure, will be implemented.
Executive Management is looking into the creation of a capital reserve or an alternative solution.
Management will review hotel operator/ tenants security protocol.
Management will continue to investigate alternative sources of finance (debt).
Compiling a legal register which will provide awareness on the various laws and regulations that applies to HPF and the controls in place to ensure compliance thereof.
HOSPITALITY PROPERTY FUND INTEGRATED ANNUAL REPORT 201660

TOP RISKSAt the time of this report, the following top risks were identified at Fund level:
No. 1. 2. 3. 4. 5. 6. 7. 8. 9. 10. 11. 12.
Risk
Capital structure
Lack of capital investment in critical infrastructure upkeep Terrorism Refinancing risk
Compliance with laws, regulations and policies Credit risk Interest rate risk
Underperformance of Hotel operator/ tenant
Unreliable supply of water, electricity and other utilities
Destruction or damage of property Investment risk Valuation risk
Risk
Des
crip
tion
Due to variable rentals affected by the cyclical nature of the hotel industry and the growth in distribution by the lower of 5% or CPI on the A-share, the distribution and share price of the B-share is highly volatile.
The capital intensive nature of HPF’s assets results in a higher capital spend requirement in comparison to other REITs. Failure to maintain properties to their star grading standards will result in loss of profits and associated reputational damage over time.
International terrorism threat to tourist destinations.
On expiry of loans, refinancing is subject to financial institution and note investors’ internal credit policies and risk assessment of HPF’s business which may result in loans/notes not being refinanced or refinanced at unfavourable terms to HPF.
New and amended legislation is continually being introduced, e.g. POPI, B-BBEE, REIT, which are increasing in complexity. This leads to a greater risk of non-compliance.
Tenant default Volatility in interest rates.
Potential loss of revenue due to poor sales and marketing strategies implemented by the Hotel Operator/tenant.
Properties not being adequately maintained by the Hotel Operator/tenant, affecting guest experience and causing brand reputational damage.
Deteriorating local infrastructure such as, power stations, water treatment plants and the road and rail network may result in the non-supply of utilities to properties.
Partial or total destruction of a hotel and infrastructure resulting in hotels not being operational, which will cause loss of income to tenant and rental income to the Fund.
Making poor investments or acquiring property with latent defaults including structural faults, land and other claims against the property and/or other regulatory non-compliance matters.
Properties are measured and reported at incorrect fair values, resulting in a misstatement of assets.
Cur
rent
Con
trols
Executive management continues to actively engage with major shareholders on the capital structure.
Additional R100 million Nedbank loan concluded in April 2016 to fund capex for FY2017. Rolling 12-month cash flow is reviewed by the Committee.
Maintaining levels of awareness of current affairs.
Engagement with and review of hotel operator/tenants security protocols.
High cost of funding reducing distributable income.
Negative impact on reputation.
Negative impact on operations such as the upkeep of the properties.
Unable to refinance expired loans and debt resulting in the company being unable to settle its liabilities.
Engage with training providers or consultants on new laws and regulations.
Engage with legal advisors.
Deposits and bank guarantees are in place.
Monthly meetings held to review tenants’ financial performance and continuous engagement to identify inability to service of rentals. Tenant diversification.
Managing market risk through interest rate swaps and fixed rate loans to reduce interest rate risk.
The loan-to-value ratio is limited to 40%.
Maintaining strong relationships with major hotel brands,
Diversification of hotel management companies.
Continuous management of the operators.
Introduction of generators, sewerage treatment plants and water storage vessels.
Assets are insured at replacement cost, business interruption and riots insurance held with reputable underwriters, with a strong credit rating insurance. Policies are in place and reviewed annually.
A formal due diligences is performed by expert services providers prior to final acquisition.
Thereafter the Investment Committee considers and approves all investments.
HPF engages the services of an Independent Professional Associate (JHI) to perform the valuation on the property portfolio on an annual basis.
Resid
ual
Risk
Ra
ting
I II II II II II II II III III III IV
Plan
ned
Con
trols
The capital restructure as approved by shareholders (with the Tsogo transaction), which will result in a single class share structure, will be implemented.
Executive Management is looking into the creation of a capital reserve or an alternative solution.
Management will review hotel operator/ tenants security protocol.
Management will continue to investigate alternative sources of finance (debt).
Compiling a legal register which will provide awareness on the various laws and regulations that applies to HPF and the controls in place to ensure compliance thereof.
HOSPITALITY PROPERTY FUND INTEGRATED ANNUAL REPORT 2016 61

NATURAL, HUMAN AND RELATIONSHIP CAPITAL
ENVIRONMENTAL IMPACTEven though the Fund’s main focus remains in reducing the carbon footprint and environmental impact, we realise that this is an ongoing process that needs to evolve over time in order to be effective.
In achieving economic, social and environmental stability, the Fund is committed to implement sustainability principles and leading environmental practices in the properties.
The following initiatives were implemented and are maintained going forward:
• Striving to reduce consumption of natural resources through the responsible use of electricity, gas and water.
• Working to minimise the consumption of water through guest usage, laundry, hotel consumption and irrigation.
• Developing innovative mechanisms to recycle sewerage, laundry and kitchens grey water.
• Actively seeking to minimise pollution, emissions and effluents emanating from its operations.
• Working to minimise the amount of waste produced by the hotels by way of programmes to reduce, reuse and recycle materials including paper, glass and cans, both steel and aluminium.
• Ensuring that at all times, the Fund identifies, evaluates and complies with local, regional or national environmental laws and regulations applicable to its operations within the areas that its business is conducted.
• Managing biodiversity through the protection of flora, fauna and land associated with or impacted by our operations.
Environmental programmes that have been implemented at the Fund’s hotels, have been done in accordance with each hotel operating company’s initiatives as follows:
• Green Engage (Intercontinental Hotel group)• Responsible Business Programme (Carlson Rezidor)• Tsogo Sun’s Environmental Initiatives• 30/20 by 20 (Starwood Hotel and Resorts)• Energy and Environmental Action (EEAP) plans
(Marriott International)
The Fund continues to recognise its responsibility for the impacts that it has on its surrounding communities and continually evaluates mechanisms to reduce its environmental impacts.
The Arabella Country Estate is the only ISO 14001 accredited golf estate in Africa. This requires compliance with international standards of sustainable environmental management and annual environmental audits of its performance are required. Hospitality embarked on an alien clearing project on Arabella Phase 2, to prepare the site for potential future developments. The impact of the irrigation system that was installed at the Arabella Golf Course in 2015, resulted in significant improvements in golf course conditioning and more efficient water utilisation. Further enhancements to the coverage and timing controls of the system will be implemented in the year ahead, with the objective of achieving a further reduction in water usage.
ENERGY CONSUMPTIONAll of the Fund’s hotels are provided with electricity by Eskom.
Energy usage is largely determined by occupancy levels of the hotels, the heating of clarifiers, operation of air‑conditioners, lifts and lighting purposes and the Fund continues to actively seek alternative methods of reducing its energy consumption. Certain of the methods implemented are:
• The introduction of awareness campaigns among guests and employees.
• Installation of heat pumps.• Energy efficient light fitting replacement (LED globes).• Hot‑water clarifiers are set to heat water only when the capacity
of the newly installed heat pumps have been reached and the demand for hot water is at its highest. Boiler temperatures are set to minimum levels.
• Fully insulated systems ensure that hot water is available at all times and heat loss is minimised.
• Air-conditioning plants have timers to reduce energy consumption so that unoccupied public spaces are not air-conditioned unnecessarily.
• Energy-saving devices, such as key-card activated switches, have been installed in new.
• Where possible, the discharged cold air from heat pumps is circulated into air handling unit plant rooms for distribution to assist the chillers.
HOSPITALITY PROPERTY FUND INTEGRATED ANNUAL REPORT 201662
• Where central air-conditioning chiller plants are installed, the utilisation of heat generated through the running of the plant is used to heat and maintain hot water temperatures through plate heat exchangers.
• Administration offices, boardrooms and conference centres have been retrofitted with motion sensors linked to lights and air-conditioning to further aid energy saving when areas are unoccupied.
• The use of energy‑efficient globes, has been implemented.• Regular maintenance of all electrical equipment ensures that
operating efficiencies are maintained.• Further planned initiatives include the introduction of occupancy
sensors, day and night sensors and key card reader sensors in the hotel bedrooms.
The Fund has determined that the measurement of energy consumption should be based on a “per room sold” basis, to establish a meaningful trend over time.
Programmes with the Magnet Group are implemented to various projects that oversee the implementation of the heat-pumps and illumination projects, previously identified as the most significant KWH savings for the hotels.
All of the Fund’s hotel excluding the Inn on the Square hotel have in-house generators. Although the implementation of generators to all of the Fund’s hotel increases the consumption of diesel fuel, it is considered to be an operational necessity for the long-term sustainability of each hotel’s performance.
WATER CONSUMPTIONThe Fund implements a strict water management policy whereby the management companies must implement initiatives to minimise water wastage. Measures being implemented in the conservation of water are as follows:
• Shower heads and taps have been fitted with aerators to simulate high flow rates, at a significantly lower rate of usage.
• Showers have systematically replaced baths in new developments.• Guest-awareness programmes to reduce laundering of linen and
towels have been implemented.• Garden irrigation is timed, to avoid watering during the hottest
times of the day, thereby reducing water loss through evaporation.• All landscaping and plant replacement projects priorities the use
of “water wise” indigenous flora.• Programmes are in place for the continual removal of invasive
alien plant species.• Water metering systems have been installed to reduce water
consumption by early detection of leaks and high usage areas.
WASTE WATERProperties within the Fund’s portfolio that are not linked to the relevant councils sewage system have been retro fitted with grey water treatment plants.
These “grey water” treatment plants utilise the outflow for the use of irrigating all gardens.
Other mitigating steps being implemented to reduce the effect of harmful substances on the environment include:
• All hotels have grease traps that are regularly maintained to ensure kitchen and food greases are removed before entering waste systems.
• Salt chlorinators are used where possible to maintain swimming pool hygiene and minimise the use of chlorine-based products.
• Guest supplies (soaps, shampoo, foam baths.• Conditioners and lotions) are bio-degradable.• Bio-degradable and environmentally friendly chemicals are used
in all kitchen, cleaning and laundry operations.
RECYCLINGAll of the Fund’s hotel properties separate and recycle waste, including all glass, paper and aluminium products.
Certain operators have in house education programs to assist their with the recycling of waste materials and participate in the following recycling initiatives:
• Sappi• Mondi• Collect-A-Can• Enviroglass
Currently, certain of the guest supplies that are not utilised, are donated to local charitable organisations or establishments.
BIODIVERSITYThe Fund monitors the impact of its hotels which are located in both protected areas and locations of high biodiversity value. Specific initiatives include the following:
Mount Grace Country House and Spa
• Many of the invasive plant species have been removed and proper attention given to replacing these with indigenous material.
Arabella Hotel and Spa
Arabella Country Estate is located within the transitional zone of the Kogelberg Biosphere Reserve and the adjacent Bot River lagoon, which is designated buffer zone to the Biosphere Reserve. Accordingly, the principles of sustainable development and protection of the natural environment on the actual property and
HOSPITALITY PROPERTY FUND INTEGRATED ANNUAL REPORT 2016 63
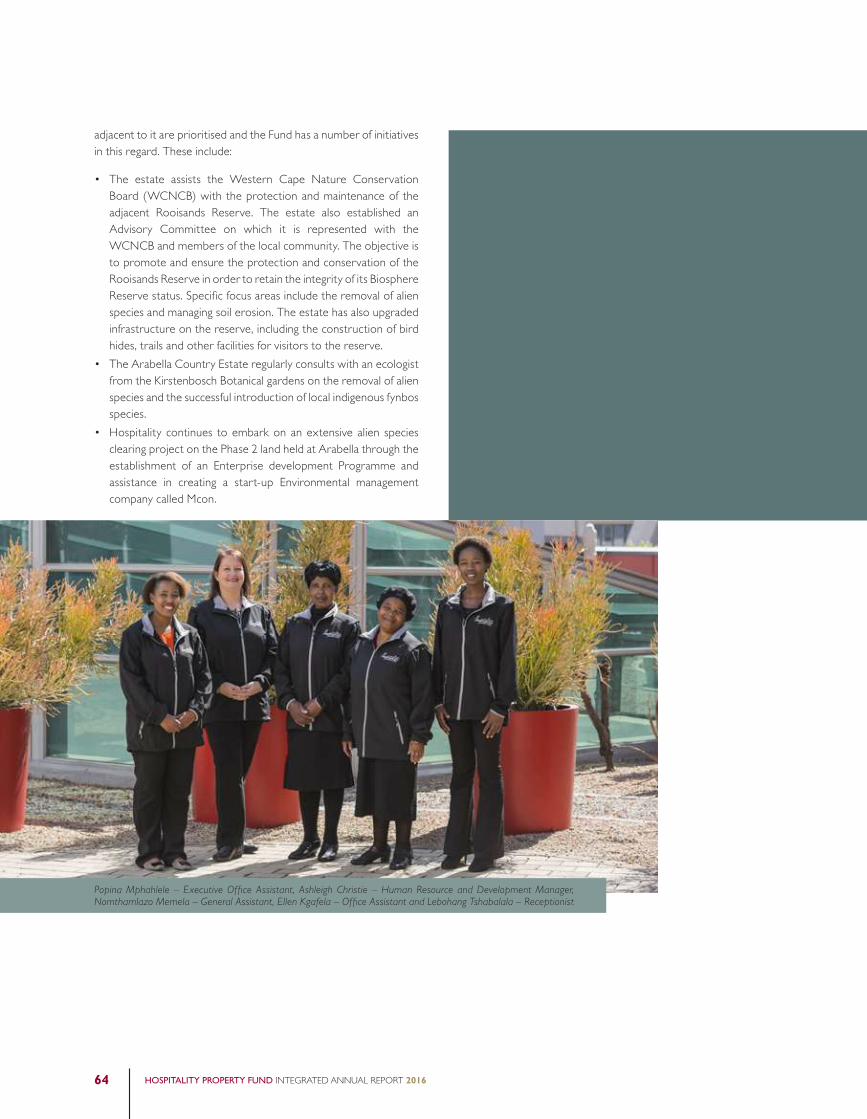
adjacent to it are prioritised and the Fund has a number of initiatives in this regard. These include:
• The estate assists the Western Cape Nature Conservation Board (WCNCB) with the protection and maintenance of the adjacent Rooisands Reserve. The estate also established an Advisory Committee on which it is represented with the WCNCB and members of the local community. The objective is to promote and ensure the protection and conservation of the Rooisands Reserve in order to retain the integrity of its Biosphere Reserve status. Specific focus areas include the removal of alien species and managing soil erosion. The estate has also upgraded infrastructure on the reserve, including the construction of bird hides, trails and other facilities for visitors to the reserve.
• The Arabella Country Estate regularly consults with an ecologist from the Kirstenbosch Botanical gardens on the removal of alien species and the successful introduction of local indigenous fynbos species.
• Hospitality continues to embark on an extensive alien species clearing project on the Phase 2 land held at Arabella through the establishment of an Enterprise development Programme and assistance in creating a start-up Environmental management company called Mcon.
Popina Mphahlele – Executive Office Assistant, Ashleigh Christie – Human Resource and Development Manager, Nomthamlazo Memela – General Assistant, Ellen Kgafela – Office Assistant and Lebohang Tshabalala – Receptionist
HOSPITALITY PROPERTY FUND INTEGRATED ANNUAL REPORT 201664

DEVELOPMENT, TRAINING AND WELLNESSHospitality’s Development Academy (“the Academy”) continued in 2016 to focus on developing its future leaders and providing basic hospitality skills training, the shortage of which is a recurring theme among industry participants.
A major component of the Academy is provided through the University of Johannesburg, School of Tourism and Hospitality and Cape Peninsula University of Technology, which has allowed in excess of 40 students between 2010 and 2016, either through bursaries or whilst in the employment of the Group, to successfully complete various accredited qualifications.
Hospitality is investigating expansion of its training and development to the property asset management and financial management fields within the hospitality industry.
The emerging leaders programme, which was established in January 2014 and which is facilitated by International Hotel School online and the American Hotel and Lodging Educational Institute, will conclude at the end of the 2016 calendar year. Nine emerging leaders have successfully completed the programme and are already enjoying the benefit of career growth.
Hospitality maintained its valuable association with the Cape Legends Inter Hotel Challenge along with Showcook. Cape Legends Inter Hotel Challenge encourages the development of chefs and sommeliers in the hospitality industry. As it has done in the past three years, Hospitality again sponsored a bursary to 2016’s most promising chef, Simamkele Twani, who is employed at the Protea Hotel Balalaika Sandton. Simamkele participates in the Protea Hotel Balalaika and HTA School for Culinary Art programme for deaf and hearing impaired chefs.
Hospitality’s Donald Xaba from Protea Hotel The Edward was awarded second place in the category “Best Wine Steward” and Lennox Mbanga from Arabella Hotel and Spa won “Best Dessert” category.
The development of Hospitality’s head office team was another priority in 2016. Initiatives included team buildings, mentorship and various developmental programmes.
THE TRANSFORMATION PROCESSHead Office staff recruitments were in line with Hospitality’s employment equity plan.
Hospitality achieved a level 4 B‑BBEE certification in March 2016, which is an improvement to its prior level 7 certification.
With the revised B-BBEE Act and imminent promulgation of the Property Charter Codes, Hospitality is developing a strategy to ensure compliance with the codes of good practice and to achieve the best possible rating in support of the industry’s transformation process. Opportunities are also considered to focus on the development of small supplier businesses.
Following the Tsogo transaction, Hospitality’s inclusion as part the Tsogo group is expected to further enhance Hospitality’s B-BBEE ownership.
Ashleigh Christie – Human Resource and Development Manager, with Heinz Brunner – The South African Chefs Association and Simamkele Twani
HOSPITALITY PROPERTY FUND INTEGRATED ANNUAL REPORT 2016 65

The Board maintains honest and transparent communication with its stakeholders. Management engages regularly with major shareholders and stakeholders to ensure open channels of communication.
Identification of stakeholder groups and methods of engagement are set out below:
Stakeholder groups Engagement approach and mechanisms Key topics and areas of concern
Direct: Fund stakeholders
Shareholders, bankers, bond to holders and financiers
Presentations, integrated annual report, results announcements, SENS releases, site visits, roadshows and direct engagement
Distributions growth, future prospects and compliance with terms of loan agreements
Tenants Monthly and quarterly face-to-face meetings for each property to obtain updates on a wide variety of matters
Absolute and relative performance, benchmarking and strategising, trading environment
Professional suppliers and business partners including legal, accounting, architects, engineers, quantity surveyors and interior designers
Ad-hoc and formal meetings, reports, letters and emails
Future business opportunities, relationships, project performance, level and standard of service
Employees Daily interactionsIntroduction of ICAS employee wellness programme
Performance and daily responsibilities, compensation and professional development
Governments and regulatory authorities
Formal meetings, written reports and regulatory submissions
B-BBEE, health and safety, labour matters and taxation
Indirect: Hotel stakeholdersConsumers Sales and marketing initiatives, direct interactions,
campaignsQuality and value for money, consistent service delivery, B-BBEE and environmental compliance
Trade unions Direct engagement Wage settlements and working conditions
Suppliers of consumables Direct engagement, tenders, centralised procurement Price and cost of goods, quality, service and payment terms
Employees Direct interactions, electronic communications, employee forums
Working conditions, salaries and benefits, training and development, safety
Communities and education institutions
Direct engagement Sponsorships, grants and bursaries
Local authorities Direct, telephonically and through legal counsel Lack of service delivery, maladministration, incorrect billing and incorrect valuations
Through its membership of industry bodies such as the SA REIT Association, Hospitality engages regularly with other industry participants on current issues impacting the industry.
Shareholder communication and stakeholder engagement
HOSPITALITY PROPERTY FUND INTEGRATED ANNUAL REPORT 201666
JOB10976 Hospitality_AFS_2016_PRF_7a – October 13, 2016 10:48 PM
HOSPITALITY PROPERTY FUND INTEGRATED ANNUAL REPORT 2016 67
68 Directors’ responsibility statement
68 Preparer of the annual financial statements
68 Certificate by the Company secretary
69 Report of the Audit and Risk Committee
71 Directors’ report
75 Independent auditor’s report
CO
NT
ENT
S78 Statements of financial
position
79 Statements of comprehensive income
81 Statements of changes in equity
82 Statements of cash flow
83 Notes to the financial statements
ANNUAL FINANCIAL STATEMENTSfor the year ended 30 June 2016
Janice Rambaly – Group Financial and Risk Manager, Maria Oliver – Group Accountant, Riaan Erasmus – Acting Chief Financial Off icer, Kate Vimbelela – Accountant and Martie Nel – Financial Controller

HOSPITALITY PROPERTY FUND INTEGRATED ANNUAL REPORT 201668
The board of directors are responsible for:• the preparation and fair presentation of the Group and separate
annual financial statements of Hospitality Property Fund Limited, comprising the statements of financial position at 30 June 2016, and the statements of comprehensive income, changes in equity and cash flows for the year then ended, and the notes to the financial statements which include a summary of significant accounting policies and other explanatory notes, in accordance with International Financial Reporting Standards and the requirements of the Companies Act, 2008 of South Africa;
• preparing the directors’ report;• such internal control as the board determines is necessary to
enable the preparation of financial statements that are free from material misstatement, whether due to fraud or error;
• maintaining adequate accounting records and an effective system of risk management; and
• the preparation of the supplementary schedules included in these financial statements.
The board have made an assessment of the ability of the Company and its subsidiaries to continue as going concerns and have no reason to believe that the businesses will not be going concerns in the year ahead.
The auditor is responsible for reporting on whether the consolidated and separate financial statements are fairly presented in accordance with the applicable financial reporting framework.
PREPARER OF THE ANNUAL FINANCIAL STATEMENTSThe Group and separate annual financial statements of Hospitality Property Fund Limited as approved by the board of directors on 23 August 2016 were prepared under the supervision of the Acting Chief Financial Officer, Mr Riaan Erasmus CA(SA). The Group and separate financial statements of Hospitality Property Fund Limited were audited in compliance with section 30 of the Companies Act, 2008 of South Africa.
APPROVAL OF GROUP AND SEPARATE ANNUAL FINANCIAL STATEMENTSThe Group and separate annual financial statements of Hospitality Property Fund Limited, as identified in the first paragraph, were approved by the board of directors on 23 August 2016 and signed by the following authorised directors:
DG Bowden VM Joyner
Chairman Chief Executive Off icer
DIRECTORS’ RESPONSIBILITY STATEMENT
CERTIFICATE BY THE COMPANY SECRETARYI hereby certify that for the year ended 30 June 2016, the Company has lodged with the Registrar of Companies all such returns and notices as are required of a public company in terms of the Companies Act, 2008 and all such returns appear to be true, correct and up-to-date.
LR van Onselenfor HPF Management Proprietary LimitedSecretaries
23 August 2016

HOSPITALITY PROPERTY FUND INTEGRATED ANNUAL REPORT 2016 69
REPORT OF THE AUDIT AND RISK COMMITTEEThe Audit and Risk Committee (“the Committee”) is pleased to submit its report in compliance with section 94(7)f of the Companies Act, 2008. Details on the composition of the Committee, its terms of reference, frequency of meetings and attendance at meetings are set out in the corporate governance section of the Integrated Annual Report on page 46.
EXECUTION OF FUNCTIONS OF THE COMMITTEEThe Committee has fulfilled its duties in terms of its statutory obligations contained in the Companies Act, 2008, the JSE Listings Requirements, its terms of reference and the King III Code on Corporate Governance in South Africa. Any areas of non- or partial application of King III have been explained in the corporate governance section of the Integrated Annual Report, pages 49 to 53. The Committee, in addition to its statutory duties, also fulfils other functions assigned to it by the Board, which include the governance of risk.
In the year under review the Committee specifically focused on the enhancement of risk governance, IT governance and strengthening of procurement and other Group policies and procedures.
EXTERNAL AUDITOR APPOINTMENT AND INDEPENDENCEThe Committee approved the audit plan, terms of engagement and audit fees for the 2016 external audit and held at least one closed meeting with KPMG Inc. without management present, to afford the auditor a chance to raise any concerns or difficulties.
The Committee is satisfied that, the external auditor, KPMG Inc. and the designated auditor are independent of the HPF Group. The Committee also satisfied itself that the external auditor is a registered auditor in terms of the Auditing Profession Act and that the audit firm and designated auditor are accredited on the JSE Limited’s list of auditors and advisors.
The Committee has considered the nature and extent of fees paid to KPMG Inc. in respect of any non-audit services performed and other criteria relating to independence and conflicts of interests. Confirmation was given by the auditor that compliance with its internal policies and the prohibition of any shareholding in the Group supports its claim of independence.
The Committee is therefore recommending the reappointment of KPMG Inc. as external auditor.
RECOMMENDATION OF THE ANNUAL FINANCIAL STATEMENTS AND ACCOUNTING POLICIES TO THE BOARD FOR APPROVALThe Committee reviewed the accounting policies, judgements, estimates and content of the annual financial statements for the 2016 financial year. The Committee is satisfied that they are adequate and appropriate and that the financial statements comply with International Financial Reporting Standards, the Companies Act, 2008 and the JSE Limited Listings Requirements. To this end the Committee recommended the annual financial statements to the Board for approval.
THE GOVERNANCE OF RISK AND INTERNAL CONTROLSA group risk management framework was adopted in 2014. During the current year, an updated risk management plan that flows from this framework was approved by the Committee. The implementation of this plan is monitored by the Committee. A review of the Group’s key internal financial controls were included in the 2016 external audit scope. The internal controls, including internal financial controls are documented and assessed by Management and considered by the Committee. In the past year significant progress was made in enhancing risk management in the Group. The Committee, however, recognises that the Group still has some way to go to bring these risk management processes to a high maturity level.
Further details can be found on page 58 of the Integrated Annual Report.
INTERNAL AUDITThe Committee is responsible for assessing the need for an internal audit function. Given the size and nature of the Group’s operations as well as the existence of internal audit functions by the various hotel operators at an individual hotel level, the Group currently does not have a dedicated Group internal audit function. However, internal audit reviews on key controls have been performed from a Group level by Management and reported to the Committee. Going forward the Committee intends to further enhance these reviews, scope and independence. In addition, the Committee requested the external auditor to perform additional audit procedures on internal financial controls at a Group level.

HOSPITALITY PROPERTY FUND INTEGRATED ANNUAL REPORT 201670
REPORT OF THE AUDIT AND RISK COMMITTEE continued
KEY AUDIT MATTERS AS AGREED WITH EXTERNAL AUDITORThe following items were agreed with the auditors as a key audit matters that they should focus on:
Valuation of investment property (refer to notes 4.2, 4.4, 6 and 12). The Committee considers independent valuations done annually for all investment properties.
Conversion of linked units to equity (refer to note 16). Significant Committee and Board time was spent on this matter to ensure adequate monitoring and appropriate disclosure.
EVALUATION OF THE EXPERTISE AND EXPERIENCE OF THE FINANCIAL DIRECTOR AND THE FINANCE TEAMAs reported before in the Integrated Annual Report, the Financial Director, Mr Ridwaan Asmal, resigned from the Group with effect 12 August 2015.
The Financial Director position remains vacant, with the role being fulfilled by Mr Riaan Erasmus (previous Group Financial Manager) in an acting capacity. In addition, the Group Financial Manager vacancy that was created as a result has been filled to assist in the successful fulfilment of the financial reporting requirements. Mr Riaan Erasmus will continue to act in the CFO position until such time a permanent CFO will be appointed after the implementation of the Tsogo transaction.
The Committee is satisfied that this interim measure will suffice, but recognise the importance of filling the Financial Director position in the short-term without compromising on skills and experience.
L de Beer
Chairman
23 August 2016

HOSPITALITY PROPERTY FUND INTEGRATED ANNUAL REPORT 2016 71
DIRECTORS’ REPORT (Group and Company)
The Board of directors have pleasure in submitting their report and annual financial statements of Hospitality Property Fund Limited (the Company or the Fund) and the Group for the year ended 30 June 2016.
NATURE OF BUSINESSThe Company is a Real Estate Investment Trust (REIT) listed on the JSE Limited (JSE). The Company is the only specialised REIT in South Africa investing in the hotel and leisure sector, providing investors with exposure to both the property and hospitality industries.
The property portfolio consists of interests in 15 properties valued at R5.3 billion.
GROUP OF ENTITIESThe “Group” comprises of the following entities:• Hospitality Property Fund Limited (the Fund or Company);• HPF Properties Proprietary Limited (HPF Properties);• HPF Management Proprietary Limited (HPF Management);• HPF Employee Incentive Trust (the Trust);• Hospitality Property Fund Managers Proprietary Limited (HPF
Fund Managers);• Hosbrook Ventures Proprietary Limited (Hosbrook Ventures); and• NIB 35 Proprietary Limited (NIB 35).
REVIEW OF OPERATIONSThe results of the Group and Company are set out in the attached financial statements and notes.
DISTRIBUTIONSThe A-shares/linked unit distribution for the year amounted to 155.62 (2015: 148.21) cents, an increase of 5.0%, and the B-shares/linked unit distribution was 34.81 (2015: 13.15) cents, an increase of 164.7% from the previous year.
The combined distribution for the year amounted to 190.43 (2015: 161.36) cents, an increase of 18.0% from the previous year.
SHARE CAPITAL AND DEBENTURESThe Company was awarded status as a REIT by the JSE with effect from 1 July 2013. In order to maintain its REIT status and ensure
that it may continue to benefit from the tax efficiencies granted to REITs, as set out in section 25BB of the Income Tax Act, the Fund is required to comply with section 13 of the JSE Listings Requirements. During the year, the Board of hospitality (the Board) proposed that the Fund’s linked unit capital structure be restructured to a share only structure through the implementation of the following inter-related corporate action:• the substitution of:
(a) all the issued Hospitality A-linked units for no par value shares (in the ratio of one no par value A-share per Hospitality A-linked unit);
(b) all the issued Hospitality B linked units for no par value shares (in the ratio of one no par value B-share per Hospitality B-linked unit).
This restructure, by way of a scheme of arrangement in terms of sections 114 and 115 of the Companies Act, 71 of 2008, received the requisite approval from both A- and B-linked unitholders at a Special General Meeting held on 21 August 2015. Effective 28 September 2015, the A- and B-linked units were terminated and the Company started trading with no par value A- and B-shares on the JSE Limited. The A- and B-linked debentures were converted to no par value shares.
A new Memorandum of Incorporation, which now takes into account the change in the Company’s capital structure has been adopted.
Further details of the share capital and debentures are set out in notes 16 and 18 of the annual financial statements.
ACQUISITIONS AND DEVELOPMENTSDuring the year, the Group acquired three additional units at the Radisson Blu Waterfront for R14.3 million, bringing its total interest in the property rental pool to 55.8%.
On 1 July 2015, all the movable assets at Champagne Sports Resort were acquired for a total consideration of R14.0 million.
In December 2015, the development of an additional 30 rooms at the Protea Hotel Edward was completed at a total cost of R19.8 million increasing the total number of rooms to 131.

HOSPITALITY PROPERTY FUND INTEGRATED ANNUAL REPORT 201672
DISPOSALSDuring the year, seven traditional non-core properties were disposed of for a total net proceed consideration of R189.9 million:
Hotel Date of disposal Net proceeds
Protea Hotel The Richards 19 August 2015 R44.7 millionProtea Hotel Hluhluwe and Safaris 1 September 2015 R13.9 millionPremier King David 1 October 2015 R27.9 millionProtea Hotel Imperial 18 December 2015 R23.8 millionProtea Hotel The Winkler 19 January 2016 R25.1 millionThe Bayshore Inn 29 January 2016 R25.6 millionProtea Hotel Richards Bay 22 March 2016 R28.9 million
Proceeds received from the above disposals will be utilised for future acquisitions of properties and/or capital expenditure in line with the Fund’s strategy.
PROPERTY VALUATIONSThe property portfolio was revalued by an independent property valuer at R5.3 billion (2015: R5.14 billion), with the net asset value per share/linked unit being R12.93 (2015: R11.74) per A-share/linked unit and R12.93 (2015: R11.74) per B-share/linked unit.
The fair value of properties under investment property (note 6), increased by R245.5 million (2015: R200.7 million). Acquisitions and capital expenditure for the year amounted to R28.3 million (2015: R154.6 million) and R88.2 million respectively (2015: R87.3 million).
The fair value of the properties held under non-current assets held for sale (note 12), increased by R5.5 million (2015: decreased by R57.0 million). Capital expenditure for the year amounted to R14.7 million (2015: R2.3 million).
BORROWINGSThe average cost of borrowings for the Group was 9.58% (2015: 9.12%) and 63% (2015: 67%) of the Groups’ facilities were hedged and thereby subject to fixed interest rates at 30 June 2016. In April 2016, an additional R100 million loan facility was secured with Nedbank Limited to fund future capital expenditure.
Total facilities with financial institutions as at 30 June 2016, amounted to R1.07 billion (2015: R0.97 billion) with R0.76 billion (2015: R0.89 billion) being utilised at year-end.
DOMESTIC MEDIUM-TERM NOTE (DMTN) PROGRAMMEThe Fund raised R150 million and R80 million through the issue of secured and unsecured notes in April 2016 to settle the secured notes of R150 million and unsecured notes of R80 million that expired in April 2016.
Total notes in issue at year-end amounted to R970 million (2015: R970 million).
Total borrowing facilities available to the Fund at 30 June 2016 was R2.04 billion with R1.73 billion utilised. Details regarding this can be found under note 19 of the financial statements. Total facilities expiring in the next 12 months, amounts to R600 million. These facilities relate to secured notes of R300 million issued in February 2014, R100 million issued in April 2014 and R200 million issued in February 2014. The Fund is currently engaging with financial institutions and potential investors to refinance or issue notes to the total value of R600 million to refinance the current notes of the same value.
The Group’s gearing ratio at 30 June 2016, was 32.6% (2015: 36.2%). The gearing ratio of the Group is the total interest-bearing liabilities divided by the total value of investment properties.
DIRECTORATEThe Board of directors comprises of:
INDEPENDENT NON-EXECUTIVE CHAIRMAN
• Mr DG Bowden
Executive Independent non-executive Non-executive
– Mr VM Joyner – Mrs L de Beer – Mr GA Nelson– Mr SA Halliday– Dr ZN Kubukeli– Mrs ZN Malinga– Mr WC Ross
In terms of the Company’s Memorandum of Incorporation, Dr ZN Kubukeli, Mr SA Halliday, Mr WC Ross and Mrs ZN Malinga and any other directors who may be appointed in the time leading up to the posting of the notice to the Annual General Meeting, retire by rotation and offer themselves for re-election.
DIRECTORS’ REPORT (Group and Company) continued

HOSPITALITY PROPERTY FUND INTEGRATED ANNUAL REPORT 2016 73
DIRECTORS’ INTERESTThe directors’ holdings of shares at 30 June 2016 were:
A-SHARES/LINKED UNITS (NUMBER OF SHARES/LINKED UNITS)
2016 2015
Direct beneficial
Indirect beneficial
Held by associates Total
Direct beneficial
Indirect beneficial
Held by associates Total
R Asmal* – – – – 10 400 – – 10 400GA Nelson# – – 288 169 288 169 – – 281 544 281 544
– – 288 169 288 169 10 400 – 281 544 291 944
B-SHARES/LINKED UNITS (NUMBER OF SHARES/LINKED UNITS)
2016 2015
Direct beneficial
Indirect beneficial
Held by associates Total
Direct beneficial
Indirect beneficial
Held by associates Total
R Asmal* – – – – 70 000 – – 70 000ZN Kubukeli – 118 715 – 118 715 – 118 715 – 118 715GA Nelson – – 825 625 825 625 – – 825 625 825 625
– 118 715 825 625 944 340 70 000 118 715 825 625 1 014 340
* Mr R Asmal resigned from the Group on 12 August 2015.# Mr Nelson inherited 6 625 A-shares/linked units on 19 August 2015..
Note: There have been no changes in the above interests from the year-end date to the date of publication of this report. Executive directors’ interest in the HPF Employee Share Scheme is disclosed in note 33.
DIRECTORS’ REMUNERATIONRemuneration of directors is disclosed in note 31.4.
DIVIDENDS/DISTRIBUTION TO SHAREHOLDERS/UNITHOLDERSDividends/distribution to shareholders/unitholders is disclosed in note 27.
CORPORATE GOVERNANCE AND INTERNAL CONTROLSThe Group and Company’s status with regards to corporate governance and internal controls is set out in a separate statement in the Integrated Annual Report on page 42.
SUBSIDIARY COMPANIESInformation relating to the Company’s interest in its subsidiaries is detailed in note 10.
ASSOCIATE COMPANIESInformation relating to the Company’s interest in its associates is detailed in note 11.

HOSPITALITY PROPERTY FUND INTEGRATED ANNUAL REPORT 201674
GOING CONCERNThe Board have made an assessment of the Company and its subsidiaries’ ability to continue as a going concern and there is no reason to believe that the businesses will not be going concerns during the year ahead. The Company has applied the solvency and liquidity test as required by the Companies Act, 2008 for both interim and final distribution payments.
Total facilities expiring in the next 12 months, amounts to R600 million. As a result, the current liabilities exceed the current assets by R315.7 million for the Group and R639.4 million for the Company. The Fund is currently engaging with financial institutions and potential investors to refinance or issue notes to the total value of R600 million and is confident that it will successfully obtain the requisite funding. This will result in the current assets exceeding the current liabilities accordingly.
SUBSEQUENT EVENTSAs announced on SENS on 11 August 2016, the Competition Tribunal has given its approval for the Tsogo Transaction, subject to outstanding administrative conditions. A merger clearance certificate has been issued. The Fund anticipates that the remaining conditions precedent to the Tsogo Transaction will be fulfilled by 31 August 2016, such that the effective date of the Tsogo Transaction will be 1 September 2016.
The Board are not aware of any other matter or circumstances arising since the end of the financial year to the date of this report, not otherwise dealt with in this report or in the Group and Company financial statements that would significantly affect the operations, the results and the financial position of the Group and Company.
REAL ESTATE INVESTMENT TRUST (REIT) STATUSAs previously stated, the Fund converted its linked unit capital structure to a no par value share structure in order to comply with section 13 of the JSE Listings Requirements and to maintain its REIT status.
In terms of the requirements, the total consolidated IFRS liabilities may not exceed 60% of the consolidated IFRS assets. As at 30 June 2016, total IFRS liabilities amounted to 33.1% (2015: 82.2%) and the Fund therefore complies with the requirements and continues to maintain its REIT status.
COMPANY SECRETARYThe Company Secretary is HPF Management Proprietary Limited (Registration number: 2009/021472/07).
The appointed representative of HPF Management Proprietary Limited is Mrs LR van Onselen.
Business address: The Zone II, Lofts East Wing, 2nd Floor, Corner Oxford and Tyrwhitt Streets, Rosebank.
Postal address: PO Box 522195, Saxonwold, 2132.
DIRECTORS’ REPORT (Group and Company) continued

HOSPITALITY PROPERTY FUND INTEGRATED ANNUAL REPORT 2016 75
INDEPENDENT AUDITOR’S REPORT
To the shareholders of Hospitality Property Fund Limited
REPORT ON THE AUDIT OF THE GROUP AND COMPANY FINANCIAL STATEMENTS
Opinion
We have audited the Group and Company financial statements of Hospitality Property Fund Limited set out on pages 78 to 132 which comprise the statements of financial position as at 30 June 2016, and the statements of comprehensive income, the statements of changes in equity and the statements of cash flows for the year then ended, and notes to the financial statements, including a summary of significant accounting policies.
In our opinion, the Group and Company financial statements present fairly, in all material respects, the consolidated and separate financial position of Hospitality Property Fund Limited as at 30 June 2016, and its consolidated and separate financial performance and consolidated and separate cash flows for the year then ended in accordance with International Financial Reporting Standards and the requirements of the Companies Act of South Africa.
Basis for opinion
We conducted our audit in accordance with International Standards on Auditing (ISAs). Our responsibilities under those standards are further described in the Auditor’s responsibilities for the audit of the
Group and Company financial statements section of our report. We are independent of the Group in accordance with the Independent Regulatory Board for Auditors Code of Professional Conduct for Registered Auditors (IRBA Code) and other independence requirements applicable to performing audits of financial statements in South Africa. We have fulfilled our other ethical responsibilities in accordance with the IRBA Code and in accordance with other ethical requirements applicable to performing audits in South Africa. The IRBA Code is consistent with the International Ethics Standards Board for Accountants Code of Ethics for Professional Accountants (Parts A and B). We believe that the audit evidence we have obtained is sufficient and appropriate to provide a basis for our opinion.
Key audit matters
Key audit matters are those matters that, in our professional judgement, were of most significance in our audit of the Group and Company financial statements of the current period. These matters were addressed in the context of our audit of the Group and Company financial statements as a whole, and in forming our opinion thereon, and we do not provide a separate opinion on these matters.
Valuation of investment property (relates to the Group financialstatements).
Refertonotes4.2,4.4,6and12tothefinancialstatements.
The key audit matter How the matter was addressed in our audit
Valuation of investment property is an area of judgement which could materially affect the financial statements.
The Group’s accounting policy in note 4.2 and 4.4 states that investment property is held at fair value. The fair values of investment properties are determined by an independent valuer using a discounted cash flow model. The data used in the models includes significant unobservable inputs including expected rental/hotel net profit growth and risk adjusted discount rates.
Our audit focused on this fair value measurement due to its impact on the Group’s financial statements and the significance of the judgments involved in the determination of the fair value.
Our audit procedures performed included the following:
• We assessed the competence, independence and integrity of the external valuer.
• We focused our audit work on testing the key assumptions used in the determination of the fair value, including: – analysing the accuracy of the historical forecasted rental
income/ hotel net profits compared to the actual results achieved.
– challenging the appropriateness of the growth assumptions used in the forecast hotel cash flows based on the accuracy of previous forecasts and budgets and our experience of the industry.
– comparing discount and capitalisation rates used to available industry data for similar investment properties.
• Assessing the appropriateness of the disclosures made in the financial statements.

HOSPITALITY PROPERTY FUND INTEGRATED ANNUAL REPORT 201676
INDEPENDENT AUDITORS’ REPORT continued
Conversion of linked units to stated capital (relatestotheGroupandCompanyfinancialstatements).
Refertonotes16and18tothefinancialstatements.
Other information
The directors are responsible for the other information. The other information comprises the Directors’ Report, the Report of the Audit and Risk Committee and the Certificate by the Company Secretary as required by the Companies Act of South Africa, which we obtained prior to the date of this report, and the Integrated Annual Report, which is expected to be made available to us after that date. Other information does not include the Group and Company financial statements and our auditor’s report thereon.
Our opinion on the Group and Company financial statements does not cover the other information and we do not express an audit opinion or any form of assurance conclusion thereon.
In connection with our audit of the Group and Company financial statements, our responsibility is to read the other information and, in doing so, consider whether the other information is materially inconsistent with the Group and Company financial statements or our knowledge obtained in the audit, or otherwise appears to be materially misstated. If, based on the work we have performed on the other information obtained prior to the date of this auditor’s
report, we conclude that there is a material misstatement of this other information, we are required to report that fact. We have nothing to report in this regard.
Responsibilities of the directors for the Group and Company financial statements
The directors are responsible for the preparation and fair presentation of the Group and Company financial statements in accordance with International Financial Reporting Standards and the requirements of the Companies Act of South Africa, and for such internal control as the directors determine is necessary to enable the preparation of Group and Company financial statements that are free from material misstatement, whether due to fraud or error.
In preparing the Group and Company financial statements, the directors are responsible for assessing the Group’s and the Company’s ability to continue as a going concern, disclosing, as applicable, matters related to going concern and using the going concern basis of accounting unless the directors either intend to liquidate the Group and/or the Company or to cease operations, or have no realistic alternative but to do so.
The key audit matter How the matter was addressed in our audit
As indicated in notes 16 and 18, Hospitality Property Fund Limited (the Company) converted its linked units to stated capital (the conversion) in order to comply with the JSE Listing Requirements for a Real Estate Investment Trust (REIT).
The conversion required majority approval by both A- and B-linked unitholders.
Notes 16 and 18 to the financial statements include disclosures related to the conversion.
This transaction receives significant shareholder focus as it was necessary in order for the Company to retain its listing as a REIT and was thus considered a key focus area of our audit.
Our audit procedures performed included the following:• We attended the Special General Meetings where the
conversion was discussed in order to understand the transaction and to identify whether the accounting treatment of the conversion in the financial statements was appropriate.
• We inspected the approvals obtained from A- and B-linked unitholders for the conversion.
• We agreed all amounts and dates of the conversion to the unitholders’ resolutions, circulars issued by the Company, minutes of meetings, and the updated Memorandum of Incorporation.
• We reconciled all of the accounts that were converted to stated capital to confirm that the correct balances were converted on 28 September 2015.
• We inspected documentation to support that the par value share capital was cancelled and the share premium was transferred to stated capital.
• We assessed the appropriateness of the disclosures made in the financial statements.

HOSPITALITY PROPERTY FUND INTEGRATED ANNUAL REPORT 2016 77
Auditor’s responsibilities for the audit of the Group and Company financial statements
Our objectives are to obtain reasonable assurance about whether the Group and Company financial statements as a whole are free from material misstatement, whether due to fraud or error, and to issue an auditor’s report that includes our opinion.
Reasonable assurance is a high level of assurance, but is not a guarantee that an audit conducted in accordance with ISAs will always detect a material misstatement when it exists. Misstatements can arise from fraud or error and are considered material if, individually or in the aggregate, they could reasonably be expected to influence the economic decisions of users taken on the basis of these Group and Company financial statements.
As part of an audit in accordance with ISAs, we exercise professional judgement and maintain professional scepticism throughout the audit. We also:
• Identify and assess the risks of material misstatement of the Group and Company financial statements, whether due to fraud or error, design and perform audit procedures responsive to those risks, and obtain audit evidence that is sufficient and appropriate to provide a basis for our opinion. The risk of not detecting a material misstatement resulting from fraud is higher than for one resulting from error, as fraud may involve collusion, forgery, intentional omissions, misrepresentations, or the override of internal control.
• Obtain an understanding of internal control relevant to the audit in order to design audit procedures that are appropriate in the circumstances, but not for the purpose of expressing an opinion on the effectiveness of the Group’s and the Company’s internal control.
• Evaluate the appropriateness of accounting policies used and the reasonableness of accounting estimates and related disclosures made by the directors.
• Conclude on the appropriateness of the directors’ use of the going concern basis of accounting and based on the audit evidence obtained, whether a material uncertainty exists related to events or conditions that may cast significant doubt on the Group’s and the Company’s ability to continue as a going concern. If we conclude that a material uncertainty exists, we are required to draw attention in our auditor’s report to the related disclosures in the Group and Company financial statements or, if such disclosures are inadequate, to modify our opinion. Our conclusions are based on the audit evidence obtained up to the date of our auditor’s report. However, future events or conditions may cause the Group and/or the Company to cease to continue as a going concern.
• Evaluate the overall presentation, structure and content of the Group and Company financial statements, including the disclosures, and whether the Group and Company financial statements represent the underlying transactions and events in a manner that achieves fair presentation.
• Obtain sufficient appropriate audit evidence regarding the financial information of the entities or business activities within the Group to express an opinion on the Group financial statements. We are responsible for the direction, supervision and performance of the Group audit. We remain solely responsible for our audit opinion.
We communicate with the directors regarding, among other matters, the planned scope and timing of the audit and significant audit f indings, including any significant deficiencies in internal control that we identify during our audit.
We also provide the directors with a statement that we have complied with relevant ethical requirements regarding independence, and to communicate with them all relationships and other matters that may reasonably be thought to bear on our independence, and where applicable, related safeguards.
From the matters communicated with the directors, we determine those matters that were of most significance in the audit of the Group and Company financial statements of the current period and are therefore the key audit matters. We describe these matters in our auditor’s report unless law or regulation precludes public disclosure about the matter or when, in extremely rare circumstances, we determine that a matter should not be communicated in our report because the adverse consequences of doing so would reasonably be expected to outweigh the public interest benefits of such communication.
REPORT ON OTHER LEGAL AND REGULATORY REQUIREMENTSIn terms of the IRBA Rule published in Government Gazette Number 39475 dated 4 December 2015, we report that KPMG Inc. has been the auditor of Hospitality Property Fund Limited for 11 years.
KPMG Inc.Registered Auditor
Per M FouchéChartered Accountant (SA)Registered AuditorDirector
5 September 2016KPMG Crescent85 Empire RoadParktownJohannesburg

HOSPITALITY PROPERTY FUND INTEGRATED ANNUAL REPORT 201678
STATEMENTS OF FINANCIAL POSITION as at 30 June 2016
GROUP COMPANY
Notes2016
R’0002015
R’0002016
R’0002015
R’000
ASSETSNon-current assets 5 174 459 4 819 827 4 047 148 4 025 151Investment properties 6 5 169 000 4 806 775 – –Straight-line rental income accrual 7 – 225 – –Investment properties and related accrual 5 169 000 4 807 000 – –Furniture, fittings and equipment 8 180 573 – –Goodwill 9 – 12 000 – –Investment in subsidiary 10 – – 4 040 884 4 021 015Loan to HPF Share Incentive Trust 33.1 – – 6 264 4 136Derivative asset 32.1 4 961 – – –Investment in associates 11 318 254 – –Current assets 404 128 626 033 4 144 3 654Non-current assets held for sale 12 129 491 329 228 – –Properties held for trading 13 22 643 21 620 – –Derivative asset 32.1 699 – – –Trade and other receivables 14 57 035 71 035 2 095 3 620Cash and cash equivalents 15 194 260 204 150 2 049 34
Total assets 5 578 587 5 445 860 4 051 292 4 028 805
EQUITY AND LIABILITIESEquity 3 732 253 970 747 3 037 728 501 239Stated capital 16 2 909 957 – 2 919 952 –Share capital and share premium 16 – 515 931 – 515 931Retained earnings/(accumulated loss) 107 961 (2 332) 117 776 (14 692)Fair value reserve 17 714 335 457 148 – –Non-current liabilities 1 126 540 4 045 747 370 000 3 165 837Debentures 18 – 2 415 842 – 2 425 837Interest-bearing liabilities 19 1 125 063 1 627 874 370 000 740 000Derivative liability 32.1 1 477 2 093 – –Current liabilities 719 794 429 304 643 564 361 729Trade and other payables 21 95 552 85 352 19 435 17 877Short-term portion of interest-bearing liabilities 19 600 000 230 000 600 000 230 000Taxation – 100 – –Provision for shareholder redemption 36 24 129 – 24 129 –Derivative liability 32.1 113 – – –Debenture interest payable 27 – 113 852 – 113 852
Total equity and liabilities 5 578 587 5 445 860 4 051 292 4 028 805
A. Net asset value per share/linked unit (Rand) A-share/linked unit 12.93 11.74 10.53 10.14 B-share/linked unit 12.93 11.74 10.53 10.14
A. Net asset value per share/linked unit def ined as: (Total assets – Total liabilities + Debentures)/(Linked units in issue at end of year).

HOSPITALITY PROPERTY FUND INTEGRATED ANNUAL REPORT 2016 79
STATEMENTS OF COMPREHENSIVE INCOMEfor the year ended 30 June 2016
GROUP COMPANY
Notes2016
R’0002015
R’0002016
R’0002015
R’000
Revenue 474 328 433 287 – –Rental income – contractual 474 553 434 112 – –
– straight-line accrual 7 (225) (825) – –Operating income – – 275 492 248 075Operating expenses (44 852) (40 674) (9 310) (9 115)Operating profit 22 429 476 392 613 266 182 238 960Net finance (cost)/income (158 085) (160 888) 912 715Finance income 23 12 737 9 696 88 073 78 225Finance costs 23 (170 822) (170 584) (87 161) (77 510)
Profit before debenture interest, goodwill impairment, fair value adjustments and taxation 271 391 231 725 267 094 239 675Debenture interest 27 – (232 815) – (232 815)Profit/(loss) before fair value adjustments, goodwill impairment and taxation 271 391 (1 090) 267 094 6 860(Loss)/profit on disposal of investment properties (13 556) 390 – –Fair value adjustments 245 412 143 531 1 728 (6 331)Investment properties, before straight-lining adjustment 251 024 143 734 – –Straight-line rental income accrual 7 225 825 – –Total fair value of investment properties 251 249 144 559 – –Goodwill impairment 9 (12 000) (7 200) – –Inter-company loan impairment reversal/(impairment raised) – – 1 728 (6 331)Interest rate swaps 6 163 6 172 – –
Profit before taxation 503 247 142 831 268 822 529Equity accounted profit from associate after tax 11 264 203 – –Debenture discount amortisation 23 (2 313) (8 633) (2 313) (8 633)Taxation 24 (9) (116) – (16)Total profit/(loss) and total comprehensive income for the year 501 189 134 285 266 509 (8 120)

HOSPITALITY PROPERTY FUND INTEGRATED ANNUAL REPORT 201680
GROUP COMPANY
Notes2016
R’0002015
R’0002016
R’0002015
R’000
Dividend/Distribution per share/linked unit (cents)A-shares/linked units
– interim 77.00 73.33 77.00 73.33– final 78.62 74.88 78.62 74.88– total 155.62 148.21 155.62 148.21
B-shares/linked units– interim 16.87 9.12 16.87 9.12– final 17.94 4.03 17.94 4.03– total 34.81 13.15 34.81 13.15
Basic earnings and diluted earnings per share/linked unit (cents)A-shares/units 179.35 129.81 – –B-shares/units 179.35 129.81 – –
358.70 259.62 – –
Total dividends/debenture interest for the year ended 30 June 2016 amounted to R271.9 million (2015: R232.8 million).
STATEMENTS OF COMPREHENSIVE INCOME continued for the year ended 30 June 2016

HOSPITALITY PROPERTY FUND INTEGRATED ANNUAL REPORT 2016 81
STATEMENTS OF CHANGES IN EQUITY for the year ended 30 June 2016
Share capital
Share premium
Stated capital
Retained earnings/
(accumulated loss)
Fair value reserve
Treasury share
reserve Total
R’000 R’000 R’000 R’000 R’000 R’000 R’000
GROUPBalance at 30 June 2014 27 481 289 – 13 289 307 242 – 801 847Total profit and comprehensive income for the year – – – 134 285 – – 134 285Transactions with owners, recorded directly in equity 1 34 614 – (149 906) 149 906 – 34 615Issue of shares 1 34 614 – – – – 34 615Transfer to fair value reserve – investment properties – – – (143 734) 143 734 – –Transfer to fair value reserve – interest rate swaps – – – (6 172) 6 172 – –
Balance at 30 June 2015 28 515 903 – (2 332) 457 148 – 970 747
Total profit and comprehensive income for the year – – – 501 189 – – 501 189Transactions with owners, recorded directly in equity (28) (515 903) 2 919 952 (390 896) 257 187 (9 995) 2 260 317
Conversion of par value shares into no par value shares (28) (515 903) 515 931 – – – –Conversion of debentures into no par value shares – – 2 428 150 – – – 2 428 150Conversion of par value treasury shares into no par value shares – – – – – (9 995) (9 995)Dividend paid (interim) (note 27) – – – (133 709) – – (133 709)Provision for shareholder redemption (note 36) – – (24 129) – – – (24 129)Transfer to fair value reserve – investment properties – – – (251 024) 251 024 – –Transfer to fair value reserve – interest rate swaps – – – (6 163) 6 163 – –
Balance at 30 June 2016 – – 2 919 952 107 961 714 335 (9 995) 3 732 253
COMPANYBalance at 30 June 2014 27 481 289 – (6 572) – – 474 744Total loss and comprehensive income for the year – – – (8 120) – – (8 120)Transactions with owners, recorded directly in equity 1 34 614 – – – – 34 615Issue of shares 1 34 614 – – – – 34 615
Balance at 30 June 2015 28 515 903 – (14 692) – – 501 239
Total profit and comprehensive income for the year – – – 266 509 – – 266 509Transactions with owners, recorded directly in equity (28) (515 903) 2 919 952 (134 041) – – 2 269 980
Conversion of par value shares into no par value shares (28) (515 903) 515 931 – – – –Conversion of debentures into no par value shares – – 2 428 150 – – 2 428 150Dividend paid (interim) (note 27) – – – (134 041) – – (134 041)Provision for shareholder redemption (note 36) – – (24 129) – – – (24 129)
Balance at 30 June 2016 – – 2 919 952 117 776 – – 3 037 728
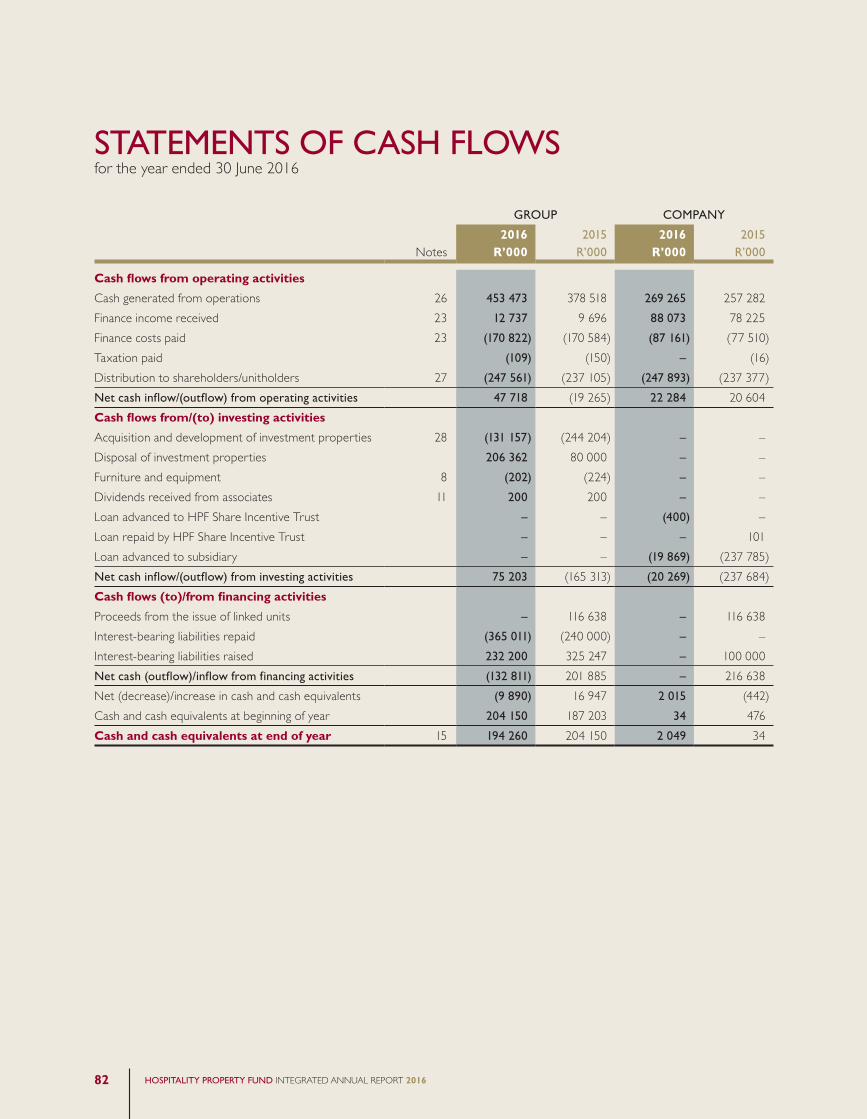
HOSPITALITY PROPERTY FUND INTEGRATED ANNUAL REPORT 201682
STATEMENTS OF CASH FLOWSfor the year ended 30 June 2016
GROUP COMPANY
Notes2016
R’0002015
R’0002016
R’0002015
R’000
Cash flows from operating activities
Cash generated from operations 26 453 473 378 518 269 265 257 282Finance income received 23 12 737 9 696 88 073 78 225Finance costs paid 23 (170 822) (170 584) (87 161) (77 510)Taxation paid (109) (150) – (16)Distribution to shareholders/unitholders 27 (247 561) (237 105) (247 893) (237 377)Net cash inflow/(outflow) from operating activities 47 718 (19 265) 22 284 20 604Cash flows from/(to) investing activities
Acquisition and development of investment properties 28 (131 157) (244 204) – –Disposal of investment properties 206 362 80 000 – –Furniture and equipment 8 (202) (224) – –Dividends received from associates 11 200 200 – –Loan advanced to HPF Share Incentive Trust – – (400) –Loan repaid by HPF Share Incentive Trust – – – 101Loan advanced to subsidiary – – (19 869) (237 785)Net cash inflow/(outflow) from investing activities 75 203 (165 313) (20 269) (237 684)Cash flows (to)/from financing activities
Proceeds from the issue of linked units – 116 638 – 116 638Interest-bearing liabilities repaid (365 011) (240 000) – –Interest-bearing liabilities raised 232 200 325 247 – 100 000Net cash (outflow)/inflow from financing activities (132 811) 201 885 – 216 638Net (decrease)/increase in cash and cash equivalents (9 890) 16 947 2 015 (442)Cash and cash equivalents at beginning of year 204 150 187 203 34 476Cash and cash equivalents at end of year 15 194 260 204 150 2 049 34
HOSPITALITY PROPERTY FUND INTEGRATED ANNUAL REPORT 2016 83
ACCOUNTING POLICIES1. INTRODUCTION
Hospitality Property Fund Limited (“the Company”) is a Company domiciled in South Africa. The Group and Company financial statements for the year ended 30 June 2016 comprise those of the Company, its subsidiaries (together referred to as the “Group” and individually as “Group entities”) and the Group’s interest in associates. The accounting policies are for both the Group and Company unless specifically noted otherwise. The Company is a Real Estate Investment Trust (REIT) and the Group is focused on the investment in hotel properties.
The “Group” comprises of Hospitality Property Fund Limited and the following subsidiaries:• HPF Properties Proprietary Limited (HPF Properties);• HPF Management Proprietary Limited (HPF Management);• HPF Employee Incentive Trust (the Trust);• Hospitality Property Fund Managers Proprietary Limited (HPF Fund Managers);• Hosbrook Ventures Proprietary Limited (Hosbrook Ventures); and• NIB 35 Proprietary Limited (NIB 35).
Where reference is made to the “entity”, this means the Company or the Group as appropriate in the context.
2. BASIS OF PREPARATIONThe Group and Company financial statements have been prepared in accordance with International Financial Reporting Standards (“IFRS”), the interpretations issued respectively by the International Accounting Standards Board (IASB), the International Financial Reporting Interpretations Committee (IFRIC) of the IASB and the SAICA Financial Reporting Guidelines as issued by the Accounting Practices Committee and Financial Reporting Pronouncements as issued by the Financial Reporting Standards Council, the JSE Listings Requirements, the requirements of the Companies Act, 2008 of South Africa, and REIT Best Practice Recommendations.
The financial statements are presented in Rands, which is the functional currency of all the Group entities, rounded to the nearest thousand. They are prepared on the going concern principle under the historical cost basis except for investment properties, investment properties held for sale and derivative financial instruments, which are measured at fair value. Fair value adjustments (where applicable) do not affect the calculation of distributable earnings but do affect the net asset value per share to the extent that adjustments are made to the carrying values of assets and liabilities.
The Group has consistently applied the accounting policies set out below to all periods presented in these consolidated financial statements.
3. USE OF JUDGEMENTS AND ESTIMATESManagement made certain judgements and estimates when preparing the financial statements. Actual results may differ from these estimates. Information about these judgements and estimates made are noted in the following notes:
• Notes 4.1.1 and 4.1.2 – whether the Group has control over an investee.• Notes 4.1.1 and 4.2 – whether acquisitions of investment properties are an acquisition of a business combination under IFRS 3 or
acquisition of property under IAS 40.• Note 9 – determination of the cash-generating unit for goodwill impairment testing.• Note 4.15 – classification of its leases as a lessor.• Notes 4.5.8, 4.16, 6, 9, 12, 19 and 32.5 – key assumptions and estimates made in the fair value of certain assets and liabilities.
NOTES TO THE FINANCIAL STATEMENTSfor the year ended 30 June 2016
HOSPITALITY PROPERTY FUND INTEGRATED ANNUAL REPORT 201684
NOTES TO THE FINANCIAL STATEMENTS continuedfor the year ended 30 June 2016
4. SIGNIFICANT ACCOUNTING POLICIES4.1 Basis of consolidation
4.1.1 BUSINESS COMBINATIONS
All business combinations are accounted for by applying the acquisition method at the acquisition date.
The acquisition date is the date on which control is transferred to the acquirer. The Group controls an entity when it is exposed to, or has rights to, variable returns from its involvement with the entity and has the ability to affect those returns through its power over the entity. Control exists where the Group has the ability to direct or dominate decision-making in an entity, regardless of whether this power is actually exercised.
Consideration transferred includes the fair values of the assets transferred, liabilities incurred by the Group to the previous owners of the acquiree, and equity interests issued by the Group.
Consideration transferred also includes the fair value of any contingent consideration. If a business combination results in the termination of pre-existing relationships between the Group and the acquiree, then the lower of the termination amount, as contained in the agreement, and the value of the off-market element is deducted from the consideration transferred and recognised in other expenses.
A contingent liability of the acquiree is assumed in a business combination only if such a liability represents a present obligation and arises from a past event, and its fair value can be measured reliably. Subsequent to initial recognition, the fair value is remeasured annually at the reporting date and any changes are recognised in profit or loss.
Transaction costs that the Group incurs in connection with a business combination, such as finder’s fees, legal fees, due diligence fees, and other professional and consulting fees are expensed as incurred, except if it is related to the issue of equity securities.
4.1.2 SUBSIDIARIES (REFER TO NOTE 10)
Subsidiaries are those entities controlled by the Group. The financial results of subsidiaries are included in the consolidated financial statements from the date that control commences until the date that control ceases.
Control exists where the Group has the ability to direct or dominate decision-making in an entity, regardless of whether this power is actually exercised.
In the case of the Company, investments in subsidiaries are measured at cost less impairment losses.
The Group has not changed its control conclusion in respect of its investments in subsidiaries.
Intra-group balances and transactions and any unrealised gains and losses arising from intra-group transactions are eliminated in preparing the consolidated financial statements.
4.1.3 INVESTMENT IN ASSOCIATES (EQUITY ACCOUNTED INVESTEES) (REFER TO NOTES 11 AND 31)
Associates are those entities in which the Group has significant influence, but not control or joint control, over the financial and operating policies.
Investments in associates are accounted for using the equity method and are recognised initially at cost. The cost of the investment includes transaction costs.
The consolidated financial statements include the Group’s share of the profit or loss and other comprehensive income, after adjustments to align the accounting policies with those of the Group, from the date that significant influence commences until the date that significant influence ceases.
HOSPITALITY PROPERTY FUND INTEGRATED ANNUAL REPORT 2016 85
4. SIGNIFICANT ACCOUNTING POLICIES (continued)4.1 Basis of consolidation (continued)
4.1.3 INVESTMENT IN ASSOCIATES (EQUITY ACCOUNTED INVESTEES) (REFERS TO NOTE 11 AND 31) (continued)
When the Group’s share of any losses exceeds its interest in the associate, the carrying amount of that investment is reduced to zero, and the recognition of further losses is discontinued except to the extent that the Group has an obligation or has made payments on behalf of the associate.
Unrealised gains arising from transactions with equity accounted investees are eliminated against the investment to the extent of the Group’s interest in the investee. Unrealised losses are eliminated in the same way as unrealised gains, but only to the extent that there is no evidence of impairment.
The associates to the Group are Vexicure Proprietary Limited and Ash Brook Investments 72 Proprietary Limited.
4.2 Investment properties (refer to note 6)
Investment properties consist of properties acquired to earn rental income for the long term and for capital appreciation over time. Properties are recognised initially at cost on acquisition, which comprises the purchase price and all costs directly attributable to the acquisition. The nature of these properties are hotels and includes furniture, fixtures and equipment and the underlying letting enterprise.
Subsequent expenditure is capitalised when it is probable that future economic benefits from the use of the investment property will flow to the Group. On redeveloping an existing investment property, all costs directly attributable to the construction (including borrowing costs) are capitalised. Repairs and maintenance which do not materially add to the value of the properties are recognised as an expense in the period in which it is incurred.
Subsequent to initial recognition, investment properties are measured at their fair value. Fair value is determined annually based on the open market value basis, using either the discounted cash flow method or the capitalisation of net income method. Gains or losses arising from changes in fair value are included in profit or loss for the period in which they arise. These gains or losses are transferred to a fair value reserve as they are not available for distribution.
On disposal of investment properties, the difference between the net disposal proceeds and the fair value at the date of the last valuation is charged or credited to profit or loss and transferred to the fair value reserve.
When the Group begins to refurbish an existing investment property for continued future use as investment property, the property remains classified as investment property, which is measured based on the fair value model.
4.3 Properties held for trading (refer to note 13)
Properties held for trading comprise properties acquired or properties developed with the intention of disposing them for profit, and are recorded at the lower of cost and net realisable value. Costs include all costs of purchase, transaction costs, costs of conversion and other costs incurred in bringing the properties to their present condition. Net realisable value is the estimated selling price in the ordinary course of business less the estimated costs of selling.
4.4 Non-current assets held for sale (refer to note 12)
Classification
Non-current assets held for sale are those investment properties of which the carrying amount will be recovered principally through sale rather than use. These investment properties are available for immediate sale in their present condition, subject only to terms that are usual for the sale of such assets, and the sale is probable within a year as management is committed to a plan to dispose of the investment properties, actively market them, and expect that the properties will be sold within a year.

HOSPITALITY PROPERTY FUND INTEGRATED ANNUAL REPORT 201686
NOTES TO THE FINANCIAL STATEMENTS continuedfor the year ended 30 June 2016
4. SIGNIFICANT ACCOUNTING POLICIES (continued)4.4 Non-current assets held for sale (refer to note 12) (continued)
Measurement
The investment properties held for sale, are measured at fair value, with gains and losses on subsequent measurement being recognised in profit or loss.
4.5 Financial instruments
A financial instrument is recognised when the Group becomes a party to the contractual provisions of the instrument. Financial instruments are initially measured at fair value, plus directly attributable transaction costs for financial instruments other than those classified at fair value through profit or loss.
Financial instruments include the following instruments per category:
Derivative financial asset/liability
Loans and receivables
• Cash and cash equivalents• Trade and other receivables• Loan to subsidiary
Financial liabilities at amortised cost
• Trade and other payables• Interest-bearing borrowings• Debentures
Subsequent to initial recognition, financial instruments are measured on the basis set out below:
4.5.1 CASH AND CASH EQUIVALENTS (REFER TO NOTE 15)
Cash and cash equivalents comprise cash balances and call deposits. Cash equivalents are short-term, highly liquid investments that are readily convertible to known amounts of cash and which are subject to an insignificant risk of changes in fair value. Cash and cash equivalents are subsequently measured at amortised cost which is equivalent to fair value.
4.5.2 TRADE AND OTHER RECEIVABLES (REFER TO NOTE 14)
Trade and other receivables are subsequently measured at amortised cost using the effective interest method, less impairment losses. Receivables with a short duration are not discounted as the effects of discounting are immaterial.
4.5.3 TRADE AND OTHER PAYABLES (REFER TO NOTE 21)
Trade and other payables are measured at amortised cost, using the effective interest method. Payables with a short duration are not discounted as the effects of discounting are immaterial.
4.5.4 FINANCIAL LIABILITIES AT AMORTISED COST (REFER TO NOTES 18 AND 19)
Interest-bearing borrowings and debentures are measured at amortised cost with any difference between cost and redemption value being recognised in profit or loss over the period of the borrowing on an effective interest basis.
4.5.5 DERIVATIVE FINANCIAL INSTRUMENTS (REFER TO NOTES 32.5 AND 32.2)
The Group uses derivative financial instruments to economically hedge its exposure to interest rate risk arising from its financing activities. The Group does not hold or issue derivative financial instruments for trading purposes. However, as the hedge relationship is not designated as a hedge for accounting purposes, the derivatives are accounted for as trading instruments. Subsequent to initial recognition, derivative financial instruments are measured at fair value.

HOSPITALITY PROPERTY FUND INTEGRATED ANNUAL REPORT 2016 87
4. SIGNIFICANT ACCOUNTING POLICIES (continued)4.5 Financial instruments (continued)
4.5.5 DERIVATIVE FINANCIAL INSTRUMENTS (REFER TO NOTES 32.5 AND 32.2) (continued)
The gain or loss on remeasurement to fair value is recognised immediately in profit or loss. Any gains or losses on these financial instruments arising from changes in fair value do not affect distributable earnings. These gains or losses are transferred from retained earnings to a fair value reserve as they are not available for distribution.
The only financial derivative instruments held by the Group are interest rate swaps. The fair value of an interest rate swap is the estimated amount that the Group would receive or pay to terminate the swap at the reporting date, taking account of current interest rates and the current creditworthiness of the swap counterparties.
4.5.6 DERECOGNITION
The Group derecognises a financial asset when and only when the contractual rights to the cash flows arising from the financial asset have expired in the Group; or it transfers the rights to receive the contractual cash flows on the financial asset including transferring substantially all the risks and rewards of ownership of the asset; or it transfers the financial asset, neither retaining nor transferring substantially all the risks and rewards of ownership of the asset, but no longer retains control of the asset. If the Group has retained control, it shall continue to recognise the financial asset to the extent of its continuing involvement in the financial asset.
A financial liability is derecognised when and only when the liability is extinguished, that is when the obligation specified in the contract is discharged, cancelled or has expired.
4.5.7 OFFSET
Financial assets and financial liabilities are offset and the net amount reported in the statement of financial position when the Group has a legally enforceable right to set off the recognised amounts, and intends to either settle on a net basis, or to realise the asset and settle the liability simultaneously.
4.5.8 IMPAIRMENT
The Group assesses at each reporting date whether there is objective evidence that a financial asset is impaired. Objective evidence that a financial asset may be impaired includes default or delinquency in payment by a counterparty, significant financial difficulty of the counterparty, or it becoming probable that the counterparty will enter bankruptcy or financial reorganisation.
An impairment loss in respect of a financial asset measured at amortised cost is calculated as the difference between its carrying amount and the present value of the estimated future cash flows discounted at the asset’s original effective interest rate. Losses are recognised in profit or loss and reflected in an allowance account against receivables. Interest on the impaired asset continues to be recognised through the unwinding of the discount.
An impairment loss is reversed if the reversal can be related objectively to an event occurring after the impairment loss was recognised. Impairment loss reversals are recognised in profit or loss.
4.6 Share capital (refer to note 16)
Ordinary shares are classified as equity. Incremental costs directly attributable to the issue of new shares are shown as a deduction in equity from the proceeds, net of any tax effects.

HOSPITALITY PROPERTY FUND INTEGRATED ANNUAL REPORT 201688
NOTES TO THE FINANCIAL STATEMENTS continuedfor the year ended 30 June 2016
4. SIGNIFICANT ACCOUNTING POLICIES (continued)4.7 Revenue
4.7.1 RENTAL INCOME (REFER TO STATEMENT OF COMPREHENSIVE INCOME AND NOTE 7)
Revenue from the letting of investment property comprises rentals (excluding VAT) and is recognised on a straight-line basis over the term of the lease. Contingent (variable) rentals are included in revenue when the amounts can be reliably measured. Recoveries of costs from lessees, where the Group merely acts as agent and makes payment of these costs on behalf of lessees, are offset against the relevant costs.
4.7.2 FINANCE INCOME (REFER TO NOTES 10 AND 23)
Interest earned on cash invested with financial institutions by Group as well as by the Company on its investments in its subsidiaries are recognised on an accrual basis using the effective interest method.
4.8 Expenses
4.8.1 LETTING COSTS
Letting costs, which include tenant installations and letting commissions are recognised in profit or loss over the period of the applicable lease, with the deferred portion being included in receivables.
4.8.2 RECOVERIES OF COSTS FROM LESSEES
Where the Group merely acts as agent and makes payment of these costs on behalf of lessees, these are offset against the relevant costs.
4.8.3 FINANCE COSTS (REFER TO NOTE 23)
Finance costs are costs incurred on funds borrowed, these are expensed in the period in which they are incurred using the effective interest method.
4.9 Income tax (refer to notes 20 and 24)
Income tax for the year comprises current and deferred tax. Income tax is recognised in profit or loss except to the extent that it relates to business combinations, or items recognised directly in equity or other comprehensive income.
4.9.1 CURRENT TAX
Current tax is the expected tax payable on the taxable income for the year, using tax rates enacted or substantively enacted at reporting date, and any adjustments to tax payable in respect of previous years.
4.9.2 DEFERRED TAX
Deferred tax is recognised on temporary differences between the carrying amounts of assets and liabilities for financial reporting purposes and the amounts used for taxation purposes. Deferred tax is not recognised for the following temporary differences: initial recognition of assets and liabilities in a transaction that is not a business combination, where the initial recognition affects neither accounting nor taxable profit or loss and on differences relating to investments in subsidiaries, associates and joint ventures to the extent that the parent company is able to control the timing of the reversal of the temporary differences and they will probably not reverse in the foreseeable future. In addition, deferred tax is not recognised for taxable temporary differences arising on the initial recognition of goodwill.
A deferred tax asset is recognised only to the extent that it is probable that future taxable profits will be available against which the asset can be utilised. Deferred tax assets are reviewed at each reporting date and reduced to the extent that it is no longer probable that the related tax benefit will be realised. Deferred tax assets and liabilities are offset if there is a legally enforceable right to offset current tax liabilities and assets, and they relate to income taxes levied by the same tax authority on the same taxable Group, or on different tax entities, but they intend to settle current tax liabilities and assets on a net basis or their tax assets and liabilities will be realised simultaneously.

HOSPITALITY PROPERTY FUND INTEGRATED ANNUAL REPORT 2016 89
4. SIGNIFICANT ACCOUNTING POLICIES (continued)4.9 Income tax (refer to notes 20 and 24) (continued)
4.9.2 DEFERRED TAX (continued)
In respect of REIT assets and liabilities (investment properties) the measurement of deferred tax is based on a rebuttable presumption that the amount of the investment property will be recovered entirely through sale. Capital gains and losses from property sold by a REIT are disregarded and the rate relevant to recoupments is 28%. Investment properties are held as long-term income-generating assets. Therefore, should any property no longer meet the Company’s investment criteria and be sold, any profits or losses will be capital in nature and will be taxed at rates applicable to capital gains (currently nil). Allowances previously claimed will be recouped on sale. Where an accumulated loss is available to shield this recoupment, a deferred tax asset is raised.
In respect of other assets and liabilities deferred tax is provided based on the expected manner of realisation or settlement taking into account the entities expectation that it will pay dividends and will receive a tax deduction making it in substance exempt.
4.10 Segment reporting (refer to note 37)
Determination and presentation of operating segments
Operating segments are reported in a manner consistent with the internal reporting provided to the chief operating decision-maker. The chief operating decision-maker has been identified as the Group’s Chief Executive Officer (“CEO”) and the Group Management Committee (“Manco”). The Group’s CEO and Manco review the Group’s internal reporting in order to assess performance and allocate resources. Management has determined the operating segments based on the reports reviewed by the Group’s CEO and Manco, which are used to make strategic decisions.
The Group has the following main reportable segments:• Traditional portfolio – properties from which revenue is generated predominately from rooms occupation;• Conference portfolio – properties that are food, beverage and conference revenue-based; and• Head office – although the head office does not generate revenue directly, the CEO together with Manco reviews and
manages head office as a separate business segment.
4.11 Employeebenefits
4.11.1 SHORT-TERM EMPLOYEE BENEFITS (REFER TO NOTE 22)
The cost of all short-term employee benefits is recognised during the period in which the employee renders the related service. Short-term employee benefits are measured on an undiscounted basis. The accrual for employee entitlements to salaries, bonuses and leave represent the amount which the Group has a present obligation to pay as a result of the employees’ services provided to the reporting date.
4.11.2 SHARE-BASED PAYMENT TRANSACTION (REFER TO NOTE 33)
The fair value of the amount payable to employees in respect of the Share Appreciation Rights (SARs), which are settled in cash, is recognised as an expense with a corresponding increase in liabilities, over the period during which the employees become unconditionally entitled to payment. The liability is remeasured at each reporting date and at a settlement date based on the fair value of the SARs. Any change in the measurement of the liability is recognised in profit or loss.
4.12 Intangible assets
Goodwill (refer to note 9)
Goodwill that arises upon the acquisition of businesses is included in intangible assets. For measurement of goodwill at initial recognition, see note 4.1.1 Business Combinations.

HOSPITALITY PROPERTY FUND INTEGRATED ANNUAL REPORT 201690
NOTES TO THE FINANCIAL STATEMENTS continuedfor the year ended 30 June 2016
4. SIGNIFICANT ACCOUNTING POLICIES (continued)4.12 Intangible assets (continued)
Subsequent measurement
Goodwill is measured at cost less accumulated impairment losses. In respect of equity accounted investees, the carrying amount of goodwill is included in the carrying amount of the investment, and an impairment loss on such an investment is not allocated to any asset, including goodwill, that forms part of the carrying amount of the equity accounted investee.
4.13 Furniture,fittingsandequipment(refertonote8)
(i) Recognition and measurement
Furniture, fittings and equipment are those acquired for use at the Group’s office and are recognised initially at cost, being all costs needed to bring the asset into use.
Subsequently, these are measured at cost less accumulated depreciation and impairment losses. The nature of these assets are such that useful lives of a part of an asset do not vary and therefore having no need for componentisation.
Gains or losses incurred on disposal of an item of furniture, fittings and equipment, being the difference between the proceeds received and the carrying amount, are recognised within other income in profit or loss.
The costs of the day-to-day servicing of furniture, fittings and equipment are recognised in profit or loss as incurred.
(ii) Depreciation
Depreciation is calculated based on the asset’s depreciable amount, which is the cost of an asset less its residual value.
Depreciation is recognised in profit or loss on a straight-line basis over the estimated useful lives of an item of furniture, fittings and equipment, since this most closely reflects the expected pattern of consumption of the future economic benefits embodied in the asset.
The estimated useful lives for the current and comparative periods are three to six years.
Depreciation methods, useful lives and residual values are reviewed at each reporting date and adjusted if appropriate.
4.14 Impairmentofnon-financialassets
This policy covers goodwill, furniture, fittings and equipment, investment in associates. The carrying amount of non-financial assets are reviewed at each reporting date to determine whether there are any indications of impairment. If any such indication exists, the asset’s recoverable amount is estimated. An impairment loss is recognised whenever the carrying amount of an asset exceeds its recoverable amount. Impairment losses are recognised in profit or loss in the period in which they are incurred.
An impairment loss is reversed if the reversal can be related objectively to an event occurring after the impairment loss was recognised. Impairment loss reversals are recognised in profit or loss.
4.15 Leases (refer to note 30)
The Group is party to numerous leasing contracts as the lessor of property. All leases are operating leases, which are those leases where the Group retains a significant portion of the risks and rewards of ownership. An adjustment is made to contractual rental income earned to bring to account in the current period the difference between the rental income that the Group is currently entitled to and the rental for the period calculated on a straight-line basis over the period of the lease term. The Group is also party to leasing contracts as the lessee of some property and equipment. Operating lease rentals with fixed escalation clauses are recognised in profit or loss on a straight-line basis over the lease term. The resulting difference arising from the straight-line basis and contractual cash flows is recognised as an operating lease asset or operating lease liability.

HOSPITALITY PROPERTY FUND INTEGRATED ANNUAL REPORT 2016 91
4. SIGNIFICANT ACCOUNTING POLICIES (continued)4.16 Fair value measurement (refer to notes 6, 9, 12, 19 and 32.5)
Market observable data is used as much as possible when measuring the fair value of an asset or liability. Fair values are categorised into different levels in a fair value hierarchy based on the inputs used in the valuation techniques as follows:
Level 1: Unadjusted quoted prices in active markets for identical assets or liabilities.
Level 2: Inputs other than quoted prices included in level 1 that are observable for the asset or liability, either directly or indirectly.
Level 3: Inputs for assets or liabilities that are not based on observable market data.
The Group has included additional disclosures in this regard under notes 6, 9, 12, 19 and 32.5.
If the inputs used to measure the fair value of an asset or a liability might be categorised in different levels of the fair value hierarchy, then the fair value measurement is categorised in its entirety in the same level of the fair value hierarchy as the lowest level input that is significant to the entire measurement.
Transfers between the levels of the fair value hierarchy are done at the end of the reporting period during which the change has occurred.
4.17 Provisions
Provisions are recognised when the Group has a present legal or constructive obligation as a result of a past event, it is probable that an outflow of resources embodying economic benefit will be required to settle the obligation and a reliable estimate of the amount can be made. Provisions are determined by discounting the expected future cash flows at a pre-tax rate that reflects current market assessments of the time value of money and the risks specific to the liability.
5. NEW AND AMENDED IFRS STANDARDS5.1 New and amended standards that came into effect
The following amended standard that has come into effect for the financial period commencing 1 July 2015 is applicable to the Group:
New and amended standard Summary Impact to the Group
Amendments to IAS 32 Financial Instruments
The presentation clarifies the meaning of “currently has a legally enforceable right to set-off” and the criteria for non-simultaneous settlement mechanisms of clearing houses to qualify for offsetting.
No impact.
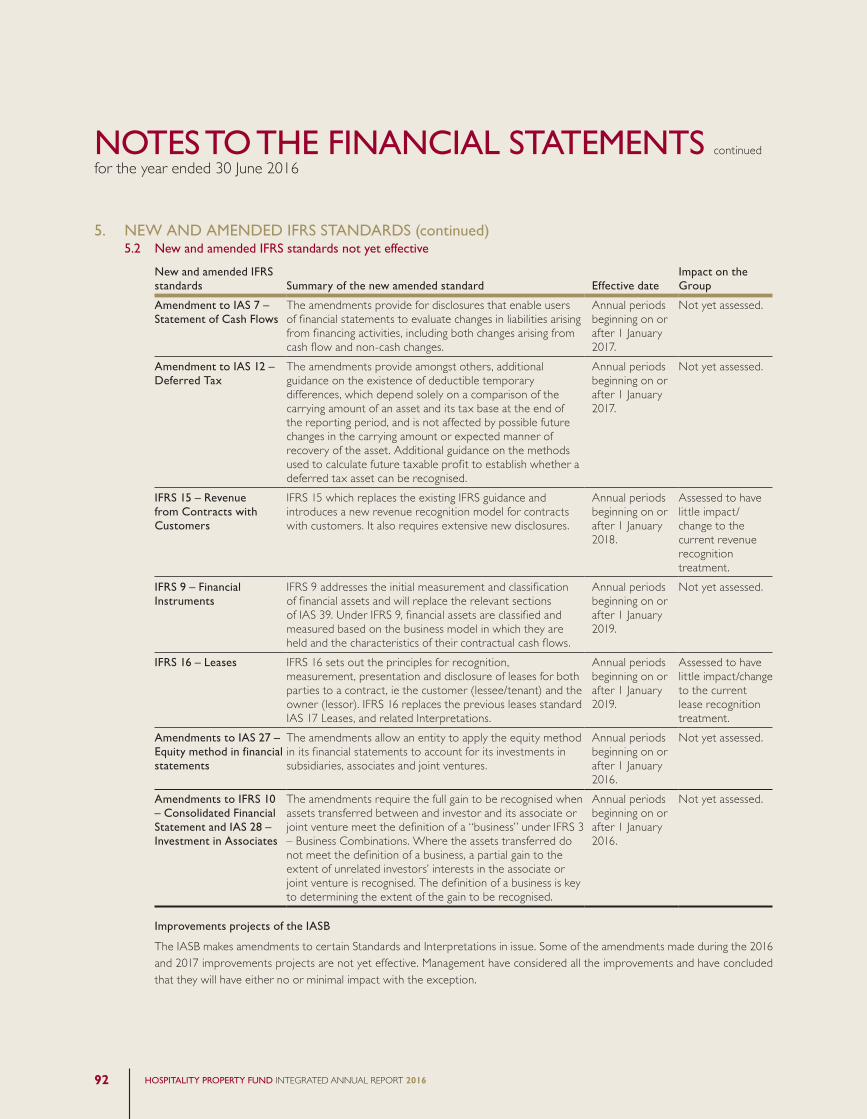
HOSPITALITY PROPERTY FUND INTEGRATED ANNUAL REPORT 201692
NOTES TO THE FINANCIAL STATEMENTS continuedfor the year ended 30 June 2016
5. NEW AND AMENDED IFRS STANDARDS (continued)5.2 New and amended IFRS standards not yet effective
New and amended IFRS standards Summary of the new amended standard Effective date
Impact on the Group
Amendment to IAS 7 – Statement of Cash Flows
The amendments provide for disclosures that enable users of financial statements to evaluate changes in liabilities arising from financing activities, including both changes arising from cash flow and non-cash changes.
Annual periods beginning on or after 1 January 2017.
Not yet assessed.
Amendment to IAS 12 – Deferred Tax
The amendments provide amongst others, additional guidance on the existence of deductible temporary differences, which depend solely on a comparison of the carrying amount of an asset and its tax base at the end of the reporting period, and is not affected by possible future changes in the carrying amount or expected manner of recovery of the asset. Additional guidance on the methods used to calculate future taxable profit to establish whether a deferred tax asset can be recognised.
Annual periods beginning on or after 1 January 2017.
Not yet assessed.
IFRS 15 – Revenue from Contracts with Customers
IFRS 15 which replaces the existing IFRS guidance and introduces a new revenue recognition model for contracts with customers. It also requires extensive new disclosures.
Annual periods beginning on or after 1 January 2018.
Assessed to have little impact/change to the current revenue recognition treatment.
IFRS 9 – Financial Instruments
IFRS 9 addresses the initial measurement and classification of financial assets and will replace the relevant sections of IAS 39. Under IFRS 9, financial assets are classified and measured based on the business model in which they are held and the characteristics of their contractual cash flows.
Annual periods beginning on or after 1 January 2019.
Not yet assessed.
IFRS 16 – Leases IFRS 16 sets out the principles for recognition, measurement, presentation and disclosure of leases for both parties to a contract, ie the customer (lessee/tenant) and the owner (lessor). IFRS 16 replaces the previous leases standard IAS 17 Leases, and related Interpretations.
Annual periods beginning on or after 1 January 2019.
Assessed to have little impact/change to the current lease recognition treatment.
Amendments to IAS 27 – Equity method in financial statements
The amendments allow an entity to apply the equity method in its financial statements to account for its investments in subsidiaries, associates and joint ventures.
Annual periods beginning on or after 1 January 2016.
Not yet assessed.
Amendments to IFRS 10 – Consolidated Financial Statement and IAS 28 – Investment in Associates
The amendments require the full gain to be recognised when assets transferred between and investor and its associate or joint venture meet the definition of a “business” under IFRS 3 – Business Combinations. Where the assets transferred do not meet the definition of a business, a partial gain to the extent of unrelated investors’ interests in the associate or joint venture is recognised. The definition of a business is key to determining the extent of the gain to be recognised.
Annual periods beginning on or after 1 January 2016.
Not yet assessed.
Improvements projects of the IASB
The IASB makes amendments to certain Standards and Interpretations in issue. Some of the amendments made during the 2016 and 2017 improvements projects are not yet effective. Management have considered all the improvements and have concluded that they will have either no or minimal impact with the exception.

HOSPITALITY PROPERTY FUND INTEGRATED ANNUAL REPORT 2016 93
GROUP COMPANY
2016R’000
2015R’000
2016R’000
2015R’000
6. INVESTMENT PROPERTIESBalance at beginning of year 4 806 775 4 514 950 – –Additions at cost – capitalised expenditure 88 240 87 287 – –Additions – acquisitions at fair value 28 252 154 627 – –Transfer to non-current assets held for sale – (72 000) – –Disposals – (79 610) – –Fair value adjustment included as part of “fair value adjustment” in profit or loss 245 508 200 696 – –
5 168 775 4 805 950 – –Adjust: straight-line rental income accrual 225 825 – –Properties at fair value 5 169 000 4 806 775 – –
Acquisitions relate to three additional units at the Radisson Blu Waterfront for R14.3 million and R14.0 million in movable assets acquired at Champagne Sports Resort.
The investment property portfolio serves as collateral against loans from funding banks and secured notes. Refer to note 19.
Measurement of fair value
Investment properties were independently valued at 30 June 2016. The valuation of the portfolio was performed by Mr B Nyagah, Professional Associate Valuer, from JHI Properties Proprietary Limited. The valuations are done on an annual basis on the entire portfolio of investment properties.
The fair value measurement for the investment properties of R5.3 billion has been categorised as a level 3 fair value based on the inputs to the valuation technique used.
Valuation technique and significant unobservable inputs
Valuation technique Significant unobservable inputs
Inter-relationship between key unobservable inputs and fair value measurement
Discounted cash flows: The valuation model considers the present value of net cash flows to be generated from the property, together with its movables, operating equipment and the business, taking into account expected rental growth rates, void periods and other costs not paid by tenants. The expected net cash flows are discounted using risk-adjusted discount rates. Among other factors, the discount rate estimation considers the quality of a hotel property, its movables, operating equipment and business, its location and lease terms.
• Expected rental/hotel net profit growth varies between 0.9% and 31.6%. The weighted average growth rate applied in the rental income/hotel net profit is 6.2%.
• Risk-adjusted discount rates varies between 13.50% and 15.00%, with a weighted average discount rate of 14.10%.
The estimated fair value would increase/(decrease) if:• expected rentals/hotel net profit
growth were higher/(lower); and• risk-adjusted discount rates were
lower/(higher).

HOSPITALITY PROPERTY FUND INTEGRATED ANNUAL REPORT 201694
NOTES TO THE FINANCIAL STATEMENTS continuedfor the year ended 30 June 2016
6. INVESTMENT PROPERTIES (continued)A controlled framework is in place in respect of the measurement of the fair values of investment properties. This includes the analyst team that oversees the fair value measurements for investment properties, as valued by an independent valuer, who directly reports to the Financial Director on the fair value of investment properties.
GROUP COMPANY
2016R’000
2015R’000
2016R’000
2015R’000
7. STRAIGHT-LINE RENT INCOME ACCRUALBalance at beginning of year 225 1 050 – –Straight-line rental reversed during year (225) (825) – –Balance at end of year – 225 – –
8. FURNITURE, FITTINGS AND EQUIPMENTCost
Balance at beginning of year 2 186 1 962 – –Acquisition during year 202 235 – –Disposals (10) (11) – –Balance at end of year 2 378 2 186 – –Depreciation and impairment losses
Balance at beginning of year 1 613 1 020 – –Depreciation for the year 323 593 – –Impairment for the year 265 – – –Disposals (3) – – –Balance at end of year 2 198 1 613 – –Carrying amount
Balance at beginning of year 573 942 – –Balance at end of year 180 573 – –The items impaired mainly relates to software which Management no longer uses.
9. GOODWILLOpening balance 12 000 19 200 – –Impairment loss (12 000) (7 200) – –Carrying amount at year-end – 12 000 – –
The goodwill resulted from the internalisation of the asset management business (cash-generating unit) on 1 December 2009. The total goodwill recognised as a result amounted to R152.8 million, which was based on the earnings before interest, tax, depreciation and amortisation of the cash-generating unit.

HOSPITALITY PROPERTY FUND INTEGRATED ANNUAL REPORT 2016 95
9. GOODWILL (continued)Impairment testing for cash-generating unit containing goodwill
For the purpose of the annual impairment testing of goodwill, the recoverable amount of the cash-generating unit was based on its value in use. It was determined that the recoverable amount was Rnil and therefore a full impairment loss of R12 million was recognised. The recoverable amount was calculated by discounting the projected future cash flows generated from the continuing use of the unit and was based on the following key assumptions and past experience:
(a) The management contract will continue on the same terms that were in place previously namely:• an annual management fee of 0.5% of the Group’s enterprise value which comprise a combination of interest-bearing debt and
market capitalisation; and• 1% acquisition and development fee.
(b) Remuneration in respect of all staff employed by the asset management company will grow in line with inflation.
(c) Rental cost of premises and all overheads will change in line with inflation.
(d) The value-in-use was calculated based on an amount equivalent to the estimated future cash flow of HPF Management over five years’ methodology (based on the purchase agreement) from 2017 to 2021. The cash flow of HPF Management for each of the years was calculated by taking the net profit before tax and depreciation cash flows from the operation for each of the years escalated by the CPI for a five-year forecast period and discounting the forecast cash flows by the average yield of Hospitality Property Fund Limited over the previous five years, which amounted to 8.80% (2015: 8.52%). As the recoverable amount is Rnil, no terminal value was applied after 2020.
The impairment of the goodwill is mainly driven by the assumption that acquisitions would take place in the current year that did not realise, together with a lower market capitalisation.
GROUP
2016R’000
2015R’000
10. INVESTMENT IN SUBSIDIARYHPF Properties Proprietary LimitedShares at cost (R120)* – –Loan to HPF Properties Proprietary Limited 4 040 884 4 021 015
4 040 884 4 021 015
The subsidiary’s principal activity is investment in properties in the hotel and leisure sector. The subsidiary has an issued share capital of R120 and is wholly-owned by the Company. The loan to HPF Properties Proprietary Limited is unsecured, of which R3 053 million bears no interest and is repayable on demand, while the R987 million bears interest and is repayable in line with the domestic medium-term note programme presented in note 19.
An amount of R88.0 million (2015: R78.2 million) in interest and R273.1 million (2015: R248.1 million) in dividends were paid to the Company during the year.
* Amount smaller than R1 000.
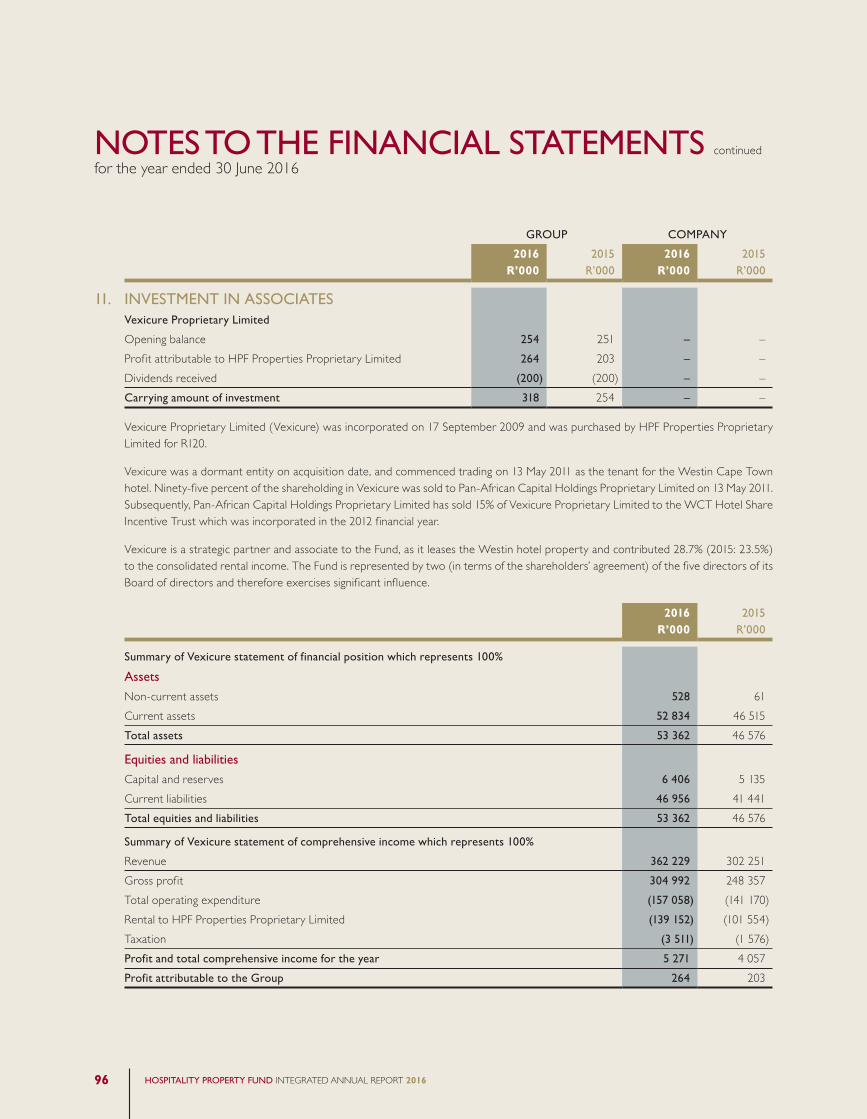
HOSPITALITY PROPERTY FUND INTEGRATED ANNUAL REPORT 201696
NOTES TO THE FINANCIAL STATEMENTS continuedfor the year ended 30 June 2016
GROUP COMPANY
2016R’000
2015R’000
2016R’000
2015R’000
11. INVESTMENT IN ASSOCIATESVexicure Proprietary Limited
Opening balance 254 251 – –Profit attributable to HPF Properties Proprietary Limited 264 203 – –Dividends received (200) (200) – –Carrying amount of investment 318 254 – –
Vexicure Proprietary Limited (Vexicure) was incorporated on 17 September 2009 and was purchased by HPF Properties Proprietary Limited for R120.
Vexicure was a dormant entity on acquisition date, and commenced trading on 13 May 2011 as the tenant for the Westin Cape Town hotel. Ninety-five percent of the shareholding in Vexicure was sold to Pan-African Capital Holdings Proprietary Limited on 13 May 2011. Subsequently, Pan-African Capital Holdings Proprietary Limited has sold 15% of Vexicure Proprietary Limited to the WCT Hotel Share Incentive Trust which was incorporated in the 2012 financial year.
Vexicure is a strategic partner and associate to the Fund, as it leases the Westin hotel property and contributed 28.7% (2015: 23.5%) to the consolidated rental income. The Fund is represented by two (in terms of the shareholders’ agreement) of the five directors of its Board of directors and therefore exercises significant influence.
2016R’000
2015R’000
Summary of Vexicure statement of financial position which represents 100%
Assets
Non-current assets 528 61Current assets 52 834 46 515Total assets 53 362 46 576
Equities and liabilities
Capital and reserves 6 406 5 135Current liabilities 46 956 41 441Total equities and liabilities 53 362 46 576
Summary of Vexicure statement of comprehensive income which represents 100%
Revenue 362 229 302 251Gross profit 304 992 248 357Total operating expenditure (157 058) (141 170)Rental to HPF Properties Proprietary Limited (139 152) (101 554)Taxation (3 511) (1 576)Profit and total comprehensive income for the year 5 271 4 057Profit attributable to the Group 264 203
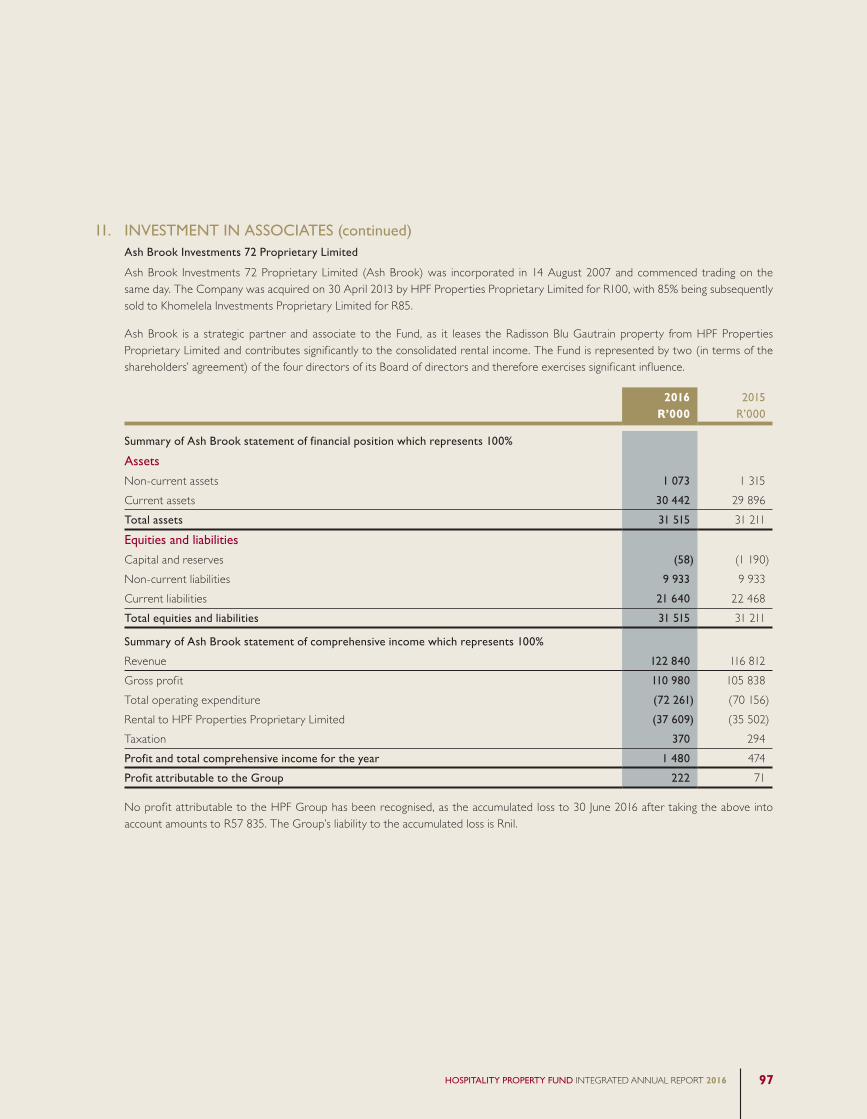
HOSPITALITY PROPERTY FUND INTEGRATED ANNUAL REPORT 2016 97
11. INVESTMENT IN ASSOCIATES (continued)Ash Brook Investments 72 Proprietary Limited
Ash Brook Investments 72 Proprietary Limited (Ash Brook) was incorporated in 14 August 2007 and commenced trading on the same day. The Company was acquired on 30 April 2013 by HPF Properties Proprietary Limited for R100, with 85% being subsequently sold to Khomelela Investments Proprietary Limited for R85.
Ash Brook is a strategic partner and associate to the Fund, as it leases the Radisson Blu Gautrain property from HPF Properties Proprietary Limited and contributes significantly to the consolidated rental income. The Fund is represented by two (in terms of the shareholders’ agreement) of the four directors of its Board of directors and therefore exercises significant influence.
2016R’000
2015R’000
Summary of Ash Brook statement of financial position which represents 100%
Assets
Non-current assets 1 073 1 315Current assets 30 442 29 896Total assets 31 515 31 211Equities and liabilities
Capital and reserves (58) (1 190)Non-current liabilities 9 933 9 933Current liabilities 21 640 22 468Total equities and liabilities 31 515 31 211
Summary of Ash Brook statement of comprehensive income which represents 100%
Revenue 122 840 116 812Gross profit 110 980 105 838Total operating expenditure (72 261) (70 156)Rental to HPF Properties Proprietary Limited (37 609) (35 502)Taxation 370 294Profit and total comprehensive income for the year 1 480 474Profit attributable to the Group 222 71
No profit attributable to the HPF Group has been recognised, as the accumulated loss to 30 June 2016 after taking the above into account amounts to R57 835. The Group’s liability to the accumulated loss is Rnil.

HOSPITALITY PROPERTY FUND INTEGRATED ANNUAL REPORT 201698
NOTES TO THE FINANCIAL STATEMENTS continuedfor the year ended 30 June 2016
12. NON-CURRENT ASSETS HELD FOR SALEThe following investment properties have been identified for disposal in the next year:
GROUP
Valuation at 30 June 2015
R’000
Capital expenditure
R’000Disposal
R’000
Fair value adjustment*
R’000
Valuation at 30 June
2016R’000
Group – 30 June 2016
Protea Hotel – The Winkler 26 000 1 470 (27 470) – –
Protea Hotel – Hazyview 46 000 613 – (5 613) 41 000
Protea Hotel – The Richards 46 000 2 655 (48 655) – –
The Bayshore Inn 36 000 1 222 (37 222) – –
Protea Hotel – Imperial 25 000 1 217 (26 217) – –
Protea Hotel – Hluhluwe & Safaris 14 500 1 121 (15 621) – –
Kopanong Hotel and Conference Centre 79 728 2 556 (4 922) 11 129 88 491
Protea Hotel Richards Bay 28 000 1 124 (29 124) – –
Premier Hotel King David 28 000 2 687 (30 687) – –
329 228 14 665 (219 918) 5 516 129 491
Valuation at 30 June 2014
R’000Transfer
R’000
Capital expenditure
R’000
Fair value adjustment*
R’000
Valuation at 30 June 2015
R’000
Group – 30 June 2015
Protea Hotel – The Winkler 41 000 – (88) (14 912) 26 000Protea Hotel – Hazyview 33 000 – 213 12 787 46 000Protea Hotel – The Richards 68 000 – 433 (22 433) 46 000The Bayshore Inn 39 000 – 381 (3 381) 36 000Protea Hotel – Imperial 30 000 – (352) (4 648) 25 000Protea Hotel – Hluhluwe & Safaris 18 900 – 982 (5 382) 14 500Kopanong Hotel and Conference centre 82 000 – 176 (2 448) 79 728Protea Hotel Richards Bay – 37 000 290 (9 290) 28 000Premier Hotel King David – 35 000 252 (7 252) 28 000
311 900 72 000 2 287 (56 959) 329 228
* Fair value adjustment included as part of “fair value adjustment” in prof it or loss.
The above investment properties have been identified for disposal and have therefore been classified as non-current assets held for sale. The above assets are available for immediate sale in their present condition, management is committed to the disposal plan and actively searching for a buyer at the above fair value price. The properties are all profitable, but considered non-core to the Fund and as such have been placed on the disposal list.

HOSPITALITY PROPERTY FUND INTEGRATED ANNUAL REPORT 2016 99
12. NON-CURRENT ASSETS HELD FOR SALE (continued)Management intends disposing these properties within the next 12 months. Kopanong Hotel and Conference Centre is presented in the conference portfolio on the segmental report, whilst Protea Hotel Hazyview is presented under the traditional portfolio.
Since the prior year five units at Kopanong Hotel and Conference Centre have been disposed off. Management have been constantly engaging with willing buyers on Protea Hotel Hazyview, to date none of the engagements have materialised into a sale.
Measurement of fair value
Non-current assets held for sale (Investment properties) were independently valued at 30 June 2016. The valuation of the portfolio was performed by Mr B Nyagah, Professional Associate Valuer, from JHI (Gensec Property Services Limited). The valuations are done on an annual basis on the entire portfolio of investment properties.
Valuation technique Significant unobservable inputsInter-relationship between key unobservable inputs and fair value
Discounted cash flows: The valuation model considers the present value of net cash flows to be generated from the property, together with its movables, operating equipment and the business, taking into account expected rental growth rates, void periods and other costs not paid by tenants. The expected net cash flows are discounted using risk-adjusted discount rates. Among other factors, the discount rate estimation considers the quality of a hotel property, its movables, operating equipment and hotel operation, its location and lease terms.
• Expected rental/hotel net profit growth varies between an increase of 10.6% and 14.5%. The weighted average growth rate applied in the rental income/hotel net profit is 12.9%.
• Risk-adjusted discount rates were between 14.50% and 15.00%, with a weighted average discount rate of 14.68%.
The estimated fair value would increase/(decrease) if:• expected rentals/hotel net profit
growth were higher/(lower); and• risk-adjusted discount rates were
lower/(higher).
A controlled framework is in place in respect of the measurement of the fair values of investment properties. This includes the analyst team that oversees the fair value measurements for investment properties, as valued by an independent valuer, who directly reports to the Financial Director on the fair value of Investment Properties.
GROUP COMPANY
2016R’000
2015R’000
2016R’000
2015R’000
13. PROPERTIES HELD FOR TRADINGProperties acquired and held for trading 22 643 21 620 – –
Properties held for trading comprise land held for sale at the phase two development at the Arabella Hotel and Spa Estate in Kleinmond, which is measured at cost. The increase in the carrying amount relates to capitalised costs. The Board is exploring the various options available to the Group in order to realise a profit from the phase two land.

HOSPITALITY PROPERTY FUND INTEGRATED ANNUAL REPORT 2016100
NOTES TO THE FINANCIAL STATEMENTS continuedfor the year ended 30 June 2016
GROUP COMPANY
2016R’000
2015R’000
2016R’000
2015R’000
14. TRADE AND OTHER RECEIVABLESTrade receivables 56 105 70 577 1 654 3 175Prepayments 930 458 441 445Trade and other receivables 57 035 71 035 2 095 3 620Financial assets 56 105 70 577 1 654 3 175Non-financial assets 930 458 441 445
15. CASH AND CASH EQUIVALENTSBank balances of current and call accounts 194 260 204 150 2 049 34
The Fund has an unutilised facility of R232.8 million with Nedbank.
16. STATED CAPITAL/SHARE CAPITAL AND SHARE PREMIUMShare capitalAuthorised
A-shares – 200 000 000 no par value ordinary shares (2015: 200 000 000 par value of R0.0001 each) – 20 – 20B-shares – 200 000 000 no par value ordinary shares (2015: 200 000 000 par value of R0.0001 each) – 20 – 20Issued
A-shares – 144 285 503 (2015: 144 285 503) no par value ordinary shares (2015: par value of R0.0001 each) 1 872 200 14.4 1 872 200 14.4B-shares – 144 285 503 (2015: 144 285 503) no par value ordinary shares (2015: par value of R0.0001 each) 1 071 881 14.4 1 071 881 14.4
2 944 081 28.8 2 944 081 28.8Shares held in trust (treasury shares)
B-shares – 1 969 710 no par value ordinary shares (9 995) (0.2) – –Shares for redemption (treasury shares)
B-shares – 8 320 397 no par value ordinary shares (24 129) – (24 129) –Issued shares less shares held in trust and for shareholder redemption
A-shares – 144 285 503 (2015: 144 285 503) no par value ordinary shares (2015: par value of R0.0001 each) 1 872 200 14.4 1 872 200 14.4B-shares – 133 995 396 (2015: 144 285 503) no par value ordinary shares (2015: par value of R0.0001 each) 1 037 757 14.2 1 047 752 14.4Balance at end of year 2 909 957 28.6 2 919 952 28.8Share premiumBalance at beginning of year 515 903 481 289 515 903 481 289Premium on share issue – 34 614 – 34 614Conversion to no par value shares (515 903) – (515 903) –Balance at end of year – 515 903 – 515 903Total stated capital/share capital and share premium 2 909 957 515 932 2 919 952 515 932

HOSPITALITY PROPERTY FUND INTEGRATED ANNUAL REPORT 2016 101
16. STATED CAPITAL/SHARE CAPITAL AND SHARE PREMIUM (continued)GROUP AND COMPANY GROUP AND COMPANY
2016 2015
R’000 R’000 R’000 R’000A-shares B-shares A-units B-units
Reconciliation of issued share capital
Opening balance 14.4 14.4 14.4 14.4Conversion of share premium to no par value shares 515 903 – – –Conversion of debentures to no par value shares 1 356 283 1 071 867 – –No par value/par value shares in issue 1 872 200 1 071 881 14.4 14.4
GROUP COMPANY
2016R’000
2015R’000
2016R’000
2015R’000
Shares held in treasury
Opening balance* – – – –Conversion of 1 969 710 at par of R0.0001 to no par value shares 9 995 – – –Closing balance 9 995 – – –* Amounts are smaller than R1 000.
GROUP COMPANY
2016 2015 2016 2015
Reconciliation of the number of shares in issue (’000)
Opening balance
A-shares 144 285 138 150 144 285 138 150B-shares 142 315 136 180 144 285 138 150
286 600 274 330 288 570 276 300Issued during the year
A-shares – specific issue – 6 135 – 6 135B-shares – specific issue – 6 135 – 6 135
– 12 270 – 12 270Shares for shareholder redemption
A-shares – – – –B-shares (8 320) – (8 320) –
(8 320) – (8 320) –Closing balance
A-shares 144 285 144 285 144 285 144 285B-shares 133 995 142 315 135 965 144 285
278 280 286 600 280 250 288 570
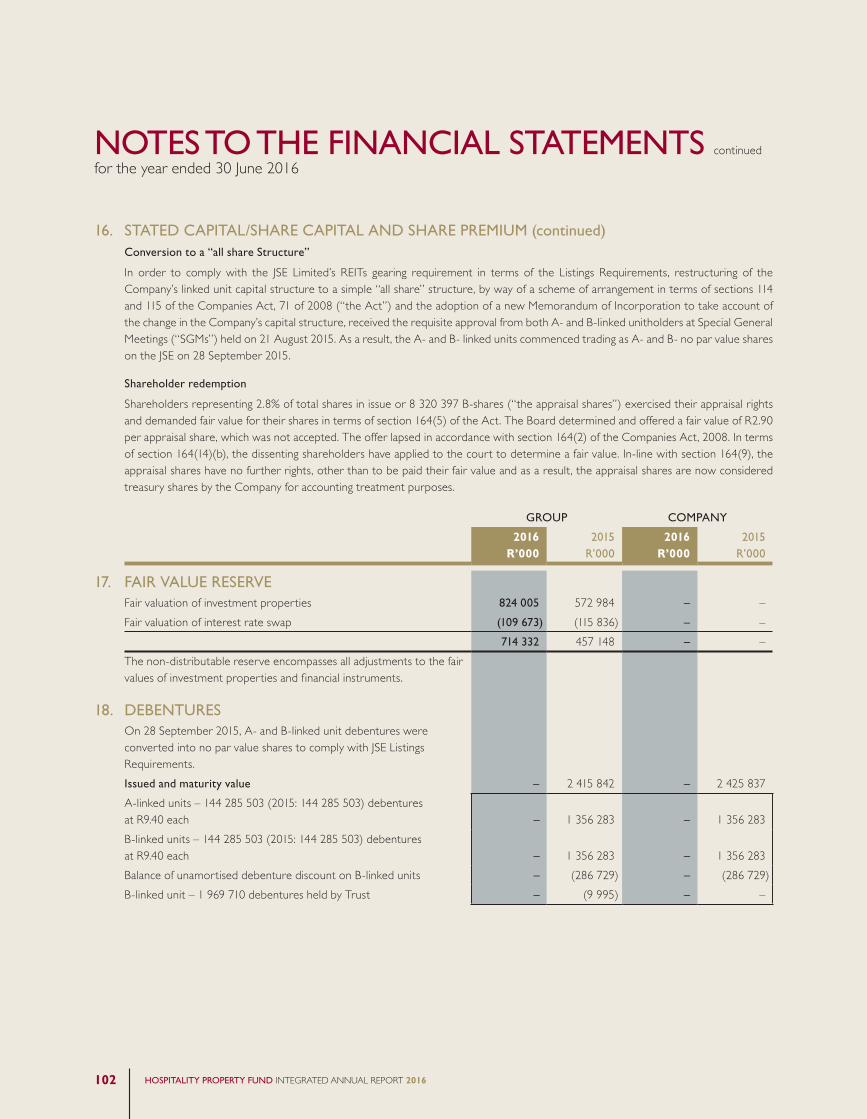
HOSPITALITY PROPERTY FUND INTEGRATED ANNUAL REPORT 2016102
NOTES TO THE FINANCIAL STATEMENTS continuedfor the year ended 30 June 2016
16. STATED CAPITAL/SHARE CAPITAL AND SHARE PREMIUM (continued)Conversion to a “all share Structure”
In order to comply with the JSE Limited’s REITs gearing requirement in terms of the Listings Requirements, restructuring of the Company’s linked unit capital structure to a simple “all share” structure, by way of a scheme of arrangement in terms of sections 114 and 115 of the Companies Act, 71 of 2008 (“the Act”) and the adoption of a new Memorandum of Incorporation to take account of the change in the Company’s capital structure, received the requisite approval from both A- and B-linked unitholders at Special General Meetings (“SGMs”) held on 21 August 2015. As a result, the A- and B- linked units commenced trading as A- and B- no par value shares on the JSE on 28 September 2015.
Shareholder redemption
Shareholders representing 2.8% of total shares in issue or 8 320 397 B-shares (“the appraisal shares”) exercised their appraisal rights and demanded fair value for their shares in terms of section 164(5) of the Act. The Board determined and offered a fair value of R2.90 per appraisal share, which was not accepted. The offer lapsed in accordance with section 164(2) of the Companies Act, 2008. In terms of section 164(14)(b), the dissenting shareholders have applied to the court to determine a fair value. In-line with section 164(9), the appraisal shares have no further rights, other than to be paid their fair value and as a result, the appraisal shares are now considered treasury shares by the Company for accounting treatment purposes.
GROUP COMPANY
2016R’000
2015R’000
2016R’000
2015R’000
17. FAIR VALUE RESERVEFair valuation of investment properties 824 005 572 984 – –Fair valuation of interest rate swap (109 673) (115 836) – –
714 332 457 148 – –The non-distributable reserve encompasses all adjustments to the fair values of investment properties and financial instruments.
18. DEBENTURESOn 28 September 2015, A- and B-linked unit debentures were converted into no par value shares to comply with JSE Listings Requirements.Issued and maturity value – 2 415 842 – 2 425 837A-linked units – 144 285 503 (2015: 144 285 503) debentures at R9.40 each – 1 356 283 – 1 356 283B-linked units – 144 285 503 (2015: 144 285 503) debentures at R9.40 each – 1 356 283 – 1 356 283Balance of unamortised debenture discount on B-linked units – (286 729) – (286 729)B-linked unit – 1 969 710 debentures held by Trust – (9 995) – –

HOSPITALITY PROPERTY FUND INTEGRATED ANNUAL REPORT 2016 103
18. DEBENTURES (continued)GROUP AND COMPANY
2016 2015
A-units B-units A-units B-units
Reconciliation
Opening balance 1 356 283 1 356 283 1 298 607 1 036 574Conversion to no par value shares (1 356 283) (1 071 867) – –Debentures issued on 29 July 2014: 1 570 050 at R9.40 and R5.10 respectively – – 14 758 7 778Debentures issued on 8 August 2014: 478 011 at R9.40 and R5.12 respectively – – 4 493 2 379Debentures issued on 1 September 2014: 474 861 at R9.40 and R5.00 respectively – – 4 464 2 307Debentures issued on 28 November 2014: 308 899 at R9.40 and R3.28 respectively – – 2 904 1 013Debentures issued on 15 December 2014: 3 303 965 at R9.40 and R3.29 respectively – – 31 057 10 870Debenture discount amortisation – 2 313 – 8 633
– 286 729 1 356 283 1 069 554Balance of unamortised debenture discount on B-linked units – (286 729) – 286 729Closing balance – – 1 356 283 1 356 283
Debentures held in treasury
During the year, 1 969 710 B-linked units owned by the Trust have been converted into no par value shares following the approval of the proposed “all share” structure mentioned under the note on share capital; these continue to remain as treasury shares on consolidation:
GROUP COMPANY
2016R’000
2015R’000
2016R’000
2015R’000
Opening balance 9 995 9 995 – –Conversion to no par value shares (9 995) – – –Closing balance – 9 995 – –
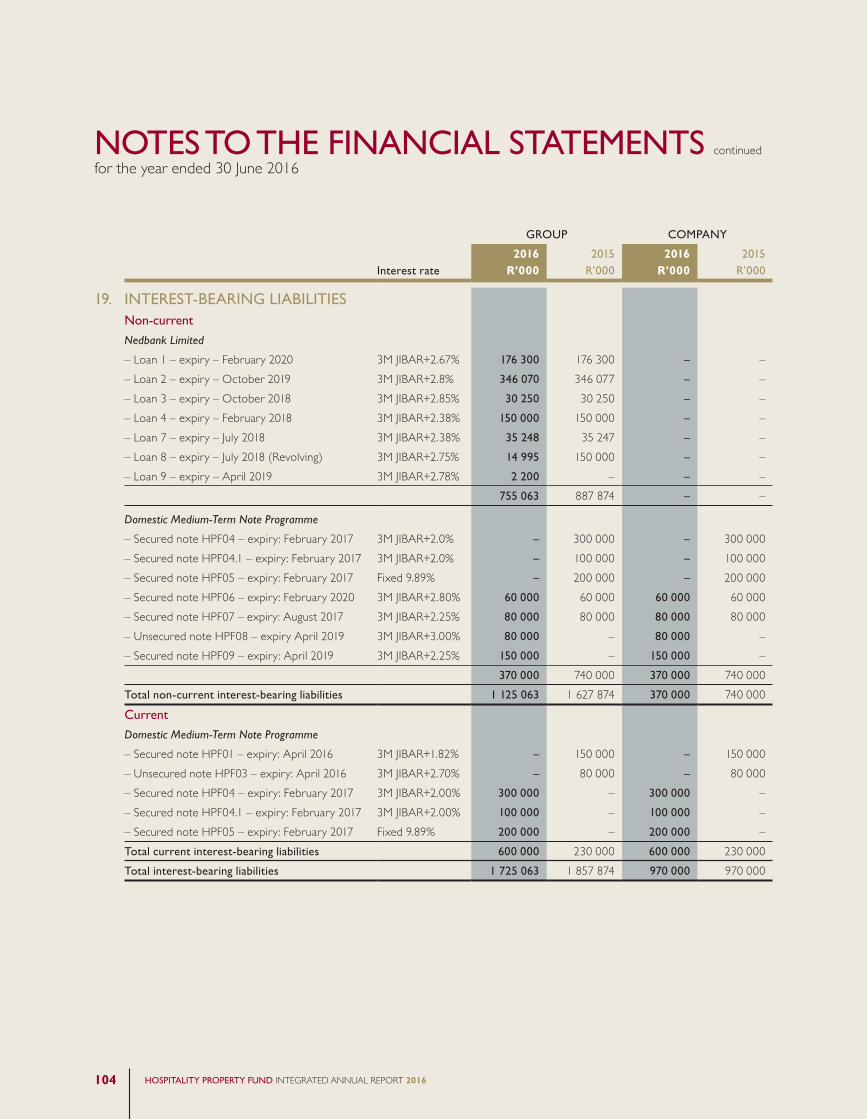
HOSPITALITY PROPERTY FUND INTEGRATED ANNUAL REPORT 2016104
NOTES TO THE FINANCIAL STATEMENTS continuedfor the year ended 30 June 2016
GROUP COMPANY
Interest rate2016
R’0002015
R’0002016
R’0002015
R’000
19. INTEREST-BEARING LIABILITIESNon-current
Nedbank Limited
– Loan 1 – expiry – February 2020 3M JIBAR+2.67% 176 300 176 300 – –– Loan 2 – expiry – October 2019 3M JIBAR+2.8% 346 070 346 077 – –– Loan 3 – expiry – October 2018 3M JIBAR+2.85% 30 250 30 250 – –– Loan 4 – expiry – February 2018 3M JIBAR+2.38% 150 000 150 000 – –– Loan 7 – expiry – July 2018 3M JIBAR+2.38% 35 248 35 247 – –– Loan 8 – expiry – July 2018 (Revolving) 3M JIBAR+2.75% 14 995 150 000 – –– Loan 9 – expiry – April 2019 3M JIBAR+2.78% 2 200 – – –
755 063 887 874 – –
Domestic Medium-Term Note Programme
– Secured note HPF04 – expiry: February 2017 3M JIBAR+2.0% – 300 000 – 300 000– Secured note HPF04.1 – expiry: February 2017 3M JIBAR+2.0% – 100 000 – 100 000– Secured note HPF05 – expiry: February 2017 Fixed 9.89% – 200 000 – 200 000– Secured note HPF06 – expiry: February 2020 3M JIBAR+2.80% 60 000 60 000 60 000 60 000– Secured note HPF07 – expiry: August 2017 3M JIBAR+2.25% 80 000 80 000 80 000 80 000– Unsecured note HPF08 – expiry April 2019 3M JIBAR+3.00% 80 000 – 80 000 –– Secured note HPF09 – expiry: April 2019 3M JIBAR+2.25% 150 000 – 150 000 –
370 000 740 000 370 000 740 000Total non-current interest-bearing liabilities 1 125 063 1 627 874 370 000 740 000Current
Domestic Medium-Term Note Programme
– Secured note HPF01 – expiry: April 2016 3M JIBAR+1.82% – 150 000 – 150 000– Unsecured note HPF03 – expiry: April 2016 3M JIBAR+2.70% – 80 000 – 80 000– Secured note HPF04 – expiry: February 2017 3M JIBAR+2.00% 300 000 – 300 000 –– Secured note HPF04.1 – expiry: February 2017 3M JIBAR+2.00% 100 000 – 100 000 –– Secured note HPF05 – expiry: February 2017 Fixed 9.89% 200 000 – 200 000 –Total current interest-bearing liabilities 600 000 230 000 600 000 230 000Total interest-bearing liabilities 1 725 063 1 857 874 970 000 970 000
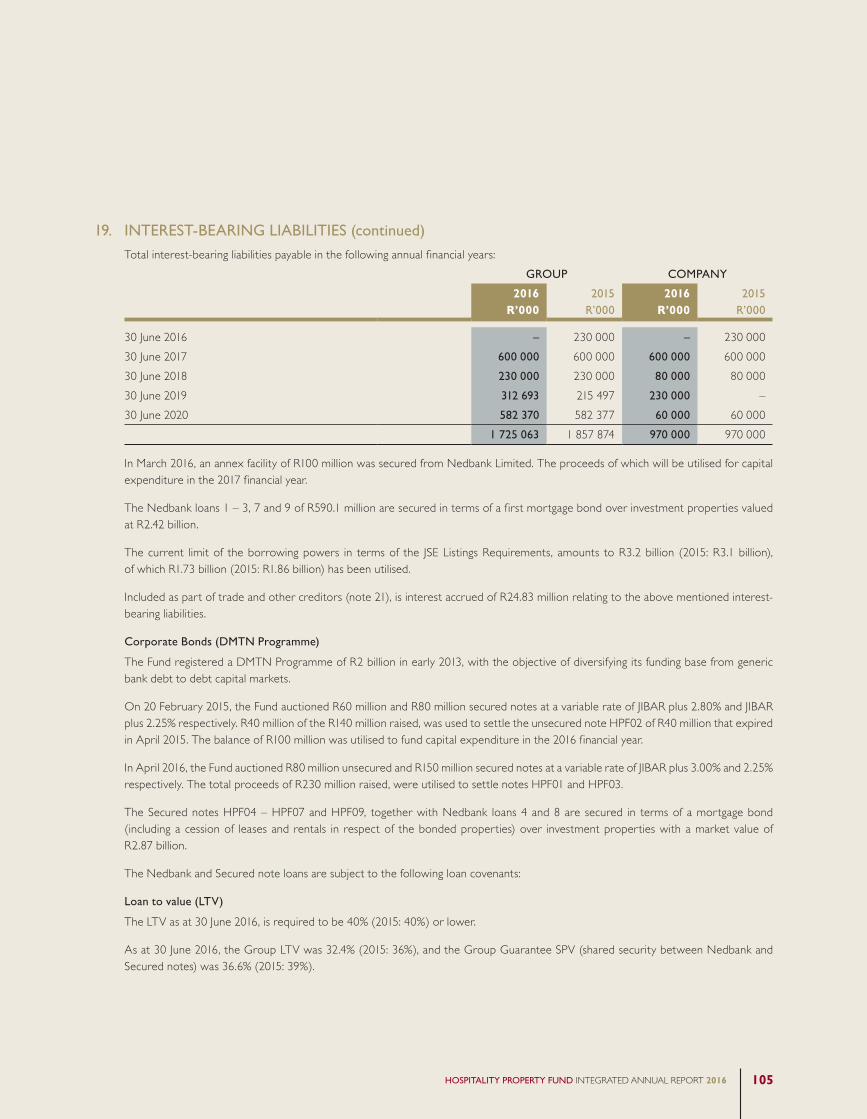
HOSPITALITY PROPERTY FUND INTEGRATED ANNUAL REPORT 2016 105
19. INTEREST-BEARING LIABILITIES (continued)Total interest-bearing liabilities payable in the following annual financial years:
GROUP COMPANY
2016R’000
2015R’000
2016R’000
2015R’000
30 June 2016 – 230 000 – 230 00030 June 2017 600 000 600 000 600 000 600 00030 June 2018 230 000 230 000 80 000 80 00030 June 2019 312 693 215 497 230 000 –30 June 2020 582 370 582 377 60 000 60 000
1 725 063 1 857 874 970 000 970 000
In March 2016, an annex facility of R100 million was secured from Nedbank Limited. The proceeds of which will be utilised for capital expenditure in the 2017 financial year.
The Nedbank loans 1 – 3, 7 and 9 of R590.1 million are secured in terms of a first mortgage bond over investment properties valued at R2.42 billion.
The current limit of the borrowing powers in terms of the JSE Listings Requirements, amounts to R3.2 billion (2015: R3.1 billion), of which R1.73 billion (2015: R1.86 billion) has been utilised.
Included as part of trade and other creditors (note 21), is interest accrued of R24.83 million relating to the above mentioned interest-bearing liabilities.
Corporate Bonds (DMTN Programme)
The Fund registered a DMTN Programme of R2 billion in early 2013, with the objective of diversifying its funding base from generic bank debt to debt capital markets.
On 20 February 2015, the Fund auctioned R60 million and R80 million secured notes at a variable rate of JIBAR plus 2.80% and JIBAR plus 2.25% respectively. R40 million of the R140 million raised, was used to settle the unsecured note HPF02 of R40 million that expired in April 2015. The balance of R100 million was utilised to fund capital expenditure in the 2016 financial year.
In April 2016, the Fund auctioned R80 million unsecured and R150 million secured notes at a variable rate of JIBAR plus 3.00% and 2.25% respectively. The total proceeds of R230 million raised, were utilised to settle notes HPF01 and HPF03.
The Secured notes HPF04 – HPF07 and HPF09, together with Nedbank loans 4 and 8 are secured in terms of a mortgage bond (including a cession of leases and rentals in respect of the bonded properties) over investment properties with a market value of R2.87 billion.
The Nedbank and Secured note loans are subject to the following loan covenants:
Loan to value (LTV)
The LTV as at 30 June 2016, is required to be 40% (2015: 40%) or lower.
As at 30 June 2016, the Group LTV was 32.4% (2015: 36%), and the Group Guarantee SPV (shared security between Nedbank and Secured notes) was 36.6% (2015: 39%).
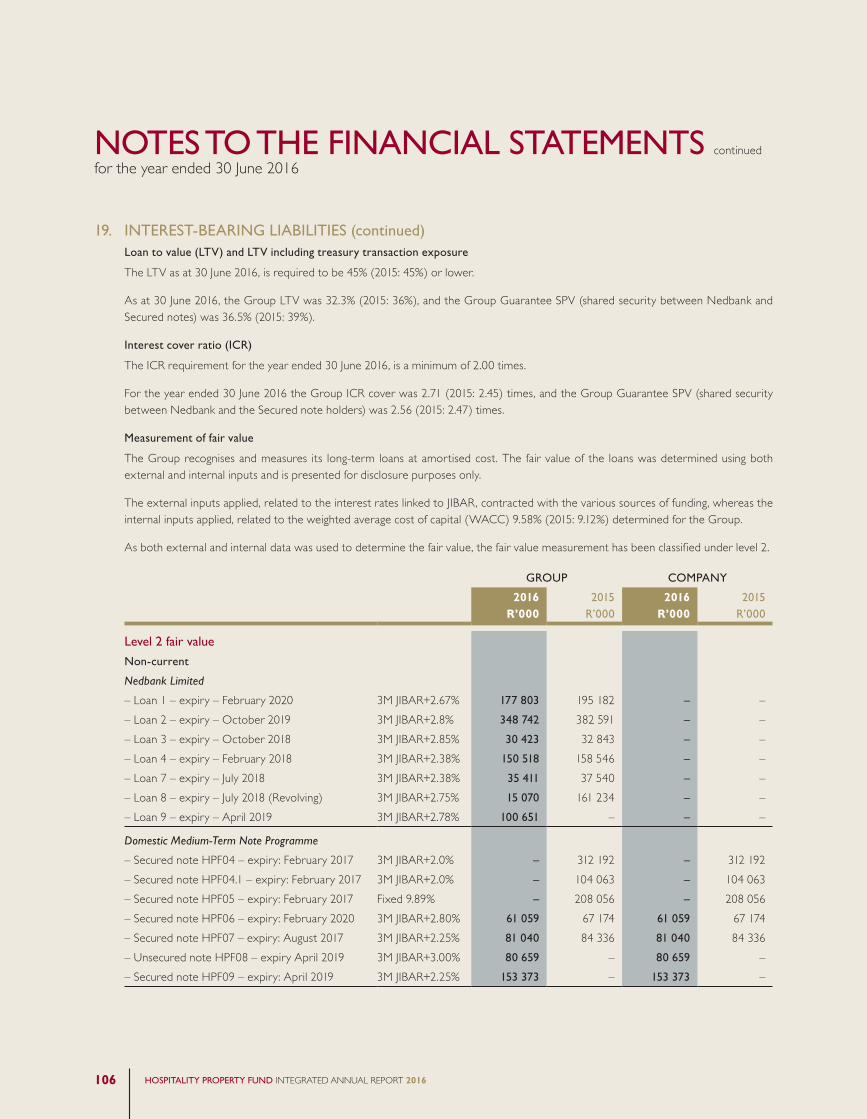
HOSPITALITY PROPERTY FUND INTEGRATED ANNUAL REPORT 2016106
NOTES TO THE FINANCIAL STATEMENTS continuedfor the year ended 30 June 2016
19. INTEREST-BEARING LIABILITIES (continued)Loan to value (LTV) and LTV including treasury transaction exposure
The LTV as at 30 June 2016, is required to be 45% (2015: 45%) or lower.
As at 30 June 2016, the Group LTV was 32.3% (2015: 36%), and the Group Guarantee SPV (shared security between Nedbank and Secured notes) was 36.5% (2015: 39%).
Interest cover ratio (ICR)
The ICR requirement for the year ended 30 June 2016, is a minimum of 2.00 times.
For the year ended 30 June 2016 the Group ICR cover was 2.71 (2015: 2.45) times, and the Group Guarantee SPV (shared security between Nedbank and the Secured note holders) was 2.56 (2015: 2.47) times.
Measurement of fair value
The Group recognises and measures its long-term loans at amortised cost. The fair value of the loans was determined using both external and internal inputs and is presented for disclosure purposes only.
The external inputs applied, related to the interest rates linked to JIBAR, contracted with the various sources of funding, whereas the internal inputs applied, related to the weighted average cost of capital (WACC) 9.58% (2015: 9.12%) determined for the Group.
As both external and internal data was used to determine the fair value, the fair value measurement has been classified under level 2.
GROUP COMPANY
2016R’000
2015R’000
2016R’000
2015R’000
Level 2 fair value
Non-current
Nedbank Limited
– Loan 1 – expiry – February 2020 3M JIBAR+2.67% 177 803 195 182 – –– Loan 2 – expiry – October 2019 3M JIBAR+2.8% 348 742 382 591 – –– Loan 3 – expiry – October 2018 3M JIBAR+2.85% 30 423 32 843 – –– Loan 4 – expiry – February 2018 3M JIBAR+2.38% 150 518 158 546 – –– Loan 7 – expiry – July 2018 3M JIBAR+2.38% 35 411 37 540 – –– Loan 8 – expiry – July 2018 (Revolving) 3M JIBAR+2.75% 15 070 161 234 – –– Loan 9 – expiry – April 2019 3M JIBAR+2.78% 100 651 – – –
Domestic Medium-Term Note Programme
– Secured note HPF04 – expiry: February 2017 3M JIBAR+2.0% – 312 192 – 312 192– Secured note HPF04.1 – expiry: February 2017 3M JIBAR+2.0% – 104 063 – 104 063– Secured note HPF05 – expiry: February 2017 Fixed 9.89% – 208 056 – 208 056– Secured note HPF06 – expiry: February 2020 3M JIBAR+2.80% 61 059 67 174 61 059 67 174– Secured note HPF07 – expiry: August 2017 3M JIBAR+2.25% 81 040 84 336 81 040 84 336– Unsecured note HPF08 – expiry April 2019 3M JIBAR+3.00% 80 659 – 80 659 –– Secured note HPF09 – expiry: April 2019 3M JIBAR+2.25% 153 373 – 153 373 –

HOSPITALITY PROPERTY FUND INTEGRATED ANNUAL REPORT 2016 107
19. INTEREST-BEARING LIABILITIES (continued)GROUP COMPANY
2016R’000
2015R’000
2016R’000
2015R’000
Level 2 fair value
Current
Domestic Medium-Term Note Programme
– Secured note HPF01 – expiry: April 2016 3M JIBAR+1.82% – 154 530 – 154 530– Unsecured note HPF03 – expiry: April 2016 3M JIBAR+2.70% – 83 131 – 83 131– Secured note HPF04 – expiry: February 2017 3M JIBAR+2.00% 303 587 – – –– Secured note HPF04.1 – expiry: February 2017 3M JIBAR+2.00% 101 196 – – –– Secured note HPF05 – expiry: February 2017 Fixed 9.89% 207 666 – – –Total fair value of loans 1 847 198 1 981 418 376 131 1 251 143
Valuation technique
Discounted Cash Flows (DCF): The valuation model considers the present value of the settlement of the current loan together with the future interest payments. The future cash flows are determined using the contracted rates with the various sources of funding for the interest payments, together with the expected settlement amounts of the loan. The expected cash flows are discounted using the Groups’ weighted average cost of capital (WACC).
The WACC is determined as the finance cost divided by the average borrowings during the year.
GROUP COMPANY
2016R’000
2015R’000
2016R’000
2015R’000
Sensitivity analysis
Cash flow sensitivity on profit or loss and equity– 0.50% change in interest rate 8 625 9 289 4 850 4 850– 1.00% change in interest rate 17 251 18 579 9 700 9 700– 1.50% change in interest rate 25 876 27 868 14 550 14 550
20. DEFERRED TAXATION LIABILITYWith effect from 2 July 2013, the Company and controlled property subsidiaries converted to REIT. As a result, section 25BB of the Income Tax Act will apply to qualifying REIT income and expenses. The legislation provides that capital gains on sale of investment properties are disregarded and previous building allowances claimed will be recouped at 28%. All rental income and dividends from property subsidiaries will be taxed at 28% and any dividends paid from these taxable profits, will be deductible at 28%. Any amount in respect of a financial instrument will be taxed at 28%. As the Group has not currently decided to pay out capital profits as dividends, income tax could arise on recoupment when investment properties are sold. This income tax is shielded by an accumulated loss.

HOSPITALITY PROPERTY FUND INTEGRATED ANNUAL REPORT 2016108
NOTES TO THE FINANCIAL STATEMENTS continuedfor the year ended 30 June 2016
20. DEFERRED TAXATION LIABILITY (continued)GROUP COMPANY
2016R’000
2015R’000
2016R’000
2015R’000
Deferred tax balances
– Provisions 1 744 648 – –– Prepayments (14) (4) – –– Fixed assets (13) 10 – –– Recoupment of capital allowances (141 906) (163 010) – –Deferred tax (liability)/asset before assessed losses (140 189) (162 356) – –– Assessed losses 140 189 162 356 – –Net deferred tax asset – – – –
A deferred tax asset has been recognised for all temporary differences to the extent that it is probable that taxable profit will be available against which the deductible temporary differences can be utilised. The total assessed losses for the Group amounts to R666.7 million (2015: R736.8 million). Only R500.6 million (2015: R575.4 million) of the total assessed losses has been utilised to raise a deferred tax asset and the remainder of the assessed loss has not been recognised as it is not deemed probable that there will be future profits against which the assessed loss can be utilised. For the Company, no deferred tax asset has been recognised as it is unlikely that any deferred tax asset will be utilised by the Company in the future.
GROUP COMPANY
2016R’000
2015R’000
2016R’000
2015R’000
Movement in deferred tax balances
Temporary differences
– Provisions 1 096 (24) – –– Prepayments (10) 53 – –– Fixed assets (3) 94 – –– Over/(Under) provision of prior year deferred tax 1 647 (45) – –– Recoupment of capital allowances 21 104 (1 907) – –– Assessed tax losses (23 834) 1 829 – –
– – – –Assessed losses available
– Recoupment of capital allowances (506 806) (582 179) – –– Assessed tax losses 666 742 736 817 – –Unrecognised assessed losses 159 936 154 638 – –

HOSPITALITY PROPERTY FUND INTEGRATED ANNUAL REPORT 2016 109
21. TRADE AND OTHER PAYABLESGROUP COMPANY
2016R’000
2015R’000
2016R’000
2015R’000
Trade payables 71 179 78 385 19 435 17 877Tenant deposits 20 518 4 948 – –VAT payable 3 855 2 019 – –
95 552 85 352 19 435 17 877Financial liabilities 91 697 83 333 19 435 17 877Non-financial liabilities 3 855 2 019 – –
22. OPERATING PROFIT INCLUDING EMPLOYEE EXPENSESOperating profit is stated after charging the following:Auditors’ remuneration 1 722 1 742 177 97– Audit fee 1 146 1 224 115 97– Audit fee – prior year extended audit scope 331 60 19 –– Non-audit related services 245 458 43 –– Total non-audit related services 932 – – –– Less: Non-audit services relating to the Tsogo transaction, capitalised (687) – – –Debt raising fee amortisation 4 072 5 111 2 416 2 581Debt cancellation fee – 250 – –Executive directors and employee remuneration (refer to note 31.4) 13 385 13 432 – –Management fee paid 136 158 1 106 1 283Non-executive directors’ remuneration (refer to note 31.4) 2 334 2 916 2 334 2 934Property and other expenses were incurred to generate rental income.Cost to income ratio
Total revenue (R’000) 474 553 434 112 275 492 248 075Total head office costs (R’000) 44 852 40 674 9 310 9 115Percentage of revenue (%) 9.45 9.37 3.38 3.67
Total revenue for the Group is defined as: Contractual rental income.
Total revenue for the Company is defined as: Mainly dividend received from HPF Properties Proprietary Limited.
The cost to income ratio has been disclosed in accordance with the accepted REIT Best Practice. This ratio is not directly comparable to other REITs as the property related expenditure is paid by the tenant.

HOSPITALITY PROPERTY FUND INTEGRATED ANNUAL REPORT 2016110
NOTES TO THE FINANCIAL STATEMENTS continuedfor the year ended 30 June 2016
GROUP COMPANY
2016R’000
2015R’000
2016R’000
2015R’000
23. FINANCE COST/INCOMEFinance income
Interest income 12 737 9 696 113 14Interest received from subsidiary and HPF Employee Incentive Trust – – 87 960 78 211
12 737 9 696 88 073 78 225Dividend income
Dividend income from subsidiary – – 275 492 248 075Finance costs
Interest-bearing liabilities 170 822 170 584 87 161 77 510Debenture discount amortisation (refer to note 18) 2 313 8 633 2 313 8 633
24. TAXATIONCurrent tax 9 116 – 16
9 116 – 16
Reconciliation of taxation rate
Current taxation rate 28.0% 28.0% 28.0% –Fair valuation of investment property (14.0%) (28.3%) – –Fair valuation of swaps (0.3%) (1.2%) – –Impairment of goodwill 0.7% 1.4% – –Reversal of/Impairment of loan – – 0.2% –Dividend (Qualifying distribution) (15.2%) – (28.6%) –Temporary differences 0.1% 0.2% – –Unrecognised assessed losses 0.7% – 0.4% –Effective taxation rate 0.0% 0.1% 0.0% –
The Company has no liability for normal taxation as all cash profits, excluding capital, is paid out as a dividend (qualifying distribution)/debenture interest and shareholders/linked unitholders are consequently subject to tax according to the individual linked unitholder’s tax status. However, a current tax expense of R9 000 (2015: R100 000) is payable by the HPF Employee Incentive Trust.

HOSPITALITY PROPERTY FUND INTEGRATED ANNUAL REPORT 2016 111
GROUP
Gross Net of tax Gross Net of tax
2016 2016 2015 2015
25. EARNINGS AND DIVIDEND/DISTRIBUTIONS PER SHARE/LINKED UNITProfit for the year 501 189 501 189 134 285 134 285Adjustments: Debenture interest – – 232 815 232 815Earnings 501 189 501 189 367 100 367 100Adjustments:Loss/(profit) on disposal of investment properties 13 556 13 556 (390) (390)Fair value – investment properties revaluation (251 024) (251 024) (143 734) (143 734)Fair value – straight-line rental income (225) (225) (825) (825)Impairment to furniture, fittings and equipment 265 265 – –Loss on disposal of furniture, fitting and equipment 7 7 – –Goodwill impairment 12 000 12 000 7 200 7 200Headline earnings 275 768 275 768 229 351 229 351HPF Employee Incentive Trust effects – – 78 78Fair value – interest rate swaps (6 163) (6 163) (6 172) (6 172)Taxation on HPF Employee Incentive Trust – – 100 100Impairment to furniture, fittings and equipment (265) (265) – –Loss on disposal of furniture, fitting and equipment (7) (7) – –Straight-line rental income 225 225 825 825Debenture discount amortisation 2 313 2 313 8 633 8 633Distributable earnings 271 871 271 871 232 815 232 815
Total dividend for the year (qualifying distribution) amounted to R271.9 million with the interim dividend of R133.7 million paid out during the year.

HOSPITALITY PROPERTY FUND INTEGRATED ANNUAL REPORT 2016112
NOTES TO THE FINANCIAL STATEMENTS continuedfor the year ended 30 June 2016
25. EARNINGS AND DIVIDEND/DISTRIBUTIONS PER SHARE/LINKED UNIT (continued)GROUP GROUP
2016 2015
A-shares B-shares Total A-units B-units Total
GroupNumber of shares/units (note 16 & 18) 144 285 503 133 995 396 278 280 899 144 285 503 142 315 793 286 601 296Weighted average number of shares/units 144 285 503 135 154 796 279 440 299 142 380 569 140 410 859 282 791 427
Cents Cents Cents Cents Cents Cents
Dividend per share/distribution per linked unit (cents)* 155.62 34.81 190.43 148.21 13.15 161.36Earnings and diluted earnings per share/linked unit# 179.35 179.35 358.71 129.81 129.81 259.62Headline earnings and diluted headline earnings per share/linked unit# 98.69 98.69 197.37 81.10 81.10 162.20Earnings and diluted earnings per no par value/linked unit# 179.35 179.35 358.70 47.49 47.49 94.98Headline earnings and diluted headline earnings per no par value/linked unit# 98.69 98.69 197.38 (0.01) (0.01) (0.02)
* Calculated based on the actual number of shares.# Calculated based on weighted average number of share.
GROUP COMPANY
NOTES TO THE STATEMENTS OF CASH FLOWS2016
R’0002015
R’0002016
R’0002015
R’000
26. CASH GENERATED FROM OPERATIONSProfit before taxation 503 247 142 831 268 822 529Adjusted for:Net finance income/(costs) 158 085 160 888 (912) (715)Net debenture interest – 232 815 – 232 815Depreciation and impairment 588 593 – –Straight-lining accrual of rental income 225 825 – –Goodwill impairment 12 000 7 200 – –Inter-company loan impairment reversal/(impairment raised) – – (1 728) 6 331Loss on disposal of furniture, fitting and equipment 7 – – –Loss/(profit) on disposal of investment properties 13 556 (390) – –Fair value adjustments (257 412) (150 731) – –Cash generated before working capital changes 430 296 394 031 266 182 238 960Changes in working capital 23 177 (15 513) 3 083 18 322Decrease/(increase) in trade and other receivables 14 000 (12 948) 1 525 2 099Increase in capital expenditure on properties held for trading (1 023) – – –Increase/(decrease) in trade and other payables 10 200 (2 565) 1 558 16 223
453 473 378 518 269 265 257 282
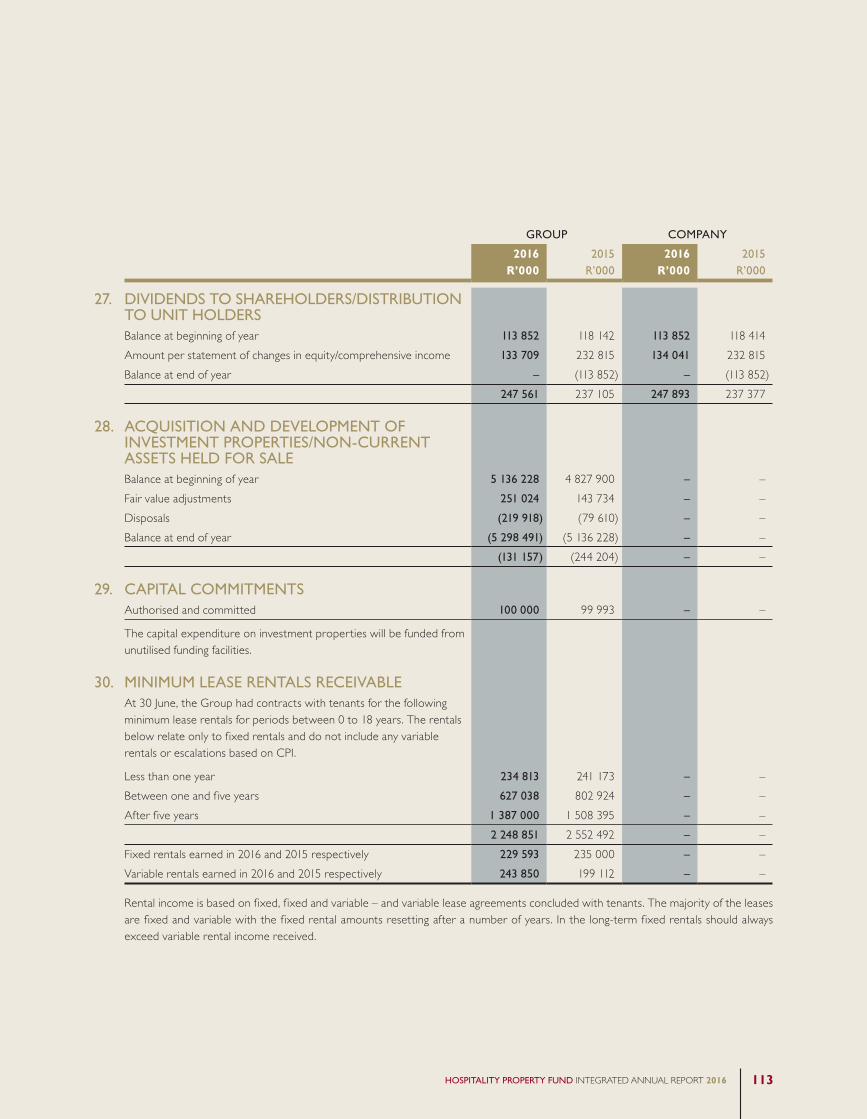
HOSPITALITY PROPERTY FUND INTEGRATED ANNUAL REPORT 2016 113
GROUP COMPANY
2016R’000
2015R’000
2016R’000
2015R’000
27. DIVIDENDS TO SHAREHOLDERS/DISTRIBUTION TO UNIT HOLDERSBalance at beginning of year 113 852 118 142 113 852 118 414Amount per statement of changes in equity/comprehensive income 133 709 232 815 134 041 232 815Balance at end of year – (113 852) – (113 852)
247 561 237 105 247 893 237 377
28. ACQUISITION AND DEVELOPMENT OF INVESTMENT PROPERTIES/NON-CURRENT ASSETS HELD FOR SALEBalance at beginning of year 5 136 228 4 827 900 – –Fair value adjustments 251 024 143 734 – –Disposals (219 918) (79 610) – –Balance at end of year (5 298 491) (5 136 228) – –
(131 157) (244 204) – –
29. CAPITAL COMMITMENTSAuthorised and committed 100 000 99 993 – –
The capital expenditure on investment properties will be funded from unutilised funding facilities.
30. MINIMUM LEASE RENTALS RECEIVABLEAt 30 June, the Group had contracts with tenants for the following minimum lease rentals for periods between 0 to 18 years. The rentals below relate only to fixed rentals and do not include any variable rentals or escalations based on CPI.
Less than one year 234 813 241 173 – –Between one and five years 627 038 802 924 – –After five years 1 387 000 1 508 395 – –
2 248 851 2 552 492 – –Fixed rentals earned in 2016 and 2015 respectively 229 593 235 000 – –Variable rentals earned in 2016 and 2015 respectively 243 850 199 112 – –
Rental income is based on fixed, fixed and variable – and variable lease agreements concluded with tenants. The majority of the leases are fixed and variable with the fixed rental amounts resetting after a number of years. In the long-term fixed rentals should always exceed variable rental income received.

HOSPITALITY PROPERTY FUND INTEGRATED ANNUAL REPORT 2016114
NOTES TO THE FINANCIAL STATEMENTS continuedfor the year ended 30 June 2016
31. RELATED PARTY TRANSACTIONS31.1 Identity of related parties
Identity of related parties Relationship
– HPF Properties Proprietary Limited 100% subsidiary– HPF Management Proprietary Limited 100% subsidiary– Hospitality Property Fund Managers
Proprietary Limited 100% subsidiary– NIB 35 Proprietary Limited 100% subsidiary– Hosbrook Ventures Proprietary Limited 100% subsidiary– HPF Employee Incentive Trust Key staff benefit structure– Directors as listed Directors– Vexicure Proprietary Limited (Associate) 80% subsidiary of Pan-African Capital Holdings Proprietary Limited, of which
Dr ZN Kubukeli is a director. HPF Properties Proprietary Limited owns a 5% shareholding in the Company. Mr R Erasmus, Mr L Meyer as well as Dr ZN Kubukeli are directors of the Company. The Company leases the Westin Cape Town hotel from the Group. The Company is accounted for as an associate entity.
– Ash Brook Investments 72 Proprietary Limited (Associate)
HPF Properties Proprietary Limited owns 15% of the Company, and both Mr L Meyer and Mr R Erasmus are directors of the Company. The Company is accounted for as an associate entity.
– HPF Employee Incentive Trust The HPF Employee Incentive Trust is a separate legal entity, which owns B-shares in Hospitality Property Fund Limited. Mr DG Bowden, Mr GA Nelson and Mr R Erasmus are trustees of the trust. The trust is considered a subsidiary for accounting purposes.
GROUP COMPANY
2016R’000
2015R’000
2016R’000
2015R’000
31.2 Transactions and balances
Associates
Vexicure Proprietary Limited
Rental received by Group 135 408 101 554 – –Trade and other receivables 129 – – –Trade and other payables 12 361 12 653 – –Tenant deposit and guarantee held as security on leases 3 301 3 074 – –Ash Brook Investments 72 Proprietary Limited
Rental received by Group 37 609 35 502 – –Trade and other receivables 18 009 16 141 – –Tenant deposit and guarantee held as security on leases 1 746 1 746 – –
Trade and other receivables are current in nature and are considered recoverable, trade and other payables are current in nature and will be repaid.

HOSPITALITY PROPERTY FUND INTEGRATED ANNUAL REPORT 2016 115
31. RELATED PARTY TRANSACTIONS (continued)GROUP COMPANY
2016R’000
2015R’000
2016R’000
2015R’000
31.2 Transactions and balances (continued)
Subsidiaries
HPF Properties Proprietary Limited
Non-interest-bearing long-term loan receivable – – 3 053 027 3 034 736Interest-bearing long-term receivable – – 987 850 986 268Interest received – – 87 161 77 514Dividend received – – 273 076 248 075HPF Management Proprietary Limited
Non-interest-bearing long-term loan receivable – – 7 11Management fees paid – – 1 106 1 283HPF Employee Incentive Trust
Interest-bearing long-term receivable – – 6 264 4 136Interest received – – 799 697Dividend/debenture interest paid – – 332 187
The long-term receivable represents the loan given to the Trust in order to acquire 1 969 710 B-shares in the Company. This receivable is interest-bearing and earns interest at prime less 2.5% per annum.
31.3 Mr AS Rogers
Identity of related parties Relationship
– Airvent Helderberg Proprietary Limited The Company’s former CEO, Mr AS Rogers’ brother is a significant shareholder.
GROUP COMPANY
2016R’000
2015R’000
2016R’000
2015R’000
Transactions
– Airvent Helderberg Proprietary Limited – 1 459 – –

HOSPITALITY PROPERTY FUND INTEGRATED ANNUAL REPORT 2016116
NOTES TO THE FINANCIAL STATEMENTS continuedfor the year ended 30 June 2016
31. RELATED PARTY TRANSACTIONS (continued)31.4 Directors’ remuneration
Group and Company – 30 June 2016
Directors’ fees
Consulting fees Total
R’000 R’000 R’000
Non-executive
DG Bowden 371 – 371
L de Beer 375 – 375
SA Halliday 341 – 341
ZN Kubukeli 323 – 323
GA Nelson 337 1 490 1 827
ZN Malinga 297 – 297
WC Ross 290 – 290
2 334 1 490 3 824
The consulting fees paid to Mr GA Nelson relate to his role of Acting CEO (before the appointment of Mr VM Joyner) and assistance with the Tsogo transaction.
Executive: All directors’ salaries and bonuses were borne by the Group.
SalariesBonuses –
F2016Leave
paid out TotalR’000 R’000 R’000 R’000
Mr R Asmal (Ex-Financial Director) 202 – 541 743
Mr VM Joyner (CEO) 2 148 2 700 – 4 848
Mr R Erasmus* (Acting CFO) 1 387 973 – 2 360
3 737 3 673 541 7 951
All the above directors’ emoluments are short-term employee benefits and there are no other employee benefits to the directors.
* Prescribed off icer.

HOSPITALITY PROPERTY FUND INTEGRATED ANNUAL REPORT 2016 117
31. RELATED PARTY TRANSACTIONS (continued)31.4 Directors’ remuneration (continued)
Group and Company – 30 June 2015
Directors’ fees
Consulting fees* Total
R’000 R’000 R’000
Non-executive
DG Bowden 324 333 657KH Abdul-Karrim 160 – 160L de Beer 341 105 446SA Halliday 330 18 348ZN Kubukeli 304 – 304GA Nelson 272 – 272ZN Malinga 280 – 280WC Ross 273 – 273A Soni 176 – 176
2 460 456 2 916
Executive: All directors’ salaries and bonuses were borne by the Group.
SalariesBonuses paid –
F2015Leave
paid out Total
R’000 R’000 R’000 R’000
R Asmal (Financial Director) 1 852 294 – 2 146AS Rogers (CEO) 2 510 – 296 2 806
4 362 294 296 4 952
All the above directors’ emoluments are short-term employee benefits and there are no other employee benefits to the directors.
Except for the executive directors, the Company had no prescribed officers in the 2015 financial year.
32. FINANCIAL RISK MANAGEMENT AND FURTHER FINANCIAL INSTRUMENT DISCLOSURESFinancial instruments consist mainly of deposits with banks, loans to the subsidiary companies, trade and other receivables, loans from banks, debentures, debenture interest payable, trade and other payables and interest rate swaps. Exposure to interest rate, liquidity and credit risks arises in the normal course of business.
Treasury policy
The Group enters into derivative transactions such as interest rate swaps in order to help manage the financial risks arising from the Group’s activities as required by debt providers. The main risks arising from the entity’s financing structure are market risk (in the form of interest rate risk) and liquidity risk. The policies for managing each of these risks and the principal effect of these policies on the results for the year are summarised below.
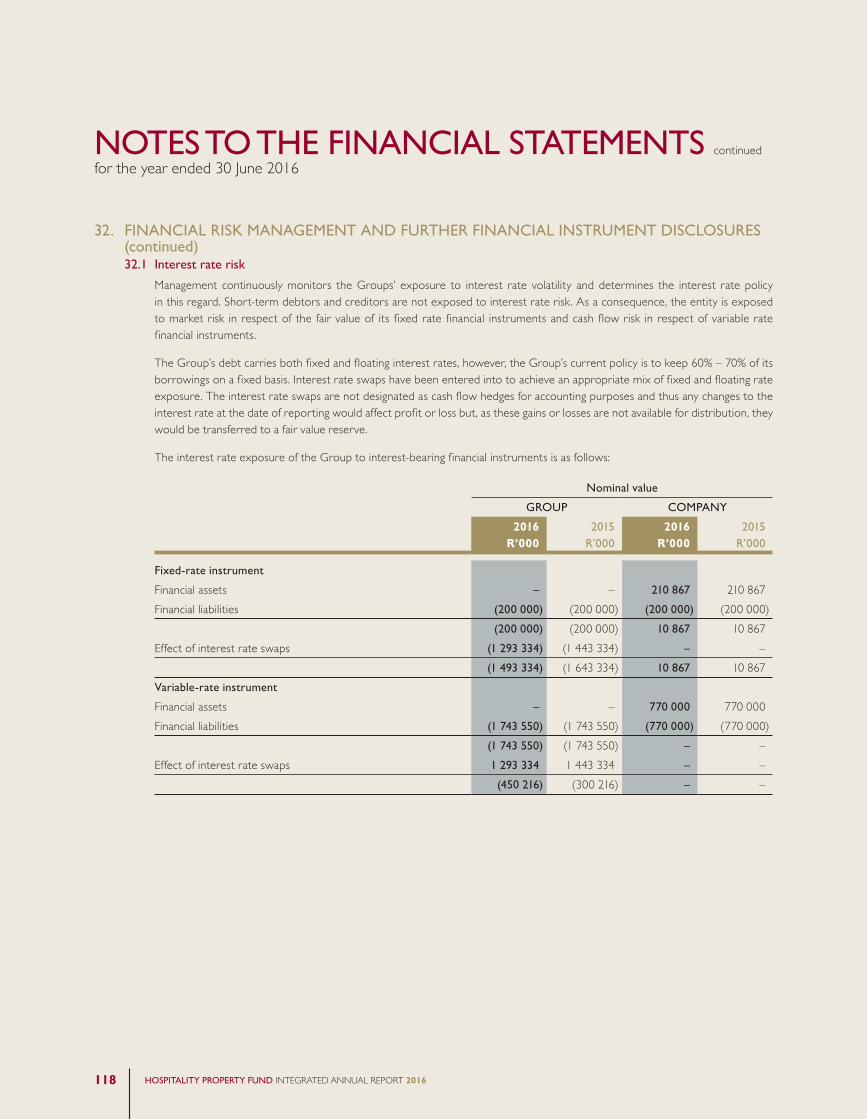
HOSPITALITY PROPERTY FUND INTEGRATED ANNUAL REPORT 2016118
NOTES TO THE FINANCIAL STATEMENTS continuedfor the year ended 30 June 2016
32. FINANCIAL RISK MANAGEMENT AND FURTHER FINANCIAL INSTRUMENT DISCLOSURES (continued)32.1 Interest rate risk
Management continuously monitors the Groups’ exposure to interest rate volatility and determines the interest rate policy in this regard. Short-term debtors and creditors are not exposed to interest rate risk. As a consequence, the entity is exposed to market risk in respect of the fair value of its fixed rate financial instruments and cash flow risk in respect of variable rate financial instruments.
The Group’s debt carries both fixed and floating interest rates, however, the Group’s current policy is to keep 60% – 70% of its borrowings on a fixed basis. Interest rate swaps have been entered into to achieve an appropriate mix of fixed and floating rate exposure. The interest rate swaps are not designated as cash flow hedges for accounting purposes and thus any changes to the interest rate at the date of reporting would affect profit or loss but, as these gains or losses are not available for distribution, they would be transferred to a fair value reserve.
The interest rate exposure of the Group to interest-bearing financial instruments is as follows:
Nominal value
GROUP COMPANY
2016R’000
2015R’000
2016R’000
2015R’000
Fixed-rate instrument
Financial assets – – 210 867 210 867Financial liabilities (200 000) (200 000) (200 000) (200 000)
(200 000) (200 000) 10 867 10 867Effect of interest rate swaps (1 293 334) (1 443 334) – –
(1 493 334) (1 643 334) 10 867 10 867Variable-rate instrument
Financial assets – – 770 000 770 000Financial liabilities (1 743 550) (1 743 550) (770 000) (770 000)
(1 743 550) (1 743 550) – –Effect of interest rate swaps 1 293 334 1 443 334 – –
(450 216) (300 216) – –

HOSPITALITY PROPERTY FUND INTEGRATED ANNUAL REPORT 2016 119
32. FINANCIAL RISK MANAGEMENT AND FURTHER FINANCIAL INSTRUMENT DISCLOSURES (continued)32.1 Interest rate risk (continued)
At the reporting date, the following interest rate swap agreements were in place:
Nominal rateCommence-
ment date Maturity
Nominal value
Fair value at 30 June
2016Fair value at
30 June 2015
R’000 R’000 R’000
Nedbank Limited – Swap 1.1 6.00 – 9.09% Dec 2013 Sep 2016 150 000 – (83)Nedbank Limited – Swap 2 6.40% Oct 2013 Oct 2016 150 000 699 458Nedbank Limited – Swap 3 7.05% Sep 2014 Sep 2017 100 000 528 (180)Rand Merchant Bank – Swap 1 7.96% Jun 2014 Jul 2016 346 667 (113) (5 114)Rand Merchant Bank – Swap 2 6.65% – 9.20% Feb 2014 Feb 2016 – – (695)Rand Merchant Bank – Swap 3 7.05% Sep 2014 Sep 2017 100 000 534 (176)Rand Merchant Bank – Swap 4 6.78% Jul 2016 Feb 2018 346 667 3 899 3 697Rand Merchant Bank – Swap 5 7.88% Feb 2016 Feb 2019 250 000 (1 477) –
Negative value denotes that swap is in the bank’s favour.
Derivative asset/liability at fair value
Non-current Current
Fair value at 30 June
2016 Non-current CurrentFair value at
30 June 2015
Group R’000 R’000 R’000 R’000 R’000 R’000
Derivative asset 4 961 699 5 660 4 155 – 4 155Derivative liability 1 477 113 1 590 6 248 – 6 248
Group2016
R’0002015
R’000
Sensitivity analysis
Fair value sensitivity on prof it or loss and equity
– 0.50% change in interest rate 6 065 7 438– 1.00% change in interest rate 11 955 13 556– 1.50% change in interest rate 17 765 20 192
Cash f low sensitivity on prof it or loss and equity
– 0.50% change in interest rate 7 867 7 217– 1.00% change in interest rate 15 733 14 433– 1.50% change in interest rate 23 600 21 650
The sensitivity analysis is based on the contractual terms of the derivatives and the estimated movement in JIBAR rates.
HOSPITALITY PROPERTY FUND INTEGRATED ANNUAL REPORT 2016120
NOTES TO THE FINANCIAL STATEMENTS continuedfor the year ended 30 June 2016
32. FINANCIAL RISK MANAGEMENT AND FURTHER FINANCIAL INSTRUMENT DISCLOSURES (continued)32.2 Liquidity risk
Liquidity risk is the risk that the Group will be unable to meet a financial commitment as it falls due. Cash flows are regularly monitored to ensure that cash resources are adequate to meet funding commitments. The Group’s policy is to seek to optimise its exposure to liquidity risk by balancing its exposure to interest rate risk and to refinancing risk. In effect, the entity seeks to borrow for as long as possible at the lowest acceptable cost.
The Group regularly reviews the maturity profile of its financial liabilities and seeks to avoid a concentration of maturities through the regular replacement of facilities and by using a selection of maturity dates. Refinancing risk may be reduced by reborrowing prior to the contracted maturity date, effectively switching liquidity risk for market risk.
The Company’s current liabilities exceed the current assets. However, the Group will ensure that all short-term liabilities are settled as and when they arise.
The following are the contractual maturities of financial liabilities including finance costs. All financial liabilities, with the exception of derivative liabilities measured at fair value, are measured and carried at amortised cost.
Carrying amount
Zero to12 months
Two to five years
More than five years
R’000 R’000 R’000 R’000
Group 30 June 2016
Interest-bearing liabilities 2 108 178 775 165 1 333 013 –
Derivative liability 10 730 4 811 5 919 –
Trade and other payables 95 552 95 552 – –
2 214 460 875 528 1 338 932 –
Group 30 June 2015
Interest-bearing liabilities 2 296 994 384 655 1 912 339 –Derivative liability 21 376 15 175 6 201 –Trade and other payables 85 352 85 352 – –Debentures 2 415 842 – – 2 415 842Debenture interest payable 113 852 113 852 – –
4 933 416 599 034 1 918 540 2 415 842

HOSPITALITY PROPERTY FUND INTEGRATED ANNUAL REPORT 2016 121
32. FINANCIAL RISK MANAGEMENT AND FURTHER FINANCIAL INSTRUMENT DISCLOSURES (continued)32.2 Liquidity risk (continued)
Carrying amount
Zero to12 months
Two tofive years
More than five years
R’000 R’000 R’000 R’000
Company 30 June 2016
Trade and other payables 19 435 19 435 – –
Interest-bearing liabilities 1 103 773 674 623 429 150 –
1 123 208 694 058 429 150 –
Company 30 June 2015
Trade and other payables 17 877 17 877 – –Debentures 2 425 837 – – 2 425 837Interest-bearing liabilities 970 000 230 000 740 000 –Debenture interest payable 113 852 113 852 – –
3 527 566 361 729 740 000 2 425 837
It is not expected that the cash flows from the above instruments would occur significantly earlier than presented.
The Company’s borrowings are limited by its Memorandum of Incorporation and in terms of JSE Listings Requirements to 60% of the directors’ bona f ide valuation of the consolidated property portfolio.
The Company’s utilised borrowing capacity at 30 June can be summarised as follows:
30 June 2016 30 June 2015
R’000 R’000
Property valuation 5 298 492 5 136 22860% thereof 3 179 095 3 081 737Effective borrowings 1 725 063 1 857 874Unutilised borrowing capacity 1 454 032 1 223 863Facilities available in terms of agreements at 30 June 2 043 550 1 943 550Undrawn facilities 318 487 85 676Gearing ratio 32.6% 36.2%
32.3 Credit risk
Credit risk arises from the risk that trade receivables may default and result in a loss to the entity. The entity has adopted a policy of only dealing with creditworthy counterparties and obtaining sufficient collateral (in the form of cash deposits and bank guarantees), where appropriate, as a means of mitigating the risk of financial loss from default. Financial performance of the tenants’ business is monitored on an ongoing basis.

HOSPITALITY PROPERTY FUND INTEGRATED ANNUAL REPORT 2016122
NOTES TO THE FINANCIAL STATEMENTS continuedfor the year ended 30 June 2016
32. FINANCIAL RISK MANAGEMENT AND FURTHER FINANCIAL INSTRUMENT DISCLOSURES (continued)32.3 Credit risk (continued)
Receivable
Properties Income % R’000
Concentration risk– Tenant 1 1 29% 129– Tenant 2 5 19% 581– Tenant 3 2 16% 980– Tenant 4 3 13% 133– Tenant 5 1 12% –– Balance 3 11% –
15 100% 1 823
In terms of the entity structure, there is a concentration risk in terms of the revenues earned and the resultant receivables. 41% of revenues earned for the current year was generated from two leased properties. Management receives comprehensive monthly management reports and attends the monthly meeting with the hotel operators in order to monitor performance and identify elements of credit risk.
32.3.1 CREDIT EXPOSURE
The carrying amount of financial assets represents the maximum credit exposure. The maximum exposure to credit risk at the reporting date was:
GROUP COMPANY
2016R’000
2015R’000
2016R’000
2015R’000
Trade and other receivables– Tenant and related receivables 56 105 70 577 – –
56 105 70 577 – –Tenant deposits 20 518 4 948 – –Bank guarantees 17 836 18 890 – –
The Group holds deposits over certain trade and other receivables in the form of cash tenant deposits and bank guarantees as indicated above.
The directors are of the opinion that the financial assets have a low credit risk.
HOSPITALITY PROPERTY FUND INTEGRATED ANNUAL REPORT 2016 123
32. FINANCIAL RISK MANAGEMENT AND FURTHER FINANCIAL INSTRUMENT DISCLOSURES (continued)32.3 Credit risk (continued)
32.3.2 IMPAIRMENT LOSSES
The ageing of tenant and related receivables at the reporting date was:
GROUP
Gross carrying amount Impairment
2016R’000
2015R’000
2016R’000
2015R’000
Current (< 30 days) 56 019 65 215 – –Past due but not yet impaired (> 30 days) 85 1 371 – –Past due but not yet impaired (> 60 days) 1 3 991 – –Total 56 105 70 577 – –
Tenant and related receivables as noted above are continuously assessed for impairment. There is no current indication of any default by any of the receivables at year-end.
The Group comprehensively assesses the individual circumstances and credit risk of each tenant and receivable and an impairment loss is recognised after the assessment indicates that recoverability is unlikely.
Management has assessed the credit quality of tenants and related receivables as being of low risk.
32.4 Capital structure
In prior years, the entity viewed its capital base as the sum of its shares and debentures as each share was linked to a debenture. During the current year both, par-value shares and debentures converted into no par value shares as disclosed under note 16. The entity seeks to enhance shareholder value by both investing in the business so as to improve the return on investment and by managing the capital structure. The entity uses a mix of equity and debt financial instruments and aims to access both debt and equity capital markets with maximum efficiency and flexibility. The key ratios used to monitor the capital structure are the debt to assets ratio (in the prior year this ratio excluded debentures) and the interest coverage ratio. Notwithstanding the fact that the entity’s total liabilities are limited by the JSE Limited Listings requirements for REITs at 60% of total assets, the current strategy is to maintain debt levels below 40% of the total investment properties portfolio as per the current loan agreements in place.
GROUP COMPANY
2016R’000
2015R’000
2016R’000
2015R’000
Stated capital 2 909 957 – 2 919 952 –Share capital and share premium – 515 931 – 515 931Debentures – 2 415 842 – 2 425 837Total capital 2 909 957 2 931 773 2 919 952 2 941 768Total interest-bearing liabilities 1 725 063 1 857 874 970 000 970 000
The above capital and interest-bearing liabilities are employed to acquire investment properties for the Group.

HOSPITALITY PROPERTY FUND INTEGRATED ANNUAL REPORT 2016124
NOTES TO THE FINANCIAL STATEMENTS continuedfor the year ended 30 June 2016
32. FINANCIAL RISK MANAGEMENT AND FURTHER FINANCIAL INSTRUMENT DISCLOSURES (continued)32.5 Carryingamountsandfairvaluesoffinancialinstruments
Derivative financial
asset
Derivative financial liability
Loans and receivables
Financial liabilities at
amortised cost
R’000 R’000 R’000 R’000
Group 2016Financial asset
Derivative asset 5 660 – – –
Trade and other receivables – – 57 035 –
Cash and cash equivalents – – 194 260 –
Financial liabilities
Derivative liability – 1 590 – –
Trade and other payables – – – 95 552
Interest-bearing liabilities – – – 1 725 063
Group 2015Financial asset
Derivative asset 4 155 – – –Trade and other receivables – – 71 035 –Cash and cash equivalents – – 204 150 –Financial liabilities
Derivative liability – 6 248 – –Trade and other payables – – – 85 352Interest-bearing liabilities – – – 1 857 874Debentures – – – 2 415 842
Company 2016Financial asset
Loan to subsidiaries – – 4 047 148 –
Trade and other receivables – – 2 095 –
Cash and cash equivalents – – 2 049 –
Financial liabilities
Trade and other payables – – – 19 435
Interest-bearing liabilities – – – 970 000
Company 2015Financial asset
Loan to subsidiaries – – 4 025 151 –Trade and other receivables – – 3 620 –Cash and cash equivalents – – 34 –Financial liabilities
Trade and other payables – – – 17 877Interest-bearing liabilities – – – 970 000Debentures – – – 2 425 837
HOSPITALITY PROPERTY FUND INTEGRATED ANNUAL REPORT 2016 125
32. FINANCIAL RISK MANAGEMENT AND FURTHER FINANCIAL INSTRUMENT DISCLOSURES (continued)32.5 Carryingamountsandfairvaluesoffinancialinstruments(continued)
The carrying amounts of trade and other receivables; cash and cash equivalents and trade and other payables reflected in the statement of financial position approximates the fair value.
The following summarises the significant methods and assumptions used in estimating the fair value of financial instruments. Where applicable, the fair values of financial assets and liabilities have been established using the market value, where available. For those instruments without a market value, a discounted cash flow approach is used.
Debentures
Linked debentures were converted into no par value shares in terms of a scheme of arrangement as disclosed under the note on share capital. In the prior year the linked debentures were carried at amortised cost, as it was impractical to determine the fair value of the linked debentures.
Derivatives
The fair value of interest rate swaps is based on broker quotes. Those quotes are tested for reasonableness by discounting estimated future cash flows based on the terms and maturity of each contract and using market interest rates for a similar instrument at the reporting date.
Non-derivative financial liabilities
Fair value is calculated based on the present value of future principal and interest cash flows, discounted at the market rate of interest at the reporting date.
Trade and other payables
The carrying amount of trade and other payables reasonably approximates its fair value due to their short-term nature.
Trade and other receivables
The carrying amount of trade and other receivables reasonably approximates its fair value due to their short-term nature.
Fair value hierarchy
The table below analyses financial instruments carried at fair value, by valuation method. The different levels have been defined as follows:
Level 1 Level 2 Level 3 Total
R’000 R’000 R’000 R’000
30 June 2016
Derivative financial assets – 5 660 – 5 660
Derivative financial liabilities – 1 590 – 1 590
30 June 2015
Derivative financial assets – 4 155 – 4 155Derivative financial liabilities – 6 248 – 6 248
There were no defaults on loans payable by Group and Company during the year.

HOSPITALITY PROPERTY FUND INTEGRATED ANNUAL REPORT 2016126
NOTES TO THE FINANCIAL STATEMENTS continuedfor the year ended 30 June 2016
33. SHARE-BASED PAYMENT ARRANGEMENTSOn 30 May 2013, a “Trust” named the HPF Employee Incentive Trust was established. It is imperative for the continued success of the Fund that its employees and those of its subsidiaries remain in their employment. Accordingly, the Fund implemented a long-term incentive scheme with the main purpose and intention of retaining these employees by providing them with an opportunity to share in the benefits of the equity of the Fund and the related distributions. The Trust is registered and considered a separate legal entity.
The Fund has three representatives on the board of Trustees, who in turn receive no remuneration for their services.
The Trustees’ responsibility and decision-making is dictated by the “Deed of Trust”, which includes the allocation of the shares acquired in the Fund to specific staff members.
Under the accounting standard IFRS 10: Consolidations, the Group has control over the Trust due to the design and purpose and the trustees of the Trust are directors/principal officers of the Company and therefore the Trust is consolidated as part of the consolidated financial statements.
Mechanics of the Trust
The Fund provides a loan to the Trust at the minimum official rate of interest under section 7 of the Income Tax Act, 58 of 1962. The proceeds of the loan were utilised to acquire a number of B-linked units in the Fund at the relevant market price on the JSE Limited. After acquisition of the B-linked units by the Trust, the Allocation Committee instructed the Trustees to create new Trust Units, such that the number of Trust Units were equal to the number of the B-linked units held by the Trust, and confirmed to the Trustees in writing the number of the Trust Units to be created that are available for allocation to qualifying employees in accordance with the terms of the Trust Deed. The Trust Units and accordingly the rights, were allocated to the qualifying employees in terms of this Trust Deed for no monetary consideration.
Key staff were identified and allocated a portion of the units acquired. In order to have qualified for the receipt of this benefit, the staff member had to be in the employment of the Fund for a set period when the benefit will be settled as agreed with the employees. The loan advanced by the Fund, bears interest at Prime less 2.5% (which is the same rate as the minimum rate under section 7 of the Income Tax Act, 58 of 1962) on the loan amount outstanding. Distributions received by the Trust from the Fund are used to settle the interest that the loan bears, as well as the capital portion of the loan where possible. On settlement of the benefit to the staff, the B-linked units will be sold back to the market at the ruling market price, with any outstanding loan amounts and interest being settled first before receiving the balance of the cash amounts, if any.
The share-based payment “scheme” is considered a share appreciate rights (SARs) cash-settled scheme based on the appreciation of the B-linked unit.
Trustees Position in Fund
Mr DG Bowden Chairman of the Board of DirectorsMr R Erasmus Acting Chief Financial OfficerMr GA Nelson Non-executive directorMr R Asmal Resigned – 12 August 2015
Tranche 1
In the 2013, a loan of R10 million was advanced to the Trust by the Fund in order to facilitate the acquisition of 1 969 710 B-linked units at an average price of R5.07.

HOSPITALITY PROPERTY FUND INTEGRATED ANNUAL REPORT 2016 127
33. SHARE-BASED PAYMENT ARRANGEMENTS (continued)Terms
• Interest rate: Prime less 2.5% (reflective of the official rate as determined by the South African Revenue Services)• Initial loan amount: R10 million• Vesting period: Three years with settlement on or after 30 September 2016, 2017 and 2018 in three equal instalments• Grant date: 29 November 2013• Grant date value: R5.50 per B-linked unit
The SARs have been measured using the ruling market price at measurement date, which is considered the fair value.
2016 2015
Value of the Share Appreciation Rights
Fair value 3.18 2.10Grant date value: 5.50 5.50Total (2.32) (3.40)
Total B-shares/linked units (partly allocated): 1 969 710 1 969 710Total liability recognised to staff: – –
As no appreciation between grant date and measurement date occurred, no expense and liability was recognised at 30 June 2016.
Units Value of SAR
Allocation of SARs at 30 June 2016
– Staff members 744 549 –
– Unallocated 1 225 161 –
1 969 710 –
Allocation of SARs at 30 June 2015
– Mr R Asmal 395 913 –– Mr AS Rogers 1 026 217 –– Unallocated 547 580 –
1 969 710 –
On 22 June 2015, Mr AS Rogers was dismissed as an employee of HPF Management Proprietary Limited. As a result, all Share Appreciation Rights to Mr AS Rogers were forfeited.
On 12 August 2016, Mr R Asmal resigned from his position as Chief Financial Officer. As a result, all Share Appreciation Rights to Mr R Asmal were forfeited.
HOSPITALITY PROPERTY FUND INTEGRATED ANNUAL REPORT 2016128
NOTES TO THE FINANCIAL STATEMENTS continuedfor the year ended 30 June 2016
33. SHARE-BASED PAYMENT ARRANGEMENTS (continued)33.1 Loan to HPF Share Incentive Trust
2016R’000
2015R’000
– Opening balance 4 136 8 714– Reversal of impairment/(impairment raised) 1 728 (6 331)– Movement in loan 400 1 753– Closing balance 6 264 4 136– Fair value of the loan to the Trust 6 264 4 136
The value of the B-shares held is used to assess the recoverability of the loan granted to the Trust. The B-share closed at R3.18 on 30 June 2016 (2015: R2.10), which resulted in the reversal of a portion of the impairment recognised in the prior financial year on the loan to the Trust of R6.1 million. The reversal amounted to R1.7 million.
34. GOING CONCERNThe directors have made an assessment of the Group’s and Company’s ability to continue as going concerns and there is no reason to believe that the businesses will not be going concerns during the year ahead.
Total facilities expiring in the next 12 months, amounts to R600 million. As a result, the current liabilities exceed the current assets by R315.7 million for the Group and R639.4 million for the Company. The Fund is currently engaging with financial institutions and potential investors to refinance or issue notes to the total value of R600 million and is confident that it will successfully obtain the requisite funding. This will result in the current assets exceeding the current liabilities accordingly.
35. SUBSEQUENT EVENTSAs announced on SENS on 11 August 2016, the Competition Tribunal has given its approval for the Tsogo Transaction, subject to outstanding administrative conditions. A merger clearance certificate has been issued. The Fund anticipates that the remaining conditions precedent to the Tsogo Transaction will be fulfilled by 31 August 2016, such that the effective date of the Tsogo Transaction will be 1 September 2016.
The Board is not aware of any other matter or circumstances arising since the end of the financial year to the date of this report, not otherwise dealt with in this report or in the Group and Company financial statements that would significantly affect the operations, the results and the financial position of the Group and Company.
36. PROVISION FOR SHAREHOLDER REDEMPTIONOn 21 August 2015, the Fund received a demand from a shareholder in terms of section 164(11) of the Companies Act 2008, to pay an amount equal to the fair value of 8 320 397 B-shares. The Fund offered to pay the shareholder an amount of R2.90 per share, totalling to R24.1 million. The 8 320 397 B-shares lost its voting and economic rights and are now considered to be shares held in treasury. The shareholder did not accept the offer it received and have approached the legal courts to determine what it perceives as the fair value of the shares in question and the amount that should be paid. As it is not possible to determine what the outcome of a court ruling would be, the Fund only recognised the offer it made to the shareholder as a liability and is confident that a positive ruling would be received.
GROUP AND COMPANY
2016R’000
2015R’000
Balance at beginning of year – –Additions: 8 320 397 B-shares at R2.90 per share 24 129 –Carrying amount at year-end 24 129 –

HOSPITALITY PROPERTY FUND INTEGRATED ANNUAL REPORT 2016 129
37. OPERATING SEGMENTSThe Group has three reportable segments, as described below. These segments offer different types of lease agreements and are managed separately to enable the Fund to adequately monitor the various risk profiles. For each of these products, the Group’s CEO and Management Committee reviews internal management reports on a monthly basis. The following summary describes each of the Group’s reportable segments:• Traditional portfolio – Properties to which revenue is generated predominately from rooms occupation• Conference portfolio – Properties that are food, beverage and conference revenue based• Head office – Represents all the costs at Fund level and is reviewed separately from the property portfolio
Information regarding the results of each reportable segment is included below. Performance is measured based on operating profit before finance costs, as included in the internal management reports that are reviewed by the Group’s CEO. Segment profit is used to measure performance as management believes that such information is the most relevant in evaluating the results of certain segments relative to other entities that operate within these industries. Inter-segment pricing is determined on an arm’s length basis. Segment profit includes actual rental cash flows and does not include straight-lining of leases adjustments, nor does it include any fair value adjustments. Inter-segments pricing is determined on an arm’s length basis. Unallocated items comprise mainly investments (other than investment properties) and related revenue, loans, debentures, deferred tax, income tax assets or liabilities, borrowings and related expenses.
Segment capital expenditure is the total cost incurred during the period to acquire, refurbish and upgrade investment properties.
R’000Traditional
portfolioConference
portfolio Head office
Total consolidated
position
Statement of comprehensive income – 30 June 2016
Segment revenue 412 261 62 292 – 474 553
Expenditure – – (44 852) (44 852)
Segment profit/(loss) 412 261 62 292 (44 852) 429 701
Statement of comprehensive income – 30 June 2015
Segment revenue 370 416 63 585 111 434 112Expenditure – – (40 674) (40 674)Segment profit/(loss) 370 416 63 585 (40 563) 393 438
Statementoffinancialposition–30June2016
Non-current assets
Investment properties 4 407 509 761 491 – 5 169 000
Current assets
Non-current assets held for sale 41 000 88 491 – 129 491
Trade receivables 56 116 – 919 57 035
Segment assets 4 504 625 849 982 919 5 355 526
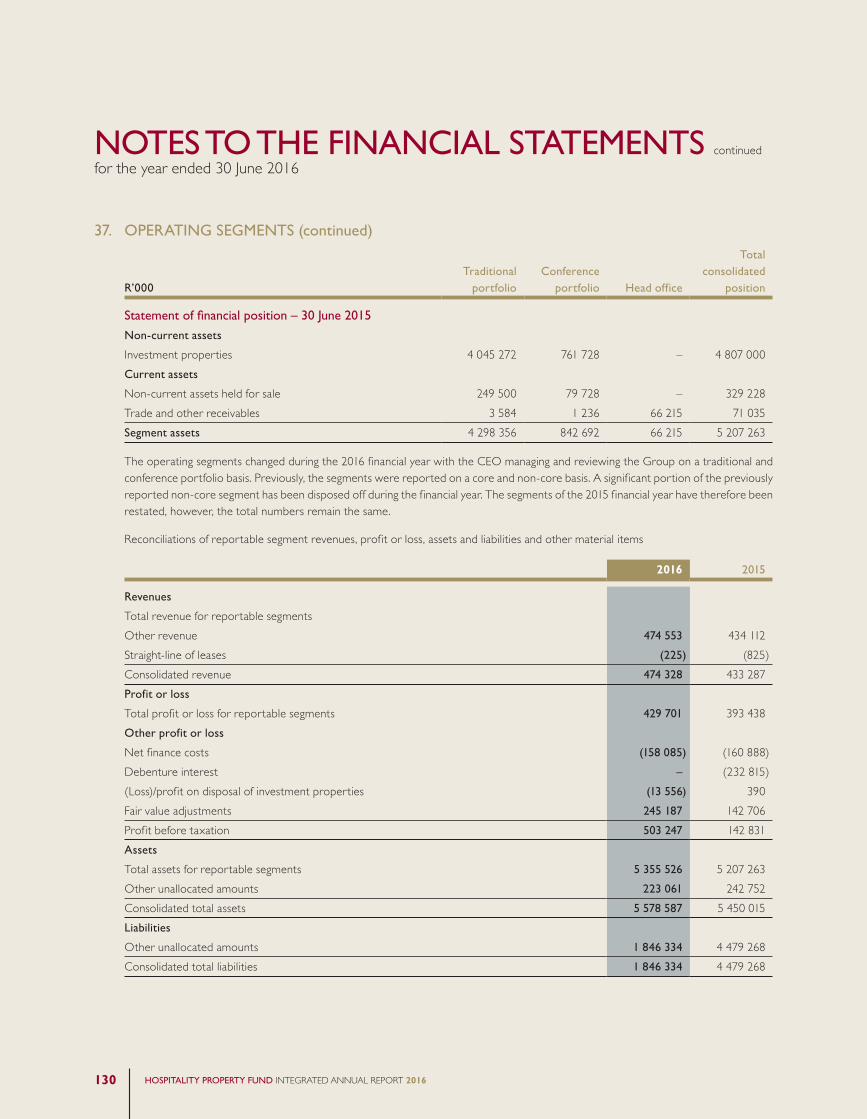
HOSPITALITY PROPERTY FUND INTEGRATED ANNUAL REPORT 2016130
NOTES TO THE FINANCIAL STATEMENTS continuedfor the year ended 30 June 2016
37. OPERATING SEGMENTS (continued)
R’000Traditional
portfolioConference
portfolio Head office
Total consolidated
position
Statementoffinancialposition–30June2015
Non-current assets
Investment properties 4 045 272 761 728 – 4 807 000Current assets
Non-current assets held for sale 249 500 79 728 – 329 228Trade and other receivables 3 584 1 236 66 215 71 035Segment assets 4 298 356 842 692 66 215 5 207 263
The operating segments changed during the 2016 financial year with the CEO managing and reviewing the Group on a traditional and conference portfolio basis. Previously, the segments were reported on a core and non-core basis. A significant portion of the previously reported non-core segment has been disposed off during the financial year. The segments of the 2015 financial year have therefore been restated, however, the total numbers remain the same.
Reconciliations of reportable segment revenues, profit or loss, assets and liabilities and other material items
2016 2015
Revenues
Total revenue for reportable segmentsOther revenue 474 553 434 112Straight-line of leases (225) (825)Consolidated revenue 474 328 433 287Profit or loss
Total profit or loss for reportable segments 429 701 393 438Other profit or loss
Net finance costs (158 085) (160 888)Debenture interest – (232 815)(Loss)/profit on disposal of investment properties (13 556) 390Fair value adjustments 245 187 142 706Profit before taxation 503 247 142 831Assets
Total assets for reportable segments 5 355 526 5 207 263Other unallocated amounts 223 061 242 752Consolidated total assets 5 578 587 5 450 015Liabilities
Other unallocated amounts 1 846 334 4 479 268Consolidated total liabilities 1 846 334 4 479 268
HOSPITALITY PROPERTY FUND INTEGRATED ANNUAL REPORT 2016 131
37. OPERATING SEGMENTS (continued)Geographical segments
None of the operating segments identified operate outside the borders of South Africa and therefore all revenues from external customers are attributable to the Group’s country of domicile and all non-current assets are located in the Group’s country of domicile, ie South Africa.
Major customer
Revenues from one customer of the Group, which is reported under the traditional portfolio, represents approximately R135.4 million (2015: R101.6 million) of the Group’s total revenues.
38. PROPERTY PORTFOLIO INFORMATION38.1 Property segment
Gross rental income Number of rooms*
Traditional properties 86% 79%Conference properties 14% 21%
100% 100%
* Indicates number of rooms at 30 June 2016 and does not account for pro rata ownership where HPF owns less than 100% of a specif ic hotel.
38.2 Geographicprofile
Gross rental income Number of rooms*
Gauteng 36% 45%KwaZulu-Natal 11% 18%Western Cape 48% 28%Eastern Cape 3% 5%Mpumalanga 2% 4%
100% 100%
* Indicates number of rooms at 30 June 2016 and does not account for pro rata ownership where HPF owns less than 100% of a specif ic hotel.
38.3 Vacancy
The Group had no vacant space at year-end.
38.4 Tenantprofile
Gross rental income Number of rooms*
Hotels with management companies that have national representation 82% 80%Independent hotel management companies 18% 20%
100% 100%
* Indicates number of rooms at 30 June 2016 and does not account for pro rata ownership where HPF owns less than 100% of a specif ic hotel.

HOSPITALITY PROPERTY FUND INTEGRATED ANNUAL REPORT 2016132
NOTES TO THE FINANCIAL STATEMENTS continuedfor the year ended 30 June 2016
38. PROPERTY PORTFOLIO INFORMATION (continued)38.5 Leaseexpiryprofile
Gross rental income Number of rooms*
One year 0% 0%Two to five years 51% 71%After five years 49% 29%
100% 100%
* Indicates number of rooms at 30 June 2016 and does not account for pro rata ownership where HPF owns less than 100% of a specif ic hotel.
38.6 By lease type
Gross rental income Number of rooms*
Fixed leases 6% 4%Fixed and variable leases 94% 96%
100% 100%
* Indicates number of rooms at 30 June 2016 and does not account for pro rata ownership where HPF owns less than 100% of a specif ic hotel.
38.7 Property grading
Gross rental income Number of rooms*
Luxury 52% 28%Midscale 29% 33%Economy 19% 39%
100% 100%
* Indicates number of rooms at 30 June 2016 and does not account for pro rata ownership where HPF owns less than 100% of a specif ic hotel.
38.8 Average property yield
2016* 9.2%2015** 9.0%
* The 2016 average property yield is determined as follows: F2016 year rental income/Investment properties 2015 value.
** The 2015 average property yield is determined as follows: F2015 rental income/Investment properties 2014 value.

HOSPITALITY PROPERTY FUND INTEGRATED ANNUAL REPORT 2016 133
SHAREHOLDERS’ ANALYSISAnalysis of A-shareholders as at 30 June 2016
SHAREHOLDER SPREADNumber of
shareholdings% of total
shareholdingsNumber of
Shares% of
issued capital
1 – 1 000 130 20.31 48 531 0.031 001 – 10 000 196 30.63 775 035 0.5410 001 – 100 000 173 27.03 6 654 692 4.61100 001 – 1 000 000 111 17.34 37 525 915 26.01Over 1 000 000 30 4.69 99 281 330 68.81Total 640 100.00 144 285 503 100.00
Number ofshareholdings
% of totalshareholdings
Number ofShares
% ofissued capital
Distribution of shareholders
Assurance companies 14 2.19 10 768 072 7.46Close corporations 12 1.88 310 747 0.22Collective investment schemes 102 15.94 93 302 019 64.66Custodians 10 1.56 947 694 0.66Foundations and charitable funds 12 1.88 2 242 749 1.55Hedge funds 4 0.63 3 420 640 2.37Insurance companies 6 0.94 1 300 196 0.90Investment partnerships 2 0.31 2 246 0.00Managed funds 16 2.50 686 959 0.48Medical aid funds 15 2.34 2 615 189 1.81Organs of state 2 0.31 2 588 987 1.79Private companies 20 3.13 380 632 0.26Public companies 2 0.31 11 078 0.01Public entities 3 0.47 394 452 0.27Retail shareholders 242 37.81 1 553 404 1.08Retirement benefit funds 127 19.84 20 629 182 14.30Scrip lending 3 0.47 372 460 0.26Stockbrokers and nominees 9 1.41 1 641 942 1.14Trusts 39 6.09 1 116 855 0.77Total 640 100.00 144 285 503 100.00
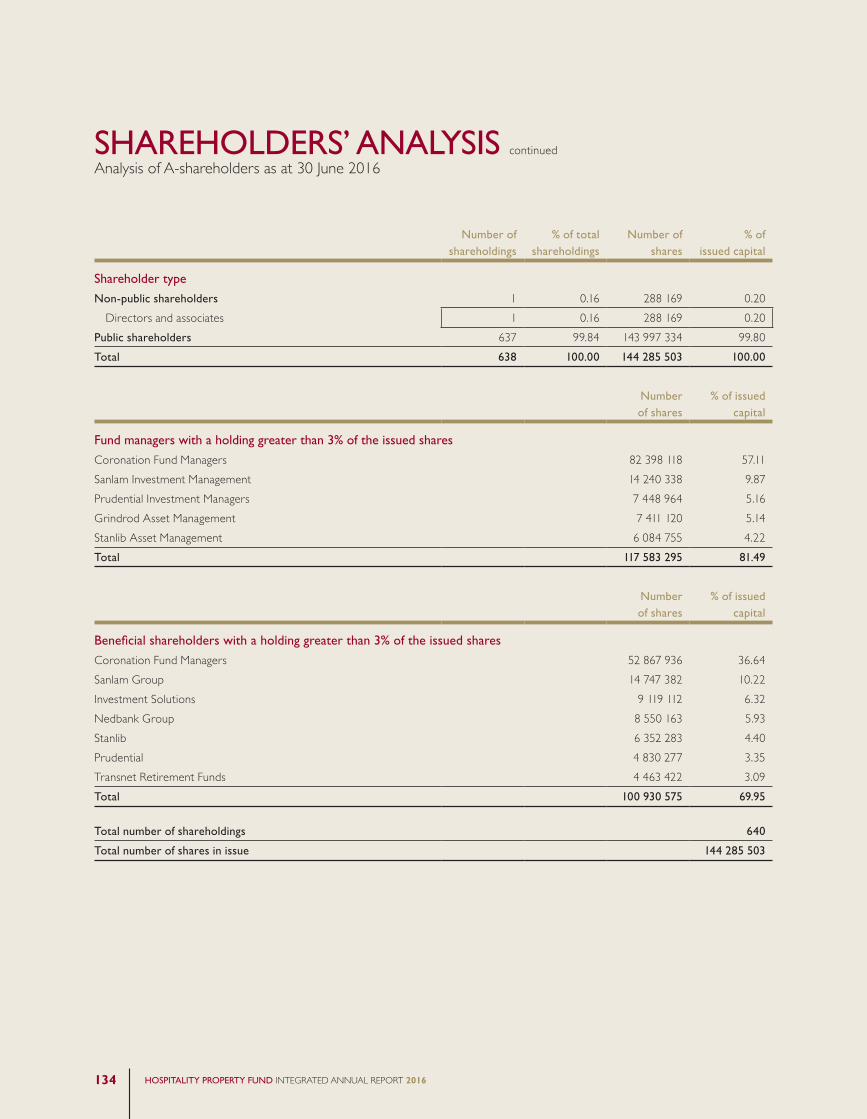
HOSPITALITY PROPERTY FUND INTEGRATED ANNUAL REPORT 2016134
Number ofshareholdings
% of totalshareholdings
Number ofshares
% ofissued capital
Shareholder type
Non-public shareholders 1 0.16 288 169 0.20Directors and associates 1 0.16 288 169 0.20
Public shareholders 637 99.84 143 997 334 99.80Total 638 100.00 144 285 503 100.00
Numberof shares
% of issuedcapital
Fund managers with a holding greater than 3% of the issued shares
Coronation Fund Managers 82 398 118 57.11Sanlam Investment Management 14 240 338 9.87Prudential Investment Managers 7 448 964 5.16Grindrod Asset Management 7 411 120 5.14Stanlib Asset Management 6 084 755 4.22Total 117 583 295 81.49
Numberof shares
% of issuedcapital
Beneficialshareholderswithaholdinggreaterthan3%oftheissuedshares
Coronation Fund Managers 52 867 936 36.64Sanlam Group 14 747 382 10.22Investment Solutions 9 119 112 6.32Nedbank Group 8 550 163 5.93Stanlib 6 352 283 4.40Prudential 4 830 277 3.35Transnet Retirement Funds 4 463 422 3.09Total 100 930 575 69.95
Total number of shareholdings 640
Total number of shares in issue 144 285 503
SHAREHOLDERS’ ANALYSIS continuedAnalysis of A-shareholders as at 30 June 2016

HOSPITALITY PROPERTY FUND INTEGRATED ANNUAL REPORT 2016 135
Number of shareholdings
% of total shareholdings
Number of shares
% of issued capital
Shareholder spread
1 – 1 000 87 19.82 35 677 0.021 001 – 10 000 153 34.85 742 905 0.5110 001 – 100 000 117 26.65 4 095 505 2.84100 001 – 1 000 000 66 15.03 28 093 695 19.47Over 1 000 000 16 3.64 111 317 721 77.15Total 439 100.00 144 285 503 100.00
Number of shareholdings
% of total shareholdings
Number of shares
% of issued capital
Distribution of shareholders
Assurance companies 3 0.68 397 223 0.28Close corporations 14 3.19 1 225 989 0.85Collective investment schemes 28 6.38 29 075 342 20.15Custodians 1 0.23 25 000 0.02Foundations and charitable funds 1 0.23 178 012 0.12Hedge funds 2 0.46 1 200 128 0.83Investment partnerships 3 0.68 42 973 0.03Managed funds 2 0.46 21 451 0.01Medical aid funds 1 0.23 47 293 0.03Organs of state 1 0.23 1 261 583 0.87Private companies 24 5.47 84 910 487 58.85Retail shareholders 271 61.73 5 190 009 3.60Retirement benefit funds 29 6.61 12 468 894 8.64Share schemes 1 0.23 1 969 710 1.37Stockbrokers and nominees 13 2.96 3 940 229 2.73Trusts 45 10.25 2 331 180 1.62Total 439 100.00 144 285 503 100.00
SHAREHOLDERS’ ANALYSISAnalysis of B-shareholders as at 30 June 2016

HOSPITALITY PROPERTY FUND INTEGRATED ANNUAL REPORT 2016136
Number of shareholdings
% of total shareholdings
Number of shares
% of issued capital
Shareholder type
Non-public shareholders 5 1.14 81 258 246 56.32
> 10% Southern Sun Hotels Proprietary Limited 1 0.23 78 344 196 54.30Share schemes 1 0.23 1 969 710 1.37Directors and associates 3 0.68 944 340 0.65
Public shareholders 433 98.68 63 027 257 43.68
Total 438 100.00 144 285 503 100.00
Number of shares
% of issued capital
Fund managers with a holding greater than 3% of the issued shares
Investec Asset Management 9 790 426 6.79Kagiso Asset Management 9 509 532 6.59Nedbank Private Wealth 8 320 397 5.77Total 27 620 355 19.14
Number of shares
% of issued capital
Beneficialshareholderswithaholdinggreaterthan3%oftheissuedshares
Southern Sun Hotels Proprietary Limited 78 344 196 54.30Nedbank Group 8 322 397 5.77Transnet Retirement Funds 4 531 255 3.14Total 91 197 848 63.21
Total number of shareholdings 439
Total number of shares in issue 144 285 503
SHAREHOLDERS’ ANALYSIS continuedAnalysis of B-shareholders as at 30 June 2016

HOSPITALITY PROPERTY FUND INTEGRATED ANNUAL REPORT 2016 137
Hospitality Property Fund Limited(Incorporated in the Republic of South Africa) (Registration number 2005/014211/06)Share code for ordinary shares: HPBISIN for ordinary shares: ZAE000214656(Approved as a REIT by the JSE Limited) (“Hospitality” or “the Company”)
Notice is hereby given to shareholders of the Company that its annual general meeting (“AGM” or “the meeting”) will be held at Crowne Plaza Johannesburg – The Rosebank, Cnr Tyrwhitt and Sturdee Avenues, Rosebank on Tuesday, 22 November 2016 at 10:00 to (i) deal with such business as may lawfully be dealt with at the meeting and (ii) consider and, if deemed fit to pass, with or without modification, the ordinary and special resolutions set out hereunder in the manner required by the Companies Act, 71 of 2008, as amended (“the Companies Act”), as read with the Listings Requirements of the JSE Limited (“the JSE Listings Requirements”).
SECTION 63(1) OF THE COMPANIES ACT: IDENTIFICATION OF MEETING PARTICIPANTSKindly note that meeting participants (including proxies) are required to provide reasonably satisfactory identification before being entitled to attend or participate in a meeting. Forms of identification that will be accepted include original and valid identity documents, drivers’ licenses and passports.
RECORD DATESIn terms of sections 59(1)(a) and (b) of the Companies Act, the Board of the Company has set the record date for the purpose of determining which shareholders are entitled to:
• receive notice of the AGM (being the date on which a shareholder must be registered in the Company’s securities register as a shareholder in order to receive notice of the AGM) as Friday, 7 October 2016; and
• participate in and vote at the AGM (being the date on which the shareholder must be registered in the Company’s securities register as a shareholder in order to participate in and vote at the AGM) as Friday, 11 November 2016. Therefore, the last day to trade in the Company’s shares on the JSE Limited (JSE) to be recorded in the share register on the voting record date is Tuesday, 8 November 2016.
1. PRESENTATION OF ANNUAL FINANCIAL STATEMENTSTo receive for consideration, the audited annual financial statements of the Company, together with the report of the directors, the independent auditors and the Audit and Risk Committee for the year ended 30 June 2016 as set out on pages 67 to 132 of the integrated annual report (“IAR”).
2. ORDINARY RESOLUTION NUMBER 1: RE-ELECTION OF MR SA HALLIDAY AS A DIRECTOR“Resolved that Mr SA Halliday, who retires by rotation in terms of the Memorandum of Incorporation of the Company and who is eligible and available for re-election is re-elected as a director of the Company.”
3. ORDINARY RESOLUTION NUMBER 2: RE-ELECTION OF DR ZN KUBUKELI AS A DIRECTOR“Resolved that Mr ZN Kubukeli, who retires by rotation in terms of the Memorandum of Incorporation of the Company and who is eligible and available for re-election is re-elected as a director of the Company.”
4. ORDINARY RESOLUTION NUMBER 3: RE-ELECTION OF MRS ZN MALINGA AS A DIRECTOR“Resolved that Mrs ZN Malinga, who retires by rotation in terms of the Memorandum of Incorporation of the Company and who is eligible and available for re-election is re-elected as a director of the Company.”
NOTICE OF ANNUAL GENERAL MEETING OF SHAREHOLDERS TO THE FINANCIAL STATEMENTS

HOSPITALITY PROPERTY FUND INTEGRATED ANNUAL REPORT 2016138
5. ORDINARY RESOLUTION NUMBER 4: RE-ELECTION OF MR WC ROSS AS A DIRECTOR“Resolved that Mr WC Ross, who retires by rotation in terms of the Memorandum of Incorporation of the Company and who is eligible and available for re-election is re-elected as a director of the Company.”
Abridged curriculum vitae of each of the above directors appears on pages 30 to 31 of the IAR of which this notice forms part.
Reason for Ordinary Resolutions Numbers 1 to 4: Election of directors at the AGM
In accordance with the Company’s Memorandum of Incorporation, one-third of the Company’s directors are required to retire at each AGM and may offer themselves for re-election. In addition, any director who is 70 years or older, shall retire annually. Mrs Malinga and Messrs Halliday and Ross and Dr Kubukeli being eligible and available offer themselves for re-election.
The Board (assisted by the Nomination Committee) has reviewed its composition against corporate governance requirements and has recommended the election of the directors listed above. It is the view of the Board that the election of the candidates referred to above would enable the Company to:
• responsibly maintain a mixture of business skills and experience relevant to the Company and balance the requirements oftransformation, continuity and succession planning; and
• comply with corporate governance requirements in respect of matters such as the balance of executive, non-executive andindependent directors on the Board.
6. ORDINARY RESOLUTION NUMBER 5: REAPPOINTMENT OF THE EXTERNAL AUDITOR“Resolved that PricewaterhouseCoopers Inc. is appointed as independent external auditor of the Company (to report on the financial year ending 30 June 2017) until the conclusion of the next AGM of the Company.”
Reason for Ordinary Resolution Number 5: Reappointment of external auditor
In terms of section 90(1) of the Companies Act, each year at its AGM, the Company must appoint an auditor who complies with the requirements of section 90(2) of the Companies Act. Hospitality’s Audit and Risk Committee recommends the appointment of PricewaterhouseCoopers Inc. as the registered external auditor of the Company until the next AGM, subject to shareholder approval as required in terms of section 90(1) of the Companies Act.
7. ORDINARY RESOLUTION NUMBER 6: ELECTION OF MRS L DE BEER AS A MEMBER OF THE AUDIT AND RISK COMMITTEE“Resolved that Mrs L de Beer, being an independent, non-executive director of the Company, be elected as a member of the Audit and Risk Committee of the Company with effect from the conclusion of this meeting (in terms of section 94(2) of the Companies Act) until the date of the next AGM to be held in 2017.”
8. ORDINARY RESOLUTION NUMBER 7: ELECTION OF MR SA HALLIDAY AS A MEMBER OF THE AUDIT AND RISK COMMITTEE“Resolved that Mr SA Halliday, being an independent, non-executive director of the Company, be elected as a member of the Audit and Risk Committee of the Company with effect from the conclusion of this meeting (in terms of section 94(2) of the Companies Act) until the date of the next AGM to be held in 2017, subject to his re-election as a director in terms of ordinary resolution number 1.”
NOTICE OF ANNUAL GENERAL MEETING OF SHAREHOLDERS TO THE FINANCIAL STATEMENTS continued

HOSPITALITY PROPERTY FUND INTEGRATED ANNUAL REPORT 2016 139
9. ORDINARY RESOLUTION NUMBER 8: ELECTION OF MRS ZN MALINGA AS A MEMBER OF THE AUDIT AND RISK COMMITTEE“Resolved that Mrs ZN Malinga, being an independent, non-executive director of the Company, be elected as a member of the Audit and Risk Committee of the Company with effect from the conclusion of this meeting (in terms of section 94(2) of the Companies Act) until the date of the next AGM to be held in 2017, subject to her re-election as a director in terms of ordinary resolution number 3.”
Reason for Ordinary Resolutions Numbers 6 to 8: Election of Audit and Risk Committee members
In terms of the Companies Act and the King Report on Governance for South Africa (“King III”) the Audit and Risk Committee is a committee of the Board elected by the shareholders at each AGM. In terms of the regulations to the Companies Act, at least one-third of the members of a Company’s Audit and Risk Committee at any particular time must have academic qualifications, or experience, in economics, law, corporate governance, finance, accounting, commerce, industry, public affairs or human resource management.
Hospitality’s Board, having satisfied itself, among others, of the independence, qualifications, experience and expertise of the independent non-executive directors offering themselves for election as members of the Hospitality Audit and Risk Committee, recommends their election to shareholders.
10. ORDINARY RESOLUTION NUMBER 9: GENERAL AUTHORITY TO DIRECTORS TO ALLOT AND ISSUE AUTHORISED BUT UNISSUED SHARES“Resolved that, to the extent required by and subject to the Memorandum of Incorporation of the Company, the Companies Act and the JSE Listings Requirements, each as presently constituted and as amended from time to time, the directors are, as a general authority and approval, authorised, as they in their discretion think fit, to allot and issue the authorised but unissued ordinary shares in the Company to such person(s) and upon such terms and conditions as the directors may determine, on the following bases:
1. the directors may allot and issue the authorised but unissued ordinary shares in the Company as consideration for the acquisition by the Company or any of its subsidiaries, of immovable property or for shares in and/or loan accounts against companies owning immovable property for the purpose of acquiring such property.
2. the directors are not authorised to issue more ordinary shares in aggregate in any one financial year than such number of ordinary shares that constitute 10% of the Company’s issued share capital as at the date of the passing of this resolution (the determination of which shall exclude any specific issue of shares approved by shareholders in their capacity as shareholders).
3. the maximum discount at which ordinary shares may be issued in terms of this authority is 5% of the weighted average trade price on the JSE of the ordinary shares measured over 30 business days prior to the date that the issue is authorised by the directors of the Company; or 5% of the weighted average traded price on the JSE of the relevant shares measured over three days prior to the date of issue.
4. this authority shall only be valid until the next AGM of the Company but shall not endure beyond a period of 15 months from the date of this meeting.”

HOSPITALITY PROPERTY FUND INTEGRATED ANNUAL REPORT 2016140
Reason for Ordinary Resolution Number 9: General authority to directors to allot and issue authorised but unissued shares
In terms of the Company’s Memorandum of Incorporation, read with the JSE Listings Requirements, the shareholders may authorise the directors to allot and issue authorised but unissued shares as the directors in their discretion think fit , but at all times subject to the Companies Act.
The aggregate number of shares to be allotted and issued in each class are limited, as set out in the above resolution. The directors consider it advantageous to approve these authorities to enable the Company to take advantage of any business opportunities that may arise in future. Being able to act promptly on such opportunities through the issue of shares as whole or part consideration puts the Company in an advantageous position at the time of negotiations.
11. REPORT BY SOCIAL AND ETHICS COMMITTEEThe Company’s Social and Ethics Committee report, included on page 54 of the IAR, read with the Natural, Human and Relationship Capital report on page 62 will serve as the Social and Ethics Committee’s report to the Company’s shareholders on matters within its mandate at the AGM. Any specific questions to the Committee may be sent to the Company Secretary prior to the AGM.
12. ORDINARY RESOLUTION NUMBER 10: SIGNATURE OF DOCUMENTATION“Resolved that any director of the Company or the Company Secretary be and is hereby authorised on behalf of the Company to sign any documents and do all such things as may be necessary in order to give effect to those ordinary and special resolutions that are approved at the AGM of the Company.”
13. ADVISORY ENDORSEMENT OF THE REMUNERATION POLICYTo endorse, through a non-binding advisory vote, the Company’s remuneration policy (excluding the remuneration of the non-executive directors and the members of Board and statutory committees for their service as directors and members of committees) as set out in the remuneration report on page 55 of the IAR.
Reason for endorsement of remuneration policy
In terms of King III recommendations, the Company’s remuneration policy should be tabled annually for a non-binding advisory vote at the AGM. The essence of this vote is to enable the shareholders to express their views on the remuneration policies adopted in the remuneration of executive directors and on their implementation.
Accordingly, the shareholders are requested to endorse the Company’s remuneration policy as recommended by King III.
14. SPECIAL RESOLUTION NUMBER 1: NON-EXECUTIVE DIRECTORS’ REMUNERATION FOR THE PERIOD 1 JULY 2017 TO 30 JUNE 2018At Hospitality’s AGM held on 27 November 2015, shareholders approved a maximum increase of 8% to the remuneration of non-executive directors of the Company, for their services as directors, for the period 1 July 2016 to 30 June 2017, subject to Board approval. The Board, on recommendation by the Remuneration Committee agreed a 7% inflationary increase for the period 1 July 2016 to 30 June 2017, as follows:
NOTICE OF ANNUAL GENERAL MEETING OF SHAREHOLDERS TO THE FINANCIAL STATEMENTS continued
HOSPITALITY PROPERTY FUND INTEGRATED ANNUAL REPORT 2016 141
ChairmanRand
MemberRand
Board (per annum) 340 260 226 840Audit and Risk Committee (per annum) 147 446 90 736Investment Committee (per meeting) 13 610 11 342Nomination Committee (per meeting) 7 372 6 238Remuneration Committee (per meeting) 7 372 6 238Social and Ethics Committee (per annum) 48 739 38 563
Approval is now sought for the non-executive directors’ fees for the period 1 July 2017 to 30 June 2018. Therefore:
“Resolved that, in terms of the Company’s Memorandum of Incorporation and sections 66(8) and 66(9) of the Companies Act, the payment of the remuneration of the non-executive directors of the Company, for their services as directors, for the period 1 July 2017 to 30 June 2018, unless amended by a special resolution of shareholders, be equal to the non-executive directors’ remuneration for the period 1 July 2016 to 30 June 2017 (as set out above), escalated as approved by the Board of Hospitality, up to a maximum of 8%.”
Reason for Special Resolution Number 1: Non-executive directors’ remuneration for the period 1 July 2017 to 30 June 2018
The reason and effect of special resolution number 1 is to obtain shareholder approval for the remuneration of each of the non-executive directors of the Company for the period 1 July 2017 to 30 June 2018 in accordance with section 66(8) and 66(9) of the Companies Act.
15. SPECIAL RESOLUTION NUMBER 2: FINANCIAL ASSISTANCE TO SUBSIDIARIES AND OTHER RELATED AND INTER-RELATED ENTITIES IN TERMS OF SECTIONS 44 AND 45 OF THE COMPANIES ACT“Resolved that, to the extent required by the Companies Act, the Board may, subject to compliance with the requirements of the Company’s Memorandum of Incorporation, the Companies Act and the JSE Listings Requirements, each as presently constituted and as amended from time to time, authorise the Company to provide direct or indirect financial assistance by way of loan, guarantee, the provision of security or otherwise, to any of its present or future subsidiaries and/or any other Company or entity that is or becomes related or inter-related to the Company for any purpose or in connection with any matter including, but not limited to, the subscription of any option or any shares issued or to be issued by the Company or a related or inter-related Company or entity, or for the purchase of any shares of the Company or a related or inter-related Company or entity, including any direct or indirect financial assistance as contemplated in sections 44 and 45 of the Companies Act, on such terms and conditions as the Board may determine, such authority to endure until the next AGM of the Company to be held in 2017.”
16. SPECIAL RESOLUTION NUMBER 3: FINANCIAL ASSISTANCE TO DIRECTORS, PRESCRIBED OFFICERS AND OTHER PERSONS PARTICIPATING IN EMPLOYEE INCENTIVE SCHEMES IN TERMS OF SECTIONS 44 AND 45 OF THE COMPANIES ACT“Resolved that, to the extent required by the Companies Act, the Board of directors of the Company may, subject to compliance with the requirements of the Company’s Memorandum of Incorporation, the Companies Act and the JSE Listings Requirements, each as presently constituted and as amended from time to time, authorise the Company to provide direct or indirect financial assistance by way of loan, guarantee, the provision of security or otherwise, to any of the present or future directors or prescribed officers of the Company or of a related or inter- related Company or entity (or any person related to any of them or to any Company or entity related or inter-related to any of them), or to any other person who is or may be a participant in any employee incentive scheme operated within the Hospitality Group, or to any trust or other entity established by the Company to facilitate an incentive scheme for qualifying employees of the Hospitality Group, for the purpose of, or in connection with, the subscription of any option, or any shares, issued or to be issued by the Company or a related or inter-related Company or entity, or for the purchase of any shares of the Company or a related or inter-

HOSPITALITY PROPERTY FUND INTEGRATED ANNUAL REPORT 2016142
related Company or entity, where such financial assistance is provided in terms of any such scheme that does not constitute an ‘employee incentive scheme’ as defined in the Companies Act and that satisfies the requirements of section 97 of the Companies Act, on such terms and conditions as the Board may determine, such authority to endure until the next AGM of the Company to be held in 2017.”
Reasons of special resolutions numbers 2 and 3: Authority to provide financial assistance to subsidiaries and other related and inter-related entities and to directors, prescribed officers and other persons participating in employee incentive schemes.
Hospitality would like the ability to provide financial assistance to related or inter-related persons and entities, such as its subsidiaries, if necessary, in accordance with section 45 of the Companies Act. Furthermore, it may be necessary or desirable for Hospitality to provide financial assistance to related or inter-related companies and entities to subscribe for options or shares or purchase shares of Hospitality or another Company related or inter-related to it. Under sections 44 and 45 of the Companies Act, Hospitality will, however, require a special resolution to be adopted before such financial assistance may be provided. In the circumstances and in order to, amongst others, ensure that Hospitality’s related and inter-related companies and entities have access to financing and/or financial backing from Hospitality (as opposed to banks), it is necessary to obtain the approval of shareholders, as set out in special resolutions numbers 2 and 3.
17. SPECIAL RESOLUTION NUMBER 4: GENERAL AUTHORITY TO ACQUIRE SHARES“Resolved that the Company and/or a subsidiary of the Company is authorised by way of a general authority to repurchase or purchase, as the case may be, ordinary shares issued by the Company, from any person, upon such terms and conditions and in such number as the directors of the Company or the subsidiary may from time to time determine, subject to the applicable requirements of the Company’s Memorandum of Incorporation, the Companies Act and the JSE Listings Requirements, each as presently constituted and as amended from time to time on the following bases:
(a) each repurchase of shares must be effected through the main order book operated by the JSE trading system and done without any prior understanding or arrangement between the Company and the counterparty (reported trades are prohibited);
(b) the repurchase or purchase, as the case may be, by the Company and/or any of its subsidiaries, of shares in the Company of any class under this authority shall not, in aggregate in any one financial year, exceed 10% of the Company’s issued share capital as at the commencement date of such financial year;
(c) repurchases of ordinary shares may not be made at a price greater than 10% above the weighted average of the market value of ordinary shares for the five business days immediately preceding the date on which the repurchase is effected (the maximum price). The JSE will be consulted for a ruling if the Company’s shares have not traded in such a five-business day period;
(d) repurchases of ordinary shares by the Company or its subsidiaries may not take place during a prohibited period as defined in the Listings Requirements, unless the Company has in place a repurchase programme where the dates and quantities of ordinary shares to be traded are fixed (not subject to any variation) and full details of the programme have been disclosed in writing to the JSE prior to the commencement of the prohibited period;
(e) the Company shall release an announcement on SENS and in the press, as soon as it or its subsidiary has, on a cumulative basis purchased or repurchased ordinary shares, which constitute 3% of the number of ordinary shares in issue (at the time that this authority from shareholders for the repurchase was granted), and for each 3% in aggregate of such number of ordinary shares purchased or repurchased, as the case may be, thereafter;
(f ) this general authority shall be valid only until the next AGM of the Company to be held in 2017, provided that it shall not extend beyond 15 months from the date of passing of this special resolution;
(g) at any point in time, the Company may only appoint one agent to effect any repurchases on the Company’s behalf;
(h) the number of ordinary shares purchased and held by a subsidiary or subsidiaries of the Company shall not exceed 10% in the aggregate of the number of issued shares in the Company at the relevant times;
NOTICE OF ANNUAL GENERAL MEETING OF SHAREHOLDERS TO THE FINANCIAL STATEMENTS continued

HOSPITALITY PROPERTY FUND INTEGRATED ANNUAL REPORT 2016 143
(i) no voting rights attached to ordinary shares acquired by the Company’s subsidiaries may be exercised while the ordinary shares are held by them and they remain subsidiaries of the Company;
(j) a resolution has been passed by the Board of the Company confirming that it has authorised the general repurchase, that the Company and its subsidiaries will satisfy the solvency and liquidity test immediately after the repurchase of ordinary shares and that since the test was done there have been no material changes to the financial position of the Group; and
(k) any such general repurchase will be subject to Exchange Control Regulations.”
Reason of Special Resolution Number 4: General authority to acquire shares
The reason for special resolution number 4 is to grant the Board a general authority for the acquisition of the Company’s shares by the Company, or by a subsidiary or subsidiaries of the Company.
Having considered the effect of acquisition of the Company’s shares up to a maximum limit, the directors of the Company are of the opinion that, if such acquisitions were implemented:
(i) the Company and the Group are in a position to repay their debt in the ordinary course of business for a period of 12 months after the date of the notice of the meeting;
(ii) the Company and the Group’s assets will be in excess of the liabilities of the Company and the Group for a period of 12 months after the date of the notice of the meeting. For this purpose, the assets and liabilities will be recognised and measured in accordance with the accounting policies used in the latest audited consolidated annual financial statements of the Group for the year ended 30 June 2016 which comply with the Companies Act;
(iii) the share capital and reserves of the Company and the Group will be adequate for the ordinary business purposes of the Company and the Group for a period of 12 months following the date of the notice of the meeting; and
(iv) the available working capital of the Company and the Group will be adequate for ordinary business purposes for a period of 12 months after the date of the notice of the meeting.
Statement of the Board’s intention
Although there is no immediate intention to effect a repurchase of shares of the Company, the Board believes that it should retain flexibility so that the directors may utilise the general authority to repurchase shares as and when suitable opportunities present themselves and which opportunities may require immediate action.
Other disclosure in accordance with section 11.26 of the JSE Listings
The following additional information, some of which may appear elsewhere in the IAR is provided in terms of the JSE Listings Requirements for purposes of this general authority:
• Majorshareholders–pages134to136oftheIAR.• SharecapitaloftheCompany–page106oftheIAR.
Material change statement
Save for the various announcements on SENS relating to the transaction in terms of which Tsogo Sun Holdings Limited acquired a controlling stake in the Company by vending a portfolio of 10 hotel properties into Hospitality in exchange for the issue of Hospitality ordinary shares, the last of which was released on 11 August 2016 and the SENS announcement of 11 April 2016 on the restructure of the Company’s dual-class share capital structure to a single-class share capital structure, there have been no material changes in

HOSPITALITY PROPERTY FUND INTEGRATED ANNUAL REPORT 2016144
the affairs or the financial position of the Company or that of its subsidiaries since the date of signature of the audited annual financial statements for the year ended 30 June 2016 and the date of this notice.
Directors’ responsibility statement
The directors, collectively and individually, accept full responsibility for the accuracy of the information given and certify that, to the best of their knowledge and belief, there are no facts that have been omitted which would make any statement false or misleading, and that all reasonable enquiries to ascertain such facts have been made and that the special resolutions contain all information required by law and the JSE Listings Requirements.
Voting requirements
All ordinary resolutions will, in terms of the Companies Act, require support of more than 50% of the voting rights of shareholders, in their capacity as shareholders, exercised thereon, to be approved. All special resolutions will, in terms of the Companies Act, require support of at least 75% of the total voting rights of shareholders, in their capacity as shareholders, exercised thereon at the meeting, to be approved.
Electronic participation
The Company has made provision for its shareholders or their proxies to participate electronically in the AGM by way of telephone conferencing. Should a shareholder wish to participate in the AGM by telephone conference call as aforesaid, the shareholder, or his/her/its proxy, will be required to advise the Company thereof by submitting by email to the Company Secretary at [email protected] or by fax to +27 (11) 994 6321 for the attention of Mrs Rosa van Onselen, relevant contact details, including an email address, cellular number and landline number, as well as full details of the shareholder’s title to shares issued by the Company and proof of identity, in the form of certified copies of identity documents and share certificates (in the case of certificated shares) and (in the case of dematerialised shares) written confirmation from the shareholder’s Central Securities Depository Participant (“CSDP”) confirming the shareholders’ title to the dematerialised shares, to reach the Company by no later than 10:00 on Tuesday, 15 November 2016. Upon receipt of the required information by the Company, the shareholder concerned will be provided with a secure code and instructions to access the electronic communication during the AGM. Shareholders must note that access to the electronic communication will be at the expense of the shareholders who wish to utilise the facility.
Shareholders and their appointed proxies attending the AGM by conference call will not be able to cast their votes at the AGM through this medium. Accordingly, shareholders making use of the electronic participation facility are requested to submit their forms of proxy to the Company, as directed in this notice.
Proxies, authority for representatives to act and voting
Shareholders who are entitled to attend, participate in and vote at the AGM, are entitled to appoint a proxy (or more than one proxy in respect of different shareholders held by them) to attend, speak and vote in their stead. A proxy need not be a shareholder of the Company and shall be entitled to vote on a show of hands or a poll. For the convenience of registered shareholders of the Company, a form of proxy is enclosed herewith to be completed by them in their capacity as shareholders.
The enclosed form of proxy is only to be completed by those shareholders who are:• holdingsharesincertificatedform;or• recordedontheCompany’ssubregisterindematerialisedelectronicformwith“ownname”registration.
It is requested that the Company receives forms of proxy at its registered office by no later than 10:00 Friday, 18 November 2016. If shareholders who have not dematerialised their shares or who have dematerialised their shares with ‘own name’ registration, and who are entitled to attend, participate in and vote at the AGM, do not deliver forms of proxy to the Company by the relevant time, such shareholders will nevertheless be entitled to lodge the form of proxy in respect of the AGM immediately prior to the exercising of
NOTICE OF ANNUAL GENERAL MEETING OF SHAREHOLDERS TO THE FINANCIAL STATEMENTS continued

HOSPITALITY PROPERTY FUND INTEGRATED ANNUAL REPORT 2016 145
the shareholders’ rights at the AGM, in accordance with the instructions therein, with the chairman of the AGM. Any shareholder who completes and lodges a form of proxy will nevertheless be entitled to attend, participate in and vote in person at the AGM should the shareholder decide to do so.
All other beneficial owners who have dematerialised their shares through a CSDP or broker and wish to attend the AGM should contact their CSDP or broker:• toprovidethemwiththenecessaryletterofRepresentationinordertoattendtheAGM;or• tofurnishtheCSDPorbrokerwiththeirvotinginstructionsintermsoftherelevantcustodyagreemententeredintobetweenthem
and the CSDP or broker.
These shareholders must not use a form of proxy.
A Company that is a shareholder wishing to attend and participate at the AGM should ensure that a resolution authorising a representative to so attend and participate at the AGM on its behalf is passed by its directors. Resolutions authorising representatives in terms of section 57(5) of the Companies Act must be lodged with the Company’s transfer secretaries prior to the AGM.
Due to Hospitality’s share structure, its shareholders are also its debenture holders and the matters to be voted on at the AGM are matters on which shareholders and not debenture holders, are entitled to vote. As a result, a form of proxy has only been included for shareholders in their capacity as shareholders.
Every shareholder present in person or represented by proxy and entitled to vote shall, in his/her/its capacity as shareholder, on a show of hands, have only one vote irrespective of the number of shares he/she/it holds or represents. On a poll, every shareholder present in person or represented by proxy and entitled to vote, shall, in his/her/its capacity as shareholder, be entitled to that proportion of the total votes in the Company which the aggregate amount of the nominal value of all the shares held by him/her/it bears to the aggregate amount of the nominal value of all the shares issued by the Company.
By order of the Board
LR van OnselenFor HPF Management Proprietray LimitedCompany Secretary20 September 2016

HOSPITALITY PROPERTY FUND INTEGRATED ANNUAL REPORT 2016146
CORPORATE INFORMATION
SECRETARIES AND MANAGERSLR van Onselen forHPF Management Proprietary LimitedThe Zone II, Loft Offices, East Wing, 2nd Floor, Cnr Oxford Road and Tyrwhitt Avenue, Rosebank, Johannesburg, 2196Tel: +27 11 994 6300Fax: +27 11 994 6301
REGISTERED OFFICEThe Zone II, Loft Offices, East Wing, 2nd Floor, Cnr Oxford Road and Tyrwhitt Avenue, Rosebank, Johannesburg, 2196(PO Box 522195, Saxonwold, 2132)Tel: +27 11 994 6300Fax: +27 11 994 6301
BANKERSNedbank Limited135 Rivonia RoadSandton(PO Box 1144, Johannesburg, 2000)
TRUSTEES TO NOTE HOLDERSTMF Corporate Services South Africa Proprietary Limited3rd Floor, 200 on Main, Cnr Main and Bowwood RoadsClaremont(Postnet Suite 294 Private Bag X1005 Claremont 7735)
INDEPENDENT AUDITORSKPMG Inc.KPMG Crescent85 Empire RoadParktown, Johannesburg(Private Bag 9, Parkview, 2122)
SPONSORSRand Merchant Bank, a division of FirstRand Bank Limited1 Merchant Place Cnr Fredman Drive and Rivonia RoadSandton(PO Box 786273, Sandton, 2146)
TRANSFER SECRETARIESComputershare Investor Services Proprietary LimitedGround Floor70 Marshall StreetJohannesburg(PO Box 61051, Marshalltown, 2107)

HOSPITALITY PROPERTY FUND INTEGRATED ANNUAL REPORT 2016 147
HOSPITALITY PROPERTY FUND LIMITEDIncorporated in the Republic of South Africa) (Registration number 2005/014211/06)Share code for ordinary shares: HPBISIN for ordinary shares: ZAE000214656(“Hospitality” or “the Company”)
THIS FORM OF PROXY IS ONLY FOR USE BY:• registeredshareholdersoftheCompany,intheircapacityasshareholders,whohavenotyetdematerialisedtheirHospitalityshares,recordedintheCompany’ssharesregister
as at Friday, 11 November 2016, in the exercise of their voting rights in respect of the ordinary shares in the capital of the Company;• registeredshareholders,intheircapacityasshareholders,whohavealreadydematerialisedtheirHospitalitysharesandwhichsharesareregisteredintheirownnamesinthe
Company’s subregister as at Friday, 11 November 2016.For completion by the aforesaid, registered shareholders of Hospitality who are unable to attend the annual general meeting of the Company to be held at Crowne Plaza Johannesburg – The Rosebank, Cnr Tyrwhitt and Sturdee Avenues, on Tuesday, on Monday, 22 November 2016 at 10:00 (“the AGM”).Certificated shareholdersIf you are a certif icated shareholder or have dematerialised your shares with ‘own name’ registration and you are unable to attend the AGM of Hospitality to be held at 10:00 on Tuesday, 22 November 2016 at Crowne Plaza Johannesburg – The Rosebank, Cnr Tyrwhitt and Sturdee Avenues, but wish to be represented thereat, you are requested to complete and return this form of proxy in accordance with the instructions contained herein and to lodge it with, or post it to, the Transfer Secretaries, namely Computershare Investor Services Proprietary Limited, so as to be received by them by no later than 10:00 on Friday, 18 November 2016. Nevertheless, such shareholders will be entitled to lodge the form of proxy in respect of the AGM immediately prior to the exercising of the shareholders’ rights at the AGM, in accordance with the instructions therein, with the chairman of the AGM. Any shareholder who completes and lodges a form of proxy will nevertheless be entitled to attend, participate in and vote in person at the AGM should the shareholder decide to do so.Dematerialised shareholders, other than those with ‘own name’ registrationIf you hold dematerialised shares in the Fund through a CSDP or broker, other than with an ‘own name’ registration, you must timeously advise your CSDP or broker of your intention to attend and vote at the AGM or be represented by proxy thereat in order for your CSDP or broker to provide you with the necessary letter of representation to do so, or should you not wish to attend the AGM in person, you must timeously provide your CSDP or broker with your voting instructions in order for the CSDP or broker to vote in accordance with your instructions at the AGM.I/We (name/s in BLOCK LETTERS) of (address)
being the registered holder/s of ordinary shares, hereby appoint:1. or failing him/her,2. or failing him/her, 3. the chairman of the AGM, as my/our proxy to attend, speak and vote for me/us on my/our behalf or to abstain from voting at the AGM of the Company and at any
adjournment thereof in respect of the ordinary share registered in my/our name/s, as follows:
Resolutions For Against Abstain1. Ordinary Resolution Number 1: Re-election of Mr SA Halliday as a Director2. Ordinary Resolution Number 2: Re-election of Dr ZN Kubukeli as a Director3. Ordinary Resolution Number 3: Re-election of Mrs ZN Malinga as a Director4. Ordinary Resolution Number 4: Re-election of Mr WC Ross as a Director5. Ordinary Resolution Number 5: Reappointment of the external auditor6. Ordinary Resolution Number 6: Election of Mrs L de Beer as a member of the Audit and Risk Committee7. Ordinary Resolution Number 7: Election of Mr SA Halliday as a member of the Audit and Risk Committee8. Ordinary Resolution Number 8: Election of Ms ZN Malinga as a member of the Audit and Risk Committee9. Ordinary Resolution Number 9: General Authority to directors to allot and issue authorised but unissued shares10. Ordinary Resolution Number 10: Signature of documentation11. Advisory endorsement of the remuneration policy12. Special Resolution Number 1: Non-executive directors’ remuneration (1 July 2017 to 30 June 2017)13. Special Resolution Number 2: Financial assistance to subsidiaries and other related and inter-related entities in terms of
sections 44 and 45 of the Companies Act14. Special Resolution Number 3: Financial assistance to directors, prescribed officers and other persons participating in employee incentive
schemes in terms of sections 44 and 45 of the Companies Act15. Special Resolution Number 4: General authority to acquire shares
Signed at on 2016
Signature(s)
Assisted by (where applicable)
Name Capacity
Signature
Please read notes overleaf.
FORM OF PROXY

HOSPITALITY PROPERTY FUND INTEGRATED ANNUAL REPORT 2016148
1. Only shareholders who are registered in the register of the Company under their own name may complete a form of proxy or attend the annual general meeting. This includes shareholders who have not dematerialised their shares or who have dematerialised their shares with “own name” registration. A shareholder entitled to attend and vote at the annual general meeting is entitled to appoint one individual as a proxy to attend, speak and, on a poll, to vote in his/her place at the annual general meeting. A proxy need not be a shareholder of the Company. Such shareholder may insert the name of a proxy of the shareholder’s choice in the space provided, with or without deleting ‘the chairman of the AGM, provided that any such deletion must be signed in full by the shareholder. The person whose name stands first on the form of proxy and who is present at the annual general meeting will be entitled to act as proxy to the exclusion of those whose names follow. Should a proxy not be specified, this will be exercised by the chairman of the class AGM.
2. The date must be filled in on this form of proxy and when it is signed.
3. The completion and lodging of this form will not preclude the relevant shareholder from attending the annual general meeting and speaking and voting in person thereat to the exclusion of any proxy appointed, should such shareholder wish to do so.
4. The appointment of a proxy or proxies:
4.1. is suspended at any time to the extent that the shareholder chooses to act directly and in person in the exercise of any rights as a shareholder;
4.2. is revocable in which case the shareholder may revoke the proxy appointment by:4.2.1. cancelling it in writing or making a later inconsistent
appointment of a proxy; and4.2.2. delivering a copy of the revocation instrument to the proxy
and to the Company.
5. The revocation of a proxy appointment constitutes a complete and final cancellation of the proxy’s authority to act on behalf of the relevant shareholder as of the later of the date:
5.1. stated in the revocation instrument, if any; or5.2. upon which the revocation instrument is delivered to the proxy and the
relevant Company as required in section 58(4)(c)(ii) of the Companies Act.
6. Should the instrument appointing a proxy or proxies have been delivered to the relevant Company, as long as that appointment remains in effect, any notice that is required by the Companies Act or the relevant Company’s Memorandum of Incorporation to be delivered by such Company to the shareholder must be delivered by such Company to:
6.1. the shareholder, or6.2. the proxy or proxies if the shareholder has in writing directed the
relevant Company to do so and has paid any reasonable fee charged by the Company for doing so.
7. The proxy appointment remains valid only until the end of the relevant meeting at which it was intended to be used unless revoked as contemplated in section 58(5) of the Companies Act.
8. Any alteration or correction made to this form of proxy must be initialled by the signatory/ies. The completion of any blank space(s) need not be signed or initialled.
9. A power of attorney or other documentary evidence establishing the authority of a person signing this form of proxy in a representative capacity must be attached to this form unless previously recorded by the transfer secretaries of the Company or waived by the chairman of the AGM.
10. A minor must be assisted by his/her parent/guardian unless the relevant documents establishing his/her legal capacity are produced or have been registered by the transfer secretaries.
11. A Company holding shares in the Company that wishes to attend and participate in the AGM should ensure that a resolution authorising a representative to act is passed by its directors. Resolutions authorising representatives in terms of section 57(5) of the Companies Act must be lodged with the Company’s transfer secretaries prior to the AGM.
12. Where there are joint holders of shares, only one of such persons need sign the form of proxy. If more than one of such joint shareholder votes, whether in person or by proxy, only the vote of one of the said persons whose name appears first in the securities register in respect of such shares or his/her proxy, as the case may be, shall be counted.
13. Every shareholder present in person or represented by proxy and entitled to vote shall, in his/her/its capacity as shareholder, on a show of hands, have only one vote irrespective of the number of shares he/she/it holds or represents. On a poll, every shareholder present in person or represented by a proxy and entitled to vote, shall, in his/her/its capacity as shareholder, be entitled to that proportion of the total votes in the Company which the aggregate amount of the nominal value of the shares held by him/her bears to the aggregate amount of the nominal value of all the shares of the relevant class issued by the Company.
14. The chairman of the AGM may reject or accept any proxy which is completed and/or received, other than in accordance with these notes, provided that he shall not accept a proxy unless he/she is satisf ied as to the matter in which a shareholder wishes to vote.
15. A proxy may not delegate his/her authority to act on behalf of the shareholder, to another person.
16. You are not obliged either to cast all your votes or to cast all your votes in the same way. A shareholder’s instruction to the proxy must be indicated either by:
16.1. the insertion of an “X” in the appropriate box next to the resolution (ie in favour of and/or against and/or by way of abstention), in which event the proxy will cast all your votes in the manner so specif ied; or
16.2. setting out the relevant number of shares to be voted on behalf of that shareholder in the appropriate box provided next to the resolution, provided that, if for any resolution the aggregate number of votes to be cast would exceed the total number of shares held, you will be deemed to have given no specif ic instruction as to how you wish your proxy to vote in respect of that resolution.Failure to comply with the above will be deemed to authorise the chairman of the AGM, if the chairman is the authorised proxy, to vote in favour of the resolutions at the annual general meeting or other proxy to vote or to abstain from voting at the AGM as he/she deems fit, in respect of the shares concerned. A shareholder or the proxy is not obliged to use all the votes exercisable by the shareholder or the proxy, but the total of votes cast in respect whereof abstention is recorded may not exceed the total of the votes exercisable by the shareholder or the proxy.
17. Where a proxy is appointed, the enclosed proxy form must be completed, signed and lodged, together with proof of the authority of the person signing the form in a representative capacity, with Computershare Investor Services Proprietary Limited, the transfer secretaries of the company, so as to be received at least 48 hours before the appointed time of the meeting, ie by 10:00 on Friday, 18 November 2016.
NOTES TO THE FORM OF PROXY AND SUMMARY OF RIGHTS UNDER SECTION 58 OF THE COMPANIES ACT, 2008


www.hpf.co.za
HO
SPIT
ALIT
Y P
RO
PER
TY
FUN
D IN
TEG
RAT
ED A
NN
UA
L REPO
RT FO
R THE YEAR EN
DED
30 JUN
E 2016