Hospital Value Based Purchasing Program - Midas Plus · Hospital Value Based Purchasing Program ......
51
Hospital Value Based Purchasing Program: Part 2 of 4: A Detailed Review of the Final CMS FY 2014 IPPS Rule - 1 -
Transcript of Hospital Value Based Purchasing Program - Midas Plus · Hospital Value Based Purchasing Program ......

Hospital Value Based Purchasing Program: Part 2 of 4: A Detailed Review of the Final CMS FY 2014 IPPS Rule
- 1 -

Hospital Value Based Purchasing Program Part 2 of 4 of Our Review of the IPPS 2014 Final Rule
Hospital Readmission
Reduction Program
Inpatient Hospital & Psychiatric
Quality Program
Hospital Acquired
Conditions Reduction Program
Hospital Value Based
Purchasing Program
- 2 -

Welcome and Introductions
- 3 -
Vicky Mahn DiNicola RN, MS, CPHQ
VP Research and Market Insights
Midas+ Xerox
Follow me at https://twitter.com/MidasXerox to keep up with
Regulatory Changes Impacting Quality Reporting Requirements!
Questions regarding this briefing may be submitted directly to me
in a private email simply by clicking on the comment bubble in the
tool bar at the bottom right of your presentation screen, or you
may contact me directly by sending me an email to

Review of
Final IPPS
Rule for
FY 2014
CMS-1599-F
CMS-1455-F Posted to
Federal Registry
August 19, 2013
http://www.gpo.gov/fdsys/
pkg/FR-2013-08-
19/pdf/2013-18956.pdf
- 4 -

Hospital Value Based
Purchasing
- 5 -
FY 2013
FY 2014
FY 2015
FY 2016
FY 2017
1.0 1.25 1.50 1.75 2.0
Funding pool started with 1.00 percent of the base-operating DRG
FY 2014 Funding Pool estimated at 1.1 Billion
Applies to subsection (d) hospitals
Maryland Hospitals Exempt
October 1, 2013 to
September 30, 2014

Each Measure Worth 0 to 10 Points Points are dependent upon your hospital’s performance
against the rest of the nation
Achievement
Threshold
Benchmark
40
National Median (50th Percentile) during a
baseline period with respect to a fiscal year
Note: This definition does not apply to the Medicare
Spending per Beneficiary Measure; which is the
median (50th percentile) of hospital performance on
a measure during the performance period with
respect to a fiscal year
Arithmetic mean of the top decile (10th Percentile)
during a baseline period with respect to a fiscal year
Note: This definition does not apply to the Medicare
Spending per Beneficiary Measure; which is the
arithmetic mean of the top decile of hospital performance
on a measure during the performance period with
respect to a fiscal year
Definitions have been clarified in the FY 2014 IPPS/LTCH Rule

Each Measure Worth 10 Points AMI-8a Primary PCI within 90 minutes of Arrival
95.34%
100%
Achievement
Threshold
Benchmark
= Your Hospital’s Performance beginning with Discharges January 1, 2013
0 Points
Performance Period
January 1, 2013 to
December 31, 2013
40

Each Measure Worth 10 Points AMI-8a Primary PCI within 90 minutes of Arrival
95.34%
100%
Achievement
Threshold
Benchmark
10 Points
Performance Period
January 1, 2013 to
December 31, 2013
= Your Hospital’s Performance beginning with Discharges January 1, 2013
40

Achievement Range
1 2 3 4 5 6 7 8 9 10
Achievement Points AMI-8a Primary PCI within 90 minutes of Arrival
95.34%
100%
Achievement Threshold
Benchmark
7 Points
For hospitals that score better than half the hospitals in the US
they can Score “Achievement Points” based on a linear scale between the
Achievement threshold and the Benchmark
98%
Performance Period
January 1, 2013 to
December 31, 2013
f 40
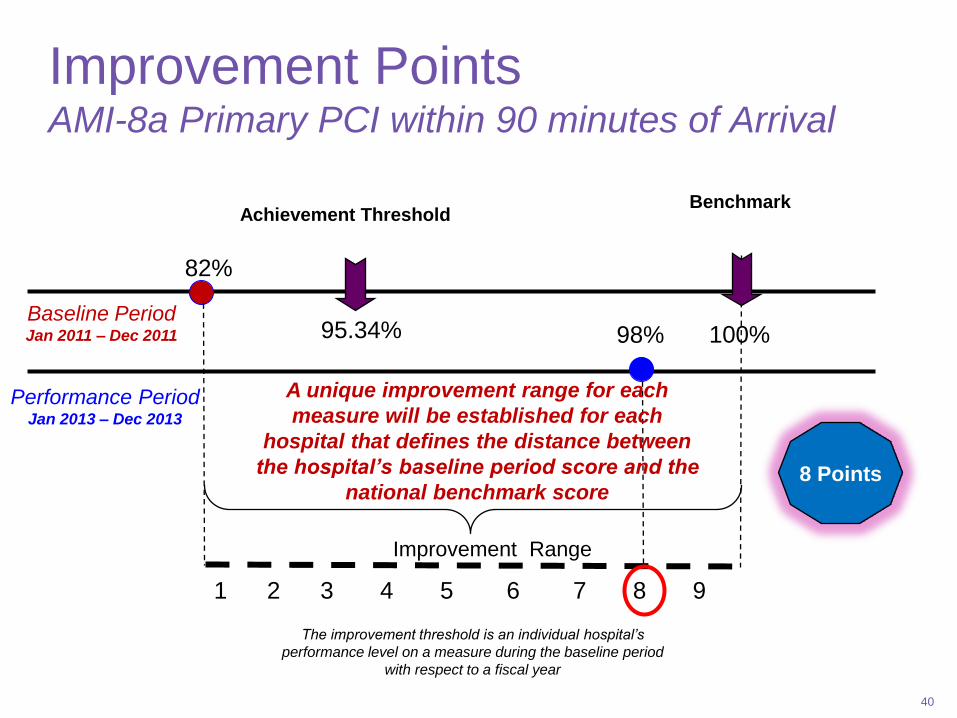
Improvement Points AMI-8a Primary PCI within 90 minutes of Arrival
Achievement Threshold
Benchmark
82%
95.34%
Baseline Period Jan 2011 – Dec 2011
Performance Period Jan 2013 – Dec 2013
Improvement Range
1 2 3 4 5 6 7 8 9
A unique improvement range for each
measure will be established for each
hospital that defines the distance between
the hospital’s baseline period score and the
national benchmark score
100%
98%
8 Points
40
The improvement threshold is an individual hospital’s
performance level on a measure during the baseline period
with respect to a fiscal year

- 11 -
Clinical Process of Care
45% Patient Experience
of Care 30%
Outcome 25%
FY 2014 Value-Based Purchasing Domains (Payment Determination for Discharges from October 1, 2013 to September 30, 2014)

FY 2014 Value-Based Purchasing Patient Experience Domain (Payment Determination for Discharges from October 1, 2013 to September 30, 2014)
- 12 -
8 Patient Experience of Care Measures
Baseline Period April 1, 2010 to December 31, 2010
Performance Period April 1, 2012 to December 31, 2012
HCAHPS Survey Dimensions Floor(%) Threshold (%) Benchmark (%)
Communication with Nurses 42.84 75.79 84.99
Communication with Doctors 55.49 79.57 88.45
Responsiveness of hospital staff 32.15 62.21 78.08
Pain management 40.79 68.99 77.92
Communications about
medications
36.01 59.85 71.54
Cleanliness and quietness 38.52 63.54 78.10
Discharge information 54.73 82.72 89.24
Overall rating of hospital 30.91 67.33 82.55
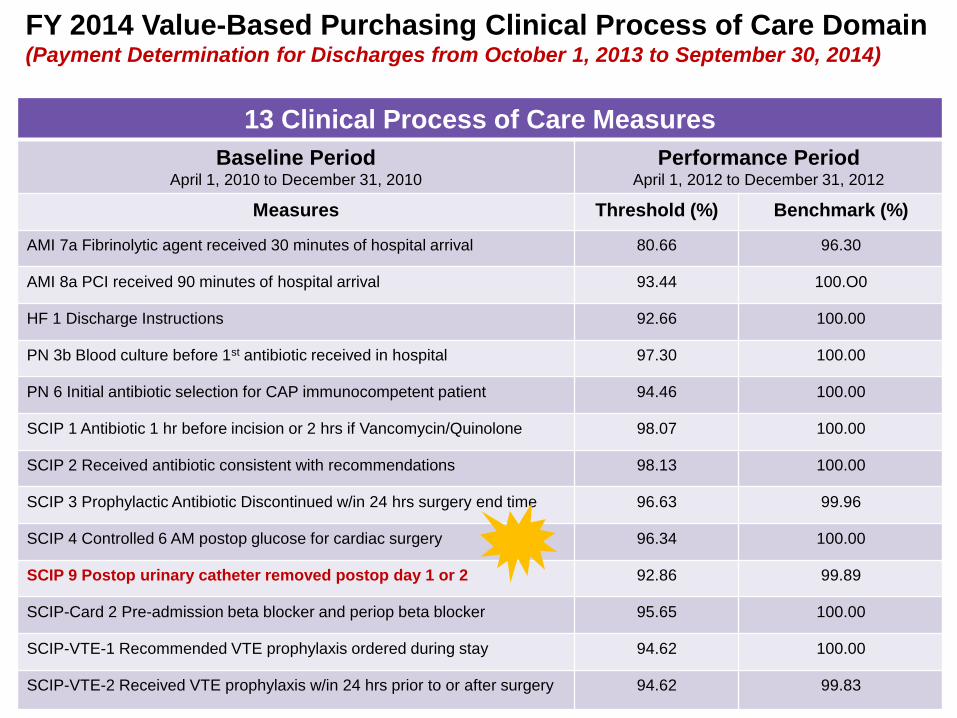
FY 2014 Value-Based Purchasing Clinical Process of Care Domain (Payment Determination for Discharges from October 1, 2013 to September 30, 2014)
- 13 -
13 Clinical Process of Care Measures
Baseline Period April 1, 2010 to December 31, 2010
Performance Period April 1, 2012 to December 31, 2012
Measures Threshold (%) Benchmark (%)
AMI 7a Fibrinolytic agent received 30 minutes of hospital arrival 80.66 96.30
AMI 8a PCI received 90 minutes of hospital arrival 93.44 100.O0
HF 1 Discharge Instructions 92.66 100.00
PN 3b Blood culture before 1st antibiotic received in hospital 97.30 100.00
PN 6 Initial antibiotic selection for CAP immunocompetent patient 94.46 100.00
SCIP 1 Antibiotic 1 hr before incision or 2 hrs if Vancomycin/Quinolone 98.07 100.00
SCIP 2 Received antibiotic consistent with recommendations 98.13 100.00
SCIP 3 Prophylactic Antibiotic Discontinued w/in 24 hrs surgery end time 96.63 99.96
SCIP 4 Controlled 6 AM postop glucose for cardiac surgery 96.34 100.00
SCIP 9 Postop urinary catheter removed postop day 1 or 2 92.86 99.89
SCIP-Card 2 Pre-admission beta blocker and periop beta blocker 95.65 100.00
SCIP-VTE-1 Recommended VTE prophylaxis ordered during stay 94.62 100.00
SCIP-VTE-2 Received VTE prophylaxis w/in 24 hrs prior to or after surgery 94.62 99.83

FY 2014 Value-Based Purchasing Outcome Domain (Payment Determination for Discharges from October 1, 2013 to September 30, 2014)
- 14 -
Three Outcome of Care Mortality Measures
Baseline Period July 1, 2009 to June 30, 2010
Performance Period July 1, 2011 to June 30, 2012
Measures Threshold (%) Benchmark (%)
Acute MI 30-day Mortality Rate 84.77 86.73
Heart Failure 30-day Mortality Rate 88.61 90.42
Pneumonia 30-day Mortality Rate 88.18 90.21
All New for FY 2014

Upcoming Shifts in Domain Weighting
- 15 -
Clinical Process of Care 20%
Patient Experience
of Care 30%
Outcome 30%
Efficiency 20%
FY 2014 FY 2015
Clinical Process of Care
45%
Patient Experience
of Care 30%
Outcome 25%
Established in the FY 2013 IPPS/LTCH IPPS Final Rule
Hospitals must have sufficient data in at least two domains to calculate a total performance score

FY 2015 Value-Based Purchasing Experience of Care Domain (Payment Determination for Discharges from October 1, 2014 to September 30, 2015)
- 16 -
* No change in measures but
Communication with Nurses
had the largest increase in Floor
values (up 4.93 percentage points)
8 Patient Experience of Care Measures
Baseline Period January 1, 2011 to December 31, 2011
Performance Period January 1, 2013 to December 31, 2013
HCAHPS Survey
Dimensions Floor(%) Threshold (%) Benchmark (%)
Communication
with Nurses
47.77 76.56 85.70
Communication with
Doctors
55.62 79.88 88.79
Responsiveness of
hospital staff
35.10 63.17 79.06
Pain management 43.58 69.46 78.17
Communications
about medications
35.48 60.89 71.85
Cleanliness and
quietness
41.94 64.07 78.90
Discharge
information
57.67 83.54 89.72
Overall rating of
hospital
32.82 67.96 83.44
Established in the FY 2013 IPPS/LTCH PPS Final Rule
Clinical Process of Care 20%
Experience of Care
30%
Outcome 30%
Efficiency 20%

FY 2015 Value-Based Purchasing Clinical Process of Care Domain (Payment Determination for Discharges from October 1, 2014 to September 30, 2015)
- 17 -
12 Clinical Process of Care Measures
Baseline Period January 1, 2011 to December 31, 2011
Performance Period January 1, 2013 to December 31, 2013
Measures Threshold (%) Benchmark (%)
AMI 7a Fibrinolytic agent received 30 minutes
of hospital arrival
80.00 100.00
AMI 8a PCI received 90 minutes of arrival 95.34 100.O0
HF 1 Discharge Instructions 92.09 100.00
PN 3b Blood culture before 1st antibiotic
received in hospital
94.11 100.00
PN 6 Initial antibiotic selection for CAP
immunocompetent patient
97.78 100.00
SCIP 1 Antibiotic 1 hr before incision or 2 hrs if
Vancomycin/Quinolone
97.17 100.00
SCIP 2 Received antibiotic consistent with
recommendations
98.63 100.00
SCIP 3 Prophylactic Antibiotic Discontinued
w/in 24 hrs surgery end time
98.63 100.00
SCIP 4 Controlled 6 AM postop glucose for
cardiac surgery
97.49 100.00
SCIP 9 Postop urinary catheter removed
postop day 1 or 2
95.79 99.76
SCIP-Card 2 Pre-admission beta blocker and
periop beta blocker
95.91 100.00
SCIP-VTE-1 Recommended VTE
prophylaxis ordered during stay
94.62 100.00
SCIP-VTE-2 Received VTE prophylaxis w/in 24 hrs
prior to or after surgery
94.89 99.99
SCIP VTE 1 removed
from FY 2015 Measures
Established in the FY 2013 IPPS/LTCH PPS Final Rule
Clinical Process of Care 20%
Experience of Care
30%
Outcome 30%
Efficiency 20%

- 18 -
Three Outcome of Care Mortality Measures
Baseline Period October 1, 2010 to June 30, 2011
Performance Period October 1, 2012 to June 30, 2013
Measures Threshold (%) Benchmark (%)
Acute MI 30-day Mortality Rate 84.7472 86.2371
Heart Failure 30-day Mortality Rate 88.1510 90.0315
Pneumonia 30-day Mortality Rate 88.2651 90.4181
FY 2015 Value-Based Purchasing Outcome Domain (Payment Determination for Discharges from October 1, 2014 to September 30, 2015)
New! One Complication/Patient Safety Measure
Baseline Period October 15, 2010 to June 30, 2011
Performance Period October 15, 2012 to June 30, 2013
Measures Threshold Benchmark (%)
AHRQ PSI-90 Composite .622879 .451792
New! One Hospital Acquired Infection Measure
Baseline Period January 1, 2011 to December 31, 2011
Performance Period February 1, 2013 to December 31, 2013
Measures Threshold Benchmark (%)
CLABSI (Standardized infection ratio) .4370 00.00
Established in the FY 2013 IPPS/LTCH PPS Final Rule
Clinical Process of Care 20%
Experience of Care
30%
Outcome 30%
Efficiency 20%

FY 2015 Value-Based Purchasing Efficiency Domain (Payment Determination for Discharges from October 1, 2014 to September 30, 2015)
Clinical Process of Care 20%
Experience of Care
30%
Outcome 30%
Efficiency 20%
- 19 -
New! One Cost of Care Efficiency Measure
Baseline Period May 1, 2011 to December 31, 2011
Performance Period May 1, 2013 to December 31, 2013
Measures Threshold (%) Benchmark (%)
MSPB-1 Medicare
spending per
beneficiary
Median Medicare
spending per
beneficiary ratio
across all
hospitals during
performance
period
Mean of 10th
percentile of
Medicare
spending per
beneficiary ratios
across all
hospitals during
performance
period
Established in the FY 2013 IPPS/LTCH PPS Final Rule

Changing Shifts in Domain Weighting
- 20 -
Clinical Process of Care 20%
Patient Experience
of Care 30%
Outcome 30%
Efficiency 20%
FY 2015
Clinical Process of Care
10%
Patient Experience
of Care 25%
Outcome 40%
Efficiency 25%
FY 2016
Hospitals must have sufficient data in at least two domains to calculate a total performance score

- 21 -
FY 2016 VBP
8 Patient Experience of Care Measures
Baseline Period January 1, 2012 to December 31, 2012
Performance Period January 1, 2014 to December 31, 2014
HCAHPS Survey
Dimensions Floor(%) Threshold (%) Benchmark (%)
Communication with
Nurses
53.99 77.67 86.07
Communication with
Doctors
57.01 80.40 88.56
Responsiveness of
hospital staff
38.21 64.715 79.76
Pain management 48.96 70.18 78.16
Communications
about medications
34.61 62.33 72.77
Cleanliness and
quietness
43.08 64.95 79.10
Discharge
information
61.36 84.70 90.39
Overall rating of
hospital
34.95 69.32 83.97
Final Changes for FY 2016 VBP Experience of Care (Payment Determination for Discharges from October 1, 2015 to September 30, 2016)
Clinical Process of Care
10%
Patient Experience
of Care 25%
Outcome 40%
Efficiency 25%

(Payment Determination for
Discharges from October 1,
2015 to September 30, 2016)
- 22 -
FY 2016 Value Based Purchasing
8 Clinical Process of Care Measures
Baseline Period January 1, 2012 to December 31, 2012
Performance Period January 1, 2014 to December 31, 2014
Measures Threshold (%) Benchmark (%)
IMM-2 Influenza Immunization 90.607 98.875
AMI 7a Fibrinolytic agent received 30 minutes of
hospital arrival
91.154 100.00
PN 6 Initial antibiotic selection for CAP
immunocompetent patient
96.552 100.00
SCIP Inf-2 Received antibiotic consistent with
recommendations
99.074 100.00
SCIP Inf-3 Prophylactic Antibiotic Discontinued
w/in 24 hrs surgery end time
98.086 100.00
SCIP 9 Postop urinary catheter removed postop
day 1 or 2
97.059 100.00
SCIP-Card 2 Pre-admission beta blocker and
periop beta blocker
97.727 100.00
SCIP-VTE-2 Received VTE prophylaxis w/in 24 hrs
prior to or after surgery
98.225 100.00
AMI 8a PCI received 90 minutes of hospital
arrival
----- ------
HF 1 Discharge Instructions ----- ------
PN 3b Blood culture before 1st antibiotic
received in hospital
----- ------
SCIP 1 Antibiotic 1 hr before incision or 2 hrs if
Vancomycin/Quinolone
----- ------
SCIP-4 Controlled Glucose 6 AM post cardiac
surgery
----- ------
Five Measures to be removed
from FY 2016 VBP calculations.
AMI 8a and SCIP-Inf-1 have
topped out and HF 1 and PN 3b
have insufficient evidence to link
process to improved outcomes
NEW! Clinical Process of Care
10%
Patient Experience
of Care 25%
Outcome 40%
Efficiency 25%

Clinical Process of Care
10%
Patient Experience
of Care 25%
Outcome 40%
Efficiency 25%
Final Changes for FY 2016 VBP Outcome Domain (Payment Determination for Discharges from October 1, 2015 to September 30, 2016)
- 23 -
Baseline and performance values for
Hospital Acquired Infections posted in
Proposed 2014 OPPS rule to be
Finalized November 2013
Three Hospital Acquired Infection Outcome Measures
Baseline Period January 1, 2012 to December 31, 2012
Performance Period January 1, 2014 to December 31, 2014
Measures Threshold Benchmark (%)
CLABSI (Standardized infection ratio of
reliability-adjusted methodology) 0.465 00.00
Catheter-Associated UTI (CAUTI) 0.801 00.00
Surgical Site Infection (weighted average
of measure strata for colon surgery and
abdominal hysterectomy)
0.668 Colon
0.752 Hysterectomy
00.00 Colon
00.00 Hysterectomy
One Complication/Patient Safety Outcome Measure
Baseline Period October 15, 2010 to June 30, 2011
Performance Period October 15, 2012 to June 30, 2014
Measures Threshold Benchmark
AHRQ PSI Composite .622879 .451792
Three Outcome of Care Mortality Measures
Baseline Period October 1, 2010 to June 30, 2011
Performance Period October 1, 2012 to June 30, 2014
Measures Threshold (%) Benchmark (%)
Acute MI 30-day Mortality Rate 84.7472 86.2371
Heart Failure 30-day Mortality Rate 88.1510 90.0315
Pneumonia 30-day Mortality Rate 88.2651 90.4181

Surgical Site Infection Scoring
Weighted by Stratum
SSI-Colon
• 5 improvement points
• 1.0 predicted infections
SSI-Abdominal Hysterectomy
• 8 achievement points
• 2.0 predicted infections
- 24 -
((5 * 1.0) + (8 * 2.0)) / (1.0 + 2.0) = 7 points

One Cost of Care Efficiency Measure
Baseline Period January 1, 2012 to December 31, 2012
Performance Period January 1, 2014 to December 31, 2014
Measures Threshold (%) Benchmark (%)
MSPB-1 Medicare spending per beneficiary Median Medicare
spending per
beneficiary ratio
across all hospitals
during performance
period
Mean of lowest 10th
percentile of
Medicare spending
per beneficiary
ratios across all
hospitals during
performance period
- 25 -
No Changes other than new baseline
and performance period
Final Changes for FY 2016 VBP Efficiency Domain (Payment Determination for Discharges from October 1, 2015 to September 30, 2016)
Clinical Process of Care
10%
Patient Experience
of Care 25%
Outcome 40%
Efficiency 25%
During the period January 1, 2012 through December 31,
2012, the Achievement threshold would have been an
MSPB ratio of 0.98, which corresponds to a standardized,
risk-adjusted MSPB amount of $18,412, and the Benchmark
would have been 0.82, which corresponds to an MSPB
amount of $15,311.

- 26 -
FY 2017 Hospital VBP Program
Baseline Period October 1, 2010 to June 30, 2012
Performance Period October 1, 2013 to June 30, 2015
Measures Threshold (%) Benchmark (%)
Acute MI 30-day Mortality Rate 0.851458 0.871669
Heart Failure 30-day Mortality Rate 0.881794 0.903985
Pneumonia 30-day Mortality Rate 0.882986 0.908124
AHRQ PSI-90 Complication Composite 0.577321 0.397051
Baseline and Performance Periods
are the same for Mortality and AHRQ Composite
Performance Standards and Reporting Periods
for FY 2017

- 27 -
FY 2018 Hospital VBP Program – Mortality
Baseline Period October 1, 2009 to June 30, 2012
Performance Period October 1, 2013 to June 30, 2016
Measures Threshold (%) Benchmark (%)
Acute MI 30-day Mortality Rate 0.850916 0.873053
Heart Failure 30-day Mortality Rate 0.883421 0.907656
Pneumonia 30-day Mortality Rate 0.882860 0.907900
Baseline and Performance Periods
are the different for Mortality and AHRQ Composite
FY 2018 Hospital VBP Program – AHRQ Composite
Baseline Period July 1, 2010 to June 30, 2012
Performance Period July 1, 2014 to June 30, 2016
Measures Threshold (%) Benchmark (%)
AHRQ PSI-90 Composite
Complication/patient safety for selected
indicators
0.582626 0.398030
Performance Standards and Reporting Periods
for FY 2018

Performance Standards and Reporting Periods
for FY 2019
- 28 -
FY 2019 Hospital VBP Program – Mortality
Baseline Period July 1, 2009 to June 30, 2012
Performance Period July 1, 2014 to June 30, 2017
Measures Threshold (%) Benchmark (%)
Acute MI 30-day Mortality Rate 0.850671 0.873263
Heart Failure 30-day Mortality Rate 0.883472 0.908094
Pneumonia 30-day Mortality Rate 0.882334 0.907906
FY 2019 Hospital VBP Program – AHRQ Composite
Baseline Period Pending future rule
Performance Period Pending future rule
Measures Threshold (%) Benchmark (%)
AHRQ PSI-90 Composite
Complication/patient safety for selected
indicators
Pending future rule Pending future rule
Baseline and Performance Periods
for AHRQ Composite pending future rule making

VBP Domain Structure for FY 2017
Alignment of VBP Domains with the Six National Quality Strategy Priorities
1. Making care safer
2. Engaging patients and families
3. Effective communication and coordination of care
4. Effective prevention and treatment practices
5. Working with communities to promote health
6. Making care more affordable
- 29 -
www.ahrq.gov/workingforquality/nqs/nqs2012annlrpt.pdf
Clinical
Care
Person
Centered
Efficiency Safety

New Measures and Domains for FY 2017
Value Based Purchasing Aligns with National Quality Strategy Domains
- 30 -
Experience & Coordination
of Care 25%
Safety 15%
Clinical Care Outcomes
25%
Clinical Care Process
10%
Efficiency & Cost
Reduction 25%
HCAHPS Survey
• CAUTI
• CLABSI
• SSI
• AHRQ PSI 90
• MSPB-1
• AMI-7a
• IMM-2
• PN-6
• SCIP-Inf-2
• SCIP-Inf-3
• SCIP-Inf-9
• SCIP-Card-2
• SCIP-VTE-2
• Mort-30-AMI
• Mort-30-HF
• Mort-30-PN

Possible Measures Being Considered in Future Rule Making
for Value Based Purchasing Program
Outcome Domain
Methicillin-resistant
Staphylococcus aureus (MRSA)
Bacteremia
Clostridium difficile (C. difficile)
Efficiency Domain
• Rate and/or dollar amount of
billing hospital inpatient services
to Medicare Part B subsequent
to the denial of a Part A hospital
inpatient claim
• Additional Medicare spending
specific to physician services
that occur during a hospital stay
• Radiology
• Anesthesiology
• Pathology
- 31 -
No measure changes finalized for FY 2017

Future Changes to Performance and Baseline
Periods for Outcome Domain
- 32 -
FY 2017 Hospital Value Based Purchasing Program
Domain Baseline Period Performance Period
Outcome
• Mortality
• AHRQ PSI Composite
October 1, 2010 to June 30, 2012
October 1, 2010 to June 30, 2012
October 1, 2013 to June 30, 2015
October 1, 2013 to June 30, 2015
FY 2018 Hospital Value Based Purchasing Program
Domain Baseline Period Performance Period
Outcome
• Mortality
• AHRQ PSI Composite
October 1, 2009 to June 30, 2012
July 1, 2010 to June 30, 2012
October 1, 2013 to June 30, 2016
July 1, 2014 to June 30, 2016
FY 2019 Hospital Value Based Purchasing Program
Domain Baseline Period Performance Period
Outcome
• Mortality
• AHRQ PSI Composite
Pending future rule-making
Pending future rule-making
Pending future rule-making
Pending future rule-making

Change to Disaster Extraordinary
Circumstances Waivers
1. Submit a waiver request to the
Hospital IQR Program within 30 days
of disaster
2. Note you also seek a waiver from the
Hospital VBP program for the program
year in which the same data could be
used as the VBP performance data
3. Submit evidence of your extraordinary
circumstance to “forestall the
possibility of hospitals attempting to
game their VBP scores”
- 33 -
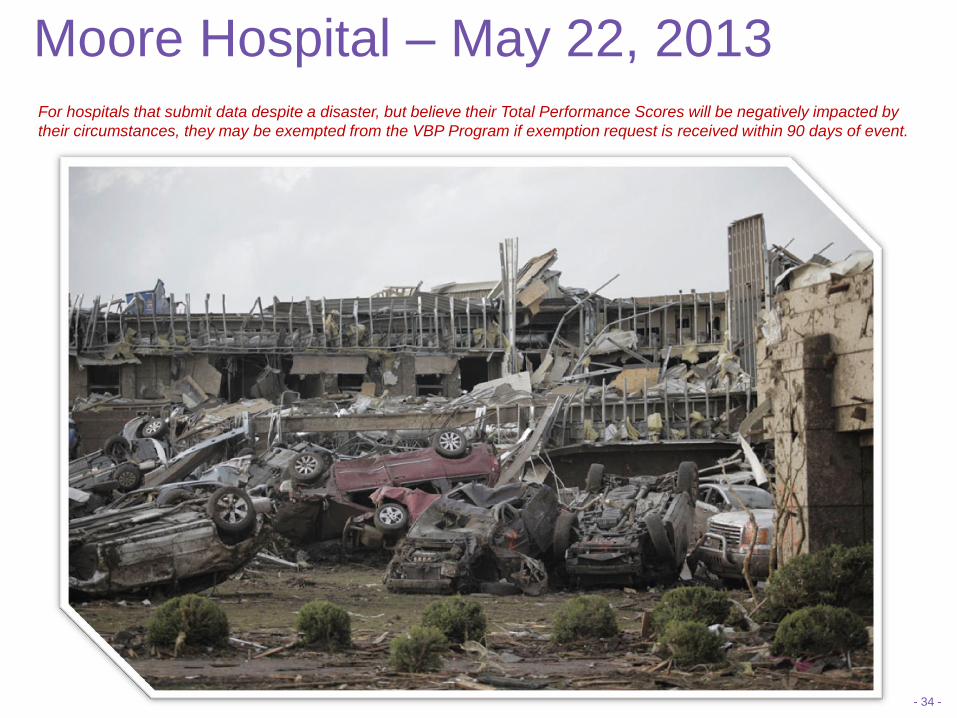
Moore Hospital – May 22, 2013
- 34 -
For hospitals that submit data despite a disaster, but believe their Total Performance Scores will be negatively impacted by
their circumstances, they may be exempted from the VBP Program if exemption request is received within 90 days of event.

FY 2016 VBP Scoring Methodology
- 35 -
• No changes in scoring methodology!
• Maryland Hospitals remain exempt

So How Does CMS Spin This?
- 36 -

HCAHPS Consistency Points
HCAHPS Measures are assigned Achievement and
Improvement Points like the clinical measures
In addition, hospitals can earn anywhere from 0-20 points for
consistency in their HCAHPS scores
Consistency points are awarded proportionately based on the
single lowest of a hospital’s eight HCAHPS dimension scores
during the performance period compared to the national floor
for that specific dimension

HCHAPS Consistency Points
• If all the hospital’s dimensions score higher than the
Achievement Thresholds for each dimension the hospital
gets 20 consistency points
• That is, if the lowest hospital dimension score is at or
greater than the corresponding achievement threshold,
all 20 points are awarded
20th Annual MIDAS+ User Symposium • May 22–25, 2011 • Tucson, Arizona
HCAHPS Dimensions Hospitals Performance Period Values CMS achievement threshold
HCAHPS1 - Nurse Communication (% Always) 76% 75.18%
HCAHPS2 - Doctor Communication (% Always) 80% 79.42%
HCAHPS3 - Cleanliness and quietness (% Always) 64% 62.80%
HCAHPS4 - Responsiveness of hospital staff (% Always) 63% 61.82%
HCAHPS5 - Pain management (% Always) 69% 68.75%
HCAHPS6 - Communication about Medications (% Always) 60% 59.28%
HCAHPS7 - Discharge information (% Always) 82% 81.93%
HCAHPS8 - Overall rating 67% 66.02%

HCHAPS Consistency Points
• If any one of the HCAHPS dimensions scores are lower
than “the Floor” value (zero percentile of baseline), the
hospital receives zero consistency points
20th Annual MIDAS+ User Symposium • May 22–25, 2011 • Tucson, Arizona
HCAHPS Dimensions Hospitals Performance Period
Values CMS achievement
threshold Floor (CMS Minimum)
HCAHPS1 - Nurse Communication (% Always) 45% 75.18% 38.98
HCAHPS2 - Doctor Communication (% Always) 50% 79.42% 51.51
HCAHPS3 - Cleanliness and quietness (% Always) 64% 62.80% 36.88
HCAHPS4 - Responsiveness of hospital staff (% Always) 63% 61.82% 30.25
HCAHPS5 - Pain management (% Always) 69% 68.75% 34.76 HCAHPS6 - Communication about Medications (% Always) 60% 59.28% 29.27
HCAHPS7 - Discharge information (% Always) 82% 81.93% 50.47
HCAHPS8 - Overall rating 67% 66.02% 29.32

HCHAPS Consistency Points
• If the lowest score is less than the achievement
threshold, but higher than the floor, then the consistency
points are based on the distance between the
achievement threshold and the floor for that dimension.
20th Annual MIDAS+ User Symposium • May 22–25, 2011 • Tucson, Arizona
HCAHPS Dimensions Hospitals Performance Period
Values CMS achievement
threshold Floor (CMS Minimum)
HCAHPS1 - Nurse Communication (% Always) 76% 75.18% 38.98
HCAHPS2 - Doctor Communication (% Always) 80% 79.42% 51.51
HCAHPS3 - Cleanliness and quietness (% Always) 64% 62.80% 36.88
HCAHPS4 - Responsiveness of hospital staff (% Always) 63% 61.82% 30.25
HCAHPS5 - Pain management (% Always) 69% 68.75% 34.76 HCAHPS6 - Communication about Medications (% Always) 58% 59.28% 29.27
HCAHPS7 - Discharge information (% Always) 82% 81.93% 50.47
HCAHPS8 - Overall rating 67% 66.02% 29.32

Formulas for Calculating HCHAPS
Consistency Points
Step 1: Calculate the “lowest dimension score” for the
lowest value across all eight HCHAPS dimensions
((Hospital’s performance period score – floor)/
(achievement threshold – floor))
20th Annual MIDAS+ User Symposium • May 22–25, 2011 • Tucson, Arizona
Example: ((.58 – .2927)/(.5928 - .2927)) = .9573

Formulas for Calculating HCHAPS
Consistency Points
Step 2: Calculate HCHAPS Consistency Points using the
“Lowest Dimension Score” Calculated in Step 1
(20 * lowest dimension score) – 0.5 = Consistency Points (rounded to nearest whole number)
20th Annual MIDAS+ User Symposium • May 22–25, 2011 • Tucson, Arizona
Example: (20 * (.9573) – 0.5) = 18.64 = 19 Consistency Points

HCHAPS Consistency Points
• If two or more HCAHPS dimensions scores are lower
than the Achievement threshold, the measure that is
closest to the “floor” value is used for the calculation of
the “lowest dimension score”
20th Annual MIDAS+ User Symposium • May 22–25, 2011 • Tucson, Arizona
HCAHPS Dimensions Hospitals Performance Period
Values CMS achievement
threshold Floor (CMS Minimum)
HCAHPS1 - Nurse Communication (% Always) 45% 75.18% 38.98
HCAHPS2 - Doctor Communication (% Always) 52% 79.42% 51.51
HCAHPS3 - Cleanliness and quietness (% Always) 64% 62.80% 36.88
HCAHPS4 - Responsiveness of hospital staff (% Always) 63% 61.82% 30.25
HCAHPS5 - Pain management (% Always) 69% 68.75% 34.76 HCAHPS6 - Communication about Medications (% Always) 60% 59.28% 29.27
HCAHPS7 - Discharge information (% Always) 82% 81.93% 50.47
HCAHPS8 - Overall rating 67% 66.02% 29.32
52-51.51 = .49
45-38.98 = 6.02

Tally Up All HCAHPS Points
1. For each of the eight dimensions, determine the larger of
the achievement or improvement scores
2. Sum these eight values to arrive at a 0-80 HCAHPS base
score
3. Calculate the 0-20 HCAHPS Consistency Score
4. Sum base score and consistency score
HCAHPS total earned points = HCAHPS base score + consistency score
20th Annual MIDAS+ User Symposium • May 22–25, 2011 • Tucson, Arizona

Calculate Total VBP Points 1. For each of the 8 Core Process Measures, determine the larger of the
achievement or improvement scores and find the sum
2. Multiply the sum of the clinical process domain by .10
3. For each of the 8 Outcome Measures (SSI strata each count as 1),
determine the larger of the achievement or improvement scores and
find the sum
4. Multiply the sum of the outcome domain by .40
5. Determine the larger of the achievement or improvement score for the
Medicare Efficiency Domain and multiple by .25
6. Multiply the HCAHPS Total Earned Points by .25
7. Sum the weighted scores together to get your Total Performance
Score (TPS).
TPS= (Sum of Process Domain Scores * .10) + (Sum of Outcome Domain Scores * .40) +
(Efficiency Domain Score * .25) + (HCAHPS Total Earned Points * .25)

How Do Points Impact Hospitals Financially?
• All hospitals will contribute 1.25% of their base operating DRG
Payment Amount in FY 2014
• VBP incentive dollars will be distributed back to hospitals based on a
linear distribution of all VBP scores nationally
• The best hospital in the nation would receive 1.817 percent extra DRG
reimbursement
• The worst hospital in the nation would receive only a 0.0236 increase
• Note this is separate from the Medicare Annual Payment Updates tied
to Hospital Inpatient Quality Reporting Program!
• Hospitals that lost their HIQR Annual Payment Update are exempt from
the VBP Program

Midas+ Value Based Purchasing Calculator
- 47 -

Shared Learning
• Submit questions or comments to [email protected]
• Download a copy of this presentation to share with others at your
organization!
• Midas+ Clients can download copy of the CMS Measure Matrix
- 48 -

CMS Measure Matrix
- 49 -

Midas+ Clients Only Website
- 50 -

See you for Part 3: Hospital Readmission Reduction Program