Hospital Value-Based Purchasing: Claims-Based Measures
43
Hospital Value-Based Purchasing: Claims-Based Measures January 20, 2015 2 P.M. ET
Transcript of Hospital Value-Based Purchasing: Claims-Based Measures
Hospital Value-Based Purchasing: Claims-Based Measures
January 20, 2015 2 P.M. ET

Objectives
Participants will be able to: • Summarize instructions on how to resubmit
claims; • Understand Hospital Specific Reports (HSRs)
for claims-based measures; • List items that may be requested during the
Claims-Based Review and Correction Period; and
• List items that may be requested during the Percentage Payment Summary Report Review and Correction Period.
015
1/20/2 2
How to Read a Hospital Specific Report
Hospital Value-Based Purchasing
Kayte Hennick, BA, Hospital Reporting, Reports and Analytics Contractor

Purpose
This presentation will explain how to read and interpret your Hospital Value-Based Purchasing (VBP) Hospital Specific Reports (HSRs) and explain the Claims-Based Measure Review and Corrections Process.
1/20/2015 4

Objectives
• Understand how to read and interpret results in HSRs.
• Learn about the Claims-Based Review and Corrections Process, including: How to submit a Review and Corrections
Request; What items can be submitted for Review and
Corrections; and Timeframe for submitting Review and
Corrections requests.
1/20/2015 5

AHRQ PSI-90 HOSPITAL-SPECIFIC REPORT
Hospital Value-Based Purchasing
1/20/2015 6

HVBP: AHRQ HSR
• AHRQ PSI-90 Composite Measure Composite value is a weighted average of eight individual Patient
Safety Indicators (PSIs), also referred to as “Component Measures” • PSI 03 – Pressure Ulcer • PSI 07 – Central Venous Catheter-Related Bloodstream Infections • PSI 08 – Postoperative Hip Fracture • PSI 12 – Postoperative Pulmonary Embolism or Deep Vein Thrombosis • PSI 13 – Postoperative Sepsis • PSI 14 – Postoperative Wound Dehiscence • PSI 15 – Accidental Puncture or Laceration
• HSR content: Hospital Results PSI Performance Discharge Information (for each PSI)
1/20/2015 7
HVBP: AHRQ HSR
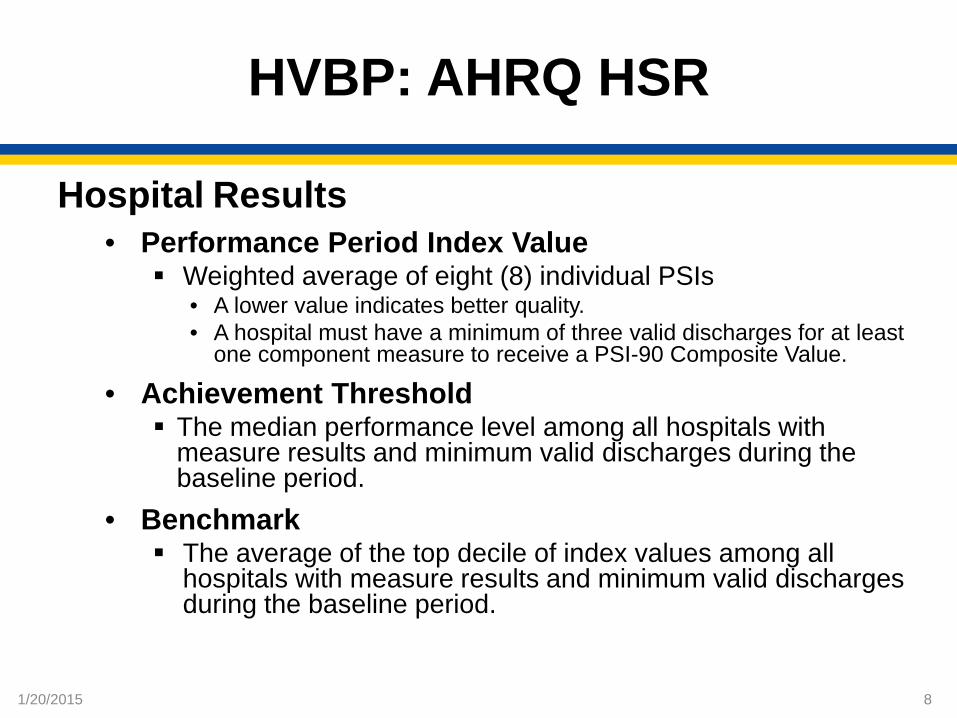
Hospital Results • Performance Period Index Value
Weighted average of eight (8) individual PSIs • A lower value indicates better quality. • A hospital must have a minimum of three valid discharges for at least
one component measure to receive a PSI-90 Composite Value.
• Achievement Threshold The median performance level among all hospitals with
measure results and minimum valid discharges during the baseline period.
• Benchmark The average of the top decile of index values among all
hospitals with measure results and minimum valid discharges during the baseline period.
1/20/2015 8
HVBP: AHRQ HSR
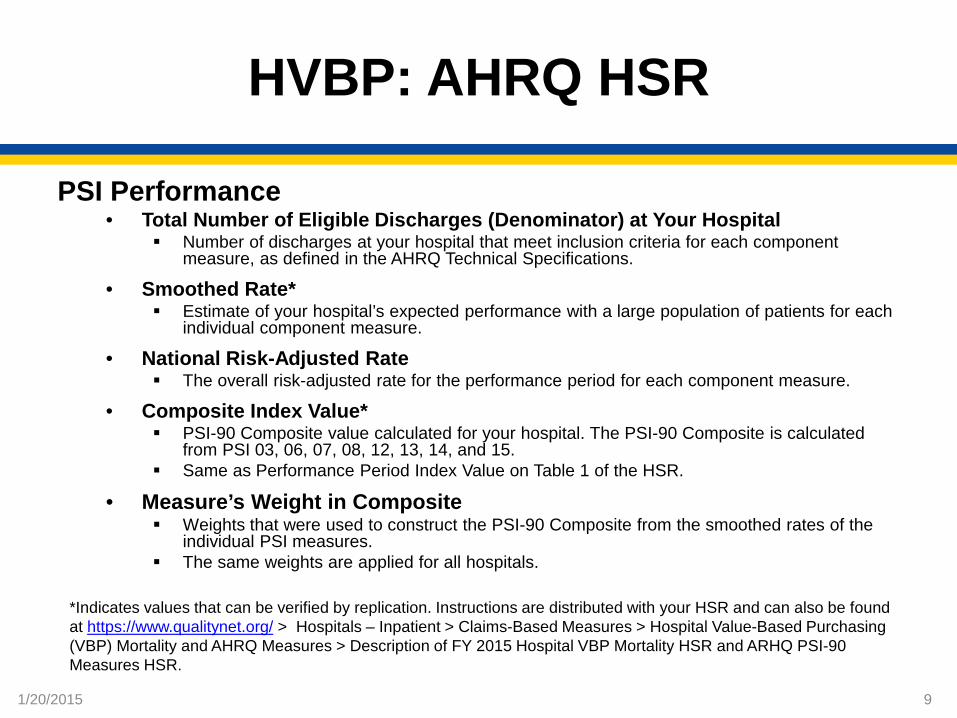
PSI Performance • Total Number of Eligible Discharges (Denominator) at Your Hospital
Number of discharges at your hospital that meet inclusion criteria for each component measure, as defined in the AHRQ Technical Specifications.
• Smoothed Rate* Estimate of your hospital’s expected performance with a large population of patients for each
individual component measure.
• National Risk-Adjusted Rate The overall risk-adjusted rate for the performance period for each component measure.
• Composite Index Value* PSI-90 Composite value calculated for your hospital. The PSI-90 Composite is calculated
from PSI 03, 06, 07, 08, 12, 13, 14, and 15. Same as Performance Period Index Value on Table 1 of the HSR.
• Measure’s Weight in Composite Weights that were used to construct the PSI-90 Composite from the smoothed rates of the
individual PSI measures. The same weights are applied for all hospitals.
*Indicates values that can be verified by replication. Instructions are distributed with your HSR and can also be found at https://www.qualitynet.org/ > Hospitals – Inpatient > Claims-Based Measures > Hospital Value-Based Purchasing (VBP) Mortality and AHRQ Measures > Description of FY 2015 Hospital VBP Mortality HSR and ARHQ PSI-90 Measures HSR.
2015 1/20/ 9

HVBP: AHRQ HSR
• Number of Outcomes (Numerator) Number of measure outcomes for each component measure, as defined in the AHRQ
Technical Specifications.
• Observed Rate* (Numerator/Denominator) x 1,000. Also referred to as the “raw rate.”
• Risk-Adjusted Rate* Estimate of your hospital’s performance on each component measure if your hospital
had an “average” patient case-mix, given your hospital’s actual performance.
• Expected Rate Your hospital’s expected performance on each component measure.
• Reliability Rate Weights that are used to construct the smoothed rate for each component measure. Reliability weights vary by hospital.
*Indicates values that can be verified by replication. Instructions are distributed with your HSR and can also be found at https://www.qualitynet.org/ > Hospitals – Inpatient > Claims-Based Measures > Hospital Value-Based Purchasing (VBP) Mortality and AHRQ Measures > Description of FY 2015 Hospital VBP Mortality HSR and ARHQ PSI-90 Measures HSR.
/2015
1/20 10

HVBP: AHRQ HSR
Discharge-Level Information • Only includes information on discharges that are
included in the numerator of one or more individual PSIs.
• Assists you in: Reviewing the discharges used in the measure calculations;
and Replicating your observed rate, risk-adjusted rate, smoothed
rate, and PSI-90 Composite Value.
1/20/2015 11
30-DAY MORTALITY HOSPITAL-SPECIFIC REPORT
Hospital Value-Based Purchasing
1/20/2015 12

HVBP: Mortality HSR
• Measures: Acute Myocardial Infarction (AMI) Heart Failure (HF) Pneumonia (PN)
• HSR Content: Hospital Results Additional Information Discharge Information (for each measure)
1/20/2015 13

HVBP: Mortality HSR
Hospital Results for Each Measure • Number of eligible discharges
On the Discharge Table, the number of stays where Index Stay = YES.
• Performance Period Survival Rate Can be replicated with the information within the Additional
Information Table and the measure-specific Discharge Table. This is the result that is used to calculate the achievement and
improvement points.
• Achievement Threshold Median survival rate among all hospitals with measure results
and minimum case size, during the baseline period.
• Benchmark Mean survival rate of the hospitals in the top performing decile,
during the baseline period.
1/20/2015 14

HVBP: Mortality HSR
Additional Information Table • This table contains supplemental information for use in replicating expected and
predicted deaths, including: Number of Eligible Discharges Predicted Deaths
• Number of deaths predicted within 30 days of admission to your hospital, based on your hospital’s performance with your case mix and your hospital’s estimated effect on mortality.
Expected Deaths • Number of deaths expected within 30 days of admission to your hospital, based on the average
hospital’s performance with your case mix and the average hospital effect on mortality.
National Crude Mortality Rate • The national observed mortality rate (within 30 days of admission). • This doesn’t account for risk factors.
Risk-Standardized Mortality Rate (RSMR) • (Predicted Deaths/Expected Deaths)*National Crude Mortality Rate. • Lower values are better.
Performance Period Survival Rate • Equal to 1 – RSMR. • Higher values are better because they correspond to lower mortality rates.
1/20/2015 15

HVBP: Mortality HSR
Discharges Level Information • The information on these tables is provided to aid hospitals
in locating the stays in internal records and to allow for replication of the results presented in the Hospital Results Table and the Additional Information Table. Replication instructions are detailed in the HSR description document).
• Important variables for replication: Index Stay (Yes/No)
• This variable indicates whether a stay is included in the measure calculation, only stays with ‘YES’ are included.
Risk Factors • These differ between measures. • Row eight (8) contains the model coefficients that are indicated in the
replication instructions. HOSP_EFFECT
• This is the estimated effect your hospital has on mortality. AVG_EFFECT
• This is the average hospital effect on mortality. 1/20/2015 16

CLAIMS-BASED MEASURES: REVIEW AND CORRECTIONS PERIOD
Hospital Value-Based Purchasing
1/20/2015 17
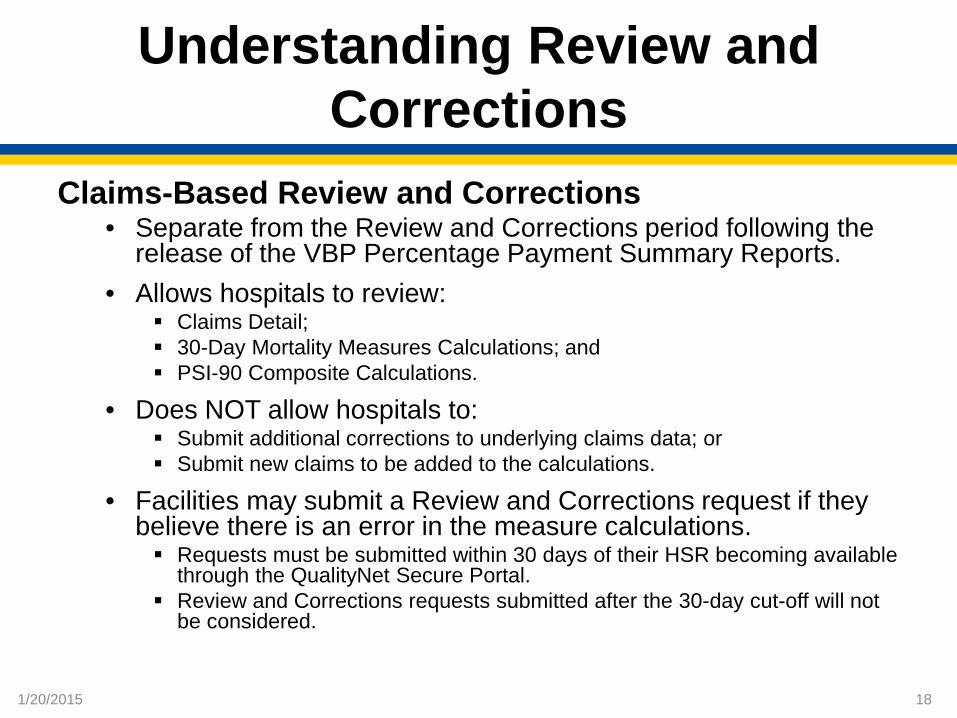
Understanding Review and Corrections
Claims-Based Review and Corrections • Separate from the Review and Corrections period following the
release of the VBP Percentage Payment Summary Reports. • Allows hospitals to review:
Claims Detail; 30-Day Mortality Measures Calculations; and PSI-90 Composite Calculations.
• Does NOT allow hospitals to: Submit additional corrections to underlying claims data; or Submit new claims to be added to the calculations.
• Facilities may submit a Review and Corrections request if they believe there is an error in the measure calculations. Requests must be submitted within 30 days of their HSR becoming available
through the QualityNet Secure Portal. Review and Corrections requests submitted after the 30-day cut-off will not
be considered.
1/20/2015 18
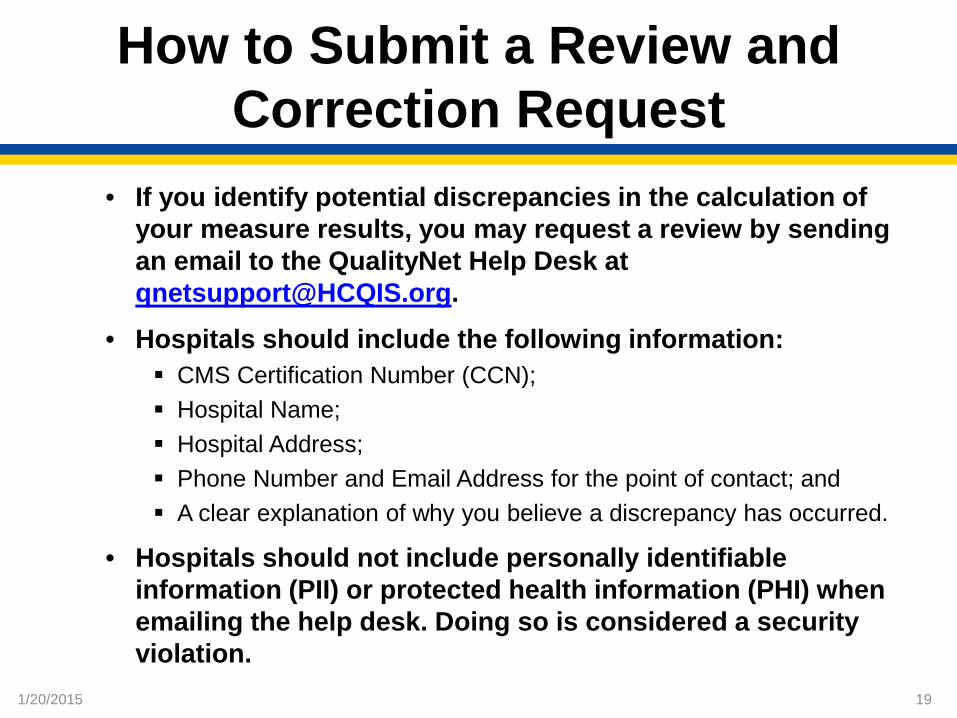
How to Submit a Review and Correction Request
• If you identify potential discrepancies in the calculation of your measure results, you may request a review by sending an email to the QualityNet Help Desk at [email protected].
• Hospitals should include the following information: CMS Certification Number (CCN); Hospital Name; Hospital Address; Phone Number and Email Address for the point of contact; and A clear explanation of why you believe a discrepancy has occurred.
• Hospitals should not include personally identifiable information (PII) or protected health information (PHI) when emailing the help desk. Doing so is considered a security violation.
5 1/20/201 19
RESOURCES
Claims-Based Measures
1/20/2015 20

Resources
• QualityNet Help Desk 866.288.8912 (TTY 877.715.6222) 7 a.m.–7 p.m. CST M-F [email protected] You will be asked to provide basic information such as name, practice, address, phone, and email.
• AHRQ Resources QualityNet
• Path: httsp://www.qualitynet.org > Hospitals – Inpatient > Claims-Based Measures > Agency for Healthcare Research and Quality (AHRQ) Indicators > Resources
• Link: https://www.qualitynet.org/dcs/ContentServer?c=Page&pagename=QnetPublic%2FPage%2FQnetTier4&cid=1228695355425
Quality Indicators Support • [email protected]
PSI Resources • http://www.qualityindicators.ahrq.gov/modules/psi_resources.aspx
• Mortality Resources QualityNet
• Path: httsp://www.qualitynet.org > Hospitals – Inpatient > Claims-Based Measures > Mortality Measures > Resources
• Link: https://www.qualitynet.org/dcs/ContentServer?c=Page&pagename=QnetPublic%2FPage%2FQnetTier3&cid=1163010398556
Questions about the 30-day mortality measures may be sent to [email protected]
1/20/2015 21

Medicare Spending Per Beneficiary (MSPB)
1/20/2015
Jennifer Podulka, MPAff, Acumen, LLC
22

MSPB Measure Definition
23 1/20/2015
• The MSPB Measure is a claims-based measure that includes price-standardized payments for all Part A and Part B services provided from 3 days prior to a hospital admission (index admission) through 30 days after the hospital discharge.
• MSPB episodes are risk adjusted.
• MSPB evaluates hospitals’ efficiency relative to the efficiency of the median hospital in the nation.
• MSPB is included in the HVBP Efficiency Domain.

Overview of HSRs
24 1/20/2015
• During the preview period, individual hospitals can review their MSPB measure in their HSR.
• Reports include six tables and are accompanied by three supplemental hospital-specific data files. Tables include the MSPB Measure results of the individual
hospital and of other hospitals in the state, and the nation.
Supplemental hospital-specific data files contain information on the admissions that were considered for the individual hospital’s MSPB measure and data on the Medicare payments (to individual hospitals and other providers) that were included in the measure.
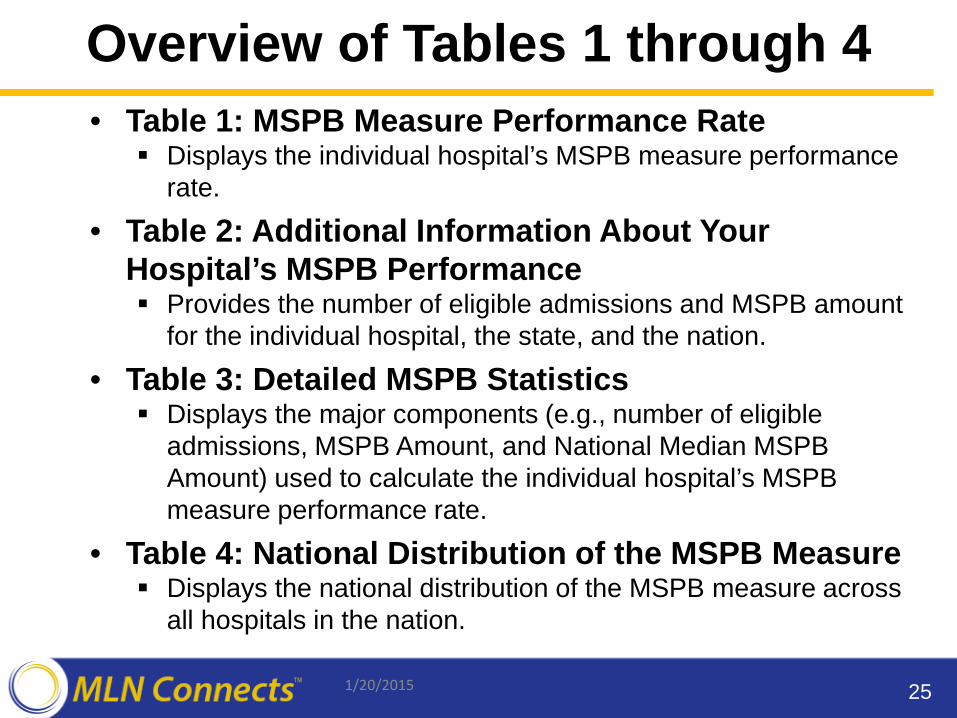
Overview of Tables 1 through 4
25 1/20/2015
• Table 1: MSPB Measure Performance Rate Displays the individual hospital’s MSPB measure performance
rate.
• Table 2: Additional Information About Your Hospital’s MSPB Performance Provides the number of eligible admissions and MSPB amount
for the individual hospital, the state, and the nation.
• Table 3: Detailed MSPB Statistics Displays the major components (e.g., number of eligible
admissions, MSPB Amount, and National Median MSPB Amount) used to calculate the individual hospital’s MSPB measure performance rate.
• Table 4: National Distribution of the MSPB Measure Displays the national distribution of the MSPB measure across
all hospitals in the nation.

Overview of Table 5: Spending Breakdown by Claim Type
26 1/20/2015
• Provides a detailed breakdown of the individual hospital’s spending for the following time periods: 3 Days Prior to Index Admission;
During-Index Admission; and
30 Days After Hospital Discharge.
• Spending levels are broken down by claim type within each of the time periods.
• Compares the percent of total average episode spending by claim type and time period at the individual hospital to the total average spending at hospitals in the state and the nation.

Table 5: Detailed MSPB Spending Breakdown by Claim Type (1 of 2)
Time Period: When in the episode the claim occurred.
Your Hospital Spending: Shows the amount and percent of total average episode spending for the individual hospital’s episodes in a given category and claim type.
Claim Type
Your Hospital Spending per
Episode
Your Hospital Percent of Spending
State Percent of Spending
Nation Percent of Spending
During-Index Admission
Total During-Index 6,687 41.23% 70.2% 54.1% Home Health Agency
47 0.29% 3.1% 0.0%
Hospice 75 0.46% 4.9% 0.0% Inpatient 5,262 32.45% 47% 46.3% Outpatient 0 0.00% 0.1% 0.0% Skilled Nursing Facility
340 2.10% 10% 0.0%
Durable Medical Equipment
76 0.47% 0.1% 0.1%
Carrier 887 5.47% 5.0% 7.7%
27 1/20/2015

Table 5: Detailed MSPB Spending Breakdown by Claim Type (2 of 2)
Percent of Total Average Spending in the Individual Hospital, State, and Nation A higher percent of spending in the individual hospital than the percent of spending in the state or nation means that for the given category and claim type, the individual hospital spends more than other hospitals in the state or the nation respectively.
Claim Type
Your Hospital Spending per
Episode
Your Hospital Percent of Spending
State Percent of Spending
Nation Percent of Spending
During-Index Admission
Total During-Index 6,687 41.23% 70.2% 54.1% Home Health Agency
47 0.29% 3.1% 0.0%
Hospice 75 0.46% 4.9% 0.0% Inpatient 5,262 32.45% 47% 46.3% Outpatient 0 0.00% 0.1% 0.0% Skilled Nursing Facility
340 2.10% 10% 0.0%
Durable Medical Equipment
76 0.47% 0.1% 0.1%
Carrier 887 5.47% 5.0% 7.7%
28 1/20/2015

Overview of Table 6: Spending Breakdown by Major Diagnostic Category (MDC)
• Provides a breakdown of the individual hospitals’ average actual and expected spending for an MSPB episode by Major Diagnostic Category (MDC).
• Compares the individual hospital’s average actual and expected spending to state and national average actual and expected spending.
29 1/20/2015

Table 6: Detailed MSPB Spending Breakdown by MDC (1 of 2)
30
MDC Number and Description
Hospital Spending: The individual hospital’s average and expected spending per episode for a given MDC
1/20/2015
MDC Description
(A) Your
Hospital Average
Spending per Episode
(B) Your
Hospital Average Expected Spending
per Episode
(C) State
Average Spending
per Episode
(D) State
Average Expected Spending
per Episode
(E) National Average
Spending per Episode
(F) National Average Expected Spending
per Episode
4 Respiratory System 14,585 16,444 16,324 15,565 16,593 16,711
5 Circulatory System 19,053 17,422 16,533 17,200 19,624 19,812 6 Digestive System 6,605 11,700 8,000 9,200 16,223 16,355

Table 6: Detailed MSPB Spending Breakdown by MDC (2 of 2)
31
Spending in the Individual Hospital’s State and Nation This table illustrates average spending values for the state and for the nation. For example, if the individual hospital has a lower value in Column B than in Column F, its patients have lower expected spending level than the Nation for that given MDC.
1/20/2015
MDC Description
(A) Your
Hospital Average
Spending per Episode
(B) Your
Hospital Average Expected Spending
per Episode
(C) State
Average Spending
per Episode
(D) State
Average Expected Spending
per Episode
(E) National Average
Spending per Episode
(F) National Average Expected Spending
per Episode
4 Respiratory System 14,585 16,444 16,324 15,565 16,593 16,711
5 Circulatory System 19,053 17,422 16,533 17,200 19,624 19,812 6 Digestive System 6,605 11,700 8,000 9,200 16,223 16,355

Overview of Supplemental Hospital-Specific Data Files
Each Hospital-Specific Report (HSR) is accompanied by three supplemental hospital-specific data files:
• Index Admission File Presents all inpatient admissions for the individual hospital in which
a beneficiary was discharged during the period of performance.
• Beneficiary Risk Score File Identifies beneficiaries and their health status based on the
beneficiary’s claims history in the 90 days prior to the start of an episode.
• MSPB Episode File Shows the type of care, spending amount, and top five providers in
each care setting for each MSPB episode.
32 1/20/2015

Review and Correction • Hospitals may preview their MSPB measure from
mid-May to mid-June 2015. • Data will be posted on Hospital Compare in October
2015. • During the preview period, hospitals may submit
questions or requests for correction to [email protected]. Please include your hospital’s CMS Certification Number (CCN).
• As with other claims-based measures, hospitals may NOT: Submit additional corrections to underlying claims data; or Submit new claims to be added to the calculations.
33 1/20/2015

Hospital Value-Based Purchasing
Percentage Payment Summary Report: Review and Correction Period
Bethany Wheeler Hospital VBP Program Support Contractor Lead
34
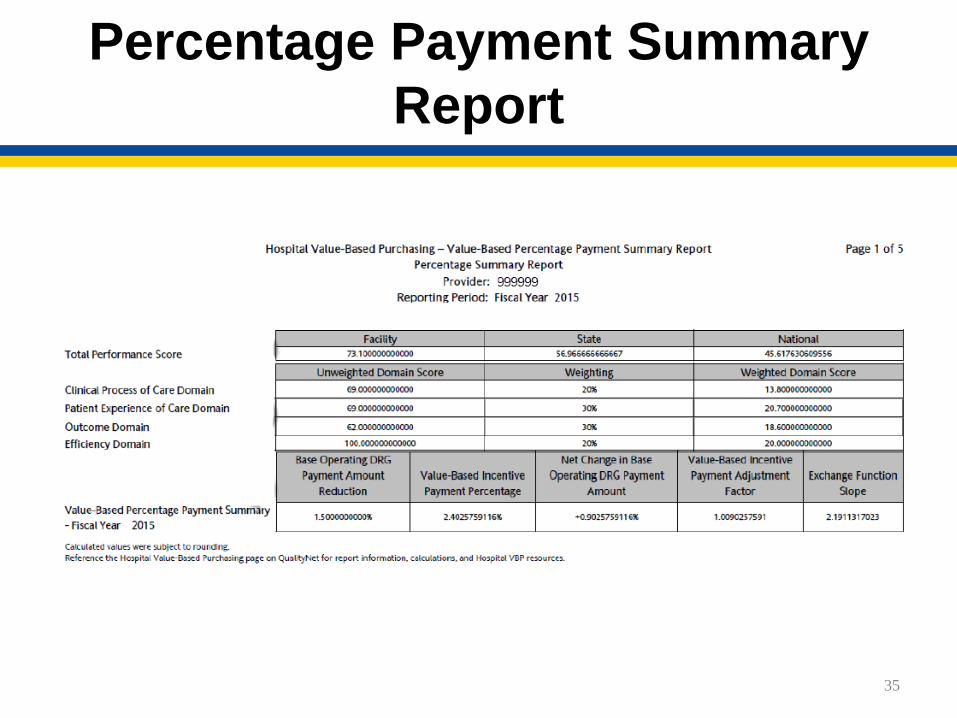
Percentage Payment Summary Report
35

Review and Corrections Period
Hospitals may review and request recalculation of scores on:
• Condition Score; • Domain Score; and • Total Performance Score.
Requests should be completed within 30 calendar days following the posting date of the Percentage Payment Summary Report (PPSR).
36

Understanding the PPSR Review and Correction Period
• What can be requested? Condition-Specific Score (CSS); Domain-Specific Score (DSS); and Total Performance Score (TPS).
• Does NOT allow hospitals to: Submit additional corrections to underlying
claims data; or Submit new claims to be added to the
calculations.
37
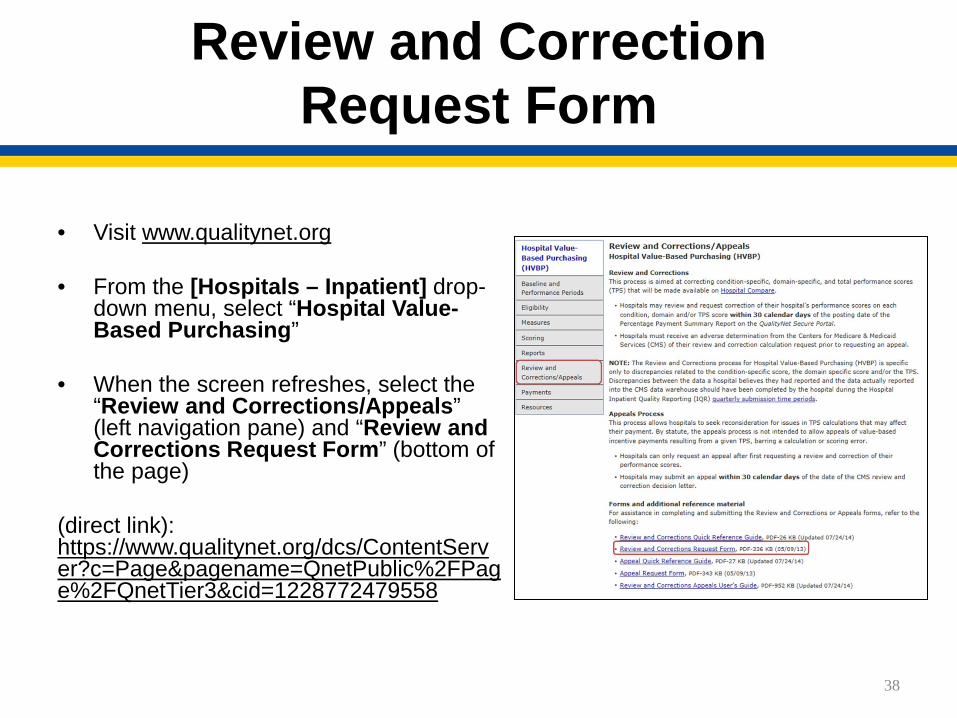
Review and Correction Request Form
• Visit www.qualitynet.org • From the [Hospitals – Inpatient] drop-
down menu, select “Hospital Value-Based Purchasing”
• When the screen refreshes, select the “Review and Corrections/Appeals” (left navigation pane) and “Review and Corrections Request Form” (bottom of the page)
(direct link): https://www.qualitynet.org/dcs/ContentServer?c=Page&pagename=QnetPublic%2FPage%2FQnetTier3&cid=1228772479558
38

Resources
• Review and Corrections Quick Reference Guide
• Review and Corrections Appeals User’s Guide
39

Hospital IQR Support Contractor
844.472.4477 or 866.800.8765
877.789.4443
[email protected] [email protected] [email protected]
https://cms-ip.custhelp.com
www.QualityReportingCenter.com
• Quality Reporting, Outreach & Education IPPS Hospitals Inpatient Psychiatric
Hospitals PPS-Exempt Cancer
Hospitals Critical Access Hospitals
1/20/2015 40
Hospital IQR Support
41
Q & A Tool Email Support Phone Support Inpatient Live Chat
Monthly Web Conferences Secure Fax Listserves Website
1/20/2015
Continuing Education Approval
• This program has been approved for 1.0 continuing education (CE) unit given by CE Provider #50-747 for the following professions: Florida Board of Nursing Florida Board of Clinical Social Work, Marriage and
Family Therapy and Mental Health Counseling Florida Board of Nursing Home Administrators Florida Council of Dietetics Florida Board of Pharmacy
• Professionals licensed in other states will receive a Certificate of Completion to submit to their licensing Boards.
1/20/2015 42

CE Credit Process
• Complete the WebEx survey you will receive by email within the next 48 hours or the one that will pop up after the webinar.
• The survey will ask you to log in or register to access your personal account in the Learning Management Center. A one-time registration process is required.
• Additional details are available at www.oqrsupport.com/hospitaloqr/education_continuing
1/20/2015 43
This material was prepared by the Inpatient Value, Incentives, and Quality Reporting Outreach and Education Support Contractor, under contract with the Centers for Medicare & Medicaid Services (CMS), an agency of the U.S. Department of Health and Human Services. HHSM-500-2013-13007I, FL-IQR-Ch8-01192015-03