Hospital payment and DRGs in Germany The G-DRG … · Hospital payment and DRGs in Germany ......
26
Hospital payment and DRGs in Germany The G-DRG system Dr. med. Wilm Quentin, MSc HPPF Department of Health Care Management (MiG) Berlin University of Technology European Observatory on Health Systems and Policies WHO Collaborating Centre for Health Systems, Research and Management
Transcript of Hospital payment and DRGs in Germany The G-DRG … · Hospital payment and DRGs in Germany ......

Hospital payment and DRGs in
Germany
The G-DRG system
Dr. med. Wilm Quentin, MSc HPPF
Department of Health Care Management (MiG)
Berlin University of Technology
European Observatory on Health Systems and Policies
WHO Collaborating Centre for Health Systems, Research and Management

Hospital facts (Data year 2012)
2
Size and type of
ownership
Hospitals overall Beds Beds per 100
000 inhabitants Occupancy Cases
Cases per 100
000 inhabitants ALOS*
Number
(Share in %)
Number
(Share in %) Number [%]
Number
(Share in %) Number Days
Hopital size in beds 2 017 501 475
624 77.4 18 620 442
22 775 7.6 (100) (100) (100)
< 49 440 7 718 10 63.2 217 689 271 8.2
50 - 99 256 18 621 23 63.2 544 041 677 9.3
100 - 149 260 31 768 40 63.2 1 051 335 1 307 8.4
150 - 199 183 31 707 39 63.2 1 166 329 1 450 7.5
200 - 299 282 69 351 86 63.2 2 527 629 3 143 7.6
300 - 399 203 69 665 87 63.2 2 577 787 3 206 7.7
400 - 499 139 62 223 77 63.2 2 310 371 2 873 7.6
500 - 599 90 48 998 61 63.2 1 990 302 2 475 7.0
600 - 799 71 48 347 60 63.2 1 814 064 2 256 7.6
> 800 93 113 077 141 63.2 4 410 556 5 485 7.5
Public hospitals 601 240 180
299 78.9 9 088 869
11 303 7.6 (29.8) (47.9) (48.8)
under private law 354 136 344 170 77.2 5 341 551 6 643 7.2
under public law 247 103 836 129 81.2 3 747 318 4 660 8.2
- legally dependent 108 34 344 43 80.8 1 148 692 1 428 8.8
- legally independent 139 69 492 86 81.3 2 598 626 3 232 8.0
Non-profit hospitals 719 171 276
213 75.9 6 408 575
7 970 7.4 (35.6) (34.2) (34.4)
Private hospitals 697 90 019
112 76.1 3 112 659
3 871 8.0 (34.6) (18.0) (16.7)

300
350
400
450
500
550
600
650
700
1995
1996
1997
1998
1999
2000
2001
2002
2003
2004
2005
2006
2007
2008
2009
2010
2011
Germany
Czech Republic
Austria
Poland
Slovenia
Slovakia
EU
Hospital beds per 100,000 inhabitants
3
40%
24%

Range of activities and services in
hospital sector
4
Pre-hospital care (GPs, Specialists)
Hospital Treatment Post-hospital care (GPs, Specialists, Rehabilitation)
Referral by GP or specialist
Inpatient care
Day-surgery
Highly specialized care on in-and outpatient basis (e.g. Cystic fibrosis)
Discharge to GP, specialist or
rehabilitation

Hospital payment and capacity
planning
5
Patients
States
Tax payers
Sickness funds
Hospitals
Taxes Infrastructure investments
Contributions
Operating costs
Hospital services
• The Hospital Financing Act (KHG) of 1972 introduced the “principle of duality”
1. State governments plan hospital capacities and finance investments
2. Sickness funds reimburse operating costs
Private insurance Premiums

Infrastructure investments
6
Leber & Scheller-Kreinsen (2012)

Operating costs
• Sickness funds negotiate activity based DRG budgets every year with every
“planned” Hospital
• Budget over-run adjustment (hospital pays back):
- 65 % (standard DRGs), 25 % (drugs, medical, polytrauma and burns DRGs),
Negotiations for certain DRGs (those that are difficult to predict)
• Budget under-run adjustment (hospital receives compensation) :
- 20% (standard DRGs)
7
Casemix
X
Base rate
Supplementary fees
Hospital budget + = Surcharges +

Aims of DRG introduction in Germany
• Facilitating precise and transparent measurement of the case mix and the
level of services delivered by hospitals
• Achieving more appropriate and fairer allocation of resources
• Increasing efficiency and quality of service delivery through improved
documentation of internal processes and increased managerial capacity
• Containing costs through LOS and bed capacity reductions
8

Tasks and stakeholders of G-DRGs
9
Ministry of Health (federal, state)
Self-Administration (DKG, GKV, PKV)
Administration
Consultation
Health Policy
Development
DIMDI (German Institute of Medical
Information and Documentation)
InEK (German DRG Institute)
Goals and
monitoring
Forming a legal
framework
Technical management
Contribution of expertise
Other Institutions (HTA, quality)
Variety of Institutions
(Professional medical associations, industry groups)
G-DRG System

DRG system building blocks
10
Patient classification system
Data collection
Price setting
Actual hospital payment
• Diagnoses • Procedures
• Severity
• Frequency of revisions
• Demographic data
• Clinical data
• Cost data • Sample size, regularity of updates
• Cost weights
• Base rate(s)
• Prices/ tariffs
• Average vs. “best”
• Volume limits
• Outliers
• High cost cases
• Quality • Innovations
• Negotiations
Import 1
2
3 4

From AR-DRGs to G-DRGs
11 11
Patient classification system
• Diagnoses
• Procedures
• Severity
• Frequency of revisions
Import 1

G-DRGs 2003-2014 • Early years: Major revisions to increase precision
• Later years: development has stabilized
12
Year 2003 2004 2005 2006 2008 2010 2012 2014
DRGs total 664 824 878 954 1137 1200 1193 1.196
Base-DRGs 411 471 614 578 604 609 595 588
Unsplit 236 454 353 318 293 290 287
Severity levels 4 5 7 8 9 9 9 9
Inpatient DRGs total 664 824 878 952 1132 1195 1189 1191
- valuated 642 806 845 912 1089 1154 1149 1148
- unvaluated 22 18 33 40 43 41 40 43
Day care DRGs total 0 0 0 2 5 5 5 5
- valuated 0 0 0 1 1 1 1 2
- unvaluated 0 0 0 1 4 4 4 3
R2 all cases 0.4556 0.5577 0.6388 0.6805 0.7209 0.7443 0.754 0.7671
R2 inlier 0.6211 0.7022 0.7796 0.7884 0.8166 0.843 0.844 0.8533
Patient classification system
• Diagnoses
• Procedures
• Severity
• Frequency of revisions
1

Data collection process
13
Case data for
reimbursement
(§ 301 SGB V) Before July 1
Case-related performance and
hospital-specific structural data
from every hospital (§21 KHEntgG)
until March 31
Case-related cost data
from a sample of hospitals
until March 31
Hospitals
Sickness
funds • Checking data
via their medical
review board
• Paying hospital
InEK • Development of case fee
catalogue annually
• checking data content
Data Centre • Collecting datasets
• Checking case and
cost data technically
• Anonymising data
Federal
Statistical
Office • Publication of data
DIMDI • Development and update
of classification base (ICD -
10 GM and OPS codes)
Data collection
• Demographic data
• Clinical data
• Cost data
• Sample size, regularity of updates
2

Verifications and controls
• Medical Review Boards – Review of about 12% of all cases (hospital bills)
– In 2010: 45% of these bills exhibited irregularitie
– Audited bills (all audited cases) on average €730 to €940 higher than justified.
• InEK – Medical plausibility check
– Economic plausibility check
– Medico-economic coherence
14
Data collection
• Demographic data
• Clinical data
• Cost data
• Sample size, regularity of updates
2

Cost data collection
• Early years: increase in sample size and representativeness
• Later years: better data quality
• Continuing problem: underrepresentation of certain providers (e.g. private)
15 15
Year (G-DRG system) 2003 2004 2005 2006 2008 2010 2012 2014
Hospitals participating in
cost data collection 125 144 148 214 249 253 249 247
- excluded for data quality 9 0 0 0 28 28 4 3
- actual 116 144 148 214 221 225 245 244
- included university
hospitals 0 12 10 9 8 10 10 12
- number of cases
available for calculation 633 577 2 825 650 2 909 784 3 531 760 3 900 098 4 539 763 4 466 493 4 283 577
- number of cases used
for calculation after data
checks
494 325 2 395 410 2 283 874 2 851 819 2 811 669 3 257 497 3 359 492 3 534 247
Data collection
• Demographic data
• Clinical data
• Cost data
• Sample size, regularity of updates
2

Cost accounting in hospitals Cost- Element Groups
1:
Labour
cost
s of
the o
ther
medic
al
staff
2:
Labour
cost
s of
the n
urs
ing s
taff
3:
Labour
cost
s of
the a
dm
inis
trati
ve a
nd
technic
al st
aff
4a:
Dru
g c
ost
s
4b:
Dru
g c
ost
s (i
ndiv
idual cost
s/ a
ctu
al
consu
mpti
on)
5:
cost
s of
impla
nts
and g
raft
s
6a:
Mate
rial cost
s (w
ithout
dru
gs,
impla
nts
and g
raft
s)
6b:
Mate
rial cost
s (i
ndiv
idual cost
s/
actu
al consu
mpti
on,
wit
hout
dru
gs,
impla
nts
/ g
raft
s
7:
Medic
al in
frast
ructu
re c
ost
s
8:
Non-
medic
al in
frast
ructu
re c
ost
s
Labour Material Infrastructure Total
Cost
- C
entr
e G
roups
01: Normal ward
Hosp
ital
unit
s
wit
h
beds
654 1744 80 156 41 ---- 131 19 371 1358 4554
02: Intensive care unit 152 360 10 45 11 ---- 60 1 64 179 881
03: Dialysis unit ---- ---- ---- ---- ---- ---- ---- ---- ---- ---- 0
04: Operating room
Dia
gnost
ic a
nd
treatm
ent
are
as
623 ---- 401 23 32 1282 286 109 264 360 3380
05: Anaesthesia 356 ---- 236 30 2 85 5 50 112 875
06: Maternity room ---- ---- ---- ---- ---- ---- ---- ---- ---- ---- 0
07: Cardiac diagnostics/ therapy 2 ---- 2 ---- ---- ---- 1 2 1 1 8
08: Endoscopic diagnostics/ therapy 3 ---- 3 ---- 1 ---- 2 ---- 2 2 12
09: Radiology 46 ---- 67 1 ---- 2 14 41 24 45 240
10: Laboratories 18 ---- 110 6 339 ---- 75 82 12 50 694
11: Other diagnostic and therapeutic
areas 36 2 271 1 ---- ---- 14 16 15 111
468
Total 1890 2106 1180 261 424 1283 669 276 803 2219 11 112 16
Data collection
• Demographic data
• Clinical data
• Cost data
• Sample size, regularity of updates
2
Patient level costing
• Standardised cost accounting
approach in hospitals (voluntarily)
participating in the data sample
Example: DRG I03A
(Hip revision or replacement with cc)
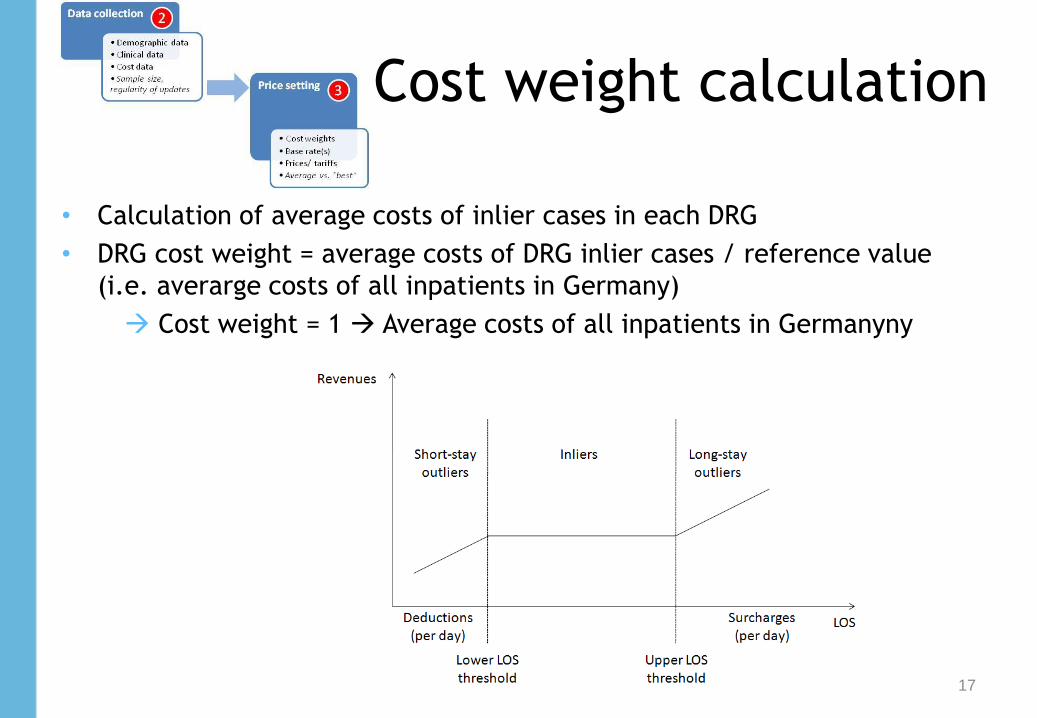
Cost weight calculation
• Calculation of average costs of inlier cases in each DRG
• DRG cost weight = average costs of DRG inlier cases / reference value
(i.e. averarge costs of all inpatients in Germany)
Cost weight = 1 Average costs of all inpatients in Germanyny
17

Actual hospital payment I
- Payment example: Normal birth without cc in Berlin in 2010
18
Base rate
Relative cost weight
Patient characteristics Gender, Age,
Diagnoses, Severity
Treatment options Procedures, Technologies,
Intensity
Hospital individual until 2009; Uniform statewide from 2010
X = G-DRG payment
Base rate Berlin
2927.5 €
Relative cost weight
0,541 X =
Payment
1584 €
Actual hospital payment
• Volume limits
• Outliers
• High cost cases • Quality
• Innovations
• Negotiations
4
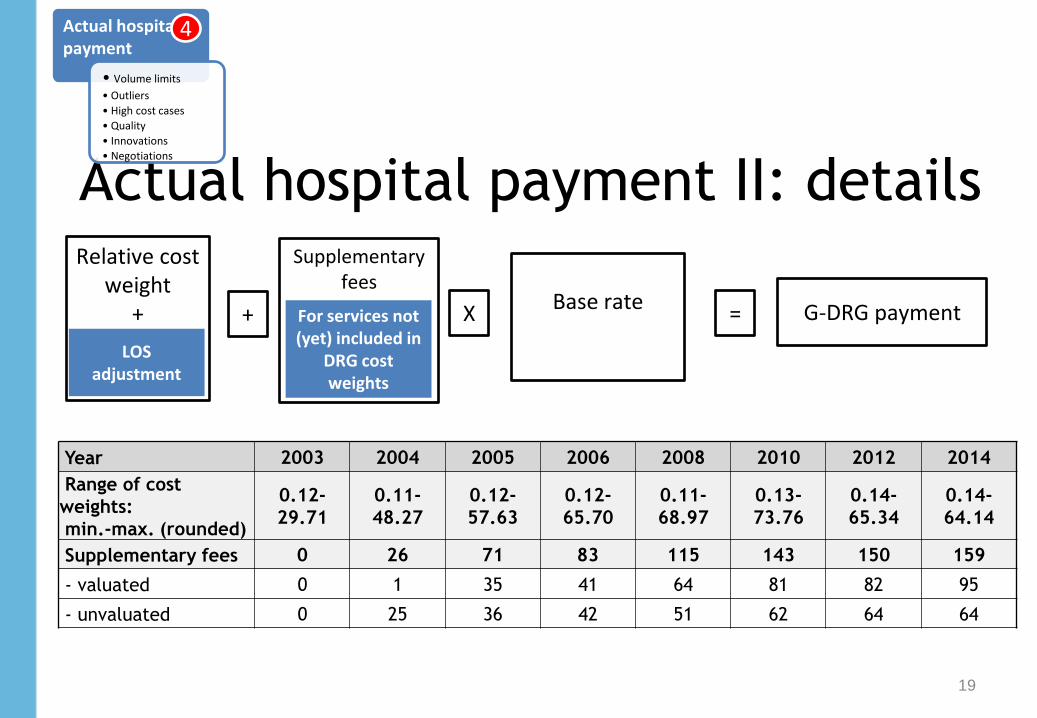
Actual hospital payment II: details
19
Actual hospital payment
• Volume limits
• Outliers
• High cost cases • Quality
• Innovations
• Negotiations
4
Year 2003 2004 2005 2006 2008 2010 2012 2014
Range of cost
weights:
min.-max. (rounded)
0.12-
29.71
0.11-
48.27
0.12-
57.63
0.12-
65.70
0.11-
68.97
0.13-
73.76
0.14-
65.34
0.14-
64.14
Supplementary fees 0 26 71 83 115 143 150 159
- valuated 0 1 35 41 64 81 82 95
- unvaluated 0 25 36 42 51 62 64 64
Base rate
Relative cost weight
+ X = G-DRG payment
LOS adjustment
Supplementary fees
+ For services not (yet) included in
DRG cost weights

Ten years of G-DRGs
20
1)
Ph
ase
of
pre
par
atio
n
Historical Budget
(2003)
Transformation
DRG-Budget (2004)
2) Budget-neutral phase
3) Phase of convergence to state-wide base rates
• Impact of DRGs
• Managing hospital volumes
• Introduction of DRG-like payment for psychiatric hospitals
• Dual Financing or Monistic
• Payment adjustments based on quality
• Selective or uniform negotiations
4) Current development and ongoing debates
15 %
15 % 20%
20%
20%
20%
20%
20%
25%
25%
State-wide
base rate
Hospital specific base rate
2000-2002 2003 - 2004 2005 - 2009 2010 - 2014
Hospital specific base rate

Impact of G-DRGs
21
Official DRG impact evaluation (IGES 2013):
Very little (if any) measurable impact (and difficulties to
attribute effects to DRG introduction)
Dimension Effect
Bed numbers Reduction slower than before DRG introduction
Average LOS 7.8 days in 2004; 6.8 days in 2010 reduction similar as before DRG introduction
Productivity Relatively strong increase in number of cases (but similar increases were seen in 1990s)
Costs per case 2.5% increase per annum from 2003 to 2010 (2.0% during 1991 to 2003)
Quality Relatively strong (6.5 to 7.8%) reduction of inpatient mortality.(up to 30, 90 and 365 days post-discharge)

Current developments and debates I
Managing hospital volumes
• The strong growth in the number of cases from an already extremely
high level (much higher than in most OECD countries) is reason for
concern
• Discussions exist to, for example, limit budget increases, increase
deductions for budget overruns, discontinue collective contracting,
introduce casemix trading…
• New government plans: introduce patients‘ right for a second opinion
prior to elective interventions
22

Current developments and debates II
Introduction of DRG-like payment system for psychiatric hospitals
• Originally psychiatric hospitals (587 hospitals in 2012) were exempt from DRG-based hospital payment
• Budget neutral introduction in 2013 based on voluntary participation of hospitals
• Mandatory introduction planned for 2015
Dual or monistic financing of investments:
• Investment lag due to public dept
• Assumption that monistic financing would make investments easier to schedule due to investment surcharges on top of every DRG
• Capital costing model has been developed by InEK but it remains unclear whether it will be used by the states.
23
Current developments and debates III
Quality adjustments
• New government plans to introduce payment adjustments based on quality of care.
• Plans include to take into account quantity and quality: – No payment reductions for budget overruns in the case of high quality
– Payment reductions in case of low quality
Selective contracting
• New government plans: strengthen selective contracting (based on quality) for certain elective admissions
• Hospitals want to avoid selective contracting, while insurers aim to expand the potential for selective contracting
• Some experiences have been made in pilot projects
24

G-DRG-based hospital payment:
Conclusion
25
Strengths Weaknesses
Transparency and improved
documentation
No system to reward/penalize hospitals for
quality
Fair (uniform) reimbursement Minimal (only state-based) adjustment for
different input prices
Precision of DRG system Increasing complexity with number of DRGs
Precision of cost weight calculation Uniform accounting system but no full
sample of hospitals
Transparent methodology of developing
and updating the system
Weak instruments to manage hospital
volumes

Thank you very much for your time and attention!
Slides available on:
www.mig.tu-berlin.de
Literature and more information: www.eurodrg.eu
Dr. med Wilm Quentin, MSc HPPF
Department of Health Care Management (MiG)
Berlin University of Technology
European Observatory on Health Systems and Policies
WHO Collaborating Centre for Health Systems, Research and Management