HOSPITAL-ACQUIRED INFECTIONS New York State University Medical Center 650 West 168th Street PH 4-470...
135
1 HOSPITAL-ACQUIRED INFECTIONS New York State 2009 New York State Department of Health September 1, 2010
Transcript of HOSPITAL-ACQUIRED INFECTIONS New York State University Medical Center 650 West 168th Street PH 4-470...

1
HOSPITAL-ACQUIRED INFECTIONS New York State 2009
New York State Department of Health September 1, 2010

2
Technical Advisory Workgroup
Audrey Adams, RN, MPH, CIC Montefiore Medical Center Henry and Lucy Moses Division Infection Control Unit 111 East 210th Street Bronx, NY 10467
Donna Armellino, RN, PhD, CIC North Shore University Hospital Long Island 300 Community Drive Manhasset, NY 11030
Melissa Bown, NP-C Saratoga Hospital 42 Myrtle Street Saratoga Springs, NY 12866
Consuelo U. Dungca, RN, EdD NYC Health & Hospitals Medical & Professional Affairs 125 Worth Street Suite 427 New York, NY 10013
Sarah Elmendorf, MD Albany Medical Center Department of Epidemiology 43 New Scotland Avenue Albany, NY 12208
Lorri Goergen, RN, BSN, CIC United Memorial Medical Center 127 North Street Batavia, NY 14020
Eileen Graffunder, BA Albany Medical Center Department of Epidemiology 43 New Scotland Avenue Albany, NY 12208
Paul Graman, MD Strong Memorial Hospital Infectious Disease Division 601 Elmwood Avenue Rochester, NY 14612
Linda Greene, RN, MPS, CIC Via Health Rochester General Hospital 1425 Portland Avenue Rochester, NY 14642
Janet Haas, RN, DNSc, CIC Westchester Medical Center 95 Grasslands Road Macy Pavilion SW 246 RM 2089 Valhalla, NY 10595
Hillary Jalon United Hospital Fund 350 5th Avenue, 23rd Floor New York, NY 10118
Linda Kokoszki, RN, BSN, CIC St. Elizabeth Medical Center 2209 Genesee Street Utica, NY 13501
Brian Koll, MD Beth Israel Medical Center Division of Infectious Disease First Ave at 16th Street New York, NY 10003
Arthur Levin, MPH Center for Medical Consumers 239 Thompson Street New York, NY 10012
Charlene Ludlow, RN, MHA, CIC Erie County Medical Center 462 Grider Street Buffalo, NY 14215
Marisa Montecalvo, MD Westchester Medical Center Division of Infections Disease 95 Grasslands Road Valhalla, NY 10595
V. Dianne Moroz, RN, MS, CIC, CCRN Thompson Health 350 Parrish Street Canandaigua, NY 14424
Lisa Saiman, MD, MPH Pediatric Infectious Diseases Columbia University Medical Center 650 West 168th Street PH 4-470 New York, NY 10032
Kent Sepkowitz, MD Sloan-Kettering 1275 York Avenue Box 420 New York, NY 10021
Rhonda Susman, RN, BSN, CIC Crouse Hospital Infection Control 736 Irving Avenue Syracuse, NY 13210
Michael Tapper, MD Lenox Hill Hospital Division of Infections Disease 100 East 77th Street New York, NY 10021
Mary Therriault, RN, MS Healthcare Association of New York State 1 Empire Drive Rensselaer, NY 12144
Brian T. Valerian, MD, FACS, FACRS Albany Medical Center Department of Surgery 47 New Scotland Avenue Albany, NY 12208
Maria Woods Greater New York Association 555 West 57th Street, 15th Floor New York, NY 10019

3
HOSPITAL-ACQUIRED INFECTIONS NEW YORK STATE – 2009
Table of Contents Technical Advisory Workgroup 2 EXECUTIVE SUMMARY 5 Background 19 Technical Advisory Workgroup (TAW) 19 HAI Reporting Indicators for 2009 20 Timeliness and Completeness of Reporting 21 Data Validation 21 Thresholds for Reporting Hospital-Specific Infection Rates 22 Risk Adjustment 22 NYS Hospital-Specific Rate Comparisons 23 Figure 1. How to Read Hospital-Specific Infection Rate Tables 25 NYS Regional Comparisons 26 Colon Surgical Site Infection Rates 27
National and NYS Colon SSI Rates 27 Colon SSI Regional Comparisons 27 Hospital-Specific Colon SSI Rate Comparisons 27 Microorganisms Associated with Colon SSIs 28
CABG Surgical Site Infection Rates 28 National and NYS CABG Chest SSI Rates 28 CABG Chest SSI Regional Comparisons 29 Hospital-Specific CABG Chest SSI Rate Comparisons 29 Microorganisms Associated with CABG Chest SSIs 29 CABG Donor Vessel SSI Regional Comparisons 30 Hospital-Specific CABG Donor Vessel SSI Rate Comparisons 30 Microorganisms Associated with CABG Donor Site SSIs 30
Hip Surgical Site Infection Rates 30 National and NYS Hip SSI Rates 30 Hip SSI Regional Comparisons 31 Hospital-Specific Hip SSI Rate Comparisons 31 Microorganisms Associated with Hip SSIs 31
CLABSIs in Adult/Pediatric ICUs 31 National and NYS CLABSI Rates in Adult/Pediatric ICUs 31 CLABSI Rates in Adult/Pediatric ICUs - Regional Comparisons 32 Hospital-Specific CLABSI Rates in Adult and Pediatric ICUs 32 Microorganisms Associated with CLABSIs in Adult and Pediatric ICUs 34 National and NYS CLABSI and UCABSI Rates in Neonatal ICUs (NICUs) 34 CLABSI and UCABSI Rates in Neonatal ICUs - Regional Comparisons 35 Hospital-specific CLABSI Rates in NICUs 35 Microorganisms Associated with CLABSIs in NICUs 36 Umbilical Catheter-Associated Bloodstream Infection Rates in Neonatal ICUs 36

4
Hospital-Specific UCABSI Rates in NICUs 36 Microorganisms Associated with Umbilical Catheter-Associated BSIs in NICUs 36
Survey of Personnel Resources for Infection Prevention and Control in NYS Hospitals 37 NYSDOH-FUNDED HAI PREVENTION PROJECTS 38
HAI Prevention Projects begun in FY 2008-2009 continued in FY 2009-2010 with continued funding in FY 2010-2011 38 HAI Prevention Project initiated March 1, 2009 40
SUMMARY OF HAI RATES 41 HAI REPORTING – LESSONS LEARNED 42 HAI REPORTING PROGRAM - NEXT STEPS 43 HAI Reporting Indicators for 2010 43 Program Personnel 44 Abbreviations 44 Glossary of Terms 46 References 51 Colon Surgical Site Infection Rate Tables 52
Table 2. Comparison of Regional Hospital-Acquired Infection Rates to State Average, New York State, 2007-2009 55
CABG Surgical Site Infection Tables – Chest Site Infections 62 CABG Surgical Site Infection Rate Tables – Donor Vessel Site Infections 67
Hip Replacement/Revision Surgical Site Infection Rate Tables 72 CLABSI Rate Tables – Adult/Pediatric Intensive Care Units 81 CLABSI and UCABSI Rate Tables – Neonatal Intensive Care Units 97 Summary Table 117 Public Health Law 2819 133

5
EXECUTIVE SUMMARY Healthcare-associated infections are a major public health problem. According to the Centers for Disease Control and Prevention (CDC), there were an estimated 1.7 million healthcare-associated infections and 99,000 deaths from those infections in 2002. 1 A recent CDC report estimated the annual medical costs of healthcare-associated infections in U.S. hospitals to be between $28 and $45 billion, adjusted to 2007 dollars.2 In July of 2005, Public Health Law 2819 was enacted mandating that New York hospitals report selected hospital-acquired infections (HAIs) to the State Department of Health (NYSDOH or “the Department”). This law was created to provide the public with fair, accurate and reliable HAI data to compare hospital infection rates, and to support quality improvement and infection control activities in hospitals. In accordance with this law, the Department compiled 2009 data from 179 hospitals and the results are presented in this report: Hospital-Acquired Infections, New York State 2009. This is the third annual report to be issued since reporting began in 2007. The initial report was submitted to the Governor, Legislature, hospitals and the public on June 30, 2008 followed by the second annual report submitted on June 30, 2009. All New York State (NYS) HAI reports are available at the following web site: http://www.health.state.ny.us/statistics/facilities/hospital/hospital_acquired_infections/ The purpose of the pilot year, as defined by Public Health Law 2819 was to: develop a HAI reporting system; train hospitals to use the reporting system; develop standardized definitions, methods of surveillance and reporting; audit and validate the hospitals’ infection data; support recommendations to improve the accuracy of data; and modify the system to ensure that hospital-specific infection rates, when released, would be fair, accurate, reliable and comparable. During the pilot year, hospital identifiers and hospital-identifiable data were encrypted by the Department in all public reports, as required by law. The 2008 and 2009 reports provide HAI rates identified by hospital and by region for the following surgical site infections (SSIs): colon, coronary artery bypass graft (CABG) and hip replacement and for central line-associated blood stream infections (CLABSIs) in adult, pediatric, and neonatal intensive care units (ICUs). METHODS NYSDOH utilizes the CDC’s National Healthcare Safety Network (NHSN) system for HAI reporting and was the first state to do so. Only hospitals that performed the selected surgical procedures or provided intensive care were required to report to the Department. In 2009, 179 acute care hospitals reported HAI data. Reporting indicators and risk adjustment methods were developed with the help of a Technical Advisory Workgroup (TAW) as required by Public Health Law 2819. Since 2007, the Department has conducted on-site audits annually in 90 percent of all reporting hospitals. Surveys identifying indicator-specific infection prevention strategies were ascertained

6
from 98 percent of reporting hospitals. Survey results and audit findings are under review and an analysis of the findings will be issued under separate cover. SUMMARY OF FINDINGS 2009 Analyses conducted of 2009 New York State hospital-acquired infection data are presented below by type of infection, beginning with SSIs and followed by CLABSIs. Surgical Site Infection Data Among the three types of surgical procedures monitored in New York State in 2009, the unadjusted SSI rates were highest for colon surgery (5.3 percent), followed by CABG surgery (2.3 percent for chest infections and 1.0 percent for donor site infections), and lastly hip replacement surgery (1.3 percent). Colon Surgical Site Infections Results
• 174 hospitals performed 17,475 colon surgery procedures and reported 929 colon SSIs in 2009, for an adjusted rate of 5.3 percent per 100 procedures using NHSN risk adjustment. This was lower than the national baseline (5.6 per 100 procedures), although the difference was not statistically significant.
• Annual NYS colon SSI rates have fluctuated between 5.9 per 100 procedures in 2007, 4.9
per 100 procedures in 2008, and 5.3 per 100 procedures in 2009. The downward trend in SSI rates was statistically significant.
• Of the 174 hospitals performing colon surgery in 2009, 12 hospitals had rates that were statistically higher than the state average and 12 had rates that were statistically lower than the state average in 2008. Of the 9 hospitals that had significantly high colon SSI rates in 2008, only one continued to be significantly higher than the state average in 2009.
• In 2009, 37 (21 percent) hospitals reported zero colon surgical site infections, but the majority of these facilities did not perform a sufficient number of procedures to include in the report or if reported, to be statistically significant.
• There was no association between SSI rates and the number of procedures performed. • Of the 929 SSIs reported 91 percent of SSIs were identified during the initial
hospitalization or readmission to the same or another hospital. Of the 9 percent of SSIs detected in outpatient settings, the majority were identified as superficial infections.

7
• Of the 929 colon SSIs, methicillin-resistant Staphylococcus aureus (MRSA) was identified in 64 (7 percent) of infections and was involved in just 0.4 percent of all colon procedures.
Lessons Learned
• Since 2007, the NYS colon SSI rates have shown a downward trend. • The majority of SSIs were recognized on initial admission or readmission to a hospital.
The majority of SSIs identified in outpatient locations were reported as superficial. • Detection of SSIs in outpatient settings is extremely variable, labor intensive, and could
not be standardized across hospitals. As a result, the Department does not include these infections in the hospital-specific comparisons.
• MRSA was not a common organism in colon SSIs.
Coronary Artery Bypass Graft (CABG) Surgical Site Infections Results
• Forty hospitals performed 13,437 CABG procedures and reported 307 CABG chest SSIs in 2009, for an adjusted rate of 2.2 percent per 100 procedures using the NHSN risk adjustment.
• The NYS CABG chest SSI rate (2.2 per 100 procedures) was higher than the national
baseline (2.0 per 100 procedures), although the difference was not statistically significant.
• Since reporting began in 2007, the CABG chest SSI rate in NYS has decreased significantly.
• Five hospitals had CABG chest SSI rates that were statistically higher than the state average and five hospitals had rates that were statistically lower than the state average in 2009. Of the five hospitals with high SSI rates in 2008, two remained statistically higher than the state average in 2008. The one hospital with a significantly lower CABG chest SSI rate in 2008 remained significantly lower than the state average in 2009.
• There was no association between SSI rates and the number of procedures performed for
CABG chest incisions.
• Of 307 CABG chest SSIs reported, 96 percent were identified during the initial hospitalization or readmission to the same or and another hospital. Of the 4 percent of SSIs detected in outpatient settings, the majority were identified as superficial infections.

8
• Of the 307 CABG chest SSIs, MRSA was not the most common organism. MRSA was identified in 40 (13 percent) of the CABG chest SSIs and was involved in just 0.3 percent of all CABG procedures.
• Of the 13,437 CABG procedures, 12,414 involved a separate donor site. Of the 12,414 procedures, 129 (1.0 per 100 procedures using NHSN risk adjustment) resulted in a donor vessel SSIs.
• The NYS CABG donor vessel SSI rate (1.0 per 100 procedures) was higher than the
national baseline rate (0.9 per 100 procedures), but the difference was not statistically significant.
• Since reporting began in 2007, the CABG donor vessel SSI rate in NYS has not changed
significantly.
• Hospital-specific CABG donor vessel SSI rates in three hospitals were significantly higher than the state average and one hospital had a rate that was significantly lower than the state average in 2009. Of the five hospitals with significantly higher CABG donor vessel SSI rates in 2008, only one remained higher than the state average in 2009. Of the three hospitals with significantly lower CABG donor vessel SSI rates in 2008, only one remained lower than the state average in 2009.
• Seven (18 percent) hospitals reported zero CABG donor vessel infections in 2009.
• There was no association between SSI rates and the number of procedures performed with a separate donor site.
• Of the 12,414 CABG procedures involving a separate donor vessel site, MRSA was not the most significant organism. MRSA was identified in 12 (9.3 percent) of infections and was involved in just 0.1 percent of all CABG donor vessel site procedures.
• Of the 129 CABG donor vessel SSIs reported, 85 percent were identified during the initial hospitalization or on readmission to the same or another hospital. Of the 15 percent of SSIs detected in outpatient settings, the majority were identified as superficial infections.

9
Lessons Learned
• Since reporting began in 2007 CABG, chest SSI rates have decreased significantly, while donor vessel SSI rates have not changed significantly.
• The majority of CABG SSIs were recognized on initial admission or readmission to a
hospital. The majority of SSIs identified in outpatient locations were reported as superficial.
• Detection of SSIs in outpatient settings is extremely variable, labor intensive, and could not be standardized across hospitals. As a result, the Department does not include these infections in the hospital-specific comparisons.
• There was no association between the number of CABG procedures performed and the SSI rates.
• MRSA was not one of the most common organisms involved in CABG SSIs.
Hip Surgical Site Infections Results
• 169 hospitals performed 25,849 hip replacement or revision surgeries and reported 311 hip SSIs, for an adjusted rate of 1.3 percent per 100 procedures using NHSN risk adjustment. The NYS hip SSI rates in 2008 and 2009 were the same as the national baseline rate (2006-2008).
• Six hospitals had hip SSI rates that were significantly higher than the state average and one hospital had a rate that was significantly lower than the state average in 2009. Of the four hospitals with higher rates in 2008, none were significantly higher in 2009. The only hospital with a lower hip SSI rate in 2008 continued to be significantly lower in 2009.
• Sixty-six (39 percent) hospitals reported zero hip SSIs in 2009.
• The likelihood of infection was lower in hospitals that performed the most hip
procedures. • Of the 311 hip SSIs reported, 91 percent were identified during initial hospitalization or
upon readmission to the same or another hospital. Of the 9 percent of SSIs detected in outpatient settings, the majority were identified as superficial infections.

10
• MRSA was associated with 33 percent of hip SSIs, but was involved in just 0.4 percent of all hip procedures.
Lessons Learned
• The hospitals that performed a high volume of hip replacement procedures had the lowest infection rates.
• The majority of SSIs were recognized on initial admission or readmission to a hospital.
The majority of SSIs identified in outpatient locations were reported as superficial. • Detection of SSIs in outpatient settings is extremely variable, labor intensive, and could
not be standardized across hospitals. As a result, the Department did not include these infections in the hospital-specific comparisons.
• MRSA was one of the most common organisms involved in hip SSIs but was an extremely rare event occurring in only 0.4 percent or procedures.
Recommendations and Next Steps for Colon, CABG and Hip Replacement SSIs
• The Department will continue to monitor hospitals for data reporting completeness, timeliness and accuracy. Technical assistance will be provided as needed.
• The Department will evaluate facilities with the highest and lowest infection rates,
determine if there are surveillance and reporting differences, assess trends over time and identify interventions to reduce infections and enhance patient safety.
• The Department will analyze the results of surveys conducted during 2008 and 2009 to identify strategies that are potentially effective in preventing colon, CABG, and hip replacement SSIs.
• The Department will consult with infection preventionists, hospital epidemiologists, and
surgeons, to identify risk factors and prevention strategies to reduce colon, CABG, and hip replacement SSIs.
• The Department will analyze the influence of transfusions on colon surgery infection rates using hospital audits.
• The Department will provide hospitals with risk factors, strategies and interventions it identifies and work with them to ensure adoption of policies and procedures that reduce risk and enhance patient safety.

11
• Hospitals must closely monitor infection rates, implement prevention and control measures and measure effectiveness of the interventions using the HAI reporting data.
Central-Line Associated Blood Stream Infection (CLABSI) Data In 2009, New York State monitored CLABSI rates in ten types of intensive care units (ICUs): cardiothoracic, coronary, medical-teaching, medical non-teaching, medical-surgical teaching, medical-surgical non-teaching, neonatal, neurosurgical, pediatric and surgical units. Central Line-Associated Bloodstream Infections (CLABSI) in Adult and Pediatric ICUs Results
• Compared to national baseline rates (2006-2008), NYS had a significantly higher
CLABSI rate in non-teaching medical-surgical ICUs (1.9 per 1000 central line days) but a significantly lower rate in pediatric ICUs (2.3 per 1000 central line days) in 2009. None of the other adult ICU CLABSI rates in 2009 were significantly different than the national baseline rates (2006-2008) for the specific ICU.
• Since 2007, there has been an 18 percent reduction in adult/pediatric CLABSI rates in NYS after adjusting for type of ICU. The significant decreases occurred in cardiothoracic ICUs, medical ICUs in non-teaching hospitals, pediatric ICUs, and surgical ICUs. The major decline occurred between 2008 and 2009. None of the ICUs had a significant increase in CLABSI rates between 2007 and 2009.
• Hospital CLABSI rates varied within ICU settings as follows:
• Cardiothoracic ICU CLABSI rates were not significantly different in any hospital when compared to the state average.
• Coronary ICU CLABSI rates were not significantly different in any hospital when compared to the state average.
• Medical ICU CLABSI rates in teaching hospitals were significantly higher in two hospitals when compared to the state average. One of the hospitals with a significantly higher rate in 2009 was also higher than the state average in 2008.
• Medical ICU CLABSI rates in non-teaching hospitals were significantly higher in two hospitals when compared to the state average. Neither of these hospitals with a significantly higher rate in 2009 was higher than the state average in 2008.
• Medical-Surgical ICU CLABSI rates in teaching hospitals were significantly higher in three hospitals and lower in two hospitals when compared to the state average. None of the hospitals with a significantly higher rate in 2009 were higher than the state average in 2008. One of the hospitals with a lower rate in 2009 was also lower than the state average in 2008.

12
• Medical-Surgical ICU CLABSI rates in non-teaching hospitals were significantly higher in seven hospitals and lower in four hospitals when compared to the state average. Two of the hospitals with a higher rate in 2009 were also higher than the state average in 2008. Two of the hospitals with a lower rate in 2009 were also lower than the state average in 2008.
• Neurosurgical ICU CLABSI rates were significantly higher in one hospital when compared to the state average. The hospital with a higher rate in 2009 was not significantly different than the state average in 2008.
• Pediatric ICU CLABSI rates were significantly higher in two hospitals and lower in one hospital when compared to the state average. The hospital with the significantly lower rate in 2009 had been significantly higher than the state average in 2008.
• Surgical ICU CLABSI rates were significantly higher in five hospitals and one hospital was significantly lower when compared to the state average. Two of the hospitals with a significantly higher rate in 2009 were also higher than the state average in 2008.
• By comparing the number of observed (actual) CLABSIs in 2009 (N=1066) with the
number expected based on rates in 2007 (N=1305), the Department was able to calculate the expected cost savings. Using the 2007 consumer price index (CPI) for inpatient hospital services, the dollar savings was estimated to be between $1.7 million and $7.0 million in adult and pediatric ICUs.
• CDC issued the first state specific report on CLABSIs in May 2010. Although NYS adult and pediatric CLABSI rates were average when compared to the national baseline, NYS and other states that audit and validate the data had the highest rates.
• MRSA was not one of the common organisms associated with CLABSIs in adult and pediatric ICU patients. MRSA was detected in four percent of infections.
Lessons Learned
• Since 2007, hospitals have made significant strides in reducing CLABSIs in adult and pediatric ICUs.
• Using the 2007 CPI for inpatient hospital services, the dollar savings associated with the reduction of CLABSI was estimated to be between $1.7 million and $7.0 million in adult and pediatric ICUs. The methods used to derive these estimates were developed by CDC.2
• Unless or until other states have the same extensive audit and validation processes, comparisons between state and national rates may be misleading.

13
• A report of zero CLABSIs in specific ICUs may not be statistically significant due to low numbers of patients and days with a central line.
• MRSA was not found to be a significant organism associated with CLABSIs in adult and pediatric ICUs. Targeting resources solely for prevention of MRSA-associated CLABSIs in ICUs is not warranted.
CLABSIs in Neonatal ICUs (NICU) Results
• After adjusting for birth weight distribution, the NYS Regional Perinatal Centers(RPC)/ Level III NICU CLABSI rate in 2009 (2.4 per 1000 line days) was significantly lower than the national baseline rate (2.9 per 1000 line days in 2006-2008).
• NYS RPC CLABSI rates decreased significantly since 2007.
• For Level III NICUS not designated as RPCs, the rate of CLABSIs increased in 2009 to 3.2 per 1000 central line days, although the increase was not statistically significant.
• After adjusting for birth weight distribution, the NYS Level II/III NICU CLABSI rate in 2009 (3.3 per 1000 line days) was not statistically different than the national baseline rate of 2.6 per 1000 line days in 2006-2008. Between 2007 and 2009, the CLABSI rates in NYS Level II/III NICUs did not change significantly.
• Among the 18 RPCs, there were two hospitals with significantly higher CLABSI rates and one hospital with a significantly lower CLABSI rate when compared to the state average. One RPC had zero CLABSIs but the rate was not statistically significant. The risk-adjusted CLABSI rates in RPCs ranged from 0.0 to 8.8 per 1000 line days.
• Among the 21 Level III NICUs, there was one hospital with a statistical higher CLABSI
rate when compared to the state average and one did not have the minimum of 50 central line days to include in the report. Of the 20 Level III NICUs with sufficient central line days, five reported zero CLABSIs in 2009. The risk-adjusted Level III CLABSI rates ranged from 0.0 to 19.0 per 1000 central line days. This wide range is due to the relatively infrequent use of central lines in this patient population.
• Among the 14 Level II/III NICUs, there was one hospital with a statistically higher CLABSI rate when compared to the state average and six reported zero CLABSIs in

14
2009. The rates ranged from 0.0 to 33.9 per 1000 central line days. This wide range is due to the relatively infrequent use of central lines in this patient population.
• MRSA was not the most common organism and was involved in just 5 percent of NICU CLABSIs.
• NYS CLABSI and Umbilical -Catheter Associated Blood Stream Infections (UCABSI) rates in NICUs have decreased significantly between 2007 and 2009. Using the 2007 CPI for inpatient hospital services, the dollar savings associated with the decrease was estimated to be between $765,000 and $3.1 million in NICUs. The methods used to derive these estimates were developed by CDC.2
Lessons Learned
• The substantial decrease in NICU CLABSI rates that occurred in RPCs throughout the state was associated with a NYSDOH-funded NICU CLABSI collaborative prevention project designed and implemented by RPCs throughout the state. This effort will be expanded to the affiliated Level III NICUs in 2010. Level III NICUs had an increase in CLABSIs in 2009 thus these prevention efforts are of critical importance.
• The reduction of CLABSI in RPC NICUs resulted in significant healthcare cost savings.
• Between 2007 and 2009, the CLABSI rates in NYS Level II/III NICUs did not change significantly.
• For Level III and Level II/III NICUs, there continues to be a wide range in CLABSI rates
among hospitals. This wide range is due to the relatively infrequent use of central lines in this patient population.
• NYS conducts intensive audits to assure complete and accurate reporting of HAIs. At the
present time, only four other states conduct audits on CLABSI rates. All of the states conducting audits have higher rates of CLABSI when compared to national data. Unless or until other states have the same extensive audit processes, comparisons with national rates may be misleading.
Recommendations and Next Steps for CLABSI and Reporting
• The Department will continue to monitor all hospitals for data reporting completeness,
timeliness and accuracy. Technical assistance will be provided as needed.

15
• The Department will evaluate hospitals with the highest and lowest rates of CLABSIs to ensure complete and accurate reporting, assess trends over time and identify interventions to reduce infections and enhance patient safety.
• The Department will analyze the results of surveys conducted during 2008 and 2009 to identify strategies that were potentially effective in preventing ICU CLABSIs.
• The Department will consult with infection preventionists, hospital epidemiologists, physicians, and neonatologists to identify evidence-based infection prevention strategies to reduce infections and enhance patient safety.
• The Department will provide hospitals with risk factors, strategies and interventions it
identifies and encourage adoption of policies and procedures that reduce risk and enhance patient safety.
• The Department will support expansion of the Regional Perinatal Centers and Level III
CLABSI prevention initiatives to the affiliated Level III NICUs in 2010.
OVERALL LESSONS LEARNED
• No hospital in New York State was found to have had high HAI rates across the board. In other words, a hospital may have had a high SSI rate for one type of surgery, but the hospital did not have a high infection rate for other surgical procedures or CLABSIs.
• High surgical procedure volume within hospitals was associated with decreased infection rates for hip replacement procedures but volume was not associated with SSI rates for colon and CABG procedures.
• Targeting resources solely for prevention of MRSA-associated CLABSIs in ICUs were not warranted.
• Department staff members were able to use the NHSN to identify hospitals with the highest infection rates, target areas in need of improvement, recommend prevention strategies and monitor progress over time.
• Hospitals had access to their own data and were able to compare their rates to national levels and monitor trends over time. In addition, groups involved in quality improvement and patient safety projects utilized the NHSN to monitor the effectiveness of infection prevention interventions.
• Strict adherence to the surveillance definitions is critical to provide consistency and comparability of data across hospitals. While additional clinical findings may be
16
appropriate for treatment decisions, they may not be available or appropriate for mandatory reporting purposes due to variation between providers and institutions.
• Hospitals with more sophisticated post-discharge surveillance methods were able to detect more infections and reported higher infection rates. Post-discharge surveillance methods were highly variable, resource dependent, influenced by availability of hospital information systems, and affect the number of reported infections. The majority of severe infections were detected during the initial hospitalization or upon readmission. In order to fairly compare hospitals and not penalize facilities with the best surveillance systems, the NYSDOH did not include surgical site infections detected solely by post-discharge surveillance but will continue to monitor the impact of this omission.
• Use of additional patient-specific risk information improved the ability to compare hospital-specific coronary artery bypass graft and hip replacement surgical site infection rates. The data in this report have been adjusted for these factors.
• Timely and complete data submission was often affected by infection control staffing turnover, vacant positions and the need for education and training to comply with the reporting mandate. Hospitals need to provide back-up personnel to ensure compliance with reporting requirements and patient safety.
• Hospitals need to integrate health information technology systems to support infection prevention and reporting efforts. For example, only 30 percent of hospitals have utilized electronic data entry of operating room procedure log information. The other 70 percent of hospitals are still manually entering this data into the NHSN.
• NYS conducted intensive audits to assure complete and accurate reporting of all required HAIs. Only four other states conducted audits on CLABSI rates at the time CDC issued a state-based CLABSI rate report. All of the states conducting audits had higher rates of CLABSI when compared to national data.9 Unless or until other states have the same extensive audit processes, comparisons with national rates may be misleading.
• Using the 2007 consumer price index (CPI) for inpatient hospital services, the dollar savings associated with the reduction in CLABSI rates in adult, pediatric and neonatal ICUs in New York was estimated to be between $2.5 and $10 million. The methods used to derive these estimates were developed by CDC.2

17
HAI Reporting Program - Next Steps The Department will work to improve HAI reporting and infection prevention efforts including taking the following actions:
• Continue to focus on hospitals with the highest and lowest infection rates to identify risk factors for infection and opportunities for improvement.
• Integrate the hospital-specific infection rates into the Department’s hospital profile web site, so it is easy to understand.
• Continue to monitor the accuracy and timeliness of data being submitted, discuss findings, ensure corrective action is taken and provide technical assistance as needed.
• Conduct onsite audits to evaluate surveillance methods, enhance surveillance definitions, and assess completeness and accuracy of reporting.
• Continue to evaluate the impact of post-discharge surveillance on surgical site infection rates and implications for public reporting.
• Continue to provide education, training and ongoing support to hospital infection reporting staff.
• Continue to provide hospitals with risk factors, strategies and interventions it identifies and encourage adoption of policies and procedures to reduce risk and enhance patient safety.
• Evaluate and monitor the effect of prevention practices on infection rates and seek opportunities to enhance patient safety.
• Evaluate the relationship between infection prevention personnel resources and surveillance activities, infection rates, and prevention projects.
• Collaborate with other department staff to investigate outbreaks and evaluate emerging trends.
• Consult with infection preventionists, hospital epidemiologists, surgeons, neonatologists and the Cardiac Advisory Committee to identify risk factors and prevention strategies to reduce infections.
• Monitor HAI prevention projects for compliance with program objectives, fiscal responsibility and potential applicability to other hospitals or healthcare settings.
• Continue to work with the TAW and seek guidance on the selection of reporting indicators, evaluation of system modifications, evaluation of potential risk factors, methods of risk adjustment and presentation of hospital-identified data.
• Continue to require, refine and report hospital-specific HAI indicators to allow consumers to make informed choices.
• Evaluate the impact of audit and validation on reported HAI infection rates and state-based comparisons.
18
CONCLUSIONS Since New York State hospitals have been reporting hospital-acquired infections to the NYSDOH, it is clear that the NHSN system is a useful tool in monitoring HAI rates and evaluating the effectiveness of prevention strategies. Hospitals have continuous access to their own data and can compare their rates to national levels and monitor trends over time. In addition, the NYSDOH has continuous access to the data reported by the hospitals for consistent real-time surveillance, identification of trends and provision of technical assistance as needed. The collected data are made available to the public annually, allowing the public the ability to review hospitals’ performance for these particular procedures and help guide their personal medical decisions.

19
HOSPITAL-ACQUIRED INFECTIONS NEW YORK STATE – 2009
Background Healthcare-associated infections are a major public health problem. According to the Centers for Disease Control and Prevention (CDC), there were an estimated 1.7 million healthcare-associated infections and 99,000 deaths from those infections in 2002. 1 A recent CDC report estimated the annual medical costs of healthcare-associated infections to U.S. hospitals to be between $28 and $45 billion, adjusted to 2007 dollars.2 These monetary costs do not measure the effect of these infections on the patients, their family members, friends and colleagues. Their emotional, physical and personal costs are not quantifiable. In July, 2005, the Legislature passed and the Governor signed Public Health Law 2819 (Appendix A) requiring hospitals to report select hospital-acquired infections (HAIs) to the New York State Department of Health (NYSDOH or “the Department”). The legislation provided an initial “pilot phase” year (2007) to develop the reporting system; train hospitals on its use; standardize definitions, methods of surveillance and reporting; audit and validate the hospitals’ infection data and modify the system to ensure that the hospital-identified infection rates would be fair, accurate and reliable. New York State (NYS) selected the CDC’s National Healthcare Safety Network (NHSN) for reporting and New York was the first state to use this system. Currently, 21 states are committed to using the NHSN and it has become the standard for state reporting. On June 30, 2008, the Department issued the pilot year report for 2007 describing the development and implementation of the HAI reporting system, an assessment of the overall accuracy of the data submitted in the pilot phase, guidance for improving the accuracy of hospital acquired infection reporting, lessons learned, and next steps.3 The pilot year 2007 report and all subsequent reports are available at the following web site: http://www.nyhealth.gov/statistics/facilities/hospital/hospital_acquired_infections/ The following report summarizes 2009 NYSDOH HAI reporting program activities; provides 2009 hospital-acquired infection rates by individual hospital, region, and NYS totals; and compares these rates to baseline national data (2006-2008).8
Technical Advisory Workgroup (TAW) PHL 2819 requires NYSDOH to utilize a Technical Advisory Workgroup (TAW) to assist with the development of methods that ensure fair and accurate comparisons between hospitals and with data collection, reporting and analysis. The TAW is made up of a panel of professionals representing state and nationally-recognized experts in the prevention, identification and control of hospital acquired infection and the public reporting of performance data as prescribed in the legislation. This group plays a critical role in the selection of reporting indicators, the evaluation of system modifications, the evaluation of potential risk factors, methods of risk adjustment and presentation of the hospital-identified data. The TAW met twice a year in 2006-2008, once in 2009 and once, thus far, in 2010.

20
HAI Reporting Indicators for 2009 PHL 2189 provided for the reporting of select HAIs during the pilot year, 2007. The initial starter set included central line-associated bloodstream infections (CLABSIs) and surgical site infections (SSIs) associated with coronary artery bypass procedures and colon surgical procedures. Thereafter, the Department, with input from the TAW may phase in or phase out indicators to be reported. In 2008, the Department added infections associated with hip replacement or revision surgery and in July 2009, began pilot testing a new Clostridium difficile infection indicator. The hospital acquired infections included in this report are described below: Surgical Site Infections (SSIs) are infections that occur after the operation in the part of the body where the surgery took place. Most SSIs are limited and only involve the skin surrounding the incision; others may be deeper and more serious. Infections related to the following types of surgery were reported:
• Colon - Colon surgery is a procedure performed on the lower part of the digestive tract also known as the large intestine or colon.
• Coronary artery bypass graft (CABG) - CABG surgery is a procedure performed for heart disease in which a vein or artery from the chest or another part of the body is used to create an alternate path for blood to flow to the heart, bypassing a blocked artery.
• Hip - Hip replacement or revision surgery involves removing damaged cartilage and bone from the hip joint and replacing them with new, man-made parts.
Central Line-Associated Bloodstream Infections (CLABSI) - A central line is a tube that is placed into a patient’s large vein, usually in the neck, chest, arm or groin. The line is used to give fluids and medication, withdraw blood, and monitor the patient’s condition. A bloodstream infection can occur when microorganisms (e.g., bacteria, fungi) travel around or through the tube, attach and multiply on the tubing or in fluid administered through the tubing and then enter the blood. CLABSI are not monitored throughout the hospital, but rather, in selected intensive care units (ICUs). ICUs are hospital units that provide intensive observation and treatment for patients either dealing with, or at risk of developing life threatening problems. ICUs are described by the types of patients in the unit. The following ICU types are required to participate in the reporting program for CLABSI:
• Cardiothoracic Surgery ICUs • Coronary ICUs • Medical ICUs • Medical Surgical ICUs • Neonatal ICUs • Neurosurgical ICUs • Pediatric ICUs • Surgical ICUs

21
Timeliness and Completeness of Reporting HAI reporting program personnel monitored the timeliness, completeness and accuracy of hospital reports and conducted onsite audits at hospitals to assure compliance with the statutory reporting requirements. Some delays in reporting are inevitable due to the prolonged incubation period for some surgical site infections. For example, if an implant is involved (e.g., sternal wires, hip prostheses), an infection occurring up to a year after the surgery is still counted and reported. However, in general, reporting should occur as required within sixty days after the completion of each surveillance month.
Data Validation Data reported to the NHSN are validated using a number of methods.
1) Point of entry checks - The NHSN is a web-based data reporting and submission program that includes validation routines for many data elements, reducing common data entry errors. Hospitals can view, edit, and analyze their data at any time.
2) Monthly checks for internal consistency - Each month, NYS HAI staff download the data from the NHSN and run it through a computerized data validation code. Data that are missing, unusual, inconsistent, or duplicate are identified and investigated through email or telephone communication with hospital staff. Hospitals are given the opportunity to verify and/or correct the data.
3) Annual on-site audits - Audits of a sample of medical records are conducted by the Department to assess compliance with reporting requirements. Onsite visits have been conducted annually by HAI program staff. The 2009 data audits have been completed in 163 of 179 (91 percent) hospitals. The purposes of the audit are to:
a. Enhance the reliability and consistency of applying the surveillance definitions; b. Evaluate the adequacy of surveillance methods to detect infections; c. Evaluate intervention strategies designed to reduce or eliminate specific
infections; and d. For data inconsistencies identified, discrepancies are discussed and records
modified by the hospitals as needed. Ongoing monitoring, education and training have been and continue to be provided to ensure the integrity of the data.
4) Checks for completeness in reporting - NYS HAI staff match the NHSN data to other NYSDOH data sets to assess the completeness of the data reported to the NHSN. The other databases include the Cardiac Surgery Reporting System5 (CSRS) and Statewide Planning and Research Cooperative System6 (SPARCS).
a. NHSN CABG data are linked to the CSRS database. The cardiac services program collects and analyzes risk factor information for patients undergoing cardiac surgery and uses the information to monitor and report hospital and physician-specific mortality rates.
b. NHSN colon and hip data are linked to the SPARCS database. SPARCS is an administrative billing database that contains details on patient diagnoses and treatments, services, and charges for every hospital discharge in New York State.

22
Thresholds for Reporting Hospital-Specific Infection Rates Only hospitals that perform the selected surgical procedures or provide ICU care are required to report the designated indicator data and HAIs. Hospitals that perform very few procedures or have ICUs with very few patients with central lines have infection rates that fluctuate greatly over time. This is because even a few cases of infection will yield a numerically high rate in the rate calculation when the denominator of central lines is small. To assure a fair and representative set of data, the Department adopted the NHSN minimum thresholds for reporting. The minimum thresholds are:
• For surgical site infections, there must be a minimum of 20 patients undergoing a surgical procedure.
• For CLABSIs and umbilical catheter-associated blood stream infections (UCABSIs) there must be a minimum of 50 central-line days. Central line days are the total number of days central lines are used for each patient in an ICU or NICU over a given period of time.
Risk Adjustment Risk adjustment is a statistical technique that allows hospitals to be more fairly compared. The adjustment takes into account the differences in patient populations related to severity of illness and other factors that may affect the risk of developing a hospital acquired infection. A hospital that performs a large number of complex procedures on very sick patients would be expected to have a higher infection rate than a hospital that performs more routine procedures on healthier patients. Therefore, before comparing the infection rates of hospitals, it is important to adjust for the proportion of high and low risk patients. New York State and National Comparison NYS annual HAI rates were compared to the baseline National data from 2006-20088. The CDC modified definitions as of January 1, 2008 and used the newer definitions and methods of analysis for their 2006-2008 report. Therefore, the Department used the same modifications for National comparisons. For the comparison of surgical site infection rates, NYS rates were directly adjusted based on the proportion of surgeries in each NHSN risk group in the 2006-2008 National baseline population. The NHSN 2006-2008 report uses three measures to account for risk differences in patients undergoing surgical procedures:
1. Wound class – contaminated or dirty wound sites at the time of surgery are more likely to become infected than clean wound sites.
2. Duration of surgery – longer surgeries are more likely to result in infection both because of the complexity of the surgical procedure and the amount of time the patient’s internal organs are exposed.
3. American Society of Anesthesiologists’ (ASA) Classification of Physical Status score – a scoring method used to capture the physical and medical condition of a patient prior to surgery. Severely ill patients or those with multiple medical conditions are more likely to
23
get an infection than healthier patients (see Glossary of Terms for more information on ASA score).
For the comparison of adult and pediatric CLABSI infection rates, crude rates were compared within each type of ICU. Patient level data is not collected on adult or pediatric patients with central lines so risk adjustment is limited to the type of intensive care unit and numbers of patients with a central line. For the comparison of Neonatal ICU CLABSI and UCABSI, rates were indirectly standardized based on NHSN birth weight category, since there were few infections within birth weight categories. The infection information is collected by type of NICU [Level II/III, Level III or Regional Perinatal Center (RPC)] and birth weights of infants in the unit with central lines. NICU CLABSI and UCABSI rates are compared for facilities providing the same level of neonatal intensive care and have been adjusted for the birth weight distribution of infants with lines on the specific unit. The indirect standardization method was based on a Poisson regression model.
NYS Hospital-Specific Rate Comparisons All NYS hospital-specific tables, charts and data analyses use the criteria and risk adjustments developed by the Department in conjunction with the Technical Advisory Workgroup. These changes resulted from lessons learned during the pilot year and include the use of additional sources of data to improve risk adjustment for hospital comparisons. Surgical Site Infection Modifications:
1. The hospital-specific SSI rates do not include infections that were identified after hospitalization (post-discharge) if the infection did not involve a readmission to the same hospital where surgery was performed or admission to another hospital. This decision was made because post-discharge surveillance efforts were found to be extremely variable, labor intensive, and could not be standardized across hospitals. Despite post-discharge surveillance being required by the NHSN, the Department was unable to audit for accuracy or completeness, and inclusion of these infections would unfairly penalize facilities with the most intensive surveillance efforts.
2. The SSI reporting form was modified to capture additional information on surgical site infections that became evident after the patient had been discharged but involved a readmission to another hospital. These events were counted in the infection rate of the hospital where the original surgery was performed.
Central Line-Associated Bloodstream Infection Modifications:
1. The CLABSI reporting form was modified to identify cases in which multiple blood cultures were obtained, but only one specimen was positive, and the one positive was clinically considered to be a contaminant and no treatment was given. These events were deleted from the hospital-specific infection rates but were not deleted in national comparisons since the information was not available on the national level. This allows for exclusion of certain cases that meet the NHSN surveillance definitions but are not deemed clinically significant; exclusion by these criteria was rare.

24
2. Neonatal intensive care unit CLABSIs and UCABSIs do not include “clinical sepsis” events. Although the CDC’s NHSN required reporting of these events (until January 2010), surveillance and detection is extremely difficult, labor intensive, and inconsistently applied. Since these events by definition do not involve positive blood cultures, their detection relies upon surveillance of clinical conditions that cannot be systematically or consistently ascertained by infection prevention staff.
3. The CLABSI reporting form was modified to capture information on the patient location (operating room, emergency room, intensive care unit, etc.) when a central line was placed. This information was collected to determine where to focus infection prevention efforts but was not used to modify the infection rates.
In addition to the NHSN risk factors, NYSDOH also utilized data from the CSRS, SPARCS and the NHSN to include the following patient-level risk factors for each HAI indicator:
1. Colon surgery – None of the additional risk factors studied improved the NHSN risk adjustment model.
2. Coronary Artery Bypass Graft surgery – For chest site infections, including the following indicators from the CSRS improved the risk adjustment model by 20%:
a. Diabetes b. Body Mass Index (BMI) – relationship between weight and height c. End Stage Renal Failure (ESRD) d. Gender e. History of Chronic Obstructive Pulmonary Disease (COPD) f. Medicaid recipient
3. Coronary Artery Bypass Graft surgery – For donor (artery or vein) site infections, including the following indicators from the CSRS improved the risk adjustment model by 14%:
a. BMI b. History of Congestive Heart Failure (CHF) c. Gender d. Age group e. Emergency or trauma patient f. History of Chronic Obstructive Pulmonary Disease (COPD) g. Diabetes
4. Hip Prosthesis surgery – Including the following indicators, available in the NHSN, improved the risk adjustment model by 4%:
a. Initial surgery or revision b. Total hip replacement or partial hip replacement
Risk-adjusted infection rates for surgical site infections in each hospital were calculated using a two step method. First, all the data for the state were pooled to develop a logistic regression model predicting the risk of infection based on patient-specific risk factors. Second, that model was used to calculate the expected number of infections for each hospital. The observed infection rate was then divided by the hospital’s expected infection rate. If the resulting ratio is larger than one, the provider has a higher infection rate than expected on the basis of its patient mix. If it is smaller than one, the provider has a lower infection rate than expected from its patient mix. For each hospital, the ratio is then multiplied by the overall statewide infection rate to obtain the

25
hospital’s risk-adjusted rate. This method of risk adjustment is called “indirect adjustment.” 7 Hospitals with risk-adjusted rates significantly higher or lower than the state average were identified using exact two-sided 95% Poisson confidence intervals. The Poisson distribution is used for rates based on rare events. All data analyses were performed using SAS versions 9.1 or 9.2 (SAS Institute, Cary NC). Figure 1. How to Read Hospital-Specific Infection Rate Tables
• Hospital A had an adjusted infection rate very similar to the state average. The grey bar
(95% confidence interval) goes over the dotted line representing the state average, indicating no statistical difference in the rates.
• Hospital B has an adjusted infection rate that is significantly higher than the state average, because the red bar is entirely to the right (representing higher rates) of the dotted line.
• Hospital C had zero infections, but this was not considered to be statistically lower than the state average because the grey bar goes over the dotted line. All hospitals that observed zero infections get a *, because they do deserve acknowledgement for achieving zero infections.
• Hospital D had the highest infection rate, but this was not statistically higher than the state average.
• Hospital E - The data are not shown because the hospital performed fewer than 20 procedures and therefore the rates are not stable enough to be reported.
• Hospital F had an adjusted infection rate that is statistically lower than the state average, because the blue bar is entirely to the left (representing lower rates) of the dotted line (Figure 1).
26
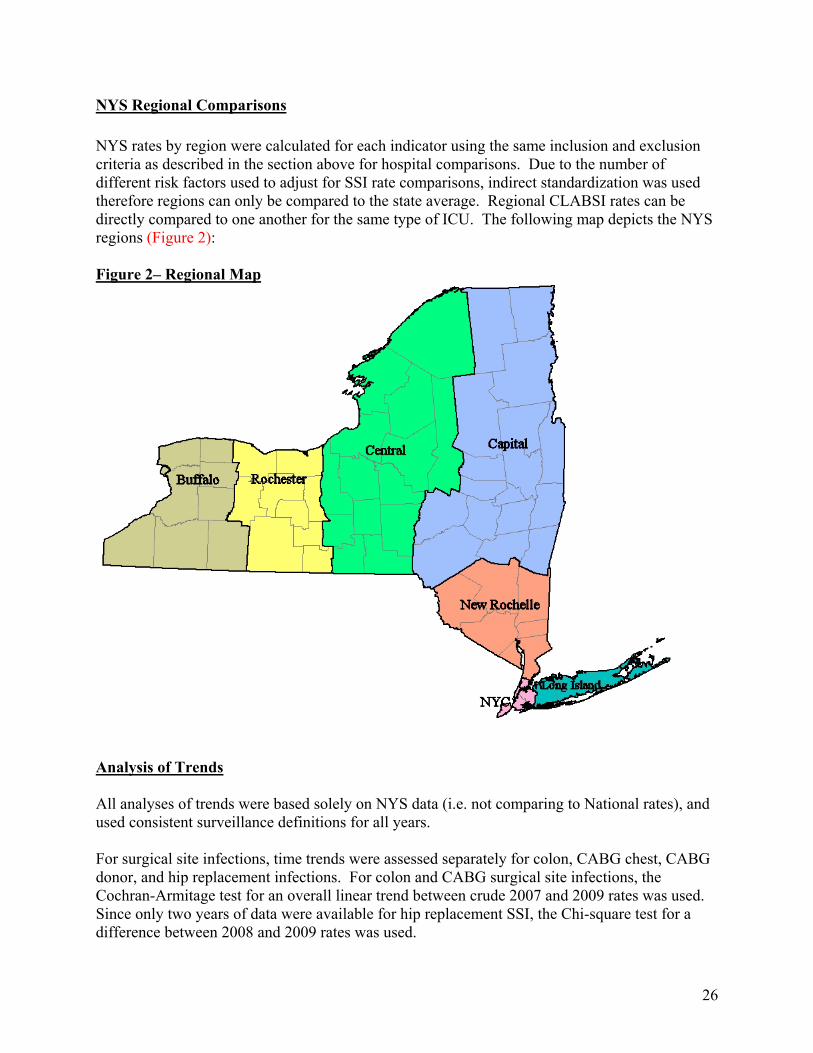
NYS Regional Comparisons NYS rates by region were calculated for each indicator using the same inclusion and exclusion criteria as described in the section above for hospital comparisons. Due to the number of different risk factors used to adjust for SSI rate comparisons, indirect standardization was used therefore regions can only be compared to the state average. Regional CLABSI rates can be directly compared to one another for the same type of ICU. The following map depicts the NYS regions (Figure 2): Figure 2– Regional Map
Analysis of Trends All analyses of trends were based solely on NYS data (i.e. not comparing to National rates), and used consistent surveillance definitions for all years. For surgical site infections, time trends were assessed separately for colon, CABG chest, CABG donor, and hip replacement infections. For colon and CABG surgical site infections, the Cochran-Armitage test for an overall linear trend between crude 2007 and 2009 rates was used. Since only two years of data were available for hip replacement SSI, the Chi-square test for a difference between 2008 and 2009 rates was used.

27
For blood stream infections (BSIs), a linear trend in crude Poisson rates was also tested within each type of ICU (results not shown). In addition, time trends were assessed using the standardized infection ratio (SIR) methodology suggested by the CDC.9 The SIR is defined in this analysis as the number of observed infections in 2009, divided by the number of infections that would have been expected if NYS CLABSI rates had not changed since 2007. Possible changes in the use of central lines in ICUs between 2007 and 2009 are taken into account by adding up the number of ICU-specific observed and expected infections across the different types of ICU. An SIR of 1 would mean that there was no change in infection rates, after adjusting for type of ICU. An SIR of 0.8 would mean that there was a 20% reduction in infection rates, after adjusting for type of ICU. Note: In 2007 hospitals with four or more adult and pediatric ICUs, BSI surveillance was only required for three consecutive months in each ICU, however the majority of facilities chose to report the entire year. Beginning in 2008, BSI surveillance in all ICUs was required for the entire year.
Colon Surgical Site Infection Rates National and NYS Colon SSI Rates In 2009, the NYS colon SSI rate (5.3 per 100 procedures) was lower than the national baseline (5.6 per 100 procedures), although the difference was not statistically significant. Annual NYS colon SSI rates have fluctuated between 5.9 per 100 procedures in 2007, 4.9 per 100 procedures in 2008, and 5.3 per 100 procedures in 2009 (Figure 3). The downward trend was statistically significant (p = 0.009 Cochran-Armitage Test for Trend). In 2009, 929 colon SSIs were reported in NYS hospitals. Of these, 588 (63 percent) were identified during the initial hospitalization, 252 (27 percent) were identified upon readmission to the same hospital, 86 (9 percent) were detected in outpatient settings and 3 (<1 percent) involved a readmission to another hospital. Of the 86 infections detected in outpatient settings, 77 (90 percent) were superficial infections (Table 1). Detection of SSIs in outpatient settings is extremely variable, labor-intensive, and not standardized across hospitals; therefore, the Department did not include these infections in the regional and hospital-specific comparisons. Colon SSI Regional Comparisons Colon SSI rates were significantly higher in New York City (5.6 per 100 procedures) and lower in the New Rochelle Region (3.7 per 100 procedures) when compared to the state average (4.8 per 100 procedures) (Table 2). Hospital-Specific Colon SSI Rate Comparisons Of the 174 hospitals performing colon surgery in 2009, 21 performed fewer than 20 procedures and were not compared to the state average. Twelve hospitals had rates that were statistically higher than the state average and twelve had rates that were statistically lower than the state

28
average. Of the 9 hospitals that had significantly high colon SSI rates in 2008, only one continued to be significantly higher than the state average in 2009. In 2009, 37 (21 percent) hospitals reported zero colon surgical site infections, but the majority of these facilities did not perform a sufficient number of procedures to report or if reported, to be statistically significant. There was no association between SSI rates and the number of procedures performed (Figure 4). Microorganisms Associated with Colon SSIs In NYS, the most common microorganisms associated with colon SSIs were Enterococci, Escherichia sp., and Staphylococcus aureus. Methicillin-Resistant Staphylococcus aureus (MRSA) would have been the seventh most common organism if considered separately from sensitive Staphylococcus aureus isolates. MRSA accounted for less than 7 percent of colon SSIs. Of the 17,475 colon surgery procedures, 64 (0.4 percent) resulted in an MRSA colon SSI (Table 3).
CABG Surgical Site Infection Rates CABG surgery usually involves two surgical sites: a chest incision and a separate site to harvest donor vessels. Because infections can occur at either incision site, the infection rates are presented separately. National and NYS CABG Chest SSI Rates In 2009, the NYS CABG chest SSI rate (2.2 per 100 procedures) was higher than the national baseline (2.0 per 100 procedures), although the difference was not statistically significant. Since reporting began in 2007, the CABG chest SSI rate in NYS has decreased significantly (Cochran-Armitage Test for Trend, p=0.02) (Figure 5). In 2009, 307 CABG chest SSIs were reported by the 40 hospitals performing CABG procedures in NYS. Of these, 73 (24 percent) were identified during the initial hospitalization, 221 (72 percent) were identified upon readmission to the same hospital, 12 (4 percent) were detected in outpatient settings and 1 (<1 percent) involved a readmission to another hospital (Table 4). Of the 12 infections detected in outpatient settings, 10 (83 percent) were superficial infections. Detection of SSIs in outpatient settings is extremely variable, labor-intensive, and not standardized across hospitals; therefore, the Department did not include these infections in the regional and hospital-specific comparisons. In NYS, regional and hospital-specific CABG chest SSI rates were further risk adjusted based upon the following patient-specific risk factors: diabetes, obesity, end stage renal disease, female gender, chronic obstructive pulmonary disease (COPD), and Medicaid status.

29
CABG Chest SSI Regional Comparisons Within NYS, Buffalo (3.5 per 100 procedures) and NYC (2.9 per 100 procedures) regions had significantly higher CABG chest SSI rates and Rochester (1.3 per 100 procedures), New Rochelle (1.3 per 100 procedures) and Long Island (1.5 per 100 procedures) had significantly lower rates than the state average of 2.2 per 100 procedures (Table 2). Hospital-Specific CABG Chest SSI Rate Comparisons Hospital-specific CABG chest SSI rates are provided in Figure 6. In 2009, five hospitals had rates that were statistically higher than the state average and five hospitals had rates that were statistically lower than the state average. Of the five hospitals with high SSI rates in 2008, two remained statistically higher than the state average in 2009. The one hospital with a significantly lower CABG chest SSI rate in 2008 remained statistically lower than the state average in 2009. One hospital reported zero CABG chest site infections in 2009. There was no association between SSI rates and the number of procedures performed. Microorganisms Associated with CABG Chest SSIs The most common microorganisms associated with CABG chest SSIs were Staphylococcus aureus and coagulase negative staphylococci. MRSA would have been the third most common organism if counted separately from sensitive Staphylococcus aureus isolates. MRSA was associated with 13 percent of chest SSIs in CABG surgery. Of the 13,437 CABG procedures, 40 (0.3 percent) patients developed an MRSA CABG chest SSIs (Table 5). National and NYS CABG Donor Vessel SSI Rates In 2009, the NYS CABG donor vessel SSI rate (1.0 per 100 procedures) was higher than the national baseline rate (0.9 per 100 procedures), but the difference was not statistically significant. Since reporting began in 2007, the CABG donor SSI rate in NYS has not significantly changed (Cochran-Armitage Test for Trend, p=0.48) (Figure 7). In 2009, 129 CABG donor SSIs were reported by the 40 hospitals performing CABG procedures in NYS. Of these, 27 (21 percent) were identified during the initial hospitalization, 83 (64 percent) were identified upon readmission to the same hospital, 19 (15 percent) were detected in outpatient settings, and none involved readmission to another hospital. Of the 19 infections detected in outpatient settings, 16 (84 percent) were superficial incisional infections (Table 6). Detection of SSIs in outpatient settings is extremely variable, labor-intensive, and not standardized across hospitals; therefore, the Department did not include these infections in the regional and hospital-specific comparisons. In NYS, regional and hospital-specific CABG donor SSI rates were further risk adjusted based upon the following patient-specific risk factors: body mass index, gender, diabetes, COPD, congestive heart failure, age over 75, and emergency/trauma.

30
CABG Donor Vessel SSI Regional Comparisons The CABG donor vessel SSI rate was significantly higher in the New York City region (1.2 per 100 procedures) when compared to the state average (0.9 per 100 procedures). New York City was the only region with a statistically significant difference in CABG donor vessel SSI rates (Table 2). Hospital-Specific CABG Donor Vessel SSI Rate Comparisons Hospital-specific CABG donor vessel SSI rates are provided in Figure 8. In 2009, three hospitals had CABG donor vessel SSI rates that were statistically higher than the state average and one hospital had a rate that was statistically lower than the state average. Of the five hospitals with statistically higher CABG donor SSI rates in 2008, only one remained higher than the state average in 2009. Of the three hospitals with statistically lower CABG donor SSI rates in 2008, only one remained lower than the state average in 2009. Seven (18 percent) hospitals reported zero CABG donor vessel site infections in 2009. There was no association between SSI rates and the number of procedures performed. Microorganisms Associated with CABG Donor Site SSIs The most common microorganisms associated with CABG donor vessel site SSIs were Staphylococcus aureus, Escherichia sp. and enterococci. MRSA would have been the seventh most common organism if counted separately from sensitive Staphylococcus aureus isolates. MRSA was associated with 9 percent of CABG donor vessel SSIs. Of the 12,414 CABG procedures involving a separate donor vessel site, 12 (0.1 percent) patients developed an MRSA CABG donor vessel SSI (Table 7). Hip Surgical Site Infection Rates National and NYS Hip SSI Rates HIP SSI rates became reportable in 2008. After applying the NHSN risk adjustment strategy, the NYS hip SSI rates in 2008 and 2009 were the same as the national baseline rate (2006-2008). The national and NYS rates were 1.3 hip SSIs per 100 procedures (Figure 9). In 2009, 169 hospitals performed hip surgery. Of the 311 hip SSIs reported, 34 (11 percent) were identified during the initial hospitalization, 243 (78 percent) were identified upon readmission to the same hospital, 27 (9 percent) were identified in outpatient settings and 7 infections (3 percent) involved a readmission to another hospital (Table 7). Of the 27 infections that were detected in outpatient settings, 24 (89 percent) were superficial incisional infections, 1 (4 percent) infection was a deep incisional infection, and 2 (7 percent) were organ space infections. Since detection of SSIs in outpatient settings is extremely variable, labor intensive, and could not be standardized across hospitals; the Department did not include the infections identified in outpatient settings in the regional and hospital-specific comparisons (Table 8).

31
In NYS, regional and hospital-specific hip SSI rates were further adjusted for type of procedure (total versus partial and replacement versus revision). This information was not available at the national level and therefore, could not be used for NYS and national comparisons. Hip SSI Regional Comparisons Within NYS, the rate of hip SSIs was significantly lower in the Central Region when compared to the statewide average. No other statistically significant regional differences were identified (Table 2). Hospital-Specific Hip SSI Rate Comparisons Hospital-specific hip SSI rates are provided in Figure 10. In 2009, six hospitals had hip SSI rates that were statistically higher than the state average and one hospital had a rate that was statistically lower than the state average. Of the four hospitals with statistically higher rates in 2008, none were significantly higher in 2009. The only hospital with a significantly lower hip SSI rate in 2008 continued to be significantly low in 2009. Sixty-six (39 percent) hospitals reported zero hip SSIs in 2009. Since hip replacements involve implanted hardware, infections may not be evident for up to one year after the procedure. Therefore, the reported 2008 SSI rates changed slightly between last year’s report and this report. High surgical volume within hospitals was associated with decreased infection rates. Microorganisms Associated with Hip SSIs The most common microorganisms associated with hip SSIs were Staphylococcus aureus, coagulase negative staphylococci, and enterococci. MRSA was the most common organism if counted separately from sensitive Staphylococcus aureus isolates. MRSA was associated with 33 percent of hip SSIs. Of the 25,849 hip surgeries performed, 102 (0.4 percent) patients developed an MRSA SSI (Table 9). CLABSIs in Adult/Pediatric ICUs National and NYS CLABSI Rates in Adult/Pediatric ICUs Compared to national baseline rates (2006-2008), NYS had a significantly higher CLABSI rate in non-teaching medical-surgical ICUs but a significantly lower rate in pediatric ICUs in 2009. None of the other adult ICU CLABSI rates in 2009 were significantly different than the national baseline rates (2006-2008) for the specific ICU. Since 2007, there was an 18 percent reduction in adult/pediatric CLABSI rates in NYS after adjusting for type of ICU. The significant decreases occurred in Cardiothoracic ICUs, Medical ICUs in non-teaching hospitals, Pediatric ICUs, and Surgical ICUs. The major decline occurred between 2008 and 2009. None of the ICUs had a significant increase in CLABSI rates between 2007 and 2009 (Table 10).

32
Using the standardized infection ratio methodology suggested by the CDC, the number of observed CLABSIs (N=1066) in 2009 was compared to the number of expected CLABSIs (N=1305) based on rates in 2007 (Table 11). Using the 2007 consumer price index (CPI) for inpatient hospital services, the dollar savings was estimated to be between $1.7 million and $7.0 million in adult and pediatric ICUs.2 After consultation with the technical advisory workgroup, a custom field was added to the reporting system in 2008 to document likely contamination rather than true infection. These events involve situations in which multiple blood cultures were obtained but only one specimen was positive, the one positive was thought to be a contaminant and either no treatment was given or treatment was discontinued upon reviewing the blood culture results. These events were deleted from New York State regional and hospital-specific infection rate comparisons but were not deleted in the national comparisons since the information was not available on the national level. CLABSI Rates in Adult/Pediatric ICUs - Regional Comparisons (Table 2) Within NYS, regional CLABSI rates were compared to the state average for the specific type of ICU. The following differences in regional CLABSI rates by type of ICU were seen in 2009:
• Cardiothoracic ICU CLABSI rates were significantly lower in the Central Region. • Coronary ICU CLABSI rates were significantly lower in the Central and New
Rochelle Regions. • Medical ICU CLABSI rates in teaching hospitals were not significantly different in
any Region. • Medical ICU CLABSI rates in non-teaching hospitals were significantly higher in the
New Rochelle Region. • Medical-Surgical ICU CLABSI rates in teaching hospitals were significantly higher
in the Buffalo Region. • Medical-Surgical ICU CLABSI rates in non-teaching hospitals were significantly
higher in NYC and significantly lower in the Central Region. • Neurosurgical ICU CLABSI rates were significantly higher in the New Rochelle
Region. • Pediatric ICU CLABSI rates were significantly lower in the Capital Region. • Surgical ICU CLABSI rates were significantly higher in the Buffalo Region and
significantly lower in the Central Region. There did not appear to be consistent regional differences in CLABSI rates by type of ICU between 2008 and 2009. Hospital-Specific CLABSI Rates in Adult and Pediatric ICUs Within NYS, hospital-specific CLABSI rates were compared to the state average for the specific type of ICU. If CLABSI rates are statistically lower than the state average, the bar is blue and if

33
statistically higher, the bar is red (Figures 11 –19). The following statistically significant differences were seen in 2009:
• Hospital-Specific Cardiothoracic ICU CLABSI rates were not significantly different in any hospital when compared to the state average.
• Hospital-Specific Coronary ICU CLABSI rates were not significantly different in any hospital when compared to the state average.
• Hospital-Specific Medical ICU CLABSI rates in teaching hospitals were significantly higher in two hospitals when compared to the state average. One of the hospitals with a significantly higher rate in 2009 was also higher than the state average in 2008.
• Hospital-Specific Medical ICU CLABSI rates in non-teaching hospitals were significantly higher in two hospitals when compared to the state average. Neither of these hospitals with a significantly higher rate in 2009 was higher than the state average in 2008.
• Hospital-Specific Medical-Surgical ICU CLABSI rates in teaching hospitals were significantly higher in three hospitals and lower in two hospitals when compared to the state average. None of the hospitals with a significantly higher rate in 2009 were higher than the state average in 2008. One of the hospitals with a lower rate in 2009 was also lower than the state average in 2008.
• Hospital-Specific Medical-Surgical ICU CLABSI rates in non-teaching hospitals were significantly higher in seven hospitals and lower in four hospitals when compared to the state average. Two of the hospitals with a higher rate in 2009 were also higher than the state average in 2008. Two of the hospitals with a lower rate in 2009 were also lower than the state average in 2008.
• Hospital-Specific Neurosurgical ICU CLABSI rates were significantly higher in one hospital when compared to the state average. The hospital with a higher rate in 2009 was not significantly different than the state average in 2008.
• Hospital-Specific Pediatric ICU CLABSI rates were significantly higher in two hospitals and lower in one hospital when compared to the state average. The hospital with the significantly lower rate in 2009 had been significantly higher than the state average in 2008.
• Hospital-Specific Surgical ICU CLABSI rates were significantly higher in five hospitals and one hospital was significantly lower when compared to the state average. Two of the hospitals with a significantly higher rate in 2009 were also higher than the state average in 2008.
Some hospitals have reported zero CLABSIs in specific ICUs although the rate may not be statistically significant due to the lower number of patients and days with a central line. The following number and percent reported zero infections by ICU type:
• 10/33 (33 percent) Cardiothoracic ICUs • 14/46 (30 percent) Coronary ICUs • 0/20 (0 percent) Medical ICUs in teaching hospitals • 4/25 (16 percent) Medical ICUs in non-teaching hospitals • 2/17 (12 percent) Medical-Surgical ICUs in teaching hospitals • 42/113 (37 percent) Medical-Surgical ICUs in non-teaching

34
• 2/15 (13 percent) Neurosurgical ICUs • 16/30 (53 percent) Pediatric ICUs • 5/39 (13 percent) Surgical ICUs
Microorganisms Associated with CLABSIs in Adult and Pediatric ICUs (Table 12) The most common microorganisms identified in adult/pediatric ICU-related CLABSIs were enterococci, coagulase negative staphylococci, yeast and Klebsiella species. MRSA was the eighth most common organism, accounting for 4 percent of adult/pediatric CLABSIs. Lessons for Safety and Quality Improvement for Prevention of CLABSIs NYS CLABSI rates in adult and pediatric ICUs have decreased significantly between 2007 and 2009. Using the 2007 consumer price index (CPI) for inpatient hospital services, the dollar savings in 2009 was estimated to be between $1.7 million and $7.0 million in adult and pediatric ICUs.2 NYS conducts intensive audits to assure complete and accurate reporting of HAIs. At the present time, only four other states conduct audits on CLABSI rates. All of the states conducting audits have higher rates of CLABSI when compared to national data. Unless or until other states have the same extensive audit processes, comparisons with national rates may be misleading. Although there is a great deal of media attention surrounding MRSA, this organism is not a major cause of CLABSIs in NYS ICUs and therefore, targeting resources solely for prevention of MRSA-associated CLABSIs in ICUs is not warranted.
National and NYS CLABSI and UCABSI Rates in Neonatal ICUs (NICUs) Regional Perinatal Center (RPC) and Level III NICU CLABSI and UCABSI Rates CLABSI and UCABSI rates in RPCs and Level III NICUs must be combined for national comparisons since the RPC designation is not used nationally. After adjusting for birth weight distribution, the NYS RPC/Level III NICU CLABSI rate in 2009 (2.4 per 1000 line days) was significantly lower than the national baseline rate (2.9 per 1000 line days in 2006-2008) (Figure 20). Between 2007 and 2009, the CLABSI rates in NYS RPC/Level III NICUs have decreased significantly (p<0.01 Poisson Trend Test). The significantly decreased rate in 2009 was associated with the prevention of CLABSI in RPCs. The rate of CLABSIs in Level III NICUs increased in 2009, although the increase was not statistically significant (p=0.08 Poisson Trend Test) (Figure 21).

35
After adjusting for birth weight distribution, the NYS RPC/Level III NICU UCABSI rate in 2009 (1.8 per 1000 line days) was not significantly different the national baseline rate (1.9 per 1000 line days in 2006-2008) (Figure 22). Between 2007 and 2009, the UCABSI rates in NYS RPC/Level III NICUs decreased significantly (p<0.01 Poisson Trend Test). The significant decrease in 2009 occurred in RPCs (3.2 to 1.4 per 1000 umbilical catheter days) (p<0.01 Poisson Trend Test). Although the UCABSI rate decreased in Level III NICUs (3.7 to 2.8 per 1000 umbilical catheter days), the decrease was not statistically significant (p=0.74 Poisson Trend Test). Level II/III NICU CLABSI and UCABSI Rates After adjusting for birth weight distribution, the NYS Level II/III NICU CLABSI rate in 2009 (3.3 per 1000 line days) was not statistically different than the national baseline rate of 2.6 per 1000 line days in 2006-2008 (Figure 23). Between 2007 and 2009, the CLABSI rates in NYS Level II/III NICUs did not change significantly (p=0.28 Poisson Trend Test). After adjusting for birth weight distribution, the NYS Level II/III NICU UCABSI rate in 2009 (3.6 per 1000 umbilical catheter days) was not significantly different the national baseline rate (2.3 per 1000 line days in 2006-2008) (Figure 24). Between 2007 and 2009, the UCABSI rates in NYS Level II/III NICUs did not change significantly (p=0.32 Poisson Trend Test). CLABSI and UCABSI Rates in Neonatal ICUs - Regional Comparisons In NYS, a custom field was used to identify cases in which multiple blood cultures were obtained, only one specimen was positive, the one positive was considered a contaminant and no treatment was given. These events were deleted from the regional and hospital-specific infection rates but were not deleted in national comparisons since the information was not available on the national level. For all NYS NICU CLABSI and UCABSI regional analyses, three categories of NICU are used: RPC, Level III, and Level II/III. In 2009, there was only one regional difference in CLABSI rates: the RPC CLABSI rate in the Capital Region was significantly lower than the state average (Table 2). Hospital-specific CLABSI Rates in NICUs For all hospital-specific CLABSI analyses, three categories of NICU are used: RPC, Level III and Level II/III. Among the 18 RPCs, there were two hospitals with significantly higher CLABSI rates. One hospital had a significantly lower CLABSI rate and only one infection. One hospital had zero CLABSIs but the rate was not statistically significant. The risk-adjusted CLABSI rates in RPCs ranged from 0.0 to 8.8 per 1000 line days (Figure 25).

36
Among the 21 Level III NICUs, there was one hospital with a statistical higher CLABSI rate and one hospital did not have the minimum of 50 central line days to include in the report. Of the 20 Level III NICUs with sufficient central line days, five reported zero CLABSIs in 2009. The risk-adjusted Level III CLABSI rates ranged from 0.0 to 19.0 per 1000 central line days. This wide range is due to the relatively infrequent use of central lines in this patient population (Figure 26). Among the 14 Level II/III NICUs, there was one hospital with a statistically higher CLABSI rate and six reported zero CLABSIs in 2009. The rates ranged from 0.0 to 33.9 per 1000 central line days. This wide range is due to the relatively infrequent use of central lines in this patient population (Figure 27). Microorganisms Associated with CLABSIs in NICUs – Table 13 The most common microorganisms identified in NICU-related CLABSIs were coagulase negative staphylococci, Staphylococcus aureus, yeast and enterococci. MRSA was the seventh most common organism, accounting for less than 5 percent of these infections.
Umbilical Catheter-Associated Bloodstream Infection Rates in Neonatal ICUs Hospital-Specific UCABSI Rates in NICUs (Figures 28-30) For all hospital-specific UCABSI analyses, three categories of NICU are used: RPC, Level III and Level II/III. Two hospitals had significantly higher UCABSI rates, one Level III facility and one Level II/III NICU facility. Eight (44 percent) of the 18 RPCs had zero UCABSIs. Risk-adjusted UCABSI rates ranged from 0.0 to 5.0 per 1000 umbilical catheter days in RPCs. There were no statistically significant differences. Ten (48 percent) of the 21 Level III NICUs had zero UCABSIs. The risk-adjusted UCABSI rates ranged from 0.0 to 9.2 per 1000 umbilical catheter days. Only one Level III facility had a significantly higher UCABSI rate. Five (36 percent) of the 14 Level II/III NICUs had zero UCABSIs. The UCABSI rates ranged from 0.0 to 32.8 per 1000 umbilical catheter days. This wide range is due to the relatively infrequent use of umbilical lines in this patient population. Only one Level II/III had a significantly higher UCABSI rate. Microorganisms Associated with Umbilical Catheter-Associated BSIs in NICUs – Table 14 The most common microorganisms identified in NICU-related UCABSIs were coagulase negative staphylococci, Staphylococcus aureus and yeast. Six of the infections involved MRSA (10 percent).

37
Lessons for Safety and Quality Improvement for Prevention of CLABIs and UCABSIs in NICUs NYS CLABSI and UCABSI rates in NICUs have decreased significantly between 2007 and 2009 (Table 15). Using the standardized infection ratio methodology suggested by the CDC, the number of observed CLABSIs and UCABSIs (N=234) in 2009 was compared to the number of expected CLABSIs and UCABSIs (N=339) based on rates in 2007. Using the 2007 consumer price index (CPI) for inpatient hospital services, the dollar savings associated with the decrease in 2009 was estimated to be between $765,000 and $3.1 million in NICUs. The methods used to derive these estimates were developed by CDC.2 The substantial decrease in NICU CLABSI rates occurred in RPCs throughout the state. This decrease was associated with a NYSDOH-funded NICU CLABSI collaborative prevention project designed and implemented by RPCs throughout the state. This effort will be expanded to the affiliated Level III NICUs in 2010. Level III NICUs had an increase in CLABSIs in 2009 thus these prevention efforts are of critical importance. Survey of Personnel Resources for Infection Prevention and Control in NYS Hospitals – (Figures 31-32) To measure the impact of mandatory HAI reporting on infection prevention personnel and programs, an infection prevention and control resource survey was conducted in the summer of 2009. Information was obtained on the number of infection preventionists (IPs) and hospital epidemiologists (HEs); IP/HE educational background and certification; infection control program support services; activities and responsibilities of infection prevention and control program staff; and an estimate of time dedicated to various activities, including surveillance. This report includes a figure with the average number of full-time-equivalent (FTE) infection preventionists to acute care (AC) beds and the average FTE infection preventionists to an aggregate measure that takes into consideration the number of ICU beds, long term care beds, dialysis centers, ambulatory surgery centers, ambulatory clinics and private physician offices in addition to acute care beds (Figure 31). The following equivalents were used: ICU bed = 2 acute care beds; long term care bed = ½ an acute care bed; dialysis facility = 50 acute care beds; ambulatory surgery center = 50 acute care beds; ambulatory clinic = 10 acute care beds; and a private physician’s office = 5 acute care beds. In 2009, the average FTE infection preventionist in NYS was responsible for 138 acute care beds or an aggregate measure equivalent to 257 AC beds. These averages were calculated for each hospital and then the hospitals were ranked. Hospitals in the lowest 15th percentile using either infection prevention staffing measure were designated with a “Low” for low IP resources in Figure 32. Additional analyses will be performed to determine the association between IP resources and infection rates, prevention project involvement, and additional hospital-specific infection prevention measures.
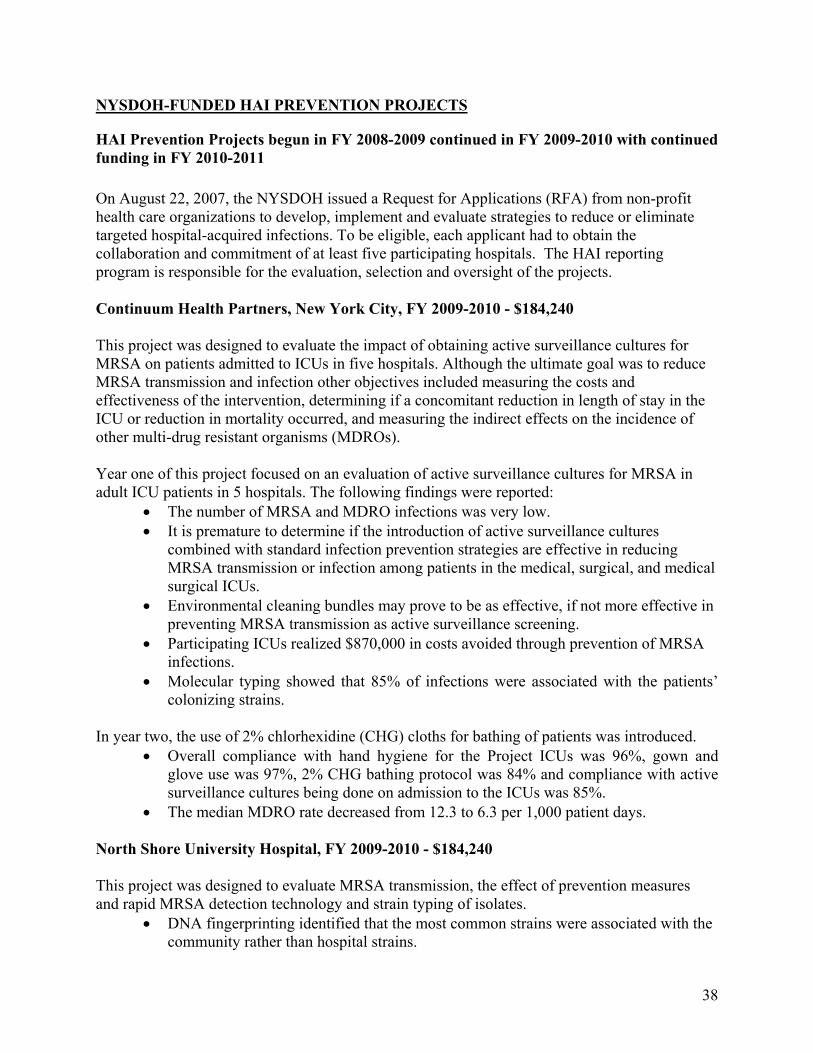
38
NYSDOH-FUNDED HAI PREVENTION PROJECTS
HAI Prevention Projects begun in FY 2008-2009 continued in FY 2009-2010 with continued funding in FY 2010-2011 On August 22, 2007, the NYSDOH issued a Request for Applications (RFA) from non-profit health care organizations to develop, implement and evaluate strategies to reduce or eliminate targeted hospital-acquired infections. To be eligible, each applicant had to obtain the collaboration and commitment of at least five participating hospitals. The HAI reporting program is responsible for the evaluation, selection and oversight of the projects. Continuum Health Partners, New York City, FY 2009-2010 - $184,240 This project was designed to evaluate the impact of obtaining active surveillance cultures for MRSA on patients admitted to ICUs in five hospitals. Although the ultimate goal was to reduce MRSA transmission and infection other objectives included measuring the costs and effectiveness of the intervention, determining if a concomitant reduction in length of stay in the ICU or reduction in mortality occurred, and measuring the indirect effects on the incidence of other multi-drug resistant organisms (MDROs). Year one of this project focused on an evaluation of active surveillance cultures for MRSA in adult ICU patients in 5 hospitals. The following findings were reported:
• The number of MRSA and MDRO infections was very low. • It is premature to determine if the introduction of active surveillance cultures
combined with standard infection prevention strategies are effective in reducing MRSA transmission or infection among patients in the medical, surgical, and medical surgical ICUs.
• Environmental cleaning bundles may prove to be as effective, if not more effective in preventing MRSA transmission as active surveillance screening.
• Participating ICUs realized $870,000 in costs avoided through prevention of MRSA infections.
• Molecular typing showed that 85% of infections were associated with the patients’ colonizing strains.
In year two, the use of 2% chlorhexidine (CHG) cloths for bathing of patients was introduced. • Overall compliance with hand hygiene for the Project ICUs was 96%, gown and
glove use was 97%, 2% CHG bathing protocol was 84% and compliance with active surveillance cultures being done on admission to the ICUs was 85%.
• The median MDRO rate decreased from 12.3 to 6.3 per 1,000 patient days. North Shore University Hospital, FY 2009-2010 - $184,240
This project was designed to evaluate MRSA transmission, the effect of prevention measures and rapid MRSA detection technology and strain typing of isolates.
• DNA fingerprinting identified that the most common strains were associated with the community rather than hospital strains.

39
• Patients admitted from the community (home) accounted for 53% of cases and the most common underlying conditions were cardiac disease, diabetes mellitus and hematologic disease.
• Healthcare-associated risk factors included surgery over the prior 12 months, repeat admissions over the prior 12 months and a history of antibiotic use over the prior 12 months.
University of Rochester School of Medicine & Dentistry, FY 2009-2010 - $184,240 This project was designed to reduce central line-associated bloodstream infections outside the ICU using evidence-based protocols for central line insertion and care. Six facilities are part of this Rochester Infection Prevention group: a tertiary care hospital, a large community hospital, a university hospital and several community hospitals. The project includes thirty-eight nursing units from these six facilities. Findings and accomplishments:
• The burden of CLABSI was high on non-ICU wards. • Between June 2008 and March 2010, the CLABSI rate decreased
o Overall from 2.8/1000 to 1.0/1000 CL days o On Medical/Surgical wards from 5.7/1000 to 2.1/1000 CL days
• Nursing staff play an important role in prevention of CLABSI o Units with nurse champion reduced CLABSI rate from 9.0/1000 central line
days to 3.0/1000 central line days • The use of a central line care maintenance protocol has led to a decrease of CLABSI
on the general medical wards. • Establishing innovative infection control practices requires a “culture change”
facilitated by leadership involvement and identifying champions. • Participation in this prevention project has earned the Infection Preventionists in the
Rochester Finger Lakes APIC Chapter national recognition as recipients of the 2009 APIC Chapter Excellence Award in Research. This award is given to the Chapter that best demonstrates excellence in supporting, promoting and publicizing research in infection surveillance, prevention and control.
1Estimating Central Line Days Outside ICU Using Weekly Device Use Ratio. Mark Shelly MD, Ghinwa Dumyati, MD. Abstract presented at SHEA March, 2009. 2 New York State Infection Prevention Grant to study Central Line Infections. Linda Greene RN, MPS, CIC. Abstract to be presented at APIC June, 2009. 3The Burden of Central Line Associated Blood Stream Infections in Non-ICU Patients: Results of Multi-Hospital Surveillance in Rochester, NY. Ghinwa Dumyati MD, et al. Abstract presented at SHEA March, 2009.
Westchester County Healthcare Corporation, FY 2009-2010 - $184,240
This two-year project involving five hospitals was designed to reduce the incidence of hospital-associated bloodstream infections (BSI) in ICUs and respiratory care patients. The five hospital study in the five ICU and one respiratory care unit evaluated the impact of daily CHG bathing on healthcare-

40
associated bloodstream infections and blood culture contaminants. The following results were identified:
• Statistically significant reductions in health care associated bloodstream infections (4.5 to 2.0 per 1000 patient days), CLABSIs (8.7 to 3.9 per 1000 CL days), and contaminated blood cultures.
• Chlorhexidine bathing had minimal risk and was well tolerated by patients. Joan & Sanford I. Weill Medical College of Cornell University, 10/1/08-9/30/10 - $186,169 All eighteen Regional Perinatal Centers (RPC) have participated in a two-year CLABSI prevention project in the neonatal intensive care units (NICUs). The first year was used to develop and standardize the prevention bundle, implement a set of evidence-based practice recommendations, design implementation and evaluation tools, monitor compliance with the prevention bundle and monitor the effectiveness of these efforts on CLABSI rates. In year two, the tools and practices will be expanded to the Level III NICUs across the state. The following results have occurred:
• The overall RPC NICU CLABSI rate decreased by 67 percent. • The standardized evidence-based NICU central line (CL) care bundle has
demonstrated its effectiveness in markedly reducing CLABSI rates. • The use of CL insertion and daily care checklists were associated with decreased
CLABSI rates.
HAI Prevention Project initiated March 1, 2009 Greater New York Hospital Association (GNYHA) 4/01/09-3/31/10 - $184,000 GNYHA and the United Hospital Fund collaborated on an initiative to design and implement an antimicrobial stewardship program (ASP) in three acute care and three long-term care facilities. The goal of this initiative was to develop a toolkit that included a “bundle” of evidence-based practices that can be used by healthcare facilities to implement an effective and sustainable antimicrobial stewardship program. The following accomplishments have been achieved:
• Tool kit has been developed and disseminated to the six participating health care facilities. The tool contains or will contain:
• Materials are designed to assess baseline knowledge of antibiotic prescribing practices and antimicrobial resistance.
• Education materials including clinician and administrator oriented presentations, a teaching guide, and a clinical assessment for prescribing physicians.
• Marketing tools to be used by various departments when implementing an antimicrobial stewardship program will also be incorporated into the toolkit.
• Stewardship team strategies and their importance in the success of an ASP.

41
SUMMARY OF HAI RATES A summary of hospital-specific infection rates for all HAI indicators is provided in Table 16. Surgical Site Infection Summary: Among the tracked surgeries, the unadjusted infection rates were highest for colon surgery (5.3%), followed by CABG surgery (2.3% for chest site infections and 1.0% for donor site infections), and lastly hip replacement surgery (1.3%) for operations performed in New York State in 2009. Colon SSIs: Since 2007, there has been a significant decrease in colon SSI rates but the majority of the decline occurred in 2008. The 2009 NYS colon SSI rate was not significantly different than national baseline rate (2006-2008). CABG SSIs: Since 2007, there has been a significant decrease in CABG chest SSI rates. The rate decreased in 2008 and remained low in 2009. Whereas the 2007 NYS CABG chest SSI rate was significantly higher than national baseline rate, the 2008 and 2009 NYS CABG chest SSI rates were not significantly different from the national baseline. Hip SSIs: Since reporting of hip SSI rates began in 2008, the NYS rates have not changed nor have the rates been significantly different that national baseline rate Adult and Pediatric ICU CLABSI Rates: NYS CLABSI rates in adult and pediatric ICUs have decreased significantly between 2007 and 2009. Using the 2007 CPI for inpatient hospital services, the dollar savings in 2009 was estimated to be between $1.7 million and $7.0 million in adult and pediatric ICUs.2 Neonatal ICU CLABSI Rates: NYS CLABSI and UCABSI rates in NICUs have decreased significantly between 2007 and 2009. Using the 2007 CPI for inpatient hospital services, the dollar savings associated with the decrease in 2009 was estimated to be between $765,000 and $3.1 million in NICUs. The methods used to derive these estimates were developed by CDC.2 The substantial decrease in NICU CLABSI rates occurred in RPCs throughout the state. This decrease was associated with a NYSDOH-funded NICU CLABSI collaborative prevention project designed and implemented by RPCs throughout the state. This effort will be expanded to the affiliated Level III NICUs in 2010. Level III NICUs had an increase in CLABSIs in 2009 thus these prevention efforts are of critical importance.

42
HAI REPORTING – LESSONS LEARNED The Department and hospitals, through annual on-site audits, monthly data checks, newsletters, and regional conference calls, have learned the following important lessons regarding HAI reporting:
1. The NHSN is a useful tool in monitoring the infection rates and the effectiveness of prevention strategies. Hospitals have continuous access to their own data and can compare their rates to national levels and monitor trends over time. Groups such as the Department of Health and other quality improvement projects can have continuous access to the data reported by the hospitals for continuous, consistent, and real-time surveillance.
2. Surveillance lessons: a. Strict adherence to the surveillance definitions is critical to provide consistency
and comparability of data across hospitals. Additional clinical findings are appropriate for treatment decisions but may not be available or appropriate for mandatory reporting purposes due to variation between providers and institutions.
b. Post-discharge surveillance methods are highly variable, dependent upon allocated resources, integration of information systems, and when performed, result in higher infection rates. The majority of severe infections are detected during the initial hospitalization or upon readmission. In order to fairly compare hospitals and not penalize facilities with the best surveillance systems, the NYSDOH did not include surgical site infections detected solely by post-discharge surveillance but is continuing to monitor the impact of this omission.
c. Use of additional patient-specific risk information improved the ability to compare hospital-specific coronary artery bypass graft and hip replacement surgical site infection rates. The data in this report have been adjusted for these factors.
d. Timely and complete data submission was often affected by infection control staffing turnover, vacant positions and the need for education and training to comply with the legislative mandate. Hospitals need to provide back-up personnel to ensure compliance with reporting requirements and patient safety.
e. Hospitals need to integrate health information technology systems to support infection prevention and reporting efforts. For example, only 30 percent of hospitals have utilized electronic data entry of operating room procedure log information. The other 70 percent of hospitals are still manually entering this data into the NHSN.
f. NYS conducts intensive audits to assure complete and accurate reporting of HAIs. At the present time, only four other states conduct audits on CLABSI rates. All of the states conducting audits have higher rates of CLABSI when compared to national data. Unless or until other states have the same extensive audit processes, comparisons with national rates may be misleading.

43
HAI REPORTING PROGRAM - NEXT STEPS The Department will work to improve HAI reporting and infection prevention efforts including taking the following actions:
1. Integrate the hospital-specific infection rates into the Department’s hospital profile web site.
2. Continue to monitor the accuracy and timeliness of data being submitted, discuss findings and ensure corrective action is taken.
3. Conduct onsite audits to evaluate surveillance methods, enhance surveillance definitions, and assess completeness and accuracy of reporting.
4. Continue to provide education, training and ongoing support to hospital infection reporting staff.
5. Continue to evaluate the impact of post-discharge surveillance on surgical site infection rates and implications for public reporting.
6. Evaluate and monitor the effect of prevention practices on infection rates. 7. Evaluate the relationship between infection prevention personnel resources and
surveillance activities, infection rates, and prevention projects. 8. Collaborate with other department staff to investigate outbreaks and evaluate emerging
trends. 9. Consult with infection preventionists, hospital epidemiologists, surgeons and the Cardiac
Advisory Committee to identify risk factors and prevention strategies to reduce HAIs. 10. Monitor HAI prevention projects for compliance with program objectives, fiscal
responsibility and potential applicability to other hospitals or healthcare settings. 11. Continue to work with the TAW to monitor, evaluate, and select mandatory reporting
indicators; evaluate system modifications, identify and evaluate risk factors, refine methods of risk adjustment and presentation of the data.
HAI Reporting Indicators for 2010 The Department will continue to require the same HAI reporting indicators in 2010 as were reported in 2009. In addition, Clostridium difficile infection rates using a new proxy indicator (Laboratory Identified Events) will be required and results for 2010 will be reported in next year’s report.

44
Program Personnel Central Office Bureau Director – Rachel L. Stricof, MT, MPH, CIC Program Director – Carole Van Antwerpen, RN, BSN, CIC State HAI Plan Coordinator – Cindi Dubner, BS Data Manager – Valerie Haley, MS Data Analyst – Boldtsetseg Tserenpuntsag, DrPh Data Analyst – KuangNan (Harry) Xiong, MS Administrative Assistant – Patricia Lewis, AAS Secretary - Kijiafa Burr, AAS Regional Staff Western Region – Peggy Hazamy, RN, BSN, CIC Central Region - Diana Doughty, RN, MBA, CIC, CPHQ Capital Region – covered by Carole Van Antwerpen and Diana Doughty New Rochelle Region – Victor J. Tucci, MPH, CIC Long Island Region – Marie Tsivitis, MPH, CIC New York City Region – Kathleen Gase, MPH, CIC Student from the State University at Albany School of Public Health Jessica Nadeau, MPH
Abbreviations AC – Acute Care ASA – American Society of Anesthesiologists’ Classification of Physical Status ASP – Antimicrobial Stewardship Program BSI – Bloodstream Infection CABG – Coronary Artery Bypass Graft Surgery CDC – Centers for Disease Control and Prevention CEOs – Chief Executive Officers CHF – Congestive Heart Failure CI – Confidence Interval CL – Central Line CLABSI – Central Line Associated Bloodstream Infection CNS – Coagulase Negative Staphylococcus CPI – Consumer Price Index CSEP – Clinical Sepsis CSRS – Cardiac Surgery Reporting System4
DIP – Deep Incisional Infection at the Primary Surgical Site (for CABG procedures, this would be the chest site) DIS – Deep Incisional Infection at the Secondary Surgical Site (for CABG procedures, this would be the donor vessel site)

45
DOH – New York State Department of Health FTE – Full-Time Equivalent GNYHA – Greater New York Hospital Association HAI – Hospital-Acquired Infection HE – Hospital Epidemiologist IC – Infection Control ICD-9 – International Classification of Diseases, Ninth Revision, Clinical Modification (ICD-9-CM) ICP – Infection Prevention and Control Specialist ICU – Intensive Care Unit IP – Infection Preventionist IT – Information Technology LCBI – Laboratory Confirmed Bloodstream Infection MDRO – Multi-Drug Resistant Organism MRSA – Methicillin-Resistant Staphylococcus aureus MSSA – Methicillin-Sensitive Staphylococcus aureus NICU – Neonatal Intensive Care Unit NHSN – National Healthcare Safety Network NYS – New York State NYSDOH – New York State Department of Health OR – Operating Room OR – Odds Ratio (statistical term) OS – Organ Space Infection PDS – Post-Discharge Surveillance PHL – Public Health Law RPC – Regional Perinatal Center (Level IV – highest level of NICU care) SHEA – Society for Healthcare Epidemiology of America SIP – Superficial Incisional Infection at the Primary Surgical Site (for CABG procedures, this
would be the chest site) SIS – Superficial Incisional Infection at the Secondary Surgical Site (for CABG procedures, this
would be the donor vessel site) SPARCS - Statewide Planning and Research Cooperative System6
SSI – Surgical Site Infection TAW – Technical Advisory Workgroup UC – Umbilical Catheter UCABSI – Umbilical Catheter-Associated Blood Stream Infection VAP – Ventilator-Associated Pneumonia VRE – Vancomycin-Resistant Enterococci

46
Glossary of Terms Term Definition Active Surveillance
A system used by a trained infection preventionist (IP) to look for infections during a patient’s hospital stay. A variety of tools are used to identify infections and determine if they are related to their hospital stay or if the infection was present on hospital admission. These tools may include, but are not limited to, information from laboratory, radiology, operation, pharmacy reports and nursing care units and/or patient treatment areas.
ASA Score
This is a scale used by the anesthesiologist to classify the patient’s physical condition prior to surgery. It uses the American Society of Anesthesiologist (ASA) Classification of Physical Status. It is one of the factors that help determine a patient’s risk of possibly developing a SSI. Here is the ASA scale: Normally healthy patient Patient with mild systemic disease Patient with severe systemic disease Patient with an incapacitating systemic disease that is a constant threat to life A patient who is not expected to survive with or without the operation.
Birth weight Categories
Birth weight refers to the weight of the infant at the time of birth. Infants remain in their birth weight category even if they gain weight. Birth weight category is important because the lower the birth weight, the higher the risk of developing an infection.
Body Mass Index (BMI)
BMI is a measure of the relationship between a person’s weight and their height. It is calculated with the following formula: kg/m2.
Central Line A Central Line is a tube that is placed into a patient’s large vein, usually in the neck, chest, arm or groin. A central line is needed to give fluids, medication, withdraw blood, and for monitoring the patient’s condition.
Central Line Bloodstream Infection (CLABSI)
A bloodstream infection can occur when microorganisms travel around and through a central line or umbilical catheter and then enter the blood.
Central Line Bloodstream Infection (CLABSI) Rate
To get this rate, we divide the total number of central line-associated bloodstream infections by the number of central line days. That result is then multiplied by 1,000. Lower rates are better.
Central Line Days (Device Days)
This is the total number of days a central line is used for patients in an ICU or a NICU. A daily count of patients with a central line in place is performed at the same time each day. Each patient with one or more central lines at the time the daily count is performed is counted as one central line day.
Clinical Sepsis A patient 1 year of age or younger who has at least one of the following clinical signs or symptoms with no other recognized cause: fever greater than 38° C. taken rectally, hypothermia ( less than 37°C.), temporary absence of breathing, or an abnormally slow heart rate; and blood culture not done or no organisms detected in blood and no apparent infection at another site, and

47
physician institutes treatment for sepsis. Colon Surgery Colon surgery is a procedure performed on the lower part of the digestive tract
also known as the large intestine or colon. Confidence Intervals
The confidence interval for a hospital’s infection rate is the range of possible rates within which there is a 95% confidence that the real infection rate for that hospital lies, given the number of infections and procedures that were observed in that hospital in a specific time period.
Coronary Artery Bypass Graft Surgery
Coronary artery bypass graft (CABG) surgery is a treatment for heart disease in which a vein or artery from another part of the body is used to create an alternate path for blood to flow to the heart, bypassing a blocked artery.
Diabetes Diabetes is a disease in which the body does not produce or properly use insulin. Insulin is needed to control the amount of sugar normally released into the blood.
Donor Incision Site
Coronary Artery By-pass Donor and Chest Surgery (CBGB) is surgery with a chest incision and donor site incisions (donor sites include the patient’s leg or arm) from where blood vessel is removed to create a new path for blood to flow to the heart. CBGB surgical incision site infections involving the donor incision site are reported separately from CBGB surgical chest incision site infections.
Duration Cut Point
The cut point of an operation is the typical time between skin incision (cut) and stitching or stapling the skin closed. The duration cut point is the time assigned to that type of surgical operation procedure. Infection risks may increase due to longer than expected surgical procedure time.
Higher than State Average
The risk adjusted rate for each hospital is compared to the state average to determine if it is significantly higher or lower than the state average. A rate is significantly higher than the state average if the confidence interval around the risk adjusted rate falls entirely above the state average.
Hip Replacement Surgery
Hip replacement surgery involves removing damaged cartilage and bone from the hip joint and replacing them with new, man-made parts.
Hospital Acquired Infection (HAI)
A hospital acquired infection is an infection that occurs in a patient as a result of being in a hospital setting after having medical or surgical treatments.
Infection control / prevention processes
These are routine measures to prevent infections that can be used in all healthcare settings. These steps or principles can be expanded to meet the needs of specialized types of hospitals. Some hospitals make the processes mandatory. Examples include Complete and thorough hand washing Use of personal protective equipment such as gloves, gowns, and/or masks when caring for patients in selected situations to prevent the spread of infections. Use of an infection prevention checklist when putting central lines in patients. The list reminds healthcare workers to clean their hands thoroughly; clean the patient’s skin before insertion with the right type of soap; wear the recommended sterile gown, gloves and mask; and place sterile barriers around the insertion site, etc.

48
Monitoring to ensure that employees, doctors and visitors are following the proper infection prevention procedures.
Infection Preventionists (IP)
Health professionals that have special training in infection prevention and monitoring.
Inpatient A patient whose date of admission to the healthcare facility and the date of discharge are different calendar days.
Intensive Care Unit (ICU)
Intensive Care Units are hospital units that provide intensive observation and treatment for patients (adult, pediatric or newborn) either dealing with, or at risk of developing life threatening problems. ICUs are described by the types of patients cared for. Many hospitals typically care for patients with both medical and surgical conditions in a combined medical/surgical ICU, while others have separate ICUs for medical, surgical and other specialty ICUs based on the patient care services provided by the hospital.
Lower than State Average
The risk adjusted rate for each hospital is compared to the state average to determine if it is significantly higher or lower than the state average. A rate is significantly lower than the state average if the confidence interval around the risk adjusted rate falls entirely below the state average.
National Healthcare Safety Network (NHSN)
This is a standardized data reporting system that New York State hospitals must use to identify and report select HAI’s and enter required data on uninfected patients. NHSN is a secure, internet-based surveillance (monitoring and reporting) system. The NHSN is managed by the CDC’s Division of Healthcare Quality Promotion.
Neonatal Intensive Care Level II/III Units
Patient care units that provide: Level II care to newborns at moderate risk and Level III care for newborns requiring increasingly complex care.
Neonatal Intensive Care Level III
Patient care units that provide a highly specialized care to newborns with serious illness, including premature birth and low birth weight and newborns under the supervision of a neonatologist.
Regional Perinatal Centers
Regional Perinatal Centers (RPC) provide all the services and expertise required by the most acutely sick or at-risk pregnant women and newborns. RPCs provide or coordinate maternal-fetal and newborn transfers of high-risk patients from their affiliate hospitals to the RPC, and are responsible for support, education, consultation and improvements in the quality of care in the affiliate hospitals within their region.
NHSN Patient Safety Protocol Manual
This contains standardized definitions and data collection methods that are essential for consistent, fair reporting of hospital infection rates.
Obesity Obesity, defined as greater than 20% of your ideal body weight, is a condition in which a person has too much body fat that can lower the likelihood of good health. It is commonly defined as a body mass index (BMI) of 30 kg/m2 or higher.
Operative Procedure
An operation that takes place during a one single trip to the operating room (OR) where a surgeon makes at least one incision (cut) through the skin or

49
mucous membrane, and stitches or staples the incision before the patient leaves the OR.
Outcome Data (HAI)
HAI outcome data are derived from reports based on data submitted by New York State hospitals into the NHSN. NHSN is a secure, internet-based surveillance (monitoring and reporting) system.
Post discharge surveillance
This is the process IPs use to seek out infections after patients have been discharged from the hospital. It includes screening a variety of data sources, including re-admissions, emergency department visits and/or contacting the patient’s doctor.
Raw Rate CLABSI
Raw rate is the number of infections (the numerator) divided by the number of line days (the denominator) or the number of umbilical catheter days (denominator) then multiplied by 1000 to be able to report the number of infections per 1000 line days or per 1000 umbilical catheter days.
Raw Rate Surgical Procedures
Raw rate is the number of infections (the numerator) divided by the number of procedures (the denominator) then multiplied by 100 to be able to report the number of infections per 100 operative procedures. Raw rates are not adjusted to account for differences in the patient populations.
Risk Adjustment
Risk adjustment accounts for differences in patient populations and allow for hospitals to be compared. A hospital that performs a large number of complex procedures on very sick patients would be expected to have a higher infection rate than a hospital that performs more routine procedures on healthier patients.
Risk-Adjusted Rate
For surgical site infections, the risk-adjusted rate is based on a comparison of the actual (observed) rate and the expected rate if statewide the patients had the same distribution of risk factors as the hospital. For CLABSIs, the adjusted rate is a comparison of the actual rate and the expected rate based on statewide rates for each ICU or within birth weight categories for neonates.
SPARCS The Statewide Planning and Research Cooperative System (SPARCS) is a
comprehensive data reporting system established in 1979 as a result of cooperation between the health care industry and government. Initially created to collect information on discharges from hospitals, SPARCS currently collects patient level detail on patient characteristics, diagnoses and treatments, services, and charges for every hospital discharge, ambulatory surgery patient, and emergency department admission in New York State.
Surgical Implant
A surgical implant is a nonhuman-derived object, material, or tissue that is permanently placed in a patient during an operation. Examples include: heart valves, metal rods, mesh, wires, screws, cements, hip replacements and other devices.
Surgical Site Infection (SSI)
A surgical site infection (SSI) is an infection that occurs after the operation in the part of the body where the surgery took place (incision). Most SSI’s are limited and only involve the skin surrounding the incision; others may be deeper and more serious.

50
Surgical Site Infection (SSI) Rate
Surgical site infection rates per 100 operative procedures are found by dividing the number of SSIs by the number of total number of specific operative procedures within a given reporting period. The results are then multiplied by 100. These calculations are performed separately for each type of surgical procedure. They are listed by risk index
Surgical Site Infection (SSI) Risk Index
This is a score used to predict a patient’s risk of acquiring a surgical site infection. The risk index score, ranging from 0 to 3, reveals how many of these risk factors are present: the anesthesiologist has given the patient an American Society of Anesthesiologists’ (ASA) physical status score of 3, 4, or 5; the operation site is determined to be contaminated or dirty / infected at the time of the procedure and the operation lasts longer than expected (the duration cut point time).
Umbilical Catheter
Umbilical catheter is a tube that is inserted through the umbilical blood vessel in a newborn.
Umbilical Catheter Days (Device Days)
This is the total number of days an umbilical catheter are present in newborns in a NICU. The count is performed at the same time each day. Each newborn with both an umbilical catheter and a central line is counted as one umbilical catheter day.
Validation Validation is a way of making sure the HAI data reported to NYS are complete and accurate. Complete reporting of HAIs, total numbers of surgical procedures performed, central line days, and patient information to assign risk scores must all be validated. Visiting hospitals and reviewing patient records is used to evaluate the accuracy of reporting. The purpose of the validation visits are to: Assess the accuracy and quality of the data submitted to NYS. Provide hospitals with information to help them use the data to improve and decrease HAI’s. Provide education to the IPs and other hospital employees and doctors, to improve reporting accuracy and quality. Look for unreported HAIs Make recommendations for improving data accuracy and/or patient care quality issues.
Wound Class
This is a way of determining how clean or dirty the operation body site is at the time of the operation. Operation body sites are divided into four classes: Clean: An uninfected operation body site is encountered and the respiratory, digestive, genital, or uninfected urinary tracts are not entered. Clean-Contaminated: Operation body sites in which the respiratory, digestive, genital or urinary tracts are entered under controlled conditions and without unusual contamination. Contaminated: Operation body sites that have recently undergone trauma, operations with major breaks in sterile technique (e.g., open cardiac massage) or gross spillage from the gastrointestinal tract. Dirty or Infected: Includes old traumatic wounds with retained dead tissue and those that involve existing infection or perforated intestines.
51
References
1. Klevens RM, Edwards JR, Horan TC, Gaynes RP, Pollack DA, Cardo DM. Estimating health care-associated infections and deaths in U.S. hospitals, 2002. Public Health Reports 2007;122:160-166.
2. Scott RD. The Direct Medical Costs of Healthcare-Associated Infections in U.S. Hospitals and the Benefits of Prevention, 2009. (accessed August 4, 2010) URL: http://www.cdc.gov/ncidod/dhqp/pdf/Scott_CostPaper.pdf
3. New York State Department of Health Hospital-Acquired Infection Reporting System – Report to Hospitals (accessed April 7, 2009) URL: http://www.nyhealth.gov/nysdoh/hospital/reports/hospital_acquired_infections/2007/docs/hospital-acquired_infection-full_report.pdf
4. Centers for Disease Control and Prevention’s Division of Healthcare Quality Promotion. National Healthcare Safety Network (NHSN) Manual (accessed April 8, 2009) URL: http://www.cdc.gov/nhsn/PDFs/pscManual/pscManual_current.pdf
5. New York State Department of Health’s Adult Cardiac Surgery in New York State 2003 – 2005 (accessed April 7, 2009) URL: http://www.nyhealth.gov/diseases/cardiovascular/heart_disease/docs/2003-2005_adult_cardiac_surgery.pdf
6. New York State Department of Health’s Statewide Planning and Research Cooperative System (accessed April 16, 2009) URL: http://www.health.state.ny.us/statistics/sparcs/
7. Breslow NE, Day NE. Statistical Methods in Cancer Research Volume 2: The Design and Analysis of Cohort Studies, 1987. IARC Publication No. 82. International Agency for Research on Cancer, Lyon.
8. Edwards JR, Peterson KD, Mu Y, Banerjee S, Allen-Bridson K, Morrell G, Dudeck MA, Pollack DA, Horan TC. National Healthcare Safety Network (NHSN) report: Data summary for 2006 through 2008, issued December 2009. Am J Infect Control 2009;37:783-805. (accessed August 5, 2010) URL: http://www.cdc.gov/nhsn/PDFs/dataStat/2009NHSNReport.pdf
9. Centers for Disease Control and Prevention’s Division of Healthcare Quality Promotion. First State-Specific Healthcare-Associated Infections Summary Data Report January – June, 2009 (accessed August 17, 2010) URL: http://www.cdc.gov/hai/pdfs/stateplans/SIR_05_25_2010.pdf

52
Colon Surgical Site Infection Rate Tables

53
Figure 3. Comparison of New York State and National Colon Surgical Site Infection Rates, 2007-2009
Year #
Hospitals#
Infections3#
ProceduresCrudeRate4
Adjusted Rate5 and 95% Confidence Interval
New York State1
2007 183 1,067 17,965 5.9 5.9 (5.6, 6.3) *H2008 179 894 18,135 4.9 4.9 (4.6, 5.2) *L2009 174 929 17,475 5.3 5.3 (4.9, 5.6) NS
NHSN Baseline2 2006-8 292 3,453 62,140 5.6 5. 6
1 New York State Data reported as of July 7, 2010. 2 NHSN 2006-8 baseline data as of NHSN Report in Am J Infect Control 2009;37:783-805. 3 NYS and NHSN data include non-readmitted cases identified using post-discharge surveillance. 4,5 Rates are per 100 procedures. 5NYS Rates directly adjusted using NHSN risk categories. “NS” indicates no significant difference between NYS and NHSN baseline. *L indicates significantly lower than NHSN baseline. *H indicates significantly higher than NHSN baseline. Test for trend Significant decrease in NYS rate between 2007 and 2009 (p=0.01 Cochran-Armitage Test for Trend)

54
Table 1. Method of Detection for Colon Surgical Site Infection by Depth of Infection, New York State 2009
When Detected Extent
(Row%) (Column%)
Initial Hospitalization
Readmitted to the Same
Hospital
Readmitted to Another
Hospital
Detected in Outpatient
Settings TotalSuperficial Incisional 326
(66.3%) (55.4%)
89 (18.1%) (35.3%)
0 (0.0%) (0.0%)
77 (15.7%) (89.5%)
492 (53.0%)
Deep Incisional 99
(66.0%) (16.8%)
47 (31.3%) (18.7%)
0 (0.0%) (0.0%)
4 (2.7%) (4.7%)
150 (16.1%)
Organ Space 163
(56.8%) (27.7%)
116 (40.4%) (46.0%)
3 (1.0%)
(100.0%)
5 (1.7%) (5.8%)
287 (30.9%)
Total 588
(63.3%) 252
(27.1%) 3
(0.3%) 86
(9.3%) 929
New York State data reported as of July 7, 2010. Includes non-readmitted cases identified using post-discharge surveillance.

55
Table 2. Comparison of Regional Hospital-Acquired Infection Rates to State Average, New York State, 2007-2009
Surgical Site Infections Central Line-Associated Blood Stream Infections
Colon Hip
Coronary Artery Bypass
Chest
Coronary Artery Bypass
Donor Coronary ICU Cardiothoracic
ICU Medical ICU
Teaching Medical ICU
Other
Medical Surgical ICU
Teaching Medical Surgical
ICU Other Surgical ICU Neurosurgical
ICU Pediatric ICU RPC NICU Level III NICULevel II/III
NICU
Region Year SSI/
procs Adj. Rate
SSI/ procs
Adj. Rate
SSI/ procs
Adj. Rate
SSI/ procs
Adj. Rate
CLABSI/CLDays Rate
CLABSI/CLDays Rate
CLABSI/CLDays Rate
CLABSI/CLDays Rate
CLABSI/CLDays Rate
CLABSI/ CLDays Rate
CLABSI/CLDays Rate
CLABSI/CLDays Rate
CLABSI/CLDays Rate
CLABSI/CLDays
Adjrate
CLABSI/CLDays
Adjrate
CLABSI/ CLDays
Adj rate
State average
2008 4.4 1.1 2.2 1.0 2.2 1.4 2.7 2.7 2.4 2.0 2.8 2.3 3.3 3.1 2.2 5.9
2009 4.8 1.1 2.2 0.9 1.8 1.3 2.5 1.9 1.7 1.9 2.1 2.1 2.2 2.2 3.5 3.8
Buffalo 2008 67/1568 4.4 32/2395 1.3 36/1239 3.0 16/1101 1.5 5/3297 1.5 1/3160 0.3 12/5082 2.4 8/2218 3.6 5/1576 3.2 24/16433 1.5 3/4287 ** 0.7 1/825 1.2 2/2579 ** 0.8 18/4147 4.7 0/649 0.0
2009 84/1554 5.7 23/2723 0.9 46/1287 ^^ 3.5 4/1150 0.4 8/4508 1.8 2/5753 0.3 16/5781 2.8 3/2787 1.1 12/2130 ^^ 5.6 28/17200 1.6 14/2625 ^^ 5.3 2/759 2.6 6/3128 1.9 7/3975 1.8 1/925 1.0
Rochester 2008 73/1424 5.2 28/2167 1.4 30/1208 2.7 13/1163 1.3 12/7383 1.6 15/2999 ^^ 5.0 10/4118 2.4 7/3266 2.1 12/11099 ** 1.1 28/6479 ^^ 4.3 18/2563 ^^ 7.0 9/3416 2.7 3/442 6.1
2009 52/1329 4.0 20/2357 0.9 14/1204 ** 1.3 8/1148 0.9 12/6254 1.9 6/3095 1.9 6/3733 1.6 1/3190 0.3 20/10716 1.9 10/5990 1.7 7/2359 3.0 10/3904 2.5 2/453 5.0
Central 2008 52/1840 ** 2.8 31/2766 1.1 22/1373 1.6 8/1219 0.7 4/4379 0.9 4/6235 0.6 12/3141 3.8 4/4148 ** 1.0 6/726 ^^ 8.3 19/16650 ** 1.1 22/7592 2.9 3/1493 2.0 1/557 1.8 7/1704 4.0 1/175 7.2
2009 77/1782 4.3 19/2793 ** 0.7 29/1506 1.9 11/1303 1.0 4/5602 ** 0.7 0/6598 ** 0.0 4/3212 1.2 6/4283 1.4 0/624 0.0 11/17424 ** 0.6 7/7541 ** 0.9 1/1557 0.6 1/484 2.1 9/3167 2.8 4/303 13.0
Capital 2008 103/1943 ^^ 5.5 33/2302 1.4 25/1563 1.6 3/1432 ** 0.2 2/3173 0.6 9/5116 1.8 5/3321 1.5 4/3086 1.3 37/19266 1.9 11/4448 2.5 0/528 0.0 14/1972 ^^ 7.1 4/3352 1.3 3/962 2.7
2009 85/2011 4.4 26/2509 1.0 22/1371 1.6 5/1269 0.4 4/3078 1.3 8/5056 1.6 5/2821 1.8 2/2641 0.8 33/18960 1.7 5/4111 1.2 0/1148 0.0 0/2039 ** 0.0 1/4706 ** 0.2 2/453 4.5
New Rochelle
2008 68/1767 3.8 22/2366 0.9 14/1062 1.4 6/1002 0.6 2/2008 1.0 7/4676 1.5 8/2014 4.0 20/2346 ^^ 8.5 66/26059 2.5 10/3693 2.7 1/1138 0.9 2/1600 1.3 14/3789 3.4 0/206 0.0 0/210 0.0
2009 64/1722 ** 3.7 32/2547 1.2 13/970 ** 1.3 6/930 0.6 0/1995 ** 0.0 5/4733 1.1 13/2910 4.5 10/2088 ^^ 4.8 52/24989 2.1 7/3172 2.2 8/1399 ^^ 5.7 3/1605 1.9 10/4485 2.2 1/191 5.6 0/206 0.0
NYC 2008 322/6540 4.8 89/9113 1.0 123/4947 2.3 51/4569 1.1 80/30781 2.6 61/35773 1.7 51/24868 2.1 43/20438 2.1 92/38432 2.4 125/47017 ^^ 2.7 92/37141 2.5 28/10607 2.6 54/18830 2.9 77/23273 3.3 13/7342 1.8 39/6374 6.1
2009 352/6115 ^^ 5.6 113/9558 1.2 134/4639 ^^ 2.9 57/4271 ^^ 1.2 59/27987 2.1 47/34964 1.3 57/24850 2.3 42/20061 2.1 57/34617 1.6 117/43271 ^^ 2.7 75/37550 2.0 24/10547 2.3 49/18878 2.6 60/23086 2.6 29/8360 3.4 21/6074 3.5
Long Island 2008 119/3053 3.9 38/3248 1.1 51/2575 2.1 31/2419 1.2 17/7220 2.4 11/11336 1.0 37/10869 3.4 12/2223 ^^ 5.4 0/944 0.0 73/37612 1.9 44/11904 3.7 7/2986 2.3 8/1597 5.0 12/6041 2.0 4/950 4.3
2009 129/2962 4.3 51/3362 1.5 37/2460 ** 1.5 18/2343 0.7 18/7537 2.4 20/11837 1.7 35/10699 3.3 12/7908 1.5 1/908 1.1 48/29591 1.6 38/14490 2.6 5/3388 1.5 2/2080 1.0 13/5882 2.2 5/1123 4.8
Color key: **Blue: significantly lower than state average ^^Red: significantly higher than state average Grey: not statistically different from state average *: Zero infections, not statistically significant NA: Fewer than 20 procedures or 50 line days reported Blank: No procedures or ICUs at hospital Colon and CABG data reported as of July 7, 2010; Hip data reported as of July 27, 2010; CLABSI data reported as of August 25, 2010. SSI NOTES: SSI=Surgical Site Infection; Procs=Procedures; Adj. Rate= Risk Adjusted Rate = # infections per 100 procedures if the state had the same risk distribution as the hospital. SSI data exclude non-readmitted cases identified using post discharge surveillance. Colon data adjusted using NHSN risk categories. CABG chest data adjusted using NHSN risk category, diabetes, body mass index, gender, end stage renal disease, COPD, medicaid. CABG donor data adjusted using NHSN risk category, body mass index, gender, diabetes, COPD, congestive heart failure, age over 75, emergency/trauma. Hip data adjusted using NHSN risk categories and type of procedure. CLABSI NOTES: CLABSI=Central Line-Associated Blood Stream Infection; CLDays=Central Line Days CLABSI data exclude cases in which multiple blood cultures were obtained, only one specimen was positive, the one positive was considered a contaminant and no treatment was given. Adult CLABSI rates are # infections per 1000 line days and no additional adjustment is performed since the data are stratified by ICU type. Neonatal CLABSI rates are adjusted by birth weight. Each region-specific adjusted rate should only be compared with the New York State average in that category in that year.

56
Figure 4. Colon Surgical Site Infection Rates, New York 2009 (page 1 of 5)
┇State Average. ●Risk-adjusted Infection rate. > Upper confidence limit exceeds graph area ▬^^Significantly higher than state average.▬**Significantly lower than state average. ▬Average. ▬*Zero Infections,not significant. Data Reported as of July 7, 2010. Excludes non-readmitted cases identified using post discharge surveillance. SSI=surgical site infections, Procs=procedures, Rates are per 100 procedures. Adjusted using NHSN risk categories. NA: Hospitals with less than 20 procedures.

57
Figure 4. Colon Surgical Site Infection Rates, New York 2009 (page 2 of 5)
┇State Average. ●Risk-adjusted Infection rate. > Upper confidence limit exceeds graph area ▬^^Significantly higher than state average.▬**Significantly lower than state average. ▬Average. ▬*Zero Infections,not significant. Data Reported as of July 7, 2010. Excludes non-readmitted cases identified using post discharge surveillance. SSI=surgical site infections, Procs=procedures, Rates are per 100 procedures. Adjusted using NHSN risk categories. NA: Hospitals with less than 20 procedures.
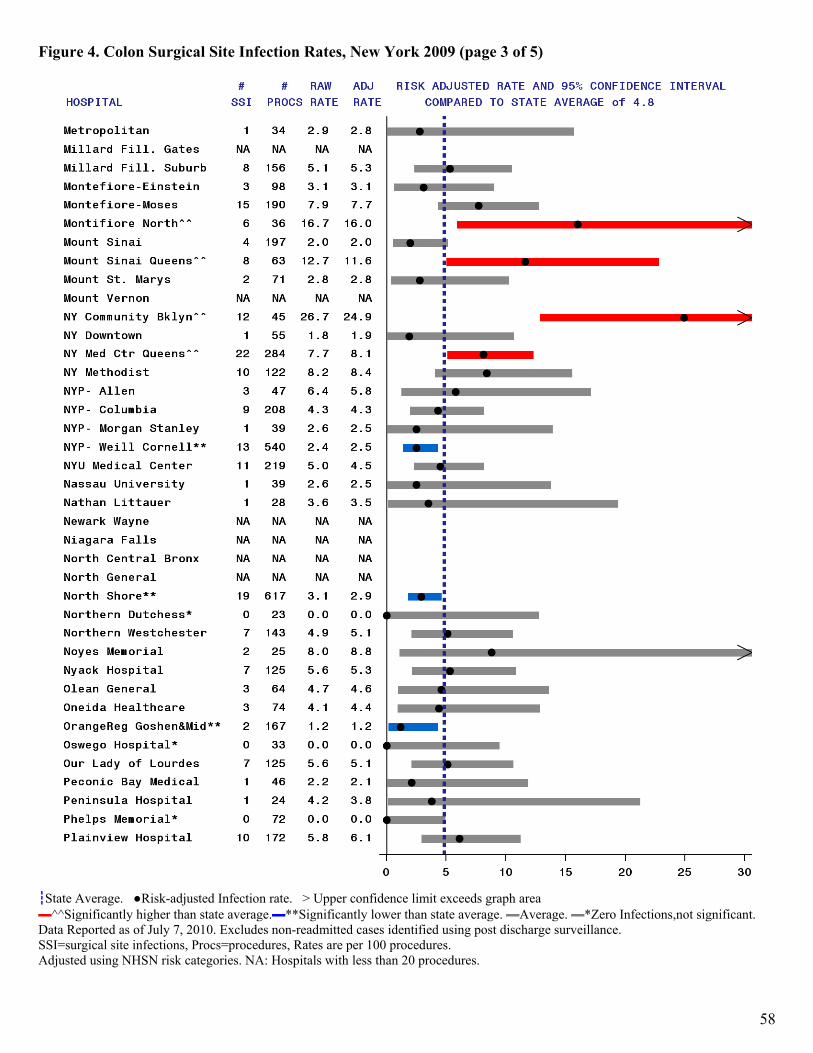
58
Figure 4. Colon Surgical Site Infection Rates, New York 2009 (page 3 of 5)
┇State Average. ●Risk-adjusted Infection rate. > Upper confidence limit exceeds graph area ▬^^Significantly higher than state average.▬**Significantly lower than state average. ▬Average. ▬*Zero Infections,not significant. Data Reported as of July 7, 2010. Excludes non-readmitted cases identified using post discharge surveillance. SSI=surgical site infections, Procs=procedures, Rates are per 100 procedures. Adjusted using NHSN risk categories. NA: Hospitals with less than 20 procedures.

59
Figure 4. Colon Surgical Site Infection Rates, New York 2009 (page 4 of 5)
┇State Average. ●Risk-adjusted Infection rate. > Upper confidence limit exceeds graph area ▬^^Significantly higher than state average.▬**Significantly lower than state average. ▬Average. ▬*Zero Infections,not significant. Data Reported as of July 7, 2010. Excludes non-readmitted cases identified using post discharge surveillance. SSI=surgical site infections, Procs=procedures, Rates are per 100 procedures. Adjusted using NHSN risk categories. NA: Hospitals with less than 20 procedures.

60
Figure 4. Colon Surgical Site Infection Rates, New York 2009 (page 5 of 5)
┇State Average. ●Risk-adjusted Infection rate. > Upper confidence limit exceeds graph area ▬^^Significantly higher than state average.▬**Significantly lower than state average. ▬Average. ▬*Zero Infections,not significant. Data Reported as of July 7, 2010. Excludes non-readmitted cases identified using post discharge surveillance. SSI=surgical site infections, Procs=procedures, Rates are per 100 procedures. Adjusted using NHSN risk categories. NA: Hospitals with less than 20 procedures.

61
Table 3. Microorganisms Identified in Colon Surgical Site Infections, New York State 2009
Microorganism
Number of
IsolatesPercent of Infections
Enterococci 277 29.8 (VRE) (75) ( 8.1) Escherichia sp. 245 26.4 Staphylococcus aureus 102 11.0 (MRSA) (64) ( 6.9) Coagulase negative staphylococci 76 8.2 Pseudomonas sp. 73 7.9 Bacteriodes 72 7.8 Klebsiella sp. 70 7.5 Streptococci 42 4.5 Enterobacter sp. 37 4.0 Yeast 30 3.2 Proteus sp. 25 2.7 Citrobacter sp. 20 2.2 Morganella morganii 10 1.1 Prevotella sp. 10 1.1 Clostridium sp. 8 0.9 Acinetobacter sp. 7 0.8 Diphtheroids 6 0.6 Serratia sp. 5 0.5 Other 29 3.1
New York State data reported as of July 7, 2010 Out of 929 infections (includes post-discharge surveillance). No microorganisms identified for 214 infections

62
CABG Surgical Site Infection Tables – Chest Site Infections

63
Figure 5. Comparison of New York State and National Coronary Artery Bypass Graft Chest Site Infection Rates, 2007-2009
Year #
Hospitals#
Infections3#
ProceduresCrudeRate4
Adjusted Rate5 and 95% Confidence Interval
1New York State
2007 40 385 14,266 2.7 2.6 (2.3, 2.9) *H 2008 40 311 13,967 2.2 2.2 (1.9, 2.4) NS 2009 40 307 13,437 2.3 2.2 (2.0, 2.5) NS
2NHSN Baseline 2006-8 292 2,744 134,714 2.0 2.0
1 New York State Data reported as of July 7, 2010. 2 NHSN 2006-8 baseline data as of NHSN Report in Am J Infect Control 2009;37:783-805. 3 NYS and NHSN procedure codes CBGB and CBGC, including non-readmitted cases identified using post-discharge surveillance 4,5Rates are per 100 procedures. 5NYS rates directly adjusted using NHSN Risk Categories; “NS”= no significant difference between NYS and NHSN Baseline. *H indicates NYS rate significantly higher than NHSN Baseline.
Test for trend Significant decrease in NYS rate between 2007 and 2009 (p=0.02 Cochran-Armitage Test for Trend)

64
Table 4. Method of Detection for Coronary Artery Bypass Graft Chest Site Infection by Depth of Infection, New York State 2009
Extent (Row%)
(Column%)
When Detected
Initial Hospitalization
Readmitted to the Same
Hospital
Readmitted to Another
Hospital
Detected in Outpatient Settings Total
Superficial Incisional 23 (24.0%) (31.5%)
62 (64.6%) (28.1%)
1 (1.0%)
(100.0%)
10 (10.4%) (83.3%)
96 (31.3%)
Deep Incisional 21
(21.4%) (28.8%)
75 (76.5%) (33.9%)
0 (0.0%) (0.0%)
2 (2.0%)
(16.7%)
98 (31.9%)
Organ Space 29
(25.7%) (39.7%)
84 (74.3%) (38.0%)
0 (0.0%) (0.0%)
0 0.0%) (0.0%)
113 (36.8%)
Total 73
(23.8%) 221
(72.0%) 1
(0.3%) 12
(3.9%) 307
New York State data reported as of July 7, 2010. Includes non-readmitted cases identified using post-discharge surveillance.
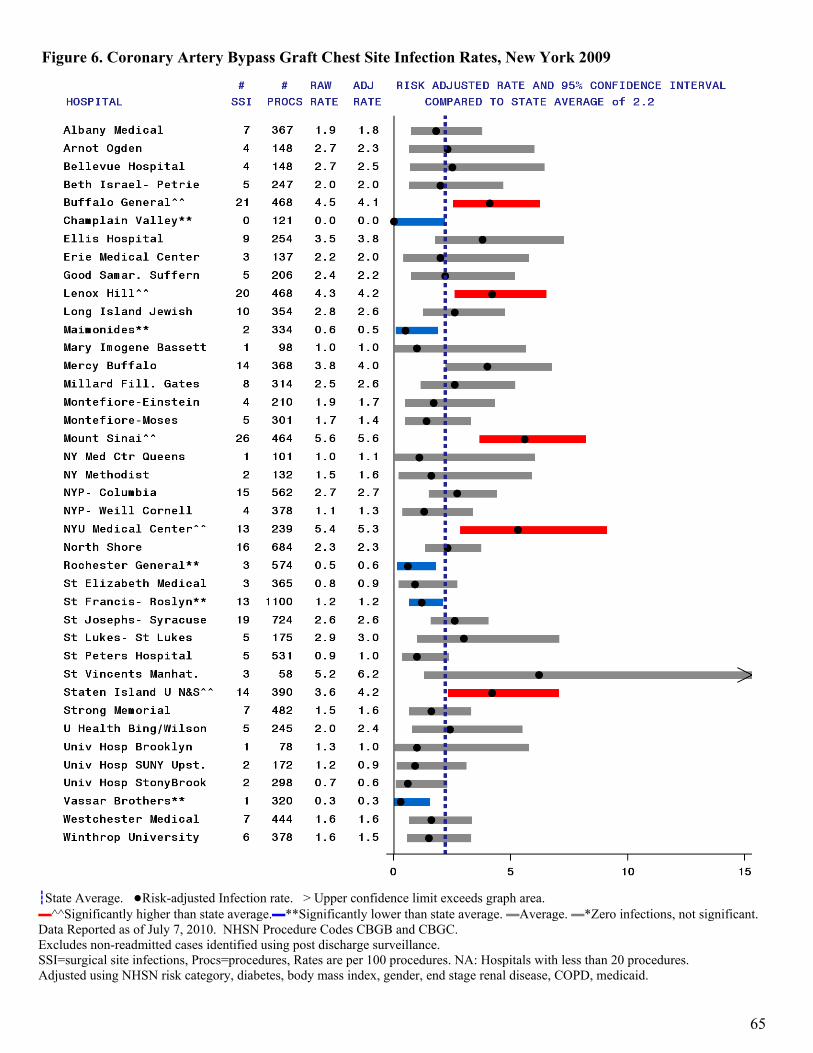
65
Figure 6. Coronary Artery Bypass Graft Chest Site Infection Rates, New York 2009
┇State Average. ●Risk-adjusted Infection rate. > Upper confidence limit exceeds graph area. ▬^^Significantly higher than state average.▬**Significantly lower than state average. ▬Average. ▬*Zero infections, not significant. Data Reported as of July 7, 2010. NHSN Procedure Codes CBGB and CBGC. Excludes non-readmitted cases identified using post discharge surveillance. SSI=surgical site infections, Procs=procedures, Rates are per 100 procedures. NA: Hospitals with less than 20 procedures. Adjusted using NHSN risk category, diabetes, body mass index, gender, end stage renal disease, COPD, medicaid.

66
Table 5. Microorganisms Identified in Coronary Artery Bypass Chest Site Infections, New York State 2009
Microorganism
Number of
Isolates
Percent of
Infections Staphylococcus aureus 111 36.2 (MRSA) (40) (13.0) Coagulase negative staphylococci 73 23.8 Enterobacter sp. 29 9.4 Pseudomonas sp. 28 9.1 Klebsiella sp. 25 8.1 Escherichia sp. 24 7.8 Serratia 24 7.8 Enterococci 19 6.2 (VRE) (8) ( 2.6) Proteus sp. 16 5.2 Streptococci 9 2.9 Yeast 6 2.0 Morganella morganii 5 1.6 Other 14 4.6
New York State data reported as of July 7, 2010 Out of 307 infections (includes post-discharge surveillance). No microorganisms identified for 22 infections

67
CABG Surgical Site Infection Rate Tables – Donor Vessel Site Infections

68
Figure 7. Comparison of New York State and National Coronary Artery Bypass Graft Donor Site Infection Rates, New York State 2007-2009
Year #
Hospitals#
Infections3#
ProceduresCrudeRate4
Adjusted Rate5 and 95% Confidence Interval
New York State1
2007 40 149 13,203 1.1 1.1 (0. 9, 1.2) *H 2008 40 139 12,905 1.1 1.0 (0.9, 1.2) NS 2009 40 129 12,414 1.0 1.0 (0.8, 1.2) NS
NHSN Baseline2 2006-8 292 1,064 123,055 0.9 0.9
1 New York State Data reported as of July 7, 2010. 2 NHSN 2006-8 baseline data as of NHSN Report in Am J Infect Control 2009;37:783-805. 3 NYS and NHSN data include non-readmitted cases identified using post-discharge surveillance. 4,5 Rates are per 100 procedures. 5NYS rates directly adjusted using NHSN Risk Categories. “NS”= no significant difference between NYS and NHSN Baseline. *H indicates NYS rate significantly higher than NHSN Baseline.
Test for trend No significant change in NYS rate between 2007 and 2009 (p=0.48 Cochran-Armitage Test for Trend)

69
Table 6. Method of Detection for Coronary Artery Bypass Graft Donor Site Infection by Depth of Infection, New York State 2009
Extent Frequency (Row Pct) (Col Pct)
When Detected
Initial Hospitalization
Readmitted to the Same
Hospital
Readmittedto a
Different Hospital
Detected in
Outpatient Settings Total
Superficial Incisional 20 (19.8%) (74.1%)
65 (64.4%) (78.3%)
0 (0%) (0%)
16 (15.8%) (84.2%)
101 (78.3%)
Deep Incisional 7
(25.0%) (25.9%)
18 (64.3%) (21.7%)
0 (0%) (0%)
3 (10.7%) (15.8%)
28 (21.7%)
Total 27
(20.9%) 83
(64.3%) 0
(0.0%) 19
(14.7%) 129
New York State data reported as of July 7, 2010. Includes non-readmitted cases identified using post-discharge surveillance.

70
Figure 8. Coronary Artery Bypass Graft Donor Site Infection Rates, New York 2009
┇State Average. ●Risk-adjusted Infection rate. > Upper confidence limit exceeds graph area ▬^^Significantly higher than state average.▬**Significantly lower than state average. ▬Average. ▬*Zero Infections,not significant. Data Reported as of July 7, 2010. NHSN Code CBGB. Excludes non-readmitted cases identified using post discharge surveillance. Only one donor site infection per person is counted.

71
Table 7. Microorganisms Identified in Coronary Artery Bypass Donor Site Infections, New York State 2009
Microorganism
Number of
Isolates
Percent of
Infections Staphylococcus aureus 29 22.5 (MRSA) (12) ( 9.3) Escherichia sp. 23 17.8 Enterococci 19 14.7 (VRE) (5) ( 3.9) Klebsiella sp. 16 12.4 Pseudomonas sp. 14 10.9 Coagulase negative staphylococci 13 10.1 Proteus sp. 8 6.2 Serratia sp. 8 6.2 Enterobacter sp. 5 3.9 Morganella morganii 5 3.9 Other 13 10.1
New York State data reported as of July 7, 2010 Out of 129 infections (includes post-discharge surveillance). No microorganisms identified for 27 infections

72
Hip Replacement/Revision Surgical Site Infection Rate Tables

73
Figure 9. Comparison of New York State and National Hip Replacement Surgical Site Infection Rates, 2008-2009
Year #
Hospitals#
Infections3#
ProceduresCrudeRate4
Adjusted Rate5 and 95% Confidence Interval
New York State1
2008 172 298 24,357 1.2 1.3 (1.1, 1.4) NS2009 169 311 25,849 1.2 1.3 (1.1, 1.4) NS
NHSN Baseline2 2006-8 665 1,651 130,391 1.3 1.3 1New York State Data reported as of July 27, 2010. 2NHSN 2006-8 baseline data as of NHSN Report in Am J Infect Control 2009;37:783-805. 3NYS and NHSN data include non-readmitted cases identified using post-discharge surveillance. 4,5Rates are per 100 procedures. 5NYS rates directly adjusted using NHSN Risk Categories; “NS”= no significant difference between NYS and NHSN Baseline.
Test for trend No significant change in NYS rate between 2008 and 2009 (p=0.8353 Chi-Square test)

74
Table 8. Method of Detection for Hip Surgical Site Infection by Depth of Infection, New York State 2009
When Detected Extent
(Row%) (Column%)
Initial Hospitalization
Readmitted to the Same
Hospital
Readmitted to Another
Hospital
Detected in Outpatient Settings Total
Superficial Incisional 14 (13.5%) (41.2%)
66 (63.5%) (27.2%)
0 (0.0%) (0.0%)
24 (23.1%) (88.9%)
104 (33.4%)
Deep Incisional 15
(11.5%) (44.1%)
109 (83.8%) (44.9%)
5 (3.8%)
(71.4%)
1 (0.8%) (3.7%)
130 (41.8%)
Organ Space 5
(6.5%) (14.7%)
68 (88.3%) (28.0%)
2 (2.6%)
(28.6%)
2 (2.6%) (7.4%)
77 (24.8%)
Total 34
(10.9%) 243
(78.1%) 7
(2.3%) 27
(8.7%) 311
New York State data reported as of July 27, 2010. Includes non-readmitted cases identified using post-discharge surveillance.

75
Figure 10. Hip Replacement Surgical Site Infection Rates, New York 2009 (page 1 of 5)
┇State Average. ●Risk-adjusted Infection rate. > Upper confidence limit exceeds graph area ▬^^Significantly higher than state average.▬**Significantly lower than state average. ▬Average. ▬*Zero Infections,not significant. Data Reported as of July 27, 2010. Excludes non-readmitted cases identified using post discharge surveillance. SSI=surgical site infections, Procs=procedures, Rates are per 100 procedures. Adjusted using NHSN risk categories and type of procedure (initial/revision,total/partial). NA: Hospitals with less than 20 procedures.

76
Figure 10. Hip Replacement Surgical Site Infection Rates, New York 2009 (page 2 of 5)
┇State Average. ●Risk-adjusted Infection rate. > Upper confidence limit exceeds graph area ▬^^Significantly higher than state average.▬**Significantly lower than state average. ▬Average. ▬*Zero Infections,not significant. Data Reported as of July 27, 2010. Excludes non-readmitted cases identified using post discharge surveillance. SSI=surgical site infections, Procs=procedures, Rates are per 100 procedures. Adjusted using NHSN risk categories and type of procedure (initial/revision,total/partial). NA: Hospitals with less than 20 procedures.

77
Figure 10. Hip Replacement Surgical Site Infection Rates, New York 2009 (page 3 of 5)
┇State Average. ●Risk-adjusted Infection rate. > Upper confidence limit exceeds graph area ▬^^Significantly higher than state average.▬**Significantly lower than state average. ▬Average. ▬*Zero Infections,not significant. Data Reported as of July 27, 2010. Excludes non-readmitted cases identified using post discharge surveillance. SSI=surgical site infections, Procs=procedures, Rates are per 100 procedures. Adjusted using NHSN risk categories and type of procedure (initial/revision,total/partial). NA: Hospitals with less than 20 procedures.

78
Figure 10. Hip Replacement Surgical Site Infection Rates, New York 2009 (page 4 of 5)
┇State Average. ●Risk-adjusted Infection rate. > Upper confidence limit exceeds graph area ▬^^Significantly higher than state average.▬**Significantly lower than state average. ▬Average. ▬*Zero Infections,not significant. Data Reported as of July 27, 2010. Excludes non-readmitted cases identified using post discharge surveillance. SSI=surgical site infections, Procs=procedures, Rates are per 100 procedures. Adjusted using NHSN risk categories and type of procedure (initial/revision,total/partial). NA: Hospitals with less than 20 procedures.

79
Figure 10. Hip Replacement Surgical Site Infection Rates, New York 2009 (page 5 of 5)
┇State Average. ●Risk-adjusted Infection rate. > Upper confidence limit exceeds graph area ▬^^Significantly higher than state average.▬**Significantly lower than state average. ▬Average. ▬*Zero Infections,not significant. Data Reported as of July 27, 2010. Excludes non-readmitted cases identified using post discharge surveillance. SSI=surgical site infections, Procs=procedures, Rates are per 100 procedures. Adjusted using NHSN risk categories and type of procedure (initial/revision,total/partial). NA: Hospitals with less than 20 procedures.

80
Table 9. Microorganisms Identified in Hip Replacement Surgical Site Infections, New York State 2009
Microorganism
Number of
IsolatesPercent of Infections
Staphylococcus aureus 186 59.8 (MRSA) (102) (32.8) Coagulase negative staphylococci 33 10.6 Enterococci 31 10.0 (VRE) (5) ( 1.6) Escherichia sp. 21 6.8 Pseudomonas sp. 20 6.4 Enterobacter sp. 11 3.5 Klebsiella sp. 11 3.5 Proteus sp. 9 2.9 Streptococci 9 2.9 Corynebacteria 8 2.6 Acinetobacter sp. 7 2.3 Other 17 5.5
New York State data reported as of July 27, 2010 Out of 311 infections (includes post-discharge surveillance). No microorganisms identified for 20 infections

81
CLABSI Rate Tables – Adult/Pediatric Intensive Care Units

82
Table 10. Comparison of New York State and National Central Line-Associated Blood Stream Infection Rates by Type of Adult/Pediatric Intensive Care Unit, 2007-2009
1 New York State data reported as of August 25, 2010. 2 NHSN 2006-8 baseline data as of NHSN Report in Am J Infect Control 2009;37:783-805. Includes untreated events with single pathogen contaminated specimen. CL Days = Central Line Days, Nat = National, Rates are per 1000 CL Days *H indicates New York State rate is significantly higher than National 2006-8 rate. *L indicates New York State rate is significantly lower than National 2006-8 rate.
New York State 2007¹
New York State 2008¹
New York State 2009¹
National 2006-82
# CLABSI
# CL Days Rate
2007 vs. Nat
# CLABSI
# CL Days Rate
2008 vs. Nat
# CLABSI
# CL Days Rate
2009 vs.
Nat #
CLABSI# CL Days Rate
Cardiothoracic 109 62,962 1.7 *H 108 73,679 1.5 NS 97 75,195 1.3 NS 879 632,769 1.4Coronary
74 39,344 1.9 NS 110 50,858 2.2 NS 94 50,707 1.9 NS 876 436,409 2.0
Medical (Major
Teaching)
120 41,612 2.9 NS 145 52,294 2.8 NS 138 53,368 2.6 NS 1,410 549,088 2.6
Medical (All other) 71 28,545 2.5 *H 99 35,491 2.8 *H 79 40,860 1.9 NS 687 362,388 1.9
Medical Surgical (Major
Teaching)
100 47,447 2.1 NS 117 48,030 2.4 NS 75 44,110 1.7 NS 1,474 699,300 2.1
Medical Surgical
(All Other)
339 164,104 2.1 *H 360 174,136 2.1 *H 313 162,151 1.9 *H 2,579 1,742,419 1.5
Neuro-Surgical 37 14,580 2.5 NS 42 17,577 2.4 NS 40 18,798 2.1 NS 396 160,879 2.5
Pediatric 90 28,173 3.2 NS 99 29,698 3.3 NS 69 30,573 2.3 *L 1,147 390,253 2.9Surgical
221 66,400 3.3 *H 219 75,544 2.9 *H 161 75,479 2.1 NS 1,683 729,989 2.3

83
Table 11. Trends in Central Line-Associated Blood Stream Infection Rates by Type of Adult/Pediatric Intensive Care Unit, New York State 2007-2009
Location
2007 2008 2009
SIR Obs Exp SIR (95% CI) Obs Exp SIR (95% CI) Cardiothoracic 1.0 108 127.6 0.85 (0.69, 1.02) 97 130.2 0.75 (0.60, 0.91)
Coronary 1.0 110 95.7 1.15 (0.95, 1.39) 94 95.4 0.99 (0.80, 1.21)
Medical (major teaching) 1.0 145 150.8 0.96 (0.81, 1.13) 138 153.9 0.90 (0.75, 1.06)
Medical (other) 1.0 99 88.3 1.12 (0.91, 1.37) 79 101.6 0.78 (0.62, 0.97)
Medical surgical (major teaching) 1.0 117 101.2 1.16 (0.96, 1.39) 75 93.0 0.81 (0.63, 1.01)
Medical surgical (other) 1.0 360 359.7 1.00 (0.90, 1.11) 313 335.0 0.93 (0.83, 1.04)
Neurosurgical 1.0 42 44.6 0.94 (0.68, 1.27) 40 47.7 0.84 (0.60, 1.14)
Pediatric 1.0 99 94.9 1.04 (0.85, 1.27) 69 97.7 0.71 (0.55, 0.89)
Surgical 1.0 219 251.4 0.87 (0.76, 0.99) 161 251.2 0.64 (0.55, 0.75)
Adult/Pediatric TOTAL 1.0 1299 1314.2 0.99 (0.94, 1.04) 1066 1305.6 0.82 (0.77, 0.87)
Obs - Number of Observed Central Line-Associated Blood Stream Infections (CLABSI) Exp - Number of Expected CLABSI, if infection rate was the same as in 2007. SIR – Standardized Incidence Ratio, using New York State 2007 as standard. CI – Confidence Interval Data downloaded 8/25/2010. Excludes Criteria 2b/3b and clinical sepsis. 2008 and 2009 data were indirectly standardized based on NYS 2007 rates.

84
Figure 11. Central Line –Associated Blood Stream Infection (CLABSI) Rates Cardiothoracic Intensive Care Units, New York 2009
┇State Average. ●Infection rate. > Upper confidence limit exceeds graph area ▬^^Significantly higher than state average.▬**Significantly lower than state average. ▬Average. ▬*Zero Infections,not significant. Data reported as of August 25, 2010. Rates are per 1000 central line days (CLDAYS). NA: Hospitals with less than 50 central line days. Excludes untreated event with single pathogen contaminated specimen.
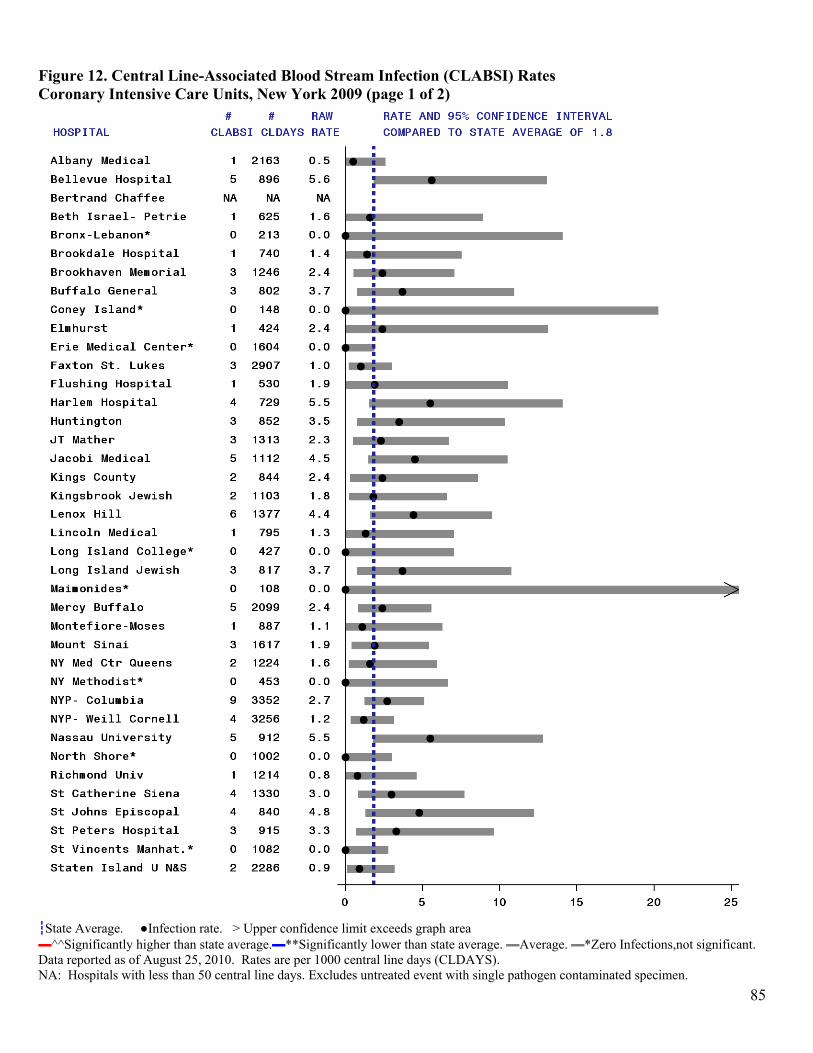
85
Figure 12. Central Line-Associated Blood Stream Infection (CLABSI) Rates Coronary Intensive Care Units, New York 2009 (page 1 of 2)
┇State Average. ●Infection rate. > Upper confidence limit exceeds graph area ▬^^Significantly higher than state average.▬**Significantly lower than state average. ▬Average. ▬*Zero Infections,not significant. Data reported as of August 25, 2010. Rates are per 1000 central line days (CLDAYS). NA: Hospitals with less than 50 central line days. Excludes untreated event with single pathogen contaminated specimen.

86
Figure 12. Central Line-Associated Blood Stream Infection (CLABSI) Rates Coronary Intensive Care Units, New York 2009 (page 2 of 2)
┇State Average. ●Infection rate. > Upper confidence limit exceeds graph area ▬^^Significantly higher than state average.▬**Significantly lower than state average. ▬Average. ▬*Zero Infections,not significant. Data reported as of August 25, 2010. Rates are per 1000 central line days (CLDAYS). NA: Hospitals with less than 50 central line days. Excludes untreated event with single pathogen contaminated specimen.

87
Figure 13. Central Line-Associated Blood Stream Infection (CLABSI) Rates Medical Intensive Care Units in Major Teaching Hospitals, New York 2009
┇State Average. ●Infection rate. > Upper confidence limit exceeds graph area ▬^^Significantly higher than state average.▬**Significantly lower than state average. ▬Average. ▬*Zero Infections,not significant. Data reported as of August 25, 2010. Rates are per 1000 central line days (CLDAYS). NA: Hospitals with less than 50 central line days. Excludes untreated event with single pathogen contaminated specimen.

88
Figure 14. Central Line-Associated Blood Stream Infection (CLABSI) Rates Medical Intensive Care Units (Non-Teaching Hospitals), New York 2009
┇State Average. ●Infection rate. > Upper confidence limit exceeds graph area ▬^^Significantly higher than state average.▬**Significantly lower than state average. ▬Average. ▬*Zero Infections,not significant. Data reported as of August 25, 2010. Rates are per 1000 central line days (CLDAYS). NA: Hospitals with less than 50 central line days. Excludes untreated event with single pathogen contaminated specimen.

89
Figure 15. Central Line-Associated Blood Stream Infection (CLABSI) Rates Medical-Surgical Intensive Care Units in Major Teaching Hospitals, New York 2009
┇State Average. ●Infection rate. > Upper confidence limit exceeds graph area ▬^^Significantly higher than state average.▬**Significantly lower than state average. ▬Average. ▬*Zero Infections,not significant. Data reported as of August 25, 2010. Rates are per 1000 central line days (CLDAYS). NA: Hospitals with less than 50 central line days. Excludes untreated event with single pathogen contaminated specimen.

90
Figure 16. Central Line-Associated Blood Stream Infection (CLABSI) Rates Medical-Surgical Intensive Care Units in Non-Major Teaching Hospitals, New York 2009 (page 1 of 3)
┇State Average. ●Infection rate. > Upper confidence limit exceeds graph area ▬^^Significantly higher than state average.▬**Significantly lower than state average. ▬Average. ▬*Zero Infections,not significant. Data reported as of August 25, 2010. Rates are per 1000 central line days (CLDAYS). NA: Hospitals with less than 50 central line days. Excludes untreated event with single pathogen contaminated specimen.

91
Figure 16. Central Line-Associated Blood Stream Infection (CLABSI) Rates Medical-Surgical Intensive Care Units in Non-Major Teaching Hospitals, New York 2009 (page 2 of 3)
┇State Average. ●Infection rate. > Upper confidence limit exceeds graph area ▬^^Significantly higher than state average.▬**Significantly lower than state average. ▬Average. ▬*Zero Infections,not significant. Data reported as of August 25, 2010. Rates are per 1000 central line days (CLDAYS). NA: Hospitals with less than 50 central line days. Excludes untreated event with single pathogen contaminated specimen.

92
Figure 16. Central Line-Associated Blood Stream Infection (CLABSI) Rates Medical-Surgical Intensive Care Units in Non-Major Teaching Hospitals, New York 2009 (page 3 of 3)
┇State Average. ●Infection rate. > Upper confidence limit exceeds graph area ▬^^Significantly higher than state average.▬**Significantly lower than state average. ▬Average. ▬*Zero Infections,not significant. Data reported as of August 25, 2010. Rates are per 1000 central line days (CLDAYS). NA: Hospitals with less than 50 central line days. Excludes untreated event with single pathogen contaminated specimen.

93
Figure 17. Central Line-Associated Blood Stream Infection (CLABSI) Rates Neurosurgical Intensive Care Units, New York 2009
┇State Average. ●Infection rate. > Upper confidence limit exceeds graph area ▬^^Significantly higher than state average.▬**Significantly lower than state average. ▬Average. ▬*Zero Infections,not significant. Data reported as of August 25, 2010. Rates are per 1000 central line days (CLDAYS). NA: Hospitals with less than 50 central line days. Excludes untreated event with single pathogen contaminated specimen.
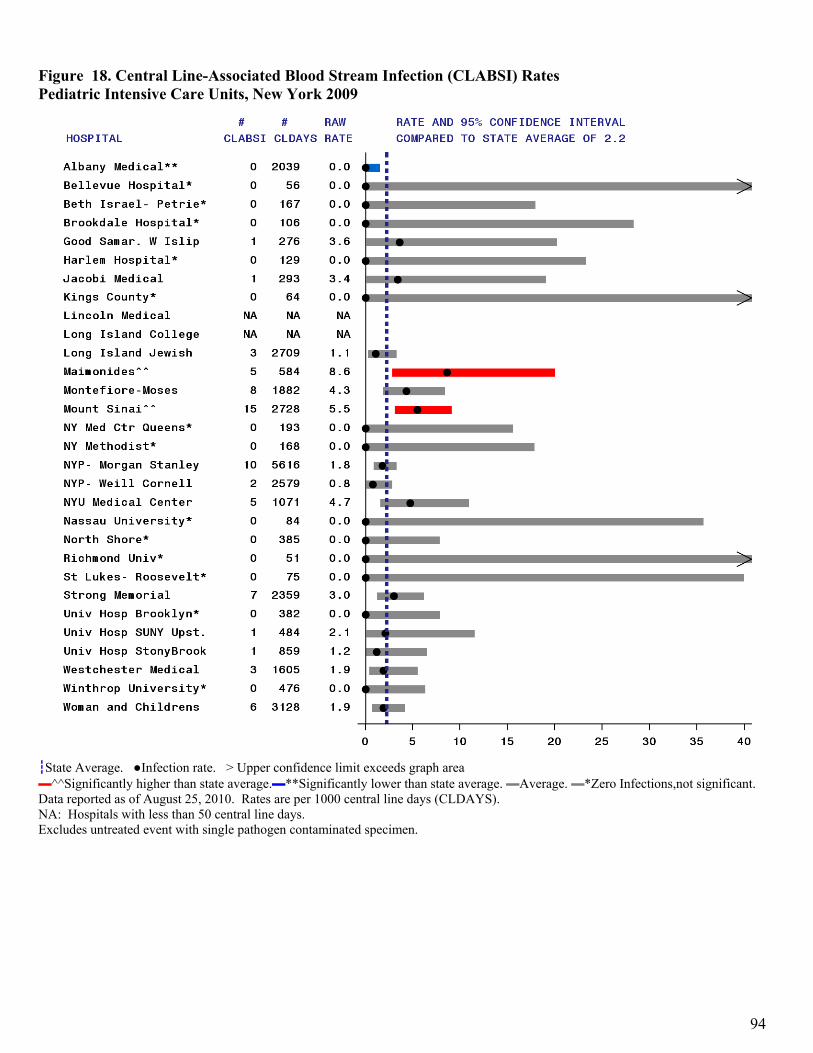
94
Figure 18. Central Line-Associated Blood Stream Infection (CLABSI) Rates Pediatric Intensive Care Units, New York 2009
┇State Average. ●Infection rate. > Upper confidence limit exceeds graph area ▬^^Significantly higher than state average.▬**Significantly lower than state average. ▬Average. ▬*Zero Infections,not significant. Data reported as of August 25, 2010. Rates are per 1000 central line days (CLDAYS). NA: Hospitals with less than 50 central line days. Excludes untreated event with single pathogen contaminated specimen.

95
Figure 19. Central Line-Associated Blood Stream Infection (CLABSI) Rates Surgical Intensive Care Units, New York 2009
┇State Average. ●Infection rate. > Upper confidence limit exceeds graph area ▬^^Significantly higher than state average.▬**Significantly lower than state average. ▬Average. ▬*Zero Infections,not significant. Data reported as of August 25, 2010. Rates are per 1000 central line days (CLDAYS). NA: Hospitals with less than 50 central line days. Excludes untreated event with single pathogen contaminated specimen.

96
Table 12. Microorganisms Identified in Central-Line Associated Blood Stream Infections, Adult and Pediatric Intensive Care Units, New York State 2009
Microorganism Number of Isolates
Percent of Infections
Enterococci 269 25.2 (VRE) (151) (14.2) Coagulase negative staphylococci 212 19.9 Yeast 184 17.3 Klebsiella sp. 104 9.8 Staphylococcus aureus 86 8.1 (MRSA) (46) ( 4.3) Acinetobacter sp. 64 6.0 Pseudomonas sp. 58 5.4 Escherichia sp. 49 4.6 Enterobacter sp. 33 3.1 Serratia sp. 27 2.5 Proteus sp. 12 1.1 Stenotrophomonas maltophilia 9 0.8 Streptococci 9 0.8 Citrobacter 6 0.6 Burkholderia cepacia 5 0.5 Other 24 2.3
New York State data reported as of August 25, 2010 Out of 1066 infections.

97
CLABSI and UCABSI Rate Tables – Neonatal Intensive Care Units

98
Figure 20. Comparison of New York State and National Central Line-Associated Blood Stream Infection Rates, Level III and RPC Neonatal Intensive Care Units, 2007-2009
Year #
Hospitals #
Infections3#
Line Days Raw4 Rate
Adjusted Rate5 and 95% Confidence Interval
1New York State
2007 39 197 52,547 3.7 3.7 (3.2, 4.2) *H 2008 40 165 56,273 2.9 2.9 (2.4, 3.3) NS 2009 40 151 60,710 2.5 2.4 (2.0, 2.8) *L
2NHSN Baseline 2006-8 154 1,503 519,552 2.9 2. 9
1 New York State data reported as of August 25, 2010. 2 NHSN 2006-8 baseline data as of NHSN Report in Am J Infect Control 2009;37:783-805. 3 NYS and NHSN data include clinical sepsis and untreated events with single pathogen contaminated specimen. 4,5Rates are per 1000 line days. 5 NYS Rates indirectly adjusted using NHSN birth weight categories. *H indicates significantly higher than NHSN baseline. *L indicates significantly lower than NHSN baseline. “NS” indicates no significant difference. Test for trend Significant decrease in NYS CLABSI rate between 2007 and 2009 (p<0.01 Poisson Trend Test)

99
Figure 21. Central Line-Associated Blood Stream Infection Rates, Level III and RPC Neonatal Intensive Care Units, New York State 2007-2009
Regional Perinatal Center Neonatal Intensive Care Units
Year #
Hospitals #
Infections #
Line Days Raw Rate
Adjusted Rate and 95% Confidence Interval
New York State
2007 18 180 44,989 4.0 3.9 (3.4, 4.5) *H 2008 18 142 45,722 3.1 3.1 (2.6, 3.6) NS 2009 18 111 49,205 2.3 2.2 (1.8, 2.7) *L
NHSN Baseline 2006-8 154 1,503 519,552 2.9 2.9 Level III Neonatal Intensive Care Units
Year #
Hospitals #
Infections #
Line Days Raw Rate
Adjusted Rate and 95% Confidence Interval
New York State
2007 21 17 7,558 2.2 2.1 (1.2, 3.4) NS 2008 22 23 10,551 2.2 2.1 (1.3, 3.1) NS 2009 22 40 11,505 3.5 3.2 (2.3, 4.4) NS
NHSN Baseline 2006-8 154 1,503 519,552 2.9 2.9 Test for trend Significant decrease in CLABSI rate at RPCs between 2007 and 2009 (p<0.01 Poisson Trend Test) No significant change in CLABSI rate in Level 3 NICUs between 2007 and 2009 (p=0.08 Poisson Trend Test)

100
Figure 22. Comparison of New York State and National Umbilical Catheter-Associated Blood Stream Infection Rates, Level III and RPC Neonatal Intensive Care Units, 2007-2009
Year #
Hospitals #
Infections3#
Line Days Raw Rate4
Adjusted Rate5 and 95% Confidence Interval
1New York State
2007 39 65 20,227 3.2 3.3 (2.5, 4.2) *H 2008 40 43 21,289 2.0 2.0 (1.4, 2. 7) NS 2009 40 44 23,235 1.9 1.8 (1.3, 2.5) NS
2NHSN Baseline 2006-8 150 331 174,886 1.9 1. 9
1 New York State data reported as of August 25, 2010. 2 NHSN 2006-8 baseline data as of NHSN Report in Am J Infect Control 2009;37:783-805. 3 NYS and NHSN data include clinical sepsis and untreated events with single pathogen contaminated specimen. 4,5Rates are per 1000 line days. 5 NYS Rates indirectly adjusted using NHSN birth weight categories. *H indicates significantly higher than NHSN baseline. “NS” indicates no significant difference.
Test for trend Significant decrease in NYS Umbilical Catheter-Associated BSI rate between 2007 and 2009 (p<0.01 Poisson Trend Test)

101
Figure 23. Comparison of New York State and National Central Line-Associated Blood Stream Infection Rates, Level II/III Neonatal Intensive Care Units, 2007-2009
Year #
Hospitals #
Infections3#
Line Days Raw Rate4
Adjusted Rate5 and 95% Confidence Interval
1New York State
2007 13 19 3,826 5.0 4.5 (2.7, 7.0) *H 2008 14 40 6,759 5.9 5.3 (3.8, 7.2) *H 2009 14 25 6,583 3.8 3.3 (2.1, 4.9) NS
2NHSN Baseline 2006-8 125 643 251,978 2.6 2.6
1 New York State data reported as of August 25, 2010. 2 NHSN 2006-8 baseline data as of NHSN Report in Am J Infect Control 2009;37:783-805. 3 NYS and NHSN data include clinical sepsis and untreated events with single pathogen contaminated specimen. 4,5Rates are per 1000 line days. 5NYS Rates indirectly adjusted using NHSN birth weight categories. *H indicates significantly higher than NHSN baseline. “NS” indicates no significant difference.
Test for trend No significant change in NYS CLABSI rate between 2007 and 2009 (p=0.28 Poisson Trend Test)

102
Figure 24. Comparison of New York State and National Umbilical Catheter-Associated Blood Stream Infection Rates, Level II/III Neonatal Intensive Care Units, 2007-2009
Year #
Hospitals #
Infections3#
Line Days Raw Rate4
Adjusted Rate5 and 95% Confidence Interval
1New York State
2007 13 13 2,132 6.1 5.2 (2.7, 8.8) *H 2008 14 10 3,627 2.8 2.4 (1.2, 4.4) NS 2009 14 14 3,539 4.0 3.6 (2.0, 6.1) NS
2NHSN Baseline 2006-8 127 227 97,285 2.3 2.3
1 New York State data reported as of August 25, 2010. 2 NHSN 2006-8 baseline data as of NHSN Report in Am J Infect Control 2009;37:783-805. 3 NYS and NHSN data include clinical sepsis and untreated events with single pathogen contaminated specimen. 4,5 Rates are per 1000 line days. 5 NYS Rates indirectly adjusted using NHSN birth weight categories. *H indicates significantly higher than NHSN baseline. “NS” indicates no significant difference.
Test for trend No significant change in NYS CLABSI rate between 2007 and 2009 (p<0.32 Poisson Trend Test)

103
Figure 25. Central Line-Associated Blood Stream Infection (CLABSI) Rates Regional Perinatal Center Intensive Care Units, New York 2009
┇State Average. ●Risk-Adjusted Infection rate. > Upper confidence limit exceeds graph area ▬^^Significantly higher than state average.▬**Significantly lower than state average. ▬Average. ▬*Zero Infections,not significant. Data reported as of August 25, 2010. Rates are per 1000 central line days (CLDAYS). NA: Hospitals with less than 50 central line days. Adj Rate =Adjusted by NHSN Birth Weight Category. Excludes clinical sepsis and untreated event with single contaminated specimen.

104
Figure 26. Central Line-Associated Blood Stream Infection (CLABSI) Rates Level III Neonatal Intensive Care Units, New York 2009
┇State Average. ●Risk-Adjusted Infection rate. > Upper confidence limit exceeds graph area ▬^^Significantly higher than state average.▬**Significantly lower than state average. ▬Average. ▬*Zero Infections,not significant. Data reported as of August 25, 2010. Rates are per 1000 central line days (CLDAYS). NA: Hospitals with less than 50 central line days. Adj Rate =Adjusted by NHSN Birth Weight Category. Excludes clinical sepsis and untreated event with single contaminated specimen.

105
Figure 27. Central Line-Associated Blood Stream Infection (CLABSI) Rates Level II/III Neonatal Intensive Care Units, New York 2009
┇State Average. ●Risk-Adjusted Infection rate. > Upper confidence limit exceeds graph area ▬^^Significantly higher than state average.▬**Significantly lower than state average. ▬Average. ▬*Zero Infections,not significant. Data reported as of August 25, 2010. Rates are per 1000 central line days (CLDAYS). NA: Hospitals with less than 50 central line days. Adj Rate =Adjusted by NHSN Birth Weight Category. Excludes clinical sepsis and untreated event with single contaminated specimen. Table 13. Microorganisms Identified with Central Line-Associated Blood Stream Infections, Neonatal Intensive Care Units, New York State 2009
Microorganism
Number of
Isolates
Percent of
Infections Coagulase negative staphylococci 72 40.9 Staphylococcus aureus 37 21.0 (MRSA) (8) ( 4.5) Yeast 21 11.9 Enterococci 19 10.8 (VRE) (1) ( 0.6) Escherichia sp. 11 6.3 Klebsiella sp. 10 5.7 Enterobacter sp. 6 3.4 Pseudomonas sp. 6 3.4 Other 12 6.8
New York State data reported as of August 25, 2010 Out of 176 infections.

106
Figure 28. Umbilical Catheter-Associated Blood Stream Infection (UCABSI) Rates Regional Perinatal Center Neonatal Intensive Care Units, New York 2009
┇State Average. ●Risk-Adjusted Infection rate. > Upper confidence limit exceeds graph area ▬^^Significantly higher than state average.▬**Significantly lower than state average. ▬Average. ▬*Zero Infections,not significant. Data reported as of August 25, 2010. Rates are per 1000 umbilical catheter days (UCDAYS). NA: Hospitals with less than 50 central line days. Adj Rate =Adjusted by NHSN Birth Weight Category Excludes clinical sepsis and untreated event with single contaminated specimen.

107
Figure 29. Umbilical Catheter-Associated Blood Stream Infection (UCABSI) Rates Level III Neonatal Intensive Care Units, New York 2009
┇State Average. ●Risk-Adjusted Infection rate. > Upper confidence limit exceeds graph area ▬^^Significantly higher than state average.▬**Significantly lower than state average. ▬Average. ▬*Zero Infections,not significant. Data reported as of August 25, 2010. Rates are per 1000 umbilical catheter days (UCDAYS). NA: Hospitals with less than 50 central line days. Adj Rate =Adjusted by NHSN Birth Weight Category Excludes clinical sepsis and untreated event with single contaminated specimen.

108
Figure 30. Umbilical Catheter-Associated Blood Stream Infection (UCABSI) Rates Level II/III Neonatal Intensive Care Units, New York 2009
┇State Average. ●Risk-Adjusted Infection rate. > Upper confidence limit exceeds graph area ▬^^Significantly higher than state average.▬**Significantly lower than state average. ▬Average. ▬*Zero Infections,not significant. Data reported as of August 25, 2010. Rates are per 1000 umbilical catheter days (UCDAYS). NA: Hospitals with less than 50 central line days. Adj Rate =Adjusted by NHSN Birth Weight Category Excludes clinical sepsis and untreated event with single contaminated specimen.
Table 14. Microorganisms Identified in Umbilical Catheter-Associated Blood Stream Infections, Neonatal Intensive Care Units, New York State 2009
Microorganism
Number of
Isolates
Percent of
Infections Coagulase negative staphylococci 24 41.4 Staphylococcus aureus 10 17.2 (MRSA) (6) (10.3) Yeast 6 10.3 Enterococci 2 3.4 Other 17 29.3
New York State data reported as of August 25, 2010 Out of 58 infections.

109
Table 15. Trends in Blood Stream Infection Rates by Type of Neonatal Intensive Care Unit, New York State 2007-2009
Location
2007 2008 2009
SIR Obs Exp SIR (95% CI) Obs Exp SIR (95% CI)
Level 2/3 NICU - CLABSI 1.0 40 33.9 1.18 (0.84, 1.61) 25 33.7 0.74 (0.48, 1.09)
Level 2/3 NICU - UCABSI 1.0 10 21.1 0.47 (0.23, 0.87) 14 19.8 0.71 (0.39, 1.19)
Level 3 NICU - CLABSI 1.0 23 23.3 0.99 (0.63, 1.48) 40 27.0 1.48 (1.06, 2.02)
Level 3 NICU - UCABSI 1.0 10 22.2 0.45 (0.22, 0.83) 19 21.2 0.90 (0.54, 1.40)
RPC NICU - CLABSI 1.0 142 172.2 0.82 (0.69, 0.97) 111 184.4 0.60 (0.50, 0.72)
RPC NICU - UCABSI 1.0 33 44.4 0.74 (0.51, 1.04) 25 52.9 0.47 (0.31, 0.70)
Neonatal TOTAL 1.0 258 317.1 0.81 (0.72, 0.92) 234 339.0 0.69 (0.60, 0.78) Obs- Number of Observed Central Line-Associated (CLABSI) or Umbilical Line-Associated Blood Stream Infections (UCABSI) Exp - Number of Expected CLABSI or UCABSI, if infection rate was the same as in 2007. SIR – Standardized Incidence Ratio, using New York State 2007 as standard. CI – Confidence Interval Data downloaded 8/25/2010. Excludes Criteria 2b/3b and clinical sepsis. 2008 and 2009 data were indirectly standardized based on NYS 2007 rates.

Figu2007
█Acute█AggreFTE = The fol ambula
ure 31. Hosp7-2009
e care beds peregate (acute anFull Time Equllowing equivaatory surgery c
pital Beds p
r One FTE Infend other) beds puivalent; Add. alents were usecenter = 50 AC
per One Ful
ection Preventiper One FTE IBed EQ = Addd: ICU bed = 2
C beds; ambula
ll Time Equ
onist Infection Preveditional Bed Eq2 AC beds; lonatory clinic = 10
uivalent Infe
entionist quivalent; IP =
ng term care be0 AC beds; and
ection Preve
= Infection Preed = ½ an AC bd a private phy
entionist in
eventionist; ACbed; dialysis faysician’s office
New York S
C = Acute Caracility = 50 ACe = 5 AC beds.
110
State,
e C beds;
0

111
Figure 32. Infection Preventionist Personnel Resources in NYS Hospitals, 2009 (page 1 of 6)
█Acute care beds per One FTE Infection Preventionist, state average is 138 █Aggregate (acute and other) beds per One FTE Infection Preventionist, state average is 257 FTE = Full Time Equivalent; Add. Bed EQ = Additional Bed Equivalent; IP = Infection Preventionist; AC = Acute Care The following equivalents were used: ICU bed = 2 AC beds; long term care bed = ½ an AC bed; dialysis facility = 50 AC beds; ambulatory surgery center = 50 AC beds; ambulatory clinic = 10 AC beds; and a private physician’s office = 5 AC beds. Vertical reference lines indicate low resources: below the 15th percentile in either Acute- or Aggregate- Beds Per FTE Measure.

112
Figure 32. Infection Preventionist Personnel Resources in NYS Hospitals, 2009 (page 2 of 6)
█Acute care beds per One FTE Infection Preventionist, state average is 138 █Aggregate (acute and other) beds per One FTE Infection Preventionist, state average is 257 FTE = Full Time Equivalent; Add. Bed EQ = Additional Bed Equivalent; IP = Infection Preventionist; AC = Acute Care The following equivalents were used: ICU bed = 2 AC beds; long term care bed = ½ an AC bed; dialysis facility = 50 AC beds; ambulatory surgery center = 50 AC beds; ambulatory clinic = 10 AC beds; and a private physician’s office = 5 AC beds. Vertical reference lines indicate low resources: below the 15th percentile in either Acute- or Aggregate- Beds Per FTE Measure.

113
Figure 32. Infection Preventionist Personnel Resources in NYS Hospitals, 2009 (page 3 of 6)
█Acute care beds per One FTE Infection Preventionist, state average is 138 █Aggregate (acute and other) beds per One FTE Infection Preventionist, state average is 257 FTE = Full Time Equivalent; Add. Bed EQ = Additional Bed Equivalent; IP = Infection Preventionist; AC = Acute Care The following equivalents were used: ICU bed = 2 AC beds; long term care bed = ½ an AC bed; dialysis facility = 50 AC beds; ambulatory surgery center = 50 AC beds; ambulatory clinic = 10 AC beds; and a private physician’s office = 5 AC beds. Vertical reference lines indicate low resources: below the 15th percentile in either Acute- or Aggregate- Beds Per FTE Measure.

114
Figure 32. Infection Preventionist Personnel Resources in NYS Hospitals, 2009 (page 4 of 6)
█Acute care beds per One FTE Infection Preventionist, state average is 138 █Aggregate (acute and other) beds per One FTE Infection Preventionist, state average is 257 FTE = Full Time Equivalent; Add. Bed EQ = Additional Bed Equivalent; IP = Infection Preventionist; AC = Acute Care The following equivalents were used: ICU bed = 2 AC beds; long term care bed = ½ an AC bed; dialysis facility = 50 AC beds; ambulatory surgery center = 50 AC beds; ambulatory clinic = 10 AC beds; and a private physician’s office = 5 AC beds. Vertical reference lines indicate low resources: below the 15th percentile in either Acute- or Aggregate- Beds Per FTE Measure.

115
Figure 32. Infection Preventionist Personnel Resources in NYS Hospitals, 2009 (page 5 of 6)
█Acute care beds per One FTE Infection Preventionist, state average is 138 █Aggregate (acute and other) beds per One FTE Infection Preventionist, state average is 257 FTE = Full Time Equivalent; Add. Bed EQ = Additional Bed Equivalent; IP = Infection Preventionist; AC = Acute Care The following equivalents were used: ICU bed = 2 AC beds; long term care bed = ½ an AC bed; dialysis facility = 50 AC beds; ambulatory surgery center = 50 AC beds; ambulatory clinic = 10 AC beds; and a private physician’s office = 5 AC beds. Vertical reference lines indicate low resources: below the 15th percentile in either Acute- or Aggregate- Beds Per FTE Measure.

116
Figure 32. Infection Preventionist Personnel Resources in NYS Hospitals, 2009 (page 6 of 6)
█Acute care beds per One FTE Infection Preventionist, state average is 138 █Aggregate (acute and other) beds per One FTE Infection Preventionist, state average is 257 FTE = Full Time Equivalent; Add. Bed EQ = Additional Bed Equivalent; IP = Infection Preventionist; AC = Acute Care The following equivalents were used: ICU bed = 2 AC beds; long term care bed = ½ an AC bed; dialysis facility = 50 AC beds; ambulatory surgery center = 50 AC beds; ambulatory clinic = 10 AC beds; and a private physician’s office = 5 AC beds. Vertical reference lines indicate low resources: below the 15th percentile in either Acute- or Aggregate- Beds Per FTE Measure.

117
Summary Table

Color key: **Blue: significantly lower than state average ^^Red: significantly higher than state average Grey: not statistically different from state average *: Zero infections, not statistically significant
NA: Fewer than 20 procedures or 50 line days reported Blank: No procedures or ICUs at hospital 118
Table 16. Summary of Hospital-Acquired Infection Data, New York State 2008-2009 Surgical Site Infections Central Line-Associated Blood Stream Infections Umbilical Inf.
Colon Hip Coronary Artery
Bypass Chest Coronary Artery
Bypass Donor Coronary ICU Cardiothoracic
ICU Medical ICU Medical Surgical
ICU Surgical ICU Neurosurgical
ICU Pediatric ICU Neonatal ICU Neonatal ICU
Hospital Year SSI/
procs Adj. Rate
SSI/ procs
Adj. Rate
SSI/ procs
Adj. Rate
SSI/ procs
Adj. Rate
CLABSI/CLDays Rate
CLABSI/CLDays Rate
CLABSI/CLDays Rate
CLABSI/ CLDays Rate
CLABSI/CLDays Rate
CLABSI/CLDays Rate
CLABSI/CLDays Rate
CLABSI/CLDays
Adj rate
UCABSI/ UCDays
Adj rate
State Average
2008 4.4 1.1 2.2 1.0 2.2 1.4 Teaching/Non 2.7/2.7
Teaching/Non 2.4/2.0 2.8 2.3 3.3 RPC/Lev3/Lev2-3
3.1/2.2/5.9 RPC/Lev3/Lev2-3
2.2/1.6/2.8
2009 4.8 1.1 2.2 0.9 1.8 1.3 Teaching/Non 2.5/1.9
Teaching/Non 1.7/1.9 2.1 2.1 2.2 RPC/Lev3/Lev2-3
2.2/3.5/3.8 RPC/Lev3/Lev2-3
1.5/3.0/4.0 AO Fox Memorial 2008 2/ 44 4.8 0/ 25 * 0.0 0/ 286 * 0.0
2009 3/ 51 6.2 0/ 25 * 0.0 0/ 272 * 0.0
Adirondack Medical 2008 1/ 20 5.4 1/ 66 1.3 2/ 595 3.4
2009 2/ 21 9.3 1/ 58 1.7 0/ 506 * 0.0
Albany Medical 2008 22/360 6.3 0/ 209 * 0.0 5/ 398 1.2 0/ 350 ** 0.0 1/2197 0.5 7/2882 2.4 5/3321 1.5 11/4448 2.5 0/ 528 * 0.0 14/1972 ^^ 7.1 4/3352 1.3 1/1768 0.6
2009 20/379 5.4 1/ 270 0.4 7/ 367 1.8 1/ 340 0.3 1/2163 0.5 4/2868 1.4 5/2821 1.8 5/4111 1.2 0/1148 * 0.0 0/2039 ** 0.0 1/4706 ** 0.2 0/1449 * 0.0
Albany Memorial 2008 5/ 81 6.7 3/ 139 2.4 1/ 797 1.3
2009 2/120 1.9 0/ 101 * 0.0 0/ 826 * 0.0
Alice Hyde 2008 0/ 27 * 0.0 1/ 40 2.0 0/ 149 * 0.0
2009 1/ 34 2.8 0/ 44 * 0.0 0/ 213 * 0.0
Arnot Ogden 2008 7/ 57 ^^12.0 6/ 165 ^^ 3.5 11/ 154 ^^ 5.6 2/ 144 1.1 5/3914 1.3 3/ 442 6.1 2/ 444 4.6
2009 6/ 86 6.3 3/ 149 2.1 4/ 148 2.3 4/ 138 2.8 7/3467 2.0 2/ 453 5.0 1/ 502 3.8
Auburn Memorial 2008 0/ 44 * 0.0 1/ 50 1.3 0/ 260 * 0.0
2009 2/ 35 6.0 0/ 48 * 0.0 0/ 384 * 0.0
Bellevue Hospital 2008 6/129 4.5 1/ 51 1.1 11/ 158 ^^ 5.7 2/ 157 1.3 6/1057 5.7 0/ 908 * 0.0 9/1910 4.7 5/2156 2.3 3/ 571 5.3 0/ 51 * 0.0 4/ 553 7.2 2/ 161 10.9
2009 12/119 ^^ 9.6 0/ 48 * 0.0 4/ 148 2.5 2/ 145 1.3 5/ 896 5.6 2/ 880 2.3 4/1471 2.7 9/1806 ^^ 5.0 1/ 654 1.5 0/ 56 * 0.0 5/ 519 ^^ 8.8 1/ 199 5.0
Benedictine Hospital 2008 0/ 59 * 0.0 NA NA 3/1199 2.5
2009 0/ 78 ** 0.0 0/ 62 * 0.0 0/1014 * 0.0
Bertrand Chaffee 2008 NA NA
2009 NA NA
Beth Israel- Kings 2008 0/ 56 * 0.0 0/ 54 * 0.0 2/1758 1.1
2009 1/ 50 1.9 1/ 56 1.3 4/1457 2.7
Beth Israel- Petrie 2008 23/230 ^^ 9.8 2/ 248 0.9 12/ 314 3.5 8/ 298 ^^ 2.8 0/ 667 * 0.0 3/1437 2.1 3/3605 ** 0.8 4/1405 2.8 0/ 157 * 0.0 3/ 292 13.0 0/ 188 * 0.0
2009 18/229 7.8 3/ 296 1.1 5/ 247 2.0 5/ 245 2.0 1/ 625 1.6 2/1074 1.9 8/3526 2.3 1/1776 0.6 0/ 167 * 0.0 1/ 203 4.9 1/ 201 4.1

Table 16. Summary of Hospital-Acquired Infection Data, New York State 2008-2009 (continued)
Color key: **Blue: significantly lower than state average ^^Red: significantly higher than state average Grey: not statistically different from state average *: Zero infections, not statistically significant NA: Fewer than 20 procedures or 50 line days reported Blank: No procedures or ICUs at hospital 119
Surgical Site Infections Central Line-Associated Blood Stream Infections Umbilical Inf.
Colon Hip Coronary Artery
Bypass Chest Coronary Artery
Bypass Donor Coronary ICU Cardiothoracic
ICU Medical ICU Medical Surgical
ICU Surgical ICU Neurosurgical
ICU Pediatric ICU Neonatal ICU Neonatal ICU
Hospital Year SSI/
procs Adj. Rate
SSI/ procs
Adj. Rate
SSI/ procs
Adj. Rate
SSI/ procs
Adj. Rate
CLABSI/CLDays Rate
CLABSI/CLDays Rate
CLABSI/CLDays Rate
CLABSI/ CLDays Rate
CLABSI/CLDays Rate
CLABSI/CLDays Rate
CLABSI/CLDays Rate
CLABSI/CLDays
Adj rate
UCABSI/ UCDays
Adj rate
State Average
2008 4.4 1.1 2.2 1.0 2.2 1.4 Teaching/Non 2.7/2.7
Teaching/Non 2.4/2.0 2.8 2.3 3.3 RPC/Lev3/Lev2-3
3.1/2.2/5.9 RPC/Lev3/Lev2-3
2.2/1.6/2.8
2009 4.8 1.1 2.2 0.9 1.8 1.3 Teaching/Non 2.5/1.9
Teaching/Non 1.7/1.9 2.1 2.1 2.2 RPC/Lev3/Lev2-3
2.2/3.5/3.8 RPC/Lev3/Lev2-3
1.5/3.0/4.0
Bon Secours 2008 1/ 32 3.1 NA NA 2/ 536 3.7
2009 0/ 22 * 0.0 NA NA 1/ 330 3.0
Bronx-Lebanon 2008 0/ 52 * 0.0 0/ 31 * 0.0 0/ 295 * 0.0 6/3082 1.9 0/ 405 * 0.0 NA NA
2009 0/ 75 ** 0.0 0/ 31 * 0.0 0/ 213 * 0.0 5/3845 1.3 3/ 616 4.2
Brookdale Hospital 2008 3/ 98 2.9 0/ 24 * 0.0 3/ 614 4.9 10/3073 3.3 5/1590 3.1 1/ 639 1.6 2/ 122 16.4 0/ 184 * 0.0 3/ 399 7.3
2009 3/ 84 3.3 0/ 31 * 0.0 1/ 740 1.4 5/2564 2.0 3/1538 2.0 1/ 469 2.1 0/ 106 * 0.0 NA NA 6/ 542 ^^ 9.2
Brookhaven Memorial 2008 3/144 2.0 3/ 125 1.9 6/1044 5.7 11/1191 ^^ 9.2 11/1829 ^^ 6.0
2009 3/130 2.3 6/ 121 ^^ 4.3 3/1246 2.4 4/1368 2.9 8/1653 ^^ 4.8
Brooklyn Downtown 2008 6/108 5.6 1/ 23 1.8 6/1170 5.1 1/1285 0.8 1/1314 0.8 0/ 362 * 0.0
2009 4/ 85 5.1 NA NA 6/1297 4.6 2/ 939 2.1 6/1517 4.3 0/ 250 * 0.0
Brooks Memorial 2008 1/ 20 5.5 2/ 75 3.4 0/ 436 * 0.0
2009 NA NA 0/ 96 * 0.0 0/ 268 * 0.0
Buffalo General 2008 11/153 7.0 7/ 544 1.2 23/ 423 ^^ 5.3 14/ 394 ^^ 3.5 2/ 600 3.3 8/2748 2.9 3/3806 ** 0.8
2009 12/156 7.7 3/ 568 0.5 21/ 468 ^^ 4.1 3/ 415 0.8 3/ 802 3.7 2/2180 0.9 13/3098 4.2 13/1942 ^^ 6.7
Canton-Potsdam 2008 1/ 36 2.7 1/ 66 1.3 0/ 197 * 0.0
2009 5/ 73 6.3 2/ 74 2.7 0/ 102 * 0.0
Carthage Area 2008 NA NA
2009 NA NA
Catskill Regional 2008 1/ 39 2.7 1/ 36 2.6 3/ 549 5.5
2009 0/ 33 * 0.0 1/ 30 3.0 0/ 548 * 0.0
Cayuga Medical Cntr 2008 5/ 76 6.6 2/ 83 2.5 0/1184 * 0.0
2009 4/ 50 7.2 0/ 66 * 0.0 0/1386 * 0.0
Champlain Valley 2008 9/ 93 ^^10.2 0/ 96 * 0.0 2/ 135 1.1 1/ 130 0.8 4/2442 1.6
2009 10/114 8.7 0/ 113 * 0.0 0/ 121 ** 0.0 1/ 119 0.9 2/1791 1.1
Chenango Memorial 2008 NA NA 1/ 36 2.1 1/ 274 3.6
2009 NA NA 0/ 45 * 0.0 0/ 205 * 0.0

Table 16. Summary of Hospital-Acquired Infection Data, New York State 2008-2009 (continued)
Color key: **Blue: significantly lower than state average ^^Red: significantly higher than state average Grey: not statistically different from state average *: Zero infections, not statistically significant NA: Fewer than 20 procedures or 50 line days reported Blank: No procedures or ICUs at hospital 120
Surgical Site Infections Central Line-Associated Blood Stream Infections Umbilical Inf.
Colon Hip Coronary Artery
Bypass Chest Coronary Artery
Bypass Donor Coronary ICU Cardiothoracic
ICU Medical ICU Medical Surgical
ICU Surgical ICU Neurosurgical
ICU Pediatric ICU Neonatal ICU Neonatal ICU
Hospital Year SSI/
procs Adj. Rate
SSI/ procs
Adj. Rate
SSI/ procs
Adj. Rate
SSI/ procs
Adj. Rate
CLABSI/CLDays Rate
CLABSI/CLDays Rate
CLABSI/CLDays Rate
CLABSI/ CLDays Rate
CLABSI/CLDays Rate
CLABSI/CLDays Rate
CLABSI/CLDays Rate
CLABSI/CLDays
Adj rate
UCABSI/ UCDays
Adj rate
State Average
2008 4.4 1.1 2.2 1.0 2.2 1.4 Teaching/Non 2.7/2.7
Teaching/Non 2.4/2.0 2.8 2.3 3.3 RPC/Lev3/Lev2-3
3.1/2.2/5.9 RPC/Lev3/Lev2-3
2.2/1.6/2.8
2009 4.8 1.1 2.2 0.9 1.8 1.3 Teaching/Non 2.5/1.9
Teaching/Non 1.7/1.9 2.1 2.1 2.2 RPC/Lev3/Lev2-3
2.2/3.5/3.8 RPC/Lev3/Lev2-3
1.5/3.0/4.0
Claxton-Hepburn 2008 1/ 28 3.7 NA NA 0/ 382 * 0.0
2009 1/ 44 2.4 NA NA 1/ 500 2.0
Clifton Springs 2008 5/ 38 ^^13.8 2/ 83 3.1 0/ 352 * 0.0
2009 1/ 31 3.6 0/ 100 * 0.0 0/ 422 * 0.0
Columbia Memorial 2008 1/ 59 1.7 1/ 48 1.3 3/ 691 4.3
2009 1/ 69 1.5 2/ 80 1.8 2/ 789 2.5
Community General 2008 2/142 1.4 4/ 525 1.0 0/1215 * 0.0
2009 1/125 ** 0.7 1/ 498 0.3 1/1404 0.7
Community Memorial 2008 NA NA 0/ 189 * 0.0 0/ 82 * 0.0
2009 NA NA 2/ 214 1.1 0/ 131 * 0.0
Coney Island 2008 4/ 36 10.4 4/ 60 3.8 0/ 241 * 0.0 1/1245 0.8 1/ 723 1.4
2009 4/ 39 9.1 2/ 69 1.8 0/ 148 * 0.0 5/1353 3.7 3/ 746 4.0
Corning Hospital 2008 0/ 32 * 0.0 1/ 60 1.4 0/ 397 * 0.0
2009 3/ 29 10.6 0/ 52 * 0.0 0/ 361 * 0.0
Cortland Reg Med 2008 0/ 22 * 0.0 0/ 28 * 0.0 1/ 691 1.4
2009 1/ 29 3.2 NA NA 2/ 912 2.2
Crouse Hospital 2008 2/239 ** 0.9 4/ 253 2.0 2/3129 0.6 7/1704 4.0 4/1156 2.9
2009 14/258 5.7 4/ 269 1.6 1/3125 ** 0.3 9/3167 2.8 6/1247 3.5
DeGraff Memorial 2008 0/ 39 * 0.0 2/ 43 3.9 0/ 570 * 0.0
2009 1/ 43 2.6 2/ 49 3.3 1/ 524 1.9
EJ Noble Hospital 2008 NA NA NA NA
2009 NA NA
Eastern Long Island 2008 NA NA NA NA 0/ 87 * 0.0
2009 NA NA NA NA 0/ 148 * 0.0
Ellis Hospital 2008 17/237 7.2 1/ 238 0.3 8/ 314 3.3 1/ 270 0.5 12/5290 2.3
2009 10/253 4.0 3/ 265 1.0 9/ 254 3.8 1/ 227 0.5 14/5718 2.4

Table 16. Summary of Hospital-Acquired Infection Data, New York State 2008-2009 (continued)
Color key: **Blue: significantly lower than state average ^^Red: significantly higher than state average Grey: not statistically different from state average *: Zero infections, not statistically significant NA: Fewer than 20 procedures or 50 line days reported Blank: No procedures or ICUs at hospital 121
Surgical Site Infections Central Line-Associated Blood Stream Infections Umbilical Inf.
Colon Hip Coronary Artery
Bypass Chest Coronary Artery
Bypass Donor Coronary ICU Cardiothoracic
ICU Medical ICU Medical Surgical
ICU Surgical ICU Neurosurgical
ICU Pediatric ICU Neonatal ICU Neonatal ICU
Hospital Year SSI/
procs Adj. Rate
SSI/ procs
Adj. Rate
SSI/ procs
Adj. Rate
SSI/ procs
Adj. Rate
CLABSI/CLDays Rate
CLABSI/CLDays Rate
CLABSI/CLDays Rate
CLABSI/ CLDays Rate
CLABSI/CLDays Rate
CLABSI/CLDays Rate
CLABSI/CLDays Rate
CLABSI/CLDays
Adj rate
UCABSI/ UCDays
Adj rate
State Average
2008 4.4 1.1 2.2 1.0 2.2 1.4 Teaching/Non 2.7/2.7
Teaching/Non 2.4/2.0 2.8 2.3 3.3 RPC/Lev3/Lev2-3
3.1/2.2/5.9 RPC/Lev3/Lev2-3
2.2/1.6/2.8
2009 4.8 1.1 2.2 0.9 1.8 1.3 Teaching/Non 2.5/1.9
Teaching/Non 1.7/1.9 2.1 2.1 2.2 RPC/Lev3/Lev2-3
2.2/3.5/3.8 RPC/Lev3/Lev2-3
1.5/3.0/4.0
Elmhurst 2008 1/ 72 1.5 0/ 30 * 0.0 0/ 474 * 0.0 1/ 289 3.9 0/ 112 * 0.0
2009 3/ 63 4.8 0/ 42 * 0.0 1/ 424 2.4 0/ 223 * 0.0 0/ 148 * 0.0
Erie Medical Center 2008 3/ 86 3.4 0/ 114 * 0.0 3/ 128 2.2 1/ 71 1.3 0/ 779 * 0.0 0/ 206 * 0.0 4/2334 1.7
2009 3/ 98 3.1 3/ 137 1.6 3/ 137 2.0 0/ 111 * 0.0 0/1604 * 0.0 0/ 428 * 0.0 3/2683 1.1
FF Thompson 2008 1/ 48 2.0 0/ 92 * 0.0 1/ 390 2.6
2009 1/ 40 2.5 1/ 155 0.9 1/ 585 1.7
Faxton St. Lukes 2008 1/129 ** 0.8 1/ 143 0.6 4/1756 2.3 7/2234 3.1
2009 0/141 ** 0.0 1/ 138 0.5 3/2907 1.0 1/2543 0.4
Flushing Hospital 2008 3/ 48 6.4 0/ 32 * 0.0 3/ 411 7.3 6/1156 5.2 2/ 405 4.9 2/1012 2.3 2/ 279 7.4
2009 2/ 58 3.9 0/ 40 * 0.0 1/ 530 1.9 4/1323 3.0 0/ 736 * 0.0 0/ 969 * 0.0 0/ 277 * 0.0
Forest Hills Hosp 2008 9/132 6.9 0/ 103 * 0.0 4/2657 1.5
2009 5/111 4.7 3/ 114 2.0 8/3508 2.3
Franklin 2008 1/114 0.9 3/ 105 2.9 2/2759 0.7
2009 0/ 96 ** 0.0 0/ 127 * 0.0 3/2715 1.1
Geneva General 2008 1/ 47 2.0 0/ 91 * 0.0 0/ 478 * 0.0
2009 0/ 49 * 0.0 1/ 72 1.3 6/ 705 ^^ 8.5
Glen Cove Hospital 2008 1/ 52 1.7 1/ 418 0.3 0/1731 ** 0.0
2009 5/ 52 8.8 5/ 440 1.4 0/1883 ** 0.0
Glens Falls 2008 8/139 5.9 1/ 176 0.5 6/2409 2.5
2009 6/131 4.9 1/ 169 0.6 3/2179 1.4
Good Samar. Suffern 2008 5/105 4.9 1/ 57 1.6 1/ 241 0.4 0/ 225 * 0.0 1/1003 1.0 2/2007 1.0 1/1007 1.0
2009 3/ 90 3.5 0/ 60 * 0.0 5/ 206 2.2 2/ 193 1.0 1/1023 1.0 6/1610 3.7 1/ 828 1.2
Good Samar. W Islip 2008 13/281 4.8 2/ 147 1.2 3/4198 0.7 2/ 141 14.2 0/ 496 * 0.0 0/ 475 * 0.0
2009 9/242 3.8 2/ 138 1.2 7/4982 1.4 1/ 276 3.6 1/ 762 1.5 3/ 558 5.0
Harlem Hospital 2008 1/ 49 1.9 NA NA 3/ 502 6.0 4/1986 2.0 NA NA 0/ 206 * 0.0 0/ 119 * 0.0
2009 0/ 48 * 0.0 NA NA 4/ 729 5.5 6/2401 2.5 0/ 129 * 0.0 2/ 472 4.1 0/ 143 * 0.0

Table 16. Summary of Hospital-Acquired Infection Data, New York State 2008-2009 (continued)
Color key: **Blue: significantly lower than state average ^^Red: significantly higher than state average Grey: not statistically different from state average *: Zero infections, not statistically significant NA: Fewer than 20 procedures or 50 line days reported Blank: No procedures or ICUs at hospital 122
Surgical Site Infections Central Line-Associated Blood Stream Infections Umbilical Inf.
Colon Hip Coronary Artery
Bypass Chest Coronary Artery
Bypass Donor Coronary ICU Cardiothoracic
ICU Medical ICU Medical Surgical
ICU Surgical ICU Neurosurgical
ICU Pediatric ICU Neonatal ICU Neonatal ICU
Hospital Year SSI/
procs Adj. Rate
SSI/ procs
Adj. Rate
SSI/ procs
Adj. Rate
SSI/ procs
Adj. Rate
CLABSI/CLDays Rate
CLABSI/CLDays Rate
CLABSI/CLDays Rate
CLABSI/ CLDays Rate
CLABSI/CLDays Rate
CLABSI/CLDays Rate
CLABSI/CLDays Rate
CLABSI/CLDays
Adj rate
UCABSI/ UCDays
Adj rate
State Average
2008 4.4 1.1 2.2 1.0 2.2 1.4 Teaching/Non 2.7/2.7
Teaching/Non 2.4/2.0 2.8 2.3 3.3 RPC/Lev3/Lev2-3
3.1/2.2/5.9 RPC/Lev3/Lev2-3
2.2/1.6/2.8
2009 4.8 1.1 2.2 0.9 1.8 1.3 Teaching/Non 2.5/1.9
Teaching/Non 1.7/1.9 2.1 2.1 2.2 RPC/Lev3/Lev2-3
2.2/3.5/3.8 RPC/Lev3/Lev2-3
1.5/3.0/4.0
Highland Hospital 2008 13/216 6.0 7/ 649 1.2 7/3266 2.1
2009 8/182 4.5 6/ 719 0.9 1/3190 0.3
Hosp for Spec Surg 2008 4/3617 ** 0.2
2009 14/3935 ** 0.5
Hudson Valley 2008 4/ 72 5.4 0/ 85 * 0.0 6/1483 4.0
2009 3/ 69 4.1 1/ 98 0.8 4/1467 2.7
Huntington 2008 6/147 4.1 6/ 212 2.7 2/ 964 2.1 1/1703 0.6
2009 4/129 3.0 8/ 227 ^^ 3.4 3/ 852 3.5 2/1490 1.3
Intercomm. Newfane 2008 NA NA NA NA 1/ 118 8.5
2009 NA NA NA NA 0/ 107 * 0.0
Interfaith Medical 2008 NA NA NA NA 5/2507 2.0
2009 0/ 29 * 0.0 NA NA 8/2342 3.4
Ira Davenport 2008 0/ 56 * 0.0
2009 NA NA
JT Mather 2008 10/144 7.2 0/ 61 * 0.0 2/1092 1.8 5/1947 2.6
2009 10/140 7.1 2/ 86 2.7 3/1313 2.3 3/1849 1.6
Jacobi Medical 2008 7/ 71 9.3 1/ 38 1.4 6/1076 5.6 6/2180 2.8 12/1472 ^^ 8.2 0/ 145 * 0.0 4/1123 3.1 1/ 342 2.5
2009 9/ 66 ^^12.0 1/ 53 1.5 5/1112 4.5 4/1890 2.1 7/ 971 ^^ 7.2 1/ 293 3.4 6/1471 3.8 0/ 494 * 0.0
Jamaica Hospital 2008 5/ 65 7.5 1/ 42 1.5 1/1698 0.6 2/1328 1.5 4/ 734 5.2 0/ 207 * 0.0
2009 5/ 66 7.5 2/ 44 3.3 1/1833 0.5 4/1678 2.4 3/ 812 3.5 1/ 115 7.9
Jones Memorial 2008 1/ 22 5.1 0/ 140 * 0.0
2009 NA NA 0/ 180 * 0.0
Kenmore Mercy 2008 1/137 0.8 7/ 379 ^^ 2.9 1/1677 0.6
2009 3/157 2.1 2/ 414 0.7 3/1830 1.6
Kings County 2008 2/ 82 2.3 NA NA 3/1143 2.6 2/1213 1.6 0/ 838 * 0.0 1/ 739 1.4 1/ 258 3.9 7/1341 4.1 2/ 593 3.1
2009 0/ 89 ** 0.0 NA NA 2/ 844 2.4 8/1387 ^^ 5.8 1/ 876 1.1 2/ 759 2.6 0/ 64 * 0.0 5/1286 3.8 1/ 265 3.3

Table 16. Summary of Hospital-Acquired Infection Data, New York State 2008-2009 (continued)
Color key: **Blue: significantly lower than state average ^^Red: significantly higher than state average Grey: not statistically different from state average *: Zero infections, not statistically significant NA: Fewer than 20 procedures or 50 line days reported Blank: No procedures or ICUs at hospital 123
Surgical Site Infections Central Line-Associated Blood Stream Infections Umbilical Inf.
Colon Hip Coronary Artery
Bypass Chest Coronary Artery
Bypass Donor Coronary ICU Cardiothoracic
ICU Medical ICU Medical Surgical
ICU Surgical ICU Neurosurgical
ICU Pediatric ICU Neonatal ICU Neonatal ICU
Hospital Year SSI/
procs Adj. Rate
SSI/ procs
Adj. Rate
SSI/ procs
Adj. Rate
SSI/ procs
Adj. Rate
CLABSI/CLDays Rate
CLABSI/CLDays Rate
CLABSI/CLDays Rate
CLABSI/ CLDays Rate
CLABSI/CLDays Rate
CLABSI/CLDays Rate
CLABSI/CLDays Rate
CLABSI/CLDays
Adj rate
UCABSI/ UCDays
Adj rate
State Average
2008 4.4 1.1 2.2 1.0 2.2 1.4 Teaching/Non 2.7/2.7
Teaching/Non 2.4/2.0 2.8 2.3 3.3 RPC/Lev3/Lev2-3
3.1/2.2/5.9 RPC/Lev3/Lev2-3
2.2/1.6/2.8
2009 4.8 1.1 2.2 0.9 1.8 1.3 Teaching/Non 2.5/1.9
Teaching/Non 1.7/1.9 2.1 2.1 2.2 RPC/Lev3/Lev2-3
2.2/3.5/3.8 RPC/Lev3/Lev2-3
1.5/3.0/4.0
Kingsbrook Jewish 2008 6/ 52 10.4 1/ 24 2.2 4/1166 3.4 4/1404 2.8
2009 3/ 30 8.9 NA NA 2/1103 1.8 11/1658 ^^ 6.6
Kingston Hospital 2008 0/ 69 ** 0.0 0/ 55 * 0.0 0/1754 ** 0.0
2009 1/ 83 1.1 1/ 62 1.5 3/1820 1.6
Lakeside Memorial 2008 NA NA 1/ 31 2.4 0/ 206 * 0.0
2009 NA NA 0/ 27 * 0.0 0/ 238 * 0.0
Lawrence 2008 2/ 77 2.6 0/ 87 * 0.0 14/ 856 ^^16.4
2009 5/103 4.9 1/ 106 0.9 3/ 947 3.2
Lenox Hill 2008 11/190 5.6 11/ 519 2.2 9/ 552 1.7 1/ 488 0.2 7/1268 ^^ 5.5 8/2225 ^^ 3.6 14/3285 4.3 8/ 977 8.3 0/ 55 * 0.0
2009 18/188 ^^ 9.2 7/ 456 1.4 20/ 468 ^^ 4.2 12/ 412 ^^ 2.8 6/1377 4.4 3/2573 1.2 11/3074 ^^ 3.6 7/1104 6.3 NA NA
Lewis County 2008 2/ 21 9.2 0/ 24 * 0.0 0/ 135 * 0.0
2009 2/ 24 7.6 0/ 25 * 0.0 0/ 122 * 0.0
Lincoln Medical 2008 2/ 73 2.6 1/ 25 2.0 0/ 775 * 0.0 0/1675 ** 0.0 4/ 750 5.3 NA NA 1/ 593 1.5 0/ 230 * 0.0
2009 7/ 60 10.5 0/ 21 * 0.0 1/ 795 1.3 2/1642 1.2 1/ 826 1.2 NA NA 2/ 735 2.4 0/ 230 * 0.0
Lockport Memorial 2008 1/ 27 3.9 0/ 26 * 0.0 1/ 526 1.9
2009 3/ 35 9.4 0/ 36 * 0.0 1/ 517 1.9
Long Beach 2008 2/ 25 7.5 NA NA 0/ 944 * 0.0
2009 NA NA 0/ 20 * 0.0 1/ 908 1.1
Long Island College 2008 12/101 ^^11.7 4/ 75 3.5 1/ 524 1.9 9/2582 3.5 1/ 54 18.5 2/ 711 2.7 2/ 369 5.6
2009 9/116 7.6 0/ 88 * 0.0 0/ 427 * 0.0 2/2292 0.9 NA NA 3/ 390 7.5 0/ 333 * 0.0
Long Island Jewish 2008 4/331 ** 1.2 3/ 353 0.8 5/ 391 1.1 3/ 391 0.7 0/ 744 * 0.0 2/2297 0.9 4/1379 2.9 8/2714 2.9 22/4298 ^^ 5.0 0/ 835 * 0.0
2009 14/248 5.5 4/ 274 1.3 10/ 354 2.6 3/ 350 0.8 3/ 817 3.7 0/1362 * 0.0 12/1922 ^^ 6.2 2/2378 0.8 3/2709 1.1 6/3771 1.7 1/ 877 1.4
Lutheran Medical 2008 4/208 2.0 0/ 169 * 0.0 7/3065 2.3 5/2223 2.2
2009 6/176 3.3 3/ 167 1.7 5/2991 1.7 8/2238 3.6
Maimonides 2008 16/235 6.8 2/ 167 0.9 6/ 412 1.3 4/ 399 0.9 1/ 446 2.2 8/2626 3.0 2/3875 ** 0.5 9/1991 4.5 1/ 725 1.4 11/2425 4.6 2/ 237 8.8
2009 20/216 ^^ 9.7 3/ 162 1.3 2/ 334 ** 0.5 4/ 322 1.0 0/ 108 * 0.0 0/1990 * 0.0 2/2182 0.9 3/1703 1.8 5/ 584 ^^ 8.6 9/2190 3.9 0/ 344 * 0.0

Table 16. Summary of Hospital-Acquired Infection Data, New York State 2008-2009 (continued)
Color key: **Blue: significantly lower than state average ^^Red: significantly higher than state average Grey: not statistically different from state average *: Zero infections, not statistically significant NA: Fewer than 20 procedures or 50 line days reported Blank: No procedures or ICUs at hospital 124
Surgical Site Infections Central Line-Associated Blood Stream Infections Umbilical Inf.
Colon Hip Coronary Artery
Bypass Chest Coronary Artery
Bypass Donor Coronary ICU Cardiothoracic
ICU Medical ICU Medical Surgical
ICU Surgical ICU Neurosurgical
ICU Pediatric ICU Neonatal ICU Neonatal ICU
Hospital Year SSI/
procs Adj. Rate
SSI/ procs
Adj. Rate
SSI/ procs
Adj. Rate
SSI/ procs
Adj. Rate
CLABSI/CLDays Rate
CLABSI/CLDays Rate
CLABSI/CLDays Rate
CLABSI/ CLDays Rate
CLABSI/CLDays Rate
CLABSI/CLDays Rate
CLABSI/CLDays Rate
CLABSI/CLDays
Adj rate
UCABSI/ UCDays
Adj rate
State Average
2008 4.4 1.1 2.2 1.0 2.2 1.4 Teaching/Non 2.7/2.7
Teaching/Non 2.4/2.0 2.8 2.3 3.3 RPC/Lev3/Lev2-3
3.1/2.2/5.9 RPC/Lev3/Lev2-3
2.2/1.6/2.8
2009 4.8 1.1 2.2 0.9 1.8 1.3 Teaching/Non 2.5/1.9
Teaching/Non 1.7/1.9 2.1 2.1 2.2 RPC/Lev3/Lev2-3
2.2/3.5/3.8 RPC/Lev3/Lev2-3
1.5/3.0/4.0
Mary Imogene Bassett 2008 9/104 8.2 9/ 187 ^^ 4.4 0/ 89 * 0.0 0/ 84 * 0.0 4/3086 1.3
2009 5/ 98 4.6 3/ 210 1.1 1/ 98 1.0 0/ 81 * 0.0 2/2641 0.8
Massena Memorial 2008 NA NA NA NA 0/ 80 * 0.0
2009 NA NA NA NA 0/ 84 * 0.0
Medina Memorial 2008 0/ 24 * 0.0 NA NA 0/ 138 * 0.0
2009 NA NA NA NA 1/ 90 11.1
Mercy Buffalo 2008 11/204 5.8 3/ 161 1.5 7/ 386 2.1 0/ 358 * 0.0 3/1918 1.6 0/1291 * 0.0 4/2233 1.8
2009 21/215 ^^10.5 0/ 197 * 0.0 14/ 368 4.0 0/ 341 * 0.0 5/2099 2.4 0/1311 * 0.0 4/2504 1.6
Mercy Medical 2008 1/ 65 1.6 0/ 114 * 0.0 7/1731 4.0 1/ 99 9.2 0/ 530 * 0.0
2009 0/ 65 ** 0.0 0/ 106 * 0.0 7/2171 3.2 0/ 115 * 0.0 2/ 513 5.2
Metropolitan 2008 5/ 42 11.8 0/ 22 * 0.0 7/1388 5.0 2/ 694 2.9 5/ 560 9.4 0/ 230 * 0.0
2009 1/ 34 2.8 1/ 32 2.3 3/1043 2.9 0/ 384 * 0.0 2/ 583 3.4 0/ 199 * 0.0
Millard Fill. Gates 2008 3/ 26 10.3 0/ 22 * 0.0 3/ 302 1.0 1/ 278 0.4 1/1663 0.6 8/1605 5.0 0/ 481 * 0.0 1/ 825 1.2
2009 NA NA NA NA 8/ 314 2.6 1/ 283 0.4 0/1834 * 0.0 3/2333 1.3 1/ 683 1.5 2/ 759 2.6
Millard Fill. Suburb 2008 9/159 5.6 2/ 280 0.8 6/3535 1.7
2009 8/156 5.3 4/ 439 1.0 9/4370 2.1
Montefiore-Einstein 2008 3/129 2.3 1/ 161 0.4 4/ 204 1.4 1/ 176 0.5 2/1919 1.0 8/3656 2.2 3/2195 1.3 1/ 796 1.2
2009 3/ 98 3.1 0/ 103 * 0.0 4/ 210 1.7 1/ 196 0.4 4/2177 1.8 3/3565 0.8 3/2335 1.3 0/1410 * 0.0
Montefiore-Moses 2008 11/212 5.2 3/ 194 1.1 13/ 341 3.0 1/ 290 0.3 6/ 997 ^^ 6.0 3/2896 1.0 8/4183 1.9 4/2378 1.7 6/1834 3.3
2009 15/190 7.7 5/ 188 2.1 5/ 301 1.4 3/ 266 0.9 1/ 887 1.1 3/2520 1.2 10/4066 2.5 1/2118 0.5 8/1882 4.3
Montifiore North 2008 2/ 36 5.0 NA NA 1/2289 0.4 8/ 367 ^^24.9 1/ 232 4.1
2009 6/ 36 ^^16.0 NA NA 0/2409 ** 0.0 0/ 291 * 0.0 2/ 279 8.3
Mount Sinai 2008 12/207 5.9 6/ 253 1.9 20/ 457 ^^ 4.0 7/ 457 1.4 4/1524 2.6 6/3796 1.6 6/3271 1.8 6/3858 1.6 7/1889 3.7 11/2334 4.7 2/1672 1.2 2/ 444 4.3
2009 4/197 2.0 6/ 299 1.5 26/ 464 ^^ 5.6 5/ 464 1.0 3/1617 1.9 7/3841 1.8 5/3617 1.4 9/4123 2.2 7/1952 3.6 15/2728 ^^ 5.5 4/2467 1.7 0/ 542 * 0.0
Mount Sinai Queens 2008 4/ 65 5.9 1/ 52 1.9 1/1517 0.7
2009 8/ 63 ^^11.6 0/ 38 * 0.0 1/1557 0.6

Table 16. Summary of Hospital-Acquired Infection Data, New York State 2008-2009 (continued)
Color key: **Blue: significantly lower than state average ^^Red: significantly higher than state average Grey: not statistically different from state average *: Zero infections, not statistically significant NA: Fewer than 20 procedures or 50 line days reported Blank: No procedures or ICUs at hospital 125
Surgical Site Infections Central Line-Associated Blood Stream Infections Umbilical Inf.
Colon Hip Coronary Artery
Bypass Chest Coronary Artery
Bypass Donor Coronary ICU Cardiothoracic
ICU Medical ICU Medical Surgical
ICU Surgical ICU Neurosurgical
ICU Pediatric ICU Neonatal ICU Neonatal ICU
Hospital Year SSI/
procs Adj. Rate
SSI/ procs
Adj. Rate
SSI/ procs
Adj. Rate
SSI/ procs
Adj. Rate
CLABSI/CLDays Rate
CLABSI/CLDays Rate
CLABSI/CLDays Rate
CLABSI/ CLDays Rate
CLABSI/CLDays Rate
CLABSI/CLDays Rate
CLABSI/CLDays Rate
CLABSI/CLDays
Adj rate
UCABSI/ UCDays
Adj rate
State Average
2008 4.4 1.1 2.2 1.0 2.2 1.4 Teaching/Non 2.7/2.7
Teaching/Non 2.4/2.0 2.8 2.3 3.3 RPC/Lev3/Lev2-3
3.1/2.2/5.9 RPC/Lev3/Lev2-3
2.2/1.6/2.8
2009 4.8 1.1 2.2 0.9 1.8 1.3 Teaching/Non 2.5/1.9
Teaching/Non 1.7/1.9 2.1 2.1 2.2 RPC/Lev3/Lev2-3
2.2/3.5/3.8 RPC/Lev3/Lev2-3
1.5/3.0/4.0
Mount St. Marys 2008 9/ 71 ^^12.7 1/ 77 1.0 0/ 613 * 0.0
2009 2/ 71 2.8 2/ 93 1.7 0/ 454 * 0.0
Mount Vernon 2008 NA NA NA NA 2/ 312 6.4
2009 NA NA NA NA 3/ 505 5.9
NY Community
Bklyn 2008 3/ 45 6.2 NA NA 3/ 852 3.5
2009 12/ 45 ^^24.9 2/ 29 4.9 3/ 779 3.9
NY Downtown 2008 2/ 39 5.2 2/ 46 3.9 4/2384 1.7
2009 1/ 55 1.9 1/ 64 1.4 5/1948 2.6
NY Med Ctr Queens 2008 8/258 3.1 11/ 227 ^^ 4.5 1/ 62 2.0 1/ 57 2.4 3/1337 2.2 1/ 673 1.5 1/2213 ** 0.5 4/1532 2.6 0/ 148 * 0.0 0/ 580 * 0.0 0/ 108 * 0.0
2009 22/284 ^^ 8.1 3/ 215 1.3 1/ 101 1.1 7/ 97 ^^ 6.1 2/1224 1.6 2/ 934 2.1 2/2089 1.0 0/1671 ** 0.0 0/ 193 * 0.0 1/ 469 2.4 0/ 149 * 0.0
NY Methodist 2008 1/102 1.0 0/ 132 * 0.0 2/ 117 1.6 2/ 111 2.6 0/ 463 * 0.0 2/1143 1.7 13/4550 2.9 0/ 64 * 0.0 3/1383 2.1 1/ 431 2.3
2009 10/122 8.4 3/ 174 1.1 2/ 132 1.6 0/ 116 * 0.0 0/ 453 * 0.0 0/1390 * 0.0 10/4238 2.4 0/ 168 * 0.0 7/1829 3.5 0/ 371 * 0.0
NYP- Allen 2008 0/ 30 * 0.0 0/ 38 * 0.0 6/1129 5.3
2009 3/ 47 5.8 0/ 46 * 0.0 2/ 882 2.3
NYP- Columbia 2008 19/301 6.2 3/ 281 1.2 14/ 598 2.4 1/ 494 0.2 14/3761 3.7 11/6300 1.7 14/5286 2.6 8/3986 2.0 6/2742 2.2
2009 9/208 4.3 3/ 277 1.0 15/ 562 2.7 1/ 453 0.2 9/3352 2.7 13/6087 2.1 3/4904 0.6 4/3511 1.1 7/2516 2.8
NYP- Morgan Stanley 2008 1/ 32 3.1 14/5939 2.4 18/6689 2.7 3/1669 1.9
2009 1/ 39 2.5 10/5616 1.8 17/6559 2.5 6/1699 3.8
NYP- Weill Cornell 2008 25/545 4.7 1/ 108 0.6 5/ 425 1.5 1/ 397 0.3 6/2537 2.4 4/3956 1.0 8/3220 2.5 12/3314 3.6 7/2261 3.1 5/2597 1.9 10/2665 3.9 1/ 664 1.6
2009 13/540 ** 2.5 1/ 75 0.9 4/ 378 1.3 1/ 353 0.3 4/3256 1.2 4/4311 0.9 7/3355 2.1 7/3275 2.1 4/2423 1.7 2/2579 0.8 7/2490 2.9 0/ 620 * 0.0
NYU Joint Disease 2008 8/ 707 1.1
2009 15/ 888 1.5
NYU Medical Center 2008 10/260 3.6 2/ 190 0.7 5/ 190 3.0 11/ 169 ^^ 5.3 6/1034 ^^ 5.8 28/7545 ^^ 3.7 1/ 556 1.8 3/ 984 3.0 2/ 793 2.6 0/ 418 * 0.0
2009 11/219 4.5 5/ 209 1.6 13/ 239 ^^ 5.3 5/ 217 1.6 1/1459 0.7 6/2646 2.3 13/4575 2.8 1/ 589 1.7 5/1071 4.7 3/ 606 5.7 0/ 457 * 0.0
Nassau University 2008 2/ 31 6.2 2/ 33 4.9 6/ 822 ^^ 7.3 11/1918 ^^ 5.7 7/ 787 ^^ 8.9 0/ 73 * 0.0 3/ 355 6.9 1/ 251 4.1
2009 1/ 39 2.5 1/ 42 2.0 5/ 912 5.5 11/1796 ^^ 6.1 4/ 670 6.0 0/ 84 * 0.0 4/ 246 ^^15.7 1/ 289 3.6

Table 16. Summary of Hospital-Acquired Infection Data, New York State 2008-2009 (continued)
Color key: **Blue: significantly lower than state average ^^Red: significantly higher than state average Grey: not statistically different from state average *: Zero infections, not statistically significant NA: Fewer than 20 procedures or 50 line days reported Blank: No procedures or ICUs at hospital 126
Surgical Site Infections Central Line-Associated Blood Stream Infections Umbilical Inf.
Colon Hip Coronary Artery
Bypass Chest Coronary Artery
Bypass Donor Coronary ICU Cardiothoracic
ICU Medical ICU Medical Surgical
ICU Surgical ICU Neurosurgical
ICU Pediatric ICU Neonatal ICU Neonatal ICU
Hospital Year SSI/
procs Adj. Rate
SSI/ procs
Adj. Rate
SSI/ procs
Adj. Rate
SSI/ procs
Adj. Rate
CLABSI/CLDays Rate
CLABSI/CLDays Rate
CLABSI/CLDays Rate
CLABSI/ CLDays Rate
CLABSI/CLDays Rate
CLABSI/CLDays Rate
CLABSI/CLDays Rate
CLABSI/CLDays
Adj rate
UCABSI/ UCDays
Adj rate
State Average
2008 4.4 1.1 2.2 1.0 2.2 1.4 Teaching/Non 2.7/2.7
Teaching/Non 2.4/2.0 2.8 2.3 3.3 RPC/Lev3/Lev2-3
3.1/2.2/5.9 RPC/Lev3/Lev2-3
2.2/1.6/2.8
2009 4.8 1.1 2.2 0.9 1.8 1.3 Teaching/Non 2.5/1.9
Teaching/Non 1.7/1.9 2.1 2.1 2.2 RPC/Lev3/Lev2-3
2.2/3.5/3.8 RPC/Lev3/Lev2-3
1.5/3.0/4.0
Nathan Littauer 2008 3/ 33 9.4 1/ 45 2.1 0/ 133 * 0.0
2009 1/ 28 3.5 3/ 44 ^^ 7.1 0/ 187 * 0.0
Newark Wayne 2008 NA NA 0/ 20 * 0.0 2/ 592 3.4
2009 NA NA 1/ 29 4.4 1/ 771 1.3
Niagara Falls 2008 0/ 23 * 0.0 NA NA 0/ 915 * 0.0
2009 NA NA 0/ 25 * 0.0 0/ 691 * 0.0
North Central Bronx 2008 NA NA 6/ 769 ^^ 7.8
2009 NA NA 1/ 504 2.0
North General 2008 4/ 26 14.6 NA NA 12/1462 ^^ 8.2
2009 NA NA NA NA 3/1265 2.4
North Shore 2008 22/576 3.7 2/ 410 0.5 18/ 640 3.0 5/ 640 0.8 0/1269 * 0.0 5/3521 1.4 2/4530 ** 0.4 4/3233 1.2 3/2138 1.4 2/ 487 4.1 8/2569 3.1 2/ 565 3.4
2009 19/617 ** 2.9 2/ 410 0.5 16/ 684 2.3 6/ 684 0.7 0/1002 * 0.0 8/4008 2.0 7/4176 1.7 4/3341 1.2 1/1810 0.6 0/ 385 * 0.0 2/2370 0.9 2/ 824 2.3
Northern Dutchess 2008 0/ 20 * 0.0 0/ 224 * 0.0 0/ 358 * 0.0
2009 0/ 23 * 0.0 3/ 286 1.3 0/ 389 * 0.0
Northern Westchester 2008 5/110 4.8 0/ 129 * 0.0 0/1179 * 0.0 0/ 68 * 0.0 NA NA
2009 7/143 5.1 1/ 136 0.7 0/ 884 * 0.0 1/ 52 19.2 NA NA
Noyes Memorial 2008 2/ 52 4.0 2/ 51 3.7 0/ 303 * 0.0
2009 2/ 25 8.8 0/ 28 * 0.0 2/ 192 10.4
Nyack Hospital 2008 7/125 5.1 2/ 142 1.3 6/1187 5.1 0/ 825 * 0.0
2009 7/125 5.3 2/ 148 1.3 6/ 972 ^^ 6.2 0/ 703 * 0.0
Olean General 2008 2/ 71 2.8 0/ 85 * 0.0 0/ 843 * 0.0
2009 3/ 64 4.6 1/ 69 1.3 1/ 808 1.2
Oneida Healthcare 2008 4/ 68 6.0 1/ 35 2.7 2/ 351 5.7
2009 3/ 74 4.4 0/ 22 * 0.0 0/ 347 * 0.0
Orange Regional
Goshen&Mid 2008 7/188 3.7 4/ 222 1.6 18/3762 ^^ 4.8
2009 2/167 ** 1.2 2/ 223 0.9 10/3452 2.9

Table 16. Summary of Hospital-Acquired Infection Data, New York State 2008-2009 (continued)
Color key: **Blue: significantly lower than state average ^^Red: significantly higher than state average Grey: not statistically different from state average *: Zero infections, not statistically significant NA: Fewer than 20 procedures or 50 line days reported Blank: No procedures or ICUs at hospital 127
Surgical Site Infections Central Line-Associated Blood Stream Infections Umbilical Inf.
Colon Hip Coronary Artery
Bypass Chest Coronary Artery
Bypass Donor Coronary ICU Cardiothoracic
ICU Medical ICU Medical Surgical
ICU Surgical ICU Neurosurgical
ICU Pediatric ICU Neonatal ICU Neonatal ICU
Hospital Year SSI/
procs Adj. Rate
SSI/ procs
Adj. Rate
SSI/ procs
Adj. Rate
SSI/ procs
Adj. Rate
CLABSI/CLDays Rate
CLABSI/CLDays Rate
CLABSI/CLDays Rate
CLABSI/ CLDays Rate
CLABSI/CLDays Rate
CLABSI/CLDays Rate
CLABSI/CLDays Rate
CLABSI/CLDays
Adj rate
UCABSI/ UCDays
Adj rate
State Average
2008 4.4 1.1 2.2 1.0 2.2 1.4 Teaching/Non 2.7/2.7
Teaching/Non 2.4/2.0 2.8 2.3 3.3 RPC/Lev3/Lev2-3
3.1/2.2/5.9 RPC/Lev3/Lev2-3
2.2/1.6/2.8
2009 4.8 1.1 2.2 0.9 1.8 1.3 Teaching/Non 2.5/1.9
Teaching/Non 1.7/1.9 2.1 2.1 2.2 RPC/Lev3/Lev2-3
2.2/3.5/3.8 RPC/Lev3/Lev2-3
1.5/3.0/4.0
Oswego Hospital 2008 0/ 31 * 0.0 NA NA 0/ 376 * 0.0
2009 0/ 33 * 0.0 NA NA 0/ 396 * 0.0
Our Lady of Lourdes 2008 2/126 1.5 0/ 226 * 0.0 2/1025 2.0
2009 7/125 5.1 5/ 233 1.9 1/1188 0.8
Peconic Bay Medical 2008 1/ 75 1.3 2/ 88 1.9 1/ 751 1.3
2009 1/ 46 2.1 0/ 79 * 0.0 0/ 734 * 0.0
Peninsula Hospital 2008 2/ 31 6.4 NA NA 1/1239 0.8
2009 1/ 24 3.8 NA NA 0/1232 * 0.0
Phelps Memorial 2008 1/ 68 1.6 0/ 140 * 0.0 3/ 896 3.3
2009 0/ 72 * 0.0 2/ 162 1.5 0/ 894 * 0.0
Plainview Hospital 2008 6/169 3.7 2/ 129 1.5 8/4664 1.7
2009 10/172 6.1 4/ 175 2.0 5/3370 1.5
Putnam Hospital 2008 1/ 77 1.4 0/ 201 * 0.0 2/ 585 3.4
2009 0/100 ** 0.0 1/ 218 0.6 0/ 607 * 0.0
Queens Hospital 2008 3/ 38 7.7 8/1614 ^^ 5.0 0/ 55 * 0.0 0/ 158 * 0.0
2009 0/ 38 * 0.0 4/1585 2.5 3/ 210 12.0 1/ 267 2.2
Richmond Univ 2008 3/118 2.6 1/ 66 1.2 0/1202 * 0.0 2/2542 0.8 0/1118 ** 0.0 NA NA 0/ 323 * 0.0 0/ 833 * 0.0
2009 5/ 98 5.1 6/ 83 ^^ 5.9 1/1214 0.8 1/2539 0.4 1/ 894 1.1 0/ 51 * 0.0 0/ 258 * 0.0 2/ 759 2.4
Rochester General 2008 22/340 7.0 7/ 357 2.3 3/ 660 ** 0.5 2/ 654 0.4 4/2762 1.4 10/3856 2.6 8/2590 3.1
2009 11/361 3.3 5/ 383 1.7 3/ 574 ** 0.6 2/ 572 0.5 2/1810 1.1 6/3489 1.7 1/2413 0.4
Rome Memorial 2008 4/ 60 6.9 1/ 34 2.9 0/1368 * 0.0
2009 2/ 50 3.9 0/ 34 * 0.0 0/1338 * 0.0
Roswell Park 2008 5/128 4.1 5/1576 3.2
2009 8/136 6.3 12/2130 ^^ 5.6
Samaritan- Troy 2008 6/ 91 6.8 2/ 93 1.8 0/ 888 * 0.0
2009 1/ 72 1.5 1/ 72 1.3 0/ 879 * 0.0

Table 16. Summary of Hospital-Acquired Infection Data, New York State 2008-2009 (continued)
Color key: **Blue: significantly lower than state average ^^Red: significantly higher than state average Grey: not statistically different from state average *: Zero infections, not statistically significant NA: Fewer than 20 procedures or 50 line days reported Blank: No procedures or ICUs at hospital 128
Surgical Site Infections Central Line-Associated Blood Stream Infections Umbilical Inf.
Colon Hip Coronary Artery
Bypass Chest Coronary Artery
Bypass Donor Coronary ICU Cardiothoracic
ICU Medical ICU Medical Surgical
ICU Surgical ICU Neurosurgical
ICU Pediatric ICU Neonatal ICU Neonatal ICU
Hospital Year SSI/
procs Adj. Rate
SSI/ procs
Adj. Rate
SSI/ procs
Adj. Rate
SSI/ procs
Adj. Rate
CLABSI/CLDays Rate
CLABSI/CLDays Rate
CLABSI/CLDays Rate
CLABSI/ CLDays Rate
CLABSI/CLDays Rate
CLABSI/CLDays Rate
CLABSI/CLDays Rate
CLABSI/CLDays
Adj rate
UCABSI/ UCDays
Adj rate
State Average
2008 4.4 1.1 2.2 1.0 2.2 1.4 Teaching/Non 2.7/2.7
Teaching/Non 2.4/2.0 2.8 2.3 3.3 RPC/Lev3/Lev2-3
3.1/2.2/5.9 RPC/Lev3/Lev2-3
2.2/1.6/2.8
2009 4.8 1.1 2.2 0.9 1.8 1.3 Teaching/Non 2.5/1.9
Teaching/Non 1.7/1.9 2.1 2.1 2.2 RPC/Lev3/Lev2-3
2.2/3.5/3.8 RPC/Lev3/Lev2-3
1.5/3.0/4.0
Samaritan- Watertown 2008 1/ 64 1.5 2/ 137 1.8 0/ 627 * 0.0
2009 2/ 68 2.8 0/ 124 * 0.0 2/ 808 2.5
Saratoga Hospital 2008 1/130 ** 0.8 2/ 151 1.2 1/1609 0.6
2009 2/136 1.5 3/ 157 2.1 0/1661 ** 0.0
Seton Health 2008 5/ 81 6.3 0/ 75 * 0.0 3/1092 2.7
2009 7/ 75 9.6 2/ 114 1.6 3/1230 2.4
Sisters of Charity 2008 2/109 2.0 0/ 153 * 0.0 3/1717 1.7 0/ 649 * 0.0 0/ 209 * 0.0
2009 8/103 8.5 1/ 133 1.0 3/1676 1.8 1/ 925 1.0 0/ 237 * 0.0
Sloan Kettering 2008 17/549 3.0 2/ 60 1.4 4/4551 0.9
2009 28/580 4.5 3/ 91 1.5 11/5188 2.1
Sound Shore Medical 2008 4/ 66 6.1 2/ 149 1.1 7/ 987 ^^ 7.1 NA NA NA NA
2009 6/ 67 8.9 1/ 120 0.7 1/ 963 1.0 NA NA
South Nassau Comm. 2008 12/201 5.6 3/ 244 1.0 1/2719 0.4
2009 13/149 7.9 5/ 294 1.4 11/2592 ^^ 4.2
Southampton 2008 2/ 38 5.0 0/ 46 * 0.0 3/ 745 4.0
2009 1/ 43 2.1 0/ 31 * 0.0 4/ 936 4.3
Southside 2008 5/109 4.4 5/ 146 3.1 0/2565 ** 0.0
2009 6/129 4.6 4/ 134 2.7 3/2935 1.0
St Anthony 2008 0/ 21 * 0.0 1/ 32 4.0 1/ 648 1.5
2009 1/ 23 4.7 0/ 23 * 0.0 0/ 494 * 0.0
St Barnabas 2008 2/ 47 3.9 NA NA 2/1544 1.3 2/ 247 10.9 3/ 111 ^^28.0
2009 3/ 63 4.4 NA NA 1/1533 0.7 0/ 306 * 0.0 0/ 87 * 0.0
St Catherine Siena 2008 0/ 91 ** 0.0 0/ 114 * 0.0 1/1118 0.9 1/1268 0.8
2009 10/129 7.5 1/ 98 1.0 4/1330 3.0 1/1537 0.7
St Charles Hospital 2008 2/ 37 5.8 2/ 244 1.1 1/1032 1.0
2009 NA NA 4/ 243 2.3 2/1259 1.6

Table 16. Summary of Hospital-Acquired Infection Data, New York State 2008-2009 (continued)
Color key: **Blue: significantly lower than state average ^^Red: significantly higher than state average Grey: not statistically different from state average *: Zero infections, not statistically significant NA: Fewer than 20 procedures or 50 line days reported Blank: No procedures or ICUs at hospital 129
Surgical Site Infections Central Line-Associated Blood Stream Infections Umbilical Inf.
Colon Hip Coronary Artery
Bypass Chest Coronary Artery
Bypass Donor Coronary ICU Cardiothoracic
ICU Medical ICU Medical Surgical
ICU Surgical ICU Neurosurgical
ICU Pediatric ICU Neonatal ICU Neonatal ICU
Hospital Year SSI/
procs Adj. Rate
SSI/ procs
Adj. Rate
SSI/ procs
Adj. Rate
SSI/ procs
Adj. Rate
CLABSI/CLDays Rate
CLABSI/CLDays Rate
CLABSI/CLDays Rate
CLABSI/ CLDays Rate
CLABSI/CLDays Rate
CLABSI/CLDays Rate
CLABSI/CLDays Rate
CLABSI/CLDays
Adj rate
UCABSI/ UCDays
Adj rate
State Average
2008 4.4 1.1 2.2 1.0 2.2 1.4 Teaching/Non 2.7/2.7
Teaching/Non 2.4/2.0 2.8 2.3 3.3 RPC/Lev3/Lev2-3
3.1/2.2/5.9 RPC/Lev3/Lev2-3
2.2/1.6/2.8
2009 4.8 1.1 2.2 0.9 1.8 1.3 Teaching/Non 2.5/1.9
Teaching/Non 1.7/1.9 2.1 2.1 2.2 RPC/Lev3/Lev2-3
2.2/3.5/3.8 RPC/Lev3/Lev2-3
1.5/3.0/4.0
St Elizabeth Medical 2008 7/101 6.8 0/ 149 * 0.0 1/ 277 0.4 0/ 249 * 0.0 2/2164 0.9 3/2916 1.0
2009 5/ 80 6.1 0/ 159 * 0.0 3/ 365 0.9 4/ 333 1.6 0/2185 * 0.0 3/3100 1.0
St Francis- Pough. 2008 3/ 67 4.7 1/ 152 0.7 2/1688 1.2
2009 4/ 43 9.2 2/ 175 1.6 1/1670 0.6
St Francis- Roslyn 2008 12/114 ^^10.2 1/ 58 1.3 20/1156 1.8 16/1088 1.5 3/6084 0.5 39/8088 ^^ 4.8
2009 12/117 ^^10.1 1/ 57 1.6 13/1100 ** 1.2 9/1043 0.9 6/5754 1.0 6/5281 1.1 3/2533 1.2
St James Mercy 2008 2/ 27 7.0 0/ 40 * 0.0 0/ 932 * 0.0
2009 NA NA NA NA 0/ 651 * 0.0
St Johns Episcopal 2008 1/ 23 4.0 0/ 22 * 0.0 4/1106 3.6 3/1227 2.4
2009 2/ 27 7.0 1/ 21 4.0 4/ 840 4.8 6/ 977 ^^ 6.1
St Johns Riverside 2008 5/ 68 7.0 1/ 66 1.2 5/1552 3.2
2009 8/ 64 ^^12.5 3/ 67 3.4 12/1919 ^^ 6.3
St Joseph -Bethpage 2008 1/ 87 1.1 0/ 126 * 0.0 2/2127 0.9
2009 1/ 57 1.6 2/ 123 1.8 2/1670 1.2
St Joseph Cheektow. 2008 5/ 76 6.4 1/ 140 0.7 3/1721 1.7
2009 6/ 68 8.7 1/ 144 0.7 3/1659 1.8
St Josephs- Elmira 2008 NA NA 0/ 52 * 0.0 1/ 696 1.4
2009 NA NA 0/ 61 * 0.0 0/ 520 * 0.0
St Josephs- Syracuse 2008 14/317 4.4 1/ 412 0.2 16/ 712 2.2 6/ 642 1.0 3/3081 1.0 9/5030 1.8 1/ 161 7.6 0/ 195 * 0.0
2009 12/270 4.3 2/ 438 0.5 19/ 724 2.6 4/ 626 0.7 4/2975 1.3 4/4948 0.8 1/ 208 4.6 0/ 226 * 0.0
St Josephs- Yonkers 2008 0/ 30 * 0.0 1/ 36 2.5 5/ 754 ^^ 6.6
2009 4/ 27 15.3 0/ 28 * 0.0 5/ 609 ^^ 8.2
St Lukes- Roosevelt 2008 10/128 7.8 0/ 124 * 0.0 2/1562 1.3 2/ 801 2.5 0/ 211 * 0.0 0/1163 ** 0.0 2/1000 2.1
2009 13/161 7.8 0/ 78 * 0.0 1/1450 0.7 1/1072 0.9 0/ 75 * 0.0 3/1254 2.5 2/1217 1.7
St Lukes- St Lukes 2008 16/ 96 ^^16.5 1/ 128 0.7 5/ 163 3.1 1/ 148 0.6 9/2600 3.5 2/1771 1.1 4/1155 3.5
2009 8/ 77 10.4 1/ 156 0.7 5/ 175 3.0 1/ 127 0.8 3/1960 1.5 7/2055 3.4 4/1004 4.0

Table 16. Summary of Hospital-Acquired Infection Data, New York State 2008-2009 (continued)
Color key: **Blue: significantly lower than state average ^^Red: significantly higher than state average Grey: not statistically different from state average *: Zero infections, not statistically significant NA: Fewer than 20 procedures or 50 line days reported Blank: No procedures or ICUs at hospital 130
Surgical Site Infections Central Line-Associated Blood Stream Infections Umbilical Inf.
Colon Hip Coronary Artery
Bypass Chest Coronary Artery
Bypass Donor Coronary ICU Cardiothoracic
ICU Medical ICU Medical Surgical
ICU Surgical ICU Neurosurgical
ICU Pediatric ICU Neonatal ICU Neonatal ICU
Hospital Year SSI/
procs Adj. Rate
SSI/ procs
Adj. Rate
SSI/ procs
Adj. Rate
SSI/ procs
Adj. Rate
CLABSI/CLDays Rate
CLABSI/CLDays Rate
CLABSI/CLDays Rate
CLABSI/ CLDays Rate
CLABSI/CLDays Rate
CLABSI/CLDays Rate
CLABSI/CLDays Rate
CLABSI/CLDays
Adj rate
UCABSI/ UCDays
Adj rate
State Average
2008 4.4 1.1 2.2 1.0 2.2 1.4 Teaching/Non 2.7/2.7
Teaching/Non 2.4/2.0 2.8 2.3 3.3 RPC/Lev3/Lev2-3
3.1/2.2/5.9 RPC/Lev3/Lev2-3
2.2/1.6/2.8
2009 4.8 1.1 2.2 0.9 1.8 1.3 Teaching/Non 2.5/1.9
Teaching/Non 1.7/1.9 2.1 2.1 2.2 RPC/Lev3/Lev2-3
2.2/3.5/3.8 RPC/Lev3/Lev2-3
1.5/3.0/4.0
St LukesNewburgh&Cor
2008 0/ 85 ** 0.0 3/ 86 4.1 0/ 303 * 0.0 3/1895 1.6
2009 0/ 56 * 0.0 2/ 84 2.4 1/ 169 5.9 3/1863 1.6
St Marys Amsterdam 2008 1/ 61 1.9 1/ 73 1.6 0/ 177 * 0.0
2009 2/ 53 4.5 0/ 110 * 0.0 NA NA
St Peters Hospital 2008 13/383 3.7 10/ 641 1.9 10/ 627 1.6 1/ 598 0.2 1/ 976 1.0 2/2234 0.9 5/2708 1.8 3/ 962 2.7 0/ 707 * 0.0
2009 12/377 3.6 6/ 677 1.1 5/ 531 1.0 2/ 502 0.5 3/ 915 3.3 4/2188 1.8 9/2678 3.4 2/ 453 4.5 0/ 592 * 0.0
St Vincents Manhat. 2008 7/154 4.7 3/ 136 1.6 2/ 106 1.9 6/ 99 ^^ 5.3 1/1409 0.7 3/1362 2.2 4/1865 2.1 1/1973 0.5 0/ 409 * 0.0 1/ 328 3.1 0/ 105 * 0.0
2009 3/160 2.0 7/ 136 ^^ 3.5 3/ 58 6.2 3/ 54 ^^ 5.4 0/1082 * 0.0 1/ 928 1.1 3/1570 1.9 5/1573 3.2 0/ 113 * 0.0 0/ 217 * 0.0 2/ 114 15.3
Staten Island U N&S 2008 8/214 3.5 4/ 222 1.0 8/ 361 2.1 1/ 342 0.3 1/2435 0.4 0/1801 * 0.0 3/4816 ** 0.6 1/ 361 2.5 1/ 368 2.7
2009 16/241 6.3 2/ 208 0.6 14/ 390 ^^ 4.2 3/ 376 1.1 2/2286 0.9 3/2027 1.5 1/4828 ** 0.2 2/ 234 6.9 2/ 222 8.2
Strong Memorial 2008 16/327 4.8 0/ 50 * 0.0 16/ 394 ^^ 4.2 9/ 365 ^^ 3.0 8/4621 1.7 15/2999 ^^ 5.0 20/3889 ^^ 5.1 18/2563 ^^ 7.0 9/3416 2.7 4/1807 2.3
2009 17/317 5.5 0/ 60 * 0.0 7/ 482 1.6 2/ 438 0.6 10/4444 2.3 6/3095 1.9 9/3577 2.5 7/2359 3.0 10/3904 2.5 3/2015 1.8
Syosset Hospital 2008 2/ 79 2.7 0/ 37 * 0.0 0/ 529 * 0.0
2009 2/ 88 2.8 0/ 26 * 0.0 0/ 579 * 0.0
TLC Lake Shore 2008 NA NA 0/ 52 * 0.0 1/ 138 7.2
2009 NA NA 0/ 71 * 0.0 0/ 62 * 0.0
U Health Bing/Wilson 2008 2/181 ** 1.2 4/ 211 2.0 3/ 204 1.5 2/ 187 1.3 0/2049 ** 0.0 2/2353 0.8 1/ 804 1.2 NA NA 0/ 81 * 0.0
2009 8/170 5.0 2/ 225 0.9 5/ 245 2.4 3/ 208 2.1 1/2071 0.5 0/2254 * 0.0 1/ 655 1.5 3/ 95 ^^33.9 2/ 74 ^^32.8
United Memorial 2008 2/ 32 6.4 3/ 81 3.1 1/ 470 2.1
2009 2/ 28 7.1 2/ 84 2.5 0/ 572 * 0.0
Unity Hosp Rochester 2008 4/192 2.1 2/ 426 0.6 3/3045 1.0
2009 1/144 ** 0.7 3/ 503 0.7 3/3042 1.0
Univ Hosp Brooklyn 2008 2/ 76 2.4 2/ 48 4.2 1/ 96 0.6 0/ 96 * 0.0 0/ 252 * 0.0 2/1400 1.4 4/2329 1.7 1/ 387 2.6 1/ 860 1.0 2/ 480 3.6
2009 2/ 46 4.0 0/ 58 * 0.0 1/ 78 1.0 1/ 78 0.9 0/ 370 * 0.0 2/1411 1.4 8/1987 ^^ 4.0 0/ 382 * 0.0 0/ 678 * 0.0 1/ 391 1.9
Univ Hosp SUNY
Upst. 2008 4/105 3.7 4/ 119 2.3 2/ 180 0.9 0/ 141 * 0.0 0/ 574 * 0.0 0/1718 * 0.0 12/3141 3.8 6/ 726 ^^ 8.3 13/2562 5.1 3/1493 2.0 1/ 557 1.8
2009 8/102 7.4 0/ 129 * 0.0 2/ 172 0.9 0/ 136 * 0.0 0/ 624 * 0.0 0/2159 * 0.0 4/3212 1.2 0/ 624 * 0.0 3/2593 1.2 1/1557 0.6 1/ 484 2.1

Table 16. Summary of Hospital-Acquired Infection Data, New York State 2008-2009 (continued)
Color key: **Blue: significantly lower than state average ^^Red: significantly higher than state average Grey: not statistically different from state average *: Zero infections, not statistically significant NA: Fewer than 20 procedures or 50 line days reported Blank: No procedures or ICUs at hospital 131
Surgical Site Infections Central Line-Associated Blood Stream Infections Umbilical Inf.
Colon Hip Coronary Artery
Bypass Chest Coronary Artery
Bypass Donor Coronary ICU Cardiothoracic
ICU Medical ICU Medical Surgical
ICU Surgical ICU Neurosurgical
ICU Pediatric ICU Neonatal ICU Neonatal ICU
Hospital Year SSI/
procs Adj. Rate
SSI/ procs
Adj. Rate
SSI/ procs
Adj. Rate
SSI/ procs
Adj. Rate
CLABSI/CLDays Rate
CLABSI/CLDays Rate
CLABSI/CLDays Rate
CLABSI/ CLDays Rate
CLABSI/CLDays Rate
CLABSI/CLDays Rate
CLABSI/CLDays Rate
CLABSI/CLDays
Adj rate
UCABSI/ UCDays
Adj rate
State Average
2008 4.4 1.1 2.2 1.0 2.2 1.4 Teaching/Non 2.7/2.7
Teaching/Non 2.4/2.0 2.8 2.3 3.3 RPC/Lev3/Lev2-3
3.1/2.2/5.9 RPC/Lev3/Lev2-3
2.2/1.6/2.8
2009 4.8 1.1 2.2 0.9 1.8 1.3 Teaching/Non 2.5/1.9
Teaching/Non 1.7/1.9 2.1 2.1 2.2 RPC/Lev3/Lev2-3
2.2/3.5/3.8 RPC/Lev3/Lev2-3
1.5/3.0/4.0
Univ Hosp StonyBrook
2008 4/148 2.6 2/ 193 0.7 4/ 386 1.2 0/ 337 ** 0.0 0/ 911 * 0.0 3/1731 1.7 19/2202 ^^ 8.6 8/2461 3.3 3/ 662 4.5 2/1704 1.2 2/ 771 2.9
2009 8/134 5.4 2/ 205 0.7 2/ 298 0.6 0/ 270 * 0.0 0/ 882 * 0.0 6/2075 2.9 8/2425 3.3 4/2244 1.8 1/ 859 1.2 10/1579 ^^ 6.5 0/ 913 * 0.0
Vassar Brothers 2008 5/147 3.3 0/ 90 * 0.0 2/ 311 0.6 0/ 292 ** 0.0 0/1291 * 0.0 0/1073 * 0.0 0/1911 ** 0.0 0/ 210 * 0.0 0/ 215 * 0.0
2009 1/ 87 1.1 5/ 88 ^^ 4.7 1/ 320 ** 0.3 0/ 304 ** 0.0 0/1299 * 0.0 0/1099 * 0.0 0/1740 ** 0.0 0/ 206 * 0.0 1/ 191 5.0
Westchester Medical 2008 4/102 3.7 3/ 134 1.3 11/ 510 2.3 6/ 485 1.2 2/ 717 2.8 6/2600 2.3 8/2014 4.0 9/1861 4.8 1/1138 0.9 2/1600 1.3 14/3789 3.4 2/1253 1.5
2009 9/109 7.3 1/ 128 0.5 7/ 444 1.6 4/ 433 0.8 0/ 696 * 0.0 4/2611 1.5 13/2910 4.5 6/1641 3.7 8/1399 ^^ 5.7 3/1605 1.9 10/4485 2.2 1/1589 0.6
Westchester Square 2008 1/ 69 1.4 1/ 28 1.7 2/ 825 2.4 1/ 967 1.0
2009 1/ 58 1.7 0/ 29 * 0.0 1/ 518 1.9 0/ 786 * 0.0
White Plains 2008 13/121 ^^10.9 0/ 201 * 0.0 2/2004 1.0 0/ 134 * 0.0 0/ 65 * 0.0
2009 3/122 2.6 2/ 213 0.9 3/2211 1.4 0/ 139 * 0.0 0/ 55 * 0.0
Winthrop University 2008 11/317 3.5 1/ 173 0.5 9/ 393 2.2 10/ 354 1.6 5/2219 2.3 14/3594 3.9 4/ 848 4.7 1/ 234 4.3 2/1768 1.2 0/ 617 * 0.0
2009 14/343 4.3 2/ 171 0.9 6/ 378 1.5 3/ 346 0.7 9/2302 3.9 15/4049 ^^ 3.7 4/1578 2.5 0/ 476 * 0.0 1/1933 0.5 2/ 756 2.8
Woman and Childrens 2008 0/ 40 * 0.0 2/2579 ** 0.8 18/4147 4.7 4/ 965 4.3
2009 0/ 38 * 0.0 6/3128 1.9 7/3975 1.8 2/1121 1.5
Womans Christian 2008 0/ 73 ** 0.0 0/ 110 * 0.0 3/1118 2.7
2009 3/ 66 4.9 2/ 108 1.8 2/1219 1.6
Woodhull Medical 2008 2/ 40 4.8 NA NA 12/4730 2.5 2/ 99 16.8 0/ 141 * 0.0
2009 1/ 48 1.9 NA NA 14/4135 3.4 0/ 217 * 0.0 3/ 203 15.3
Wyckoff Heights 2008 3/ 47 6.1 NA NA 21/3149 ^^ 6.7 1/ 192 6.3 0/ 125 * 0.0
2009 7/ 54 ^^12.3 1/ 24 3.0 15/2360 ^^ 6.4 0/ 209 * 0.0 0/ 167 * 0.0
Wyoming County
Comm. 2008 NA NA NA NA 0/ 138 * 0.0
2009 0/ 22 * 0.0 0/ 25 * 0.0 0/ 123 * 0.0
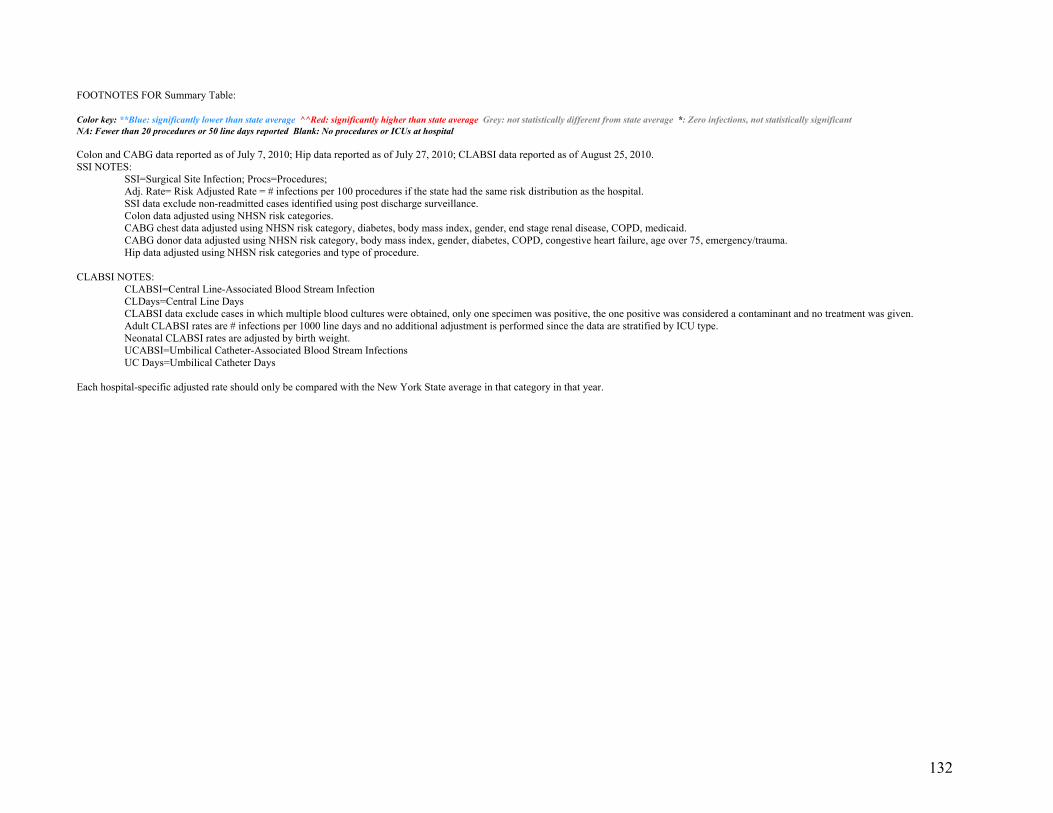
132
FOOTNOTES FOR Summary Table: Color key: **Blue: significantly lower than state average ^^Red: significantly higher than state average Grey: not statistically different from state average *: Zero infections, not statistically significant NA: Fewer than 20 procedures or 50 line days reported Blank: No procedures or ICUs at hospital Colon and CABG data reported as of July 7, 2010; Hip data reported as of July 27, 2010; CLABSI data reported as of August 25, 2010. SSI NOTES: SSI=Surgical Site Infection; Procs=Procedures; Adj. Rate= Risk Adjusted Rate = # infections per 100 procedures if the state had the same risk distribution as the hospital. SSI data exclude non-readmitted cases identified using post discharge surveillance. Colon data adjusted using NHSN risk categories. CABG chest data adjusted using NHSN risk category, diabetes, body mass index, gender, end stage renal disease, COPD, medicaid. CABG donor data adjusted using NHSN risk category, body mass index, gender, diabetes, COPD, congestive heart failure, age over 75, emergency/trauma. Hip data adjusted using NHSN risk categories and type of procedure. CLABSI NOTES: CLABSI=Central Line-Associated Blood Stream Infection
CLDays=Central Line Days CLABSI data exclude cases in which multiple blood cultures were obtained, only one specimen was positive, the one positive was considered a contaminant and no treatment was given. Adult CLABSI rates are # infections per 1000 line days and no additional adjustment is performed since the data are stratified by ICU type. Neonatal CLABSI rates are adjusted by birth weight. UCABSI=Umbilical Catheter-Associated Blood Stream Infections
UC Days=Umbilical Catheter Days Each hospital-specific adjusted rate should only be compared with the New York State average in that category in that year.

133
Public Health Law 2819 Appendix A § 2819. Hospital acquired infection reporting. 1. For the purposes of this section, "hospital acquired infection" shall mean any localized or systemic patient condition that: (a) resulted from the presence of an infectious agent or agents, or its toxin or toxins as determined by clinical examination or by laboratory testing; and * (b) was not found to be present or incubating at the time of admission unless the infection was related to a previous admission to the same setting. * NB Effective until January 1, 2008 * (b) was not found to be present or incubating at the time of admission unless the infection was related to a previous admission. * NB Effective January 1, 2008 2. (a) Each general hospital shall maintain a program capable of identifying and tracking hospital acquired infections for the purpose of public reporting under this section and quality improvement. (b) Such programs shall have the capacity to identify the following elements: the specific infectious agents or toxins and site of each infection; the clinical department or unit within the facility where the patient first became infected; and the patient's diagnoses and any relevant specific surgical, medical or diagnostic procedure performed during the current admission. (c) The department shall establish guidelines, definitions, criteria, standards and coding for hospital identification, tracking and reporting of hospital acquired infections which shall be consistent with the recommendations of recognized centers of expertise in the identification and prevention of hospital acquired infections including, but not limited to the National Health Care Safety Network of the Centers for Disease Control and Prevention or its successor. The department shall solicit and consider public comment prior to such establishment. (d) Hospitals shall be initially required to identify, track and report hospital acquired infections that occur in critical care units to include surgical wound infections and central line related bloodstream infections. * (e) Subsequent to the initial requirements identified in paragraph (d) of this subdivision the department may, from time to time, require the tracking and reporting of other types of hospital acquired infections (for example, ventilator-associated pneumonias) that occur in hospitals in consultation with technical advisors who are regionally or nationally-recognized experts in the prevention, identification and control of hospital acquired infection and the public reporting of performance data. * NB Effective until January 1, 2008 * (e) For hospital acquired infections for which the department requires tracking and reporting as permitted in this section, hospitals shall be required to report a suspected or confirmed hospital-acquired infection associated with another hospital to the originating hospital. Documentation of reporting should be maintained for a minimum of six years. * NB Effective January 1, 2008 * (f) Subsequent to the initial requirements identified in paragraph (d) of this subdivision the department may, from time to time, require the tracking and reporting of other types of hospital acquired infections (for example, ventilator-associated pneumonias) that occur in hospitals in consultation with technical advisors who are regionally or nationally-recognized experts in the prevention, identification and control of hospital acquired infection and the public reporting of performance data. * NB Effective January 1, 2008 * 3. Each hospital shall regularly report to the department the hospital infection data it has collected. The department shall establish data collection and analytical methodologies that meet accepted standards for validity and reliability. In no case shall the frequency of reporting be

134
required to be more frequently than once every six months, and reports shall be submitted not more than sixty days after the close of the reporting period. * NB Effective until January 1, 2008 * 3. Each hospital shall regularly report to the department the hospital infection data it has collected. The department shall establish data collection and analytical methodologies that meet accepted standards for validity and reliability. The frequency of reporting shall be monthly, and reports shall be submitted not more than sixty days after the close of the reporting period. * NB Effective January 1, 2008 4. The commissioner shall establish a state-wide database of all reported hospital acquired infection information for the purpose of supporting quality improvement and infection control activities in hospitals. The database shall be organized so that consumers, hospitals, healthcare professionals, purchasers and payers may compare individual hospital experience with that of other individual hospitals as well as regional and state-wide averages and, where available, national data. 5. (a) Subject to paragraph (c) of this subdivision, on or before September first [Effective April 1, 2010] of each year the commissioner shall submit a report to the governor and the legislature, which shall simultaneously be published in its entirety on the department's web site, that includes, but is not limited to, hospital acquired infection rates adjusted for the potential differences in risk factors for each reporting hospital, an analysis of trends in the prevention and control of hospital acquired infection rates in hospitals across the state, regional and, if available, national comparisons for the purpose of comparing individual hospital performance, and a narrative describing lessons for safety and quality improvement that can be learned from leadership hospitals and programs. (b) The commissioner shall consult with technical advisors who have regionally or nationally acknowledged expertise in the prevention and control of hospital acquired infection and infectious disease in order to develop the adjustment for potential differences in risk factors to be used for public reporting. (c)(i) No later than July first, two thousand six, the department shall establish a hospital acquired infection reporting system capable of receiving electronically transmitted reports from hospitals. Hospitals shall begin to submit such reports as directed by the commissioner but in no case later than January first, two thousand seven. (ii) The first year of data submission under this section shall be considered the "pilot phase" of the statewide hospital- acquired infection reporting system. The purpose of the pilot phase is to ensure, by various means, including any audit process referred to in subdivision seven of this section, the completeness and accuracy of hospital acquired infection reporting by hospitals. For data reported during the pilot phase, hospital identifiers shall be encrypted by the department in any and all public databases and reports. The department shall provide each hospital with an encryption key for that hospital only to permit access to its own performance data for internal quality improvement purposes. (iii) No later than one hundred eighty days after the conclusion of the pilot phase, the department shall issue a report to hospitals assessing the overall accuracy of the data submitted in the pilot phase and provide guidance for improving the accuracy of hospital acquired infection reporting. The department shall issue a report to the governor and the legislature assessing the overall completeness and accuracy of the data submitted by hospitals during the pilot phase and make recommendations for the improvement or modification of hospital acquired infection data reporting based on the pilot phase as well as share lessons learned in prevention of hospital acquired infections. No hospital identifiable data shall be included in the pilot phase report, but aggregate or otherwise de-identified data may be included.

135
(iv) After the pilot phase is completed, all data submitted under this section and compiled in the statewide hospital acquired infection database established herein and all public reports derived therefrom shall include hospital identifiers. 6. Subject to subdivision five of this section, a summary table, in a format designed to be easily understood by lay consumers, that includes individual facility hospital acquired infection rates adjusted for potential differences in risk factors and comparisons with regional and/or state averages shall be developed and posted on the department's web site. The commissioner shall consult with consumer and patient advocates and representatives of reporting facilities for the purpose of ensuring that such summary table report format is easily understandable by the public, and clearly and accurately portrays comparative hospital performance in the prevention and control of hospital acquired infections. 7. To assure the accuracy of the self-reported hospital acquired infection data and to assure that public reporting fairly reflects what actually is occurring in each hospital, the department shall develop and implement an audit process. 8. For the purpose of ensuring that hospitals have the resources needed for ongoing staff education and training in hospital acquired infection prevention and control, the department may make such grants to hospitals within amounts appropriated therefor. 9. Individual patient identifying information reported to the department under this section shall be subject to paragraph (j) of subdivision one of section two hundred six of this chapter. Regulations under this section shall include standards to assure the protection of patient privacy in data collected and released under this section and standards for the publication and release of data reported under this section.


![Hospital Acquired Infections, Sources, Route of …...hospital acquired infections worldwide is Enterococci [17]. Three to seven percent of hospital-acquired bacterial infections are](https://static.fdocuments.us/doc/165x107/5e8d2da3c3edfd174827a4ae/hospital-acquired-infections-sources-route-of-hospital-acquired-infections.jpg)