HORNER JUNIOR HIGH SCHOOL - DTS Morris, Ed.D. ... Horner has an outstanding activities program to...
12
2014-15 School Accountability Report Card for HORNER JUNIOR HIGH SCHOOL Page 1 of 12 HORNER JUNIOR HIGH SCHOOL 41365 Chapel Way • Fremont, CA 94538 • (510) 656-4000 • Grades 7-8 Jana Holmes, Principal [email protected] 2014-15 School Accountability Report Card Published During the 2015-16 School Year Fremont Unified School District 4210 Technology Drive Fremont, CA 94538 (510) 657-2350 www.fremont.k12.ca.us District Governing Board Desrie Campbell Ann Crosbie Larry Sweeney Yang Shao Michele Berke District Administration James Morris, Ed.D. Superintendent Raul A. Parungao Associate Superintendent Kim Wallace, Ed.D. Assistant Superintendent, Instruction Raul M. Zamora, Ed.D. Assistant Superintendent, Human Resources ---- ---- School Description School Vision: Horner Junior High’s vision is to provide an outstanding and well-rounded education to all of its students. This will be done by ensuring equitable outcomes, a safe campus, highly qualified professional teachers and staff, and opportunities for social growth. Mission Statement: It is Horner’s mission to provide a safe, purposeful, and caring environment conducive to learning where all students: 1. Acquire knowledge for personal growth and confidence. 2. Develop effective study habits and successful social skills. 3. Learn how to manage personal property, develop self-discipline, and make proper decisions. 4. Increase understanding of personal differences and treat all others with respect. 5. Expand on tools for successfully managing different teacher requirements and classroom environments. Description of the School Community: Horner Junior High School is one of five Junior Highs in the Fremont Unified School District. The student population is comprised of approximately over 1000 7th and 8th graders. The school has a rich history that spans over fifty years. Horner is equipped with modern science labs and a well-maintained library. The school curriculum includes core curriculum courses in English, Mathematics, Science, Social Studies. All students have a Physical Education course along with electives in the following disciplines: Spanish, Chorus, Band, Leadership, Journalism, Drama, Technology, and Arts and Crafts. Honors classes are provided for English and Science. An acceleration pathway is available for Math. Horner has an outstanding activities program to help develop social skills. The ethnic diversity among students is integrated into all aspects of school life. The balance between academics, exploration, social opportunities, and athletics, together with a firm, fair behavior policy, results in an orderly, safe school. As the new Principal at Horner Junior High School, I am delighted to be a part of this community and proud of the school's many accomplishments and the dedication of our students, teachers and parents. Horner Junior High School was recognized as a Gold Ribbon School in the Spring of 2015. This is a reflection of the school and community commitment to the students. Mrs. Jana Holmes
Transcript of HORNER JUNIOR HIGH SCHOOL - DTS Morris, Ed.D. ... Horner has an outstanding activities program to...

2014-15 School Accountability Report Card for HORNER JUNIOR HIGH SCHOOL Page 1 of 12
HORNER JUNIOR HIGH SCHOOL
41365 Chapel Way • Fremont, CA 94538 • (510) 656-4000 • Grades 7-8 Jana Holmes, Principal
2014-15 School Accountability Report Card
Published During the 2015-16 School Year
Fremont Unified School District 4210 Technology Drive
Fremont, CA 94538 (510) 657-2350
www.fremont.k12.ca.us
District Governing Board
Desrie Campbell
Ann Crosbie
Larry Sweeney
Yang Shao
Michele Berke
District Administration
James Morris, Ed.D. Superintendent
Raul A. Parungao Associate Superintendent
Kim Wallace, Ed.D. Assistant Superintendent, Instruction
Raul M. Zamora, Ed.D. Assistant Superintendent, Human
Resources
---- ----
School Description School Vision: Horner Junior High’s vision is to provide an outstanding and well-rounded education to all of its students. This will be done by ensuring equitable outcomes, a safe campus, highly qualified professional teachers and staff, and opportunities for social growth. Mission Statement: It is Horner’s mission to provide a safe, purposeful, and caring environment conducive to learning where all students: 1. Acquire knowledge for personal growth and confidence. 2. Develop effective study habits and successful social skills. 3. Learn how to manage personal property, develop self-discipline, and make proper decisions. 4. Increase understanding of personal differences and treat all others with respect. 5. Expand on tools for successfully managing different teacher requirements and classroom
environments. Description of the School Community: Horner Junior High School is one of five Junior Highs in the Fremont Unified School District. The student population is comprised of approximately over 1000 7th and 8th graders. The school has a rich history that spans over fifty years. Horner is equipped with modern science labs and a well-maintained library. The school curriculum includes core curriculum courses in English, Mathematics, Science, Social Studies. All students have a Physical Education course along with electives in the following disciplines: Spanish, Chorus, Band, Leadership, Journalism, Drama, Technology, and Arts and Crafts. Honors classes are provided for English and Science. An acceleration pathway is available for Math. Horner has an outstanding activities program to help develop social skills. The ethnic diversity among students is integrated into all aspects of school life. The balance between academics, exploration, social opportunities, and athletics, together with a firm, fair behavior policy, results in an orderly, safe school. As the new Principal at Horner Junior High School, I am delighted to be a part of this community and proud of the school's many accomplishments and the dedication of our students, teachers and parents. Horner Junior High School was recognized as a Gold Ribbon School in the Spring of 2015. This is a reflection of the school and community commitment to the students. Mrs. Jana Holmes

2014-15 School Accountability Report Card for HORNER JUNIOR HIGH SCHOOL Page 2 of 12
About the SARC By February 1 of each year, every school in California is required by state law to publish a School Accountability Report Card (SARC). The SARC contains information about the condition and performance of each California public school. Under the Local Control Funding Formula (LCFF) all local educational agencies (LEAs) are required to prepare a Local Control Accountability Plan (LCAP), which describes how they intend to meet annual school-specific goals for all pupils, with specific activities to address state and local priorities. Additionally, data reported in an LCAP is to be consistent with data reported in the SARC. • For more information about SARC requirements, see the California
Department of Education (CDE) SARC Web page at http://www.cde.ca.gov/ta/ac/sa/.
• For more information about the LCFF or LCAP, see the CDE LCFF Web page at http://www.cde.ca.gov/fg/aa/lc/.
• For additional information about the school, parents/guardians and community members should contact the school at (510) 656-4000 or the district office.
2014-15 Student Enrollment by Grade Level
Grade Level Number of Students
Grade 7 531
Grade 8 499
Total Enrollment 1,030
2014-15 Student Enrollment by Group
Group Percent of Total Enrollment
Black or African American 2.3
American Indian or Alaska Native 0.3
Asian 68.4
Filipino 4.7
Hispanic or Latino 10.6
Native Hawaiian or Pacific Islander 0.5
White 11
Two or More Races 2.2
Socioeconomically Disadvantaged 15.8
English Learners 8.8
Students with Disabilities 8.6
Foster Youth 0.2
A. Conditions of Learning State Priority: Basic The SARC provides the following information relevant to the Basic State Priority (Priority 1): • Degree to which teachers are appropriately assigned and fully
credentialed in the subject area and for the pupils they are teaching; • Pupils have access to standards-aligned instructional materials; and • School facilities are maintained in good repair.
Teacher Credentials
HORNER JUNIOR HIGH SCHOOL 13-14 14-15 15-16
With Full Credential 45 45 50.5
Without Full Credential 0 0 0
Teaching Outside Subject Area of Competence 0 0 0
Fremont Unified School District 13-14 14-15 15-16
With Full Credential ♦ ♦ 1590.82
Without Full Credential ♦ ♦ 6
Teaching Outside Subject Area of Competence ♦ ♦ 0
Teacher Misassignments and Vacant Teacher Positions at this School
HORNER JUNIOR HIGH SCHOOL 13-14 14-15 15-16
Teachers of English Learners 0 0 0
Total Teacher Misassignments 0 0 0
Vacant Teacher Positions 0 1 0
* “Misassignments” refers to the number of positions filled by teachers who lack legal authorization to teach that grade level, subject area, student group, etc. Total Teacher Misassignments includes the number of Misassignments of Teachers of English Learners.
Core Academic Classes Taught by Highly Qualified Teachers
2014-15 Percent of Classes In Core Academic Subjects Core Academic Classes Taught by Highly Qualified Teachers
Location of Classes Taught by Highly
Qualified Teachers Not Taught by Highly
Qualified Teachers
This School 100.0 0.0
Districtwide
All Schools 99.5 0.5
High-Poverty Schools 99.4 0.6
Low-Poverty Schools 99.5 0.5
* High-poverty schools are defined as those schools with student eligibility of approximately 40 percent or more in the free and reduced price meals program. Low-poverty schools are those with student eligibility of approximately 39 percent or less in the free and reduced price meals program.

2014-15 School Accountability Report Card for HORNER JUNIOR HIGH SCHOOL Page 3 of 12
Quality, Currency, Availability of Textbooks and Instructional Materials (School Year 2015-16) The main fact about textbooks that the Williams legislation calls for describes whether schools have enough books in core classes for all students. The law also asks districts to reveal whether those books are presenting what the California Content Standards call for. All of our textbooks are the most recently approved by the State Board of Education or our Local Governing Agency.
Textbooks and Instructional Materials
Year and month in which data were collected: 10/27/2015
Core Curriculum Area Textbooks and Instructional Materials/Year of Adoption
Reading/Language Arts Timeless Voices, Timeless Themes, Prentice Hall Adopted 2003
The textbooks listed are from most recent adoption: Yes
Percent of students lacking their own assigned textbook: 0%
Mathematics SpringBoard Course 2, College Board Adopted 2014 SpringBoard Course 3, College Board Adopted 2014 SpringBoard Algebra 1, College Board Adopted 2014 Transition to Algebra, Heinemann Adopted 2015
The textbooks listed are from most recent adoption: Yes
Percent of students lacking their own assigned textbook: 0%
Science Physical Science: Concepts in Action, Pearson Adopted 2008 Focus on Life Science, Pearson Adopted 2007 Focus on Physical Science, Pearson Adopted 2007
The textbooks listed are from most recent adoption: Yes
Percent of students lacking their own assigned textbook: 0%
History-Social Science US: Independence to 1914, Holt Adopted 2006 WH: Medieval to Early Modern Times, Holt Adopted 2006
The textbooks listed are from most recent adoption: Yes
Percent of students lacking their own assigned textbook: 0%

2014-15 School Accountability Report Card for HORNER JUNIOR HIGH SCHOOL Page 4 of 12
School Facility Conditions and Planned Improvements (Most Recent Year) Horner Junior High opened in 1958 with an administrative office/classrooms building and a library building. In 1959, we added two classroom wings and a multiuse room. In 1964, a locker room building and classroom wing were added, and in 1990 and 1992 two modular classrooms were added. Three modular classrooms and a restroom modular were added in 1996, one modular was added in both 1999 and 2001, and three science lab modular classrooms were added in 2003. In 2005, our new community-use gymnasium was completed and provides additional PE classroom space as well as courts for our basketball and volleyball teams. The primary buildings at Horner Junior High measure 72,413 square feet, while the auxiliary buildings measure 1,424 square feet. In the fall of 2007, there was a new covered area with tables added at which students can eat lunch. The new structure is by the portable classrooms. Restrooms were remodeled to become Americans with Disabilities Act (ADA) compliant. During the summer of 2008, the school had a new walkway installed in front of the school. The school has been allocated 32 hours of daily custodial time, and the services of district maintenance and gardening crews help ensure that the school is clean and maintained. The custodial time allowance is based on a formula that factors in the size of the school, the number of students, and the number of carpeted rooms. Fremont USD maintenance staff works very hard to ensure that repairs necessary to keep the school in good repair and working order are completed in a timely manner. District maintenance staff uses a work order priority process to ensure that efficient service and emergency repairs are given the highest priority. To determine the condition of our facilities, our district sent experts from our facilities team to perform an inspection using a survey called the Facilities Inspection Tool, which is issued by the Office of Public School Construction. Based on that survey, we’ve answered the questions you see on this report. Please note that the information reflects the condition of our buildings as of the date of the report. Since that time, those conditions may have changed.
School Facility Good Repair Status (Most Recent Year) Year and month in which data were collected: 11/10/2015
System Inspected Repair Status Repair Needed and
Action Taken or Planned Good Fair Poor
Systems: Gas Leaks, Mechanical/HVAC, Sewer
X Main hallway rooms 1 - 11: Rooms 2 3 ,6, 9 and 11 all have HVAC issues, T-stats not working properly. Numerous dents/cracks on floor. Room 9 several outlets not working. Front of roof top all around are peeling and are in bad shape. Room 9 sink has small leak. Rooms 13-19 & weight room: Rooms 13, 16, 17 have several lights out. Room 18 has issue with T-stat. Room 16 has cracked diffusers.
Interior: Interior Surfaces
X Boys & Girls locker room: There are several dings & dents on walls in both boys and girls locker rooms. Front roof top is damaged. Kitchen GYM & Multi use: Multi-use room has several lights out, several damaged/cracked diffusers, 1 missing diffuser. Has several missing air register/grills on ceiling, cracked paint throughout walls also front of roof has chipped paint, damaged wood.
Cleanliness: Overall Cleanliness, Pest/ Vermin Infestation
X Kitchen GYM & Multi use: Multi-use room has several lights out, several damaged/cracked diffusers, 1 missing diffuser. Has several missing air register/grills on ceiling, cracked paint throughout walls also front of roof has chipped paint, damaged wood.

2014-15 School Accountability Report Card for HORNER JUNIOR HIGH SCHOOL Page 5 of 12
School Facility Good Repair Status (Most Recent Year) Year and month in which data were collected: 11/10/2015
System Inspected Repair Status Repair Needed and
Action Taken or Planned Good Fair Poor
Electrical: Electrical
X All Portables: Restrooms have lots of rust on ceiling, 4 damaged ceiling tiles in both restrooms, Room TP5 speaker does not work. Kitchen GYM & Multi use: Multi-use room has several lights out, several damaged/cracked diffusers, 1 missing diffuser. Has several missing air register/grills on ceiling, cracked paint throughout walls also front of roof has chipped paint, damaged wood. Main hallway rooms 1 - 11: Rooms 2 3 ,6, 9 and 11 all have HVAC issues, T-stats not working properly. Numerous dents/cracks on floor. Room 9 several outlets not working. Front of roof top all around are peeling and are in bad shape. Room 9 sink has small leak. Main Office, Library: Several lights out in office. Crack in window in Vice Principal's office. Front roof peeling. Music Room: Light fixture in teacher's office is completely out, needs ballast replaced. Rooms 13-19 & weight room: Rooms 13, 16, 17 have several lights out. Room 18 has issue with T-stat. Room 16 has cracked diffusers.
Restrooms/Fountains: Restrooms, Sinks/ Fountains
X All Portables: Restrooms have lots of rust on ceiling, 4 damaged ceiling tiles in both restrooms, Room TP5 speaker does not work. Main hallway rooms 1 - 11: Rooms 2 3 ,6, 9 and 11 all have HVAC issues, T-stats not working properly. Numerous dents/cracks on floor. Room 9 several outlets not working. Front of roof top all around are peeling and are in bad shape. Room 9 sink has small leak.
Safety: Fire Safety, Hazardous Materials
X

2014-15 School Accountability Report Card for HORNER JUNIOR HIGH SCHOOL Page 6 of 12
School Facility Good Repair Status (Most Recent Year) Year and month in which data were collected: 11/10/2015
System Inspected Repair Status Repair Needed and
Action Taken or Planned Good Fair Poor
Structural: Structural Damage, Roofs
X 20 Wing, courtyard: Front of roofs are severely peeling & chunks of wood missing. Cracked concrete by sewer drain. Boys & Girls locker room: There are several dings & dents on walls in both boys and girls locker rooms. Front roof top is damaged. Kitchen GYM & Multi use: Multi-use room has several lights out, several damaged/cracked diffusers, 1 missing diffuser. Has several missing air register/grills on ceiling, cracked paint throughout walls also front of roof has chipped paint, damaged wood. Main hallway rooms 1 - 11: Rooms 2 3 ,6, 9 and 11 all have HVAC issues, T-stats not working properly. Numerous dents/cracks on floor. Room 9 several outlets not working. Front of roof top all around are peeling and are in bad shape. Room 9 sink has small leak. Main Office, Library: Several lights out in office. Crack in window in Vice Principal's office. Front roof peeling. Music Room: Light fixture in teacher's office is completely out, needs ballast replaced. Outside lunch tables, courtyard basketball court: Roof top throughout school needs repair, the front of the roof top, it is peeling & breaking. Rooms 13-19 & weight room: Rooms 13, 16, 17 have several lights out. Room 18 has issue with T-stat. Room 16 has cracked diffusers.
External: Playground/School Grounds, Windows/ Doors/Gates/Fences
X 20 Wing, courtyard: Front of roofs are severely peeling & chunks of wood missing. Cracked concrete by sewer drain. Main Office, Library: Several lights out in office. Crack in window in Vice Principal's office. Front roof peeling.
Overall Rating Exemplary Good Fair Poor
---------- X

2014-15 School Accountability Report Card for HORNER JUNIOR HIGH SCHOOL Page 7 of 12
B. Pupil Outcomes
State Priority: Pupil Achievement The SARC provides the following information relevant to the State priority: Pupil Achievement (Priority 4): • Statewide assessments (i.e., California Assessment of Student
Performance and Progress [CAASPP], Science California Standards Tests); and
• The percentage of pupils who have successfully completed courses that satisfy the requirements for entrance to the University of California and the California State University, or career technical education sequences or programs of study
2014-15 CAASPP Results for All Students
Subject
Percent of Students Meeting or Exceeding the State Standards (grades 3-8 and 11)
School District State
ELA 78 71 44
Math 75 69 33
* Percentages are not calculated when the number of students tested is ten or less, either because the number of students in this category is too small for statistical accuracy or to protect student privacy.
CAASPP Results for All Students - Three-Year Comparison
Subject
Percent of Students Scoring at Proficient or Advanced (meeting or exceeding the state standards)
School District State
12-13 13-14 14-15 12-13 13-14 14-15 12-13 13-14 14-15
Science 86 86 89 79 81 80 59 60 56
* Results are for grades 5, 8, and 10. Scores are not shown when the number of students tested is ten or less, either because the number of students in this category is too small for statistical accuracy or to protect student privacy.
Grade Level
2014-15 Percent of Students Meeting Fitness Standards
4 of 6 5 of 6 6 of 6
---7--- 19.30 19.90 42.80
* Percentages are not calculated when the number of students tested is ten or less, either because the number of students in this category is too small for statistical accuracy or to protect student privacy.
2014-15 CAASPP Results by Student Group
Group
Percent of Students Scoring at Proficient or Advanced
Science (grades 5, 8, and 10)
All Students in the LEA 80
All Student at the School 89
Male 89
Female 89
Black or African American --
American Indian or Alaska Native --
Asian 93
Filipino 72
Hispanic or Latino 72
Native Hawaiian or Pacific Islander --
White 83
Two or More Races 90
Socioeconomically Disadvantaged --
English Learners 58
Students with Disabilities 70
Students Receiving Migrant Education Services
--
Foster Youth --
* Scores are not shown when the number of students tested is ten or less, either because the number of students in this category is too small for statistical accuracy or to protect student privacy.
School Year 2014-15 CAASPP Assessment Results - English Language Arts (ELA) Disaggregated by Student Groups, Grades Three through Eight and Eleven
Student Group Grade
Number of Students* Percent of Students
Enrolled Tested Tested** Standard Not
Met Standard
Nearly Met Standard
Met Standard Exceeded
All Students 7 531 523 98.5 9 12 32 46
8 499 476 95.4 9 12 33 45
Male 7 264 258 48.6 12 14 34 39
8 249 230 46.1 10 13 38 37
Female 7 267 265 49.9 5 11 31 52
8 250 246 49.3 8 10 29 52
Black or African American 7 12 10 1.9 -- -- -- --
8 12 9 1.8 -- -- -- --
American Indian or Alaska Native 7 2 3 0.6 -- -- -- --
8 1 1 0.2 -- -- -- --

2014-15 School Accountability Report Card for HORNER JUNIOR HIGH SCHOOL Page 8 of 12
School Year 2014-15 CAASPP Assessment Results - English Language Arts (ELA) Disaggregated by Student Groups, Grades Three through Eight and Eleven
Student Group Grade
Number of Students* Percent of Students
Enrolled Tested Tested** Standard Not
Met Standard
Nearly Met Standard
Met Standard Exceeded
Asian 7 369 365 68.7 4 9 28 58
8 340 329 65.9 4 7 34 55
Filipino 7 20 23 4.3 13 35 39 13
8 24 24 4.8 13 21 38 25
Hispanic or Latino 7 55 48 9.0 27 17 46 10
8 54 46 9.2 22 35 39 4
Native Hawaiian or Pacific Islander 7 1 1 0.2 -- -- -- --
8 4 4 0.8 -- -- -- --
White 7 61 61 11.5 16 18 44 21
8 52 51 10.2 24 12 22 39
Two or More Races 7 11 12 2.3 17 25 17 42
8 12 12 2.4 8 17 50 25
Socioeconomically Disadvantaged 7 82 81 15.3 27 17 42 14
8 75 76 15.2 26 24 36 14
English Learners 7 48 43 8.1 47 23 23 2
8 43 38 7.6 42 24 29 3
Students with Disabilities 7 50 38 7.2 58 29 11 3
8 39 27 5.4 81 15 4 0
Students Receiving Migrant Education Services
7 1 0.2 -- -- -- --
8 1 0.2 -- -- -- --
Foster Youth 7 -- -- -- -- -- --
8 -- -- -- -- -- --
* Because enrollment numbers are provided in the fall and testing occurs in the spring, data will fluctuate. ** The percentage reported represents the percent of all enrolled students tested, not the percent of the subgroup tested. Double dashes (--) appear in the table when the number of students is ten or less, either because the number of students in this category is too small for statistical accuracy or to protect student privacy. The number of students tested includes students that did not receive a score; however, the number of students tested is not the number that was used to calculate the achievement level percentages. The achievement level percentages are calculated using students with scores.
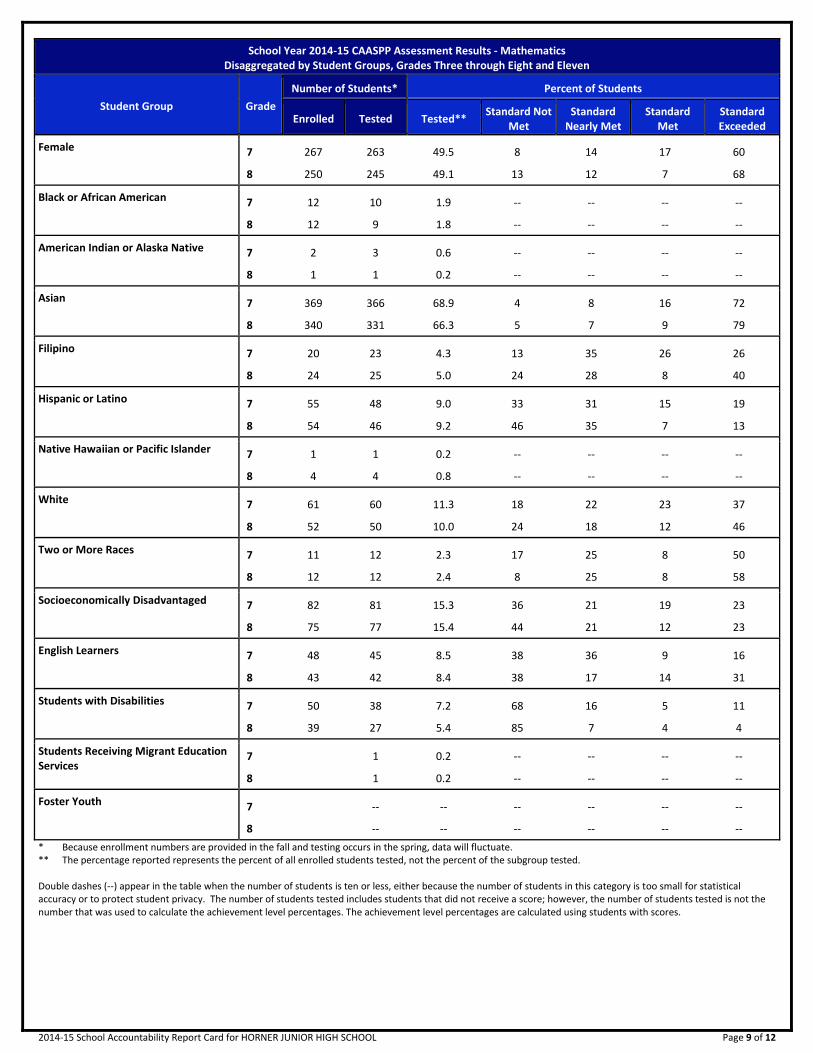
School Year 2014-15 CAASPP Assessment Results - Mathematics Disaggregated by Student Groups, Grades Three through Eight and Eleven
Student Group Grade
Number of Students* Percent of Students
Enrolled Tested Tested** Standard Not
Met Standard
Nearly Met Standard
Met Standard Exceeded
All Students 7 531 523 98.5 10 14 17 59
8 499 478 95.8 13 13 9 65
Male 7 264 260 49.0 12 13 17 58
8 249 233 46.7 13 13 11 63
2014-15 School Accountability Report Card for HORNER JUNIOR HIGH SCHOOL Page 9 of 12
School Year 2014-15 CAASPP Assessment Results - Mathematics Disaggregated by Student Groups, Grades Three through Eight and Eleven
Student Group Grade
Number of Students* Percent of Students
Enrolled Tested Tested** Standard Not
Met Standard
Nearly Met Standard
Met Standard Exceeded
Female 7 267 263 49.5 8 14 17 60
8 250 245 49.1 13 12 7 68
Black or African American 7 12 10 1.9 -- -- -- --
8 12 9 1.8 -- -- -- --
American Indian or Alaska Native 7 2 3 0.6 -- -- -- --
8 1 1 0.2 -- -- -- --
Asian 7 369 366 68.9 4 8 16 72
8 340 331 66.3 5 7 9 79
Filipino 7 20 23 4.3 13 35 26 26
8 24 25 5.0 24 28 8 40
Hispanic or Latino 7 55 48 9.0 33 31 15 19
8 54 46 9.2 46 35 7 13
Native Hawaiian or Pacific Islander 7 1 1 0.2 -- -- -- --
8 4 4 0.8 -- -- -- --
White 7 61 60 11.3 18 22 23 37
8 52 50 10.0 24 18 12 46
Two or More Races 7 11 12 2.3 17 25 8 50
8 12 12 2.4 8 25 8 58
Socioeconomically Disadvantaged 7 82 81 15.3 36 21 19 23
8 75 77 15.4 44 21 12 23
English Learners 7 48 45 8.5 38 36 9 16
8 43 42 8.4 38 17 14 31
Students with Disabilities 7 50 38 7.2 68 16 5 11
8 39 27 5.4 85 7 4 4
Students Receiving Migrant Education Services
7 1 0.2 -- -- -- --
8 1 0.2 -- -- -- --
Foster Youth 7 -- -- -- -- -- --
8 -- -- -- -- -- --
* Because enrollment numbers are provided in the fall and testing occurs in the spring, data will fluctuate. ** The percentage reported represents the percent of all enrolled students tested, not the percent of the subgroup tested. Double dashes (--) appear in the table when the number of students is ten or less, either because the number of students in this category is too small for statistical accuracy or to protect student privacy. The number of students tested includes students that did not receive a score; however, the number of students tested is not the number that was used to calculate the achievement level percentages. The achievement level percentages are calculated using students with scores.

2014-15 School Accountability Report Card for HORNER JUNIOR HIGH SCHOOL Page 10 of 12
C. Engagement
State Priority: Parental Involvement The SARC provides the following information relevant to the Parental Involvement State Priority (Priority 3): • Efforts the school district makes to seek parent input in making decisions for the school district and each schoolsite. Opportunities for Parental Involvement We have many ways for parents to participate in the life of our school, and we depend on parents to keep our programs running smoothly. Parents join our School Site Council (SSC), which works with administration, teachers, and staff to monitor academic progress and progress towards school goals. Parents of English Learners are vital to our English Language Advisory Committee (ELAC) and to our outreach efforts on behalf of new families. Our PTSA works with teachers to hold Back-to-School Night in the fall and Open House in the spring. We expect all parents to attend these events. Parents organize the socials, 8th grade field trip, and promotion party. We are continuously recruiting new volunteers and parental assistance to improve the junior high experience for our students. We encourage parent involvement at school. Parents are invited to visit Horner as part of the incoming 7th grade orientation, attend with students on Maze Day, follow their students’ schedules on Back-to-School Night, and see examples of students’ work at our Open House. We encourage parents to stay connected through FUSD's online School Loop system. For information about where you can participate or help, parents or guardians may contact the administrators, counselors, and staff by calling Horner Junior High School at (510) 656-4000.
State Priority: School Climate The SARC provides the following information relevant to the School Climate State Priority (Priority 6): • Pupil suspension rates, pupil expulsion rates; and other local measures on the sense of safety. School Safety Plan Our supervision needs are divided into five areas. These areas are monitored by a campus supervisor and other staff members before and after school and during lunch. The safety plan is reviewed with staff at the start of every school year. All components are discussed and teachers regularly review the rules with students for safe, responsible behavior in school and on the grounds. We have a closed campus. Visitors must enter the school through the main door and sign in at the office . Students are not allowed off campus during the school day. We revise our school safety plan annually; it was last revised October 2015. The plan includes procedures for emergencies, exit routes, handling chemicals and hazardous materials, and inventories of emergency supplies. Drills are held on a regular basis; fire drills are held four times a year and disaster drills are held twice a year. This school has a fire alarm system to protect the facility. The PTSA updates disaster supply needs and works with the staff on the school disaster plan. The Horner Site Safety Committee meets four times a year to review and revise the school safety plan. This plan is available upon request.
Suspensions and Expulsions
School 2012-13 2013-14 2014-15
Suspensions Rate 2.85 6.37 4.21
Expulsions Rate 0.00 0.18 0.09
District 2012-13 2013-14 2014-15
Suspensions Rate 2.41 2.92 1.98
Expulsions Rate 0.06 0.04 0.03
State 2012-13 2013-14 2014-15
Suspensions Rate 5.07 4.36 3.80
Expulsions Rate 0.13 0.10 0.09

2014-15 School Accountability Report Card for HORNER JUNIOR HIGH SCHOOL Page 11 of 12
D. Other SARC Information
The information in this section is required to be in the SARC but is not included in the state priorities for LCFF.
2014-15 Adequate Yearly Progress Overall and by Criteria
AYP Criteria School District State
English Language Arts
Met Participation Rate Yes Yes Yes
Met Percent Proficient N/A N/A N/A
Mathematics
Met Participation Rate Yes Yes Yes
Met Percent Proficient N/A N/A N/A
Overall
Made AYP Overall Yes Yes Yes
Met Attendance Rate Yes Yes Yes
Met Graduation Rate N/A Yes Yes
2015-16 Federal Intervention Program
Indicator School District
Program Improvement Status In PI
First Year of Program Improvement 2011-2012
Year in Program Improvement Year 3
Number of Schools Currently in Program Improvement 4
Percent of Schools Currently in Program Improvement 80.0
Average Class Size and Class Size Distribution (Secondary)
Average Class Size Number of Classrooms*
1-22 23-32 33+
Subject 2012-13 2013-14 2014-15 2012-13 2013-14 2014-15 2012-13 2013-14 2014-15 2012-13 2013-14 2014-15
English 27 29 25 10 7 13 16 14 25 15 23 10
Math--- 27 29 14 6 7 11 21 18 12 16
Science
30 32 29 3 3 5 13 6 14 17 26 16
SS----- 31 31 28 3 3 6 10 12 17 19 20 13
* Number of classes indicates how many classrooms fall into each size category (a range of total students per classroom). At the secondary school level, this information is reported by subject area rather than grade level.
Academic Counselors and Other Support Staff at this School
Number of Full-Time Equivalent (FTE)
Academic Counselor------- 2.5
Counselor (Social/Behavioral or Career Development) 0
Library Media Teacher (Librarian) 0
Library Media Services Staff (Paraprofessional) 1.0
Psychologist------- 0.6
Social Worker------- 0
Nurse------- .33
Speech/Language/Hearing Specialist 0.6
Resource Specialist------- 2.0
Other------- 0
Average Number of Students per Staff Member
Academic Counselor------- 413 * One Full Time Equivalent (FTE) equals one staff member working full time;
one FTE could also represent two staff members who each work 50 percent of full time.
Professional Development provided for Teachers Teachers take some time each year to improve their teaching skills and to extend their knowledge of the subjects they teach. Below is the amount of time we set aside for the past three years for their continuing education and professional development: 2012-2013: 3 days 2013-2014: 3 days 2014-2015: 3 days Three days are set aside each year, but due to budget cuts and related negotiations these days are sometimes reduced.

2014-15 School Accountability Report Card for HORNER JUNIOR HIGH SCHOOL Page 12 of 12
FY 2013-14 Teacher and Administrative Salaries
Category District Amount
State Average for Districts In Same
Category
Beginning Teacher Salary $55,963 $43,165
Mid-Range Teacher Salary $77,027 $68,574
Highest Teacher Salary $101,924 $89,146
Average Principal Salary (ES) $128,378 $111,129
Average Principal Salary (MS) $136,606 $116,569
Average Principal Salary (HS) $147,877 $127,448
Superintendent Salary $241,997 $234,382
Percent of District Budget
Teacher Salaries 48% 38%
Administrative Salaries 5% 5% * For detailed information on salaries, see the CDE Certificated Salaries &
Benefits webpage at www.cde.ca.gov/ds/fd/cs/.
FY 2013-14 Expenditures Per Pupil and School Site Teacher Salaries
Level Expenditures Per Pupil Average
Teacher Salary Total Restricted Unrestricted
School Site-------
$5,750 $805 $4,945 $78,162
District-------
♦ ♦ $5,887 $78,936
State------- ♦ ♦ $5,348 $72,971
Percent Difference: School Site/District -16.0 -1.0
Percent Difference: School Site/ State -7.5 7.1
* Cells with ♦ do not require data.
Types of Services Funded
Categorical Funding for Supplemental Services:
• Federal Title I funds support eligible schools. The purpose of this funding is to ensure all children have a fair and significant opportunity to obtain a high-quality education, meeting the challenging state standards.
• Federal Title III funds are used to support Immigrant and English Learners at all schools, kindergarten through grade twelve. Examples of supplemental services include: before- and after-school intervention programs, summer categorical intervention programs, instructional assistants, supplemental instructional materials, professional development for staff, and parent involvement activities.
DataQuest DataQuest is an online data tool located on the CDE DataQuest Web page at http://dq.cde.ca.gov/dataquest/ that contains additional information about this school and comparisons of the school to the district, the county, and the state. Specifically, DataQuest is a dynamic system that provides reports for accountability (e.g., test data, enrollment, high school graduates, dropouts, course enrollments, staffing, and data regarding English learners.
Internet Access Internet access is available at public libraries and other locations that are publicly accessible (e.g., the California State Library). Access to the Internet at libraries and public locations is generally provided on a first-come, first-served basis. Other use restrictions may include the hours of operation, the length of time that a workstation may be used (depending on availability), the types of software programs available on a workstation, and the ability to print documents.