Hormones, Pharmaceuticals, Personal Care Products (CECs ... · mmwd1013i1.pptx/1 Hormones,...
40
mmwd1013i1.pptx/1 Hormones, Pharmaceuticals, Personal Care Products (CECs) in Potable Water Reuse Applications October 2015 Andrew Salveson, P.E. California and Texas [email protected]
Transcript of Hormones, Pharmaceuticals, Personal Care Products (CECs ... · mmwd1013i1.pptx/1 Hormones,...
mm
wd1
013i
1.pp
tx/1
Hormones, Pharmaceuticals, Personal Care Products (CECs) in
Potable Water Reuse ApplicationsOctober 2015
Andrew Salveson, P.E. California and [email protected]
mm
wd1
013i
1.pp
tx/2
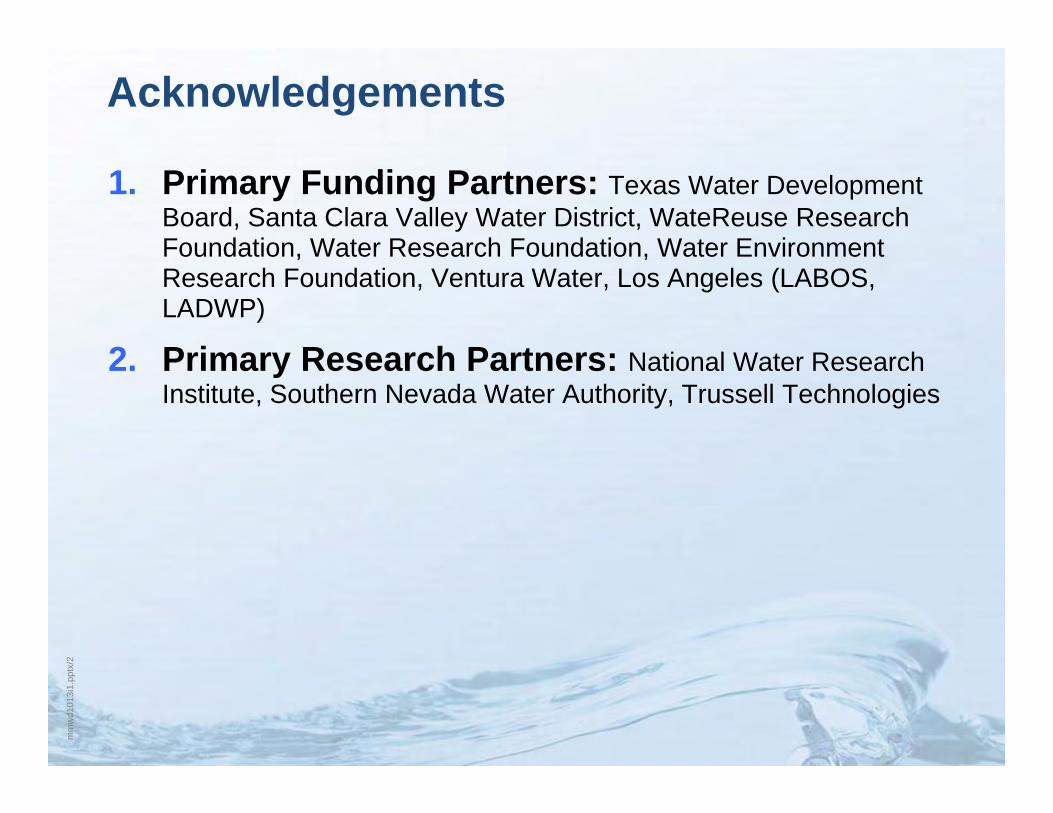
Acknowledgements
1. Primary Funding Partners: Texas Water Development Board, Santa Clara Valley Water District, WateReuse Research Foundation, Water Research Foundation, Water Environment Research Foundation, Ventura Water, Los Angeles (LABOS, LADWP)
2. Primary Research Partners: National Water Research Institute, Southern Nevada Water Authority, Trussell Technologies
mm
wd1
013i
1.pp
tx/3
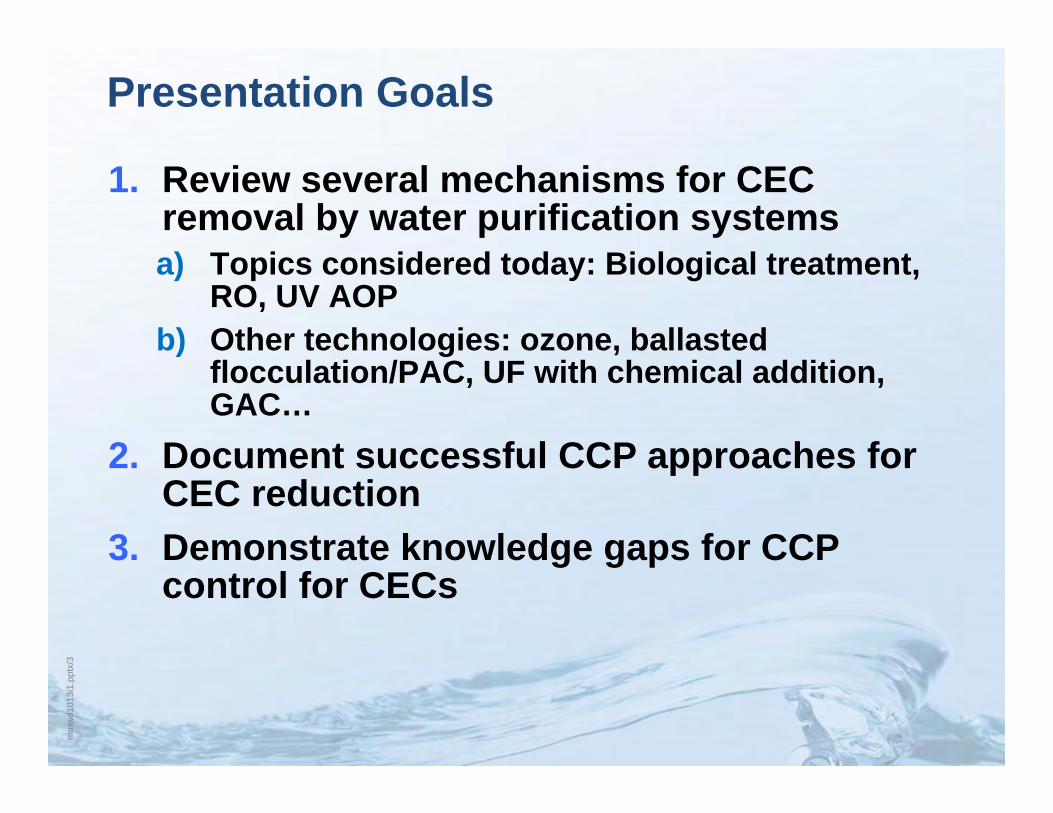
Presentation Goals
1. Review several mechanisms for CEC removal by water purification systemsa) Topics considered today: Biological treatment,
RO, UV AOPb) Other technologies: ozone, ballasted
flocculation/PAC, UF with chemical addition, GAC…
2. Document successful CCP approaches for CEC reduction
3. Demonstrate knowledge gaps for CCPcontrol for CECs
mm
wd1
013i
1.pp
tx/4
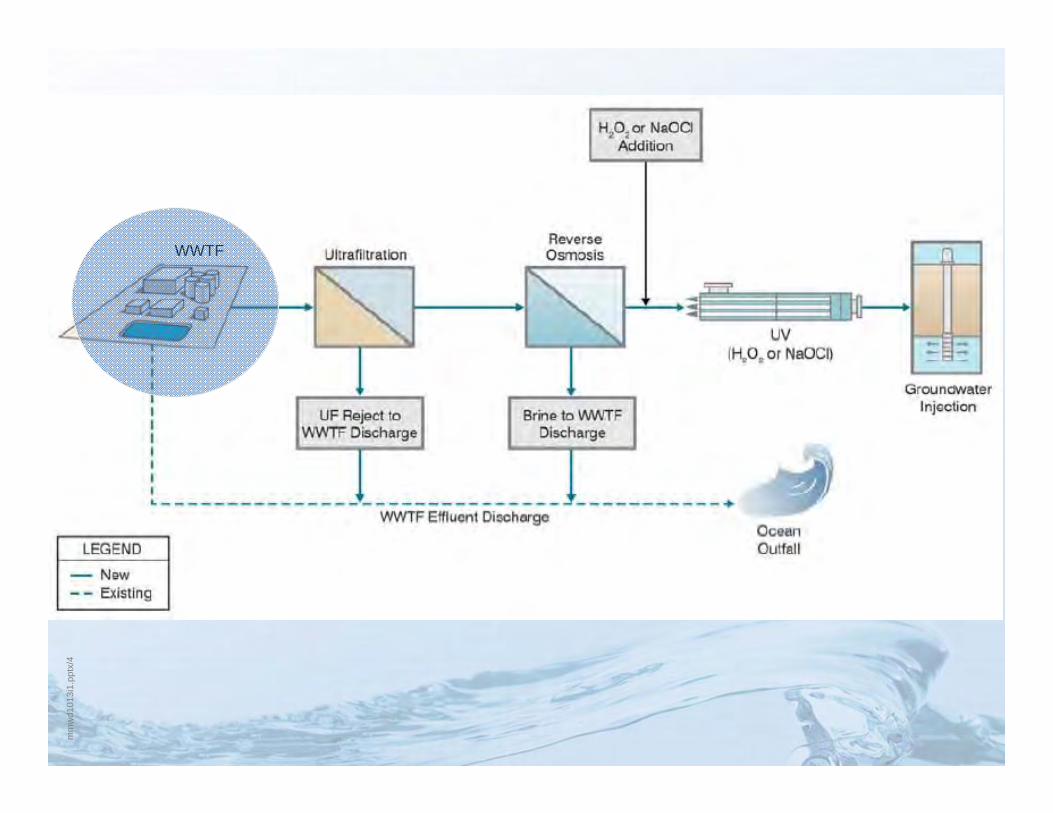
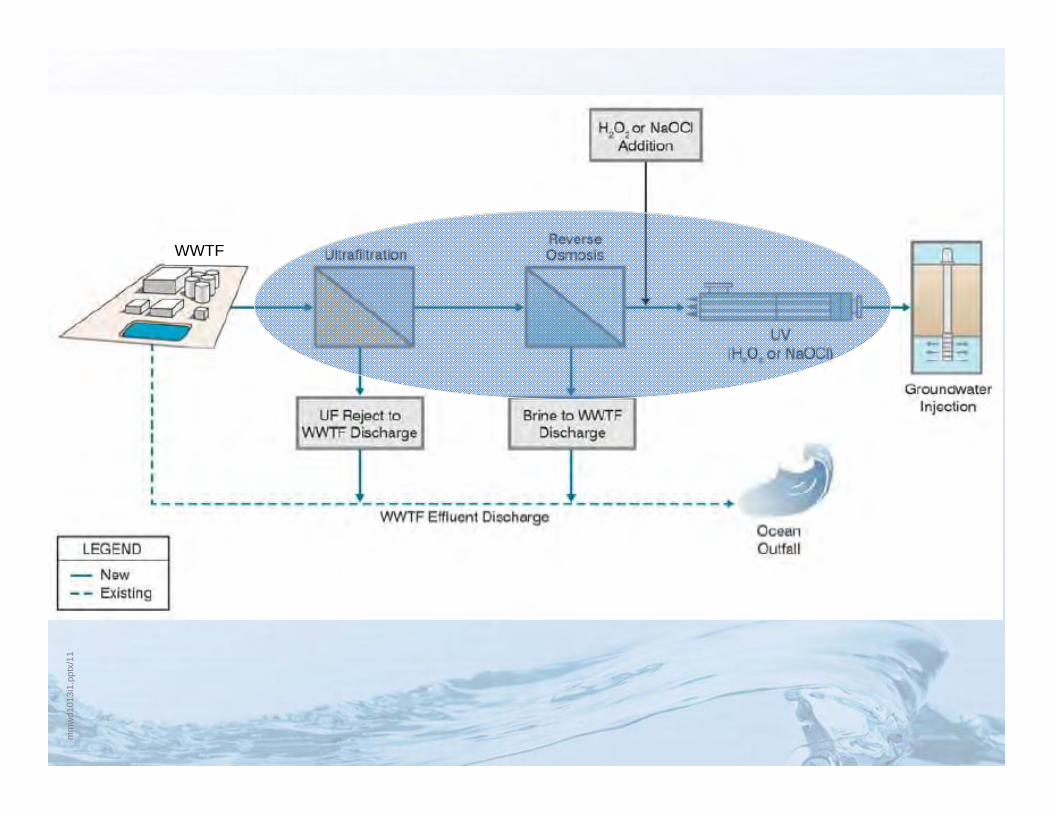
WWTF
mm
wd1
013i
1.pp
tx/5
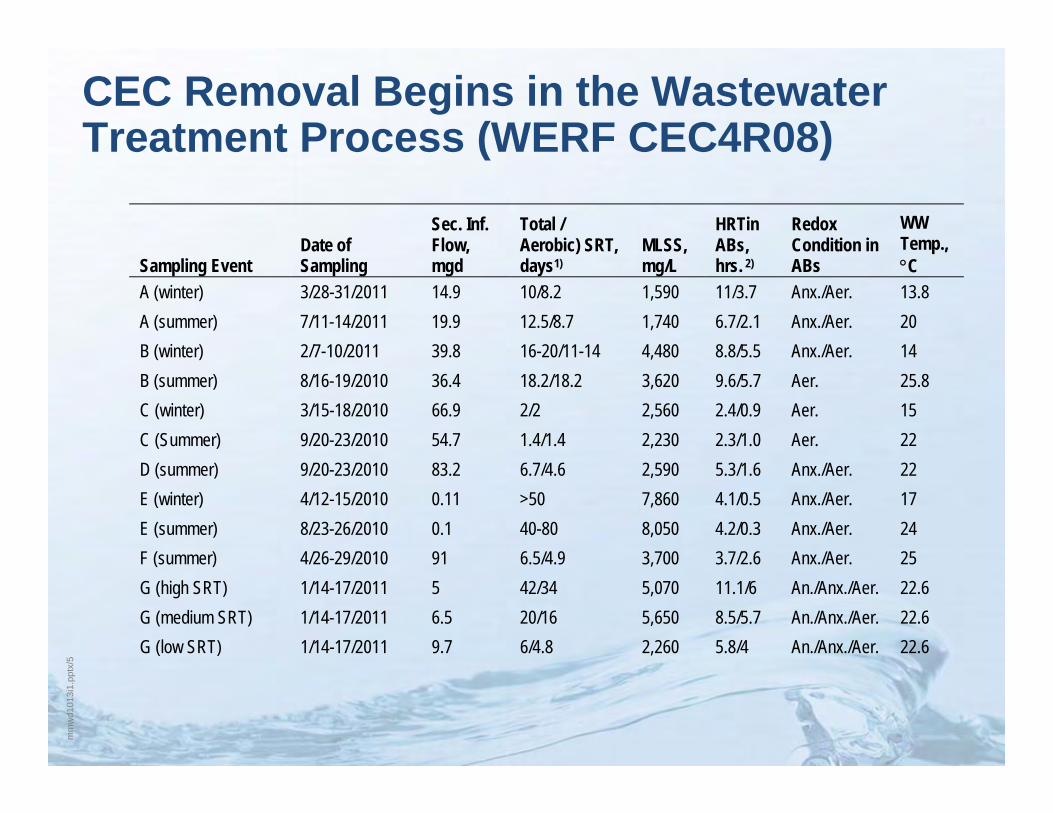
Sampling Event Date of Sampling
Sec. Inf. Flow, mgd
Total / Aerobic) SRT, days1)
MLSS, mg/L
HRTin ABs, hrs. 2)
Redox Condition in ABs
WW Temp., C
A (winter) 3/28-31/2011 14.9 10/8.2 1,590 11/3.7 Anx./Aer. 13.8 A (summer) 7/11-14/2011 19.9 12.5/8.7 1,740 6.7/2.1 Anx./Aer. 20 B (winter) 2/7-10/2011 39.8 16-20/11-14 4,480 8.8/5.5 Anx./Aer. 14 B (summer) 8/16-19/2010 36.4 18.2/18.2 3,620 9.6/5.7 Aer. 25.8 C (winter) 3/15-18/2010 66.9 2/2 2,560 2.4/0.9 Aer. 15 C (Summer) 9/20-23/2010 54.7 1.4/1.4 2,230 2.3/1.0 Aer. 22 D (summer) 9/20-23/2010 83.2 6.7/4.6 2,590 5.3/1.6 Anx./Aer. 22 E (winter) 4/12-15/2010 0.11 >50 7,860 4.1/0.5 Anx./Aer. 17 E (summer) 8/23-26/2010 0.1 40-80 8,050 4.2/0.3 Anx./Aer. 24 F (summer) 4/26-29/2010 91 6.5/4.9 3,700 3.7/2.6 Anx./Aer. 25 G (high SRT) 1/14-17/2011 5 42/34 5,070 11.1/6 An./Anx./Aer. 22.6 G (medium SRT) 1/14-17/2011 6.5 20/16 5,650 8.5/5.7 An./Anx./Aer. 22.6 G (low SRT) 1/14-17/2011 9.7 6/4.8 2,260 5.8/4 An./Anx./Aer. 22.6
CEC Removal Begins in the Wastewater Treatment Process (WERF CEC4R08)
mm
wd1
013i
1.pp
tx/6
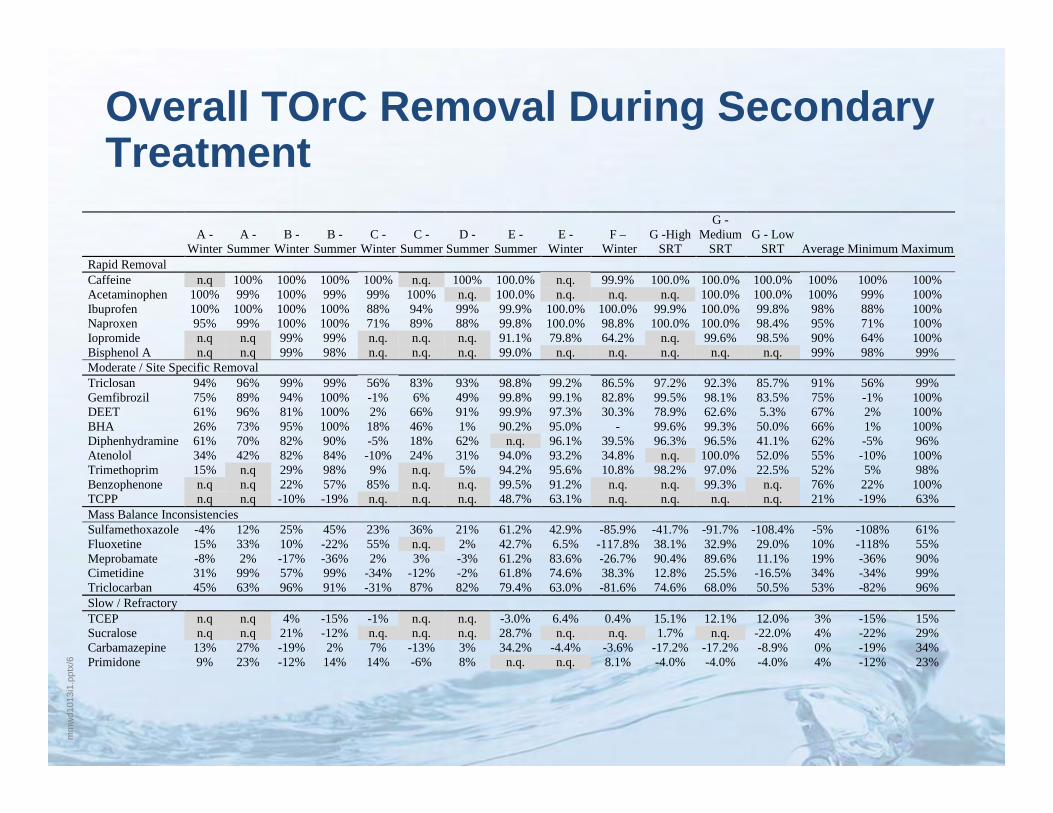
Overall TOrC Removal During Secondary Treatment
A - Winter
A - Summer
B - Winter
B - Summer
C - Winter
C - Summer
D - Summer
E - Summer
E - Winter
F – Winter
G -High SRT
G -Medium
SRT G - Low
SRT Average Minimum MaximumRapid Removal Caffeine n.q 100% 100% 100% 100% n.q. 100% 100.0% n.q. 99.9% 100.0% 100.0% 100.0% 100% 100% 100% Acetaminophen 100% 99% 100% 99% 99% 100% n.q. 100.0% n.q. n.q. n.q. 100.0% 100.0% 100% 99% 100% Ibuprofen 100% 100% 100% 100% 88% 94% 99% 99.9% 100.0% 100.0% 99.9% 100.0% 99.8% 98% 88% 100% Naproxen 95% 99% 100% 100% 71% 89% 88% 99.8% 100.0% 98.8% 100.0% 100.0% 98.4% 95% 71% 100% Iopromide n.q n.q 99% 99% n.q. n.q. n.q. 91.1% 79.8% 64.2% n.q. 99.6% 98.5% 90% 64% 100% Bisphenol A n.q n.q 99% 98% n.q. n.q. n.q. 99.0% n.q. n.q. n.q. n.q. n.q. 99% 98% 99% Moderate / Site Specific Removal Triclosan 94% 96% 99% 99% 56% 83% 93% 98.8% 99.2% 86.5% 97.2% 92.3% 85.7% 91% 56% 99% Gemfibrozil 75% 89% 94% 100% -1% 6% 49% 99.8% 99.1% 82.8% 99.5% 98.1% 83.5% 75% -1% 100% DEET 61% 96% 81% 100% 2% 66% 91% 99.9% 97.3% 30.3% 78.9% 62.6% 5.3% 67% 2% 100% BHA 26% 73% 95% 100% 18% 46% 1% 90.2% 95.0% - 99.6% 99.3% 50.0% 66% 1% 100% Diphenhydramine 61% 70% 82% 90% -5% 18% 62% n.q. 96.1% 39.5% 96.3% 96.5% 41.1% 62% -5% 96% Atenolol 34% 42% 82% 84% -10% 24% 31% 94.0% 93.2% 34.8% n.q. 100.0% 52.0% 55% -10% 100% Trimethoprim 15% n.q 29% 98% 9% n.q. 5% 94.2% 95.6% 10.8% 98.2% 97.0% 22.5% 52% 5% 98% Benzophenone n.q n.q 22% 57% 85% n.q. n.q. 99.5% 91.2% n.q. n.q. 99.3% n.q. 76% 22% 100% TCPP n.q n.q -10% -19% n.q. n.q. n.q. 48.7% 63.1% n.q. n.q. n.q. n.q. 21% -19% 63% Mass Balance Inconsistencies Sulfamethoxazole -4% 12% 25% 45% 23% 36% 21% 61.2% 42.9% -85.9% -41.7% -91.7% -108.4% -5% -108% 61% Fluoxetine 15% 33% 10% -22% 55% n.q. 2% 42.7% 6.5% -117.8% 38.1% 32.9% 29.0% 10% -118% 55% Meprobamate -8% 2% -17% -36% 2% 3% -3% 61.2% 83.6% -26.7% 90.4% 89.6% 11.1% 19% -36% 90% Cimetidine 31% 99% 57% 99% -34% -12% -2% 61.8% 74.6% 38.3% 12.8% 25.5% -16.5% 34% -34% 99% Triclocarban 45% 63% 96% 91% -31% 87% 82% 79.4% 63.0% -81.6% 74.6% 68.0% 50.5% 53% -82% 96% Slow / Refractory TCEP n.q n.q 4% -15% -1% n.q. n.q. -3.0% 6.4% 0.4% 15.1% 12.1% 12.0% 3% -15% 15% Sucralose n.q n.q 21% -12% n.q. n.q. n.q. 28.7% n.q. n.q. 1.7% n.q. -22.0% 4% -22% 29% Carbamazepine 13% 27% -19% 2% 7% -13% 3% 34.2% -4.4% -3.6% -17.2% -17.2% -8.9% 0% -19% 34% Primidone 9% 23% -12% 14% 14% -6% 8% n.q. n.q. 8.1% -4.0% -4.0% -4.0% 4% -12% 23%
mm
wd1
013i
1.pp
tx/7
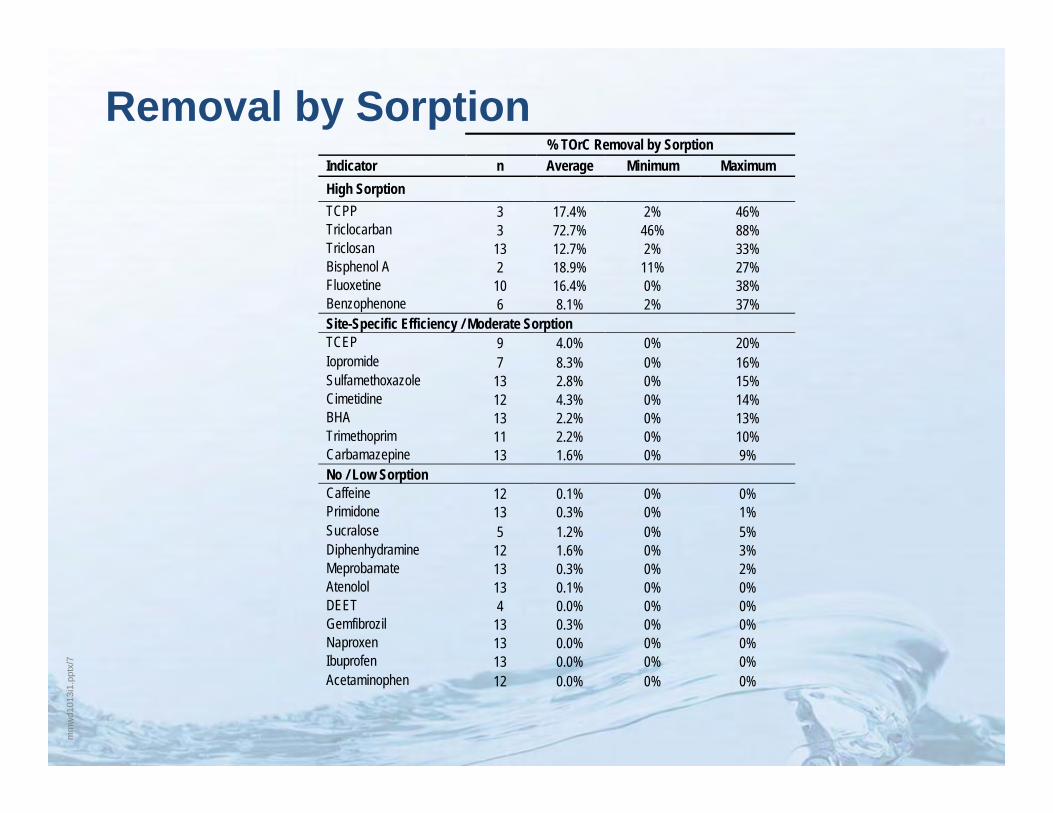
Removal by Sorption% TOrC Removal by Sorption
Indicator n Average Minimum Maximum High Sorption TCPP 3 17.4% 2% 46% Triclocarban 3 72.7% 46% 88% Triclosan 13 12.7% 2% 33% Bisphenol A 2 18.9% 11% 27% Fluoxetine 10 16.4% 0% 38% Benzophenone 6 8.1% 2% 37% Site-Specific Efficiency / Moderate Sorption TCEP 9 4.0% 0% 20% Iopromide 7 8.3% 0% 16% Sulfamethoxazole 13 2.8% 0% 15% Cimetidine 12 4.3% 0% 14% BHA 13 2.2% 0% 13% Trimethoprim 11 2.2% 0% 10% Carbamazepine 13 1.6% 0% 9% No / Low Sorption Caffeine 12 0.1% 0% 0% Primidone 13 0.3% 0% 1% Sucralose 5 1.2% 0% 5% Diphenhydramine 12 1.6% 0% 3% Meprobamate 13 0.3% 0% 2% Atenolol 13 0.1% 0% 0% DEET 4 0.0% 0% 0% Gemfibrozil 13 0.3% 0% 0% Naproxen 13 0.0% 0% 0% Ibuprofen 13 0.0% 0% 0% Acetaminophen 12 0.0% 0% 0%
mm
wd1
013i
1.pp
tx/8
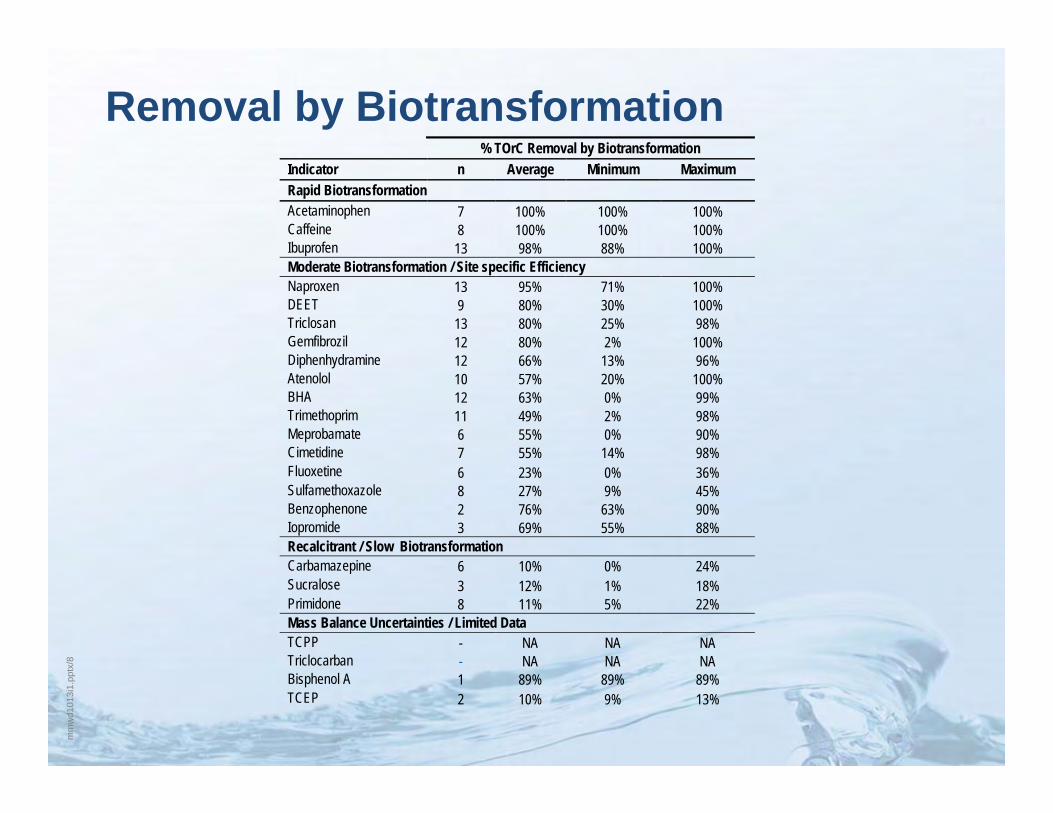
Removal by Biotransformation% TOrC Removal by Biotransformation
Indicator n Average Minimum Maximum Rapid Biotransformation Acetaminophen 7 100% 100% 100% Caffeine 8 100% 100% 100% Ibuprofen 13 98% 88% 100% Moderate Biotransformation / Site specific Efficiency Naproxen 13 95% 71% 100% DEET 9 80% 30% 100% Triclosan 13 80% 25% 98% Gemfibrozil 12 80% 2% 100% Diphenhydramine 12 66% 13% 96% Atenolol 10 57% 20% 100% BHA 12 63% 0% 99% Trimethoprim 11 49% 2% 98% Meprobamate 6 55% 0% 90% Cimetidine 7 55% 14% 98% Fluoxetine 6 23% 0% 36% Sulfamethoxazole 8 27% 9% 45% Benzophenone 2 76% 63% 90% Iopromide 3 69% 55% 88% Recalcitrant / Slow Biotransformation Carbamazepine 6 10% 0% 24% Sucralose 3 12% 1% 18% Primidone 8 11% 5% 22% Mass Balance Uncertainties / Limited Data TCPP - NA NA NA Triclocarban - NA NA NA Bisphenol A 1 89% 89% 89% TCEP 2 10% 9% 13%
mm
wd1
013i
1.pp
tx/9
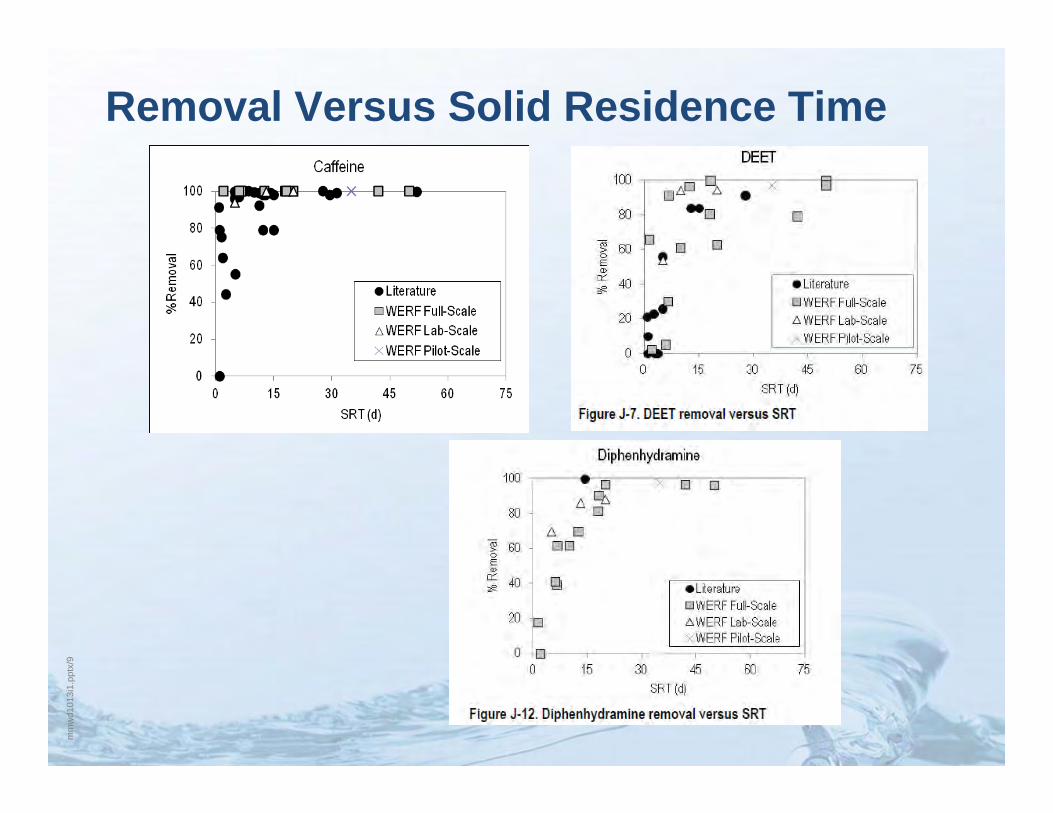
Removal Versus Solid Residence Time
mm
wd1
013i
1.pp
tx/1
0
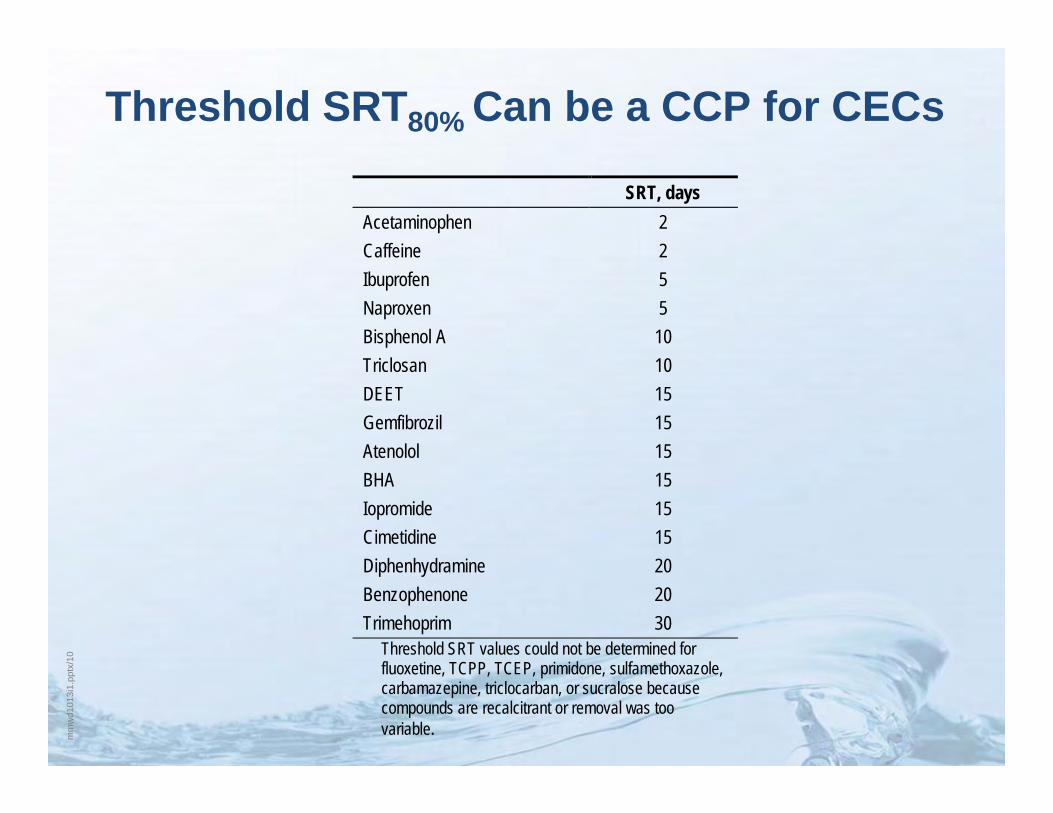
Threshold SRT80% Can be a CCP for CECs
SRT, days Acetaminophen 2 Caffeine 2 Ibuprofen 5 Naproxen 5 Bisphenol A 10 Triclosan 10 DEET 15 Gemfibrozil 15 Atenolol 15 BHA 15 Iopromide 15 Cimetidine 15 Diphenhydramine 20 Benzophenone 20 Trimehoprim 30
Threshold SRT values could not be determined for fluoxetine, TCPP, TCEP, primidone, sulfamethoxazole, carbamazepine, triclocarban, or sucralose because compounds are recalcitrant or removal was too variable.
mm
wd1
013i
1.pp
tx/1
1
WWTF
mm
wd1
013i
1.pp
tx/1
2
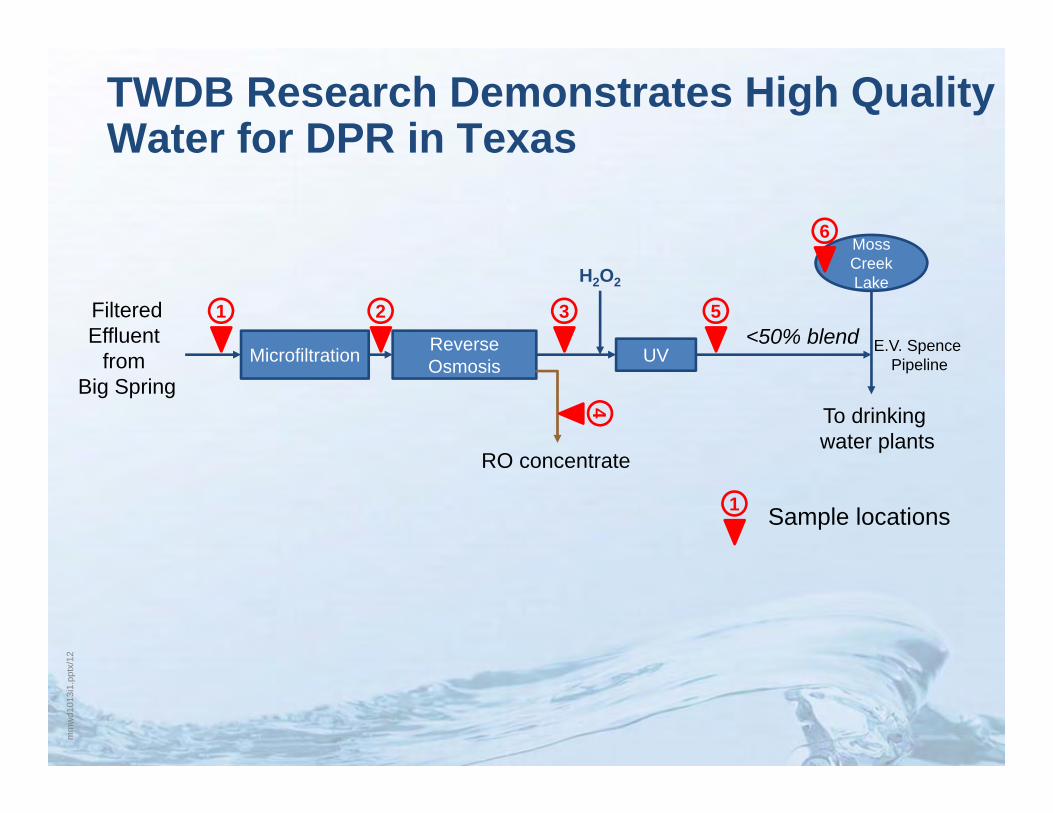
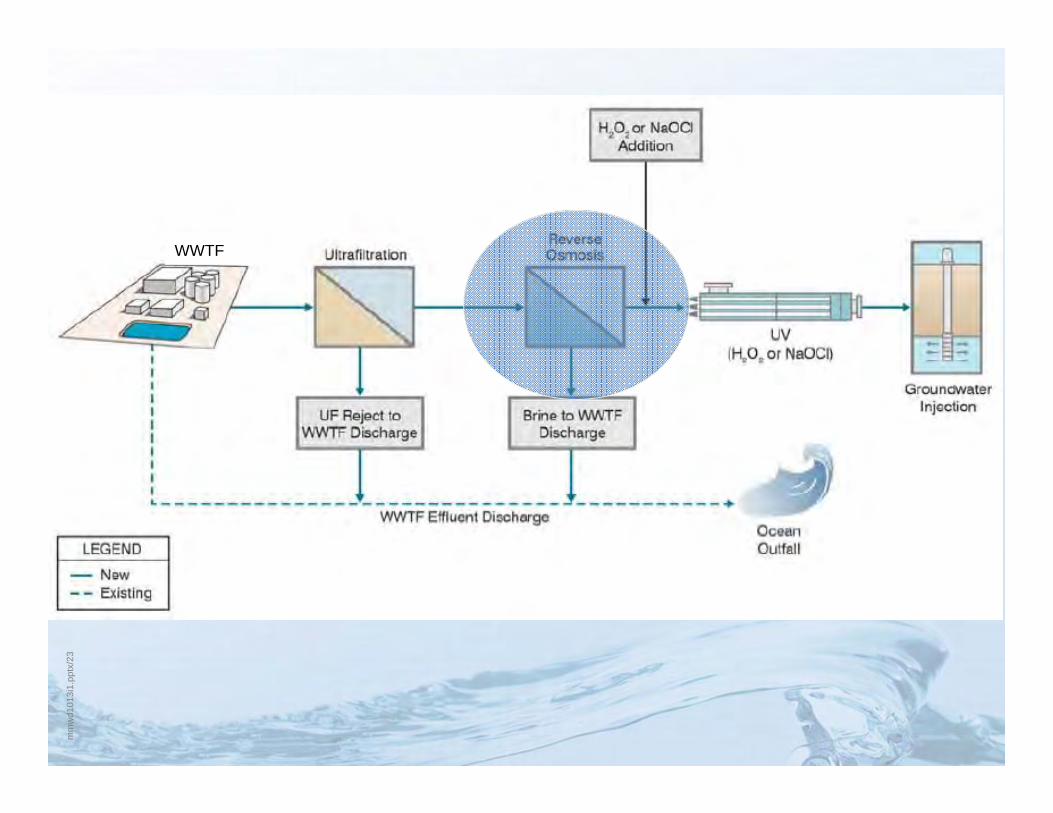
TWDB Research Demonstrates High Quality Water for DPR in Texas
Microfiltration Reverse Osmosis UV
FilteredEffluent
from Big Spring
H2O2
<50% blend
To drinking water plants
Moss Creek Lake
E.V. Spence Pipeline
RO concentrate4
1 2 3 5
6
1 Sample locations
mm
wd1
013i
1.pp
tx/1
3
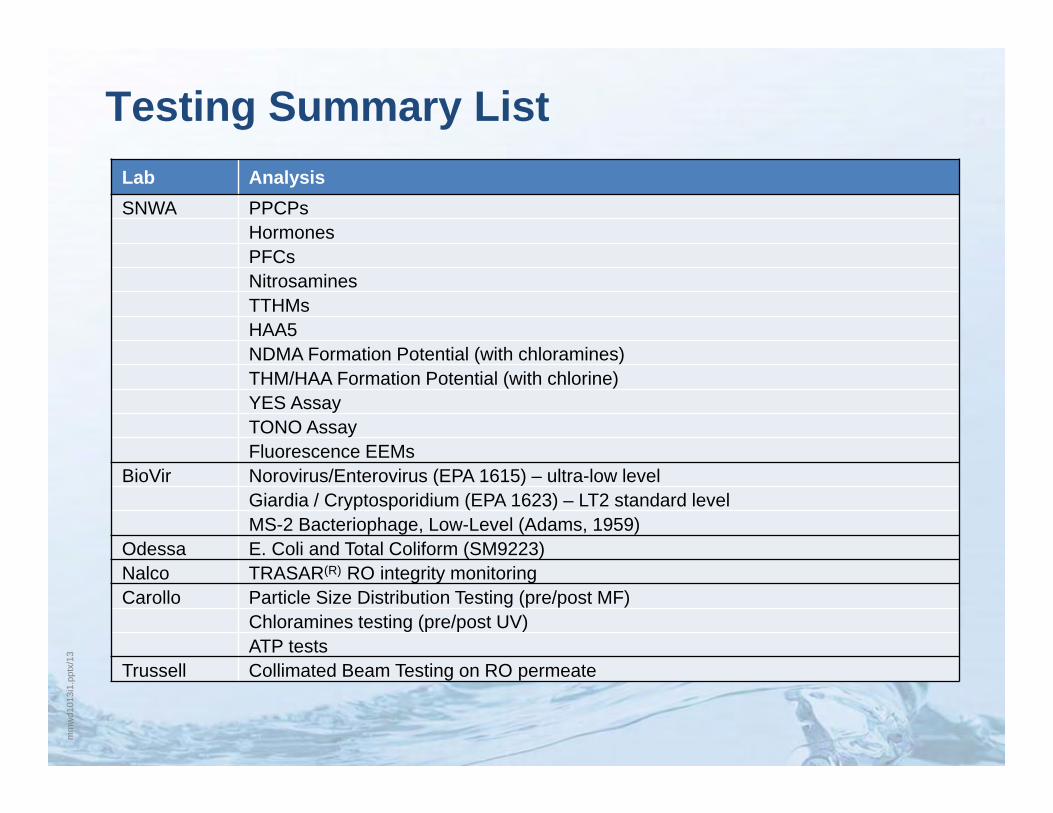
Testing Summary ListLab AnalysisSNWA PPCPs
HormonesPFCsNitrosaminesTTHMsHAA5NDMA Formation Potential (with chloramines)THM/HAA Formation Potential (with chlorine)YES AssayTONO AssayFluorescence EEMs
BioVir Norovirus/Enterovirus (EPA 1615) – ultra-low levelGiardia / Cryptosporidium (EPA 1623) – LT2 standard levelMS-2 Bacteriophage, Low-Level (Adams, 1959)
Odessa E. Coli and Total Coliform (SM9223)Nalco TRASAR(R) RO integrity monitoringCarollo Particle Size Distribution Testing (pre/post MF)
Chloramines testing (pre/post UV)ATP tests
Trussell Collimated Beam Testing on RO permeate
mm
wd1
013i
1.pp
tx/1
4
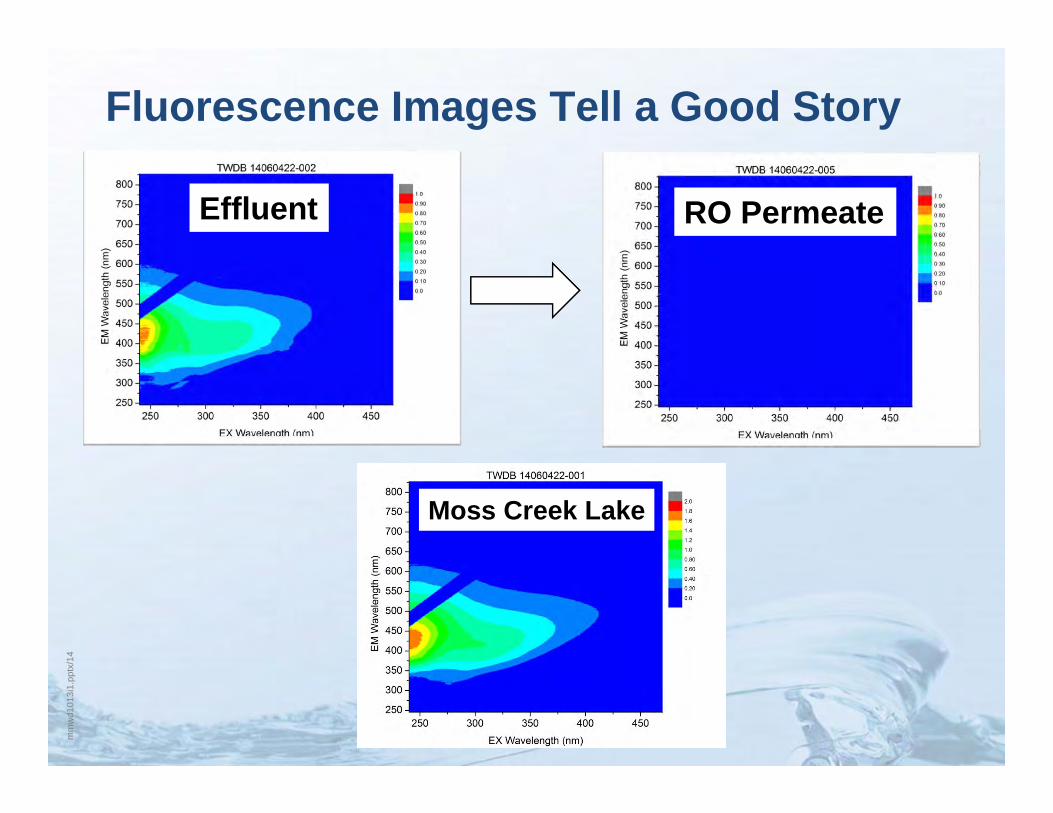
Fluorescence Images Tell a Good Story
Effluent RO Permeate
Moss Creek Lake
mm
wd1
013i
1.pp
tx/1
5
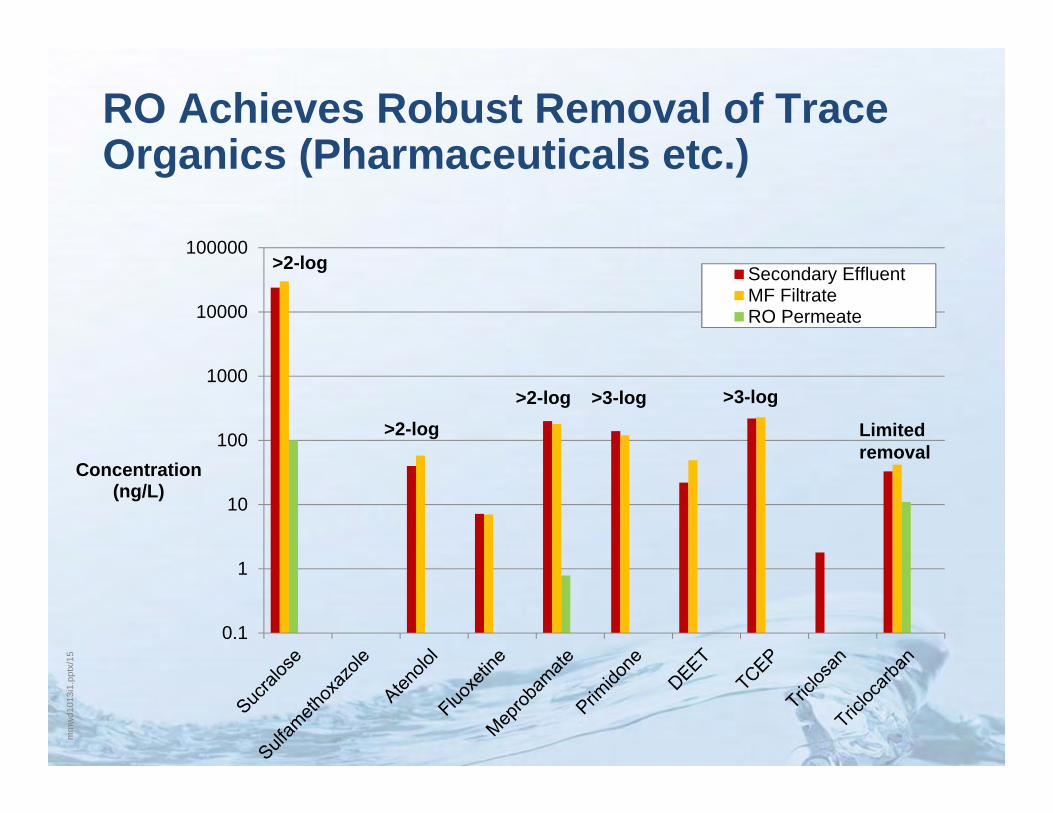
RO Achieves Robust Removal of Trace Organics (Pharmaceuticals etc.)
0.1
1
10
100
1000
10000
100000
Concentration (ng/L)
Secondary EffluentMF FiltrateRO Permeate
>2-log
>2-log>3-log>2-log >3-log
Limited removal
mm
wd1
013i
1.pp
tx/1
6
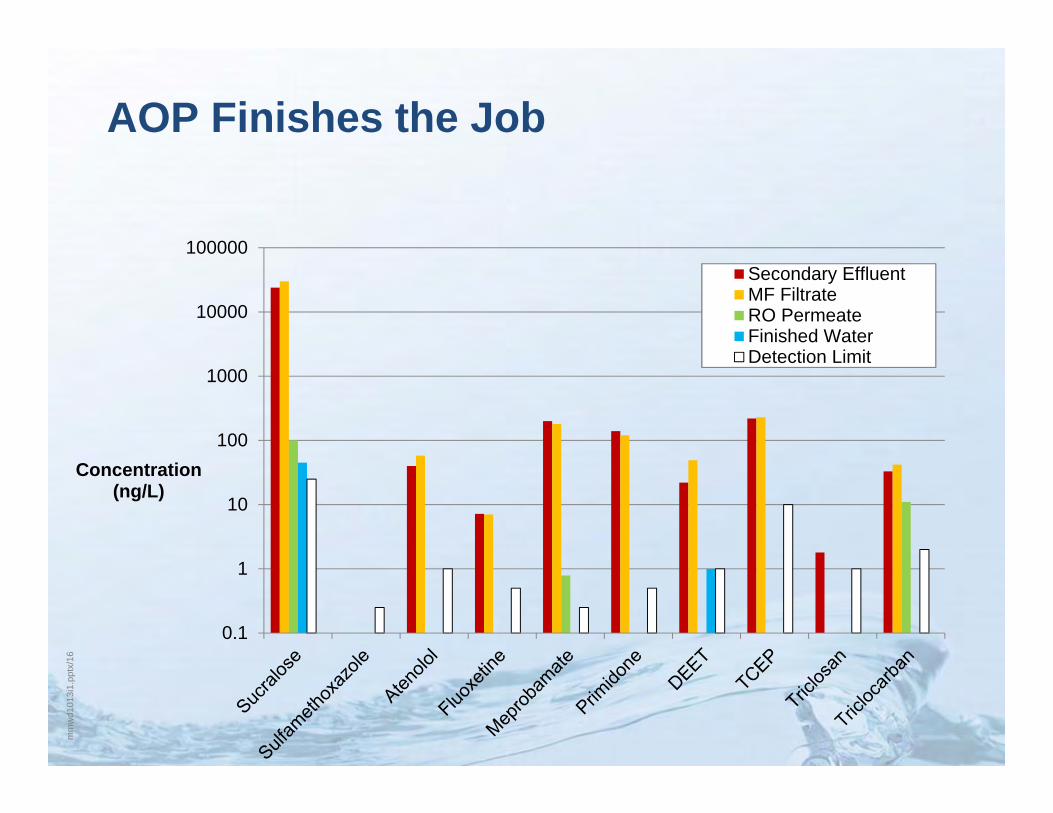
AOP Finishes the Job
0.1
1
10
100
1000
10000
100000
Concentration (ng/L)
Secondary EffluentMF FiltrateRO PermeateFinished WaterDetection Limit
mm
wd1
013i
1.pp
tx/1
7
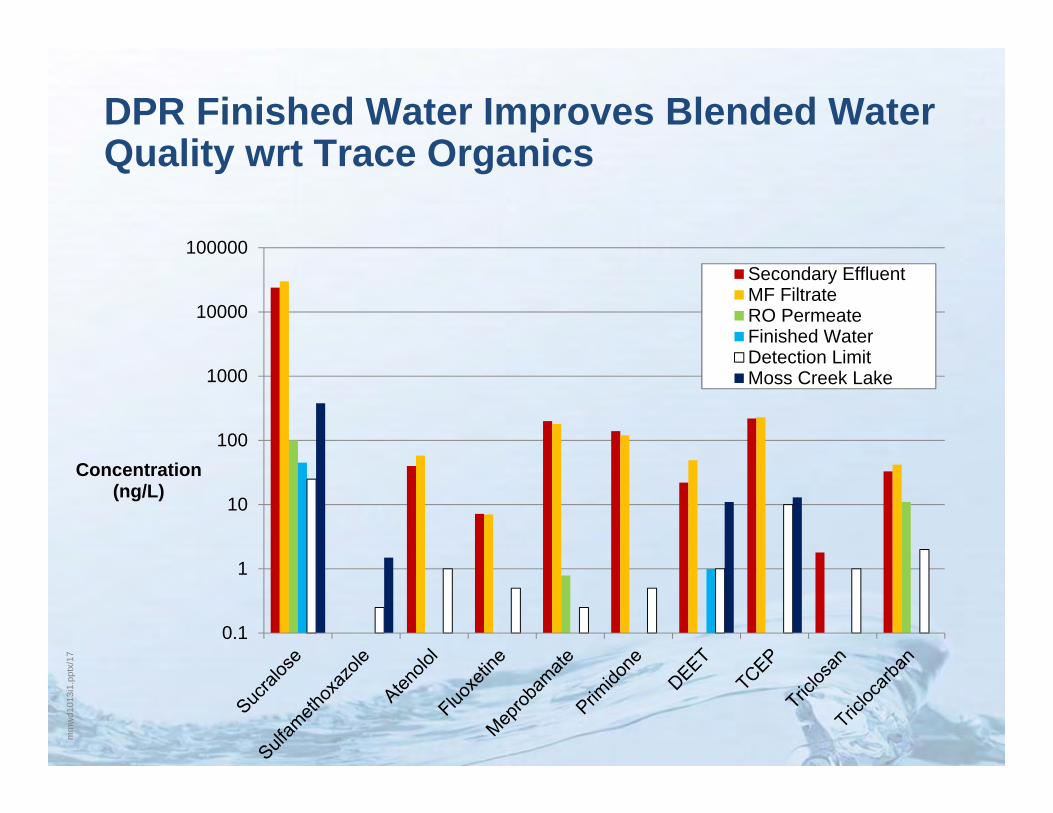
DPR Finished Water Improves Blended Water Quality wrt Trace Organics
0.1
1
10
100
1000
10000
100000
Concentration (ng/L)
Secondary EffluentMF FiltrateRO PermeateFinished WaterDetection LimitMoss Creek Lake
mm
wd1
013i
1.pp
tx/1
8
0.1
1
10
100
1000
10000
100000
Concentration (ng/L)
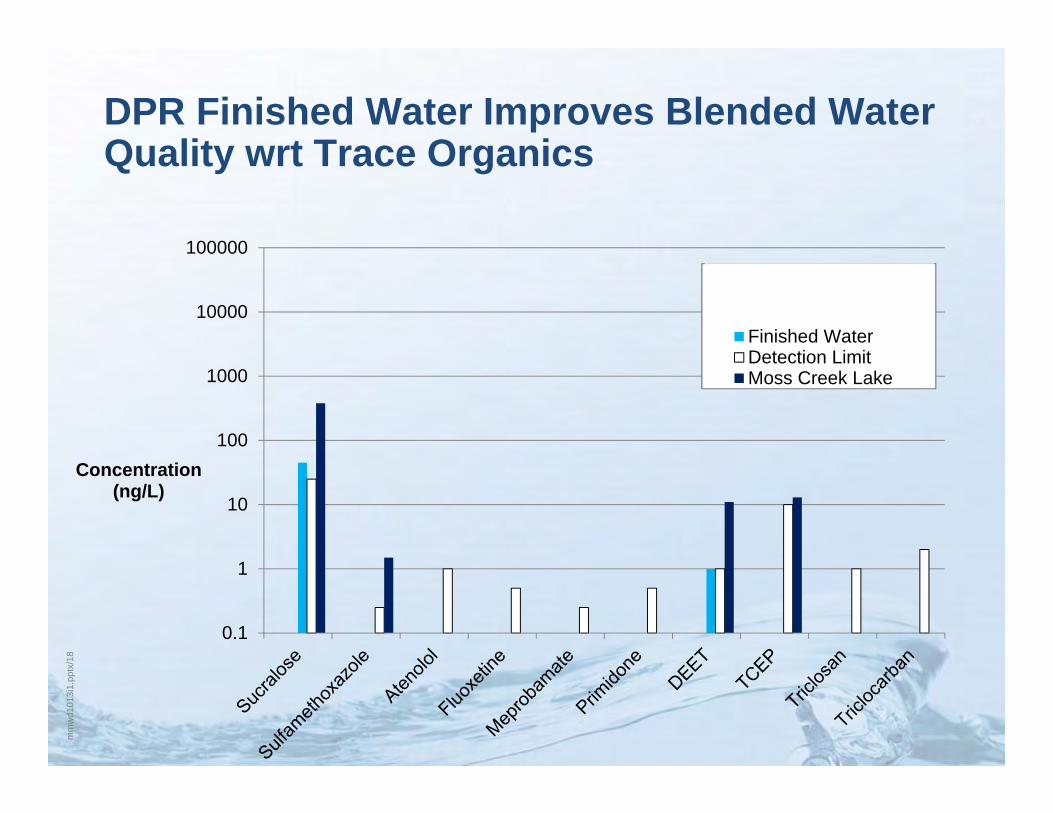
Secondary EffluentMF FiltrateRO PermeateFinished WaterDetection LimitMoss Creek Lake
DPR Finished Water Improves Blended Water Quality wrt Trace Organics
mm
wd1
013i
1.pp
tx/1
9
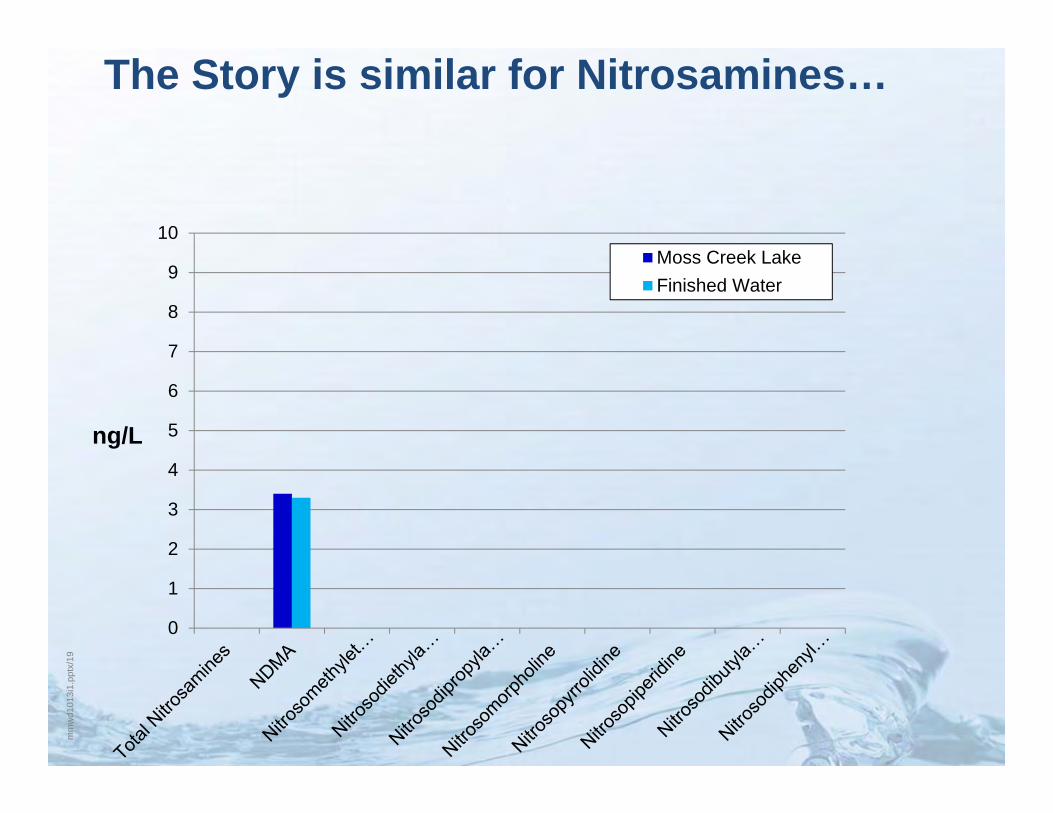
0
1
2
3
4
5
6
7
8
9
10
ng/L
Moss Creek LakeFinished Water
The Story is similar for Nitrosamines…
mm
wd1
013i
1.pp
tx/2
0
0
0.1
0.2
0.3
0.4
0.5
0.6
0.7
0.8
0.9
1
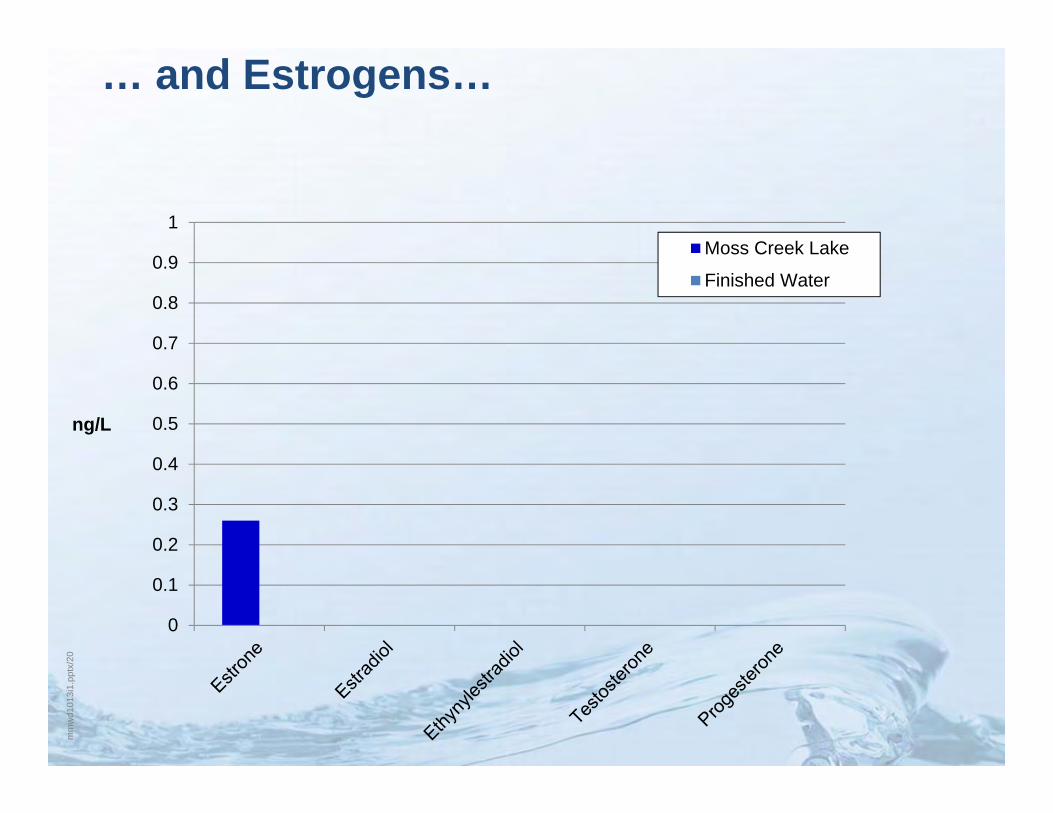
ng/L
Moss Creek Lake
Finished Water
… and Estrogens…
mm
wd1
013i
1.pp
tx/2
1
0
0.5
1
1.5
2
2.5
3
3.5
4
4.5
5
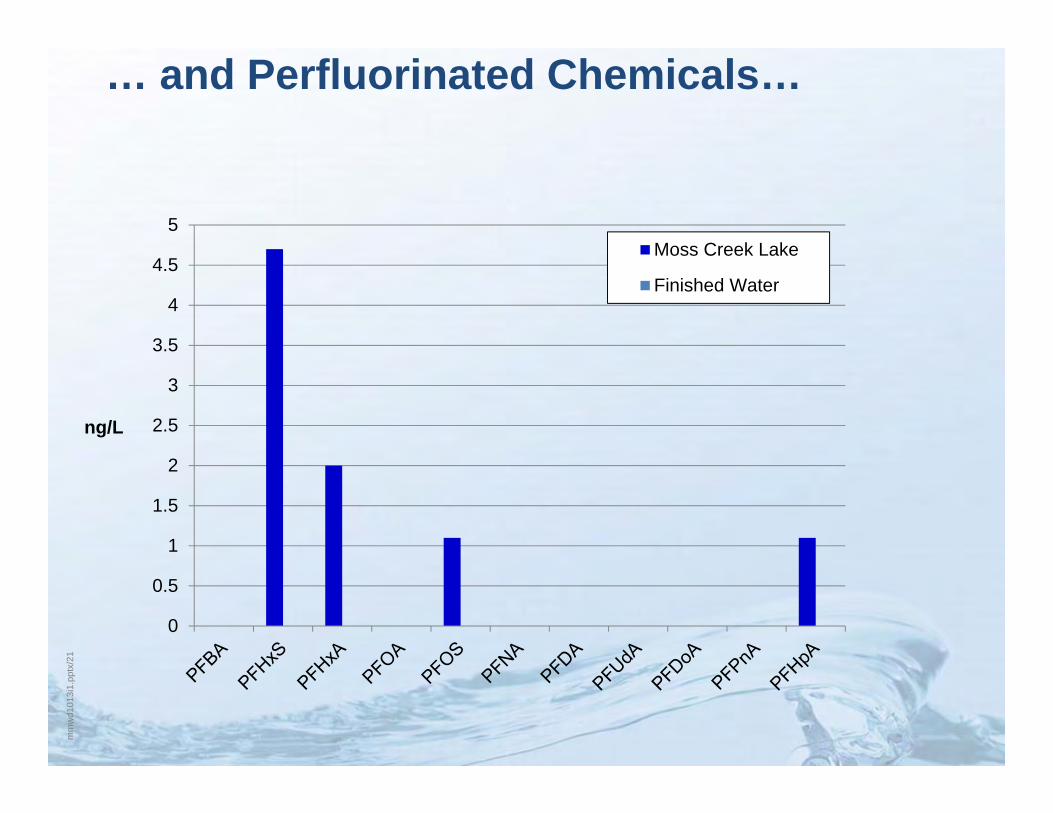
ng/L
Moss Creek Lake
Finished Water
… and Perfluorinated Chemicals…
mm
wd1
013i
1.pp
tx/2
2
How Do We Gain Confidence in Water Quality Pertaining to CEC Removal?
1. CCPs for RO
2. CCPs for UV AOP
mm
wd1
013i
1.pp
tx/2
3
WWTF
mm
wd1
013i
1.pp
tx/2
4
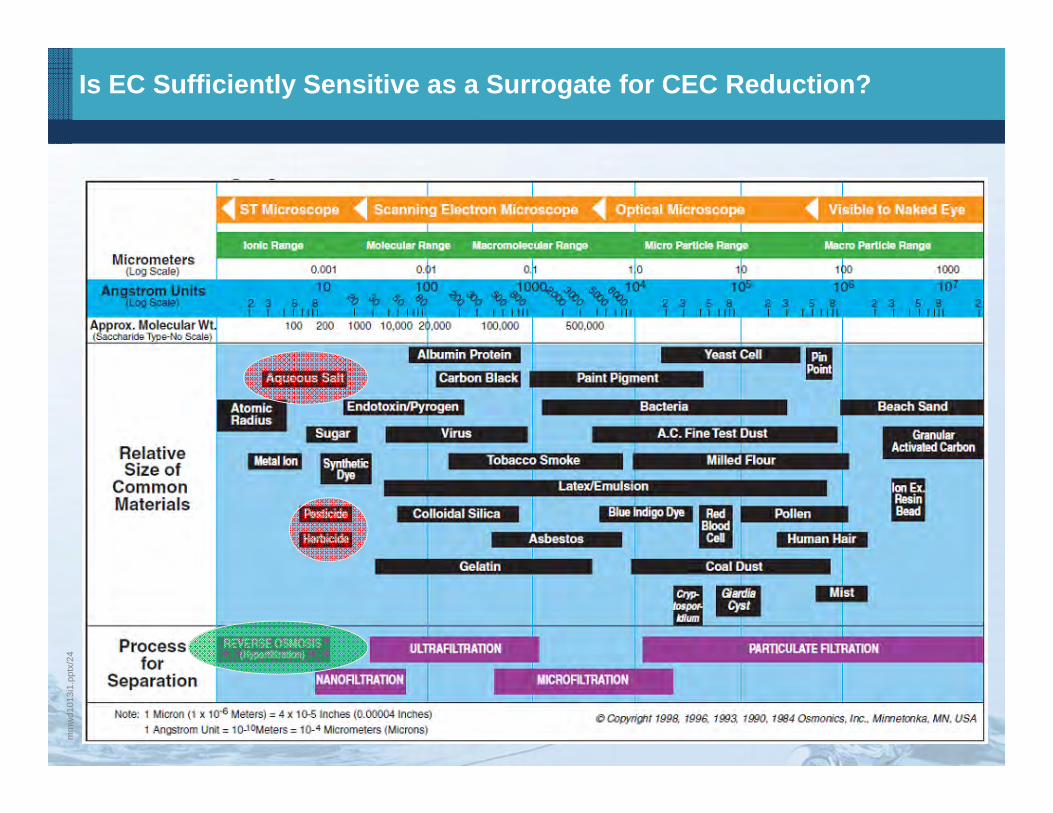
Is EC Sufficiently Sensitive as a Surrogate for CEC Reduction?
mm
wd1
013i
1.pp
tx/2
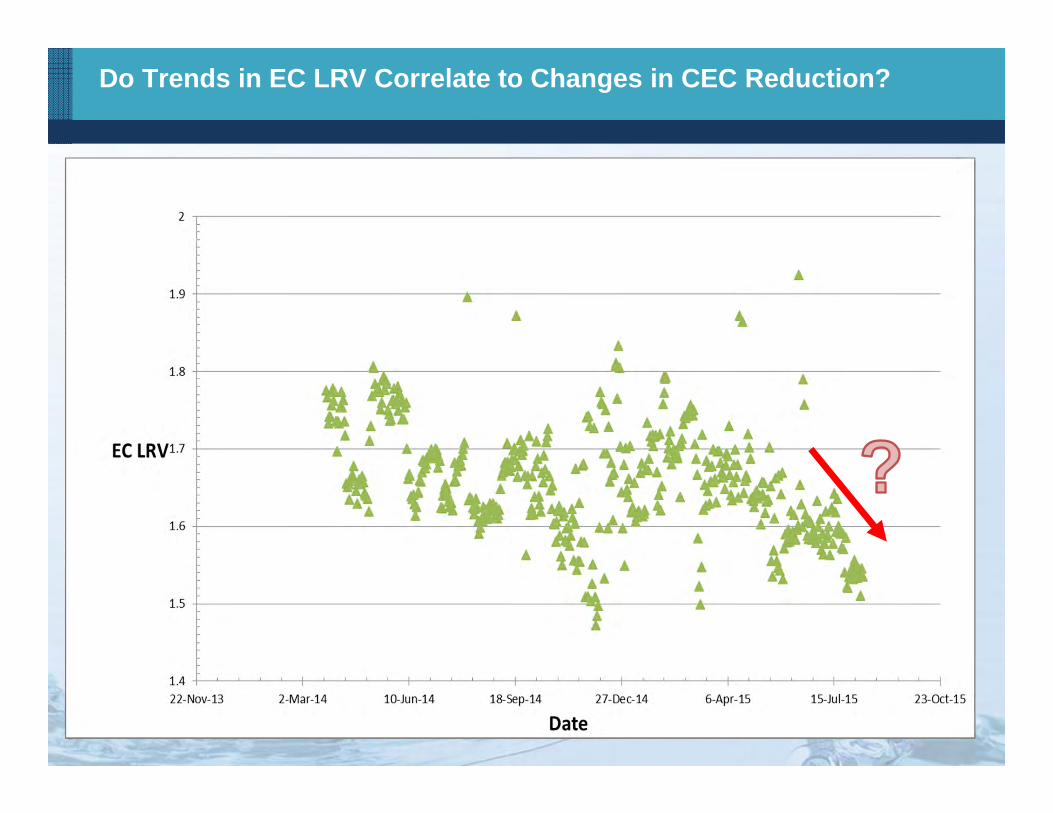
5Do Trends in EC LRV Correlate to Changes in CEC Reduction?
mm
wd1
013i
1.pp
tx/2
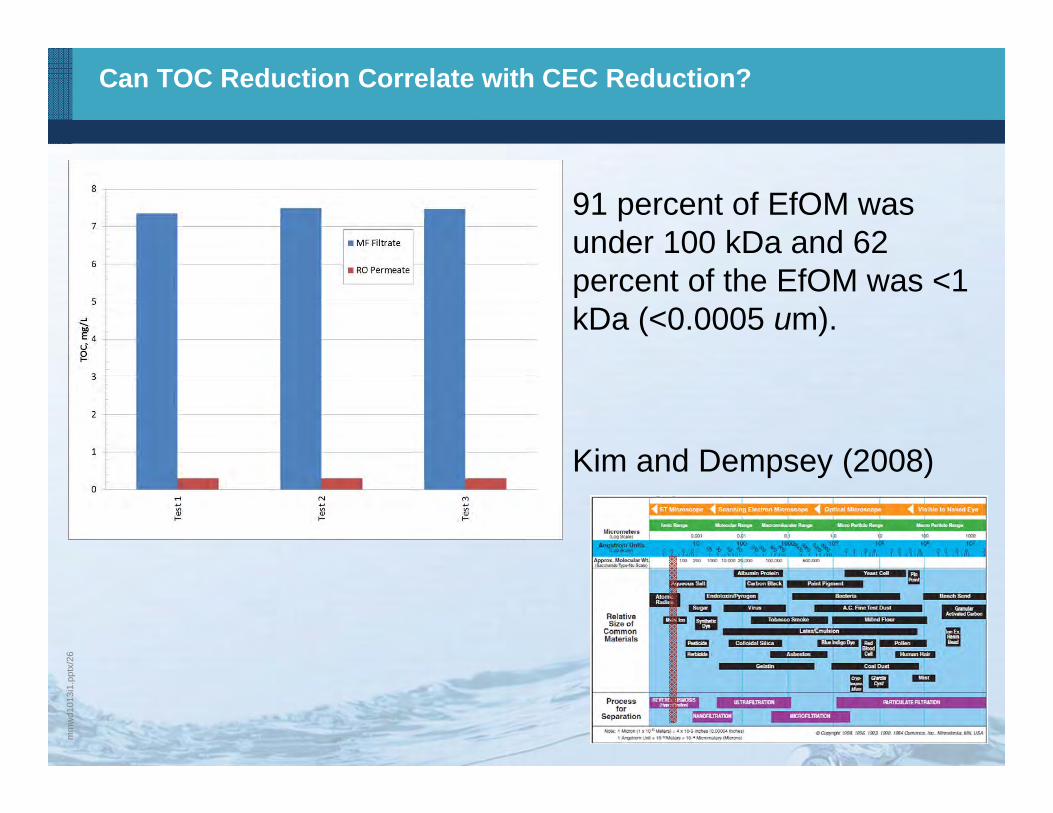
6Can TOC Reduction Correlate with CEC Reduction?
91 percent of EfOM was under 100 kDa and 62 percent of the EfOM was <1 kDa (<0.0005 um).
Kim and Dempsey (2008)
mm
wd1
013i
1.pp
tx/2
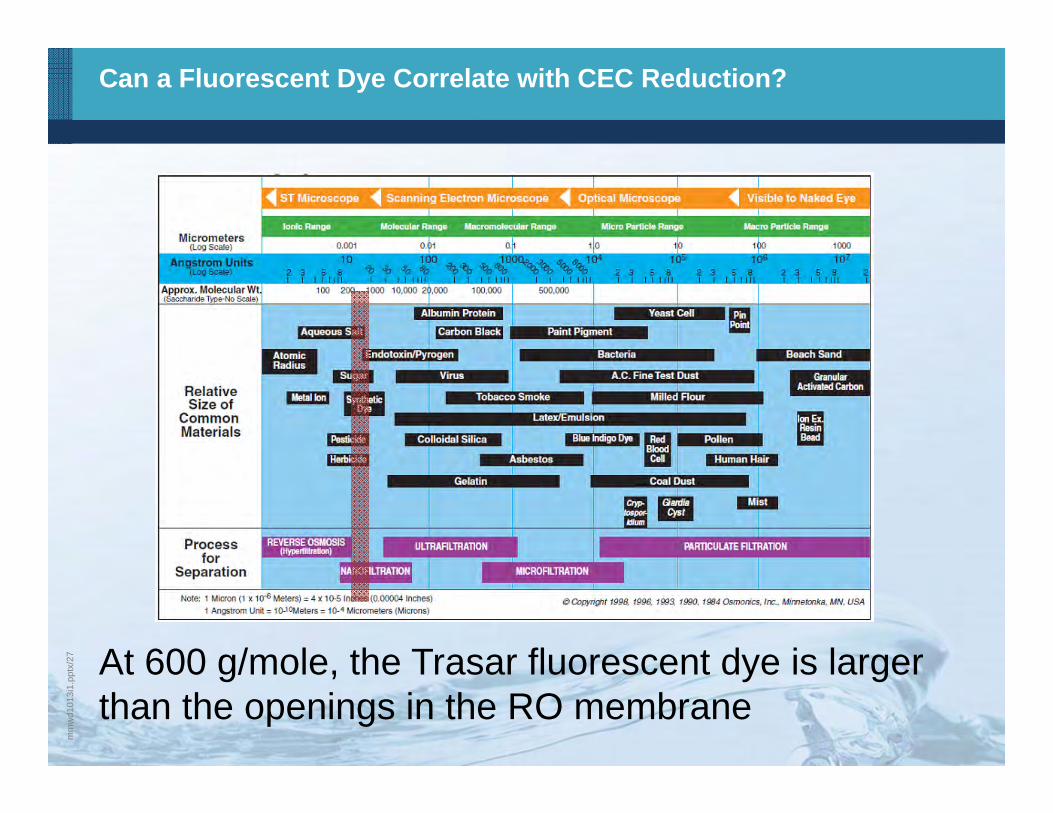
7Can a Fluorescent Dye Correlate with CEC Reduction?
At 600 g/mole, the Trasar fluorescent dye is larger than the openings in the RO membrane
mm
wd1
013i
1.pp
tx/2
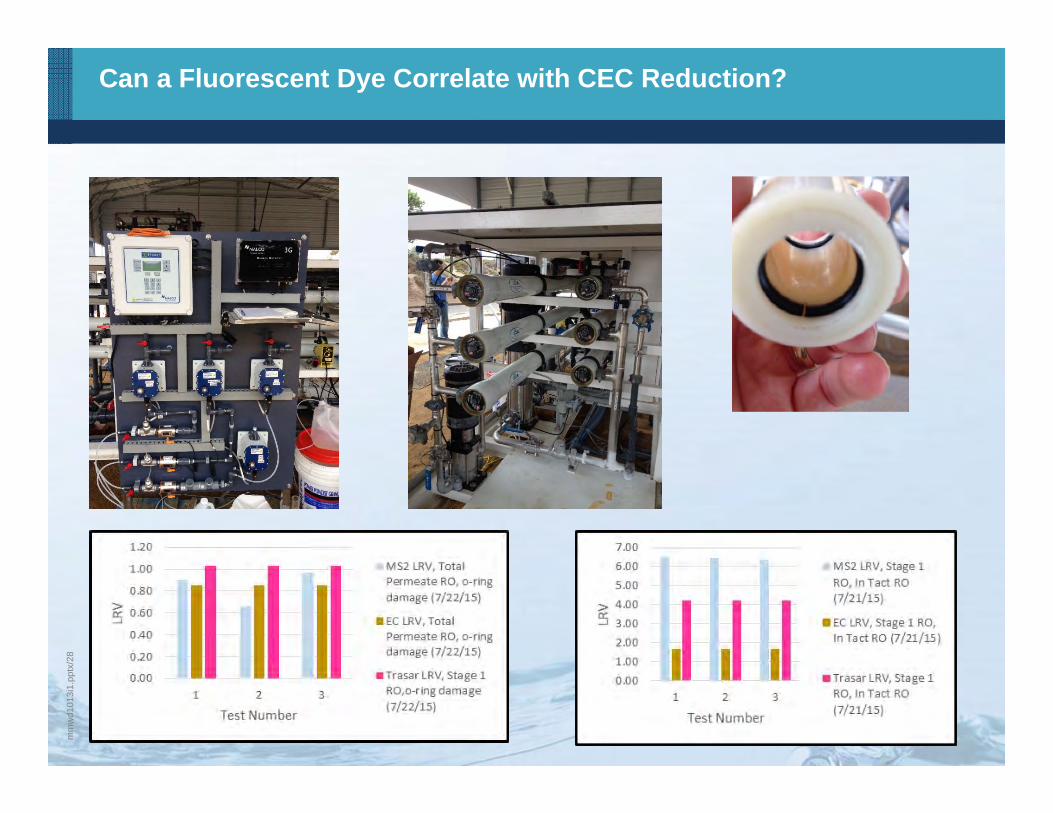
8Can a Fluorescent Dye Correlate with CEC Reduction?
mm
wd1
013i
1.pp
tx/2
9
WWTF
mm
wd1
013i
1.pp
tx/3
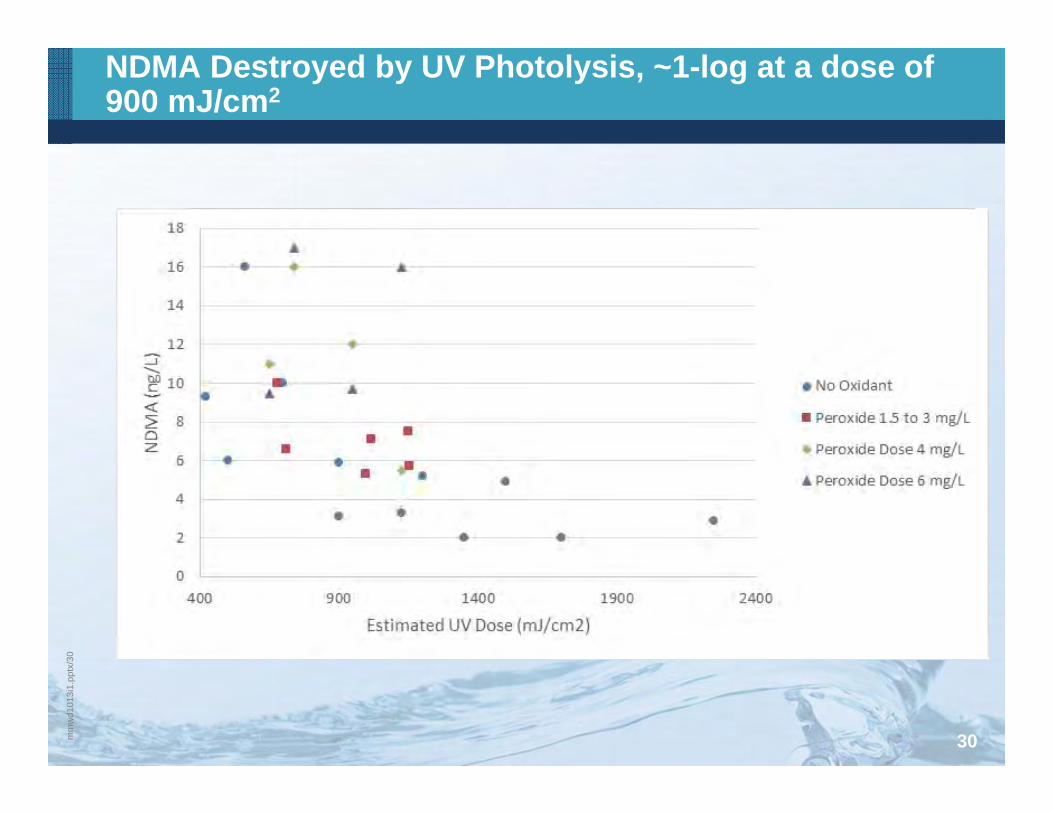
0NDMA Destroyed by UV Photolysis, ~1-log at a dose of 900 mJ/cm2
30

mm
wd1
013i
1.pp
tx/3
1
31
NDMA Destroyed by UV Photolysis, ~1-log at a dose of 900 mJ/cm2
mm
wd1
013i
1.pp
tx/3
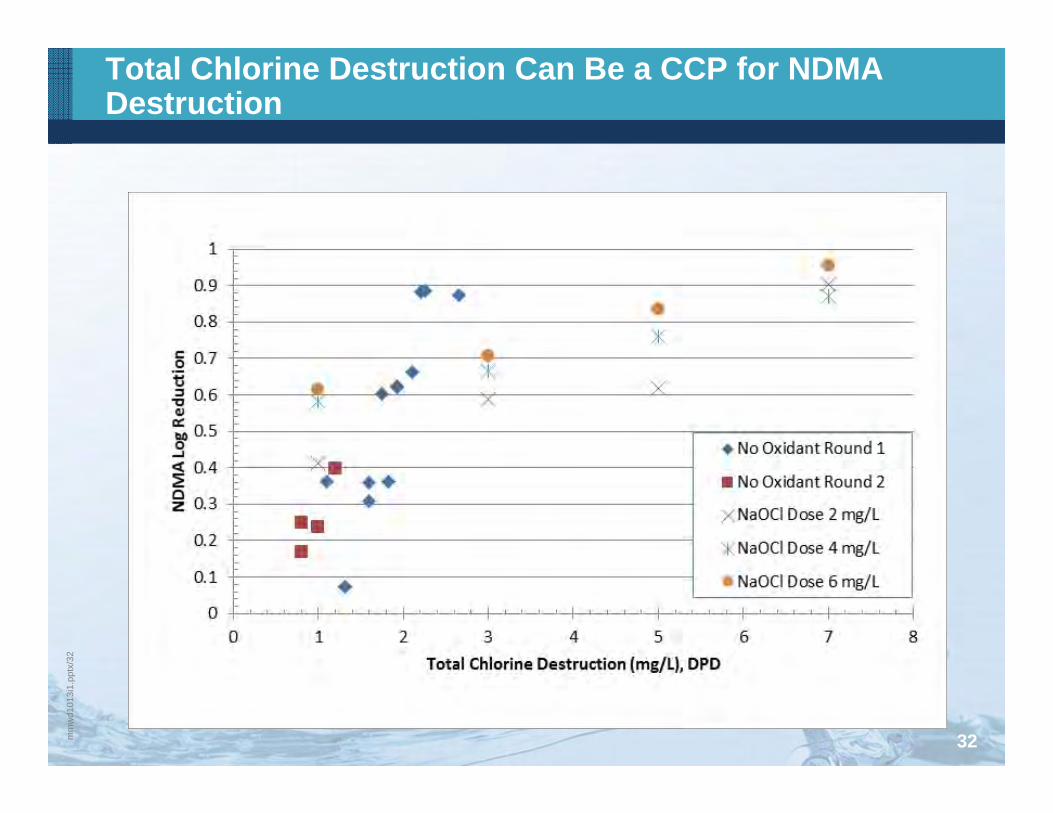
2Total Chlorine Destruction Can Be a CCP for NDMADestruction
32
mm
wd1
013i
1.pp
tx/3
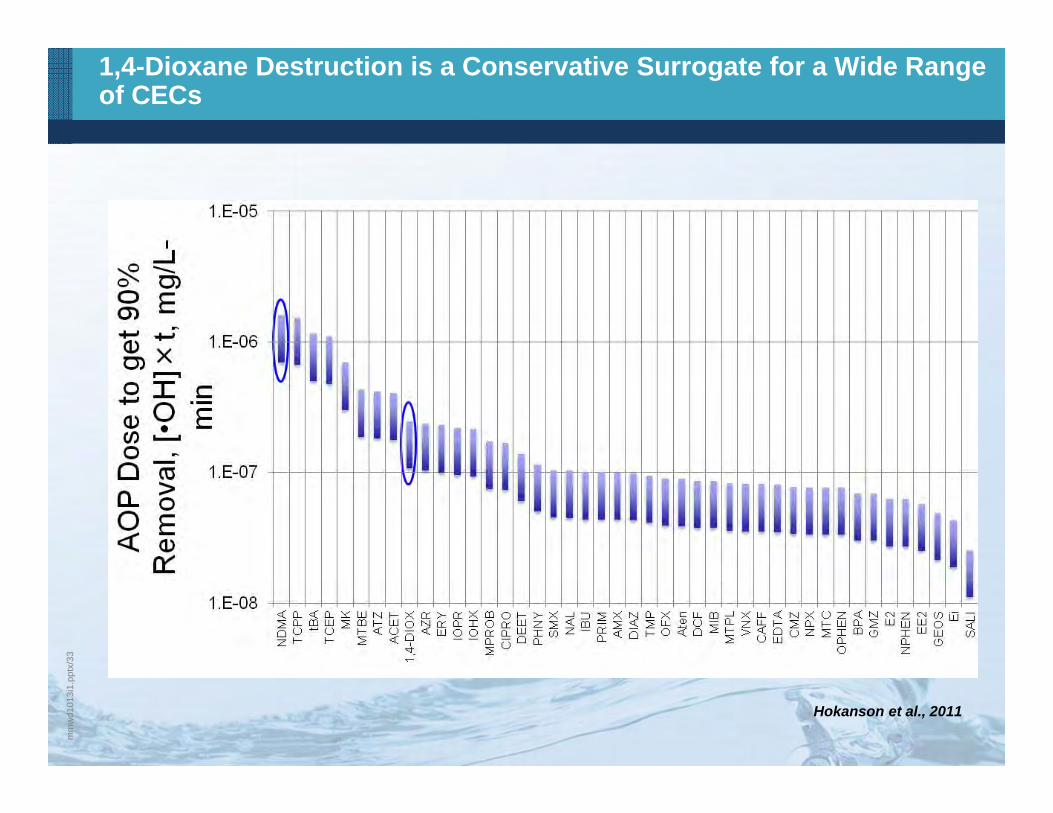
31,4-Dioxane Destruction is a Conservative Surrogate for a Wide Range of CECs
Hokanson et al., 2011
mm
wd1
013i
1.pp
tx/3
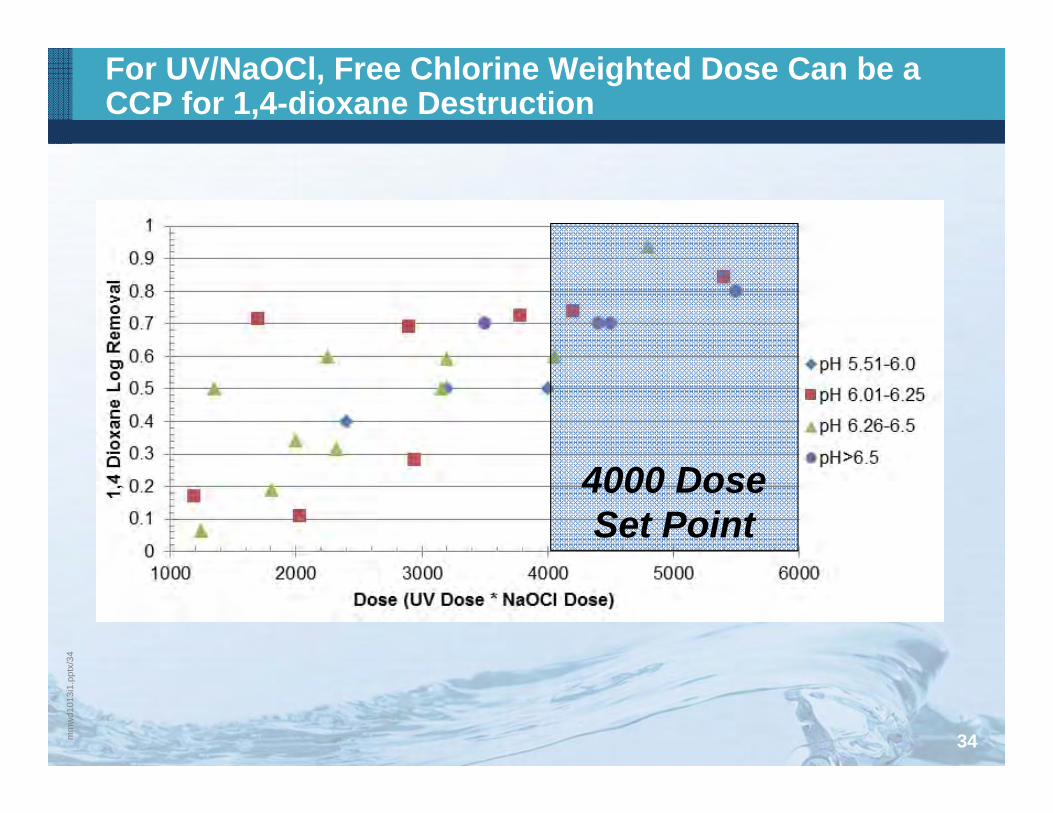
4For UV/NaOCl, Free Chlorine Weighted Dose Can be a CCP for 1,4-dioxane Destruction
34
4000 Dose Set Point
mm
wd1
013i
1.pp
tx/3
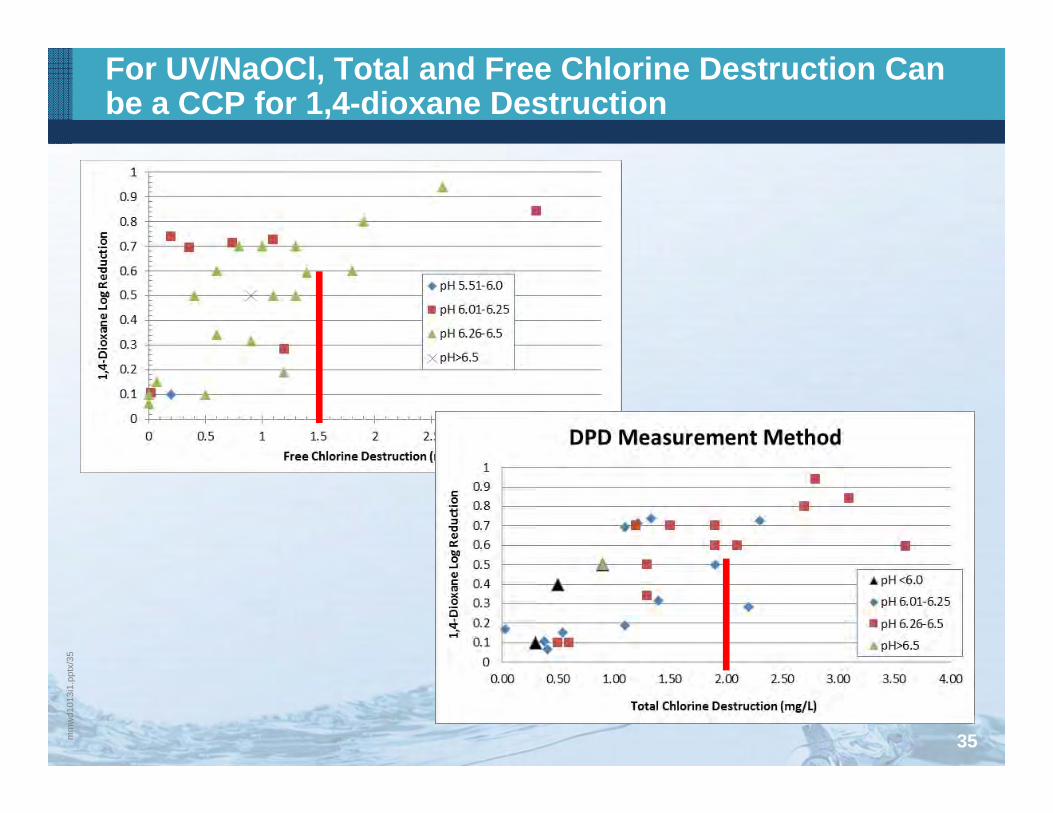
5For UV/NaOCl, Total and Free Chlorine Destruction Can be a CCP for 1,4-dioxane Destruction
35
mm
wd1
013i
1.pp
tx/3
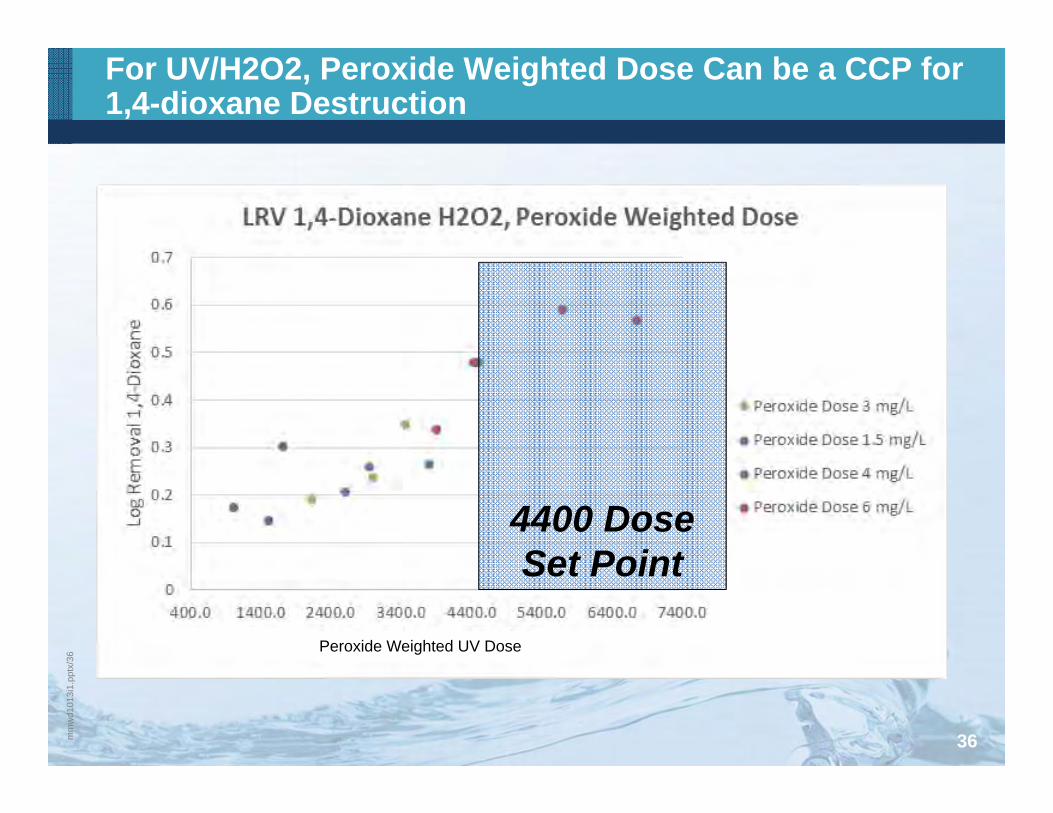
6For UV/H2O2, Peroxide Weighted Dose Can be a CCP for 1,4-dioxane Destruction
36
4400 Dose Set Point
Peroxide Weighted UV Dose

mm
wd1
013i
1.pp
tx/3
7Where Are We Going and How Do We Get There?
mm
wd1
013i
1.pp
tx/3
8
DkDkAOPPhotolysisCC
OHdo
''exp
][][][][][
254)254(][3025.2'
exp
222222
33
25422
22
33
2222
HOkOHkCOkHCOkTOCk
DhcN
OHkDk
CC
HOOHCOHCOTOC
OHnmOHA
Cont
Contd
o
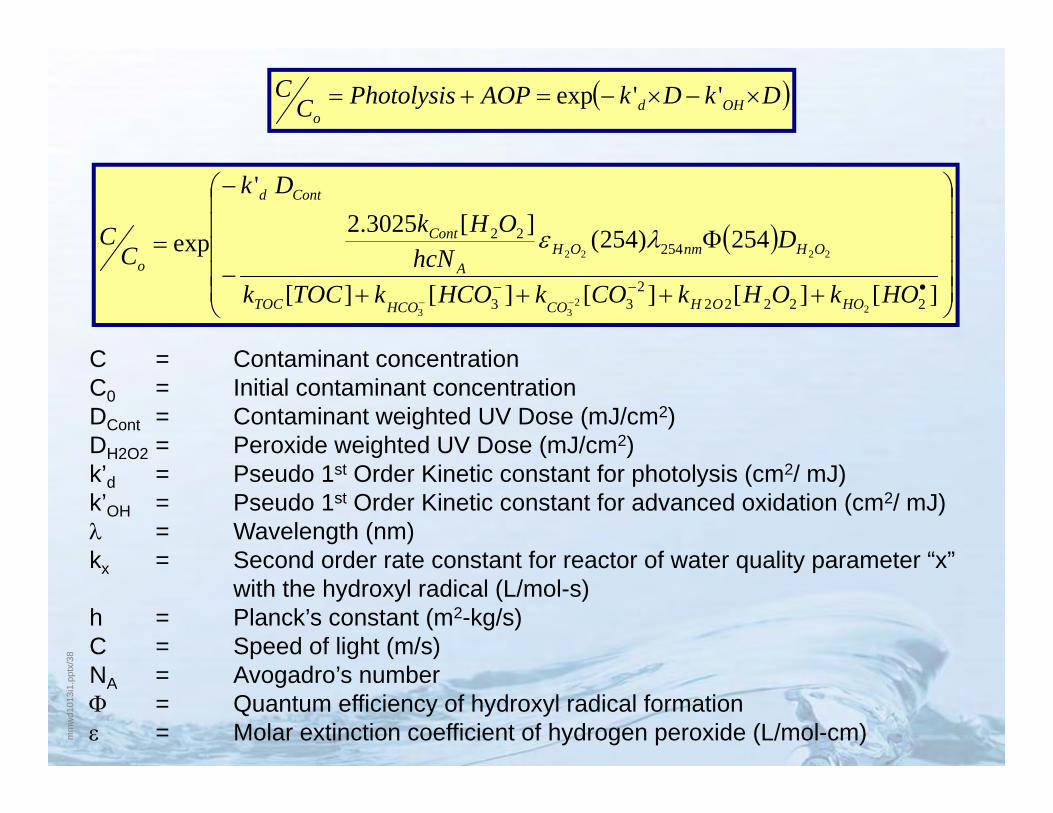
C = Contaminant concentrationC0 = Initial contaminant concentrationDCont = Contaminant weighted UV Dose (mJ/cm2)DH2O2 = Peroxide weighted UV Dose (mJ/cm2)k’d = Pseudo 1st Order Kinetic constant for photolysis (cm2/ mJ)k’OH = Pseudo 1st Order Kinetic constant for advanced oxidation (cm2/ mJ) = Wavelength (nm)kx = Second order rate constant for reactor of water quality parameter “x”
with the hydroxyl radical (L/mol-s)h = Planck’s constant (m2-kg/s)C = Speed of light (m/s)NA = Avogadro’s number = Quantum efficiency of hydroxyl radical formation = Molar extinction coefficient of hydrogen peroxide (L/mol-cm)
mm
wd1
013i
1.pp
tx/3
9
Conclusions and Research Needs
• CEC removal through WWTPs is reasonably predictable based upon chemical characteristics and operational configuration of the secondary process.
• More work is needed to correlate online surrogates for CEC removal with RO. This can be done through extensive monitoring and challenge studies, including failure analysis.
• New trends suggest good online surrogates for CEC removal by UV AOP. Further work on defining the impact of water quality variables, even in RO permeate, is needed.
mm
wd1
013i
1.pp
tx/4
0
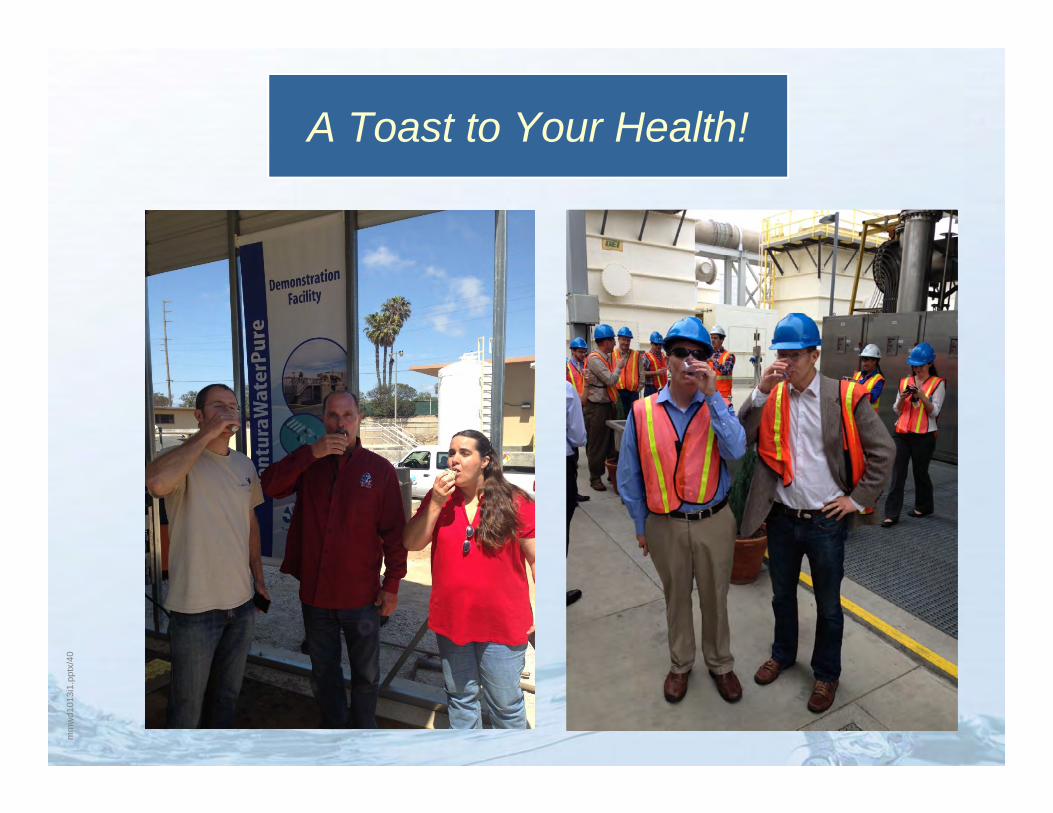
A Toast to Your Health!