Horizons Active Emerging Markets Bond ETF (HEMB:TSX) · Horizons Active Emerging Markets Bond ETF...
42
Horizons Active Emerging Markets Bond ETF (HEMB:TSX) Annual Report | December 31, 2018 www.HorizonsETFs.com Innovation is our capital. Make it yours. ACTIVE BENCHMARK BETAPRO
Transcript of Horizons Active Emerging Markets Bond ETF (HEMB:TSX) · Horizons Active Emerging Markets Bond ETF...

Horizons Active Emerging Markets Bond ETF(HEMB:TSX)
Annual Report | December 31, 2018
www.HorizonsETFs.comInnovation is our capital. Make it yours.
ACTIVE BENCHMARK BETAPRO
104644 – HEMB.indd 1 2019-03-11 3:18 PM
ContentsMANAGEMENT REPORT OF FUND PERFORMANCE
Management Discussion of Fund Performance . . . . . . . . . . . . . . . . . . . . . 1
Financial Highlights . . . . . . . . . . . . . . . . . . . . . . . . . . . . . . . . . . . . . . . . . . . . . . . 7
Past Performance . . . . . . . . . . . . . . . . . . . . . . . . . . . . . . . . . . . . . . . . . . . . . . . . . 10
Summary of Investment Portfolio . . . . . . . . . . . . . . . . . . . . . . . . . . . . . . . . . 12
MANAGER’S RESPONSIBILITY FOR FINANCIAL REPORTING . . . . . . . . . . . . 14
INDEPENDENT AUDITORS’ REPORT . . . . . . . . . . . . . . . . . . . . . . . . . . . . . . . . . . . . . 15
FINANCIAL STATEMENTS
Statement of Financial Position . . . . . . . . . . . . . . . . . . . . . . . . . . . . . . . . . . . 18
Statement of Comprehensive Income . . . . . . . . . . . . . . . . . . . . . . . . . . . . . 19
Statement of Changes in Financial Position . . . . . . . . . . . . . . . . . . . . . . . . 20
Statement of Cash Flows . . . . . . . . . . . . . . . . . . . . . . . . . . . . . . . . . . . . . . . . . . 21
Schedule of Investments . . . . . . . . . . . . . . . . . . . . . . . . . . . . . . . . . . . . . . . . . . 22
Notes to Financial Statements . . . . . . . . . . . . . . . . . . . . . . . . . . . . . . . . . . . . 26
104644 – HEMB.indd 3 2019-03-11 3:18 PM

Letter from the President and CEO:
For both Horizons ETFs and the Canadian ETF industry, 2018 marked another great year. The industry surpassed $157 billion in assets under management (“AUM”) and now has more than 770 ETF listings. Meanwhile, we launched seven new ETFs, giving us a total of 85 di�erent investment tools available for our clients – and ended the year with $9.9 billion of AUM.
In keeping with our mandate of bringing highly innovative ETF solutions to Canadian investors, we continued to focus on the future by expanding our lineup of thematic, technology-focused ETFs. Along with our existing robotics and arti�cial intelligence solutions, in 2018 we introduced the Horizons Blockchain Technology & Hardware Index ETF (“BKCH”), as well as the Horizons Industry 4.0 Index ETF (“FOUR”).
In 2018, we carried on our tradition of bringing �rst-of-their-kind ETFs to market in Canada, including the Horizons Conservative TRI ETF Portfolio (“HCON”) and the Horizons Balanced TRI ETF Portfolio (“HBAL”). These one-ticket ETF solutions are designed to provide instant diversi�cation and tax-e�cient returns for investors. We also launched Canada’s �rst actively managed emerging markets bond ETF – as well as our �rst socially responsible investing ETF.
This was also a very intriguing year in the cannabis investing space. To complement the world’s �rst and largest marijuana ETF: the Horizons Marijuana Life Sciences Index ETF (“HMMJ”), we introduced a small-cap marijuana ETF – the Horizons Emerging Marijuana Growers Index ETF (“HMJR”). In early September, we saw HMMJ’s AUM surpass the $1 billion threshold due to the impending legalization of recreational marijuana in October.
Along with expanding our o�erings, we recently lowered the management fees on six of our existing actively managed ETFs – giving unitholders in these funds the opportunity to keep more of their investment dollars.
Regardless of the direction of markets or interest rates, we have ETF solutions that allow investors of all types to customize their portfolio exposure. Markets do change, sometimes quickly, and our family of ETFs gives investors the tools they need to help meet their objectives. For information on all our strategies, please visit our website at www.HorizonsETFs.com where we o�er a range of resources designed to help you become a more educated ETF investor.
Thank you for your continued support and wishing you strong returns in 2019.
Steven J. Hawkins, President & CEO Horizons ETFs Management (Canada) Inc.
PS: I would like to take this opportunity to thank the dedicated team of professionals that I work with here at Horizons ETFs. My recognition as CEO of the Year at the 2018 Wealth Professional Awards is a testament to their tremendous talent and passion for ETFs.
104644 – HEMB.indd 4 2019-03-11 3:18 PM
1
Horizons Active Emerging Markets Bond ETF
MANAGEMENT REPORT OF FUND PERFORMANCE
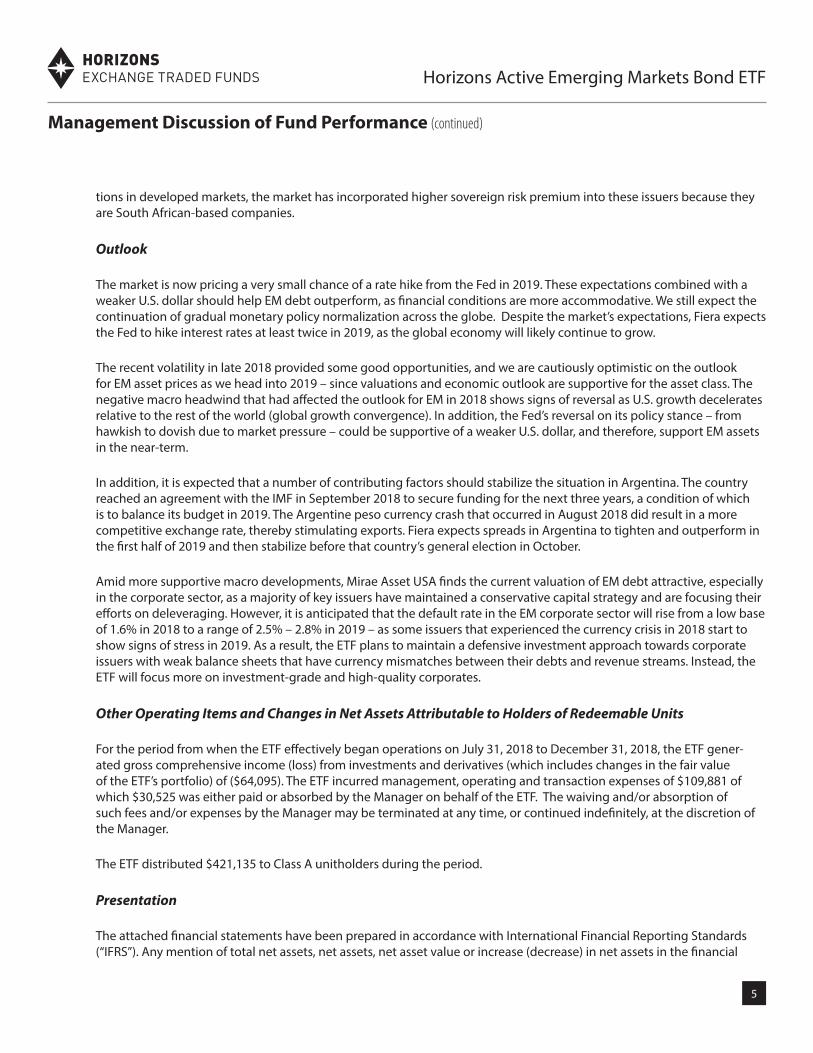
This annual management report of fund performance for Horizons Active Emerging Markets Bond ETF (“HEMB” or the “ETF”) contains �nancial highlights and is included with the audited annual �nancial statements for the investment fund. You may request a copy of the ETF’s unaudited interim or audited annual �nancial statements, interim or annual management report of fund performance, current proxy voting policies and procedures, proxy voting disclosure record, or quarterly portfolio disclosures, at no cost, from the ETF’s manager, Horizons ETFs Management (Canada) Inc. (“Hori-zons Management” or the “Manager”), by calling toll free 1-866-641-5739, or locally (416) 933-5745, by writing to us at: 55 University Avenue, Suite 800, Toronto ON, M5J 2H7, or by visiting our website at www.horizonsetfs.com or SEDAR at www.sedar.com.
This document may contain forward-looking statements relating to anticipated future events, results, circumstances, per-formance, or expectations that are not historical facts but instead represent our beliefs regarding future events. By their nature, forward-looking statements require us to make assumptions and are subject to inherent risks and uncertainties. There is signi�cant risk that predictions and other forward-looking statements will not prove to be accurate. We caution readers of this document not to place undue reliance on our forward-looking statements as a number of factors could cause actual future results, conditions, actions or events to di�er materially from the targets, expectations, estimates or intentions expressed or implied in the forward-looking statements.
Actual results may di�er materially from management expectations as projected in such forward-looking statements for a variety of reasons, including but not limited to market and general economic conditions, interest rates, regulatory and statutory developments, the e�ects of competition in the geographic and business areas in which the ETF may invest and the risks detailed from time to time in the ETF’s prospectus. New risk factors emerge from time to time and it is not pos-sible for management to predict all such risk factors. We caution that the foregoing list of factors is not exhaustive, and that when relying on forward-looking statements to make decisions with respect to investing in the ETF, investors and others should carefully consider these factors, as well as other uncertainties and potential events, and the inherent uncer-tainty of forward-looking statements. Due to the potential impact of these factors, the Manager does not undertake, and speci�cally disclaims, any intention or obligation to update or revise any forward-looking statements, whether as a result of new information, future events or otherwise, unless required by applicable law.
Management Discussion of Fund Performance
Investment Objective and Strategies
The investment objective of HEMB is to seek income and long-term capital growth by investing primarily in debt securi-ties of emerging market issuers. HEMB will invest in both �xed rate and �oating rate instruments issued by sovereign, quasi sovereign, supranational, and corporate issuers.
The Manager has engaged Fiera Capital Corporation (“Fiera”) and Mirae Asset Global Investments (USA) LLC (“Mirae Asset USA”) to act as sub-advisors to the ETF (together, the “Sub-Advisors”). The Sub-Advisors use fundamental sovereign and credit research to select countries, companies and instruments that, based on the views of the Sub-Advisors, are believed to o�er superior risk-adjusted returns relative to passively managed emerging market bond indexes. HEMB invests in a di-versi�ed portfolio of investment grade and non-investment grade emerging market debt securities which are believed by the Sub-Advisors to be undervalued given current market sentiment. When the Sub-Advisors believe that interest rates will increase, the Sub-Advisors may choose securities with shorter terms, and, conversely, when the Sub-Advisors believe that interest rates will decrease, the Sub-Advisors may choose securities with longer terms.
104644 – HEMB.indd 1 2019-03-11 3:18 PM

2
Horizons Active Emerging Markets Bond ETF
The Sub-Advisors seek diversi�cation by geographic region, country, credit rating and industry sector, and rely on their in-depth fundamental research, view of macroeconomic fundamentals, corporate credit analysis, analysis of the competitive position of countries and companies, and review of the total return relative to comparable countries, company risk and general market conditions, to select securities for the ETF.
The emerging market debt securities in which the ETF invests are primarily denominated in U.S. dollars, however, the ETF may also invest in emerging market debt securities denominated in applicable local foreign currencies. HEMB generally seeks to hedge its U.S. currency exposure back to the Canadian dollar at all times. HEMB may also hedge some or all of its other foreign currency exposure back to the Canadian dollar, at its discretion.
Risk
The Manager performs a review of the ETF’s risk rating at least annually, as well as when there is a material change in the ETF’s investment objective or investment strategies. The current risk rating for the ETF is: low to medium.
Risk ratings are determined based on the historical volatility of the ETF as measured by the standard deviation of its performance against its mean. The risk categorization of the ETF may change over time and historical volatility is not indicative of future volatility. Generally, a risk rating is assigned to the ETF based on a rolling 10-year standard deviation of its returns, the return of an underlying index, or of an applicable proxy. In cases where the Manager believes that this methodology produces a result that is not indicative of the ETF’s future volatility, the risk rating may be determined by the ETF’s category. Risk ratings are not intended for use as a substitute for undertaking a proper and complete suitability or �nancial assessment by an investment advisor.
The Manager, as a summary for existing investors, is providing the list below of the risks to which an investment in the ETF may be subject. Prospective investors should read the ETF’s most recent prospectus and consider the full descrip-tion of the risks contained therein before purchasing units.
The risks to which an investment in the ETF is subject are listed below and have not changed from the list of risks found in the ETF’s most recent prospectus. A full description of each risk listed below may also be found in the most recent prospectus. The most recent prospectus is available at www.horizonsetfs.com or from www.sedar.com, or by contacting Horizons ETFs Management (Canada) Inc. directly via the contact information on the back page of this document.
• Stock market risk• Speci�c issuer risk• Legal and regulatory risk• Exchange traded funds risk• Reliance on historical data risk• Corresponding net asset value risk• Designated broker/dealer risk• Cease trading of securities risk• Exchange risk• Early closing risk• No assurance of meeting investment objective• Tax risk
• Securities lending, repurchase and reverse repurchase transaction risk
• Loss of limited liability• Reliance on key personnel• Distributions risk• Con�icts of interest• No ownership interest• Market for units• Redemption price• Net asset value �uctuation• Limited operating history• Restrictions on certain unitholders
Management Discussion of Fund Performance (continued)
104644 – HEMB.indd 2 2019-03-11 3:18 PM

3
Horizons Active Emerging Markets Bond ETF
Management Discussion of Fund Performance (continued)
• Highly volatile markets• No guaranteed return• Interest rate risk• Foreign currency risk• Emerging markets risk• Credit risk• Foreign stock exchange risk
• High yield bond risk and risk of other lower rated investments
• Call risk• Risk of di�erence between quoted and actionable
market price• Liquidity risk
Results of Operations
For the period from when the ETF e�ectively began operations on July 31, 2018, to December 31, 2018, units of the ETF returned -1.07%, when including distributions paid to unitholders. This compares to a return of -1.87% for the J.P. Morgan Emerging Markets Bond Global Core Index (the “Index”) for the same period, in U.S. dollar terms.
The Index tracks liquid, U.S. dollar emerging market �xed and �oating-rate debt instruments issued by sovereign and quasi sovereign entities. The diversi�cation methodology limits the weights of the larger countries in the Index by only including a speci�ed portion of those countries’ eligible current face amounts of debt outstanding, thus providing a more even distribution of weights across the countries in the Index.
General Market Review
Contrary to the general market consensus of a “global synchronized growth” outlook at the beginning of 2018, the market witnessed strong U.S.-only growth momentum while the rest of the world experienced growth deceleration. This global growth divergence on the back of a pull-back by the global central bank stimulus, led by the U.S. Federal Reserve’s (the “Fed”) normalization policy, had a signi�cant impact on the market’s risk appetite – especially for Emerging Markets (“EM”).
Despite the improved external macro imbalances in a majority of EM countries, with the exception of a few outliers like Turkey and Argentina, strong U.S. economic growth and rising wages spurred the Fed to continue its tightening policy. It raised both short-term borrowing costs as well as strengthened the U.S. dollar. Consequently, a rising fear for the higher costs of servicing dollar-denominated debts and the limited accessibility of market funding for those emerging countries with tight liquidity, led to the sharp pull back of funds in EM investments.
Furthermore, trade tensions between the U.S. and China, which practically evolved from reconciling trade imbalances to a technology war and a struggle for global hegemony, raised fears of de-globalization. However, as time progressed, a more conciliatory rhetoric between the two countries, partly due to the slowdown in their respective domestic econo-mies and internal political pressures, abated the market’s concern for a possible disruption in the global trade system.
During the fourth quarter, the U.S. stock market, which was resilient to macro developments in the beginning of the year, started to give in to the market’s concerns of a global slowdown and tightening liquidity conditions. The concern, com-bined with slower economic data raised the prospects for a possible pause in the Fed’s normalization policy. This, in turn, helped reverse the negative market sentiments for EM assets towards the end of the year.
Outside of the general EM market trends, speci�c country issues had varying impacts on EM investments. Turkish bonds and the Lira were highly volatile as its central bank raised its benchmark interest rate by 625 basis points (“bps”) in one shot in September in an e�ort to control the country’s 15-year high in�ation rate. While the country did experience severe
104644 – HEMB.indd 3 2019-03-11 3:18 PM

4
market pressure in the �rst half of the year, it did recover in the second half of the year and was the best-performing country in the EM space.
Meanwhile, Argentinian President Mauricio Macri launched new austerity measures, including an increased export tax on soybeans and a halving of the number of government agencies. The announcement was made in an e�ort to restore investor con�dence amid a 20% fall in the value of the Peso after Macri asked the International Monetary Fund (the “IMF”) to speed up the release of funds that are part of its US$50 billion bailout package, and following the central bank’s hiking of its benchmark rate from 45% to 60%.
Finally, the new president of Mexico decided to cancel the Mexico City airport project, following a referendum in which approximately one million Mexicans voted. This event caused an important sell-o� in Mexican assets. The new adminis-tration decided to do a tender o�er to buy back a third of each series of the Mexico City Airport bonds at 100. The tender o�er was well-received by market participants and a rally in Mexican assets followed.
In general, high beta issuers such as Argentina, oil-exporting issuers from Africa and Middle East regions and issuers with idiosyncratic risks such as Costa Rica and Mexico were a drag on overall performance.
Sovereign Debt Portfolio Review
Mexico City Airport issues were highly bene�cial to the ETF’s returns, as the Mexican government o�ered to buy back a third of all the series at par; the ETF being overweight these issues bene�ted from it. That said, other Mexican sovereign debt detracted from performance. Argentina was also a detractor of performance, as the general risk-o� tone negatively impacted the country’s credit spread.
The ETF is overweight the Argentina sovereign sector heading into 2019 as both Sub-Advisors �nd its valuations to be at-tractive. The ETF is proceeding on the thesis that Argentina has been through the worst of its economic problems and its outlook is now positive. The Macri administration is moving toward a balanced budget and has secured a �nancing deal with the IMF. We also believe the central bank of Argentina will succeed in its battle against high in�ation. The biggest risk for Argentina in 2019 is a global economic slowdown and a general election in October 2019.
Mexican bonds (in local currency) are also one of Fiera’s highest convictions in the portfolio. It is expected that lower in�a-tion in Mexico will lead to lower rates in the short end of the curve, as the market will anticipate a higher probability of a rate cut by the Mexican central bank.
The ETF has no sovereign debt exposure to Russia, which is the biggest underweight position in the portfolio. Fiera ex-pects to hear more noise around potential sanctions on the country.
Corporate Debt Portfolio Review
Due to quickly deteriorating market sentiment toward EM assets in the second half of the year, the ETF reduced its expo-sure to lower-quality corporate issuers with weak balance sheets and maintained a conservative investment approach to high-beta issuers in Africa and the Middle East.
Going into 2019, the ETF is overweight South African and Israeli corporate bonds. The ETF has overweight positions on two South African corporate issuers, Naspers Ltd. and Sasol Ltd., as Mirae Asset USA �nds their valuations to be attractive, given their solid credit pro�le. Even though both issuers generate a majority of their cash �ows from their overseas opera-
Management Discussion of Fund Performance (continued)
Horizons Active Emerging Markets Bond ETF
104644 – HEMB.indd 4 2019-03-11 3:18 PM
5
Management Discussion of Fund Performance (continued)
tions in developed markets, the market has incorporated higher sovereign risk premium into these issuers because they are South African-based companies.
Outlook
The market is now pricing a very small chance of a rate hike from the Fed in 2019. These expectations combined with a weaker U.S. dollar should help EM debt outperform, as �nancial conditions are more accommodative. We still expect the continuation of gradual monetary policy normalization across the globe. Despite the market’s expectations, Fiera expects the Fed to hike interest rates at least twice in 2019, as the global economy will likely continue to grow.
The recent volatility in late 2018 provided some good opportunities, and we are cautiously optimistic on the outlook for EM asset prices as we head into 2019 – since valuations and economic outlook are supportive for the asset class. The negative macro headwind that had a�ected the outlook for EM in 2018 shows signs of reversal as U.S. growth decelerates relative to the rest of the world (global growth convergence). In addition, the Fed’s reversal on its policy stance – from hawkish to dovish due to market pressure – could be supportive of a weaker U.S. dollar, and therefore, support EM assets in the near-term.
In addition, it is expected that a number of contributing factors should stabilize the situation in Argentina. The country reached an agreement with the IMF in September 2018 to secure funding for the next three years, a condition of which is to balance its budget in 2019. The Argentine peso currency crash that occurred in August 2018 did result in a more competitive exchange rate, thereby stimulating exports. Fiera expects spreads in Argentina to tighten and outperform in the �rst half of 2019 and then stabilize before that country’s general election in October.
Amid more supportive macro developments, Mirae Asset USA �nds the current valuation of EM debt attractive, especially in the corporate sector, as a majority of key issuers have maintained a conservative capital strategy and are focusing their e�orts on deleveraging. However, it is anticipated that the default rate in the EM corporate sector will rise from a low base of 1.6% in 2018 to a range of 2.5% – 2.8% in 2019 – as some issuers that experienced the currency crisis in 2018 start to show signs of stress in 2019. As a result, the ETF plans to maintain a defensive investment approach towards corporate issuers with weak balance sheets that have currency mismatches between their debts and revenue streams. Instead, the ETF will focus more on investment-grade and high-quality corporates.
Other Operating Items and Changes in Net Assets Attributable to Holders of Redeemable Units
For the period from when the ETF e�ectively began operations on July 31, 2018 to December 31, 2018, the ETF gener-ated gross comprehensive income (loss) from investments and derivatives (which includes changes in the fair value of the ETF’s portfolio) of ($64,095). The ETF incurred management, operating and transaction expenses of $109,881 of which $30,525 was either paid or absorbed by the Manager on behalf of the ETF. The waiving and/or absorption of such fees and/or expenses by the Manager may be terminated at any time, or continued inde�nitely, at the discretion of the Manager.
The ETF distributed $421,135 to Class A unitholders during the period.
Presentation
The attached �nancial statements have been prepared in accordance with International Financial Reporting Standards (“IFRS”). Any mention of total net assets, net assets, net asset value or increase (decrease) in net assets in the �nancial
Horizons Active Emerging Markets Bond ETF
104644 – HEMB.indd 5 2019-03-11 3:18 PM
6
Management Discussion of Fund Performance (continued)
Horizons Active Emerging Markets Bond ETF
statements and/or management report of fund performance is referring to net assets or increase (decrease) in net assets attributable to holders of redeemable units as reported under IFRS.
Recent Developments
There are no recent industry, management or ETF related developments that are pertinent to the present and future of the ETF.
Related Party Transactions
Certain services have been provided to the ETF by related parties and those relationships are described below.
Manager, Trustee and Investment Manager
The manager, trustee and investment manager of the ETF is Horizons ETFs Management (Canada) Inc., 55 University Av-enue, Suite 800, Toronto, Ontario, M5J 2H7, a corporation incorporated under the laws of Ontario. Horizons Management is a member of the Mirae Asset Financial Group based in Seoul, South Korea.
If the ETF invests in other Horizons Management ETFs, Horizons Management may receive management fees in respect of the ETF’s assets invested in such Horizons Management ETFs. In addition, any management fees paid to the Manager (de-scribed in detail on page 9) are related party transactions, as the Manager is considered to be a related party to the ETF. Fees paid to the Independent Review Committee are also considered to be related party transactions. Both the manage-ment fees and fees paid to the Independent Review Committee are disclosed in the statement of comprehensive income in the attached �nancial statements of the ETF. The management fees payable by the ETF as at December 31, 2018, are disclosed in the statement of �nancial position.
104644 – HEMB.indd 6 2019-03-11 3:18 PM
7
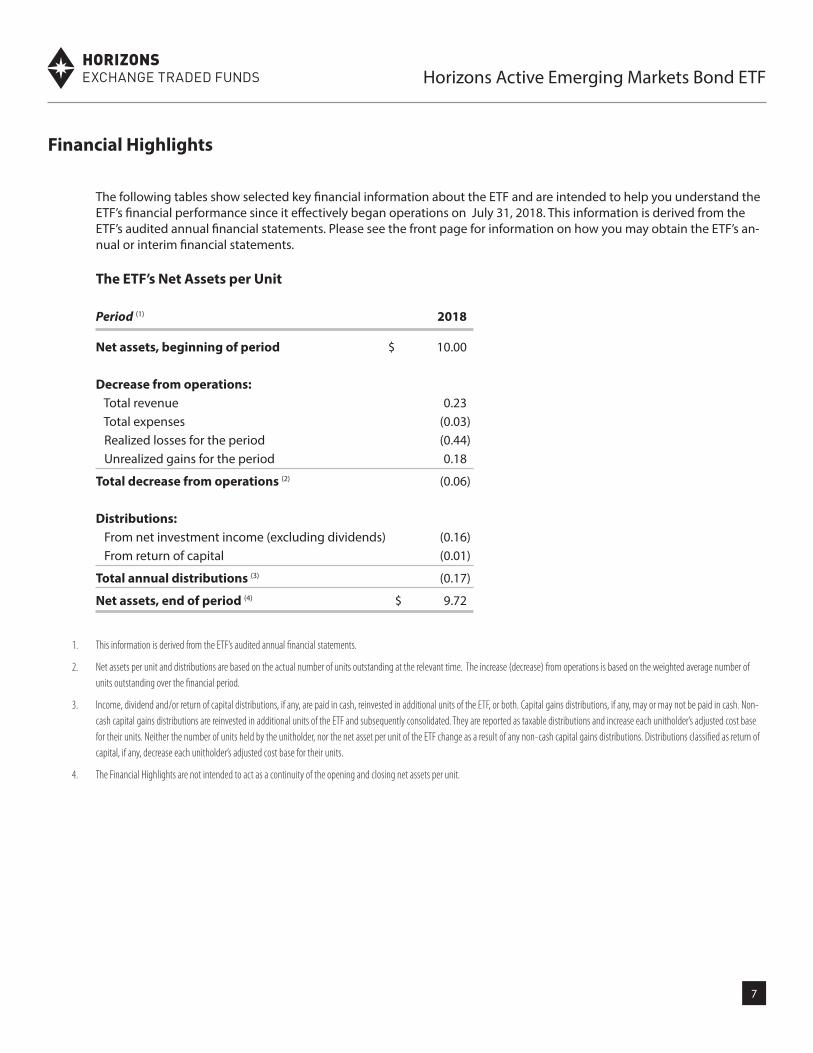
The following tables show selected key �nancial information about the ETF and are intended to help you understand the ETF’s �nancial performance since it e�ectively began operations on July 31, 2018. This information is derived from the ETF’s audited annual �nancial statements. Please see the front page for information on how you may obtain the ETF’s an-nual or interim �nancial statements.
The ETF’s Net Assets per Unit
Period (1) 2018
Net assets, beginning of period $ 10.00
Decrease from operations: Total revenue 0.23 Total expenses (0.03) Realized losses for the period (0.44) Unrealized gains for the period 0.18
Total decrease from operations (2) (0.06)
Distributions: From net investment income (excluding dividends) (0.16) From return of capital (0.01)
Total annual distributions (3) (0.17)
Net assets, end of period (4) $ 9.72
1. This information is derived from the ETF’s audited annual �nancial statements.
2. Net assets per unit and distributions are based on the actual number of units outstanding at the relevant time. The increase (decrease) from operations is based on the weighted average number of units outstanding over the �nancial period.
3. Income, dividend and/or return of capital distributions, if any, are paid in cash, reinvested in additional units of the ETF, or both. Capital gains distributions, if any, may or may not be paid in cash. Non-cash capital gains distributions are reinvested in additional units of the ETF and subsequently consolidated. They are reported as taxable distributions and increase each unitholder’s adjusted cost base for their units. Neither the number of units held by the unitholder, nor the net asset per unit of the ETF change as a result of any non-cash capital gains distributions. Distributions classi�ed as return of capital, if any, decrease each unitholder’s adjusted cost base for their units.
4. The Financial Highlights are not intended to act as a continuity of the opening and closing net assets per unit.
Financial Highlights
Horizons Active Emerging Markets Bond ETF
104644 – HEMB.indd 7 2019-03-11 3:18 PM

8
Ratios and Supplemental Data
Period (1) 2018
Total net asset value (000’s) $ 24,575Number of units outstanding (000’s) 2,527Management expense ratio (2) 0.67%Management expense ratio before waivers and absorptions (3) 0.98%Trading expense ratio (4) 0.05%Portfolio turnover rate (5) 81.92%Net asset value per unit, end of period $ 9.72Closing market price $ 9.61
1. This information is provided as at December 31, 2018.
2. Management expense ratio is based on total expenses, including sales tax, (excluding commissions and other portfolio transaction costs) for the stated period and is expressed as an annualized per-centage of daily average net asset value during the period. Out of its management fees, the Manager pays for such services to the ETF as investment manager compensation, service fees and marketing.
3. The Manager, at its discretion, may waive and/or absorb a portion of the fees and/or expenses otherwise payable by the ETF. The waiving and/or absorption of such fees and/or expenses by the Manager may be terminated at any time, or continued inde�nitely, at the discretion of the Manager.
4. The trading expense ratio represents total commissions and other portfolio transaction costs expressed as an annualized percentage of daily average net asset value during the period. Transaction costs related to the purchase and/or sale of �xed income securities are typically imbedded in the price of those transactions and are therefore not included in the trading expense ratio.
5. The ETF’s management expense ratio (MER) and trading expense ratio (TER) include an estimated proportion of the MER and TER for any underlying investment funds held in the ETF’s portfolio during the period.
6. The ETF’s portfolio turnover rate indicates how actively its portfolio investments are traded. A portfolio turnover rate of 100% is equivalent to the ETF buying and selling all of the securities in its port-folio once in the course of the year. Generally, the higher the ETF’s portfolio turnover rate in a year, the greater the trading costs payable by the ETF in the year, and the greater the chance of an investor receiving taxable capital gains in the year. There is not necessarily a relationship between a high turnover rate and the performance of the ETF.
Financial Highlights (continued)
Horizons Active Emerging Markets Bond ETF
104644 – HEMB.indd 8 2019-03-11 3:18 PM

9
Management Fees
The Manager provides, or oversees the provision of, administrative services required by the ETF including, but not limited to: negotiating contracts with certain third-party service providers, such as portfolio managers, custodians, registrars, transfer agents, auditors and printers; authorizing the payment of operating expenses incurred on behalf of the ETF; arranging for the maintenance of accounting records for the ETF; preparing reports to unitholders and to the applicable securities regulatory authorities; calculating the amount and determining the frequency of distributions by the ETF; pre-paring �nancial statements, income tax returns and �nancial and accounting information as required by the ETF; ensuring that unitholders are provided with �nancial statements and other reports as are required from time to time by applicable law; ensuring that the ETF complies with all other regulatory requirements, including the continuous disclosure obliga-tions of the ETF under applicable securities laws; administering purchases, redemptions and other transactions in units of the ETF; and dealing and communicating with unitholders of the ETF. The Manager provides o�ce facilities and personnel to carry out these services, if not otherwise furnished by any other service provider to the ETF. The Manager also monitors the investment strategies of the ETF to ensure that the ETF complies with its investment objectives, investment strategies and investment restrictions and practices.
In consideration for the provision of these services, the Manager receives a monthly management fee at the annual rate of 0.55%, plus applicable sales taxes, of the net asset value of the ETF’s Class A units, calculated and accrued daily and payable monthly in arrears.
The Sub-Advisor is compensated for its services out of the management fees without any further cost to the ETF. Any expenses of the ETF which are waived or absorbed by the Manager are paid out of the management fees received by the Manager.
The table below details, in percentage terms, the services received by the ETF from the Manager in consideration of the management fees paid during the period.
Marketing
Portfolio management fees, general administrative costs
and pro�t
Waived/absorbed expenses of the ETF
5% 46% 49%
Financial Highlights (continued)
Horizons Active Emerging Markets Bond ETF
104644 – HEMB.indd 9 2019-03-11 3:18 PM

10
Commissions, trailing commissions, management fees, expenses and applicable sales taxes all may be associated with an investment in the ETF. Please read the prospectus before investing. The indicated rates of return are the historical total returns including changes in unit value and reinvestment of all distributions, and do not take into account sales, redemp-tions, distributions or optional charges or income taxes payable by any investor that would have reduced returns. An investment in the ETF is not guaranteed. Its value changes frequently and past performance may not be repeated. The ETF’s performance numbers assume that all distributions, if any, are reinvested in additional units of the ETF. If you hold this ETF outside of a registered plan, income and capital gains distributions that are paid to you increase your income for tax purposes whether paid to you in cash or reinvested in additional units. The amount of the reinvested taxable distribu-tions is added to the adjusted cost base of the units that you own. This would decrease your capital gain or increase your capital loss when you later redeem from the ETF, thereby ensuring that you are not taxed on this amount again. Please consult your tax advisor regarding your personal tax situation.
Year-by-Year Returns
The following chart presents the ETF’s performance for its Class A units for the period shown. In percentage terms, the chart shows how much an investment made on the �rst day of the �nancial period would have grown or decreased by the last day of the �nancial period.
2018HEMB -1.07%
-3.00%
-2.00%
-1.00%
0.00%
1.00%
Rate
of R
etur
n
The ETF e�ectively began operations on July 31, 2018.
Past Performance
Horizons Active Emerging Markets Bond ETF
104644 – HEMB.indd 10 2019-03-11 3:18 PM
11
Past Performance (continued)
Horizons Active Emerging Markets Bond ETF
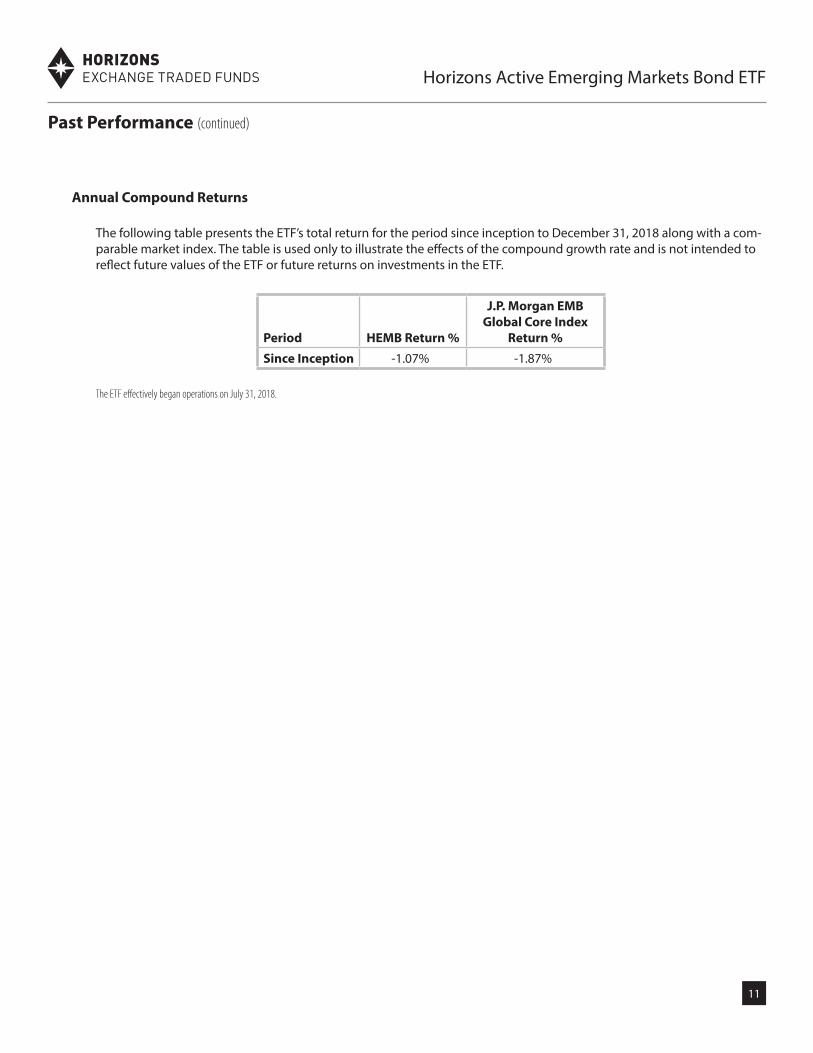
Annual Compound Returns
The following table presents the ETF’s total return for the period since inception to December 31, 2018 along with a com-parable market index. The table is used only to illustrate the e�ects of the compound growth rate and is not intended to re�ect future values of the ETF or future returns on investments in the ETF.
Period HEMB Return %
J.P. Morgan EMB Global Core Index
Return %
Since Inception -1.07% -1.87%
The ETF e�ectively began operations on July 31, 2018.
104644 – HEMB.indd 11 2019-03-11 3:18 PM

12
% of ETF’sAsset Mix Net Asset Value Net Asset Value
Global Fixed Income Securities $ 21,939,598 89.28%U.S. Fixed Income Securities 1,051,626 4.28%Currency Forward Hedge* (594,445) -2.42%Cash and Cash Equivalents 2,238,814 9.11%Other Assets less Liabilities (60,316) -0.25%
$ 24,575,277 100.00%
% of ETF’sSector Mix Net Asset Value Net Asset Value
Government Bonds $ 16,653,367 67.77%Corporate Bonds 6,054,114 24.63%Global Broad Fixed Income 283,743 1.16%Currency Forward Hedge* (594,445) -2.42%Cash and Cash Equivalents 2,238,814 9.11%Other Assets less Liabilities (60,316) -0.25%
$ 24,575,277 100.00%
*Positions in forward contracts are disclosed as the gain/(loss) that would be realized if the contracts were closed out on the date of this report.
Summary of Investment PortfolioAs at December 31, 2018
Horizons Active Emerging Markets Bond ETF
104644 – HEMB.indd 12 2019-03-11 3:18 PM
13
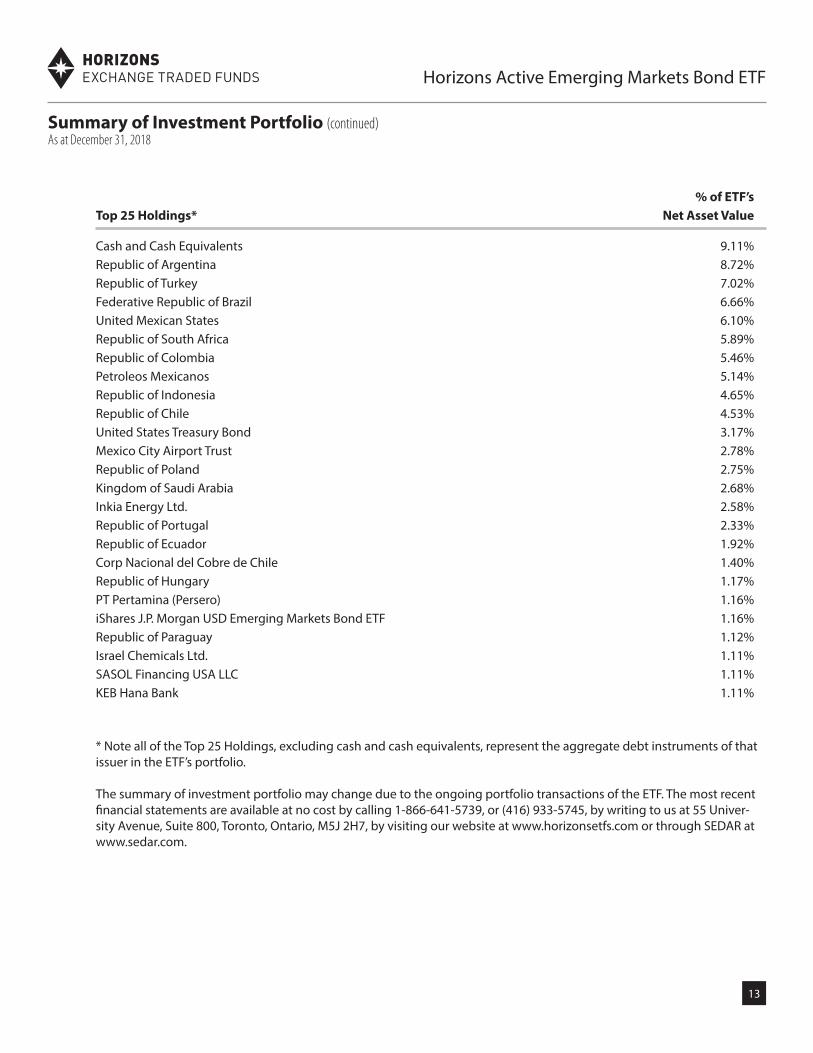
% of ETF’sTop 25 Holdings* Net Asset Value
Cash and Cash Equivalents 9.11%Republic of Argentina 8.72%Republic of Turkey 7.02%Federative Republic of Brazil 6.66%United Mexican States 6.10%Republic of South Africa 5.89%Republic of Colombia 5.46%Petroleos Mexicanos 5.14%Republic of Indonesia 4.65%Republic of Chile 4.53%United States Treasury Bond 3.17%Mexico City Airport Trust 2.78%Republic of Poland 2.75%Kingdom of Saudi Arabia 2.68%Inkia Energy Ltd. 2.58%Republic of Portugal 2.33%Republic of Ecuador 1.92%Corp Nacional del Cobre de Chile 1.40%Republic of Hungary 1.17%PT Pertamina (Persero) 1.16%iShares J.P. Morgan USD Emerging Markets Bond ETF 1.16%Republic of Paraguay 1.12%Israel Chemicals Ltd. 1.11%SASOL Financing USA LLC 1.11%KEB Hana Bank 1.11%
* Note all of the Top 25 Holdings, excluding cash and cash equivalents, represent the aggregate debt instruments of that issuer in the ETF’s portfolio.
The summary of investment portfolio may change due to the ongoing portfolio transactions of the ETF. The most recent �nancial statements are available at no cost by calling 1-866-641-5739, or (416) 933-5745, by writing to us at 55 Univer-sity Avenue, Suite 800, Toronto, Ontario, M5J 2H7, by visiting our website at www.horizonsetfs.com or through SEDAR at www.sedar.com.
Summary of Investment Portfolio (continued)As at December 31, 2018
Horizons Active Emerging Markets Bond ETF
104644 – HEMB.indd 13 2019-03-11 3:18 PM

14
MANAGER’S RESPONSIBILITY FOR FINANCIAL REPORTING
The accompanying audited annual �nancial statements of Horizons Active Emerging Markets Bond ETF (the “ETF”) are the re-sponsibility of the manager and trustee to the ETF, Horizons ETFs Management (Canada) Inc. (the “Manager”). They have been prepared in accordance with International Financial Reporting Standards using information available and include certain amounts that are based on the Manager’s best estimates and judgements.
The Manager has developed and maintains a system of internal controls to provide reasonable assurance that all assets are safeguarded and to produce relevant, reliable and timely �nancial information, including the accompanying �nancial statements.
These �nancial statements have been approved by the Board of Directors of the Manager. These �nancial statements have been approved by the Board of Directors of the Manager and have been audited by KPMG LLP, Chartered Professional Accountants, Licensed Public Accountants, on behalf of unitholders. The independent auditors’ report outlines the scope of their audit and their opinion on the �nancial statements.
________________________ ________________________Steven J. Hawkins Peter LeeDirector DirectorHorizons ETFs Management (Canada) Inc. Horizons ETFs Management (Canada) Inc.
Horizons Active Emerging Markets Bond ETF
104644 – HEMB.indd 14 2019-03-11 3:18 PM

15
Horizons Active Emerging Markets Bond ETF
INDEPENDENT AUDITORS’ REPORT
To the Unitholders of Horizons Active Emerging Markets Bond ETF (the “ETF”)
Opinion
We have audited the �nancial statements of the ETF, which comprise the statement of �nancial position as at December 31, 2018, the statements of comprehensive income, changes in �nancial position and cash �ows for the period from inception on July 23, 2018 to December 31, 2018, and notes to the �nancial statements, including a summary of signi�cant accounting policies (hereinafter referred to as the “�nancial statements”).
In our opinion, the accompanying �nancial statements present fairly, in all material respects, the �nancial position of the ETF as at December 31, 2018, and its �nancial performance and its cash �ows for the period from inception on July 23, 2018 to December 31, 2018 in accordance with International Financial Reporting Standards.
Basis for Opinion
We conducted our audit in accordance with Canadian generally accepted auditing standards. Our responsibilities under those standards are further described in the “Auditors’ Responsibilities for the Audit of the Financial Statements” section of our auditors’ report.
We are independent of the ETF in accordance with the ethical requirements that are relevant to our audit of the �nancial statements in Canada and we have ful�lled our other ethical responsibilities in accordance with these requirements.
We believe that the audit evidence we have obtained is su�cient and appropriate to provide a basis for our opinion.
Other Information
Management is responsible for the other information. Other information comprises:
• the information included in the Management Report of Fund Performance �led with the relevant Canadian Securities Commissions.
Our opinion on the �nancial statements does not cover the other information and we do not and will not express any form of assurance conclusion thereon.
In connection with our audit of the �nancial statements, our responsibility is to read the other information identi�ed above and, in doing so, consider whether the other information is materially inconsistent with the �nancial statements or our knowledge obtained in the audit and remain alert for indications that the other information appears to be materially misstated.
We obtained the information in the Management Report of Fund Performance �led with the relevant Canadian Securities Commissions as at the date of this auditors’ report. If, based on the work we have performed on this other information, we conclude that there is a material misstatement of this other information, we are required to report that fact in the auditors’ report.
We have nothing to report in this regard.
104644 – HEMB.indd 15 2019-03-11 3:18 PM

16
Horizons Active Emerging Markets Bond ETF
Responsibilities of Management and Those Charged with Governance for the Financial Statements
Management is responsible for the preparation and fair presentation of the �nancial statements in accordance with International Financial Reporting Standards, and for such internal control as management determines is necessary to enable the preparation of �nancial statements that are free from material misstatement, whether due to fraud or error.
In preparing the �nancial statements, management is responsible for assessing the ETF’s ability to continue as a going concern, disclosing as applicable, matters related to going concern and using the going concern basis of accounting unless management either intends to liquidate the ETF or to cease operations, or has no realistic alternative but to do so.
Those charged with governance are responsible for overseeing the ETF’s �nancial reporting process.
Auditors’ Responsibilities for the Audit of the Financial Statements
Our objectives are to obtain reasonable assurance about whether the �nancial statements as a whole are free from material misstatement, whether due to fraud or error, and to issue an auditors’ report that includes our opinion.
Reasonable assurance is a high level of assurance, but is not a guarantee that an audit conducted in accordance with Canadian generally accepted auditing standards will always detect a material misstatement when it exists.
Misstatements can arise from fraud or error and are considered material if, individually or in the aggregate, they could reasonably be expected to in�uence the economic decisions of users taken on the basis of the �nancial statements.
As part of an audit in accordance with Canadian generally accepted auditing standards, we exercise professional judgment and maintain professional skepticism throughout the audit.
We also:
• Identify and assess the risks of material misstatement of the �nancial statements, whether due to fraud or error, design and perform audit procedures responsive to those risks, and obtain audit evidence that is su�cient and appropriate to provide a basis for our opinion.
The risk of not detecting a material misstatement resulting from fraud is higher than for one resulting from error, as fraud may involve collusion, forgery, intentional omissions, misrepresentations, or the override of internal control.
• Obtain an understanding of internal control relevant to the audit in order to design audit procedures that are appropriate in the circumstances, but not for the purpose of expressing an opinion on the e�ectiveness of the ETF’s internal control.
• Evaluate the appropriateness of accounting policies used and the reasonableness of accounting estimates and related disclosures made by management.
• Conclude on the appropriateness of management’s use of the going concern basis of accounting and, based on the audit evidence obtained, whether a material uncertainty exists related to events or conditions that may cast signi�cant doubt on the ETF’s ability to continue as a going concern. If we conclude that a material uncertainty exists, we are required to draw attention in our auditors’ report to the related disclosures in the �nancial statements or, if such disclosures are inadequate, to modify our opinion. Our conclusions are based on the audit evidence obtained
104644 – HEMB.indd 16 2019-03-11 3:18 PM

17
Horizons Active Emerging Markets Bond ETF
up to the date of our auditors’ report. However, future events or conditions may cause the ETF to cease to continue as a going concern.
• Evaluate the overall presentation, structure and content of the �nancial statements, including the disclosures, and whether the �nancial statements represent the underlying transactions and events in a manner that achieves fair presentation.
• Communicate with those charged with governance regarding, among other matters, the planned scope and timing of the audit and signi�cant audit �ndings, including any signi�cant de�ciencies in internal control that we identify during our audit.
• Provide those charged with governance with a statement that we have complied with relevant ethical requirements regarding independence, and communicate with them all relationships and other matters that may reasonably be thought to bear on our independence, and where applicable, related safeguards.
Chartered Professional Accountants, Licensed Public Accountants The engagement partner on the audit resulting in this auditors’ report is Paritosh Gambhir. Toronto, Canada March 13, 2019
104644 – HEMB.indd 17 2019-03-11 3:18 PM

18
2018
Assets Cash and cash equivalents $ 2,238,814 Investments 22,991,224
Amounts receivable relating to accrued income 319,335 Amounts receivable relating to portfolio assets sold 1,071 Derivative assets (note 3) 24,149
Total assets 25,574,593
Liabilities Accrued management fees 12,935 Accrued operating expenses 2,089 Amounts payable for portfolio assets purchased 276,159 Distribution payable 89,539 Derivative liabilities (note 3) 618,594
Total liabilities 999,316
Total net assets (note 2) $ 24,575,277
Number of redeemable units outstanding (note 8) 2,527,201Total net assets per unit $ 9.72
(See accompanying notes to �nancial statements)
Approved on behalf of the Board of Directors of the Manager:
______________________ _______________________Steven J. Hawkins Peter LeeDirector Director
Statement of Financial PositionAs at December 31,
Horizons Active Emerging Markets Bond ETF
104644 – HEMB.indd 18 2019-03-11 3:18 PM

19
2018
Income Dividend income $ 11,051 Interest income for distribution purposes 547,840 Net realized loss on sale of investments and derivatives (1,428,031) Net realized gain on foreign exchange 364,473 Net change in unrealized appreciation of investments and derivatives 94,390 Net change in unrealized appreciation of foreign exchange 346,182
(64,095)
Expenses (note 9) Management fees 62,052 Audit fees 4,302 Independent Review Committee fees 379 Custodial and fund valuation fees 13,913 Securityholder reporting costs 8,968 Administration fees 4,251 Transaction costs 5,339 Withholding taxes 6,712 Other expenses 3,965
109,881
Amounts that were payable by the investment fund that were paid or absorbed by the Manager (30,525)
79,356
Decrease in net assets for the period $ (143,451)
Decrease in net assets per unit $ (0.06)
(See accompanying notes to �nancial statements)
Statement of Comprehensive IncomeFor the Period from Inception on July 23 to December 31, 2018
Horizons Active Emerging Markets Bond ETF
104644 – HEMB.indd 19 2019-03-11 3:18 PM
20
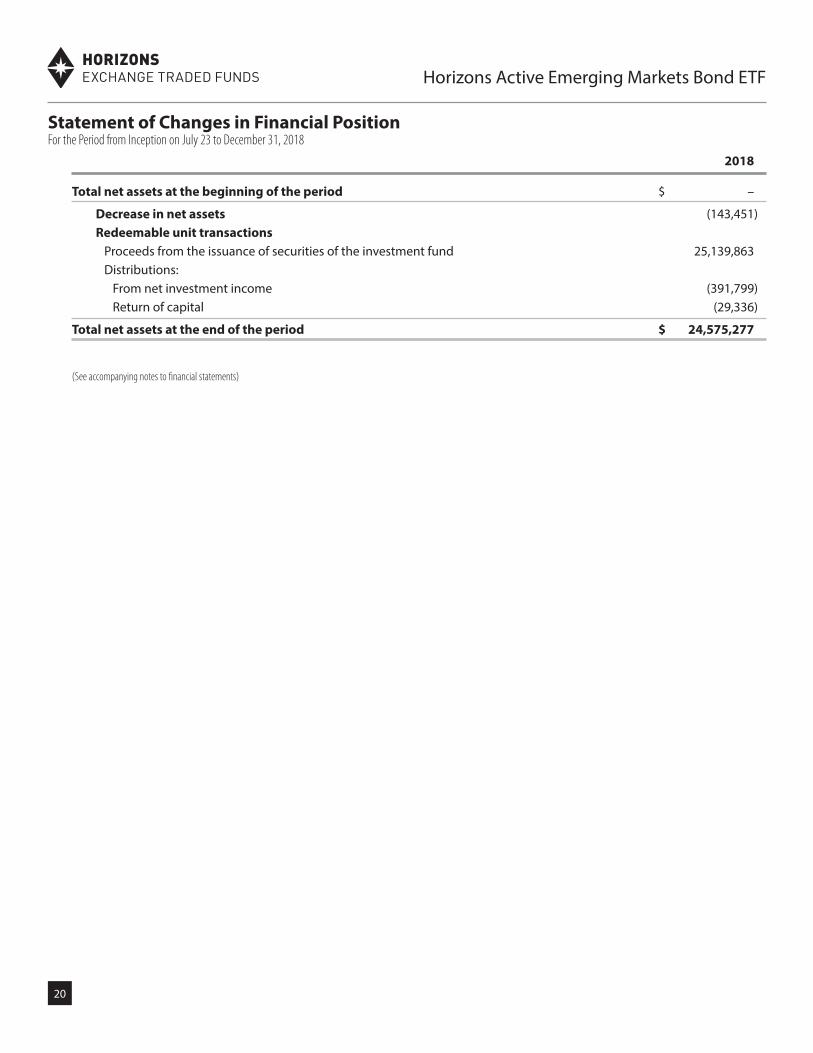
Statement of Changes in Financial PositionFor the Period from Inception on July 23 to December 31, 2018
2018
Total net assets at the beginning of the period $ –
Decrease in net assets (143,451)Redeemable unit transactions Proceeds from the issuance of securities of the investment fund 25,139,863 Distributions: From net investment income (391,799) Return of capital (29,336)
Total net assets at the end of the period $ 24,575,277
(See accompanying notes to �nancial statements)
Horizons Active Emerging Markets Bond ETF
104644 – HEMB.indd 20 2019-03-11 3:18 PM

21
Statement of Cash FlowsFor the Period from Inception on July 23 to December 31, 2018
2018
Cash �ows from operating activities:Decrease in net assets for the period $ (143,451)Adjustments for:
Net realized loss on sale of investments and derivatives 1,428,031 Net realized loss on currency forward contracts (767,719) Net change in unrealized appreciation of investments and derivatives (94,390) Net change in unrealized appreciation of foreign exchange (334,260) Purchase of investments (25,115,614) Proceeds from the sale of investments 16,136,896
Amounts receivable relating to accrued income (319,335)Accrued expenses 15,024
Net cash used in operating activities (9,194,818)
Cash �ows from �nancing activities: Amount received from the issuance of units 11,430,968 Distributions paid to unitholders (331,596)
Net cash from �nancing activities 11,099,372
Net increase in cash and cash equivalents during the period 1,904,554 E�ect of exchange rate �uctuations on cash and cash equivalents 334,260Cash and cash equivalents at beginning of period –
Cash and cash equivalents at end of period $ 2,238,814
Interest received, net of withholding taxes $ 227,952Dividends received, net of withholding taxes $ 4,891
(See accompanying notes to �nancial statements)
Horizons Active Emerging Markets Bond ETF
104644 – HEMB.indd 21 2019-03-11 3:18 PM

22
Par Value/ Average FairSecurity Shares/Contracts Cost Value
GLOBAL FIXED INCOME SECURITIES (89.28%)Mexico (16.07%) Alfa SAB de CV, Callable, 6.88%, 2044/03/25 200,000 $ 271,618 $ 268,944 Mexico City Airport Trust, Callable, 4.25%, 2026/10/31 249,000 308,681 304,670 Mexico City Airport Trust, Callable, 3.88%, 2028/04/30 195,000 231,410 235,200 Mexico City Airport Trust, Callable, 5.50%, 2047/07/31 118,000 132,506 142,368 Petroleos Mexicanos, Floating Rate, 6.42%, 2022/03/11 400,000 552,986 548,811 Petroleos Mexicanos, 5.35%, 2028/02/12 600,000 736,435 716,730 Uni�n Financiera SAB de CV SOFOM ENR, Callable, 7.38%, 2026/02/12 200,000 253,136 234,132 United Mexican States, Series ‘M’, 6.50%, 2021/06/10 30,000 187,472 199,129 United Mexican States, Series ‘M’, 6.50%, 2022/06/09 100,000 651,832 652,653 United Mexican States, Series ‘M20’, 7.50%, 2027/06/03 100,000 618,312 645,762
3,944,388 3,948,399
Argentina (9.56%) Provincia de Buenos Aires, 5.75%, 2019/06/15 150,000 193,510 205,548 Republic of Argentina, 5.63%, 2022/01/26 700,000 852,029 809,905 Republic of Argentina, 4.63%, 2023/01/11 200,000 234,646 216,555 Republic of Argentina, 3.38%, 2023/01/15 400,000 553,456 495,266 Republic of Argentina, 5.88%, 2028/01/11 200,000 197,656 197,271 Republic of Argentina, 5.25%, 2028/01/15 200,000 237,751 225,429 Republic of Argentina, 7.63%, 2046/04/22 200,000 203,018 199,012
2,472,066 2,348,986
Turkey (7.02%) Republic of Turkey, 6.25%, 2022/09/26 400,000 463,912 550,972 Republic of Turkey, 5.75%, 2024/03/22 400,000 463,618 529,367 Republic of Turkey, 6.00%, 2027/03/25 500,000 557,030 644,308
1,484,560 1,724,647
Brazil (6.66%) Federative Republic of Brazil, 2.63%, 2023/01/05 500,000 602,132 643,699 Federative Republic of Brazil, 6.00%, 2026/04/07 500,000 686,295 730,143 Federative Republic of Brazil, Callable, 4.63%, 2028/01/13 200,000 236,930 263,009
1,525,357 1,636,851
Colombia (6.57%) Republic of Colombia, 4.00%, 2024/02/26 500,000 652,337 676,627 Republic of Colombia, Callable, 3.88%, 2027/04/25 200,000 252,953 261,095 Republic of Colombia, Callable, Callable, 4.50%, 2029/03/15 300,000 383,130 405,464 SURA Asset Management SA, 4.88%, 2024/04/17 200,000 261,693 271,336
1,550,113 1,614,522
Schedule of Investments As at December 31, 2018
Horizons Active Emerging Markets Bond ETF
104644 – HEMB.indd 22 2019-03-11 3:18 PM

23
Chile (6.48%)Corp Nacional del Cobre de Chile, 3.75%, 2020/11/04 250,000 327,387 344,527
Enel Generacion Chile SA, Callable, 4.25%, 2024/04/15 100,000 130,242 134,547 Republic of Chile, 3.88%, 2020/08/05 325,000 430,793 449,072 Republic of Chile, 3.13%, 2025/03/27 500,000 630,631 664,538
1,519,053 1,592,684
South Africa (5.89%) Republic of South Africa, 5.50%, 2020/03/09 250,000 334,403 346,569 Republic of South Africa, 5.88%, 2022/05/30 400,000 547,633 567,244 Republic of South Africa, 4.67%, 2024/01/17 400,000 508,065 534,492
1,390,101 1,448,305
Indonesia (5.81%) PT Pertamina (Persero), 6.45%, 2044/05/30 200,000 268,780 286,052 Republic of Indonesia, 3.70%, 2022/01/08 400,000 518,924 541,196 Republic of Indonesia, 3.38%, 2023/04/15 200,000 253,284 264,667 Republic of Indonesia, 4.13%, 2025/01/15 250,000 322,838 336,670
1,363,826 1,428,585
Bermuda (3.61%) Inkia Energy Ltd., Callable, 5.88%, 2027/11/09 500,000 630,403 634,825 Tengizchevroil Finance Company International Ltd., Sinkable, 4.00%, 2026/08/15 200,000 248,762 252,731
879,165 887,556
Poland (2.75%) Republic of Poland, 3.00%, 2023/03/17 500,000 639,190 674,736
Saudi Arabia (2.68%) Kingdom of Saudi Arabia, 2.38%, 2021/10/26 500,000 625,243 658,478
Netherlands (2.44%) Myriad International Holdings BV, Callable, 4.85%, 2027/07/06 200,000 252,776 262,572 Petrobras Global Finance BV, Callable, 5.38%, 2021/01/27 79,000 105,251 109,900 Syngenta Finance NV, Callable, 5.68%, 2048/04/24 200,000 240,660 226,445
598,687 598,917
Portugal (2.33%) Republic of Portugal, 5.13%, 2024/10/15 400,000 546,526 572,989
Ecuador (1.92%) Republic of Ecuador, 8.88%, 2027/10/23 400,000 476,184 471,677
Par Value/ Average FairSecurity Shares/Contracts Cost Value
Schedule of Investments (continued)As at December 31, 2018
Horizons Active Emerging Markets Bond ETF
104644 – HEMB.indd 23 2019-03-11 3:18 PM

24
Par Value/ Average FairSecurity Shares/Contracts Cost Value
Schedule of Investments (continued)As at December 31, 2018
Hungary (1.17%)Republic of Hungary, 6.38%, 2021/03/29 200,000 279,061 288,569
Global Broad Fixed Income (1.16%) iShares J.P. Morgan USD Emerging Markets Bond ETF 2,000 281,794 283,743
Paraguay (1.12%) Republic of Paraguay, 4.63%, 2023/01/25 200,000 264,265 274,644
Israel (1.11%) Israel Chemicals Ltd., Callable, 6.38%, 2038/05/31 200,000 261,258 273,740
South Korea (1.11%) KEB Hana Bank, 4.25%, 2024/10/14 200,000 256,806 271,929
Luxembourg (1.06%) Gazprom OAO Via Gaz Capital SA, 4.95%, 2027/03/23 200,000 244,521 261,086
Senegal (0.96%) Republic of Senegal, Sinkable, 6.25%, 2033/05/23 200,000 248,241 235,919
Nigeria (0.94%) Federal Republic of Nigeria, 7.63%, 2047/11/28 200,000 231,815 230,689
Dominican Republic (0.86%) Dominican Republic, Sinkable, 7.50%, 2021/05/06 150,000 206,132 211,947
TOTAL GLOBAL FIXED INCOME SECURITIES 21,288,352 21,939,598
U.S. FIXED INCOME SECURITIES (4.28%)Government Bonds (3.17%) United States Treasury Bond, 2.50%, 2020/06/30 425,000 566,226 579,836 United States Treasury Bond, 2.63%, 2020/07/31 145,000 190,176 198,221
756,402 778,057
Corporate Bonds (1.11%) SASOL Financing USA LLC, Callable, Callable, 6.50%, 2028/09/27 200,000 257,732 273,569
TOTAL U.S. FIXED INCOME SECURITIES 1,014,134 1,051,626
Horizons Active Emerging Markets Bond ETF
104644 – HEMB.indd 24 2019-03-11 3:18 PM

25
DERIVATIVES (-2.42%)Currency Forwards (-2.42%)
Currency forward contract to buy C$4,944,680 for US$3,700,000 maturing January 10, 2019 – (105,584)Currency forward contract to buy EUR€178,195 for C$269,588 maturing March 13, 2019 – 10,307
Currency forward contract to buy US$240,000 for C$320,136 maturing March 13, 2019 – 6,976 Currency forward contract to buy MXN 2,385,000 for C$156,780 maturing March 13, 2019 – 6,866 Currency forward contract to buy C$1,038,468 for EUR€680,000 maturing March 13, 2019 – (29,622)
Currency forward contract to buy C$1,700,000 for MXN 25,976,000 maturing March 13, 2019 – (82,334)Currency forward contract to buy C$17,617,383 for US$13,220,000 maturing March 13, 2019 – (401,054)
– (594,445)
TOTAL DERIVATIVES – (594,445)
Transaction Costs (97)
TOTAL INVESTMENT PORTFOLIO (91.14%) $ 22,302,389 $ 22,396,779
Cash and cash equivalents (9.11%) 2,238,814Other assets less liabilities (-0.25%) (60,316)
TOTAL NET ASSETS (100.00%) $ 24,575,277
(See accompanying notes to �nancial statements)
Par Value/ Average FairSecurity Shares/Contracts Cost Value
Schedule of Investments (continued)As at December 31, 2018
Horizons Active Emerging Markets Bond ETF
104644 – HEMB.indd 25 2019-03-11 3:18 PM

26
Notes to Financial StatementsFor the Period from Inception on July 23 to December 31, 2018
1. REPORTING ENTITY
Horizons Active Emerging Markets Bond ETF (“HEMB” or the “ETF”) is an investment trust established under the laws of the Province of Ontario by Declaration of Trust and e�ectively began operations on July 31, 2018. The address of the ETF’s registered o�ce is: c/o Horizons ETFs Management (Canada) Inc., 55 University Avenue, Suite 800, Toronto, Ontario, M5J 2H7.
The ETF is o�ered for sale on a continuous basis by its prospectus in Class A units (“Class A”) which trade on the Toronto Stock Exchange (“TSX”) under the symbol HEMB. An investor may buy or sell units of the ETF on the TSX only through a registered broker or dealer in the province or territory where the investor resides. Investors are able to trade units of the ETF in the same way as other securities traded on the TSX, including by using market orders and limit orders and may incur customary brokerage commissions when buying or selling units.
The investment objective of HEMB is to seek income and long-term capital growth by investing primarily in debt securi-ties of emerging market issuers. HEMB will invest in both �xed rate and �oating rate instruments issued by sovereign, quasi sovereign, supranational, and corporate issuers.
Horizons ETFs Management (Canada) Inc. is the manager, trustee and investment manager of the ETF (“Horizons Manage-ment”, the “Manager” or the “Investment Manager”). The Investment Manager is responsible for implementing the ETF’s investment strategies and for engaging the services of Fiera Capital Corporation & Mirae Asset Global Investments (USA) LLC. (“Fiera and Mirae Asset” or the “Sub-Advisor”), to act as the sub-advisor to the ETF. The Manager is a member of the Mirae Asset Financial Group (“Mirae Asset”).
2. BASIS OF PREPARATION
(i) Statement of compliance
These �nancial statements have been prepared in accordance with International Financial Reporting Standards (“IFRS”). Any mention of total net assets, net assets, net asset value or increase (decrease) in net assets is referring to net assets or increase (decrease) in net assets attributable to holders of redeemable units as reported under IFRS.
These �nancial statements were authorized for issue on March 13, 2019, by the Board of Directors of the Manager.
(ii) Basis of measurement
The �nancial statements have been prepared on the historical cost basis except for �nancial instruments at fair value though pro�t or loss, which are measured at fair value.
(iii) Functional and presentation currency
These �nancial statements are presented in Canadian dollars, which is the ETF’s functional currency.
3. SIGNIFICANT ACCOUNTING POLICIES
The accounting policies set out below have been applied consistently to all periods presented in these �nancial statements.
Horizons Active Emerging Markets Bond ETF
104644 – HEMB.indd 26 2019-03-11 3:18 PM

27
Notes to Financial Statements (continued)For the Period from Inception on July 23 to December 31, 2018
(a) Financial instruments
(i) Recognition, initial measurement and classi�cation
The ETF is subject to IFRS 9, Financial Instruments (“IFRS 9”) for the classi�cation and measurement requirements for �nancial instruments, including impairment on �nancial assets and hedge accounting.
This standard requires assets to be classi�ed based on the ETF’s business model for managing the �nancial assets and contractual cash �ow characteristics of the �nancial assets. The standard includes three principal classi�cation categories for �nancial assets: measured at amortized cost, fair value through other comprehensive income, and fair value through pro�t and loss (“FVTPL”). IFRS 9 requires classi�cation of debt instruments, if any, based solely on payments of principal and interests, and business model tests.
The ETF’s �nancial assets and �nancial liabilities are managed and its performance is evaluated on a fair value basis. The contractual cash �ows of the ETF’s debt securities, if any, consist solely of principal and interest, however, these securities are neither held in held-to-collect, or held-to-collect-and-sale business models in IFRS 9.
Financial assets and �nancial liabilities at FVTPL are initially recognized on the trade date, at fair value (see below), with transaction costs recognized in the statement of comprehensive income. Other �nancial assets and �nancial liabilities are recognized on the date on which they are originated at fair value.
The ETF classi�es �nancial assets and �nancial liabilities into the following categories:
• Financial assets mandatorily classi�ed at fair value through pro�t or loss: debt securities, equity investments and deriva-tive �nancial instruments
• Financial assets at amortized cost: All other �nancial assets
• Financial liabilities classi�ed at fair value through pro�t or loss: derivative �nancial instruments and securities sold short, if any
• Financial liabilities at amortized cost: all other �nancial liabilities
(ii) Fair value measurement
Fair value is the price that would be received to sell an asset or paid to transfer a liability in an orderly transaction be-tween market participants at the measurement date in the principal or, in its absence, the most advantageous market to which the ETF has access at that date. The fair value of a liability re�ects its non-performance risk.
Investments are valued at fair value as of the close of business on each day upon which a session of the TSX is held (“Valu-ation Date”) and based on external pricing sources to the extent possible. Investments held that are traded in an active market through recognized public stock exchanges, over-the-counter markets, or through recognized investment deal-ers, are valued at their closing sale price. However, such prices may be adjusted if a more accurate value can be obtained from recent trading activity or by incorporating other relevant information that may not have been re�ected in pricing obtained from external sources. Short-term investments, including notes and money market instruments, are valued at amortized cost which approximates fair value.
Investments held that are not traded in an active market, including some derivative �nancial instruments, are valued us-ing observable market inputs where possible, on such basis and in such manner as established by the Manager. Deriva-
Horizons Active Emerging Markets Bond ETF
104644 – HEMB.indd 27 2019-03-11 3:18 PM

28
Notes to Financial Statements (continued)For the Period from Inception on July 23 to December 31, 2018
tive �nancial instruments are recorded in the statement of �nancial position according to the gain or loss that would be realized if the contracts were closed out on the Valuation Date. Margin deposits, if any, are included in the schedule of investments as margin deposits. See also the summary of fair value measurements in note 6.
Fair value policies used for �nancial reporting purposes are the same as those used to measure the net asset value (“NAV”) for transactions with unitholders.
The fair value of other �nancial assets and liabilities approximates their carrying values due to the short-term nature of these instruments.
(iii) O�setting
Financial assets and liabilities are o�set and the net amount presented in the statement of �nancial position when there is a legally enforceable right to o�set the recognized amounts and there is an intention to settle on a net basis, or to real-ize the asset and settle the liability simultaneously.
Income and expenses are presented on a net basis for gains and losses from �nancial instruments at fair value through pro�t or loss and foreign exchange gains and losses.
(iv) Speci�c instruments
Cash and cash equivalents
Cash and cash equivalents consist of cash on deposit and short-term, interest bearing notes with a term to maturity of less than three months from the date of purchase.
Forward foreign exchange contracts
Forward foreign exchange contracts, if any, are valued at the current market value thereof on the Valuation Date. The val-ue of these forward contracts is the gain or loss that would be realized if, on the Valuation Date, the positions were to be closed out and recorded as derivative assets and/or liabilities in the statement of �nancial position and as a net change in unrealized appreciation (depreciation) of investments and derivatives in the statements of comprehensive income. When the forward contracts are closed out or mature, realized gains or losses on forward contracts are recognized and are included in the statement of comprehensive income in net realized gain (loss) on sale of investments and derivatives. The Canadian dollar value of forward foreign exchange contracts is determined using forward currency exchange rates supplied by an independent service provider.
Redeemable units
The redeemable units are measured at the present value of the redemption amounts and are considered a residual amount of the net assets attributable to holders of redeemable units. They are classi�ed as �nancial liabilities as a result of the ETF’s requirement to distribute net income and capital gains to unitholders.
Horizons Active Emerging Markets Bond ETF
104644 – HEMB.indd 28 2019-03-11 3:18 PM
29
(b) Investment income
Investment transactions are accounted for as of the trade date. Realized gains and losses from investment transactions are calculated on a weighted average cost basis. The di�erence between fair value and average cost, as recorded in the �nancial statements, is included in the statement of comprehensive income as part of the net change in unrealized ap-preciation (depreciation) of investments and derivatives. Interest income for distribution purposes from investments in bonds and short-term investments represents the coupon interest received by the ETF accounted for on an accrual basis. Dividend income is recognized on the ex-dividend date. Distribution income from investments in other funds or ETFs is recognized when earned.
Income from derivatives is shown in the statement of comprehensive income as net realized gain (loss) on sale of invest-ments and derivatives; net change in unrealized appreciation (depreciation) of investments and derivatives; and, interest income for distribution purposes, in accordance with its nature.
Income from securities lending, if any, is included in “Securities lending income” on the statement of comprehensive in-come and is recognized when earned. Any securities on loan continue to be displayed in the schedule of investments and the market value of the securities loaned and collateral held is determined daily (see note 7).
If the ETF incurs withholding taxes imposed by certain countries on investment income and capital gains, such income and gains are recorded on a gross basis and the related withholding taxes are shown as a separate expense in the state-ment of comprehensive income.
(c) Foreign currency
Transactions in foreign currencies are translated into the ETF’s reporting currency using the exchange rate prevailing on the trade date. Monetary assets and liabilities denominated in foreign currencies at the reporting date are translated at the period-end exchange rate. Foreign exchange gains and losses are presented as “Net realized gain (loss) on foreign exchange”, except for those arising from �nancial instruments at fair value through pro�t or loss, which are recognized as a component within “Net realized gain (loss) on sale of investments and derivatives” and “Net change in unrealized appre-ciation (depreciation) of investments and derivatives” in the statement of comprehensive income.
(d) Cost basis
The cost of portfolio investments is determined on an average cost basis.
(e) Increase (decrease) in net assets attributable to holders of redeemable units per unit
The increase (decrease) in net assets per unit by class in the statement of comprehensive income represents the change in net assets attributable to holders of redeemable units from operations attributable to each class divided by the weighted average number of units of that class outstanding during the reporting period. Income, expenses other than manage-ment fees, and realized and unrealized capital gains (losses) are distributed amongst the di�erent classes of units in proportion to the amount invested in them. For management fees please refer to note 9.
Notes to Financial Statements (continued)For the Period from Inception on July 23 to December 31, 2018
Horizons Active Emerging Markets Bond ETF
104644 – HEMB.indd 29 2019-03-11 3:18 PM

30
(f) Unitholder transactions
The value at which units are issued or redeemed is determined by dividing the net asset value of the class by the total number of units outstanding of that class on the Valuation Date. Amounts received on the issuance of units and amounts paid on the redemption of units are included in the statement of changes in �nancial position.
(g) Amounts receivable (payable) relating to portfolio assets sold (purchased)
In accordance with the ETF’s policy of trade date accounting for sale and purchase transactions, sales/purchase transac-tions awaiting settlement represent amounts receivable/payable for securities sold/purchased, but not yet settled as at the reporting date.
(h) Net assets attributable to holders of redeemable units per unit
Net assets attributable to holders of redeemable units per unit is calculated for each class of units of the ETF by taking the respective class’ proportionate share of the ETF’s net assets attributable to holders of redeemable units and dividing by the number of units of that class outstanding on the Valuation Date.
(i) Transaction costs
Transaction costs are incremental costs that are directly attributable to the acquisition, issue or disposal of an investment, which include fees and commissions paid to agents, advisors, brokers and dealers, levies by regulatory agencies and secu-rities exchanges, and transfer taxes and duties. Transaction costs are expensed and are included in “Transaction costs” in the statement of comprehensive income.
4. CRITICAL ACCOUNTING ESTIMATES AND JUDGEMENTS
In preparing these �nancial statements, the Manager has made judgements, estimates and assumptions that a�ect the application of accounting policies and the reported amounts of assets, liabilities, income and expenses. Actual results may di�er from these estimates. Estimates and underlying assumptions are reviewed on an ongoing basis. Revisions to estimates are recognized prospectively.
The ETF may hold �nancial instruments that are not quoted in active markets, including derivatives. The determination of the fair value of these instruments is the area with the most signi�cant accounting judgements and estimates that the ETF has made in preparing the �nancial statements. See note 6 for more information on the fair value measurement of the ETF’s �nancial instruments.
5. FINANCIAL INSTRUMENTS RISK
In the normal course of business, the ETF’s investment activities expose it to a variety of �nancial risks. The Manager seeks to minimize potential adverse e�ects of these risks for the ETF’s performance by employing professional, experienced portfolio advisors, by daily monitoring of the ETF’s positions and market events, and periodically may use derivatives to hedge certain risk exposures. To assist in managing risks, the Manager maintains a governance structure that oversees the ETF’s investment activities and monitors compliance with the ETF’s stated investment strategies, internal guidelines and securities regulations.
Notes to Financial Statements (continued)For the Period from Inception on July 23 to December 31, 2018
Horizons Active Emerging Markets Bond ETF
104644 – HEMB.indd 30 2019-03-11 3:18 PM

31
Please refer to the most recent prospectus for a complete discussion of the risks attributed to an investment in the units of the ETF. Signi�cant �nancial instrument risks that are relevant to the ETF and an analysis of how they are managed are presented below.
(a) Market risk
Market risk is the risk that changes in market prices, such as interest rates, equity prices, foreign exchange rates and credit spreads (not relating to changes in the obligor’s/issuer’s credit standing) will a�ect the ETF’s income or the fair value of its holdings of �nancial instruments. The objective of market risk management is to manage and control market risk expo-sures within acceptable parameters, while optimizing the return.
(i) Currency risk
Currency risk is the risk that �nancial instruments which are denominated in currencies other than the ETF’s reporting currency, the Canadian dollar, will �uctuate due to changes in exchange rates and adversely impact the ETF’s income, cash �ows or fair values of its investment holdings. The ETF may reduce its foreign currency exposure through the use of derivative arrangements such as foreign exchange forward contracts or futures contracts. As at December 31, 2018, the ETF did not have any material net exposure to foreign currencies due to the ETF’s hedging strategies.
(ii) Interest rate risk
The ETF may be exposed to the risk that the fair value of future cash �ows of its �nancial instruments will �uctuate as a result of changes in market interest rates. In general, the value of interest-bearing �nancial instruments will rise if interest rates fall, and conversely, will generally fall if interest rates rise. There is minimal sensitivity to interest rate �uctuation on cash and cash equivalents invested at short-term market rates since those securities are usually held to maturity and are short term in nature.
The following table summarizes the ETF’s exposure to interest rate risk, including the ETF’s assets categorized by the remaining term to maturity:
InvestmentsLess than
1 year 1 - 3 years 3 - 5 years > 5 yearsNon-interest
bearing Total
As at ($000's) ($000's) ($000's) ($000's) ($000's) ($000's)
December 31, 2018 731 3,396 6,319 13,139 – 23,585
The percentage of the ETF’s net assets exposed to interest rate risk as at December 31, 2018, was 96.0%. The amount by which the net assets of the ETF would have increased or decreased, as at December 31, 2018, had the prevailing inter-est rates been lowered or raised by 1%, assuming a parallel shift in the yield curve, with all other variables remaining constant, was $1,101,151. The ETF’s interest rate sensitivity was determined based on portfolio weighted duration. In practice, actual results may di�er from this sensitivity analysis.
Notes to Financial Statements (continued)For the Period from Inception on July 23 to December 31, 2018
Horizons Active Emerging Markets Bond ETF
104644 – HEMB.indd 31 2019-03-11 3:18 PM
32
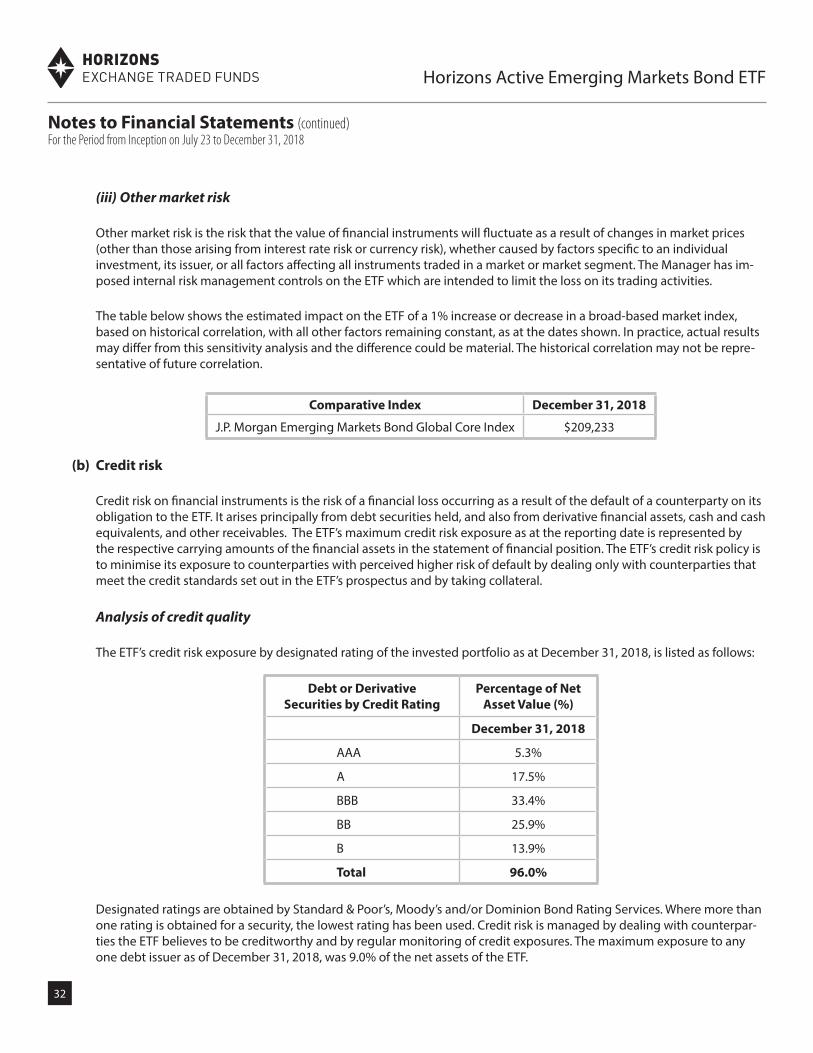
(iii) Other market risk
Other market risk is the risk that the value of �nancial instruments will �uctuate as a result of changes in market prices (other than those arising from interest rate risk or currency risk), whether caused by factors speci�c to an individual investment, its issuer, or all factors a�ecting all instruments traded in a market or market segment. The Manager has im-posed internal risk management controls on the ETF which are intended to limit the loss on its trading activities.
The table below shows the estimated impact on the ETF of a 1% increase or decrease in a broad-based market index, based on historical correlation, with all other factors remaining constant, as at the dates shown. In practice, actual results may di�er from this sensitivity analysis and the di�erence could be material. The historical correlation may not be repre-sentative of future correlation.
Comparative Index December 31, 2018
J.P. Morgan Emerging Markets Bond Global Core Index $209,233
(b) Credit risk
Credit risk on �nancial instruments is the risk of a �nancial loss occurring as a result of the default of a counterparty on its obligation to the ETF. It arises principally from debt securities held, and also from derivative �nancial assets, cash and cash equivalents, and other receivables. The ETF’s maximum credit risk exposure as at the reporting date is represented by the respective carrying amounts of the �nancial assets in the statement of �nancial position. The ETF’s credit risk policy is to minimise its exposure to counterparties with perceived higher risk of default by dealing only with counterparties that meet the credit standards set out in the ETF’s prospectus and by taking collateral.
Analysis of credit quality
The ETF’s credit risk exposure by designated rating of the invested portfolio as at December 31, 2018, is listed as follows:
Debt or Derivative Securities by Credit Rating
Percentage of Net Asset Value (%)
December 31, 2018
AAA 5.3%
A 17.5%
BBB 33.4%
BB 25.9%
B 13.9%
Total 96.0%
Designated ratings are obtained by Standard & Poor’s, Moody’s and/or Dominion Bond Rating Services. Where more than one rating is obtained for a security, the lowest rating has been used. Credit risk is managed by dealing with counterpar-ties the ETF believes to be creditworthy and by regular monitoring of credit exposures. The maximum exposure to any one debt issuer as of December 31, 2018, was 9.0% of the net assets of the ETF.
Notes to Financial Statements (continued)For the Period from Inception on July 23 to December 31, 2018
Horizons Active Emerging Markets Bond ETF
104644 – HEMB.indd 32 2019-03-11 3:18 PM

33
(c) Liquidity risk
Liquidity risk is the risk that the ETF will encounter di�culty in meeting the obligations associated with its �nancial liabili-ties that are settled by delivering cash or another �nancial asset. The ETF’s policy and the Investment Manager’s approach to managing liquidity is to ensure, as far as possible, that it will always have su�cient liquidity to meet its liabilities when due, under both normal and stress conditions, including estimated redemptions of shares, without incurring unaccept-able losses or risking damage to the ETF’s reputation. Generally, liabilities of the ETF are due within 90 days. Liquidity risk is managed by investing the majority of the ETF’s assets in investments that are traded in an active market and can be readily disposed. The ETF aims to retain su�cient cash and cash equivalent positions to maintain liquidity; therefore, the liquidity risk for the ETF is considered minimal.
6. FAIR VALUE MEASUREMENT
Below is a classi�cation of fair value measurements of the ETF’s investments based on a three level fair value hierarchy and a reconciliation of transactions and transfers within that hierarchy. The hierarchy of fair valuation inputs is summa-rized as follows:
• Level 1: securities that are valued based on quoted prices in active markets.
• Level 2: securities that are valued based on inputs other than quoted prices that are observable, either directly as prices, or indirectly as derived from prices.
• Level 3: securities that are valued with signi�cant unobservable market data.
Changes in valuation methods may result in transfers into or out of an investment’s assigned level. The following is a sum-mary of the inputs used as at December 31, 2018, in valuing the ETF’s investments and derivatives carried at fair values:
December 31, 2018
Level 1 ($) Level 2 ($) Level 3 ($)
Financial Assets
Bonds – 22,707,481 –
Exchange Traded Funds 283,743 – –
Currency Forward Contracts – 24,149 –
Total Financial Assets 283,743 22,731,630 –
Financial Liabilities
Currency Forward Contracts – (618,594) –
Total Financial Liabilities – (618,594) –
Net Financial Assets and Liabilities 283,743 22,113,036 –
There were no signi�cant transfers made between Levels 1 and 2 as a result of changes in the availability of quoted mar-ket prices or observable market inputs during the period shown. In addition, there were no investments or transactions classi�ed in Level 3 for the period ended December 31, 2018.
Notes to Financial Statements (continued)For the Period from Inception on July 23 to December 31, 2018
Horizons Active Emerging Markets Bond ETF
104644 – HEMB.indd 33 2019-03-11 3:18 PM

34
7. SECURITIES LENDING
In order to generate additional returns, the ETF is authorized to enter into securities lending agreements with borrowers deemed acceptable in accordance with National Instrument 81-102 – Investment Funds (“NI 81-102”). Under a securities lending agreement, the borrower must pay the ETF a negotiated securities lending fee, provide compensation to the ETF equal to any distributions received by the borrower on the securities borrowed, and the ETF must receive an acceptable form of collateral in excess of the value of the securities loaned. Although such collateral is marked to market, the ETF may be exposed to the risk of loss should a borrower default on its obligations to return the borrowed securities and the collateral is insu�cient to reconstitute the portfolio of loaned securities. Revenue, if any, earned on securities lending transactions during the period is disclosed in the ETF’s statement of comprehensive income.
As at December 31, 2018, the ETF was not participating in any securities lending transactions. The ETF did not earn any income from securities lending transactions for the period ended December 31, 2018.
8. REDEEMABLE UNITS
The ETF is authorized to issue an unlimited number of redeemable, transferable Class A units each of which represents an equal, undivided interest in the net assets of the ETF. Each unit entitles the owner to one vote at meetings of unitholders. Each unit is entitled to participate equally with all other units with respect to all payments made to unitholders, other than management fee distributions, whether by way of income or capital distributions and, on liquidation, to participate equally in the net assets of the ETF remaining after satisfaction of any outstanding liabilities that are attributable to units of that class of the ETF. All units will be fully paid and non-assessable, with no liability for future assessments, when issued and will not be transferable except by operation of law.
The redeemable units issued by the ETF provide an investor with the right to require redemption for cash at a value proportionate to the investor’s share in the ETF’s net assets at each redemption date. They are classi�ed as liabilities as a result of the ETF’s requirement to distribute net income and capital gains to unitholders. The ETF’s objectives in managing the redeemable units are to meet the ETF’s investment objective, and to manage liquidity risk arising from redemptions. The ETF’s management of liquidity risk arising from redeemable units is discussed in note 5.
On any trading day, which is de�ned as the day that a net asset value of the ETF is being struck, unitholders of the ETF may (i) redeem units of the ETF for cash at a redemption price per unit equal to 95% of the closing price for units of the ETF on the TSX on the e�ective day of the redemption, where the units being redeemed are not equal to a prescribed number of units (“PNU”) or a multiple PNU; or (ii) redeem, less any applicable redemption charge as determined by the Manager in its sole discretion from time to time, a PNU or a multiple PNU of the ETF for cash equal to the net asset value of that number of units.
Subject to regulatory and other necessary third party approvals, a stock exchange sponsored execution program may become available which would allow investors to purchase and sell Class A units of the ETF based on transaction prices calculated as at the end-of-day net asset value, plus any fee payable to the investor’s dealer for the dealer’s facilitation of the purchase or sale. The Manager will issue a news release announcing the details of any such stock exchange sponsored execution program.
Units of the ETF are issued or redeemed on a daily basis at the net asset value per security that is determined as at 4:00 p.m. (Eastern Time) each business day. Purchase and redemption orders are subject to a 9:30 a.m. (Eastern Time) cut-o� time.
Notes to Financial Statements (continued)For the Period from Inception on July 23 to December 31, 2018
Horizons Active Emerging Markets Bond ETF
104644 – HEMB.indd 34 2019-03-11 3:18 PM

35
The ETF is required to distribute any net income and capital gains that it has earned in the period. Income earned by the ETF is distributed to unitholders at least once per year, if necessary, and these distributions are either paid in cash or rein-vested by unitholders into additional units of the ETF. Net realized capital gains, if any, are typically distributed in Decem-ber of each year to unitholders. The annual capital gains distributions are not paid in cash but rather, are reinvested and reported as taxable distributions and used to increase each unitholder’s adjusted cost base for the ETF. Distributions paid to holders of redeemable units are recognized in the statement of changes in �nancial position.
Please consult the ETF’s most recent prospectus for a full description of the subscription and redemption features of the ETF’s units.
For the period ended December 31, 2018, the number of units issued by subscription and/or distribution reinvestment, the number of units redeemed, the total and average number of units outstanding was as follows:
Period
Beginning Units
Outstanding Units
Issued Units
Redeemed
Ending Units
Outstanding
Average Units
Outstanding
2018 – 2,527,201 – 2,527,201 2,439,672
9. EXPENSES
Management fees
The Manager provides, or oversees the provision of, administrative services required by the ETF including, but not limited to: negotiating contracts with certain third-party service providers, such as portfolio managers, custodians, registrars, transfer agents, auditors and printers; authorizing the payment of operating expenses incurred on behalf of the ETF; arranging for the maintenance of accounting records for the ETF; preparing reports to unitholders and to the applicable securities regulatory authorities; calculating the amount and determining the frequency of distributions by the ETF; pre-paring �nancial statements, income tax returns and �nancial and accounting information as required by the ETF; ensuring that unitholders are provided with �nancial statements and other reports as are required from time to time by applicable law; ensuring that the ETF complies with all other regulatory requirements, including the continuous disclosure obliga-tions of the ETF under applicable securities laws; administering purchases, redemptions and other transactions in units of the ETF; and dealing and communicating with unitholders of the ETF. The Manager provides o�ce facilities and personnel to carry out these services, if not otherwise furnished by any other service provider to the ETF. The Manager also monitors the investment strategies of the ETF to ensure that the ETF complies with its investment objectives, investment strategies and investment restrictions and practices.
In consideration for the provision of these services, the Manager receives a monthly management fee at the annual rate of 0.55%, plus applicable sales taxes, of the net asset value of the ETF’s Class A units, calculated and accrued daily and payable monthly in arrears. The Sub-Advisor is compensated for its services out of the management fees without any fur-ther cost to the ETF. Any expenses of the ETF which are waived or absorbed by the Manager are paid out of the manage-ment fees received by the Manager.
Other expenses
Unless otherwise waived or reimbursed by the Manager, the ETF pays all of its operating expenses, including but not limited to: audit fees; trustee and custodial expenses; valuation, accounting and record keeping costs; legal expenses; permitted prospectus preparation and �ling expenses; costs associated with delivering documents to unitholders; listing
Notes to Financial Statements (continued)For the Period from Inception on July 23 to December 31, 2018
Horizons Active Emerging Markets Bond ETF
104644 – HEMB.indd 35 2019-03-11 3:18 PM

36
and annual stock exchange fees; index licensing fees, if applicable; fees payable to CDS Clearing and Depository Services Inc.; bank related fees and interest charges; extraordinary expenses; unitholder reports and servicing costs; registrar and transfer agent fees; costs associated with the Independent Review Committee; income taxes; sales taxes; brokerage expenses and commissions; and withholding taxes.
The Manager, at its discretion, may waive and/or absorb a portion of the fees and/or expenses otherwise payable by the ETF. The waiving and/or absorption of such fees and/or expenses by the Manager may be terminated at any time, or con-tinued inde�nitely, at the discretion of the Manager.
10. BROKER COMMISSIONS, SOFT DOLLARS AND RELATED PARTY TRANSACTIONS
Brokerage commissions paid on securities transactions may include amounts paid to related parties of the Manager for brokerage services provided to the ETF.
Research and system usage related services received in return for commissions generated with speci�c dealers are gener-ally referred to as soft dollars.
Total brokerage commissions paid to dealers in connection with investment portfolio transactions, soft dollar trans-actions incurred and amounts paid to related parties of the Manager for the period ended December 31, 2018, were as follow:
Period Ended Brokerage Commissions Paid
Soft Dollar Transactions
Amount Paid to Related Parties
December 31, 2018 $981 $nil $nil
In addition to the information contained in the table above, the management fees paid to the Manager described in note 9 are related party transactions, as the Manager is considered to be a related party to the ETF. Fees paid to the Indepen-dent Review Committee are also considered to be related party transactions. Both the management fees and fees paid to the Independent Review Committee are disclosed in the statement of comprehensive income. The management fees payable by the ETF as at December 31, 2018, are disclosed in the statement of �nancial position.
The ETF may invest in other ETFs managed by the Manager or its a�liates, in accordance with the ETF’s investment objec-tives and strategies. Such investments, if any, are disclosed in the schedule of investments.
11. INCOME TAX
The ETF has quali�ed as a mutual fund trust under the Income Tax Act (Canada) (the “Tax Act”) and accordingly, is not taxed on the portion of taxable income that is paid or allocated to unitholders. As well, tax refunds (based on redemp-tions and realized and unrealized gains during the year) may be available that would make it possible to retain some net capital gains in the ETF without incurring any income taxes.
Notes to Financial Statements (continued)For the Period from Inception on July 23 to December 31, 2018
Horizons Active Emerging Markets Bond ETF
104644 – HEMB.indd 36 2019-03-11 3:18 PM

37
12. TAX LOSSES CARRIED FORWARD
Capital losses for income tax purposes may be carried forward inde�nitely and applied against capital gains realized in future years. Non-capital losses carried forwards may be applied against future years’ taxable income. Non-capital losses that are realized in the current taxation year may be carried forward for 20 years. As at December 31, 2018, the ETF had net capital losses and/or non-capital losses, with the year of expiry of the non-capital losses as follows:
Net Capital Losses Non-Capital Losses Year of Expiry of the Non-Capital Losses
$326,986 – –
13. OFFSETTING OF FINANCIAL INSTRUMENTS
In the normal course of business, the ETF may enter into various master netting arrangements or other similar agree-ments that do not meet the criteria for o�setting in the statement of �nancial position but still allow for the related amounts to be set o� in certain circumstances, such as bankruptcy or termination of the contracts. The following table shows �nancial instruments that may be eligible for o�set, if such conditions were to arise, as at December 31, 2018. The “Net” column displays what the net impact would be on the ETF’s statement of �nancial position if all amounts were set-o�.
Amounts O�set ($) Amounts Not O�set ($) Net ($)
Financial Assets and Liabilities as at December 31, 2018
Gross Assets
(Liabilities)
Gross Assets (Liabilities)
O�set
Net Amounts
Financial Instruments
Cash Collateral Pledged
Derivative assets 24,149 – 24,149 (24,149) – –
Derivative liabilities (618,594) – (618,594) 24,149 – (594,445)
14. INTERESTS IN SUBSIDIARIES, ASSOCIATES AND UNCONSOLIDATED STRUCTURED ENTITIES
The ETF may invest in units of other ETFs as part of its investment strategies (“Investee ETF(s)”). The nature and purpose of these Investee ETFs generally, is to manage assets on behalf of third party investors in accordance with their investment objectives, and are �nanced through the issue of units to investors.
In determining whether the ETF has control or signi�cant in�uence over an Investee ETF, the ETF assesses voting rights, the exposure to variable returns, and its ability to use the voting rights to a�ect the amount of the returns. In instances where the ETF has control over an Investee ETF, the ETF quali�es as an investment entity under IFRS 10 - Consolidated Financial Statements, and therefore accounts for investments it controls at fair value through pro�t and loss. The ETF’s pri-mary purpose is de�ned by its investment objectives and uses the investment strategies available to it as de�ned in the ETF’s prospectus to meet those objectives. The ETF also measures and evaluates the performance of any Investee ETFs on a fair value basis.
Investee ETFs over which the ETF has control or signi�cant in�uence are categorized as subsidiaries and associates, re-spectively. All other Investee ETFs are categorized as unconsolidated structured entities. Investee ETFs may be managed by the Manager, its a�liates, or by third-party managers.
Notes to Financial Statements (continued)For the Period from Inception on July 23 to December 31, 2018
Horizons Active Emerging Markets Bond ETF
104644 – HEMB.indd 37 2019-03-11 3:18 PM

38
Notes to Financial Statements (continued)For the Period from Inception on July 23 to December 31, 2018
Horizons Active Emerging Markets Bond ETF
Investments in Investee ETFs are susceptible to market price risk arising from uncertainty about future values of those Investee ETFs. The maximum exposure to loss from interests in Investee ETFs is equal to the total fair value of the invest-ment in those respective Investee ETFs at any given point in time. The fair value of Investee ETFs, if any, are disclosed in investments in the statement of �nancial position and listed in the schedule of investments. As at December 31, 2018, the ETF had no exposure to subsidiaries, associates or unconsolidated structured entities.
104644 – HEMB.indd 38 2019-03-11 3:18 PM

ACTIVE BENCHMARK BETAPRO
ETF Solutions for every investorTM
Innovation is our capital. Make it yours.
sInnovation is our capital. Make it yours.
Horizons Exchange Traded Funds | 55 University Avenue, Suite 800 | Toronto, Ontario, M5J 2H7
T 416 933 5745 | TF 1 866 641 5739 | w horizonsetfs.com
ManagerHorizons ETFs Management (Canada) Inc.55 University Avenue, Suite 800Toronto, OntarioM5J 2H7Tel: 416-933-5745Fax: 416-777-5181Toll Free: [email protected]
CustodianCIBC Mellon Trust Company1 York Street, Suite 900Toronto, OntarioM5J 0B6
AuditorsKPMG LLPBay Adelaide Centre333 Bay Street, Suite 4600Toronto, OntarioM5H 2S5
Registrar and Transfer AgentTSX Trust Company100 Adelaide Street West, Suite 301Toronto, OntarioM5H 4H1
104644 – HEMB.indd 40 2019-03-11 3:18 PM