HOPING FOR THE BEST, PREPARING FOR THE WORST … · 4 SPECIAL FEATURE 1 GLOBAL ECONOMIC PROSPECTS |...
28
HOPING FOR THE BEST, PREPARING FOR THE WORST: Risks around U.S. Rate Liftoff and Policy Options SPECIAL FEATURE 1
Transcript of HOPING FOR THE BEST, PREPARING FOR THE WORST … · 4 SPECIAL FEATURE 1 GLOBAL ECONOMIC PROSPECTS |...
HOPING FOR THE BEST, PREPARING FOR THE WORST:
Risks around U.S. Rate Liftoff and Policy Options
SPECIAL FEATURE 1

S P E C I A L F E AT U R E 1G LO B A L E C O N O M I C P R O S P E C T S | J U N E 2 0 1 5 3
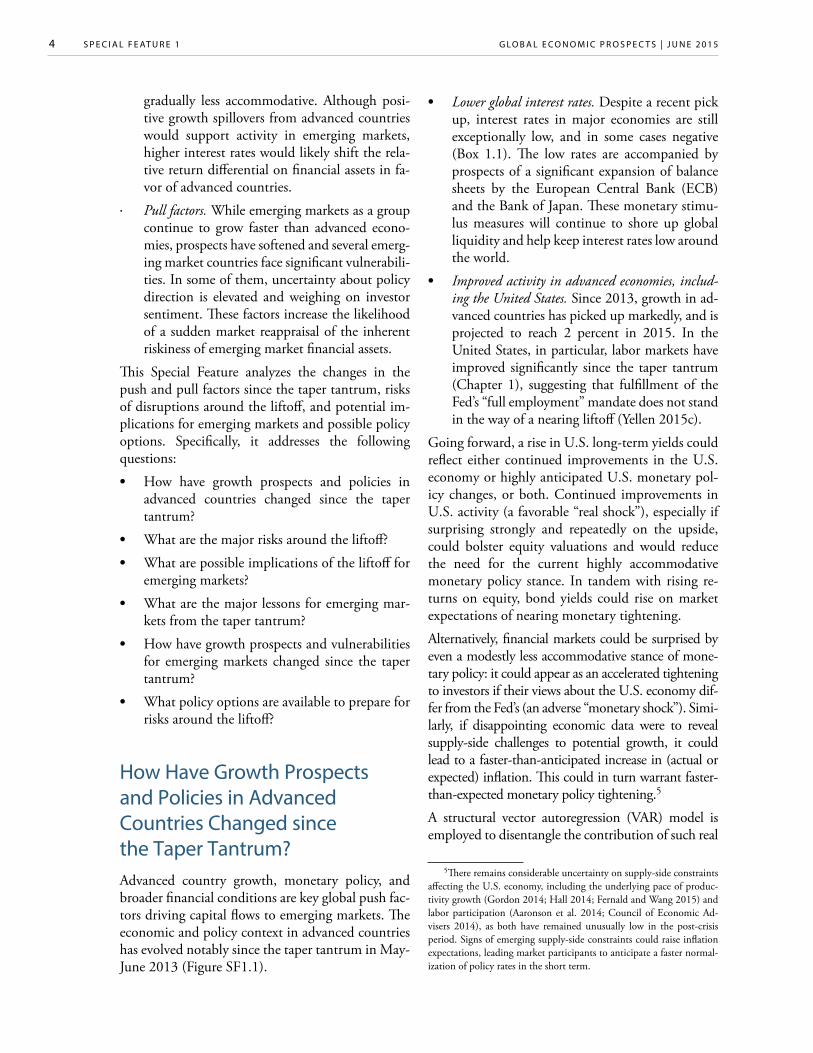
“We face a risk that longer-term interest rates will rise sharply at some point.” (Ben S. Bernanke, March 1, 2013)1
“Long-term interest rates are at very low levels, and that would appear to embody low term premiums, which can move, and can move very rapidly…”
(Janet Yellen, May 6, 2015)2
The U.S. Federal Reserve is expected to begin to gradually raise policy interest rates in the near term. Given that it has been anticipated for some time and will take place against the backdrop of an ongoing U.S. recovery and highly accommodative monetary policy by other major central banks, the launch of a series of U.S. rate increases (“liftoff”) is likely to proceed smoothly. The risk remains, however, that the liftoff or subsequent rate increases could lead to abrupt changes in market expectations regarding monetary conditions that could, in turn, prompt a spike in U.S. long-term interest rates, volatility in global financial markets, and a sharp increase in borrowing cost for emerging markets—similar to the way initial discussions of U.S. monetary policy normalization triggered the “taper tantrum” of May-June 2013. If, in response to the liftoff, U.S. long-term bond yields were to jump 100 basis points (as they did during the taper tantrum), capital inflows to emerging markets could decline by 0.8–1.8 percentage points of GDP. The change in external conditions driven by the liftoff or subsequent rate increases could potentially combine with domestic factors to spark a sudden stop in capital inflows in some emerging markets, especially those where vulnerabilities have increased, where there has been uncertainty about policy direction, or where growth prospects have deteriorated significantly. In anticipation of such a risk, emerging markets should prioritize monetary, financial, and fiscal policies that reduce vulnerabilities and strengthen credibility, and struc-tural reform agendas that improve growth prospects.
IntroductionThe exceptionally accommodative monetary policy stance of major central banks since the global finan-cial crisis has helped support global liquidity, bolster asset valuations, and reduce risk premia. It has been instrumental in lowering long-term interest rates in the United States and other advanced economies, and has contributed to the increase in capital in-flows to emerging market countries as investors search for higher yields. As a result, borrowing con-ditions in emerging markets have remained particu-larly favorable.
As the U.S. economy improves, the U.S. Federal Reserve (Fed) is expected to begin to gradually raise policy interest rates in the near term, an event widely referred to as “liftoff”.3 The liftoff and the subse-
The main authors of this Special Feature are Carlos Arteta, Ayhan Kose, Franziska Ohnsorge, and Marc Stocker, with inputs from Derek Chen, Raju Huidrom, Ergys Islamaj, Eung Ju Kim, and Tianli Zhao. Research assistance was provided by Trang Nguyen and Jiayi Zhang.
1Bernanke (2013b).2Yellen (2015b).3In a recent speech, Federal Reserve Chair Janet Yellen (2015c)
articulated her position on the timing of the rate hike: “If the economy continues to improve as I expect, I think it will be appropriate at some
quent tightening cycle are expected to proceed smoothly, leading to only modest downward pres-sures on capital inflows to emerging market coun-tries (Fischer 2015). However, the “taper tantrum” episode of May–June 2013 is a reminder that even an event long anticipated by markets can surprise in its specifics and generate significant financial market volatility and shifts in capital flows.
The potential impact on capital flows to emerging and developing countries depends on both “push” factors (global economic and financial conditions) and “pull” factors (country-specific prospects, vul-nerabilities, and policies).4
· Push factors. As growth prospects improve in ad-vanced countries relative to emerging markets, investment returns are likely to rise and ad-vanced country monetary policies will become
point this year to take the initial step to raise the federal funds rate tar-get and begin the process of normalizing monetary policy. To support taking this step, however, I will need to see continued improvement in labor market conditions, and I will need to be reasonably confident that inflation will move back to 2 percent over the medium term.”
4Several recent studies have examined the links between capital flows to emerging and developing countries and “pull” and “push” fac-tors, including U.S. monetary policy and global risk aversion (Koepke 2015a).
S P E C I A L F E AT U R E 1 G LO B A L E C O N O M I C P R O S P E C T S | J U N E 2 0 1 5 4
gradually less accommodative. Although posi-tive growth spillovers from advanced countries would support activity in emerging markets, higher interest rates would likely shift the rela-tive return differential on financial assets in fa-vor of advanced countries.
· Pull factors. While emerging markets as a group continue to grow faster than advanced econo-mies, prospects have softened and several emerg-ing market countries face significant vulnerabili-ties. In some of them, uncertainty about policy direction is elevated and weighing on investor sentiment. These factors increase the likelihood of a sudden market reappraisal of the inherent riskiness of emerging market financial assets.
This Special Feature analyzes the changes in the push and pull factors since the taper tantrum, risks of disruptions around the liftoff, and potential im-plications for emerging markets and possible policy options. Specifically, it addresses the following questions:
• How have growth prospects and policies in advanced countries changed since the taper tantrum?
• What are the major risks around the liftoff?
• What are possible implications of the liftoff for emerging markets?
• What are the major lessons for emerging mar-kets from the taper tantrum?
• How have growth prospects and vulnerabilities for emerging markets changed since the taper tantrum?
• What policy options are available to prepare for risks around the liftoff?
How Have Growth Prospects and Policies in Advanced Countries Changed since the Taper Tantrum? Advanced country growth, monetary policy, and broader financial conditions are key global push fac-tors driving capital flows to emerging markets. The economic and policy context in advanced countries has evolved notably since the taper tantrum in May-June 2013 (Figure SF1.1).
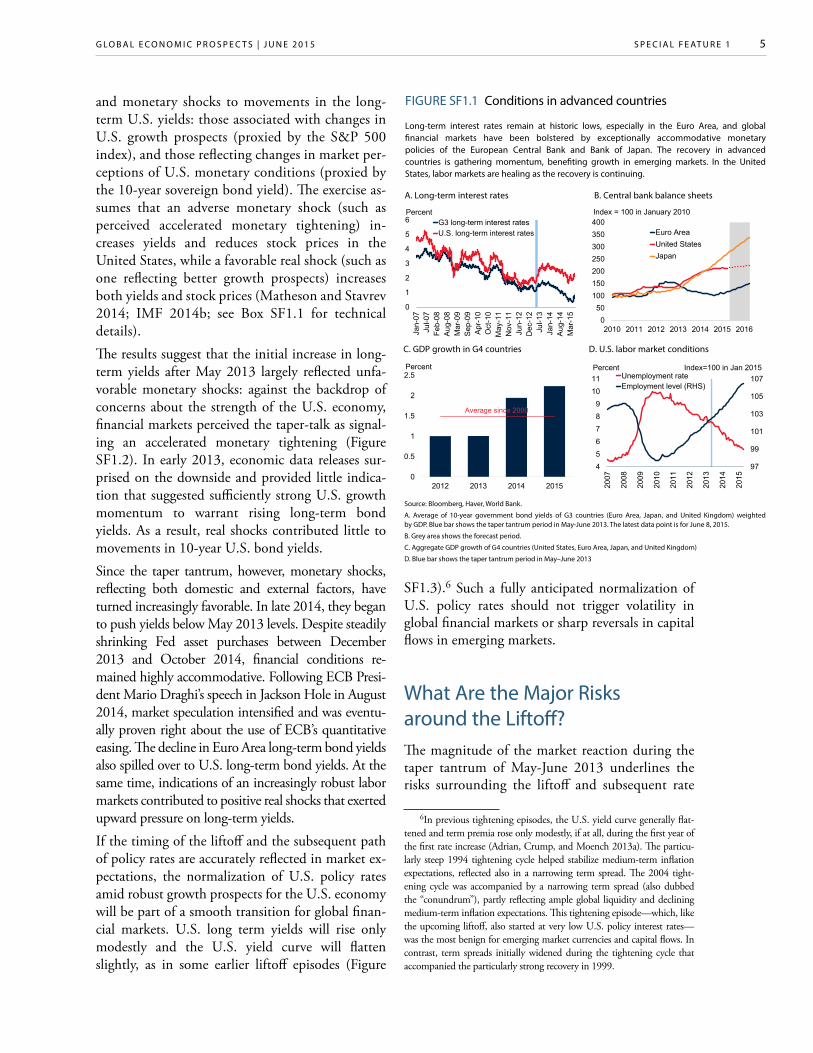
• Lower global interest rates. Despite a recent pick up, interest rates in major economies are still exceptionally low, and in some cases negative (Box 1.1). The low rates are accompanied by prospects of a significant expansion of balance sheets by the European Central Bank (ECB) and the Bank of Japan. These monetary stimu-lus measures will continue to shore up global liquidity and help keep interest rates low around the world.
• Improved activity in advanced economies, includ-ing the United States. Since 2013, growth in ad-vanced countries has picked up markedly, and is projected to reach 2 percent in 2015. In the United States, in particular, labor markets have improved significantly since the taper tantrum (Chapter 1), suggesting that fulfillment of the Fed’s “full employment” mandate does not stand in the way of a nearing liftoff (Yellen 2015c).
Going forward, a rise in U.S. long-term yields could reflect either continued improvements in the U.S. economy or highly anticipated U.S. monetary pol-icy changes, or both. Continued improvements in U.S. activity (a favorable “real shock”), especially if surprising strongly and repeatedly on the upside, could bolster equity valuations and would reduce the need for the current highly accommodative monetary policy stance. In tandem with rising re-turns on equity, bond yields could rise on market expectations of nearing monetary tightening.
Alternatively, financial markets could be surprised by even a modestly less accommodative stance of mone-tary policy: it could appear as an accelerated tightening to investors if their views about the U.S. economy dif-fer from the Fed’s (an adverse “monetary shock”). Simi-larly, if disappointing economic data were to reveal supply-side challenges to potential growth, it could lead to a faster-than-anticipated increase in (actual or expected) inflation. This could in turn warrant faster-than-expected monetary policy tightening.5
A structural vector autoregression (VAR) model is employed to disentangle the contribution of such real
5There remains considerable uncertainty on supply-side constraints affecting the U.S. economy, including the underlying pace of produc-tivity growth (Gordon 2014; Hall 2014; Fernald and Wang 2015) and labor participation (Aaronson et al. 2014; Council of Economic Ad-visers 2014), as both have remained unusually low in the post-crisis period. Signs of emerging supply-side constraints could raise inflation expectations, leading market participants to anticipate a faster normal-ization of policy rates in the short term.
S P E C I A L F E AT U R E 1G LO B A L E C O N O M I C P R O S P E C T S | J U N E 2 0 1 5 5
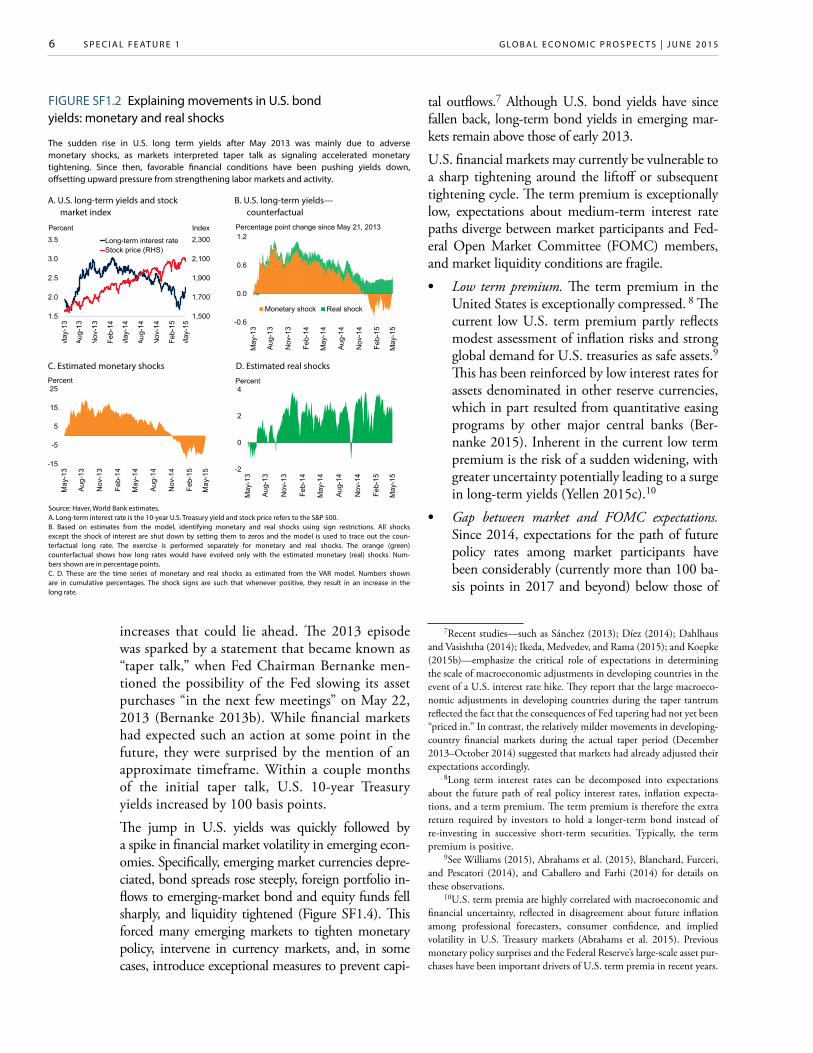
and monetary shocks to movements in the long-term U.S. yields: those associated with changes in U.S. growth prospects (proxied by the S&P 500 index), and those reflecting changes in market per-ceptions of U.S. monetary conditions (proxied by the 10-year sovereign bond yield). The exercise as-sumes that an adverse monetary shock (such as perceived accelerated monetary tightening) in-creases yields and reduces stock prices in the United States, while a favorable real shock (such as one reflecting better growth prospects) increases both yields and stock prices (Matheson and Stavrev 2014; IMF 2014b; see Box SF1.1 for technical details).The results suggest that the initial increase in long-term yields after May 2013 largely reflected unfa-vorable monetary shocks: against the backdrop of concerns about the strength of the U.S. economy, financial markets perceived the taper-talk as signal-ing an accelerated monetary tightening (Figure SF1.2). In early 2013, economic data releases sur-prised on the downside and provided little indica-tion that suggested sufficiently strong U.S. growth momentum to warrant rising long-term bond yields. As a result, real shocks contributed little to movements in 10-year U.S. bond yields. Since the taper tantrum, however, monetary shocks, reflecting both domestic and external factors, have turned increasingly favorable. In late 2014, they began to push yields below May 2013 levels. Despite steadily shrinking Fed asset purchases between December 2013 and October 2014, financial conditions re-mained highly accommodative. Following ECB Presi-dent Mario Draghi’s speech in Jackson Hole in August 2014, market speculation intensified and was eventu-ally proven right about the use of ECB’s quantitative easing. The decline in Euro Area long-term bond yields also spilled over to U.S. long-term bond yields. At the same time, indications of an increasingly robust labor markets contributed to positive real shocks that exerted upward pressure on long-term yields. If the timing of the liftoff and the subsequent path of policy rates are accurately reflected in market ex-pectations, the normalization of U.S. policy rates amid robust growth prospects for the U.S. economy will be part of a smooth transition for global finan-cial markets. U.S. long term yields will rise only modestly and the U.S. yield curve will flatten slightly, as in some earlier liftoff episodes (Figure
SF1.3).6 Such a fully anticipated normalization of U.S. policy rates should not trigger volatility in global financial markets or sharp reversals in capital flows in emerging markets.
What Are the Major Risks around the Liftoff?The magnitude of the market reaction during the taper tantrum of May-June 2013 underlines the risks surrounding the liftoff and subsequent rate
6In previous tightening episodes, the U.S. yield curve generally flat-tened and term premia rose only modestly, if at all, during the first year of the first rate increase (Adrian, Crump, and Moench 2013a). The particu-larly steep 1994 tightening cycle helped stabilize medium-term inflation expectations, reflected also in a narrowing term spread. The 2004 tight-ening cycle was accompanied by a narrowing term spread (also dubbed the “conundrum”), partly reflecting ample global liquidity and declining medium-term inflation expectations. This tightening episode—which, like the upcoming liftoff, also started at very low U.S. policy interest rates—was the most benign for emerging market currencies and capital flows. In contrast, term spreads initially widened during the tightening cycle that accompanied the particularly strong recovery in 1999.
A. Long-term interest rates
C. GDP growth in G4 countries
B. Central bank balance sheets
D. U.S. labor market conditions
Source: Bloomberg, Haver, World Bank.
A. Average of 10-year government bond yields of G3 countries (Euro Area, Japan, and United Kingdom) weighted by GDP. Blue bar shows the taper tantrum period in May-June 2013. The latest data point is for June 8, 2015.
B. Grey area shows the forecast period.
C. Aggregate GDP growth of G4 countries (United States, Euro Area, Japan, and United Kingdom)
D. Blue bar shows the taper tantrum period in May–June 2013
FIGURE SF1.1 Conditions in advanced countries
Long-term interest rates remain at historic lows, especially in the Euro Area, and global financial markets have been bolstered by exceptionally accommodative monetary policies of the European Central Bank and Bank of Japan. The recovery in advanced countries is gathering momentum, benefiting growth in emerging markets. In the United States, labor markets are healing as the recovery is continuing.
0
1
2
3
4
5
6
Jan-
07Ju
l-07
Feb-
08A
ug-0
8M
ar-0
9S
ep-0
9A
pr-1
0O
ct-1
0M
ay-1
1N
ov-1
1Ju
n-12
Dec
-12
Jul-1
3Ja
n-14
Aug
-14
Mar
-15
G3 long-term interest ratesU.S. long-term interest rates
Percent
050
100150200250300350400
2010 2011 2012 2013 2014 2015 2016
Euro AreaUnited StatesJapan
Index = 100 in January 2010
0
0.5
1
1.5
2
2.5
2012 2013 2014 2015
Percent
Average since 2000
97
99
101
103
105
107
456789
1011
2007
2008
2009
2010
2011
2012
2013
2014
2015
Unemployment rateEmployment level (RHS)
Index=100 in Jan 2015 Percent
S P E C I A L F E AT U R E 1 G LO B A L E C O N O M I C P R O S P E C T S | J U N E 2 0 1 5 6
increases that could lie ahead. The 2013 episode was sparked by a statement that became known as “taper talk,” when Fed Chairman Bernanke men-tioned the possibility of the Fed slowing its asset purchases “in the next few meetings” on May 22, 2013 (Bernanke 2013b). While financial markets had expected such an action at some point in the future, they were surprised by the mention of an approximate timeframe. Within a couple months of the initial taper talk, U.S. 10-year Treasury yields increased by 100 basis points.
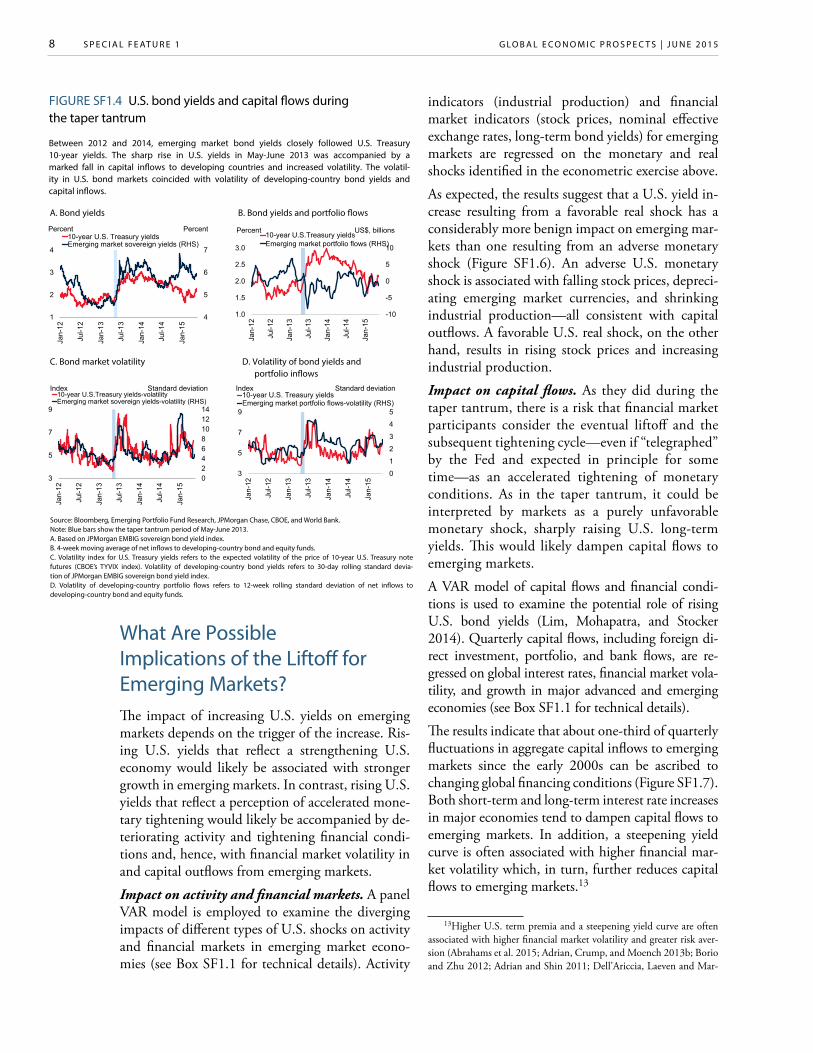
The jump in U.S. yields was quickly followed by a spike in financial market volatility in emerging econ-omies. Specifically, emerging market currencies depre-ciated, bond spreads rose steeply, foreign portfolio in-flows to emerging-market bond and equity funds fell sharply, and liquidity tightened (Figure SF1.4). This forced many emerging markets to tighten monetary policy, intervene in currency markets, and, in some cases, introduce exceptional measures to prevent capi-
A. U.S. long-term yields and stock market index
C. Estimated monetary shocks
B. U.S. long-term yields— counterfactual
D. Estimated real shocks
FIGURE SF1.2 Explaining movements in U.S. bond yields: monetary and real shocks
The sudden rise in U.S. long term yields after May 2013 was mainly due to adverse monetary shocks, as markets interpreted taper talk as signaling accelerated monetary tightening. Since then, favorable financial conditions have been pushing yields down, offsetting upward pressure from strengthening labor markets and activity.
Source: Haver, World Bank estimates.A. Long-term interest rate is the 10-year U.S. Treasury yield and stock price refers to the S&P 500.B. Based on estimates from the model, identifying monetary and real shocks using sign restrictions. All shocks except the shock of interest are shut down by setting them to zeros and the model is used to trace out the coun-terfactual long rate. The exercise is performed separately for monetary and real shocks. The orange (green) counterfactual shows how long rates would have evolved only with the estimated monetary (real) shocks. Num-bers shown are in percentage points.C. D. These are the time series of monetary and real shocks as estimated from the VAR model. Numbers shown are in cumulative percentages. The shock signs are such that whenever positive, they result in an increase in the long rate.
tal outflows.7 Although U.S. bond yields have since fallen back, long-term bond yields in emerging mar-kets remain above those of early 2013.
U.S. financial markets may currently be vulnerable to a sharp tightening around the liftoff or subsequent tightening cycle. The term premium is exceptionally low, expectations about medium-term interest rate paths diverge between market participants and Fed-eral Open Market Committee (FOMC) members, and market liquidity conditions are fragile.
• Low term premium. The term premium in the United States is exceptionally compressed. 8 The current low U.S. term premium partly reflects modest assessment of inflation risks and strong global demand for U.S. treasuries as safe assets.9 This has been reinforced by low interest rates for assets denominated in other reserve currencies, which in part resulted from quantitative easing programs by other major central banks (Ber-nanke 2015). Inherent in the current low term premium is the risk of a sudden widening, with greater uncertainty potentially leading to a surge in long-term yields (Yellen 2015c).10
• Gap between market and FOMC expectations. Since 2014, expectations for the path of future policy rates among market participants have been considerably (currently more than 100 ba-sis points in 2017 and beyond) below those of
7Recent studies—such as Sánchez (2013); Díez (2014); Dahlhaus and Vasishtha (2014); Ikeda, Medvedev, and Rama (2015); and Koepke (2015b)—emphasize the critical role of expectations in determining the scale of macroeconomic adjustments in developing countries in the event of a U.S. interest rate hike. They report that the large macroeco-nomic adjustments in developing countries during the taper tantrum reflected the fact that the consequences of Fed tapering had not yet been “priced in.” In contrast, the relatively milder movements in developing- country financial markets during the actual taper period (December 2013–October 2014) suggested that markets had already adjusted their expectations accordingly.
8Long term interest rates can be decomposed into expectations about the future path of real policy interest rates, inflation expecta-tions, and a term premium. The term premium is therefore the extra return required by investors to hold a longer-term bond instead of re-investing in successive short-term securities. Typically, the term premium is positive.
9See Williams (2015), Abrahams et al. (2015), Blanchard, Furceri, and Pescatori (2014), and Caballero and Farhi (2014) for details on these observations.
10U.S. term premia are highly correlated with macroeconomic and financial uncertainty, reflected in disagreement about future inflation among professional forecasters, consumer confidence, and implied volatility in U.S. Treasury markets (Abrahams et al. 2015). Previous monetary policy surprises and the Federal Reserve’s large-scale asset pur-chases have been important drivers of U.S. term premia in recent years.
1,500
1,700
1,900
2,100
2,300
1.5
2.0
2.5
3.0
3.5
May
-13
Aug
-13
Nov
-13
Feb-
14
May
-14
Aug
-14
Nov
-14
Feb-
15
May
-15
IndexPercent
Long-term interest rateStock price (RHS)
-0.6
0.0
0.6
1.2
May
-13
Aug
-13
Nov
-13
Feb-
14
May
-14
Aug
-14
Nov
-14
Feb-
15
May
-15
Monetary shock Real shock
Percentage point change since May 21, 2013
-15
-5
5
15
25
May
-13
Aug
-13
Nov
-13
Feb-
14
May
-14
Aug
-14
Nov
-14
Feb-
15
May
-15
Percent
-2
0
2
4
May
-13
Aug
-13
Nov
-13
Feb-
14
May
-14
Aug
-14
Nov
-14
Feb-
15
May
-15
Percent
S P E C I A L F E AT U R E 1G LO B A L E C O N O M I C P R O S P E C T S | J U N E 2 0 1 5 7
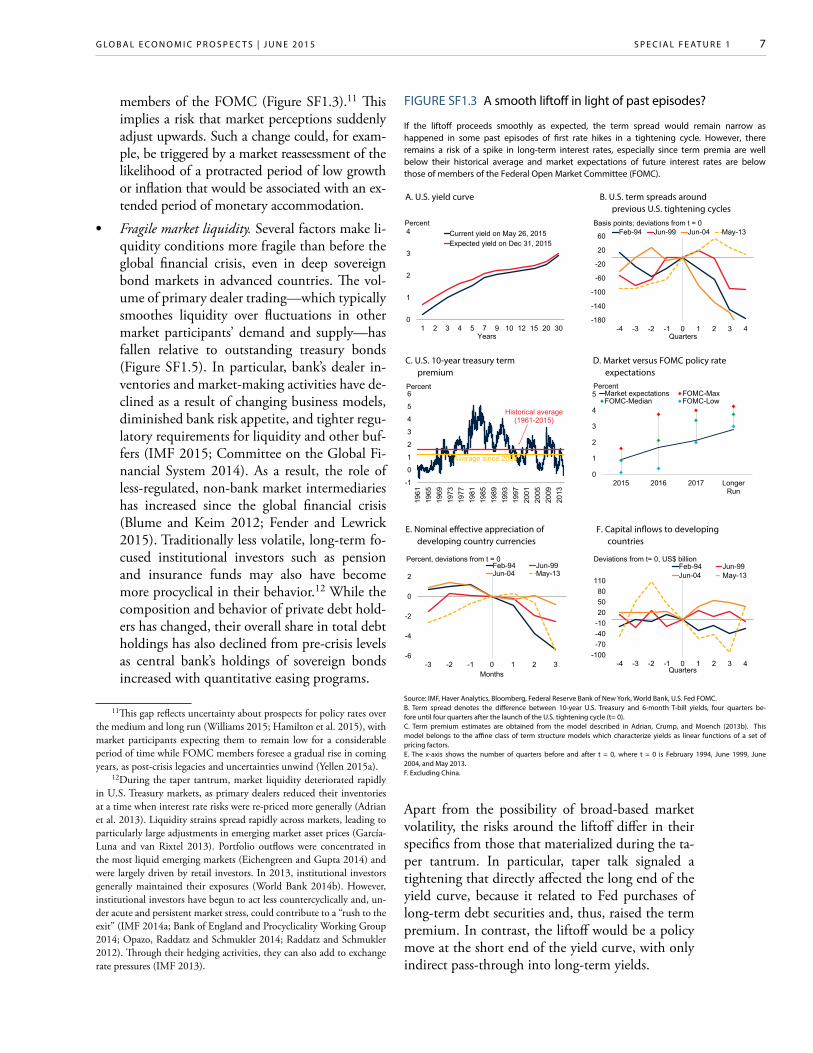
FIGURE SF1.3 A smooth liftoff in light of past episodes?
If the liftoff proceeds smoothly as expected, the term spread would remain narrow as happened in some past episodes of first rate hikes in a tightening cycle. However, there remains a risk of a spike in long-term interest rates, especially since term premia are well below their historical average and market expectations of future interest rates are below those of members of the Federal Open Market Committee (FOMC).
D. Market versus FOMC policy rate expectations
F. Capital inflows to developing countries
Source: IMF, Haver Analytics, Bloomberg, Federal Reserve Bank of New York, World Bank, U.S. Fed FOMC.B. Term spread denotes the difference between 10-year U.S. Treasury and 6-month T-bill yields, four quarters be-fore until four quarters after the launch of the U.S. tightening cycle (t= 0).C. Term premium estimates are obtained from the model described in Adrian, Crump, and Moench (2013b). This model belongs to the affine class of term structure models which characterize yields as linear functions of a set of pricing factors.E. The x-axis shows the number of quarters before and after t = 0, where t = 0 is February 1994, June 1999, June 2004, and May 2013. F. Excluding China.
C. U.S. 10-year treasury term premium
E. Nominal effective appreciation of developing country currencies
A. U.S. yield curve B. U.S. term spreads around previous U.S. tightening cycles
members of the FOMC (Figure SF1.3).11 This implies a risk that market perceptions suddenly adjust upwards. Such a change could, for exam-ple, be triggered by a market reassessment of the likelihood of a protracted period of low growth or inflation that would be associated with an ex-tended period of monetary accommodation.
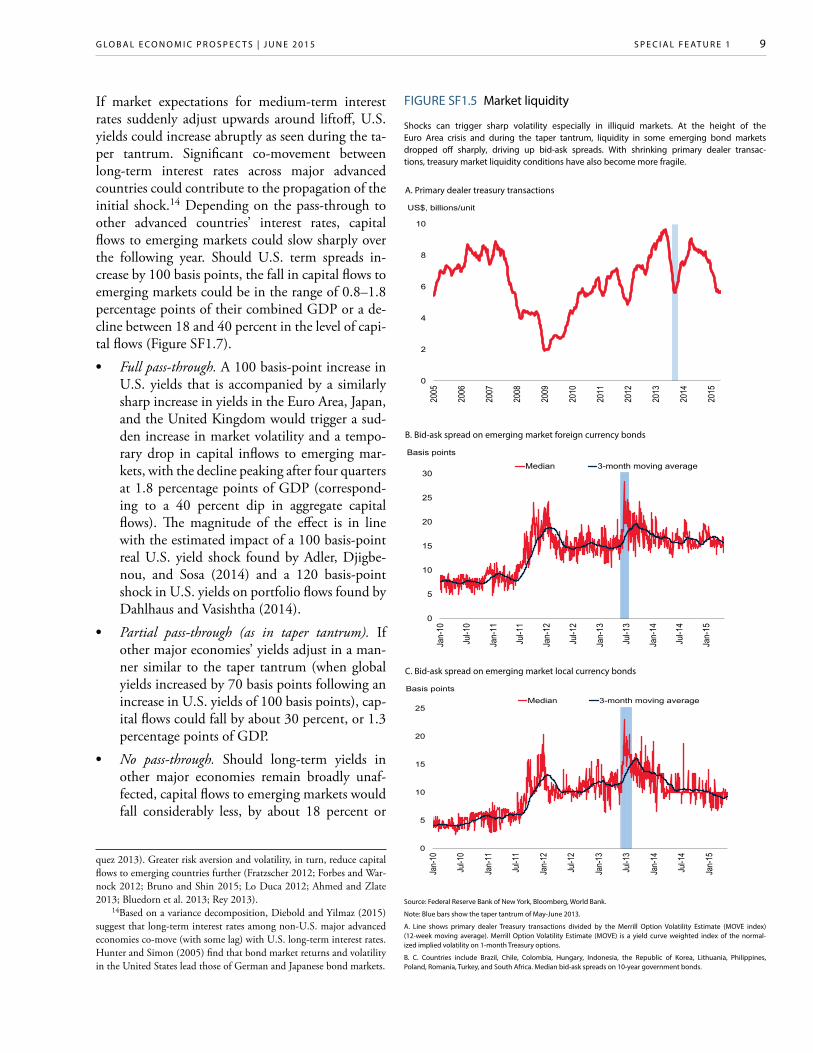
• Fragile market liquidity. Several factors make li-quidity conditions more fragile than before the global financial crisis, even in deep sovereign bond markets in advanced countries. The vol-ume of primary dealer trading—which typically smoothes liquidity over fluctuations in other market participants’ demand and supply—has fallen relative to outstanding treasury bonds (Figure SF1.5). In particular, bank’s dealer in-ventories and market-making activities have de-clined as a result of changing business models, diminished bank risk appetite, and tighter regu-latory requirements for liquidity and other buf-fers (IMF 2015; Committee on the Global Fi-nancial System 2014). As a result, the role of less-regulated, non-bank market intermediaries has increased since the global financial crisis (Blume and Keim 2012; Fender and Lewrick 2015). Traditionally less volatile, long-term fo-cused institutional investors such as pension and insurance funds may also have become more procyclical in their behavior.12 While the composition and behavior of private debt hold-ers has changed, their overall share in total debt holdings has also declined from pre-crisis levels as central bank’s holdings of sovereign bonds increased with quantitative easing programs.
11This gap reflects uncertainty about prospects for policy rates over the medium and long run (Williams 2015; Hamilton et al. 2015), with market participants expecting them to remain low for a considerable period of time while FOMC members foresee a gradual rise in coming years, as post-crisis legacies and uncertainties unwind (Yellen 2015a).
12During the taper tantrum, market liquidity deteriorated rapidly in U.S. Treasury markets, as primary dealers reduced their inventories at a time when interest rate risks were re-priced more generally (Adrian et al. 2013). Liquidity strains spread rapidly across markets, leading to particularly large adjustments in emerging market asset prices (García-Luna and van Rixtel 2013). Portfolio outflows were concentrated in the most liquid emerging markets (Eichengreen and Gupta 2014) and were largely driven by retail investors. In 2013, institutional investors generally maintained their exposures (World Bank 2014b). However, institutional investors have begun to act less countercyclically and, un-der acute and persistent market stress, could contribute to a “rush to the exit” (IMF 2014a; Bank of England and Procyclicality Working Group 2014; Opazo, Raddatz and Schmukler 2014; Raddatz and Schmukler 2012). Through their hedging activities, they can also add to exchange rate pressures (IMF 2013).
Apart from the possibility of broad-based market volatility, the risks around the liftoff differ in their specifics from those that materialized during the ta-per tantrum. In particular, taper talk signaled a tightening that directly affected the long end of the yield curve, because it related to Fed purchases of long-term debt securities and, thus, raised the term premium. In contrast, the liftoff would be a policy move at the short end of the yield curve, with only indirect pass-through into long-term yields.
0
1
2
3
4
1 2 3 4 5 7 9 10 12 15 20 30
Current yield on May 26, 2015Expected yield on Dec 31, 2015
Percent
Years
-180
-140
-100
-60
-20
20
60
-4 -3 -2 -1 0 1 2 3 4
Feb-94 Jun-99 Jun-04 May-13Basis points; deviations from t = 0
Quarters
-1
0
1
2
3
4
5
6
1961
1965
1969
1973
1977
1981
1985
1989
1993
1997
2001
2005
2009
2013
Percent
Historical average (1961-2015)
Average since 2000
0
1
2
3
4
5
2015 2016 2017 LongerRun
Market expectations FOMC-MaxFOMC-Median FOMC-Low
Percent
-6
-4
-2
0
2
-3 -2 -1 0 1 2 3
Feb-94 Jun-99Jun-04 May-13
Percent, deviations from t = 0
Months
-100-70-40-10205080
110
-4 -3 -2 -1 0 1 2 3 4
Feb-94 Jun-99Jun-04 May-13
Deviations from t= 0, US$ billion
Quarters
S P E C I A L F E AT U R E 1 G LO B A L E C O N O M I C P R O S P E C T S | J U N E 2 0 1 5 8
What Are Possible Implications of the Liftoff for Emerging Markets? The impact of increasing U.S. yields on emerging markets depends on the trigger of the increase. Ris-ing U.S. yields that reflect a strengthening U.S. economy would likely be associated with stronger growth in emerging markets. In contrast, rising U.S. yields that reflect a perception of accelerated mone-tary tightening would likely be accompanied by de-teriorating activity and tightening financial condi-tions and, hence, with financial market volatility in and capital outflows from emerging markets.
Impact on activity and financial markets. A panel VAR model is employed to examine the diverging impacts of different types of U.S. shocks on activity and financial markets in emerging market econo-mies (see Box SF1.1 for technical details). Activity
indicators (industrial production) and financial market indicators (stock prices, nominal effective exchange rates, long-term bond yields) for emerging markets are regressed on the monetary and real shocks identified in the econometric exercise above.
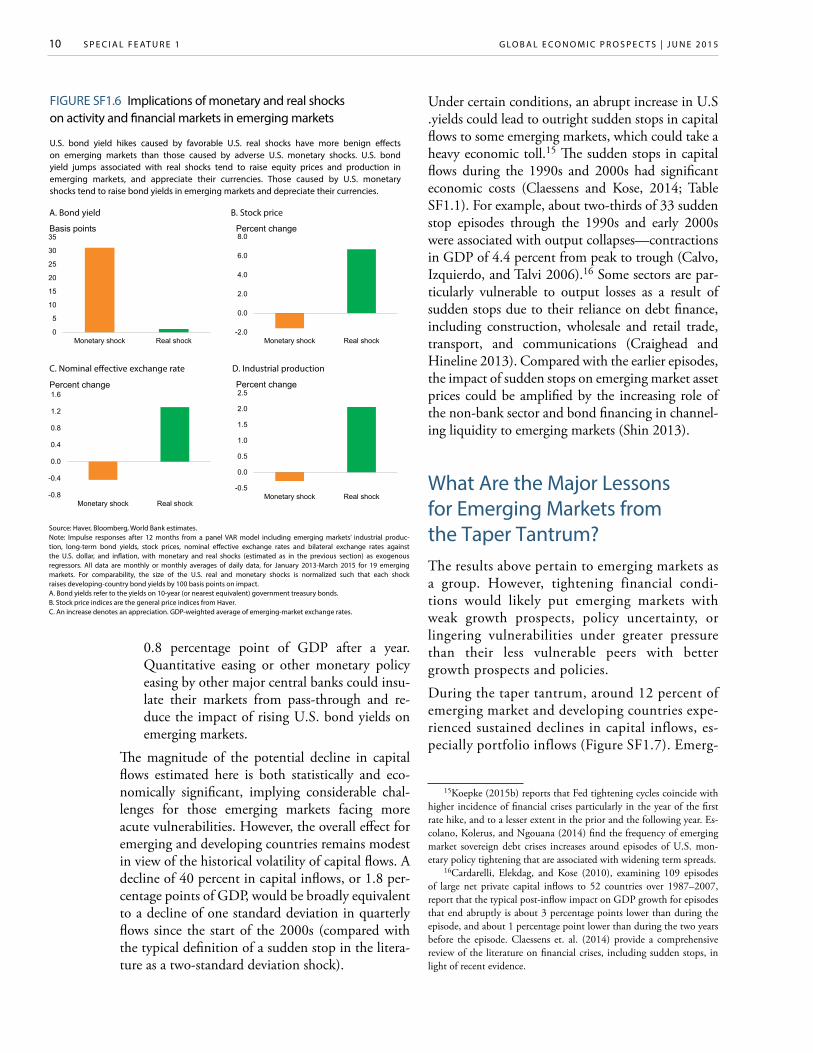
As expected, the results suggest that a U.S. yield in-crease resulting from a favorable real shock has a considerably more benign impact on emerging mar-kets than one resulting from an adverse monetary shock (Figure SF1.6). An adverse U.S. monetary shock is associated with falling stock prices, depreci-ating emerging market currencies, and shrinking industrial production—all consistent with capital outflows. A favorable U.S. real shock, on the other hand, results in rising stock prices and increasing industrial production.
Impact on capital flows. As they did during the taper tantrum, there is a risk that financial market participants consider the eventual liftoff and the subsequent tightening cycle—even if “telegraphed” by the Fed and expected in principle for some time—as an accelerated tightening of monetary conditions. As in the taper tantrum, it could be interpreted by markets as a purely unfavorable monetary shock, sharply raising U.S. long-term yields. This would likely dampen capital flows to emerging markets.
A VAR model of capital flows and financial condi-tions is used to examine the potential role of rising U.S. bond yields (Lim, Mohapatra, and Stocker 2014). Quarterly capital flows, including foreign di-rect investment, portfolio, and bank flows, are re-gressed on global interest rates, financial market vola-tility, and growth in major advanced and emerging economies (see Box SF1.1 for technical details).
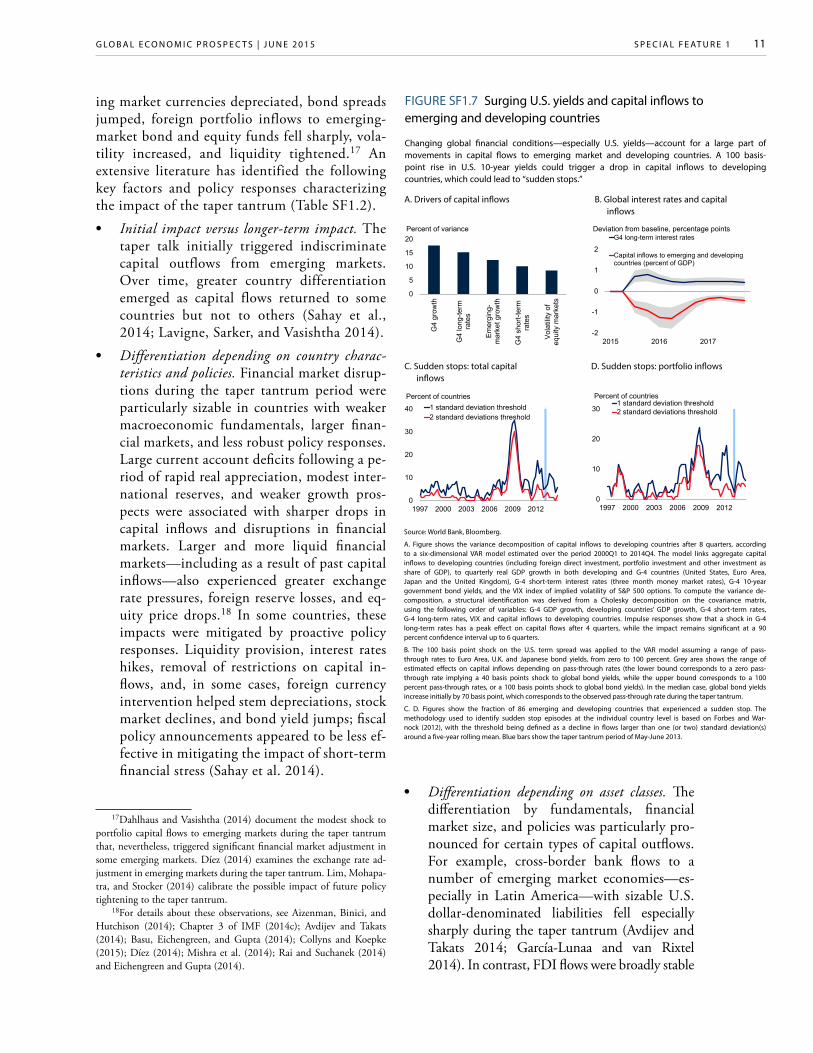
The results indicate that about one-third of quarterly fluctuations in aggregate capital inflows to emerging markets since the early 2000s can be ascribed to changing global financing conditions (Figure SF1.7). Both short-term and long-term interest rate increases in major economies tend to dampen capital flows to emerging markets. In addition, a steepening yield curve is often associated with higher financial mar-ket volatility which, in turn, further reduces capital flows to emerging markets.13
13Higher U.S. term premia and a steepening yield curve are often associated with higher financial market volatility and greater risk aver-sion (Abrahams et al. 2015; Adrian, Crump, and Moench 2013b; Borio and Zhu 2012; Adrian and Shin 2011; Dell’Ariccia, Laeven and Mar-
A. Bond yields
C. Bond market volatility
B. Bond yields and portfolio flows
D. Volatility of bond yields and portfolio inflows
Source: Bloomberg, Emerging Portfolio Fund Research, JPMorgan Chase, CBOE, and World Bank.Note: Blue bars show the taper tantrum period of May-June 2013.A. Based on JPMorgan EMBIG sovereign bond yield index. B. 4-week moving average of net inflows to developing-country bond and equity funds.C. Volatility index for U.S. Treasury yields refers to the expected volatility of the price of 10-year U.S. Treasury note futures (CBOE’s TYVIX index). Volatility of developing-country bond yields refers to 30-day rolling standard devia-tion of JPMorgan EMBIG sovereign bond yield index. D. Volatility of developing-country portfolio flows refers to 12-week rolling standard deviation of net inflows to developing-country bond and equity funds.
FIGURE SF1.4 U.S. bond yields and capital flows during the taper tantrum
Between 2012 and 2014, emerging market bond yields closely followed U.S. Treasury 10-year yields. The sharp rise in U.S. yields in May-June 2013 was accompanied by a marked fall in capital inflows to developing countries and increased volatility. The volatil-ity in U.S. bond markets coincided with volatility of developing-country bond yields and capital inflows.
4
5
6
7
1
2
3
4
Jan-
12
Jul-1
2
Jan-
13
Jul-1
3
Jan-
14
Jul-1
4
Jan-
15
10-year U.S. Treasury yieldsEmerging market sovereign yields (RHS)
Percent Percent
-10
-5
0
5
10
1.0
1.5
2.0
2.5
3.0Ja
n-12
Jul-1
2
Jan-
13
Jul-1
3
Jan-
14
Jul-1
4
Jan-
15
10-year U.S.Treasury yieldsEmerging market portfolio flows (RHS)
Percent US$, billions
02468101214
3
5
7
9
Jan-
12
Jul-1
2
Jan-
13
Jul-1
3
Jan-
14
Jul-1
4
Jan-
15
10-year U.S.Treasury yields-volatilityEmerging market sovereign yields-volatility (RHS)
Index Standard deviation
0
1
2
3
4
5
3
5
7
9
Jan-
12
Jul-1
2
Jan-
13
Jul-1
3
Jan-
14
Jul-1
4
Jan-
15
10-year U.S. Treasury yieldsEmerging market portfolio flows-volatility (RHS)
Index Standard deviation
S P E C I A L F E AT U R E 1G LO B A L E C O N O M I C P R O S P E C T S | J U N E 2 0 1 5 9
If market expectations for medium-term interest rates suddenly adjust upwards around liftoff, U.S. yields could increase abruptly as seen during the ta-per tantrum. Significant co-movement between long-term interest rates across major advanced countries could contribute to the propagation of the initial shock.14 Depending on the pass-through to other advanced countries’ interest rates, capital flows to emerging markets could slow sharply over the following year. Should U.S. term spreads in-crease by 100 basis points, the fall in capital flows to emerging markets could be in the range of 0.8–1.8 percentage points of their combined GDP or a de-cline between 18 and 40 percent in the level of capi-tal flows (Figure SF1.7).
• Full pass-through. A 100 basis-point increase in U.S. yields that is accompanied by a similarly sharp increase in yields in the Euro Area, Japan, and the United Kingdom would trigger a sud-den increase in market volatility and a tempo-rary drop in capital inflows to emerging mar-kets, with the decline peaking after four quarters at 1.8 percentage points of GDP (correspond-ing to a 40 percent dip in aggregate capital flows). The magnitude of the effect is in line with the estimated impact of a 100 basis-point real U.S. yield shock found by Adler, Djigbe-nou, and Sosa (2014) and a 120 basis-point shock in U.S. yields on portfolio flows found by Dahlhaus and Vasishtha (2014).
• Partial pass-through (as in taper tantrum). If other major economies’ yields adjust in a man-ner similar to the taper tantrum (when global yields increased by 70 basis points following an increase in U.S. yields of 100 basis points), cap-ital flows could fall by about 30 percent, or 1.3 percentage points of GDP.
• No pass-through. Should long-term yields in other major economies remain broadly unaf-fected, capital flows to emerging markets would fall considerably less, by about 18 percent or
quez 2013). Greater risk aversion and volatility, in turn, reduce capital flows to emerging countries further (Fratzscher 2012; Forbes and War-nock 2012; Bruno and Shin 2015; Lo Duca 2012; Ahmed and Zlate 2013; Bluedorn et al. 2013; Rey 2013).
14Based on a variance decomposition, Diebold and Yilmaz (2015) suggest that long-term interest rates among non-U.S. major advanced economies co-move (with some lag) with U.S. long-term interest rates. Hunter and Simon (2005) find that bond market returns and volatility in the United States lead those of German and Japanese bond markets.
A. Primary dealer treasury transactions
FIGURE SF1.5 Market liquidity
Shocks can trigger sharp volatility especially in illiquid markets. At the height of the Euro Area crisis and during the taper tantrum, liquidity in some emerging bond markets dropped off sharply, driving up bid-ask spreads. With shrinking primary dealer transac-tions, treasury market liquidity conditions have also become more fragile.
Source: Federal Reserve Bank of New York, Bloomberg, World Bank.
Note: Blue bars show the taper tantrum of May-June 2013.
A. Line shows primary dealer Treasury transactions divided by the Merrill Option Volatility Estimate (MOVE index) (12-week moving average). Merrill Option Volatility Estimate (MOVE) is a yield curve weighted index of the normal-ized implied volatility on 1-month Treasury options.
B. C. Countries include Brazil, Chile, Colombia, Hungary, Indonesia, the Republic of Korea, Lithuania, Philippines, Poland, Romania, Turkey, and South Africa. Median bid-ask spreads on 10-year government bonds.
B. Bid-ask spread on emerging market foreign currency bonds
0
2
4
6
8
10
2005
2006
2007
2008
2009
2010
2011
2012
2013
2014
2015
US$, billions/unit
0
5
10
15
20
25
30
Jan-
10
Jul-1
0
Jan-
11
Jul-1
1
Jan-
12
Jul-1
2
Jan-
13
Jul-1
3
Jan-
14
Jul-1
4
Jan-
15
Median 3-month moving average
Basis points
C. Bid-ask spread on emerging market local currency bonds
0
5
10
15
20
25
Jan-
10
Jul-1
0
Jan-
11
Jul-1
1
Jan-
12
Jul-1
2
Jan-
13
Jul-1
3
Jan-
14
Jul-1
4
Jan-
15Median 3-month moving average
Basis points
S P E C I A L F E AT U R E 1 G LO B A L E C O N O M I C P R O S P E C T S | J U N E 2 0 1 5 10
0.8 percentage point of GDP after a year. Quantitative easing or other monetary policy easing by other major central banks could insu-late their markets from pass-through and re-duce the impact of rising U.S. bond yields on emerging markets.
The magnitude of the potential decline in capital flows estimated here is both statistically and eco-nomically significant, implying considerable chal-lenges for those emerging markets facing more acute vulnerabilities. However, the overall effect for emerging and developing countries remains modest in view of the historical volatility of capital flows. A decline of 40 percent in capital inflows, or 1.8 per-centage points of GDP, would be broadly equivalent to a decline of one standard deviation in quarterly flows since the start of the 2000s (compared with the typical definition of a sudden stop in the litera-ture as a two-standard deviation shock).
Under certain conditions, an abrupt increase in U.S .yields could lead to outright sudden stops in capital flows to some emerging markets, which could take a heavy economic toll.15 The sudden stops in capital flows during the 1990s and 2000s had significant economic costs (Claessens and Kose, 2014; Table SF1.1). For example, about two-thirds of 33 sudden stop episodes through the 1990s and early 2000s were associated with output collapses—contractions in GDP of 4.4 percent from peak to trough (Calvo, Izquierdo, and Talvi 2006).16 Some sectors are par-ticularly vulnerable to output losses as a result of sudden stops due to their reliance on debt finance, including construction, wholesale and retail trade, transport, and communications (Craighead and Hineline 2013). Compared with the earlier episodes, the impact of sudden stops on emerging market asset prices could be amplified by the increasing role of the non-bank sector and bond financing in channel-ing liquidity to emerging markets (Shin 2013).
What Are the Major Lessons for Emerging Markets from the Taper Tantrum?The results above pertain to emerging markets as a group. However, tightening financial condi-tions would likely put emerging markets with weak growth prospects, policy uncertainty, or lingering vulnerabilities under greater pressure than their less vulnerable peers with better growth prospects and policies.
During the taper tantrum, around 12 percent of emerging market and developing countries expe-rienced sustained declines in capital inflows, es-pecially portfolio inflows (Figure SF1.7). Emerg-
15Koepke (2015b) reports that Fed tightening cycles coincide with higher incidence of financial crises particularly in the year of the first rate hike, and to a lesser extent in the prior and the following year. Es-colano, Kolerus, and Ngouana (2014) find the frequency of emerging market sovereign debt crises increases around episodes of U.S. mon-etary policy tightening that are associated with widening term spreads.
16Cardarelli, Elekdag, and Kose (2010), examining 109 episodes of large net private capital inflows to 52 countries over 1987–2007, report that the typical post-inflow impact on GDP growth for episodes that end abruptly is about 3 percentage points lower than during the episode, and about 1 percentage point lower than during the two years before the episode. Claessens et. al. (2014) provide a comprehensive review of the literature on financial crises, including sudden stops, in light of recent evidence.
A. Bond yield B. Stock price
Source: Haver, Bloomberg, World Bank estimates.Note: Impulse responses after 12 months from a panel VAR model including emerging markets’ industrial produc-tion, long-term bond yields, stock prices, nominal effective exchange rates and bilateral exchange rates against the U.S. dollar, and inflation, with monetary and real shocks (estimated as in the previous section) as exogenous regressors. All data are monthly or monthly averages of daily data, for January 2013-March 2015 for 19 emerging markets. For comparability, the size of the U.S. real and monetary shocks is normalized such that each shock raises developing-country bond yields by 100 basis points on impact.A. Bond yields refer to the yields on 10-year (or nearest equivalent) government treasury bonds.B. Stock price indices are the general price indices from Haver.C. An increase denotes an appreciation. GDP-weighted average of emerging-market exchange rates.
FIGURE SF1.6 Implications of monetary and real shocks on activity and financial markets in emerging markets
U.S. bond yield hikes caused by favorable U.S. real shocks have more benign effects on emerging markets than those caused by adverse U.S. monetary shocks. U.S. bond yield jumps associated with real shocks tend to raise equity prices and production in emerging markets, and appreciate their currencies. Those caused by U.S. monetary shocks tend to raise bond yields in emerging markets and depreciate their currencies.
C. Nominal effective exchange rate D. Industrial production
0
5
10
15
20
25
30
35
Monetary shock Real shock
Basis points
-2.0
0.0
2.0
4.0
6.0
8.0
Monetary shock Real shock
Percent change
-0.8
-0.4
0.0
0.4
0.8
1.2
1.6
Monetary shock Real shock
Percent change
-0.5
0.0
0.5
1.0
1.5
2.0
2.5
Monetary shock Real shock
Percent change
S P E C I A L F E AT U R E 1G LO B A L E C O N O M I C P R O S P E C T S | J U N E 2 0 1 5 11
ing market currencies depreciated, bond spreads jumped, foreign portfolio inflows to emerging-market bond and equity funds fell sharply, vola-tility increased, and liquidity tightened.17 An extensive literature has identified the following key factors and policy responses characterizing the impact of the taper tantrum (Table SF1.2).
• Initial impact versus longer-term impact. The taper talk initially triggered indiscriminate capital outflows from emerging markets. Over time, greater country differentiation emerged as capital flows returned to some countries but not to others (Sahay et al., 2014; Lavigne, Sarker, and Vasishtha 2014).
• Differentiation depending on country charac-teristics and policies. Financial market disrup-tions during the taper tantrum period were particularly sizable in countries with weaker macroeconomic fundamentals, larger finan-cial markets, and less robust policy responses. Large current account deficits following a pe-riod of rapid real appreciation, modest inter-national reserves, and weaker growth pros-pects were associated with sharper drops in capital inflows and disruptions in financial markets. Larger and more liquid financial markets—including as a result of past capital inflows—also experienced greater exchange rate pressures, foreign reserve losses, and eq-uity price drops.18 In some countries, these impacts were mitigated by proactive policy responses. Liquidity provision, interest rates hikes, removal of restrictions on capital in-flows, and, in some cases, foreign currency intervention helped stem depreciations, stock market declines, and bond yield jumps; fiscal policy announcements appeared to be less ef-fective in mitigating the impact of short-term financial stress (Sahay et al. 2014).
17Dahlhaus and Vasishtha (2014) document the modest shock to portfolio capital flows to emerging markets during the taper tantrum that, nevertheless, triggered significant financial market adjustment in some emerging markets. Díez (2014) examines the exchange rate ad-justment in emerging markets during the taper tantrum. Lim, Mohapa-tra, and Stocker (2014) calibrate the possible impact of future policy tightening to the taper tantrum.
18For details about these observations, see Aizenman, Binici, and Hutchison (2014); Chapter 3 of IMF (2014c); Avdijev and Takats (2014); Basu, Eichengreen, and Gupta (2014); Collyns and Koepke (2015); Díez (2014); Mishra et al. (2014); Rai and Suchanek (2014) and Eichengreen and Gupta (2014).
• Differentiation depending on asset classes. The differentiation by fundamentals, financial market size, and policies was particularly pro-nounced for certain types of capital outflows. For example, cross-border bank flows to a number of emerging market economies—es-pecially in Latin America—with sizable U.S. dollar-denominated liabilities fell especially sharply during the taper tantrum (Avdijev and Takats 2014; García-Lunaa and van Rixtel 2014). In contrast, FDI flows were broadly stable
A. Drivers of capital inflows B. Global interest rates and capital inflows
Source: World Bank, Bloomberg.
A. Figure shows the variance decomposition of capital inflows to developing countries after 8 quarters, according to a six-dimensional VAR model estimated over the period 2000Q1 to 2014Q4. The model links aggregate capital inflows to developing countries (including foreign direct investment, portfolio investment and other investment as share of GDP), to quarterly real GDP growth in both developing and G-4 countries (United States, Euro Area, Japan and the United Kingdom), G-4 short-term interest rates (three month money market rates), G-4 10-year government bond yields, and the VIX index of implied volatility of S&P 500 options. To compute the variance de-composition, a structural identification was derived from a Cholesky decomposition on the covariance matrix, using the following order of variables: G-4 GDP growth, developing countries’ GDP growth, G-4 short-term rates, G-4 long-term rates, VIX and capital inflows to developing countries. Impulse responses show that a shock in G-4 long-term rates has a peak effect on capital flows after 4 quarters, while the impact remains significant at a 90 percent confidence interval up to 6 quarters.
B. The 100 basis point shock on the U.S. term spread was applied to the VAR model assuming a range of pass-through rates to Euro Area, U.K. and Japanese bond yields, from zero to 100 percent. Grey area shows the range of estimated effects on capital inflows depending on pass-through rates (the lower bound corresponds to a zero pass-through rate implying a 40 basis points shock to global bond yields, while the upper bound corresponds to a 100 percent pass-through rates, or a 100 basis points shock to global bond yields). In the median case, global bond yields increase initially by 70 basis point, which corresponds to the observed pass-through rate during the taper tantrum.
C. D. Figures show the fraction of 86 emerging and developing countries that experienced a sudden stop. The methodology used to identify sudden stop episodes at the individual country level is based on Forbes and War-nock (2012), with the threshold being defined as a decline in flows larger than one (or two) standard deviation(s) around a five-year rolling mean. Blue bars show the taper tantrum period of May-June 2013.
FIGURE SF1.7 Surging U.S. yields and capital inflows to emerging and developing countries
Changing global financial conditions—especially U.S. yields—account for a large part of movements in capital flows to emerging market and developing countries. A 100 basis- point rise in U.S. 10-year yields could trigger a drop in capital inflows to developing countries, which could lead to “sudden stops.”
0
5
10
15
20
G4
grow
th
G4
long
-term
rate
s
Em
ergi
ng-
mar
ket g
row
th
G4
shor
t-ter
mra
tes
Vol
atili
ty o
feq
uity
mar
kets
Percent of variance
-2
-1
0
1
2
2015 2016 2017
G4 long-term interest rates
Capital inflows to emerging and developingcountries (percent of GDP)
Deviation from baseline, percentage points
C. Sudden stops: total capital inflows
D. Sudden stops: portfolio inflows
0
10
20
30
40
1997 2000 2003 2006 2009 2012
1 standard deviation threshold2 standard deviations threshold
Percent of countries
0
10
20
30
1997 2000 2003 2006 2009 2012
1 standard deviation threshold2 standard deviations threshold
Percent of countries
S P E C I A L F E AT U R E 1 G LO B A L E C O N O M I C P R O S P E C T S | J U N E 2 0 1 5 12
(Basu, Eichengreen, and Gupta 2014), and drops in equity market valuations were more uniform across countries (Mishra et al. 2014; Rai and Suchanek 2014).
Lessons from the taper tantrum episode are consis-tent with those from the broader literature on sud-den stops in capital inflows. Country-specific vul-nerabilities not only increase the probability of a sudden stop, but also intensify its severity in terms of currency depreciation, private sector credit con-traction, and growth declines, and lengthen the time it takes for growth to revert to its long-term trend (see also Table SF1.1). A greater reliance on FDI and equity flows instead of debt flows and cross-border bank loans may reduce the severity of sudden stop episodes (Levchenko and Mauro 2007).
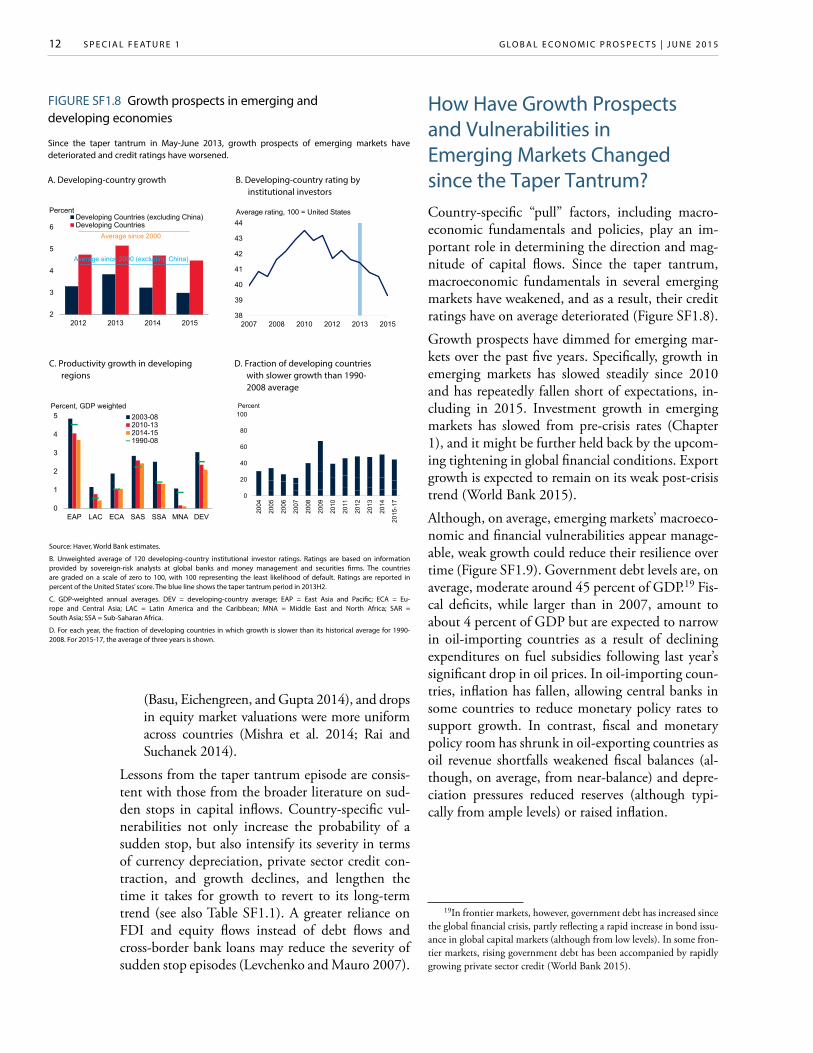
How Have Growth Prospects and Vulnerabilities in Emerging Markets Changed since the Taper Tantrum? Country-specific “pull” factors, including macro-economic fundamentals and policies, play an im-portant role in determining the direction and mag-nitude of capital flows. Since the taper tantrum, macroeconomic fundamentals in several emerging markets have weakened, and as a result, their credit ratings have on average deteriorated (Figure SF1.8).
Growth prospects have dimmed for emerging mar-kets over the past five years. Specifically, growth in emerging markets has slowed steadily since 2010 and has repeatedly fallen short of expectations, in-cluding in 2015. Investment growth in emerging markets has slowed from pre-crisis rates (Chapter 1), and it might be further held back by the upcom-ing tightening in global financial conditions. Export growth is expected to remain on its weak post-crisis trend (World Bank 2015).
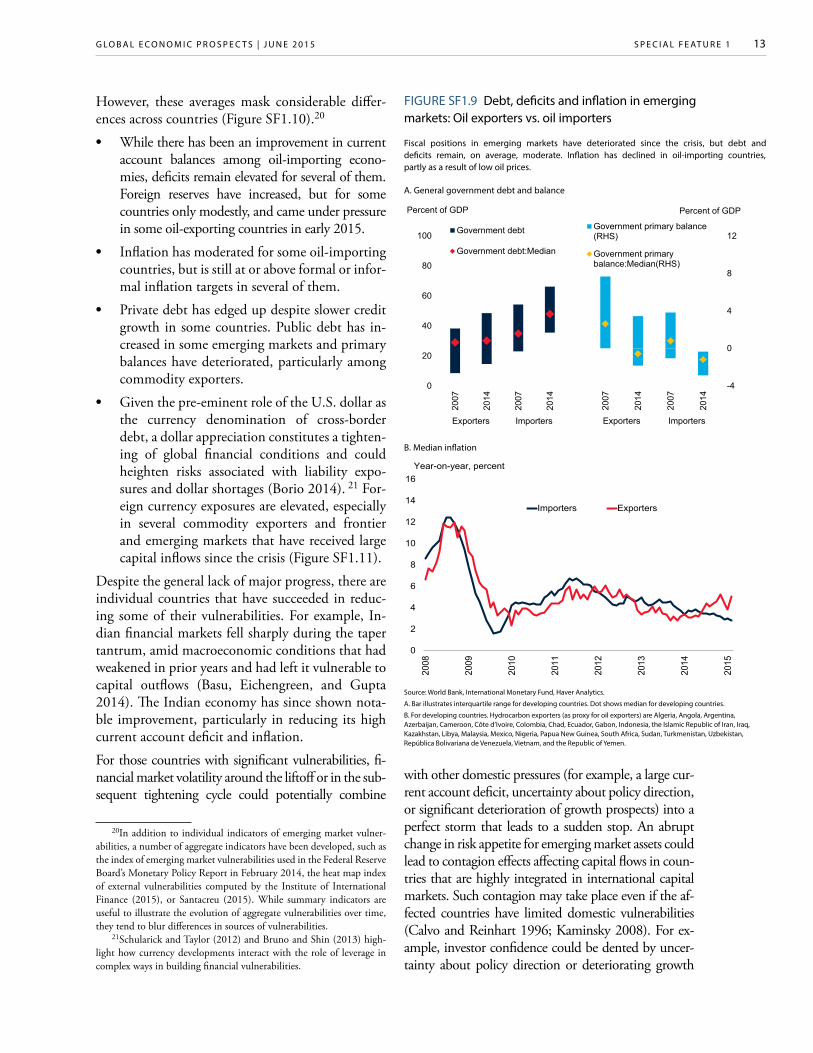
Although, on average, emerging markets’ macroeco-nomic and financial vulnerabilities appear manage-able, weak growth could reduce their resilience over time (Figure SF1.9). Government debt levels are, on average, moderate around 45 percent of GDP.19 Fis-cal deficits, while larger than in 2007, amount to about 4 percent of GDP but are expected to narrow in oil-importing countries as a result of declining expenditures on fuel subsidies following last year’s significant drop in oil prices. In oil-importing coun-tries, inflation has fallen, allowing central banks in some countries to reduce monetary policy rates to support growth. In contrast, fiscal and monetary policy room has shrunk in oil-exporting countries as oil revenue shortfalls weakened fiscal balances (al-though, on average, from near-balance) and depre-ciation pressures reduced reserves (although typi-cally from ample levels) or raised inflation.
19In frontier markets, however, government debt has increased since the global financial crisis, partly reflecting a rapid increase in bond issu-ance in global capital markets (although from low levels). In some fron-tier markets, rising government debt has been accompanied by rapidly growing private sector credit (World Bank 2015).
A. Developing-country growth
C. Productivity growth in developing regions
B. Developing-country rating by institutional investors
D. Fraction of developing countries with slower growth than 1990-2008 average
Source: Haver, World Bank estimates.
B. Unweighted average of 120 developing-country institutional investor ratings. Ratings are based on information provided by sovereign-risk analysts at global banks and money management and securities firms. The countries are graded on a scale of zero to 100, with 100 representing the least likelihood of default. Ratings are reported in percent of the United States’ score. The blue line shows the taper tantrum period in 2013H2.
C. GDP-weighted annual averages. DEV = developing-country average; EAP = East Asia and Pacific; ECA = Eu-rope and Central Asia; LAC = Latin America and the Caribbean; MNA = Middle East and North Africa; SAR = South Asia; SSA = Sub-Saharan Africa.
D. For each year, the fraction of developing countries in which growth is slower than its historical average for 1990-2008. For 2015-17, the average of three years is shown.
FIGURE SF1.8 Growth prospects in emerging and developing economies
Since the taper tantrum in May-June 2013, growth prospects of emerging markets have deteriorated and credit ratings have worsened.
2
3
4
5
6
2012 2013 2014 2015
Developing Countries (excluding China)Developing Countries
Percent
Average since 2000
Average since 2000 (excluding China)
38
39
40
41
42
43
44
2007 2008 2010 2012 2013 2015
Average rating, 100 = United States
0
1
2
3
4
5
EAP LAC ECA SAS SSA MNA DEV
2003-082010-132014-151990-08
Percent, GDP weighted
0
20
40
60
80
100
2004
2005
2006
2007
2008
2009
2010
2011
2012
2013
2014
2015
-17
Percent
S P E C I A L F E AT U R E 1G LO B A L E C O N O M I C P R O S P E C T S | J U N E 2 0 1 5 13
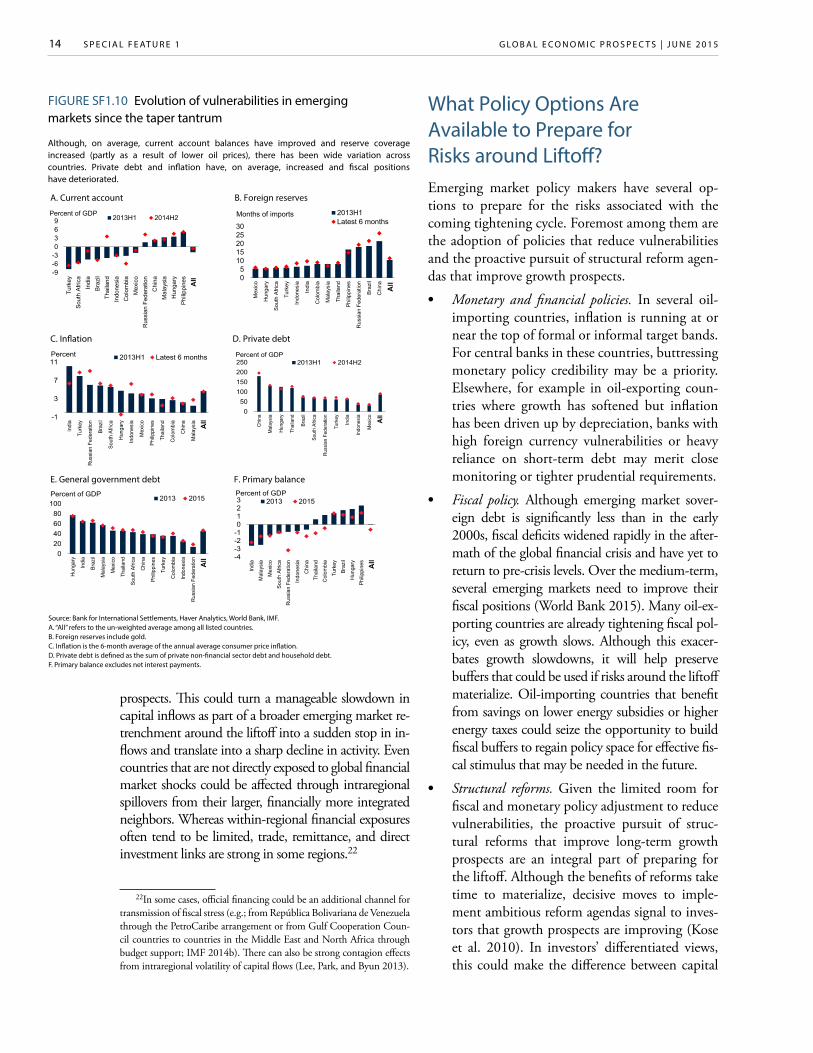
However, these averages mask considerable differ-ences across countries (Figure SF1.10).20
• While there has been an improvement in current account balances among oil-importing econo-mies, deficits remain elevated for several of them. Foreign reserves have increased, but for some countries only modestly, and came under pressure in some oil-exporting countries in early 2015.
• Inflation has moderated for some oil-importing countries, but is still at or above formal or infor-mal inflation targets in several of them.
• Private debt has edged up despite slower credit growth in some countries. Public debt has in-creased in some emerging markets and primary balances have deteriorated, particularly among commodity exporters.
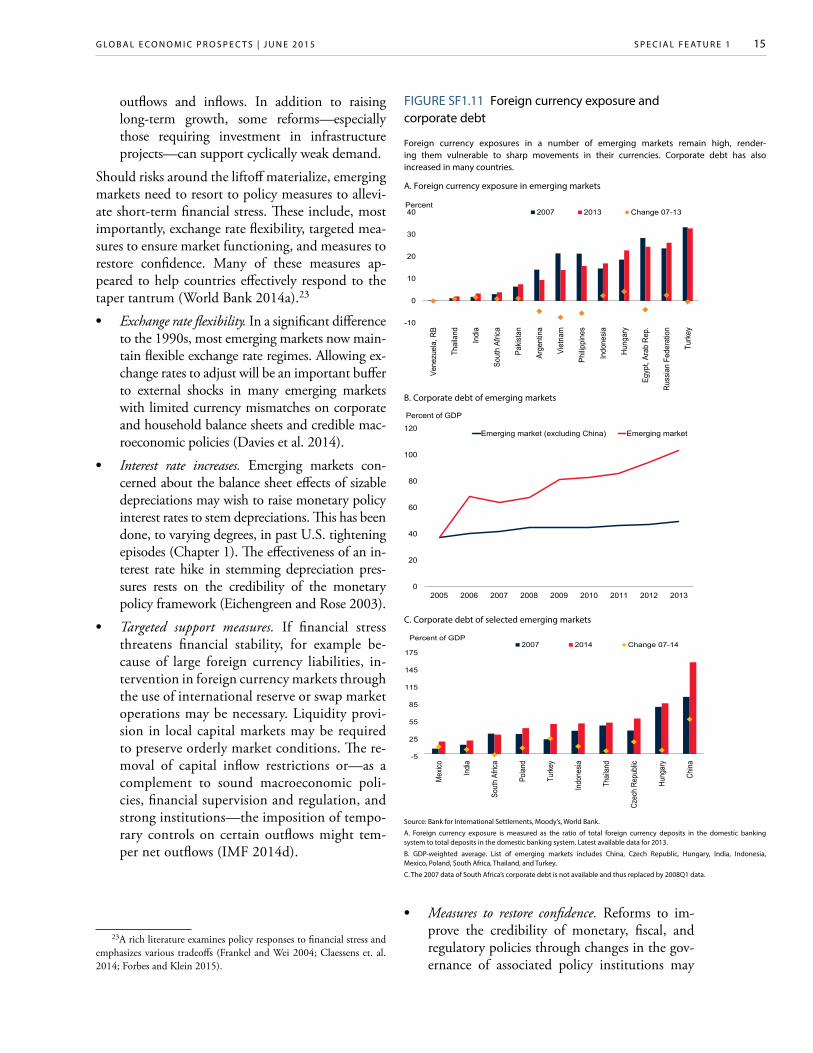
• Given the pre-eminent role of the U.S. dollar as the currency denomination of cross-border debt, a dollar appreciation constitutes a tighten-ing of global financial conditions and could heighten risks associated with liability expo-sures and dollar shortages (Borio 2014). 21 For-eign currency exposures are elevated, especially in several commodity exporters and frontier and emerging markets that have received large capital inflows since the crisis (Figure SF1.11).
Despite the general lack of major progress, there are individual countries that have succeeded in reduc-ing some of their vulnerabilities. For example, In-dian financial markets fell sharply during the taper tantrum, amid macroeconomic conditions that had weakened in prior years and had left it vulnerable to capital outflows (Basu, Eichengreen, and Gupta 2014). The Indian economy has since shown nota-ble improvement, particularly in reducing its high current account deficit and inflation.
For those countries with significant vulnerabilities, fi-nancial market volatility around the liftoff or in the sub-sequent tightening cycle could potentially combine
20In addition to individual indicators of emerging market vulner-abilities, a number of aggregate indicators have been developed, such as the index of emerging market vulnerabilities used in the Federal Reserve Board’s Monetary Policy Report in February 2014, the heat map index of external vulnerabilities computed by the Institute of International Finance (2015), or Santacreu (2015). While summary indicators are useful to illustrate the evolution of aggregate vulnerabilities over time, they tend to blur differences in sources of vulnerabilities.
21Schularick and Taylor (2012) and Bruno and Shin (2013) high-light how currency developments interact with the role of leverage in complex ways in building financial vulnerabilities.
with other domestic pressures (for example, a large cur-rent account deficit, uncertainty about policy direction, or significant deterioration of growth prospects) into a perfect storm that leads to a sudden stop. An abrupt change in risk appetite for emerging market assets could lead to contagion effects affecting capital flows in coun-tries that are highly integrated in international capital markets. Such contagion may take place even if the af-fected countries have limited domestic vulnerabilities (Calvo and Reinhart 1996; Kaminsky 2008). For ex-ample, investor confidence could be dented by uncer-tainty about policy direction or deteriorating growth
A. General government debt and balance
B. Median inflation
Source: World Bank, International Monetary Fund, Haver Analytics.
A. Bar illustrates interquartile range for developing countries. Dot shows median for developing countries.
B. For developing countries. Hydrocarbon exporters (as proxy for oil exporters) are Algeria, Angola, Argentina, Azerbaijan, Cameroon, Côte d’Ivoire, Colombia, Chad, Ecuador, Gabon, Indonesia, the Islamic Republic of Iran, Iraq, Kazakhstan, Libya, Malaysia, Mexico, Nigeria, Papua New Guinea, South Africa, Sudan, Turkmenistan, Uzbekistan, República Bolivariana de Venezuela, Vietnam, and the Republic of Yemen.
FIGURE SF1.9 Debt, deficits and inflation in emerging markets: Oil exporters vs. oil importers
Fiscal positions in emerging markets have deteriorated since the crisis, but debt and deficits remain, on average, moderate. Inflation has declined in oil-importing countries, partly as a result of low oil prices.
0
20
40
60
80
100
2007
2014
2007
2014
Exporters Importers
Government debt
Government debt:Median
Percent of GDP
2007
2014
2007
2014
Exporters Importers
-4
0
4
8
12Government primary balance(RHS)
Government primarybalance:Median(RHS)
Percent of GDP
0
2
4
6
8
10
12
14
16
2008
2009
2010
2011
2012
2013
2014
2015
Importers Exporters
Year-on-year, percent
S P E C I A L F E AT U R E 1 G LO B A L E C O N O M I C P R O S P E C T S | J U N E 2 0 1 5 14
prospects. This could turn a manageable slowdown in capital inflows as part of a broader emerging market re-trenchment around the liftoff into a sudden stop in in-flows and translate into a sharp decline in activity. Even countries that are not directly exposed to global financial market shocks could be affected through intraregional spillovers from their larger, financially more integrated neighbors. Whereas within-regional financial exposures often tend to be limited, trade, remittance, and direct investment links are strong in some regions.22
22In some cases, official financing could be an additional channel for transmission of fiscal stress (e.g.; from República Bolivariana de Venezuela through the PetroCaribe arrangement or from Gulf Cooperation Coun-cil countries to countries in the Middle East and North Africa through budget support; IMF 2014b). There can also be strong contagion effects from intraregional volatility of capital flows (Lee, Park, and Byun 2013).
What Policy Options Are Available to Prepare for Risks around Liftoff? Emerging market policy makers have several op-tions to prepare for the risks associated with the coming tightening cycle. Foremost among them are the adoption of policies that reduce vulnerabilities and the proactive pursuit of structural reform agen-das that improve growth prospects.
• Monetary and financial policies. In several oil-importing countries, inflation is running at or near the top of formal or informal target bands. For central banks in these countries, buttressing monetary policy credibility may be a priority. Elsewhere, for example in oil-exporting coun-tries where growth has softened but inflation has been driven up by depreciation, banks with high foreign currency vulnerabilities or heavy reliance on short-term debt may merit close monitoring or tighter prudential requirements.
• Fiscal policy. Although emerging market sover-eign debt is significantly less than in the early 2000s, fiscal deficits widened rapidly in the after-math of the global financial crisis and have yet to return to pre-crisis levels. Over the medium-term, several emerging markets need to improve their fiscal positions (World Bank 2015). Many oil-ex-porting countries are already tightening fiscal pol-icy, even as growth slows. Although this exacer-bates growth slowdowns, it will help preserve buffers that could be used if risks around the liftoff materialize. Oil-importing countries that benefit from savings on lower energy subsidies or higher energy taxes could seize the opportunity to build fiscal buffers to regain policy space for effective fis-cal stimulus that may be needed in the future.
• Structural reforms. Given the limited room for fiscal and monetary policy adjustment to reduce vulnerabilities, the proactive pursuit of struc-tural reforms that improve long-term growth prospects are an integral part of preparing for the liftoff. Although the benefits of reforms take time to materialize, decisive moves to imple-ment ambitious reform agendas signal to inves-tors that growth prospects are improving (Kose et al. 2010). In investors’ differentiated views, this could make the difference between capital
Source: Bank for International Settlements, Haver Analytics, World Bank, IMF.A. “All” refers to the un-weighted average among all listed countries.B. Foreign reserves include gold.C. Inflation is the 6-month average of the annual average consumer price inflation. D. Private debt is defined as the sum of private non-financial sector debt and household debt.F. Primary balance excludes net interest payments.
A. Current account B. Foreign reserves
FIGURE SF1.10 Evolution of vulnerabilities in emerging markets since the taper tantrum
Although, on average, current account balances have improved and reserve coverage increased (partly as a result of lower oil prices), there has been wide variation across countries. Private debt and inflation have, on average, increased and fiscal positions have deteriorated.
-9-6-30369
Turk
eyS
outh
Afri
caIn
dia
Bra
zil
Thai
land
Indo
nesi
aC
olom
bia
Mex
ico
Rus
sian
Fed
erat
ion
Chi
naM
alay
sia
Hun
gary
Phi
lippi
nes All
2013H1 2014H2Percent of GDP
All 0
51015202530
Mex
ico
Hun
gary
Sout
h A
frica
Turk
ey
Indo
nesi
a
Indi
a
Col
ombi
a
Mal
aysi
a
Thai
land
Philip
pine
s
Rus
sian
Fed
erat
ion
Braz
il
Chi
na All
2013H1Latest 6 months
Months of imports
All
C. Inflation D. Private debt
-1
3
7
11
Indi
a
Turk
ey
Rus
sian
Fed
erat
ion
Braz
il
Sout
h Af
rica
Hun
gary
Indo
nesi
a
Mex
ico
Philip
pine
s
Thai
land
Col
ombi
a
Chi
na
Mal
aysi
a All
2013H1 Latest 6 monthsPercent
All
050
100150200250
Chi
na
Mal
aysi
a
Hun
gary
Thai
land
Braz
il
Sout
h Af
rica
Rus
sian
Fed
erat
ion
Turk
ey
Indi
a
Indo
nesi
a
Mex
ico All
2013H1 2014H2Percent of GDP
All
E. General government debt F. Primary balance
020406080
100
Hun
gary
Indi
a
Braz
il
Mal
aysi
a
Mex
ico
Thai
land
Sout
h Af
rica
Chi
na
Philip
pine
s
Turk
ey
Col
ombi
a
Indo
nesi
a
Rus
sian
Fed
erat
ion All
2013 2015Percent of GDP
All -4
-3-2-10123
Indi
a
Mal
aysi
a
Mex
ico
Sout
h Af
rica
Rus
sian
Fed
erat
ion
Indo
nesi
a
Chi
na
Thai
land
Col
ombi
a
Turk
ey
Braz
il
Hun
gary
Philip
pine
s All
2013 2015Percent of GDP
All
S P E C I A L F E AT U R E 1G LO B A L E C O N O M I C P R O S P E C T S | J U N E 2 0 1 5 15
outflows and inflows. In addition to raising long-term growth, some reforms—especially those requiring investment in infrastructure projects—can support cyclically weak demand.
Should risks around the liftoff materialize, emerging markets need to resort to policy measures to allevi-ate short-term financial stress. These include, most importantly, exchange rate flexibility, targeted mea-sures to ensure market functioning, and measures to restore confidence. Many of these measures ap-peared to help countries effectively respond to the taper tantrum (World Bank 2014a).23
• Exchange rate flexibility. In a significant difference to the 1990s, most emerging markets now main-tain flexible exchange rate regimes. Allowing ex-change rates to adjust will be an important buffer to external shocks in many emerging markets with limited currency mismatches on corporate and household balance sheets and credible mac-roeconomic policies (Davies et al. 2014).
• Interest rate increases. Emerging markets con-cerned about the balance sheet effects of sizable depreciations may wish to raise monetary policy interest rates to stem depreciations. This has been done, to varying degrees, in past U.S. tightening episodes (Chapter 1). The effectiveness of an in-terest rate hike in stemming depreciation pres-sures rests on the credibility of the monetary policy framework (Eichengreen and Rose 2003).
• Targeted support measures. If financial stress threatens financial stability, for example be-cause of large foreign currency liabilities, in-tervention in foreign currency markets through the use of international reserve or swap market operations may be necessary. Liquidity provi-sion in local capital markets may be required to preserve orderly market conditions. The re-moval of capital inflow restrictions or—as a complement to sound macroeconomic poli-cies, financial supervision and regulation, and strong institutions—the imposition of tempo-rary controls on certain outflows might tem-per net outflows (IMF 2014d).
23A rich literature examines policy responses to financial stress and emphasizes various tradeoffs (Frankel and Wei 2004; Claessens et. al. 2014; Forbes and Klein 2015).
• Measures to restore confidence. Reforms to im-prove the credibility of monetary, fiscal, and regulatory policies through changes in the gov-ernance of associated policy institutions may
-5
25
55
85
115
145
175
Mex
ico
India
Sout
h Af
rica
Polan
d
Turk
ey
Indo
nesia
Thail
and
Czec
h Re
publi
c
Hung
ary
China
2007 2014 Change 07-14Percent of GDP
C. Corporate debt of selected emerging markets
Source: Bank for International Settlements, Moody’s, World Bank.
A. Foreign currency exposure is measured as the ratio of total foreign currency deposits in the domestic banking system to total deposits in the domestic banking system. Latest available data for 2013.
B. GDP-weighted average. List of emerging markets includes China, Czech Republic, Hungary, India, Indonesia, Mexico, Poland, South Africa, Thailand, and Turkey.
C. The 2007 data of South Africa’s corporate debt is not available and thus replaced by 2008Q1 data.
FIGURE SF1.11 Foreign currency exposure and corporate debt
Foreign currency exposures in a number of emerging markets remain high, render-ing them vulnerable to sharp movements in their currencies. Corporate debt has also increased in many countries.
0
20
40
60
80
100
120
2005 2006 2007 2008 2009 2010 2011 2012 2013
Emerging market (excluding China) Emerging market
Percent of GDP
B. Corporate debt of emerging markets
A. Foreign currency exposure in emerging markets
-10
0
10
20
30
40
Vene
zuel
a, R
B
Thai
land
Indi
a
Sout
h Af
rica
Pakis
tan
Arge
ntin
a
Viet
nam
Philip
pine
s
Indo
nesia
Hung
ary
Egyp
t, Ar
ab R
ep.
Russ
ian
Fede
ratio
n
Turk
ey
2007 2013 Change 07-13Percent
S P E C I A L F E AT U R E 1 G LO B A L E C O N O M I C P R O S P E C T S | J U N E 2 0 1 5 16
help convince investors of a commitment to sustainable macroeconomic and financial poli-cies. Credible commitments to structural re-forms could enhance investors’ perceptions of long-term growth prospects.
International policy coordination could poten-tially help limit the risks of financial turmoil around liftoff and, if they materialize, help emerging market countries navigate them, and, in turn, avoid spill-backs to advanced countries (Sahay et al. 2014). Policy coordination could range from heightened efforts by advanced country central banks to engage in clear and effective communication to the inter-nalization by central banks of the spillover effects of their policies, although the latter may be difficult to operationalize (Rajan 2014).24 More broadly speak-ing, there may be scope for enhanced global and regional safety nets, including through multilateral institutions and regional risk-sharing arrangements, to support emerging markets during periods of fi-nancial stress (Carstens 2015).
ConclusionAs the Fed readies for its first policy rate hike after almost a decade, financial conditions are on the cusp of becoming more challenging for emerging market countries. Most likely, the lift-off will proceed smoothly given that the U.S. re-covery appears well entrenched and financial markets are being bolstered by highly accommo-dative monetary policies in other major advanced countries. If the liftoff takes place in line with market expectations, U.S. long-term yields will likely remain well contained, the term premium will remain narrow, and movements in capital flows to emerging countries will be modest.
However, as evidenced during the taper tantrum episode, there is a risk that if market expectations adjust in a disorderly fashion, financial market volatility could spill over to emerging markets. Specifically, low U.S. term premia, diverging views between markets and Fed policy makers about the future path of interest rates, and chang-
24An example of coordination is the introduction of liquidity swap lines by the Fed to other (mostly advanced country) central banks in the 2008–09 global financial crisis (Fischer 2014). Dudley (2014) pres-ents a discussion of the impact of U.S. monetary policies on emerging economies and summary of policy lessons from the taper tantrum.
ing conditions in market liquidity all heighten risks to U.S. financial markets. If the risks around the liftoff and subsequent tightening steps mate-rialize, U.S. interest rates could increase sharply. This could in turn lead to greater financial mar-ket volatility and could significantly reduce capi-tal flows to emerging market countries.
Emerging markets have become more resilient since the early 2000s: fewer have fixed exchange rates; most have sounder fiscal positions and bet-ter monetary policy frameworks; and the extent of liability dollarization has declined (Kose and Prasad 2010; Davies et al. 2014). Nevertheless, the taper tantrum is a reminder that emerging market currencies could depreciate sharply, local borrowing costs rise steeply, and balance sheets come under pressure.
During the taper tantrum episode, a jump in U.S. long-term interest rates led, initially, to financial stress across the entire spectrum of emerging mar-ket assets. Over time, differentiation among countries increased based on country-specific vul-nerabilities, policies, and growth prospects. Since the episode, growth prospects have weakened and vulnerabilities remain in some emerging market countries, heightening the risks of another simi-lar shock. Unless appropriate policy measures are in place, the sudden realization of risks around the liftoff could potentially spark a “perfect storm” in some emerging market economies, in particular those that need to adjust to the pros-pects of persistently low commodity prices and tighter financial conditions, or that face domestic policy uncertainty against the backdrop of linger-ing vulnerabilities and weaker growth.
In anticipation of the risks surrounding the liftoff, emerging market countries should prioritize mone-tary and fiscal policies that reduce vulnerabilities and strengthen policy credibility, and structural policy agendas that improve growth prospects. In the event that risks materialize, exchange rate flexi-bility could buffer shocks in some countries but may need to be complemented by monetary policy measures and targeted interventions to support or-derly market functioning. International policy coor-dination could reduce the likelihood that these risks materialize and could alleviate their impact on emerging markets. While emerging economies may hope for the best from the eventual liftoff of the U.S. policy rates, they need to prepare for the worst.
S P E C I A L F E AT U R E 1G LO B A L E C O N O M I C P R O S P E C T S | J U N E 2 0 1 5 17
This box briefly describes the main features of the three econometric models used to analyze the role of mone-tary and real shocks in explaining movements in U.S. yields, the spillovers of such shocks for emerging mar-kets, and the impact of a sudden increase in U.S. yields on capital flows to emerging market and developing countries.
Contribution of monetary and real shocks to U.S. long-term yields
To analyze the drivers of moves in U.S. yields, the first econometric model uses a structural vector auto- regression (SVAR) framework with sign restrictions to decompose daily movements in yields during January 2013-March 2015 into two components: one reflecting real U.S. growth shocks and another reflecting U.S. monetary shocks.a The SVAR follows a similar approach as Matheson and Stavrev (2014) and the International Monetary Fund (2014b) based on three U.S. variables: long-term interest rates, stock prices, and the nominal effective exchange rate.b For reasons of data availability, other economic data (e.g. inflation expectations) that may also be important drivers of the long-term interest rate are excluded from the model. The sign restrictions assume that an adverse “monetary” shock (such as an unexpected real or perceived policy tightening) in-creases yields and reduces stock prices in the United States, while a favorable “real” shock (such as reflecting better growth prospects) increases both yields and stock prices.c The shocks identified using these restrictions naturally reflect market perceptions of monetary policy and growth.
Spillovers from U.S. monetary and real shocks to activity and financial markets
To assess the spillovers from the shocks driving U.S. yields on emerging markets, a panel VAR model is estimated for emerging market country variables, with monetary and real shocks (estimated as in the above
model) as exogenous regressors. The panel VAR in-cludes six variables for emerging markets: long-term bond yields, stock prices, nominal effective exchange rates, bilateral exchange rate with the dollar, industrial production, and inflation. The list of countries is: Argentina, Brazil, Chile, Colombia, the Czech Repub-lic, Israel, Mexico, Poland, South Africa, Turkey, India, Indonesia, the Russian Federation, China, the Republic of Korea, Malaysia, the Philippines, Saudi Arabia, and Thailand.d All data are monthly or monthly averages of daily data for January 2013–March 2015. Spillovers are then evaluated by tracing out the impulse responses of these variables due to adverse monetary U.S. shocks and favorable U.S. real shocks. The size of the U.S. shocks is normalized such that developing-country bond yields increase by 100 basis points on impact.
Spillovers from U.S. financial conditions to capital flows
The effects of moves in U.S. yields on aggregate capital inflows to emerging markets and developing countries are modeled using a VAR model, based on Lim, Mo-hapatra, and Stocker (2014). This model links quarterly aggregate capital inflows (including foreign direct in-vestment, portfolio investment, and other investment) to 86 emerging and developing countries (from BPM6 balance of payment data, expressed in percent of gross domestic product [GDP]) to real GDP growth in both emerging market and developing countries and G-4 countries (the United States, the Euro Area, Japan, and the United Kingdom), G-4 short-term interest rates (GDP-weighted average of three month money market rates for G-4 countries), G-4 long-term interest rates (GDP-weighted average of 10-year government bond yields for G-4 countries), and the VIX index of implied volatility of S&P 500 options. This captures the re-sponse of capital flows to external shocks, and their propagation through global uncertainty and growth ef-fects. The feedback between global interest rates and investors’ risk appetite is captured by incorporating in the model the VIX index of implied stock market vola-tility, which is often used as proxy of risk aversion and deleveraging pressures (Adrian and Shin 2010 and 2012), with significant repercussions for capital flows to
BOX SF1.1 Econometric analysis of U.S. yields and spillovers
aDaily (rather than monthly) data is used to ensure that U.S. shocks, in particular monetary shocks that reflect Fed announcements, and their near immediate effects on stock prices are well identified.
bThe nominal effective exchange rate is added on technical grounds, to ensure that the two identified shocks are orthogonal while also ensuring that the sign restrictions are satisfied. The results are broadly in line with Matheson and Stavrev (2014) who leave out a third variable.
cSign restrictions are imposed on stock prices and yields. Responses of exchange rates are unrestricted and turn out to be statistically insignificant.
dTo avoid spurious results, the sample is restricted to large emerging markets that are highly integrated into global financial markets.
S P E C I A L F E AT U R E 1 G LO B A L E C O N O M I C P R O S P E C T S | J U N E 2 0 1 5 18
BOX SF1.1 (continued)
developing countries (Rey 2013; Bruno and Shin 2013; Forbes and Warnock 2012).
To compute impulse responses, the covariance matrix is derived from a Cholesky decomposition. The Cholesky decomposition is based on the following order of vari-ables (from least to most “endogenous”): G-4 GDP growth, emerging markets’ GDP growth, G-4 short-term rates, G-4 long-term rates, VIX, and capital inflows to emerging markets. Overall, the impact of a 25 basis-points (one standard deviation) shock in long-term in-terest rate across G-4 economies is estimated to reduce aggregate capital flows to emerging and developing countries by 0.45 percent of their combined GDP (10 percent drop in flows), with the effect peaking after 4
quarters and remaining significant at a 90 percent confi-dence interval up to 6 quarters.
For robustness, a similar VAR model was computed for portfolio flows (balance of payment data), with the im-pact of an interest rate shock estimated to be of similar magnitude, but peaking earlier and with wider confi-dence intervals given greater volatility in quarterly portfolio flows. A 100 basis-point shock to the U.S. term spread is applied to the model, assuming a range of pass-through effects on Euro Area, U.K., and Japa-nese long-term yields (from zero to 100 percent). In the median case, global bond yields increase by 70 basis points on impact, roughly comparable to the pass-through rate observed during the taper tantrum.
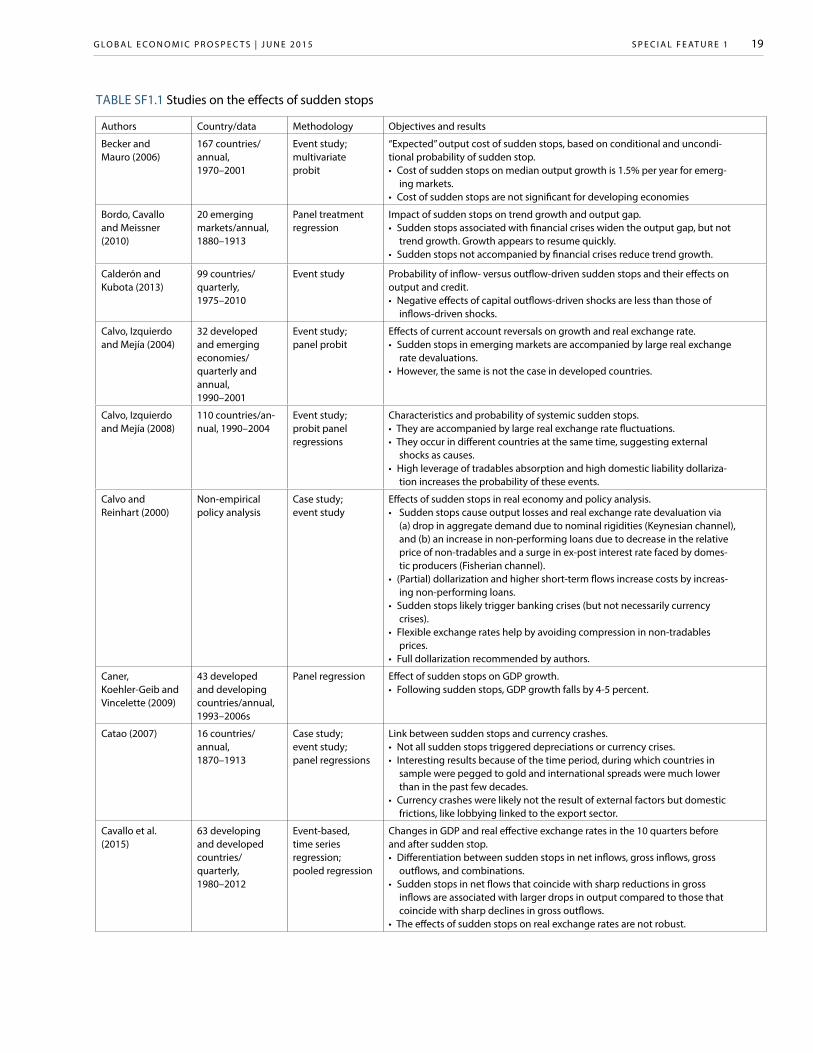
S P E C I A L F E AT U R E 1G LO B A L E C O N O M I C P R O S P E C T S | J U N E 2 0 1 5 19
TABLE SF1.1 Studies on the effects of sudden stops
Authors Country/data Methodology Objectives and results
Becker and Mauro (2006)
167 countries/ annual, 1970–2001
Event study; multivariate probit
“Expected” output cost of sudden stops, based on conditional and uncondi-tional probability of sudden stop.• Cost of sudden stops on median output growth is 1.5% per year for emerg-
ing markets.• Cost of sudden stops are not significant for developing economies
Bordo, Cavallo and Meissner (2010)
20 emerging markets/annual, 1880–1913
Panel treatment regression
Impact of sudden stops on trend growth and output gap. • Sudden stops associated with financial crises widen the output gap, but not
trend growth. Growth appears to resume quickly. • Sudden stops not accompanied by financial crises reduce trend growth.
Calderón and Kubota (2013)
99 countries/ quarterly, 1975–2010
Event study Probability of inflow- versus outflow-driven sudden stops and their effects on output and credit.• Negative effects of capital outflows-driven shocks are less than those of
inflows-driven shocks.
Calvo, Izquierdo and Mejía (2004)
32 developed and emerging economies/ quarterly and annual, 1990–2001
Event study; panel probit
Effects of current account reversals on growth and real exchange rate.• Sudden stops in emerging markets are accompanied by large real exchange
rate devaluations.• However, the same is not the case in developed countries.
Calvo, Izquierdo and Mejía (2008)
110 countries/an-nual, 1990–2004
Event study; probit panel regressions
Characteristics and probability of systemic sudden stops.• They are accompanied by large real exchange rate fluctuations.• They occur in different countries at the same time, suggesting external
shocks as causes.• High leverage of tradables absorption and high domestic liability dollariza-
tion increases the probability of these events.
Calvo and Reinhart (2000)
Non-empirical policy analysis
Case study; event study
Effects of sudden stops in real economy and policy analysis.• Sudden stops cause output losses and real exchange rate devaluation via
(a) drop in aggregate demand due to nominal rigidities (Keynesian channel), and (b) an increase in non-performing loans due to decrease in the relative price of non-tradables and a surge in ex-post interest rate faced by domes-tic producers (Fisherian channel).
• (Partial) dollarization and higher short-term flows increase costs by increas-ing non-performing loans.
• Sudden stops likely trigger banking crises (but not necessarily currency crises).
• Flexible exchange rates help by avoiding compression in non-tradables prices.
• Full dollarization recommended by authors.
Caner, Koehler-Geib and Vincelette (2009)
43 developed and developing countries/annual, 1993–2006s
Panel regression Effect of sudden stops on GDP growth. • Following sudden stops, GDP growth falls by 4-5 percent.
Catao (2007) 16 countries/ annual, 1870–1913
Case study; event study; panel regressions
Link between sudden stops and currency crashes.• Not all sudden stops triggered depreciations or currency crises.• Interesting results because of the time period, during which countries in
sample were pegged to gold and international spreads were much lower than in the past few decades.
• Currency crashes were likely not the result of external factors but domestic frictions, like lobbying linked to the export sector.
Cavallo et al. (2015)
63 developing and developed countries/ quarterly, 1980–2012
Event-based, time series regression; pooled regression
Changes in GDP and real effective exchange rates in the 10 quarters before and after sudden stop. • Differentiation between sudden stops in net inflows, gross inflows, gross
outflows, and combinations.• Sudden stops in net flows that coincide with sharp reductions in gross
inflows are associated with larger drops in output compared to those that coincide with sharp declines in gross outflows.
• The effects of sudden stops on real exchange rates are not robust.
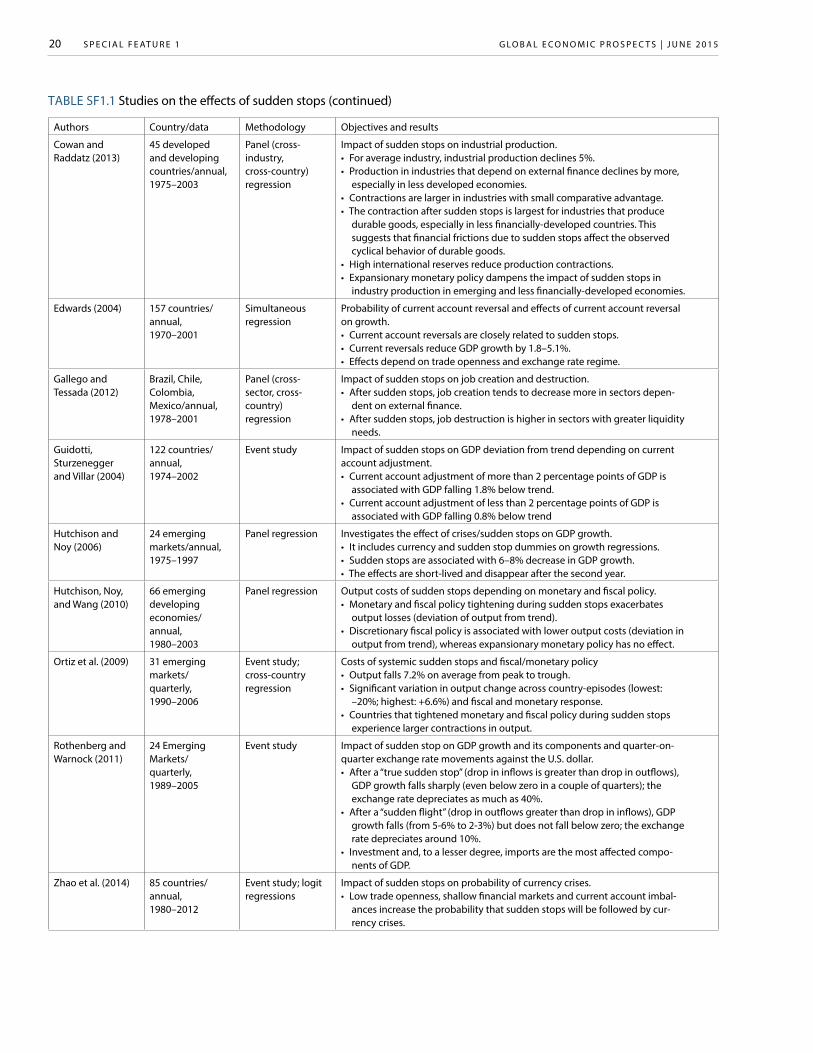
S P E C I A L F E AT U R E 1 G LO B A L E C O N O M I C P R O S P E C T S | J U N E 2 0 1 5 20
Authors Country/data Methodology Objectives and results
Cowan and Raddatz (2013)
45 developed and developing countries/annual, 1975–2003
Panel (cross-industry, cross-country) regression
Impact of sudden stops on industrial production.• For average industry, industrial production declines 5%. • Production in industries that depend on external finance declines by more,
especially in less developed economies.• Contractions are larger in industries with small comparative advantage.• The contraction after sudden stops is largest for industries that produce
durable goods, especially in less financially-developed countries. This suggests that financial frictions due to sudden stops affect the observed cyclical behavior of durable goods.
• High international reserves reduce production contractions.• Expansionary monetary policy dampens the impact of sudden stops in
industry production in emerging and less financially-developed economies.
Edwards (2004) 157 countries/ annual, 1970–2001
Simultaneous regression
Probability of current account reversal and effects of current account reversal on growth. • Current account reversals are closely related to sudden stops.• Current reversals reduce GDP growth by 1.8–5.1%.• Effects depend on trade openness and exchange rate regime.
Gallego and Tessada (2012)
Brazil, Chile, Colombia, Mexico/annual, 1978–2001
Panel (cross- sector, cross-country) regression
Impact of sudden stops on job creation and destruction.• After sudden stops, job creation tends to decrease more in sectors depen-
dent on external finance.• After sudden stops, job destruction is higher in sectors with greater liquidity
needs.
Guidotti, Sturzenegger and Villar (2004)
122 countries/ annual, 1974–2002
Event study Impact of sudden stops on GDP deviation from trend depending on current account adjustment. • Current account adjustment of more than 2 percentage points of GDP is
associated with GDP falling 1.8% below trend.• Current account adjustment of less than 2 percentage points of GDP is
associated with GDP falling 0.8% below trend
Hutchison and Noy (2006)
24 emerging markets/annual, 1975–1997
Panel regression Investigates the effect of crises/sudden stops on GDP growth.• It includes currency and sudden stop dummies on growth regressions. • Sudden stops are associated with 6–8% decrease in GDP growth.• The effects are short-lived and disappear after the second year.
Hutchison, Noy, and Wang (2010)
66 emerging developing economies/ annual, 1980–2003
Panel regression Output costs of sudden stops depending on monetary and fiscal policy.• Monetary and fiscal policy tightening during sudden stops exacerbates
output losses (deviation of output from trend).• Discretionary fiscal policy is associated with lower output costs (deviation in
output from trend), whereas expansionary monetary policy has no effect.
Ortiz et al. (2009) 31 emerging markets/ quarterly, 1990–2006
Event study; cross-country regression
Costs of systemic sudden stops and fiscal/monetary policy • Output falls 7.2% on average from peak to trough.• Significant variation in output change across country-episodes (lowest:
–20%; highest: +6.6%) and fiscal and monetary response.• Countries that tightened monetary and fiscal policy during sudden stops
experience larger contractions in output.
Rothenberg and Warnock (2011)
24 Emerging Markets/ quarterly, 1989–2005
Event study Impact of sudden stop on GDP growth and its components and quarter-on-quarter exchange rate movements against the U.S. dollar. • After a “true sudden stop” (drop in inflows is greater than drop in outflows),
GDP growth falls sharply (even below zero in a couple of quarters); the exchange rate depreciates as much as 40%.
• After a “sudden flight” (drop in outflows greater than drop in inflows), GDP growth falls (from 5-6% to 2-3%) but does not fall below zero; the exchange rate depreciates around 10%.
• Investment and, to a lesser degree, imports are the most affected compo-nents of GDP.
Zhao et al. (2014) 85 countries/ annual, 1980–2012
Event study; logit regressions
Impact of sudden stops on probability of currency crises.• Low trade openness, shallow financial markets and current account imbal-
ances increase the probability that sudden stops will be followed by cur-rency crises.
TABLE SF1.1 Studies on the effects of sudden stops (continued)
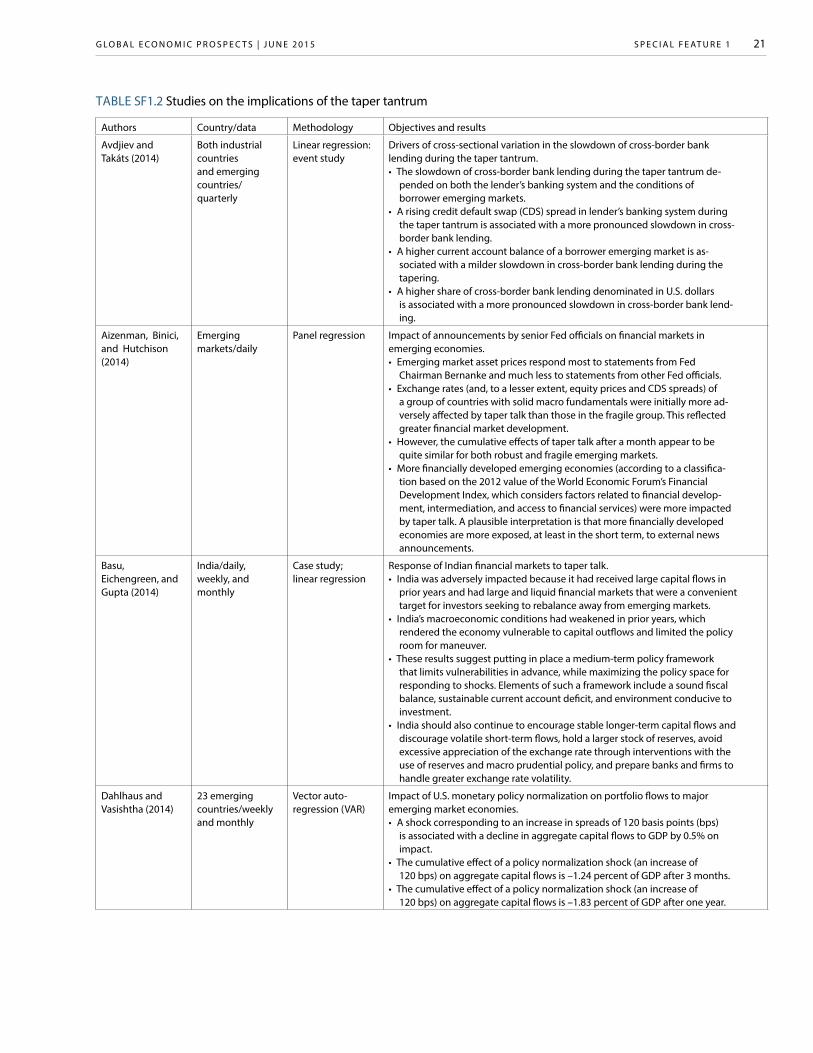
S P E C I A L F E AT U R E 1G LO B A L E C O N O M I C P R O S P E C T S | J U N E 2 0 1 5 21
TABLE SF1.2 Studies on the implications of the taper tantrum
Authors Country/data Methodology Objectives and results
Avdjiev and Takáts (2014)
Both industrial countries and emerging countries/ quarterly
Linear regression: event study
Drivers of cross-sectional variation in the slowdown of cross-border bank lending during the taper tantrum. • The slowdown of cross-border bank lending during the taper tantrum de-
pended on both the lender’s banking system and the conditions of borrower emerging markets.
• A rising credit default swap (CDS) spread in lender’s banking system during the taper tantrum is associated with a more pronounced slowdown in cross-border bank lending.
• A higher current account balance of a borrower emerging market is as-sociated with a milder slowdown in cross-border bank lending during the tapering.
• A higher share of cross-border bank lending denominated in U.S. dollars is associated with a more pronounced slowdown in cross-border bank lend-ing.
Aizenman, Binici, and Hutchison (2014)
Emerging markets/daily
Panel regression Impact of announcements by senior Fed officials on financial markets in emerging economies.• Emerging market asset prices respond most to statements from Fed
Chairman Bernanke and much less to statements from other Fed officials.• Exchange rates (and, to a lesser extent, equity prices and CDS spreads) of
a group of countries with solid macro fundamentals were initially more ad-versely affected by taper talk than those in the fragile group. This reflected greater financial market development.
• However, the cumulative effects of taper talk after a month appear to be quite similar for both robust and fragile emerging markets.
• More financially developed emerging economies (according to a classifica-tion based on the 2012 value of the World Economic Forum’s Financial Development Index, which considers factors related to financial develop-ment, intermediation, and access to financial services) were more impacted by taper talk. A plausible interpretation is that more financially developed economies are more exposed, at least in the short term, to external news announcements.
Basu, Eichengreen, and Gupta (2014)
India/daily, weekly, and monthly
Case study; linear regression
Response of Indian financial markets to taper talk. • India was adversely impacted because it had received large capital flows in
prior years and had large and liquid financial markets that were a convenient target for investors seeking to rebalance away from emerging markets.
• India’s macroeconomic conditions had weakened in prior years, which rendered the economy vulnerable to capital outflows and limited the policy room for maneuver.
• These results suggest putting in place a medium-term policy framework that limits vulnerabilities in advance, while maximizing the policy space for responding to shocks. Elements of such a framework include a sound fiscal balance, sustainable current account deficit, and environment conducive to investment.
• India should also continue to encourage stable longer-term capital flows and discourage volatile short-term flows, hold a larger stock of reserves, avoid excessive appreciation of the exchange rate through interventions with the use of reserves and macro prudential policy, and prepare banks and firms to handle greater exchange rate volatility.
Dahlhaus and Vasishtha (2014)
23 emerging countries/weekly and monthly
Vector auto-regression (VAR)
Impact of U.S. monetary policy normalization on portfolio flows to major emerging market economies.• A shock corresponding to an increase in spreads of 120 basis points (bps)
is associated with a decline in aggregate capital flows to GDP by 0.5% on impact.
• The cumulative effect of a policy normalization shock (an increase of 120 bps) on aggregate capital flows is –1.24 percent of GDP after 3 months.
• The cumulative effect of a policy normalization shock (an increase of 120 bps) on aggregate capital flows is –1.83 percent of GDP after one year.
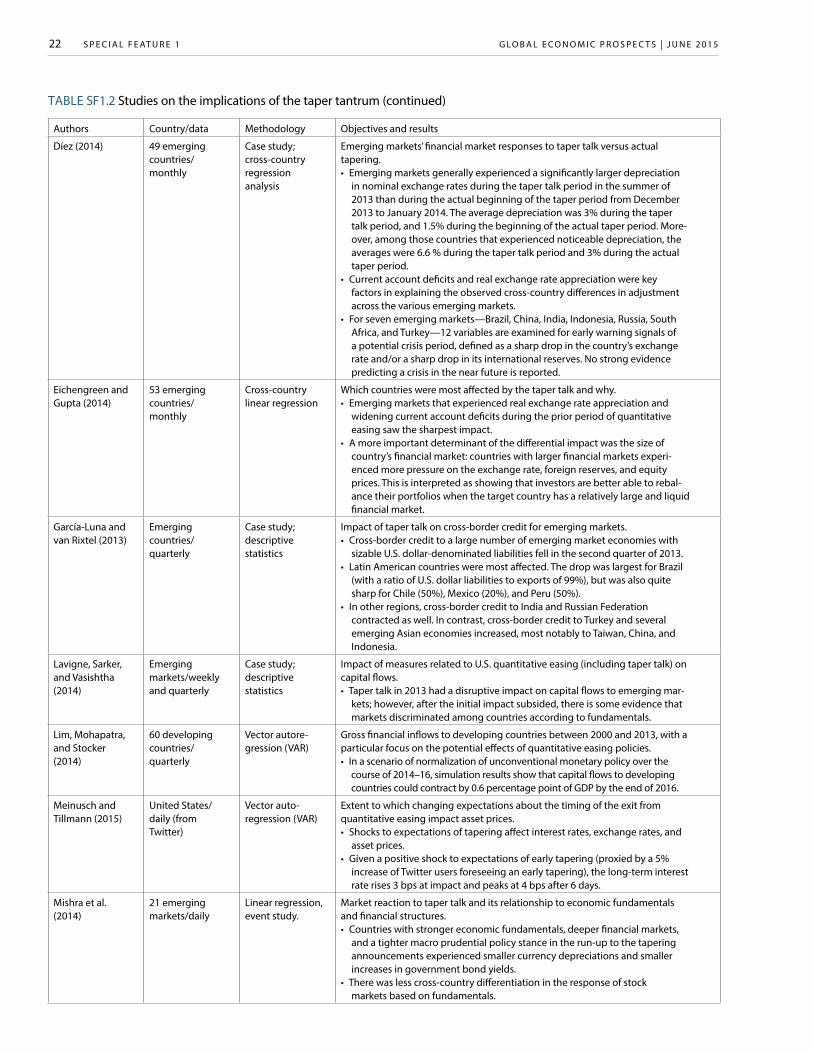
S P E C I A L F E AT U R E 1 G LO B A L E C O N O M I C P R O S P E C T S | J U N E 2 0 1 5 22
Authors Country/data Methodology Objectives and results
Díez (2014) 49 emerging countries/monthly
Case study; cross-country regression analysis
Emerging markets’ financial market responses to taper talk versus actual tapering.• Emerging markets generally experienced a significantly larger depreciation
in nominal exchange rates during the taper talk period in the summer of 2013 than during the actual beginning of the taper period from December 2013 to January 2014. The average depreciation was 3% during the taper talk period, and 1.5% during the beginning of the actual taper period. More-over, among those countries that experienced noticeable depreciation, the averages were 6.6 % during the taper talk period and 3% during the actual taper period.
• Current account deficits and real exchange rate appreciation were key factors in explaining the observed cross-country differences in adjustment across the various emerging markets.
• For seven emerging markets—Brazil, China, India, Indonesia, Russia, South Africa, and Turkey—12 variables are examined for early warning signals of a potential crisis period, defined as a sharp drop in the country’s exchange rate and/or a sharp drop in its international reserves. No strong evidence predicting a crisis in the near future is reported.
Eichengreen and Gupta (2014)
53 emerging countries/ monthly
Cross-country linear regression
Which countries were most affected by the taper talk and why.• Emerging markets that experienced real exchange rate appreciation and
widening current account deficits during the prior period of quantitative easing saw the sharpest impact.
• A more important determinant of the differential impact was the size of country’s financial market: countries with larger financial markets experi-enced more pressure on the exchange rate, foreign reserves, and equity prices. This is interpreted as showing that investors are better able to rebal-ance their portfolios when the target country has a relatively large and liquid financial market.
García-Luna and van Rixtel (2013)
Emerging countries/ quarterly
Case study; descriptive statistics
Impact of taper talk on cross-border credit for emerging markets. • Cross-border credit to a large number of emerging market economies with
sizable U.S. dollar-denominated liabilities fell in the second quarter of 2013. • Latin American countries were most affected. The drop was largest for Brazil
(with a ratio of U.S. dollar liabilities to exports of 99%), but was also quite sharp for Chile (50%), Mexico (20%), and Peru (50%).
• In other regions, cross-border credit to India and Russian Federation contracted as well. In contrast, cross-border credit to Turkey and several emerging Asian economies increased, most notably to Taiwan, China, and Indonesia.
Lavigne, Sarker, and Vasishtha (2014)
Emerging markets/weekly and quarterly
Case study; descriptive statistics
Impact of measures related to U.S. quantitative easing (including taper talk) on capital flows.• Taper talk in 2013 had a disruptive impact on capital flows to emerging mar-
kets; however, after the initial impact subsided, there is some evidence that markets discriminated among countries according to fundamentals.
Lim, Mohapatra, and Stocker (2014)
60 developing countries/ quarterly
Vector autore-gression (VAR)
Gross financial inflows to developing countries between 2000 and 2013, with a particular focus on the potential effects of quantitative easing policies.• In a scenario of normalization of unconventional monetary policy over the
course of 2014–16, simulation results show that capital flows to developing countries could contract by 0.6 percentage point of GDP by the end of 2016.
Meinusch and Tillmann (2015)
United States/daily (from Twitter)
Vector auto-regression (VAR)
Extent to which changing expectations about the timing of the exit from quantitative easing impact asset prices.• Shocks to expectations of tapering affect interest rates, exchange rates, and
asset prices. • Given a positive shock to expectations of early tapering (proxied by a 5%
increase of Twitter users foreseeing an early tapering), the long-term interest rate rises 3 bps at impact and peaks at 4 bps after 6 days.
Mishra et al. (2014)
21 emerging markets/daily
Linear regression, event study.
Market reaction to taper talk and its relationship to economic fundamentals and financial structures.• Countries with stronger economic fundamentals, deeper financial markets,
and a tighter macro prudential policy stance in the run-up to the tapering announcements experienced smaller currency depreciations and smaller increases in government bond yields.
• There was less cross-country differentiation in the response of stock markets based on fundamentals.
TABLE SF1.2 Studies on the implications of the taper tantrum (continued)
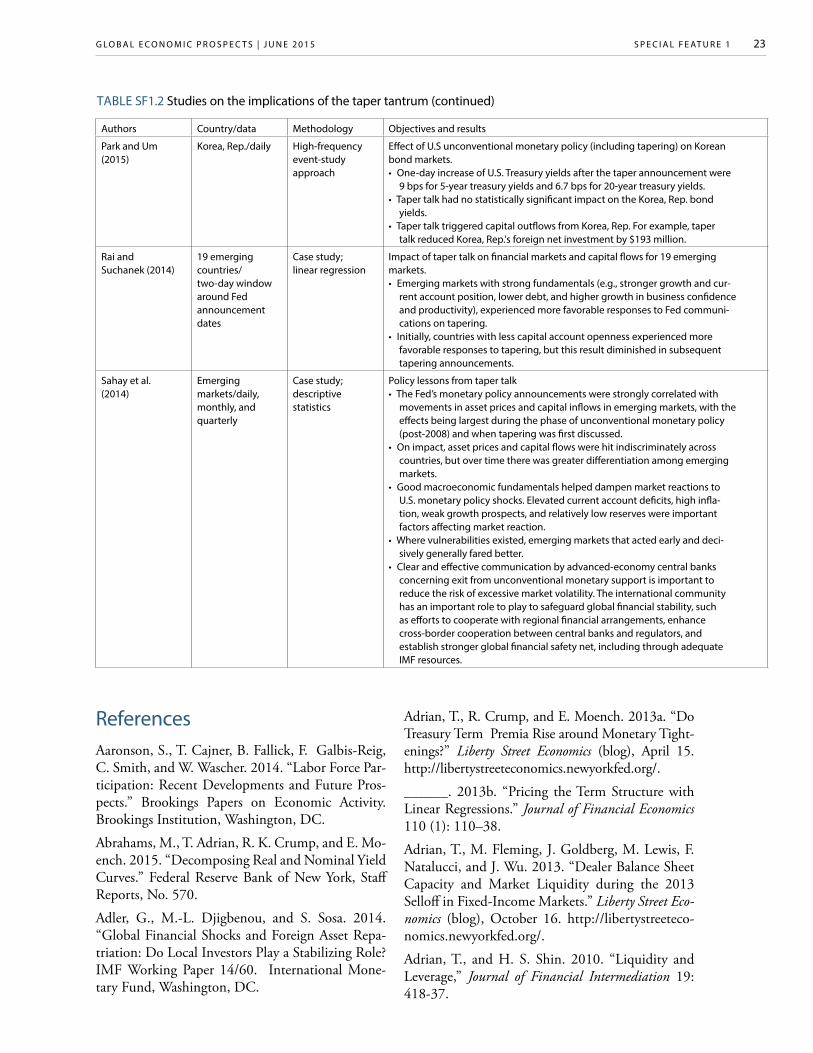
S P E C I A L F E AT U R E 1G LO B A L E C O N O M I C P R O S P E C T S | J U N E 2 0 1 5 23
Authors Country/data Methodology Objectives and results
Park and Um (2015)
Korea, Rep./daily High-frequency event-study approach
Effect of U.S unconventional monetary policy (including tapering) on Korean bond markets.• One-day increase of U.S. Treasury yields after the taper announcement were
9 bps for 5-year treasury yields and 6.7 bps for 20-year treasury yields. • Taper talk had no statistically significant impact on the Korea, Rep. bond
yields. • Taper talk triggered capital outflows from Korea, Rep. For example, taper
talk reduced Korea, Rep.'s foreign net investment by $193 million.
Rai and Suchanek (2014)
19 emerging countries/ two-day window around Fed announcement dates
Case study; linear regression
Impact of taper talk on financial markets and capital flows for 19 emerging markets.• Emerging markets with strong fundamentals (e.g., stronger growth and cur-
rent account position, lower debt, and higher growth in business confidence and productivity), experienced more favorable responses to Fed communi-cations on tapering.
• Initially, countries with less capital account openness experienced more favorable responses to tapering, but this result diminished in subsequent tapering announcements.
Sahay et al. (2014)
Emerging markets/daily, monthly, and quarterly
Case study; descriptive statistics
Policy lessons from taper talk• The Fed’s monetary policy announcements were strongly correlated with
movements in asset prices and capital inflows in emerging markets, with the effects being largest during the phase of unconventional monetary policy (post-2008) and when tapering was first discussed.
• On impact, asset prices and capital flows were hit indiscriminately across countries, but over time there was greater differentiation among emerging markets.
• Good macroeconomic fundamentals helped dampen market reactions to U.S. monetary policy shocks. Elevated current account deficits, high infla-tion, weak growth prospects, and relatively low reserves were important factors affecting market reaction.
• Where vulnerabilities existed, emerging markets that acted early and deci-sively generally fared better.
• Clear and effective communication by advanced-economy central banks concerning exit from unconventional monetary support is important to reduce the risk of excessive market volatility. The international community has an important role to play to safeguard global financial stability, such as efforts to cooperate with regional financial arrangements, enhance cross-border cooperation between central banks and regulators, and establish stronger global financial safety net, including through adequate IMF resources.
TABLE SF1.2 Studies on the implications of the taper tantrum (continued)
ReferencesAaronson, S., T. Cajner, B. Fallick, F. Galbis-Reig, C. Smith, and W. Wascher. 2014. “Labor Force Par-ticipation: Recent Developments and Future Pros-pects.” Brookings Papers on Economic Activity. Brookings Institution, Washington, DC.
Abrahams, M., T. Adrian, R. K. Crump, and E. Mo-ench. 2015. “Decomposing Real and Nominal Yield Curves.” Federal Reserve Bank of New York, Staff Reports, No. 570.
Adler, G., M.-L. Djigbenou, and S. Sosa. 2014. “Global Financial Shocks and Foreign Asset Repa-triation: Do Local Investors Play a Stabilizing Role? IMF Working Paper 14/60. International Mone-tary Fund, Washington, DC.
Adrian, T., R. Crump, and E. Moench. 2013a. “Do Treasury Term Premia Rise around Monetary Tight-enings?” Liberty Street Economics (blog), April 15. http://libertystreeteconomics.newyorkfed.org/.
______. 2013b. “Pricing the Term Structure with Linear Regressions.” Journal of Financial Economics 110 (1): 110–38.
Adrian, T., M. Fleming, J. Goldberg, M. Lewis, F. Natalucci, and J. Wu. 2013. “Dealer Balance Sheet Capacity and Market Liquidity during the 2013 Selloff in Fixed-Income Markets.” Liberty Street Eco-nomics (blog), October 16. http://libertystreeteco-nomics.newyorkfed.org/.
Adrian, T., and H. S. Shin. 2010. “Liquidity and Leverage,” Journal of Financial Interme diation 19: 418-37.
S P E C I A L F E AT U R E 1 G LO B A L E C O N O M I C P R O S P E C T S | J U N E 2 0 1 5 24
______. 2011. “Financial Intermediaries and Mon-etary Economics.” In Vol. 3 of Handbook of Mone-tary Economics, 601–50. San Diego, CA: Elsevier.
______. 2012. “Pro-cyclical Leverage and Value-at-Risk.” Federal Reserve Bank of New York Staff Re-ports, No. 338.
Ahmed, S. and A. Zlate. 2013. "Capital Flows to Emerging Market Economies: A Brave New World?" International Finance Discussion Papers 1081, Board of Governors of the Federal Reserve System. Washington, DC.
Aizenman, J., M. Binici, and M. M. Hutchison. 2014. “The Transmission of Federal Reserve Taper-ing News to Emerging Financial Markets.” NBER Working Paper No. 19980, National Bureau of Economic Research, Cambridge, MA.
Avdijev, S., and E. Takáts. 2014. “Cross-Border Bank Lending During the Taper Tantrum: The Role of Emerging Market Fundamentals.” BIS Quarterly Review (September): 49-60.
Bank of England and the Procyclicality Working Group. 2014. “Procyclicality and Structural Trends in Investment Allocation by Insurance Companies and Pension Funds.” Bank of England and Procycli-cality Working Group Discussion Paper. London.
Basu, K., B. Eichengreen, and P. Gupta. 2014. “From Tapering to Tightening: The Impact of the Fed’s Exit on India.” Policy Research Working Paper 7071, World Bank, Washington, DC.
Becker, T. I., and P. Mauro. 2006. “Output Drops and the Shocks That Matter.” Working Paper 06/172, International Monetary Fund, Washington, DC.
Bernanke, B. 2013a. “Long-Term Interest Rates.” Speech at the Annual Monetary/ Macroeconomics Conference, “The Past and Future of Monetary Pol-icy,” sponsored by the Federal Reserve Bank of San Francisco, San Francisco, March 1.
______. 2013b. Comments after “The Economic Outlook,” testimony before the Joint Economic Committee, U.S. Congress, Washington, DC, May 22. http://www.gpo.gov/fdsys/pkg/CHRG-113shrg81472/pdf/CHRG-113shrg81472.pdf.
______. 2015. “Why Are Interest Rates so Low, Part 4: Term Premiums?” Ben Bernanke’s Blog. http://www.brookings.edu/blogs/ben-bernanke.
Blanchard, O., D. Furceri, and A. Pescatori. 2014. “A Prolonged Period of Low Real Interest Rates?” In Secular Stagnation: Facts, Causes and Cures, edited by Coen Teulings and Richard Baldwin. London: Centre for Economic Policy Research.
Bluedorn, J. C., R. Duttagupta, J. Guajardo, and P. Topalova. 2013. “Capital Flows Are Fickle: Any-time, Anywhere.” IMF Working Paper No. 13/183, International Monetary Fund, Washington, DC.
Blume, M. E., and D. B. Keim. 2012. “Institutional Investors and Stock Market Liquidity: Trends and Relationships.” Working Paper, the Wharton School, University of Pennsylvania, Philadelphia.
Bordo, M. D., A. F. Cavallo, and C. F. Meissner. 2010. “Sudden Stops: Determinants and Output Effects in the First Era of Globalization, 1880-1913.” Journal of Development Economics 91 (2): 227-41.
Borio, C. 2014. “The International Monetary and Financial System: Its Achilles Heel and What to Do about It.” BIS Working Papers No. 456, Bank for International Settlements, Basel.
Borio, C., and H. Zhu. 2012. “Capital Regulation, Risk-taking and Monetary Policy: A Missing Link in the Transmission Mechanism?” Journal of Finan-cial Stability 8(1): 236–51.
Bruno, V., and H. S. Shin. 2013. “Capital Flows, Cross-Border Banking and Global Liquidity.” NBER Working Paper No. 19038, National Bureau of Economic Research, Cambridge, MA.
______. 2015. “Capital Flows and the Risk-Taking Channel of Monetary Policy.” Journal of Monetary Economics 71 (1): 119-32.
Caballero, R. J., and E. Farhi. 2014. “On the Role of Safe Asset Shortages in Secular Stagnation.” In Secular Stagnation: Facts, Causes and Cures, edited by Coen Teulings and Richard Baldwin. London: Centre for Economic Policy Research.
Calderón, C., and M. Kubota. 2013. “Sudden Stops: Are Global and Local Investors Alike?” Jour-nal of International Economics 89 (1): 122-42
Calvo, G., A. Izquierdo, and L. F. Mejía. 2004. “On the Empirics of Sudden Stops: the Relevance of Bal-ance-sheet Effects.” NBER Working Paper No. 10520, National Bureau of Economic Research, Cambridge, MA.
S P E C I A L F E AT U R E 1G LO B A L E C O N O M I C P R O S P E C T S | J U N E 2 0 1 5 25
______. 2008. “Systemic Sudden Stops: The Rele-vance of Balance-Sheet Effects And Financial Inte-gration.” NBER Working Paper No. 14026, Na-tional Bureau of Economic Research, Cambridge, MA.
Calvo, G. A., A. Izquierdo, and E. Talvi. 2006. “Sud-den Stops and Phoenix Miracles in Emerging Mar-kets.” American Economic Review 96 (2): 405–10.
Calvo, S., and C. Reinhart. 1996. “Capital Flows to Latin America: Is There Evidence of Contagion Ef-fects?” Policy Research Working Paper 1619, World Bank, Washington, DC.
______. 2000. “When Capital Inflows Come to a Sudden Stop: Consequences and Policy Options.” In Reforming the International Monetary and Finan-cial System, edited by P. Kenen and A. Swoboda. Washington, DC: International Monetary Fund.
Caner, M., F. Koehler-Geib, and G. A. Vincelette. 2009. “When Do Sudden Stops Really Hurt?” Pol-icy Research Working Paper 5021, World Bank, Washington, DC.
Cardarelli, R., S. Elekdag, and M. A. Kose. 2010. “Capital Inflows: Macroeconomic Implications and Policy Responses.” Economic Systems 34 (4): 333–56.
Carstens, A. 2015. “Challenges for Emerging Econ-omies in the Face of Unconventional Monetary Policies in Advanced Economies.” Stavros Niarchos Foundation Lecture, Peterson Institute for Interna-tional Economics, April 20.
Catao, L. A. V. 2007. “Sudden Stops and Currency Drops: A Historical Look.” In The Decline of Latin American Economies: Growth, Institutions and Crises, edited by Sebastian Edwards, Gerardo Esquivel, and Graciela Marquez. Chicago: University of Chicago Press.
Cavallo, E., A. Powell, M. Pedemonte, and P. Tavella. 2015. “A New Taxonomy of Sudden Stops: Which Sudden Stops should Countries be Most Concerned About?” Journal of International Money and Finance 51: 47-70.
Claessens, S., and M. A. Kose. 2014. “Financial Crises: Explanations, Types and Implications.” In Financial Crises: Causes, Consequences, and Policy Responses, edited by S. Claessens, M. A. Kose, L. Laeven, and F. Valencia, 3-60. Washington, DC: In-ternational Monetary Fund.
Claessens, S., M. A. Kose, L. Laeven, and F. Valen-cia. 2014. Financial Crises: Causes, Consequences, and Policy Responses. Washington, DC: International Monetary Fund.
Collyns, C., and R. Koepke. 2015. “Which EMs Would Suffer from a Risk Shock?” Memo, Insti-tute of International Finance, Washington, DC.
Committee on the Global Financial System. 2014. “Market-Making and Proprietary Trading: Industry Trends, Drivers and Policy Implications.” CGFS Pa-pers No 52, Bank for International Settlements, Basel.
Council of Economic Advisers. 2014. “The Labor Force Participation Rate since 2007: Causes and Policy Implications.” Council of Economic Advis-ers, Washington, DC.
Cowan, K., and C. Raddatz. 2013. “Sudden Stops and Financial Frictions: Evidence from Industry-Level Data.” Journal of International Money Finance 32: 99-128.
Craighead, W. D., and D. R. Hineline. 2013. “Cur-rent Account Reversals and Structural Change in Developing and Industrialized Countries.” Wes-leyan Economics Working Papers 2013-001, Wes-leyan University Department of Economics, Mid-dleton, CT.
Dahlhaus, T., and G. Vasishtha. 2014. “The Im-pact of U.S. Monetary Policy Normalization of Capital Flows to Emerging-Market Economies.” Working Paper 2014-53, Bank of Canada, Ottawa.
Davies, G., M. Obstfeld, A. M. Taylor, and D. Wil-son. 2014. “Will Emerging Market Jitters Morph into a Crisis?” Fulcrum Research Paper. https://www.fulcrumasset.com/assets/2/1608_document.pdf?1398878033.
Dell’Ariccia, G., L. Laeven, and R. Marquez. 2013. “Monetary Policy, Leverage, and Bank Risk-Tak-ing.” Journal of Economic Theory, forthcoming.
Diebold, F. X., and Yilmaz, K. 2015. Financial Con-nectedness: A Network Approach to Measurement and Monitoring. Oxford, U.K.: Oxford University Press.
Díez, F. J. 2014. “The Emerging Market Economies in Times of Taper-Talk and Actual Tapering.” Cur-rent Policy Perspectives No. 14-6, Federal Reserve Bank of Boston.
S P E C I A L F E AT U R E 1 G LO B A L E C O N O M I C P R O S P E C T S | J U N E 2 0 1 5 26
Dudley, W. 2014. “U.S. Monetary Policy and Emerging Market Economies.” Speech at the Roundtable Discussion in Honor of Terrence Checki, “Three Decades of Crises: What Have We Learned?” Federal Reserve Bank of New York, New York, March 27.
Edwards, S., 2004. “Thirty Years of Current Ac-count Imbalances, Current Account Reversals and Sudden Stops.” IMF Staff Papers 51(0): 1-49. Inter-national Monetary Fund, Washington, DC.
Eichengreen, B., and P. Gupta. 2014. “Tapering Talk: The Impact of Expectations of Reduced Fed-eral Reserve Security Purchases on Emerging Mar-kets.” Policy Research Working Paper 6754. World Bank, Washington, DC.
Eichengreen, B., and A. Rose. 2003. “Does It Pay to Defend against a Speculative Attack?” In Managing Currency Crises in Emerging Markets, edited by M. Dooley and J. Frankel. Chicago: University of Chi-cago Press.
Escolano, J., C. Kolerus, and C. L. Ngouana. “Global Monetary Tightening: Emerging Markets Debt Dynamics and Fiscal Crises.” IMF Working Paper No. 14/215, International Monetary Fund, Washington, DC.
Fender, I., and U. Lewrick. 2015. “Shifting Tides – Market Liquidity and Market-Making in Fixed In-come Instruments.” BIS Quarterly Review (March): 97–109.
Fernald, J. and B. Wang. 2015. “The Recent Rise and Fall of Rapid Productivity Growth.” Economic Letter 2015-04, Federal Reserve Bank of San Francisco.
Fischer, S. 2014. “The Federal Reserve and the Global Economy.” Speech at the 2014 Annual Meetings of the International Monetary Fund and the World Bank Group, Washington, DC. October 11.
______. 2015. “The Federal Reserve and the Global Economy.” Speech at the conference held in honor of Professor Haim Ben-Shahar, former president of Tel Aviv University, Tel Aviv University, Tel Aviv, Is-rael, May 26.
Forbes, K. J., and M. W. Klein. 2015. “Pick Your Poison: The Choices and Consequences of Policy Responses to Crises.” IMF Economic Review 63: 197-237.
Forbes, K. J., and F. E. Warnock. 2012. “Capital Flow Waves: Surges, Stops, Flight, and Retrench-ment.” Journal of International Economics 88 (2): 235-51.
Frankel, J., and S. Wei. 2004. “Managing Macro-economic Crises.” NBER Working Paper No. 10907, National Bureau of Economic Research, Cambridge, MA.
Fratzscher, M., 2012. “Capital Flows, Push versus Pull Factors and the Global Financial Crisis.” Jour-nal of International Economics 88 (2): 341-56.
Gallego, F., and J. Tessada. 2012. “Sudden Stops and Reallocation: Evidence from Labor Market Flows in Latin America.” Journal of Development Economics 97 (2): 257–68.
García-Luna, P., and A. van Rixtel. 2013. “Emerg-ing Markets and Talk of Tapering.” BIS Quarterly Review (December): 16–17.
Gordon, R. J. 2014. “The Demise of U.S. Economic Growth: Restatement, Rebuttal, and Reflections.” NBER Working Paper No. 19895, National Bureau of Economic Research, Cambridge, MA.
Guidotti, P., F. Sturzenegger, and A. Villar. 2004. “On the Consequences of Sudden Stops.” Economia 4 (2): 171–214.
Hall, R. E. 2014. “Quantifying the Lasting Harm to the U.S. Economy from the Financial Crisis.” In NBER Macroeconomics Annual 2014, Volume. 29, edited by J. Parker and M. Woodford.
Hamilton, J. D., E. S. Harris, J. Hatzius, and K. D. West. 2015. “The Equilibrium Real Funds Rate: Past, Present, and Future.” Working Paper, Univer-sity of California, San Diego.
Hunter, D. M., and D. P. Simon. 2005. “A Condi-tional Assessment of the Relationships between the Major World Bond Markets.” European Financial Management 11 (4): 463–82.
Hutchison, M., and I. Noy. 2006. “Sudden Stops and the Mexican Wave: Currency Crises, Capital Flow Reversals and Output Loss in Emerging Mar-kets.” Journal of Development Economics 79 (1): 225–48.
Hutchison, M. M., I. Noy, and L. Wang. 2010. “Fiscal and Monetary Policies and the Cost of Sud-den Stops.” Journal of International Money and Fi-nance 29: 973–87.
S P E C I A L F E AT U R E 1G LO B A L E C O N O M I C P R O S P E C T S | J U N E 2 0 1 5 27
Ikeda, Y., D. Medvedev, and M. Rama. 2015. “Advanced-Country Policies and Emerging-Market Currencies: The Impact of U.S. Tapering on India’s Rupee.” Policy Research Working Paper 7219, World Bank, Washington, DC.
Institute of International Finance. 2015. “Heat Map of EM Vulnerabilities.” (May).
IMF. 2013. Global Financial Stability Report: Transi-tion Challenges to Stability (October). Washington, DC: International Monetary Fund.
______. 2014a. Global Financial Stability Report: Risk Taking, Liquidity, and Shadow Banking: Curb-ing Excess While Promoting Growth (October). Washington, DC: International Monetary Fund.
______. 2014b. “IMF Multilateral Policy Issue Re-port: 2014 Spillover Report.” Washington, DC: In-ternational Monetary Fund.
______. 2014c. Regional Economic Outlook: Western Hemisphere (April). Washington, DC: In-ternational Monetary Fund.
______. 2014d. The Liberalization and Manage-ment of Capital Flows: An Institutional View. Washington, DC: International Monetary Fund.
______. 2015. Global Financial Stability Report: Navigating Monetary Policy Challenges and Manag-ing Risks (January). Washington, DC: International Monetary Fund.
Kaminsky, G. 2008. “Crises and Sudden Stops: Evi-dence from International Bond and Syndicated-Loan Markets.” NBER Working Paper No. 14249, National Bureau of Economic Research, Cam-bridge, MA.
Koepke, R. 2015a. “What Drives Capital Flows to Emerging Markets? A Survey of Empirical Litera-ture.” IIF Working Paper, Institute of International Finance, Washington, DC.
______. 2015b. “Fed Policy Expectations and Port-folio Flows to Emerging Markets.” IIF Working Paper, Institute of International Finance, Washing-ton, DC.
Kose, M. A., and E. Prasad. 2010. Emerging Mar-kets: Resilience and Growth Amid Global Turmoil. Washington, DC: Brookings Institution Press.
Kose, M. A., E. Prasad, K. Rogoff, and S. Wei. 2010. “Financial Globalization and Economic Poli-cies.” In Handbook of Development Economics, Vol-
ume 5, edited by D. Rodrik and M. R. Rosenzweig, 4283–362. Oxford, U.K.: North-Holland.
Lavigne, R., S. Sarker, and G. Vasishtha. 2014. “Spillover Effects of Quantitative Easing on Emerg-ing-Market Economies.” Bank of Canada Review (Autumn): 23–33.
Levchenko, A., and P. Mauro. 2007. “Do Some Forms of Financial Flows Protect from Sudden Stops?” World Bank Economic Review 21 (3): 389-411.
Lee, H., C. Park, and H. Byun. 2013. “Do Conta-gion Effects Exist in Capital Flow Volatility?” Jour-nal of the Japanese and International Economies 30: 76–95.
Lim, J., S. Mohapatra, and M. Stocker. 2014. “Tin-ker, Taper, QE, Bye? The Effect of Quantitative Eas-ing on Financial Flows to Developing Countries.” Policy Research Working Paper 6820, World Bank, Washington, DC.
Lo Duca, M. 2012. “Modeling the Time Varying Determinants of Portfolio Flows to Emerging Mar-kets.” Working Paper Series 1468, European Cen-tral Bank, Frankfurt.
Matheson, T. and E. Stavrev. 2014. “News and Monetary Shocks at a High Frequency: A Simple Approach.” IMF Working Paper No. 14/167, Inter-national Monetary Fund, Washington, DC.
Meinusch, A., and P. Tillmann. 2015. “Quantitative Easing and Tapering Uncertainty: Evidence from Twitter.” Joint Discussion Paper Series in Econom-ics, No. 09-2015, University of Marburg, Marburg, Germany.
Mishra, P., K. Moriyama, P. N’Diaye, and L. Nguye. 2014. “Impact of Fed Tapering Announcements on Emerging Markets.” IMF Working Paper WP/14/109, International Monetary Fund, Washington, DC.
Opazo, L., C. Raddatz, and S. Schmukler. 2014. “Institutional Investors and Long-Term Investment: Evidence from Chile.” Policy Research Working Pa-per 6922, World Bank, Washington, DC.
Ortiz, A., Ottonello, P., Sturzenegger, F., Talvi, E., 2009. “Monetary and Fiscal Policies in a sudden Stop: Is Tighter Brighter?” In Dealing with an Inter-national Credit Crunch: Policy Responses to Sudden Stops in Latin America, edited by E. Cavallo and A. Izquierdo, 23–73. Washington, DC: Inter-Ameri-can Development Bank.
S P E C I A L F E AT U R E 1 G LO B A L E C O N O M I C P R O S P E C T S | J U N E 2 0 1 5 28
Park, K. Y., and J. Y. Um. 2015. “Spillover Effects of U.S. Unconventional Monetary Policy on Korean Bond Markets: Evidence from High-Frequency Data.” Working Paper, Yonsei University, Seoul, South Korea.
Raddatz, C., and S. Schmukler. 2012. “On the In-ternational Transmission of Shocks: Micro-Evidence from Mutual Fund Portfolios.” Journal of Interna-tional Economics 88: 357–74.
Rai, V., and L. Suchanek. 2014. “The Effect of the Federal Reserve’s Tapering Announcements on Emerging Markets.” Bank of Canada Working Pa-per, Bank of Canada, Ottawa.
Rajan, R. 2014. “Concerns about Competitive Monetary Easing.” Speech at Bank of Japan, Tokyo, May 30.
Rey, H. 2013. “Dilemma not Trilemma: The Global Financial Cycle and Monetary Policy Indepen-dence.” In Proceedings of the Federal Reserve Bank of Kansas City Economic Symposium at Jackson Hole. Federal Reserve Bank of Kansas City.
Rothenberg, A., and F. Warnock. 2011. “Sudden Flight and True Sudden Stops.” Review of Interna-tional Economics 19 (3): 509-24.
Sahay, R., V. B. Arora, A. V. Arvanitis, H. Faruqee, P. N’Diaye, and T. M. Griffoli. 2014. “Emerging Market Volatility: Lessons from the Taper Tan-trum.” IMF Staff Discussion Notes No. 14/9, Inter-national Monetary Fund, Washington, DC.
Sánchez, M. 2013. “The Impact of Monetary Poli-cies of Advanced Countries on Emerging Markets.” Remarks at the 55th Annual Meeting of the Na-tional Association of Business Economists, San Francisco, September 9.
Santacreu, A. M. 2015. “The Economic Fundamen-tals of Emerging Market Volatility.” Economic Syn-opses (January), Federal Reserve Bank of St. Louis.
Schularick, M., and A. M. Taylor. 2012. “Credit Booms Gone Bust: Monetary Policy, Leverage Cy-cles, and Financial Crises, 1870-2008.” American Economic Review 102 (2): 1029-61.
Shin, H. 2013: “The Second Phase of Global Li-quidity and Its Impact on Emerging Economies.” Speech at the Asia Economic Policy Conference, sponsored by the Federal Reserve Bank of San Fran-cisco, November 3–5.
Williams, J. C. 2015. “The Decline in the Natural Rate of Interest.” Federal Reserve Bank of San Fran-cisco, manuscript based on the presentation for the NABE panel “The Outlook for the U.S. and Global Economy: Headwinds, Tailwinds and Whirlwinds,” January 3.
World Bank. 2014a. Global Economic Prospects: Coping with Policy Normalization in High-Income Countries (January). Washington, DC: World Bank.
______. 2014b. “Financial Market Outlook” (Feb-ruary). World Bank, Washington, DC.
______. 2015. Global Economic Prospects: Having Fiscal Space and Using It (January). Washington, DC: World Bank.
Yellen, J. 2015a. “Normalizing Monetary Policy: Prospects and Perspectives”. Speech at “The New Normal Monetary Policy,” a research conference sponsored by the Federal Reserve Bank of San Fran-cisco, San Francisco, March 27.
______. 2015b. Comments after speech at “Finance and Society,” a conference sponsored by Institute for New Economic Thinking, Washington, DC, May 6. Available at http://www.bloomberg.com/n e w s / a r t i c l e s / 2 0 1 5 - 0 5 - 0 6 /yellen-s-focus-on-term-premium-getting-noticed-in-bond-market.
______. 2015c. “The Outlook for the Economy.” Speech at the Providence Chamber of Commerce, Providence, Rhode Island, May 22.
Zhao, Y., J. de Haan, B. Scholtens, and H. Yang. 2014. “Sudden Stops and Currency Crashes.” Re-view of International Economics 22 (4): 660-85.