Hooke et al_2013_Dispersal plumes in till
9
ARTICLE Genesis of dispersal plumes in till 1 Roger LeB. Hooke, Don I. Cummings, Jerome-Etienne Lesemann, and David R. Sharpe Abstract: In regions formerly covered by continental ice, till sheets may contain distinctive clastic particles derived from local bedrock sources such as ore bodies. Such particles, especially in thicker tills, may be distributed in three-dimensional dispersal trains or plumes. Developments in our understanding of glacial erosion, entrainment, and deposition over the past two or three decades help clarify formation of these plumes. Much of the debris in the basal ice of ice sheets is likely incorporated at places where water is freezing onto the base of the ice sheet. This water, largely a product of melting of basal ice further upglacier, has migrated downglacier under the influence of a gradient in the hydraulic potential controlled primarily by the ice surface slope and secondarily by basal topography and thermal regime. Refreezing occurs over a substantial distance along flow, so as the ice moves away from an ore body, material eroded from the body is later elevated above the bed by refreezing of more meltwater, incorporating additional material derived from the country rock. Broadening and mixing of the plume, both vertically and horizontally, can occur by shear in the ice, by shifting ice flow directions, by collisions between particles, and by folding of basal ice layers. Further downflow, where net basal melting resumes, the debris is deposited by meltout or lodgement. Many idiosyn- crasies of dispersal plumes are likely caused by non-steady-state changes in basal thermal regime. Résumé : Dans des régions anciennement recouvertes de glace continentale, les couches de till peuvent contenir des particules clastiques distinctives provenant du socle rocheux local, p. ex des amas minéralisés. De telles particules, surtout dans les tills a ` grande épaisseur, peuvent être distribuées dans des trains ou des panaches de dispersion a ` trois dimensions. Au cours des deux a ` trois dernières décennies, une meilleure compréhension de l'érosion glaciaire, du transport et de la déposition a aidé a ` expliquer la formation de ces panaches. Une grande partie des débris dans la couche de glace basale est sans doute incorporée a ` des endroits où l'eau gèle a ` la base de la nappe glaciaire. Cette eau, provenant en grande partie de la fusion de la couche de glace basale plus en amont du glacier, a migré vers l'aval sous l'influence d'un gradient du potentiel hydraulique, lequel est surtout contrôlé par la pente de la surface glaciaire et puis par la topographie a ` la base du glacier et le régime thermique. Le regel a lieu sur une grande distance le long de l'écoulement; donc, a ` mesure que la glace s'éloigne d'un amas minéralisé, le matériel érodé de l'amas est par la suite élevé au-dessus du lit par le regel d'autre eau de fonte, incorporant du matériel additionnel provenant de la roche encaissante. L'élargissement du panache et le mélange a ` l'intérieur de celui-ci, horizontalement et verticalement, peuvent se produire par le cisaillement de la glace, le changement de direction d'écoulement de la glace, des collisions entre les particules et le plissement de couches basales. Plus encore vers l'aval, lorsque recommence la fonte basale nette, les débris sont déposés dans un till de fusion ou de fond. Plusieurs particularités des panaches de dispersion proviennent probablement de changements d'états non stationnaires au régime thermique de base. [Traduit par la Rédaction] Introduction For over two centuries, it has been recognized that ore bodies could be located by tracing clasts in glacial till back to their origin in the bedrock. The process by which the clasts had been moved, however, was initially unknown (see Grip 1953 for historical de- tails). The “clasts” to which we refer herein vary in size from microscopic grains, identifiable only by chemical analysis, to cob- bles and boulders with visible mineralogy. If these can be associ- ated with a known source, all of them, from chemical signatures to macroscopic particles, are called indicators (Flint 1971, p. 175; Shilts 1993; Neuendorf et al. 2005). Drake (1983) believed that the distribution of indicators in till must inherently be three- dimensional (3-D) (Fig. 1), and thus that a 3-D term like “plume” should be used. Plume is normally used to refer to 3-D buoyancy- driven flows; Drake, however, used the term, and we use it herein, only to emphasize the 3-D nature of the dispersion (not the driv- ing force). The 3-D character can be recognized only if the till sheet sam- pled is thick, and if samples are taken at different depths. Most tills are sampled using shallow pits dug at the surface (e.g., Larson and Mooers 2005; McClenaghan et al. 2002), which precludes identifying the plume geometry. In addition, many till sheets are relatively thin; plumes in these are also likely 3-D, but this would be difficult to demonstrate. That clasts higher in the till came from further up-ice was ap- parently first recognized by Sauramo (1924, cited by Puranen 1988). The full 3-D nature of plumes, however, was likely first demonstrated by geologists tracing a train of boulders containing rich silver ore near Harmsarvet, Sweden, in 1935–1937 (Grip 1953). There, a boulder train was followed northward, first on the sur- face and then in subsurface by trenching, until the mother lode was found. Drake (1983) cites several examples which he reinterprets to be evidence for a 3-D geometry, and noted some difficulties in ex- plaining this geometry. He was particularly concerned by the fact Received 5 February 2013. Accepted 16 May 2013. Paper handled by Associate Editor Timothy Fisher. R.LeB. Hooke. School of Earth and Climate Sciences and Climate Change Institute, University of Maine, Orono, ME 04469, USA. D.I. Cummings. DC Geosciences, 12 Decarie Street, Aylmer, QC J9H 2M3, Canada. J.-E. Lesemann. Department of Earth Sciences, University of Ottawa, Ottawa, ON K1N 6N5, Canada. D.R. Sharpe. Geological Survey of Canada, 601 Booth St. Ottawa, ON K1A 0E8, Canada. Corresponding author: Roger LeBaron Hooke (e-mail: [email protected]). A correction was made to the e-First version of this paper on 6 July 2013 prior to final issue publication. The current online and print versions are identical and both contain the correction. 1 Geological Survey of Canada (GSC) Contribution 20130062. 847 Can. J. Earth Sci. 50: 847–855 (2013) dx.doi.org/10.1139/cjes-2013-0018 Published at www.nrcresearchpress.com/cjes on 3 June 2013. Can. J. Earth Sci. Downloaded from www.nrcresearchpress.com by University of Maine on 07/12/13 For personal use only.
-
Upload
don-cummings -
Category
Documents
-
view
87 -
download
0
Transcript of Hooke et al_2013_Dispersal plumes in till

ARTICLE
Genesis of dispersal plumes in till1
Roger LeB. Hooke, Don I. Cummings, Jerome-Etienne Lesemann, and David R. Sharpe
Abstract: In regions formerly covered by continental ice, till sheets may contain distinctive clastic particles derived from localbedrock sources such as ore bodies. Such particles, especially in thicker tills, may be distributed in three-dimensional dispersaltrains or plumes. Developments in our understanding of glacial erosion, entrainment, and deposition over the past two or threedecades help clarify formation of these plumes. Much of the debris in the basal ice of ice sheets is likely incorporated at placeswhere water is freezing onto the base of the ice sheet. This water, largely a product of melting of basal ice further upglacier, hasmigrated downglacier under the influence of a gradient in the hydraulic potential controlled primarily by the ice surface slopeand secondarily by basal topography and thermal regime. Refreezing occurs over a substantial distance along flow, so as the icemoves away from an ore body, material eroded from the body is later elevated above the bed by refreezing of more meltwater,incorporating additional material derived from the country rock. Broadening and mixing of the plume, both vertically andhorizontally, can occur by shear in the ice, by shifting ice flow directions, by collisions between particles, and by folding of basalice layers. Further downflow, where net basal melting resumes, the debris is deposited by meltout or lodgement. Many idiosyn-crasies of dispersal plumes are likely caused by non-steady-state changes in basal thermal regime.
Résumé : Dans des régions anciennement recouvertes de glace continentale, les couches de till peuvent contenir des particulesclastiques distinctives provenant du socle rocheux local, p. ex des amas minéralisés. De telles particules, surtout dans les tills agrande épaisseur, peuvent être distribuées dans des trains ou des panaches de dispersion a trois dimensions. Au cours des deuxa trois dernières décennies, une meilleure compréhension de l'érosion glaciaire, du transport et de la déposition a aidé aexpliquer la formation de ces panaches. Une grande partie des débris dans la couche de glace basale est sans doute incorporéea des endroits où l'eau gèle a la base de la nappe glaciaire. Cette eau, provenant en grande partie de la fusion de la couche de glacebasale plus en amont du glacier, a migré vers l'aval sous l'influence d'un gradient du potentiel hydraulique, lequel est surtoutcontrôlé par la pente de la surface glaciaire et puis par la topographie a la base du glacier et le régime thermique. Le regel a lieusur une grande distance le long de l'écoulement; donc, a mesure que la glace s'éloigne d'un amas minéralisé, le matériel érodéde l'amas est par la suite élevé au-dessus du lit par le regel d'autre eau de fonte, incorporant du matériel additionnel provenantde la roche encaissante. L'élargissement du panache et le mélange a l'intérieur de celui-ci, horizontalement et verticalement,peuvent se produire par le cisaillement de la glace, le changement de direction d'écoulement de la glace, des collisions entre lesparticules et le plissement de couches basales. Plus encore vers l'aval, lorsque recommence la fonte basale nette, les débris sontdéposés dans un till de fusion ou de fond. Plusieurs particularités des panaches de dispersion proviennent probablement dechangements d'états non stationnaires au régime thermique de base. [Traduit par la Rédaction]
IntroductionFor over two centuries, it has been recognized that ore bodies
could be located by tracing clasts in glacial till back to their originin the bedrock. The process by which the clasts had been moved,however, was initially unknown (see Grip 1953 for historical de-tails). The “clasts” to which we refer herein vary in size frommicroscopic grains, identifiable only by chemical analysis, to cob-bles and boulders with visible mineralogy. If these can be associ-ated with a known source, all of them, from chemical signaturesto macroscopic particles, are called indicators (Flint 1971, p. 175;Shilts 1993; Neuendorf et al. 2005). Drake (1983) believed that thedistribution of indicators in till must inherently be three-dimensional (3-D) (Fig. 1), and thus that a 3-D term like “plume”should be used. Plume is normally used to refer to 3-D buoyancy-driven flows; Drake, however, used the term, andwe use it herein,only to emphasize the 3-D nature of the dispersion (not the driv-ing force).
The 3-D character can be recognized only if the till sheet sam-pled is thick, and if samples are taken at different depths. Mosttills are sampled using shallow pits dug at the surface (e.g., Larsonand Mooers 2005; McClenaghan et al. 2002), which precludesidentifying the plume geometry. In addition, many till sheets arerelatively thin; plumes in these are also likely 3-D, but this wouldbe difficult to demonstrate.
That clasts higher in the till came from further up-ice was ap-parently first recognized by Sauramo (1924, cited by Puranen1988). The full 3-D nature of plumes, however, was likely firstdemonstrated by geologists tracing a train of boulders containingrich silver ore near Harmsarvet, Sweden, in 1935–1937 (Grip 1953).There, a boulder train was followed northward, first on the sur-face and then in subsurface by trenching, until the mother lodewas found.
Drake (1983) cites several examples which he reinterprets to beevidence for a 3-D geometry, and noted some difficulties in ex-plaining this geometry. He was particularly concerned by the fact
Received 5 February 2013. Accepted 16 May 2013.
Paper handled by Associate Editor Timothy Fisher.
R.LeB. Hooke. School of Earth and Climate Sciences and Climate Change Institute, University of Maine, Orono, ME 04469, USA.D.I. Cummings. DC Geosciences, 12 Decarie Street, Aylmer, QC J9H 2M3, Canada.J.-E. Lesemann. Department of Earth Sciences, University of Ottawa, Ottawa, ON K1N 6N5, Canada.D.R. Sharpe. Geological Survey of Canada, 601 Booth St. Ottawa, ON K1A 0E8, Canada.
Corresponding author: Roger LeBaron Hooke (e-mail: [email protected]).A correction was made to the e-First version of this paper on 6 July 2013 prior to final issue publication. The current online and print versions are identical and both contain the correction.1Geological Survey of Canada (GSC) Contribution 20130062.
847
Can. J. Earth Sci. 50: 847–855 (2013) dx.doi.org/10.1139/cjes-2013-0018 Published at www.nrcresearchpress.com/cjes on 3 June 2013.
Can
. J. E
arth
Sci
. Dow
nloa
ded
from
ww
w.n
rcre
sear
chpr
ess.
com
by
Uni
vers
ity o
f M
aine
on
07/1
2/13
For
pers
onal
use
onl
y.

that once a source is covered by till, further erosion would beinhibited. However, he did not offer a solution to this problem.Miller (1984) provided data demonstrating the 3-D nature of somegeochemical dispersal plumes, and attributed the rising of theplume to low-angle thrust planes. Stanley (2009, p. 42) invokedthrusting to entrain material, and he correctly recognized that en-trainmentwould continue downflow fromanore body.However, hethought the plume was raised off the bed because shear somehowmoved particles upward in the ice. He did not provide a rigorousphysical explanation for this process. Puranen (1990, p. 31) went astep further, appealing to “the action of newly eroded materialpushing the previously loosened grains upwards” to elevate oreparticles into the ice. Both Drake and Miller focused on the obser-vation that the maximum concentration of indicators was some-times found hundreds ofmetres or kilometres downflow from thebedrock source. Drake, however, did not have subsurface data todemonstrate that the feature was 3-D, and in some cases we sus-pect he overinterpreted the observations.
In our effort to clarify the formation of dispersal plumes, webuild on Puranen's analyses, incorporating ideas on glacial ero-sion that have developed over the past 30 years. These ideas, sep-arately, are well known in the glaciological community. Some,however, do not appear to have been discussed in the explorationliterature, and to the best of our knowledge they have not previ-ously been combined into a model for formation of dispersalplumes. Our goal in this paper is to provide exploration geologistsand others studying dispersal plumeswith a better understandingof plume formation, and thus a firmer foundation upon which tointerpret their observations.
Temperature of an ice sheetGlacial erosion is strongly dependent on the thermal regime at
the base of an ice sheet. Where ice is frozen to the bed, erosion isnegligible. Where the basal temperature is at the pressure melt-ing point and ice is melting, erosion is possible but the thicknessof the basal layer of debris-bearing ice is likely minimized by thetendency for particles to be moved toward the bed as meltingoccurs. Where meltwater is freezing to the base of the ice sheet,however, substantial thicknesses of debris-rich basal ice can accu-mulate.
Near the center of an ice sheet, at the ice surface, the meanannual accumulation rate in metres of ice equivalent is roughlybalanced by the vertical velocity, w. This vertical flow advects coldice downwards, thus cooling the bed (Fig. 2). In the Laurentide IceSheet, the ice at the divide was likely thicker than shown in Fig. 2,perhaps approaching 3 km. The accumulation rate was also prob-ably quite low. Thus, there may well have been a small amount ofbasal melting beneath the divide (Fig. 3).
Outward from the divide, the horizontal velocity increases, asdoes the accumulation rate (and hencew). Thus, downward advec-tion of cold surface ice is stronger, and the ice is also advectedoutward (dashed flowline in Fig. 3). Although this advection ofcold ice is partially offset by higher surface temperatures at lower
elevations and by strain heating near the bed, it still leads to adownglacier increase the basal temperature gradient. Where thisgradient becomes steep enough to conduct upward into the icemore heat than is supplied by the geothermal flux, water movingoutward along the ice/bed interface will refreeze. In constructingFig. 3, conditions were selected that resulted in refreezing of basalmeltwater between �270 and 450 km from the divide, and in afrozen bed between �450 and 840 km. The continued outwardincrease in strain heating, however, eventually raises the temper-ature above the pressure melting point again at a distance of�840 km from the divide.
These thawed¡frozen and frozen¡thawed transitions, andthat described next, are likely gradational, as illustrated in Fig. 4.The frozen patches in Fig. 4 may be colder because they areslightly higher (so the ice over them is thinner) or they may resultfrom spatial differences in thermal conductivity of the substrate.
Still further downglacier, slightly down-ice from the equilib-rium line, the vertical velocity becomes upward, and the temper-ature profile, instead of being bowed downward as in Fig. 2, isbowed upward. This dramatically reduces the amount of geother-mal heat that can be conducted to the surface, and basal meltrates increase accordingly (Fig. 3). At the margin, however, wherethe upward vertical velocity again decreases and the ice becomes
Fig. 1. Idealized model of a 3-D dispersal train in till (after Drake 1983; used with permission of the University of Chicago Press).
Ore body
Ice flow
Fig. 2. Temperature (T) profiles near the center of an ice sheet,2000 m thick, with various vertical velocities (w). Geothermal flux:33 mW/m2 (typical of parts of the Canadian Shield; Blackwell andRichards 2004). Calculated using Robin's (1955) theory.
848 Can. J. Earth Sci. Vol. 50, 2013
Published by NRC Research Press
Can
. J. E
arth
Sci
. Dow
nloa
ded
from
ww
w.n
rcre
sear
chpr
ess.
com
by
Uni
vers
ity o
f M
aine
on
07/1
2/13
For
pers
onal
use
onl
y.
thin, the outermost few kilometres of the ice sheet may be frozento the bed.
Budd et al. (1971) were apparently the first to present modelcalculations showing this zonation of subglacial thermal regimes,but David Sugden's pioneering 1977 paper called attention to itsrelevance to geomorphic problems. By extending Sugden's analy-sis closer to the margin, Moran et al. (1980) recognized the possi-bility of a frozen toe there, but they assumed a steady state. Cutleret al. (2000) called attention to the fact that such frozen toes mayalso develop when an ice sheet advances over permafrost — anon-steady-state situation — and showed that they could havepersisted for centuries.
Water movement beneath a polar ice sheetMelt rates beneath polar ice sheets may reach several millime-
tres per year (Fig. 3). This water must either escape or accumulateuntil it can escape. Initially, it accumulates in any permeablesubstrate that may be present. Once the substrate becomes satu-rated, a water layer forms between the ice and the bed. As long asthe water discharge through the substrate is less than the basalmelt rate, the pressure in this layer will rise, limited only by theweight of the overlying ice. When the water pressure approachesthe overburden pressure, flow is initiated between the substrateand the glacier sole.
The water flow is driven by the gradient in the potential, �,given approximately by
(1)∂�∂s
� �ig∂h∂s
� �wg∂z∂s
where �i and �w are the densities of ice andwater, respectively, h isthe glacier thickness, g is the acceleration due to gravity, and z isthe elevation above some datum such as sea level (Shreve 1972).Water will tend to flow, either through the substrate or as a sub-glacial stream, in the direction, s, in which ∂�/∂s is amaximum. Inmost cases, the bed topography, ∂z/∂s, simply perturbs the flowdirection without altering the overall flow, which is in the direc-tion of decreasing ice thickness, ∂h/∂s — toward the margin.
Glacier erosion and entrainmentTo form a dispersal plume, a glaciermust entrainmaterial from
the bed and transport it downflow. Some of this material waslikely saprolite formed by pre- or inter-glacial weathering (e.g.,Feininger 1971). Most known dispersal trains, however, are inbasal till deposited by the Laurentide and Fennoscandian icesheets that reached their maximum extent about 20 ka. Whilethese probably derivedmuch of their debris load from earlier tills,they must also have eroded unweathered crystalline rock by abra-sion and quarrying. In general, abrasion produces silt and clay-sized particles, while quarrying results inmacroscopic fragments.Rock strength, however, also affects particle size; weaker rocksare less likely to yield pebble and coarser debris, so studies focus-ing on only one size fraction, particularly the coarser fraction,may overlook significant anomalies (Dilabio and Shilts 1979;Shilts 1993).
The question of how glaciers entrain sediment was debated inthe 1950s and 1960s and is still not well understood (Alley et al.1997). Goldthwait (1951) believed that debris was sheared into theice and actually carried to the glacier surface along the shearplanes. This hypothesis was initially widely accepted. Weertman(1961), however, perhaps inspired by Drygalski (1897), suggestedinstead that material was entrained at places where meltwater,moving outward from a zone of netmelting, was refreezing to theglacier sole. Radar soundings in Antarctica have revealed a re-markable example of this process (Bell et al. 2011): basal ice layerswith a mean thickness of �490 m are interpreted as originatingfrombasal refreezing over 30–60 kiloyears, suggesting a freeze-onrate of 5–15 mm/a. Christoffersen et al. (2010) argue that a layer ofdebris bearing ice at the base of Kamb ice stream in Antarcticaoriginated in this way. Alternative explanations for several of thefeatures Goldthwait (1951) attributed to shear were provided by
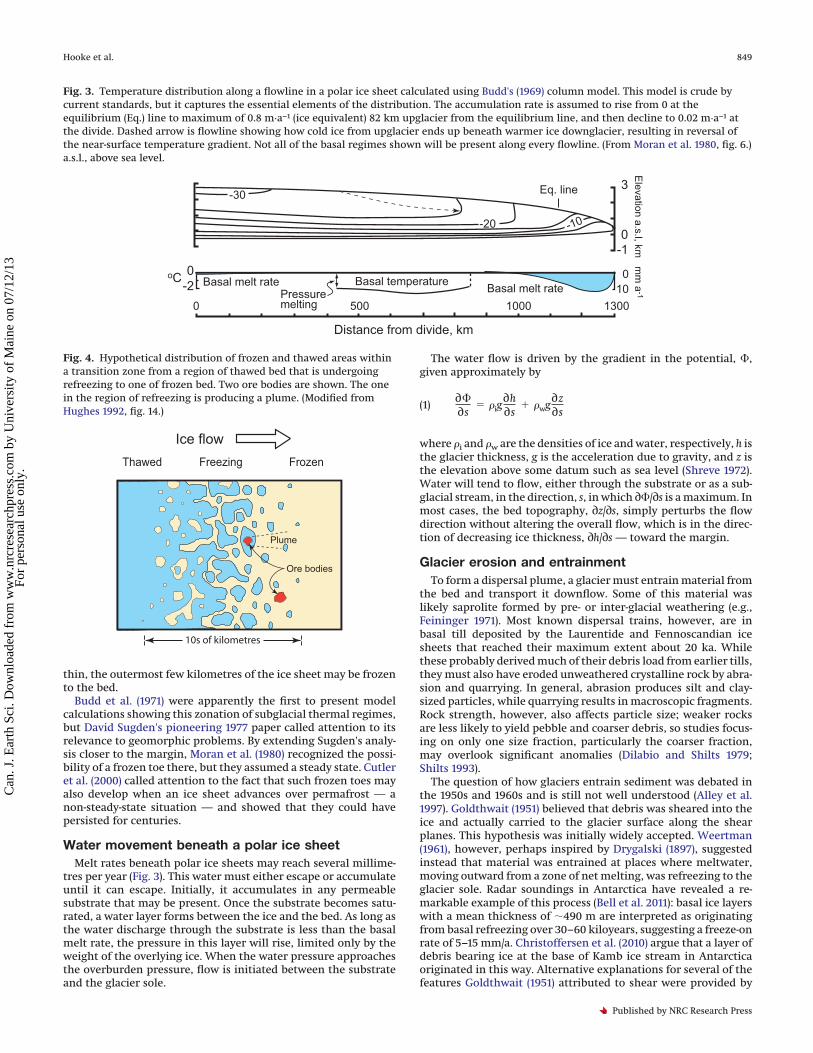
Fig. 3. Temperature distribution along a flowline in a polar ice sheet calculated using Budd's (1969) column model. This model is crude bycurrent standards, but it captures the essential elements of the distribution. The accumulation rate is assumed to rise from 0 at theequilibrium (Eq.) line to maximum of 0.8 m·a−1 (ice equivalent) 82 km upglacier from the equilibrium line, and then decline to 0.02 m·a−1 atthe divide. Dashed arrow is flowline showing how cold ice from upglacier ends up beneath warmer ice downglacier, resulting in reversal ofthe near-surface temperature gradient. Not all of the basal regimes shown will be present along every flowline. (From Moran et al. 1980, fig. 6.)a.s.l., above sea level.
Distance from divide, km
0 500 1000 1300
0-2
oC Basal melt ratePressuremelting
Basal temperature 010
mm
a-1Basal melt rate
-30
-20 -10
Eq. line 3
0-1
Elevation a.s.l, km
Fig. 4. Hypothetical distribution of frozen and thawed areas withina transition zone from a region of thawed bed that is undergoingrefreezing to one of frozen bed. Two ore bodies are shown. The onein the region of refreezing is producing a plume. (Modified fromHughes 1992, fig. 14.)
Thawed Freezing Frozen
Ice flow
Plume
Ore bodies
10s of kilometres
Hooke et al. 849
Published by NRC Research Press
Can
. J. E
arth
Sci
. Dow
nloa
ded
from
ww
w.n
rcre
sear
chpr
ess.
com
by
Uni
vers
ity o
f M
aine
on
07/1
2/13
For
pers
onal
use
onl
y.

measurements near the margin of Barnes Ice Cap on Baffin Island(Hooke 1973). Alley et al. (1997) discussed other processes for en-training debris such as shearing in zones of high longitudinalcompression; injection into basal crevasses (see also Ensmingeret al. 2001); and regelation normal to the bed. Bed-normal regela-tion forces ice down into permeable sediment (e.g., Drygalski1897; Iverson and Slemmons 1995; Iverson 2000) that then may besheared loose from the bed. Observations beneath 213 m of ice atEngabreen, Norway, provide intriguing evidence for this process(Iverson et al. 2007). However, it, alone, cannot raise debris furtheroff the bed as it is transported. Alley et al. (1997) also discussed avariation of Weertman's refreezing mechanism involving forma-tion of frazil ice in water moving up an adverse bed slope andtrapping fine sediment particles in the flow.
Herein, we focus on the refreezing mechanisms, recognizing,however, that other processes may also entrain material.
A point to emphasize from this discussion is that debris-richbasal ice accumulates through time and, contrary to normal sed-imentary successions, it accumulates from the bottom up so thelast material entrained is at the bottom. In many situations thisstratigraphy is likely to persist as the debris is deposited as till.The implications of these facts were not fully appreciated byDrake (1983) and Miller (1984).
A model for formation of dispersal plumesOurmodel for formation of dispersal plumes depends, globally,
on the overall glacier regime, and locally on the thermal state atthe bed. We couch the discussion in terms of an ore body, al-though a local bedrock source of any distinctive lithology canform a plume. We also couch it in terms of a steady state, as if theice sheet were plunked down on the landscape fully formed and atthermal and kinematic equilibrium with the prevailing condi-tions. Non-steady-state complications are discussed later.
Based on the foregoing discussion, we think plumes are proba-bly initiated in areas like that between 270 and 450 km in Fig. 3where water is refreezing to the glacier sole in a wide diffuseboundary zone like that illustrated in Fig. 4. Significant incorpo-ration of country rock begins where refreezing starts (at I inFig. 5c). In the absence of an effective mechanism for incorporat-ing large amounts of debris, and consistent with our steady-stateapproximation, the ice upflow from this location is relativelyclean. The plume is initiated at II, where the refreezing occursover the ore body. Downflow from point III ore fragments areelevated into the glacier by continued refreezing, incorporatingmore country rock, and dispersed by diffusion processes (dis-cussed later in the text). We view debris entrainment as a contin-
Fig. 5. Genesis of a 3-D plume (modified from Miller 1984; used with permission of Maney Publishing, London). (a) Map view of the plume asexposed at the surface. (b) Transverse cross sections through plume while still in ice. (c) Longitudinal section showing (i) initiation ofentrainment at I where water begins to refreeze to the glacier sole, (ii) initiation of dispersal train at II, and (iii) cessation of entrainment at IVwhere water supply is exhausted. (d) Plume after till is deposited. This plume geometry was obtained by compressing the geometry in panel cvertically and shearing it horizontally. Compare with panel a.
A'
A A' B B' C C' D D'
Clean ice
Dirty ice
Clean ice
Dirty ice
Ore bodyClean iceDirty ice
Country rock
Plume
FrozenMelting Wet and refreezing
Ice flow
B - B' C - C' D - D'A - A'
Transverse cross sectionsshowing plume while stillin ice
Map view showing concen-trations of ore in surface till after stagnation, meltout, anderosion.
a.
b.
c.
Ore body(Not exposed at surface)
d.
Longitudinal cross sectionshowing plume while stillin ice
Longitudinal cross sectionshowing plume after stag-naton, meltout and erosion
Till
Bedrock
A few to several kilometres
Sev
eral
met
ers
toa
few
ten
s o
f m
eter
s
I IVIIIII
Typically5 - 30 m
Typically1 - 10 m
850 Can. J. Earth Sci. Vol. 50, 2013
Published by NRC Research Press
Can
. J. E
arth
Sci
. Dow
nloa
ded
from
ww
w.n
rcre
sear
chpr
ess.
com
by
Uni
vers
ity o
f M
aine
on
07/1
2/13
For
pers
onal
use
onl
y.

uous process between I and IV so a rather thick basal layer of dirtyice accumulates. Particles higher in this layer will have come fromfurther upglacier, consistent with the observations of Sauramo(1924) and others. The thickness of the layer will depend on thedifference between the heat flux to the bed from below and thatupward from the bed into the ice, and on the sliding speed of theglacier. The concentration of debris will depend on the erodibilityof the bed.
The moving dirty basal ice can experience one of two fates: (i) itcan freeze to the bed once the supply of liquid water from upgla-cier is exhausted (at �500 km in Fig. 3 or IV in Fig. 5), or (ii) it canreach a place where there is net basal melting again withoutpassing over a zone of frozen bed. In the former case there will beincreased compressional strain, folding, and possibly someminorthrust faulting. These processes will thicken the layer of dirty ice,but the concentration of particles in the ice will not change. De-bris carried in ice above the bed will continue to move downgla-cier. With the basal ice now frozen to the bed, shear strain ratesare likely to increase, further smearing out the feature. In thelatter case, the dispersal feature will be gradually let down andparticles will be lodged in the substrate. Because the basal meltrate is small compared with the flow rate, this will also smear outthe feature over a considerable distance downflow.
Panel d of Fig. 5 shows the plume once the till has been depos-ited by lodgment or meltout. The plume has been reduced inthickness and sheared horizontally. Thiswas the state sketched byMiller (1984) based on two well-documented examples (see Fig. 8),and is the state depicted in panel a and in Fig. 1. (As sketched, thetransition from panel c to panel d requires a change in regime, anon-steady-state.).
Precisely the same processes could occur in a transition to afrozen toe in a marginal zone.
A noteworthy characteristic of plumes is that an ore body in onelocation may produce one while other(s) in the same area do not(Grip 1953, p. 721; McClenaghan et al. 2002, p. 317). This could wellbe because refreezing of basal meltwater was occurring over theore body that produced a plume, but not over the others, and isconsistent with the model of basal temperature distribution inFig. 4.
Vertical and lateral dispersion of indicatorsThe concentration of indicators is 0 outside a plume and rises to
a maximum in its center. Over an ore body, the concentration ofore clasts in the last ice to have been accreted approaches 100%.Further downflow, particles are affected by vertical shear in theice (∂u/∂zwhere u is the ice velocity in the downflow or x direction,and y and z are the axes in the transverse and vertical directions);by horizontal shear (∂u/∂y) as the ice passes frozen patches,coarser particles ploughing into the bed, or zones of higher bedroughness; by local changes in ice flow direction in response tobed topography; and by collisions between particles as they shearpast one another (Weertman 1968). These processes are diffusive;they move ore particles preferentially outward toward ice inwhich their concentration is low, and particles of country rockinward, into the dispersal train, where their concentration is alsolow. The dispersal feature is thus broadened, thickened, and di-luted.
Global changes in flow direction in response to climate changeor other perturbations (e.g., Flint 1971, pp. 176–177; Shilts, 1993,p. 347) are also especially important in broadening a plume.Viewed at this scale, they are advective rather than diffusive.Equally important, but greatly underappreciated, is the fact thatchanges in glacier regime can result in isoclinal recumbent foldsin basal ice (Fig. 6) (Hudleston 1976). Such folding is responsiblefor a lack of stratigraphic correlation in the basal 200 m of theGreenland Ice Sheet in the ice cores GRIP and GISP II (Meese et al.1997, p. 26 420) which are only 28 km apart. Folding may well be amajor contributor to mixing of indicators. As amplitude/wave-length ratios in such folds commonly exceed 102, this processmayappear to be diffusive.
Erosion of till surfacesWhere entrainment of debris is initiated upflow from the ore
body, the proximal part of a plume will be overlain by ice thatcontains debris but is free of the indicator lithology. More distally,a dilute part of the plume may reach the surface by diffusiveprocesses (Fig. 5b, Section D–D=). However, to expose the high-concentration core, as shown in Fig. 5a, it would seem that somespecial circumstance is required.
Fig. 6. Recumbent fold in basal ice of Barnes Ice Cap, Baffin Island, Canada. The fold is believed to have formed as a result of a slight changein flowlines in basal ice following a climatic perturbation (Hudleston 1976) (photo: R.LeB.H., summer 1969).
Hooke et al. 851
Published by NRC Research Press
Can
. J. E
arth
Sci
. Dow
nloa
ded
from
ww
w.n
rcre
sear
chpr
ess.
com
by
Uni
vers
ity o
f M
aine
on
07/1
2/13
For
pers
onal
use
onl
y.

The core of a plume may become exposed if the indicator-poorcover is removed, either by subglacial or subaerial erosion. As tillis gradually lodged, ice flow continues. Thus, the core of theplume may be deposited, and then the overlying, not-yet-deposited, indicator-poor cover sheared away and replaced byclean ice. Subglacial meltwater may also erode the top of till;eskers on the Canadian Shield commonly lie in meltwater corri-dors, 1–5 km wide, that are typically interpreted to have beeneroded subglacially (Craig 1964; Rampton 2000). Alternatively,erosion may occur post-glacially by subaerial processes.
Folding in the ice (Fig. 6) may also leave the core of the plumeexposed at the ground surface after deglaciation.
Time scale for formation of a dispersal plumeConsider an ore body 400 km from the center of an ice dome
and under 3 km of ice flowing radially. The mean accumulationrate between the dome and the ore body is 0.2m/a (ice equivalent).These are roughly the conditions at the transition from thawed tofrozen bed in Fig. 3. To transfer all of that ice downglacier, andthus preserve a steady-state ice sheet profile, the depth-averagedice velocity (commonly called the balance velocity) over the orebody would have to be �13 m/a. The velocity near the bed woulddepend on the fraction of the bed that was frozen, but would besignificantly less than this (Hughes 1992). Thus, a dispersal train10 km long might take well over 1000 years to form. A thousandyears is a substantial length of time, but it is only a small fractionof the time during which many areas were covered by ice in thelast 100 000 years.
Longitudinal variation in indicator concentrationShilts (1976, pp. 209–210; 1993, p. 344) noted that, in some indi-
cator trains, concentrations of indicators peaked “in till at or closeto their source.” He thought that, in an “ideal” situation, theconcentration, c, of indicators would decrease with distance, x,from the source following a “negative exponential” pattern. LarsonandMooers (2004) showed analytically that the depth-averaged con-centration of indicators should fall off hyperbolically with dis-tance. Their relation can be written as
(2) c �1
a � bx
where, for any given situation, a and b are constants that dependon the mass of till in transport upflow from the ore body, thebreadth of the ore body in the direction of flow, and the erosivitiesof the ore and country rock. In a till sheet only ametre or so thick,the variation in concentration with depth may be minimal and,barring non-steady-state phenomena, the variation in indicatorconcentration in surface samples might follow this relation, atleast approximately. However, the model illustrated in Fig. 5
suggests that, in thicker till sheets, one might expect a gap be-tween the source and the maximum concentration in surfacesamples.
PartitioningDilabio and Shilts (1979) and Shilts (1993) emphasized that the
composition of unweathered till from a single site commonly varieswith grain size. The latter notes, for example, that “the presenceof abundant local pebbles and cobbles should not be taken tomean that the finer fractions of the till are likewise of local origin,nor should the opposite be assumed” (p. 344). This is a very inter-esting observation for which we suggest three possible explana-tions. (i) Particles of different sizes may be deposited at differentrates. Finer particles may settle out though a millimetre-scalesubglacial water layer while coarser ones are dragged further bythe moving ice. (ii) Different rock types, or different minerals in arock (Shilts 1993, pp. 338–339), likely produce particles of differ-ent sizes. These may then become mixed by the diffusive pro-cesses described earlier in the text. (iii) Fine particles arecommonly produced by abrasion while coarser ones by plucking.On a relatively smooth bed, abrasion can occur without plucking.In any case, this observation suggests that laboratory analysis ofsamples should not be confined to a small range of grain sizes, andthat, at least during reconnaissancework, analysis of separate sizefractions could be useful.
The non-steady-stateMany idiosyncrasies of plumes can be attributed to non-steady-
state conditions. We have already alluded to some high-frequencynon-steady-state processes like collisions between particles orploughing of coarser particles into the bed. Lower-frequencychanges could involve the distribution of frozen and thawedpatches on the bed, the erosivity of the bed (perhaps as a surfaceweathered zone is removed), and paths of meltwater movementalong the bed. These latter three are probably themost importantfor explaining characteristics of plumes. At still lower frequencyis migration, either upglacier or downglacier, of the transitionzone between thawed and frozen zones, and climate changes af-fecting the overall flow field. We illustrate these with some casestudies and a hypothetical example.
Ranch Lake kimberlite trainThe Ranch Lake kimberlite train (McClenaghan et al. 2002) ex-
tends westward from a kimberlite pipe beneath Ranch Lake inCanada's Northwest Territories (Fig. 7). The train can be traced for70 km, but the segment of most concern to us is the first 20 km inwhich the train widens from 0.5 to 2 km. Contrary to eq. (2), theconcentration of the indicator minerals, Cr–diopside (Fig. 7) andpyrope in the 0.42–0.84 mm size range, increases downflow,reaching maxima between 15 and 20 km from the subcrop (the
Fig. 7. The Ranch Lake kimberlite train. Indicator mineral is Cr–diopside in the 0.42–0.84 mm size range. Contours are number of grains in a20 kg sample. Kimberlite source is at �. Modified from McClenaghan and Kjarsgaard (2007).
0
10
50150
300
5 km
N Ice flow
Sampling points
852 Can. J. Earth Sci. Vol. 50, 2013
Published by NRC Research Press
Can
. J. E
arth
Sci
. Dow
nloa
ded
from
ww
w.n
rcre
sear
chpr
ess.
com
by
Uni
vers
ity o
f M
aine
on
07/1
2/13
For
pers
onal
use
onl
y.

“exposure” of the source beneath the till). Most samples werecollected from shallow (0.2–0.8 m) hand-dug pits in mudboils inplaces where the till sheet was 2–10 m thick.
The failure of the indicator-mineral concentration to decreaseas predicted by eq. (2) could be due to the following:
(i) Differential rates of comminution in which coarser parti-cles in the till are comminuted to the 0.42–0.84 mm rangefaster than existing particles in that range are reduced tofiner sizes. Although some authors suggest that comminu-tion is of minor importance in tills (Dredge et al. 1997;McClenaghan and Kjarsgaard 2001), in some cases it maybe a factor (Dreimanis and Vagners 1971, 1972). In this caseit cannot be ruled out with available data.
(ii) A period during the time of westerly ice flow in this areawhen the kimberlite eroded faster than either earlier orlater, or during which the country rock eroded faster, thusdiluting the concentration of indicator minerals. Changesin erosion rates, are likely causes of gaps between subcropsand indicator maxima as Puranen (1990, p. 29) noted. Suchchanges could be caused by changes in erosivity of the rockas deeper layers become exposed, in the distribution offrozen and thawed patches, or in water movement alongthe ice-bed interface. McClenaghan et al. (2002) suggestedthat the erosion rate might also decrease as differentialerosion increased the depth of the kimberlite below theaverage elevation of the bedrock, but one can questionwhether enough erosion occurred during formation of thetrain to have had such an effect.
(iii) The 3-D character of the plume. Although not clearly defineddue to lack of subsurface data, this possibility should not bedismissed. As noted, samples were collected from mudboilswhich likely homogenize the upper part of the till. Tills aretypically <2 m thick in this area. However, near the kimber-lite,which lies in a depression, theymaybe thicker. Thus, themudboils may not have been deep enough to sample highconcentrations of indicator phases nearer the bed.
Lough Derg plumeThe Lough Derg plume (Fig. 8) in central Ireland is one of two
studied by Miller (1984). Till in the area ranges from 4 to 15 m inthickness. The indicator element is Pb derived from the Old RedSandstone. Miller (p. 72) notes that the Old Red “… commonly con-tains elevated Pb values near the formation top” and he frequentlyrefers to an “assumed source” of an anomaly. We interpret this asindicating that the source of any given anomaly is not known, butthat numerous sources are likely to have existed. Miller, as noted,attributes rising plumes to low-angle thrust planes in the till, andthinks the bed topography may deflect a plume upward.
There are three anomalies (A–C in Fig. 8) in the distribution forwhich we will offer possible explanations:
(i) The high concentration at the surface at A may have beensourced further upflow at a time when the bedrock therewas producing till with high concentrations of Pb or waseroding more rapidly than it was later. Some post-depositional erosion is likely to have occurred here.
(ii) The>400ppmPb zone at the surface at Bmay reflect a periodof higher erosion rate, or erosion of bedrockwith a higher Pbconcentration, near the top of the bedrock high at D, the restof the plume having come from lower on this hill. On suchlow hills, changes from freeze-on to frozen are likely com-mon, as geothermalheat is deflectedaway fromhighs towardlows by such topography (Hooke and Medford 2013).
(iii) The separation of the >800 ppm Pb zone at C from the tipof the buried zone at E likely reflects a period of reducederosion rate on the lee flank of the hill at 225m or a periodof higher flow speed (or both). A period of reduced refreez-ing on the lee side of that hill could reduce erosion andincrease sliding speed.
The Red Hill syenite boulder train, New Hampshire (USA)The Red Hill syenite boulder train (Fig. 9a) was described by
Goldthwait (1968) and is one of those discussed by Drake (1983). Itextends �35 km downflow from a 340 m high hill composed of adistinctive syenite, reaches amaximumwidth of �14 km, and hasseveral indicator maxima. The indicators are syenite boulders instone walls. Goldthwait (1968, p. 25) notes that, “Stone counts ofsmaller pebbles in till suggest much the same pattern…but withslightly higher percentages”. There is a strong indicator maxi-mum at the base of Red Hill and then what Drake calls a “shadowzone” between Red Hill and what Drake considered to be theprincipal maximum along the northern side of the train. Drakeattributes this shadow zone to the distance required for a plumeto reach the surface.
When ice covered Red Hill and was actively eroding it, the hillwas likely overlain by syenite-bearing dirty ice, which probably inturn was overlain by syenite-free dirty ice from upflow (Fig. 9b).Later, downflow from the hill, subglacial melting deposited thisentrained debris as lodgement till. There may also have been a tillcover on the hill that was later removed by subaerial erosion.Without 3-D data, we cannot know whether the syenite-bearingtill is underlain by syenite-free till.
Given that Red Hill projects well above the surrounding tillblanket, the barren till in the shadow zone is noteworthy. It mayhave come from up-ice of Red Hill as we have shown Fig. 9b.However, equally likely is the possibility that non-steady-stateprocesses were again involved. Owing to changes in water flow orthermal regime, erosion of the syenite could have ceased wellbefore deglaciation, so ice with the highest concentration of syen-ite was moved away from the hill.
Similarly, the other two areas of high syenite concentration,further downflow and along apparently different flowlines, likelyreflect an earlier period of erosion, perhaps concentrated on op-posite flanks of the hill leading to two peaks rather than only one.This may have occurred at a time when the top of the hill wasfrozenwhile the bottomwas thawed, a likely common occurrenceas noted earlier.
Complete detachment of a train from its sourceWhen an ice sheet becomes frozen to its bed, the pressuremelt-
ing isotherm no longer lies at the glacier sole; it is deeper in thesubstrate. When it is only a few (or a very few tens) of metresbelow the sole, and when the water pressure beneath it is high,failure may take place along the isothermal surface. Substantialpackages of subglacial sediment or bedrock have thus becomeattached to an ice sheet and transported, en masse, tens to hun-dreds or thousands of metres (Liszkowski 1987; Aber 1989). A layerof till, up to some metres in thickness and containing a plume,could thus be detached from its source. Such displacement wouldbe difficult to recognize in the field, and would likely prove con-fusing and frustrating to the prospector following a plume up-icein hopes of finding its source.
ConclusionsEntrainment of substantial volumes of subglacial material
likely occurs in areas where the sole of a continental ice sheet is atthe pressure melting temperature and meltwater from upglacieris refreezing to it, incorporating particles from the bed. An orebody in such an area would constitute a localized source for clastswith a distinctive lithology. Extending an analysis by Puranen(1988, 1990), we argue that as ice moves away from this source,more water is frozen to the glacier sole, entraining more countryrock and raising the dispersal train off the bed (Fig. 5c). This re-sults in a rather thick layer of dirty ice of which the dispersal trainconstitutes only a part. The dispersal train is preserved when thedirty ice becomes frozen to the bed and remains so as the iceretreats, or when basal melting begins to occur and the entrained
Hooke et al. 853
Published by NRC Research Press
Can
. J. E
arth
Sci
. Dow
nloa
ded
from
ww
w.n
rcre
sear
chpr
ess.
com
by
Uni
vers
ity o
f M
aine
on
07/1
2/13
For
pers
onal
use
onl
y.

debris is deposited as lodgment till. Either process would likelysmear out the dispersal train substantially.
Non-steady-state changes offer many possibilities for perturb-ing this basic pattern. Over the several centuries that it likelytakes to generate a dispersal train, changes inmeltwater supply tothe area of eroding bed or in basal thermal regime are to beexpected, and will alter both the erosion rate and the ice flowspeed, leading to longitudinal variations in indicator concentra-
tion. Changes in flow direction are also likely on these time scales,and will lead to broadening of the dispersal train.
AcknowledgementsThe comments of P. Larson, H. Mooers, and V. Rampton on
earlier versions of the manuscript and discussions with A.Plouffe resulted in significant improvements and are muchappreciated. D. Kerr reviewed the manuscript internally for the
Fig. 8. Cross section of the Loch Derg plume studied by Miller (1984). Contours at 200, 400, and 800 ppm Pb. Modified from Miller (1984, fig. 6;used with permission of Maney Publishing, London).
Fig. 9. (a) Map of Red Hill indicator fan discussed by Drake (1983). (Modified from Goldthwait 1968, fig. 7A; used with permission of the NewHampshire Geological Survey.) (b) Schematic longitudinal cross section showing geometry while ice was present. During deposition,thicknesses of the dirty ice layers would be reduced and sheared, but otherwise their relative positions would not be changed. (Colours infigure refer to online version.)
0 5km
Red Hill
0
1
0
1
2
5
0
19
5Contours at: 0, 1, 2, 5, 10, and 19%Hachured contours surround areas of 0%Dark blue areas are >10%Not all contours are shown Data point
Lake Winnipesaukee
a2
Clean ice
Dirty ice Dirty ice with syenite (plume)
b
Red Hill
Shadow zonePrincipal maximum
Present erosion surface
NIce flowShadowzone
854 Can. J. Earth Sci. Vol. 50, 2013
Published by NRC Research Press
Can
. J. E
arth
Sci
. Dow
nloa
ded
from
ww
w.n
rcre
sear
chpr
ess.
com
by
Uni
vers
ity o
f M
aine
on
07/1
2/13
For
pers
onal
use
onl
y.

Geological Survey of Canada (GSC). GSC funding support wasfrom Targeted Geoscience Initiative (TGI-4) and Geo-mappingfor Energy and Minerals (GEM) minerals.
ReferencesAber, J.S. 1989. Spectrum of constructional glaciotectonic landforms. In Genetic
Classification of Glacigenic Deposits: Final Report of the Commission onGenesis and Lithology of Glacial Quaternary Deposits of the InternationalUnion for Quat. Res. (INQUA). Edited by R.P. Goldthwait and C.L. Matsch. A.A.Balkema, Rotterdam. pp. 281–292.
Alley, R.B., Cuffey, K.M., Evenson, E.B., Strasser, J.C., Lawson, D.E., andLarson, G.J. 1997. How glaciers entrain and transport basal sediment. Physicalconstraints. Quaternary Science Reviews, 16: 1017–1038.
Bell, R.E., Ferraccioli, F., Creyts, T.T., Braaten, D., Corr, H., Das, I., Damaske, D.,Frearson, N., Jordan, T., Rose, K., Studinger, M., andWolovick, M. 2011. Wide-spread persistent thickening of the East Antarctic ice sheet by freezing fromthe base: Science, 331: 1592–1595.
Blackwell, D.D., and Richards, M.C. 2004. Geothermal map of North America.Tulsa, OK, American Association of Petroleum Geologists. ISBN: 0791815722.
Budd, W.F. 1969. The dynamics of ice masses. Australian Nat'l Antarctic Expedi-tions Scientific Reports, Series A (IV) Glaciology. Publication No. 108.
Budd, W.F., Jenssen, D., and Radok, U. 1971. Derived physical characteristics ofthe Antarctic Ice Sheet. Australian Nat'l Antarctic Expeditions Interim Re-ports, Series A (IV) Glaciology. Publication No. 120.
Christoffersen, P., Tulaczyk, S., and Behar, A. 2010. Basal ice sequences in Ant-arctic ice stream: exposure of past hydrologic conditions and a principalmode of sediment transfer. Journal of Geophysical Research, F03034. doi:10.1029/2009JF001430.
Craig, B.C. 1964. Surficial geology of east-central District of Mackenzie. Geolog-ical Survey of Canada, Bulletin 99, 41 p.
Cutler, P.M., MacAyeal, D.R., Mickelson, D.M., Parizek, B.R., and Colgan, P.M.2000. A numerical investigation of ice-lobe – permafrost interaction aroundthe southern Laurentide ice sheet. Journal of Glaciology, 46(153): 311–325.doi:10.3189/172756500781832800.
Dilabio, R.N.W., and Shilts, W.W. 1979. Composition and dispersal of debris bymodern glaciers, Bylot Island, Canada. In Moraines and varves: origin,genesis and classification. Edited by C. Schlüchter. A.A. Balkema, Rotter-dam. pp. 145–155.
Drake, L.D. 1983. Ore plumes in till. Journal of Geology, 91: 707–713. doi:10.1086/628821.
Dredge, L.A., Kerr, D.E., Kjarsgaard, I.M., Knight, R.D., and Ward, B.C. 1997.Kimberlite indicator minerals in till, central Slave Province, Northwest Ter-ritories. Geological Survey of Canada Open File 3426.
Dreimanis, A., and Vagners, U.J. 1971. Bimodal distribution of rock and mineralfragments in basal tills. In Till, a symposium. Edited by R.P. Goldthwait. OhioState University Press, Columbus, Ohio. pp. 237–250.
Dreimanis, A., and Vagners, U.J. 1972. The effect of lithology on the texture of till.In Research methods in Pleistocene geomorphology. Edited by E. Yatsu andA. Falconer. 2nd Guelph Symposium on Geomorphology, Guelph, Ont.pp. 66–82.
Drygalski, E. von. 1897. Grönland-Expedition der Gesellschaft für Erdkunde zuBerlin, 1891–1893. Bd. 1. Grönlands Eis und sein Vorland. Berlin, W.H. Kuhl,p. 109.
Ensminger, S.L., Alley, R.B., Evenson, E.B., Lawson, D.E, and Larson, G.J. 2001.Basal-crevasse-fill origin of laminated debris bands at Matanuska glacier,Alaska, U.S.A. Journal of Glaciology, 47(158): 412–422.
Feininger, T. 1971. Chemical weathering and glacial erosion of crystallinerocks and the origin of till. U.S. Geological Survey Professional Paper750-C, C65–C81.
Flint, R.F. 1971 Glacial and Quaternary Geology. John Wiley and Sons, Inc., NewYork. p. 892.
Goldthwait, R.P. 1951. Development of end moraines in east-central Baffin Is-land. Journal of Geology, 59(6): 567–577. doi:10.1086/625912.
Goldthwait, R.P. 1968. Surficial geology ofWolfeboro-Winnepesaukee Area, NewHampshire. Concord, New Hampshire Department of Resources and Eco-nomic Development, p. 60.
Grip, E. 1953. Tracing glacial boulders as an aid to ore prospecting in Sweden.Economic Geology, 48: 715–725. doi:10.2113/gsecongeo.48.8.715.
Hooke, R.L. 1973. Flow near the margin of the Barnes Ice Cap, and the develop-ment of ice-cored moraines. Geological Society of America Bulletin, 84:3929–3948. doi:10.1130/0016-7606(1973)84<3929:FNTMOT>2.0.CO;2.
Hooke, R.L., and Medford, A. 2013. Drumlins: a product of a thermo-mechanicalinstability. Quaternary Research, 79(3): 458–464. doi:10.1016/j.yqres.2012.12.002.
Hudleston, P.J. 1976. Recumbent folding in the base of the Barnes Ice Cap, BaffinIsland, Northwest Territories, Canada. Geological Society of America Bulle-tin, 87(12): 1678–1683. doi:10.1130/0016-7606(1976)87<1678:SDODBF>2.0.CO;2.
Hughes, T. 1992. Abrupt climate change related to unstable ice-sheet dynamics:
toward a new paradigm. Palaeogeography., Palaeoclimatology, and Palaeo-ecology, 97: 203–234. doi:10.1016/0031-0182(92)90209-N.
Iverson, N.R. 2000. Sediment entrainment by a soft-bedded glacier: A modelbased on regelation into the bed. Earth Surfaces and Landforms, 25: 881–893.doi:10.1002/1096-9837(200008)25:8<881::AID-ESP105>3.0.CO;2-Y.
Iverson, N.R., and Slemmons, D.J. 1995. Intrusion of ice into porous media byregelation: A mechanism of sediment entrainment by glaciers. Journal ofGeophysical Research, 100(B7): 10219–10230. doi:10.1029/95JB00043.
Iverson, N.R., Hooyer, T.S., Fischer, U.H., Cohen, D., Moore, P.L., Jackson, M.,Lappegard, G., and Kohler, J. 2007. Soft-bed experiments beneath Engabreen,Norway: regelation infiltration, basal slip and bed deformation. Journal ofGlaciology, 53(182): 323–340. doi:10.3189/002214307783258431.
Larson, P., and Mooers, H. 2004. Glacial indicator dispersal processes: a concep-tual model. Boreas, 33: 238–249. doi:10.1080/03009480410001262.
Larson, P., and Mooers, H. 2005. Generation of a heavy-mineral glacial indicatordispersal train from a diabase sill, Nipigon region, northwestern Ontario.Canadian Journal of Earth Sciences, 42(9): 1601–1613. doi:10.1139/e05-088.
Liszkowski, J. 1987. Zonal arrangement of thermal regimes of Pleistocene icesheets as indicated by field data from Poland. In The Physical Basis of IceSheet Modelling (Proceedings of the Vancouver Symposium, August 1987).IAHS Publ. 170. pp. 121–130.
McClenaghan, M.B., and Kjarsgaard, B.A. 2001. Indicator mineral and geochem-ical methods for diamond exploration in glaciated terrain in Canada. InDriftexploration in glaciated terrain. Edited byM.B. McClenaghan, P.T. Bobrowsky,G.E.M. Hall, and S.J. Cook. Geol. Soc., London, Spec. Publ. 185, pp. 873–123.
McClenaghan, M.B., and Kjarsgaard, B.A. 2007. Indicator mineral and surficialgeochemical exploration methods for kimberlite in glaciated terrain, exam-ples from Canada. In Mineral Resources of Canada: A Synthesis of MajorDeposit-types, District Metallogeny, the Evolution of Geological Provincesand Exploration Methods. Geological Association of Canada, Special Publica-tion No. 5, pp. 983–1006.
McClenaghan, M.B.,Ward, B.C., Kjarsgaard, I.M., Kjarsgaard, B.A., Kerr, D.E., andDredge, L.A. 2002. Indicator mineral and till geochemical dispersal patternsassociatedwith the Ranch Lake kimberlite, Lac de Gras region, NWT, Canada.Geochemistry: Exploration, Environment, Analysis, 2, 299–320.
Meese, D.A., Gow, A.J., Alley, R.B., Zielinski, G.A., Grootes, P.M., Ram, M.,Taylor, K.C., Mayewski, P.A., and Bolzan, J.F. 1997. The Greenland Ice SheetProject 2 depth-age scale: Methods and results. Journal of Geophysical Re-search, 102(C12): 26411–26423. doi:10.1029/97JC00269.
Miller, J.K. 1984. Model for clastic indicator trains in till: Prospecting in Areasof Glaciated Terrain. The Institution of Mining and Metallurgy, London.pp. 69–77.
Moran, S.R., Clayton, L., Hooke, R.LeB., Fenton, M.M., and Andriashek, L.D. 1980.Glacier bed landforms of the prairie region of North America. Journal ofGlaciology, 25(93): 457–476.
Neuendorf, K.E., Mehl, J.P., Jr., and Jackson, J.A. (Editors). 2005. Glossary of Geol-ogy. Alexandria, VA, American Geological Institute, p. 779.
Puranen, R. 1988. Modelling of glacial transport of basal tills in Finland. Geolog-ical Survey of Finland, Rept. No. 3312, p. 27.
Puranen, R. 1990. Modelling of glacial transport in tills. Chapter 2. In Glacialindicator tracing. Edited by R. Kujansuu and M. Saarnisto. A.A. Balkema, Rot-terdam, Netherlands. p. 252.
Rampton, V.N. 2000. Large-scale effects of subglacial meltwater flow in thesouthern Slave Province, Northwest Territories, Canada. Canadian Journal ofEarth Sciences, 37(1): 81–93. doi:10.1139/e99-110.
Robin, G.deQ. 1955. Ice movement and temperature distribution in glaciersand ice sheets. Journal of Glaciology, 2(18): 523–532. doi:10.3189/002214355793702028.
Sauramo, M. 1924. Tracing of glacial boulders and its application in prospecting.Bulletin de la Commission Géologique de Finlande 67, 37 p.
Shilts, W.W. 1976. Glacial till and mineral exploration: In Glacial till. Edited byR.F. Legget. Royal Soc. Canada, Spec. Publ. 12, pp. 205–224.
Shilts,W.W. 1993. Geological Survey of Canada's contributions to understandingthe composition of glacial sediments. Canadian Journal of Earth Sciences,30(2): 333–353. doi:10.1139/e93-026.
Shreve, R.L. 1972. Movement of water in glaciers. Journal of Glaciology, 11(62):205–214.
Stanley, C.R. 2009. Geochemical, mineralogical, and lithological dispersionmodels in glacial till: Physical process constraints and application inmineralexploration. InApplication of till and streamheavymineral and geochemicalmethods to mineral exploration in western and northern Canada. Edited byR.C. Paulen and I. McMartin. Geological Association of Canada, GAC ShortCourse Notes 18, pp. 35–48.
Sugden, D.E. 1977. Reconstruction of the morphology, dynamics, and thermalcharacteristics of the Laurentide Ice Sheet at its maximum. Arctic and AlpineResearch, 9(1): 21–47. doi:10.2307/1550407.
Weertman, J. 1961. Mechanism for the formation of inner moraines near theedge of cold ice caps and ice sheets. Journal of Glaciology, 3(30): 965–978.
Weertman, J. 1968. Diffusion law for the dispersion of hard particles in an icematrix that undergoes simple shear deformation. Journal of Glaciology,7(50): 161–165.
Hooke et al. 855
Published by NRC Research Press
Can
. J. E
arth
Sci
. Dow
nloa
ded
from
ww
w.n
rcre
sear
chpr
ess.
com
by
Uni
vers
ity o
f M
aine
on
07/1
2/13
For
pers
onal
use
onl
y.