Hong Kong’s Future - Bauhinia Foundation Research CentreObjectives To examine Hong Kong’sfuture...
29
20 February 2014 1 Hong Kong’s Future Population and Manpower Needs to 2030
Transcript of Hong Kong’s Future - Bauhinia Foundation Research CentreObjectives To examine Hong Kong’sfuture...

20 February 2014
1
Hong Kong’s Future
Population and
Manpower Needs
to 2030

This report is NOT about
Crystal-balling the states of the world and economy
Predicting in detail about the future
Making specific recommendations that the Government can
adopt immediately
This report is about
What Hong Kong’s demographic profile may look like in
2030
What effects this will have on the society and economy
What strategies can be adopted to achieve the best possible
outcome
What This Report is about?
2

Objectives
To examine Hong Kong’s future population and manpower needs
to 2030
To critically review the available evidence on population dynamics in
Hong Kong and their impact on the growth of the labour force
To map out areas of future direction in order to secure and nurture a
population that sustains Hong Kong’s long-term competitiveness
Methodology
Desktop research
Collecting different views through attending various forums
Conducting in-depth interviews
Conducting focus group meetings
Study Objectives and Methodology
3

The Problem in a Nutshell
Low fertility rate
High dependency ratios
Shrinking labour force
Increasing challenge with attracting and retaining talents
Declining economic productivity
Declining GDP per capita
Increasing government expenditure but decreasing revenue
Deteriorating quality and quantity of public services
4

Low Fertility Rate
Total fertility rate consistently well below the replacement level of
2.1 children per woman (1.19 in 2031)
5
1.20
1.18
1.19 1.19 1.19
1.17
1.18
1.18
1.19
1.19
1.20
1.20
1.21
2011 2016 2021 2026 2031
Ra
te
Year
Projected Total Fertility Rate
Source: Hong Kong Population Projections 2012–2041, C&SD
0

High Dependency Ratios
High overall dependency ratio, mainly elderly-driven
In 2031, 1,000 persons aged 15-64 supporting 578 persons
aged<15 and ≥65
6
333
437
578
177
272
418
155 165 161
0
100
200
300
400
500
600
700
2011 2021 2031
De
pe
nd
en
cy R
ati
o
Year
Overall dependency ratio
Elderly dependency ratio
Child dependency ratio
Source: Hong Kong Population Projections 2012–2041, C&SD

Shrinking Labour Force
3,712,600
3,519,700 (51.9%)
3,400,000
3,450,000
3,500,000
3,550,000
3,600,000
3,650,000
3,700,000
3,750,000
La
bo
ur
Fo
rce
Year
Projected labour force
Labour force will peak at 3.7 million in 2018 then decline to
3.5 million in 2031
Labour force participation rate will decrease from 60.0% in 2013 to 51.9% in 2031
Need some 500,000+ labour to maintain the 2013 labour force participation rate at
60.0%
7
Projected labour force participation rate+549,300
4,069,000
(60.0%)60.0%
Source: Updated Hong Kong Labour Force Projections for 2013 to 2041, C&SD
0

What We Should Do?
Immigration and Integration
Organic Growth
Pan-Greater Pearl River Delta Integration
Planning for the Elderly
Financial Planning
8

Immigration and Integration
Encourage immigration
9
28,625
19,154
8,105
6,756
3,804
502
298
0 10,000 20,000 30,000 40,000
Employment Visas under 'General Employment Policy'
Dependent Visas
Employment Visas under 'Admission Scheme for Mainland Talents and Professionals'
Visas under 'Immigration Arrangements for Non-local Graduates'
Entry Visas under 'Capital Investment Entrant Scheme'
Entry Visas under 'Working Holiday Scheme'
Quotas Allotted under 'Quality Migrant Admission Scheme'
Selected Visas / Entry Permits Issued 2012
Source: Annual Report 2012, Immigration Department

Immigration and Integration (Cont’d)
Move Hong Kong into a real global city model
10
Born in Mainland/Macao/Taiwan:
2,267,917(32.1%)Born in
Hong Kong: 4,278,126 (60.5%)
Born Elsewhere:
525,533 (7.4%)
Hong Kong 2011
Source: 2011 Population Census, C&SD

Immigration and Integration (Cont’d)
11
Born
Elsewhere:
3,136,592
(37.6%)
Born in US:
5,200,105
(62.4%)
New York City 2012
Born
Elsewhere:
2,998,264
(36.7%)Born in UK:
5,175,677
(63.3%)
London 2011
Sources:
2012 American Community Survey, US Census Bureau
2011 Census, UK Office for National Statistics
2011 National Household Survey, Statistics Canada
Born
Elsewhere:
973,595
(42.7%)
Born in
Canada:
1,307,105
(57.3%)
Vancouver 2011

Immigration and Integration (Cont’d)
Marginal increases in fertility due to increasing presence of migrant
groups
Emphasis on integration of immigrants
Instill a greater sense of belonging to help reduce the churn rate
12
Source: The Fertility Trend in Hong Kong, 1981 to 2012, C&SD
Births to
Mainland
Women:
33,199
(36.3%)
Births to
Hong Kong
and non-
Mainland
Women:
58,359
(63.7%)
Births in HK 2012

Immigration and Integration (Cont’d)
13
Fertility rate:
Samoa 4.63
Iraq 3.36
Lebanon 3.98
Syria 3.61
Pakistan 3.50
Top five countries:
Poland, Pakistan,
India, Bangladesh and
Nigeria
Sources:
Childbearing of UK and Non-UK Born Women Living in the
UK, 2011, UK Office for National Statistics
TABLE 9: Births, Country of Birth of Parents, Australia –
2012, Australian Bureau of Statistics
Births to non-UK-
born women:
196,000 (24.3%)
Fertility rate: 2.28Births to UK-born
women:
612,000 (75.7%)
Fertility rate: 1.89
Births in UK 2011
Births to non-
Australian-born
women:
97,653 (31.6%)
Births to
Australian-born
women:
211,570 (68.4%)
Fertility rate: 1.95
Births in Australia 2012
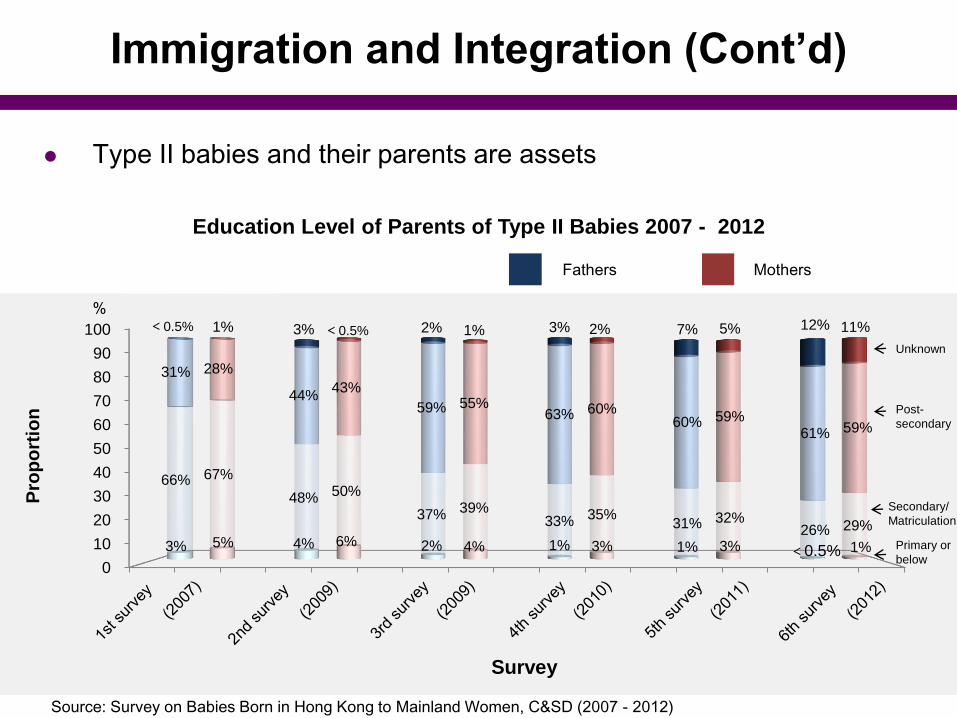
Immigration and Integration (Cont’d)
Type II babies and their parents are assets
14
0
10
20
30
40
50
60
70
80
90
100
3% 5% 4% 6% 2% 4% 1% 3% 1% 3% <0.5% 1%
66% 67%
48% 50%
37% 39% 33% 35%
31% 32% 26% 29%
31% 28%
44% 43%
59% 55% 63% 60%
60% 59% 61% 59%
<0.5% 1% 3% <0.5% 2% 1% 3% 2% 7% 5% 12% 11%
Pro
po
rtio
n
Survey
%
Fathers Mothers
Education Level of Parents of Type II Babies 2007 - 2012
Unknown
Post-
secondary
Secondary/
Matriculation
Primary or
below
Source: Survey on Babies Born in Hong Kong to Mainland Women, C&SD (2007 - 2012)
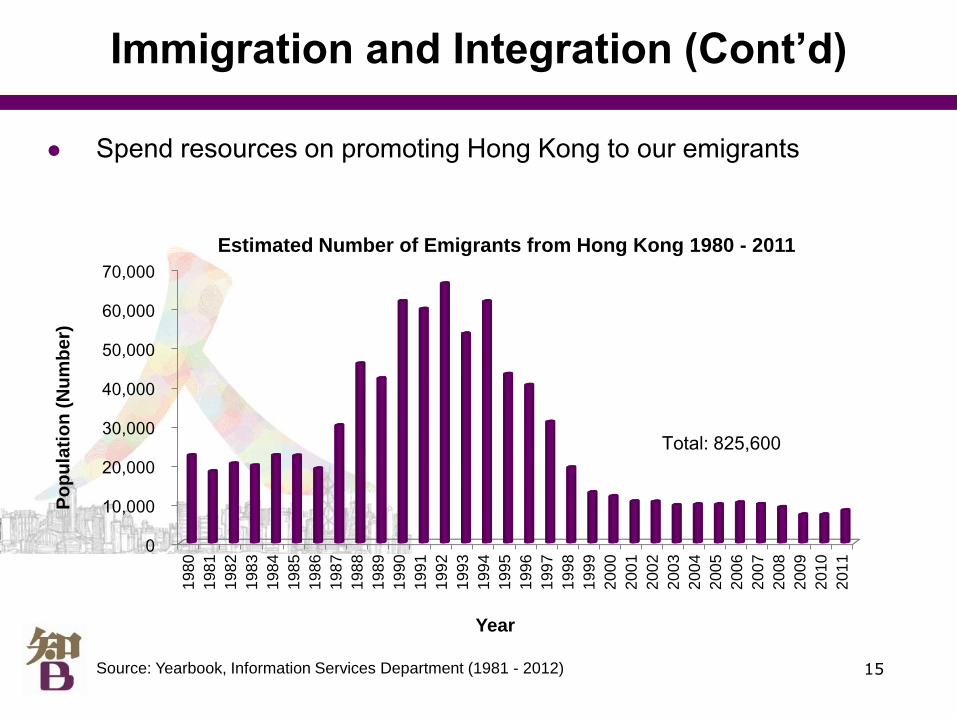
Immigration and Integration (Cont’d)
Spend resources on promoting Hong Kong to our emigrants
15
0
10,000
20,000
30,000
40,000
50,000
60,000
70,000
198
0
198
1
198
2
198
3
198
4
198
5
198
6
198
7
198
8
198
9
199
0
199
1
199
2
199
3
199
4
199
5
199
6
199
7
199
8
199
9
200
0
200
1
200
2
200
3
200
4
200
5
200
6
200
7
200
8
200
9
201
0
201
1
Po
pu
lati
on
(N
um
be
r)
Year
Estimated Number of Emigrants from Hong Kong 1980 - 2011
Total: 825,600
Source: Yearbook, Information Services Department (1981 - 2012)

Immigration and Integration (Cont’d)
Foreign Domestic Helpers (FDHs)
Secure more supply
Maximise the potential of skilled FDHs enabling them to provide care to
needy elderly after recognised training
16
Primary and
below:
21,589
(16.7%)
Secondary/
Sixth Form:
99,432
(76.8%)
Post-
secondary:
8,451
(6.5%)
Female Indonesian FDHs by Educational Attainment 2011
Primary and
below:
3,669
(3.2%)
Secondary/
Sixth Form:
80,563
(69.7%)
Post-
secondary:
31,412
(27.2%)
Female Filipino FDHs by Educational Attainment 2011
Source: 2011 Population Census, C&SD

Organic Growth
Hong Kong is part of the developed-world trend where people simply
decide to have less children
17
3.29
1.03
0.5
1
1.5
2
2.5
3
3.5
1970-1975 1975-1980 1980-1985 1985-1990 1990-1995 1995-2000 2000-2005 2005-2010
To
tal F
ert
ilit
y
Year
Trends in Total Fertility in Selected Places in the Developed World
United StatesFranceAustraliaSwedenUnited KingdomCanadaItalyGermanyJapanSingaporeHong Kong
Source: World Population Prospects: The 2012 Revision, the United Nations (2012)
0

Organic Growth (Cont’d)
18
Encourage women to
stay at home and
have babies (i.e.
increase fertility rate)
Encourage women to
go to work (i.e.
increase labour force
participation rate)
Money and advanced planning for large-scale and high quality childcare services?

Organic Growth (Cont’d)
Cost of raising a child
UK – approx HK$2 Mn (0 -18 years)
Singapore – approx HK$3 Mn (0 - end of first degree)
Hong Kong middle class – approx HK$5 Mn (0 - end of first
degree)
Direct interventions proven NOT effective
An example is to provide incentives for educated couples to
have larger families
19Sources:
The Cost of a Child 2013, Child Poverty Action Group, UK (2013)
The $900,000 Singapore child, The Straits Times, 15 February 2013

Organic Growth (Cont’d)
20
1.621.62
1.96 (Year of Dragon in 1988)
1.60
(Year of Dragon in 2000)1.26
1.29(Year of Dragon in 2012)
0
0.5
1
1.5
2
2.5
1980
1981
1982
1983
1984
1985
1986
1987
1988
1989
1990
1991
1992
1993
1994
1995
1996
1997
1998
1999
2000
2001
2002
2003
2004
2005
2006
2007
2008
2009
2010
2011
2012
Ra
te
Year
2004:
5-day work
week and
childcare
leave
introduced
Total Fertility Rate in Singapore (1980 - 2012)
1984:
Policies
introduced to
raise birth rates
among target
groups such as
giving priority in
primary school
registration to the
kids of graduate
mothers
1987:
“Have Three or
More if You Can
Afford It”
campaign started
2000:
Baby Bonus
scheme
started
2012:
Government
launched
public
consultation
drive for a
sustainable
population
strategy
Source: Singapore’s population journey, The Straits Times, 6 October 2012
Organic Growth (Cont’d)
21
Our education system needs to be flexible enough
To adapt to labour needs
To produce individuals who are mentally ready to be flexible
and adaptable
No more single career tracks
Expect multiple careers or trades within a lifetime

GPRD Integration
Plan well beyond our boundary
Outsource more elderly care and healthcare services to north of the
boundary
Provide more initiatives such as
Portable welfare benefits and subsidy, healthcare vouchers, old age
allowance, old age living allowance
People will move north naturally
When they see no difference in services provided there
22

Planning for the Elderly
Elderly poverty will be a big problem and burden
One in three of our elderly now living below the poverty line
Retain the current and future senior citizens in the workforce
Despite better educated, their labour force participation rate (LFPR) is relatively
low
Provide incentives (e.g. tax reduction or exemption) to encourage working
23

Planning for the Elderly (Cont’d)
24
0.0%
5.0%
10.0%
15.0%
20.0%
7.1%
12.0% 12.5%
19.9% 19.9%18.5%
Rate
Place
LFPRs for Persons Aged 65 and above 2012
0%
20%
40%
60%
80%
100%
65-69 70-74 75-79 80-84 85+
14% 22%36%
48%57%
39%
39%
39%
35%29%36%
27%
18%13% 11%
11% 12% 7% 4% 3%
Pro
po
rtio
n
Age Group
Older Persons by Age Group and
Educational Attainment 2011
Secondary /
sixth form
Primary
No
schooling/
pre-primary
Post-
secondary
Source: 2011 Population Census, C&SDSource: Labour Force Statistics by Age, OECD (2014)
Financial Planning
There is no such thing as a free population policy, but
how can we finance it?
It will cost the Government a lot of money
Now is the time to plan for it – make a 15-year
financial plan
25

What We Shouldn’t Do?
Have a knee-jerk reaction to tackle short-term
problems
Only provide direct financial incentives to encourage
fertility
Cap the population
Plan only within the boundary of Hong Kong
26

Useful Indicators to Consider
Government expenditure to revenue ratio
Immigrants from non-Mainland and non-OECD
territories
Healthcare manpower to population ratio
Number of elderly care home places
Housing targets for a longer term
27

But Most Importantly…
Demographic challenges call for concerted efforts
Population study goes beyond numbers
We cannot plan for the future if we do not have a
vision
There needs to be an economic and social vision
of Hong Kong many decades from now
28

Bauhinia Foundation Research Centre
Q&A
29