Hong Kong Q4 Mobile Statistics and Trends
38
HONG KONG MOBILE ADVERTISING STATISTICS & TRENDS 2015 Quarter 4
-
Upload
oliver-lau-pmp -
Category
Mobile
-
view
406 -
download
1
Transcript of Hong Kong Q4 Mobile Statistics and Trends
HONG KONG MOBILE ADVERTISING
STATISTICS & TRENDS
2015 Quarter 4
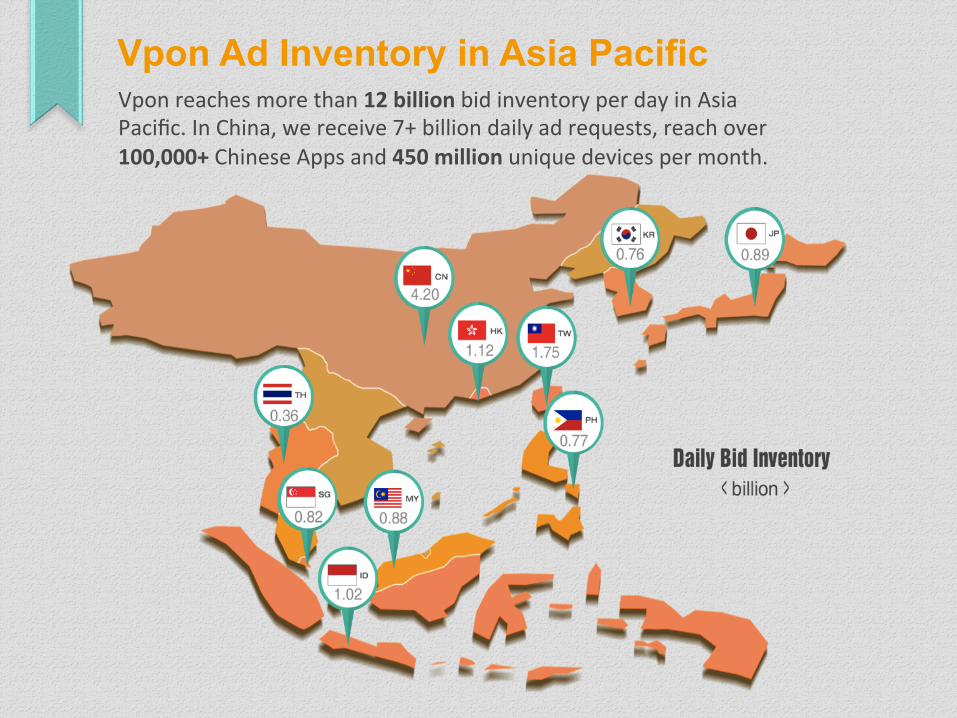
Vpon Ad Inventory in Asia Pacific Vpon reaches more than 12 billion bid inventory per day in Asia Pacific. In China, we receive 7+ billion daily ad requests, reach over 100,000+ Chinese Apps and 450 million unique devices per month.
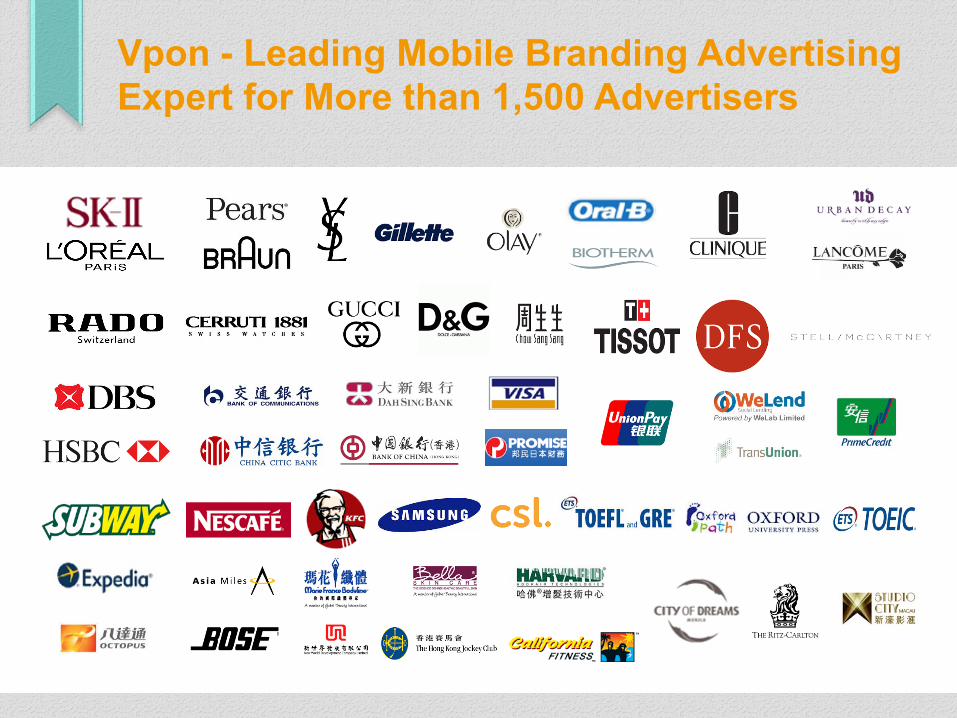
Vpon - Leading Mobile Branding Advertising Expert for More than 1,500 Advertisers
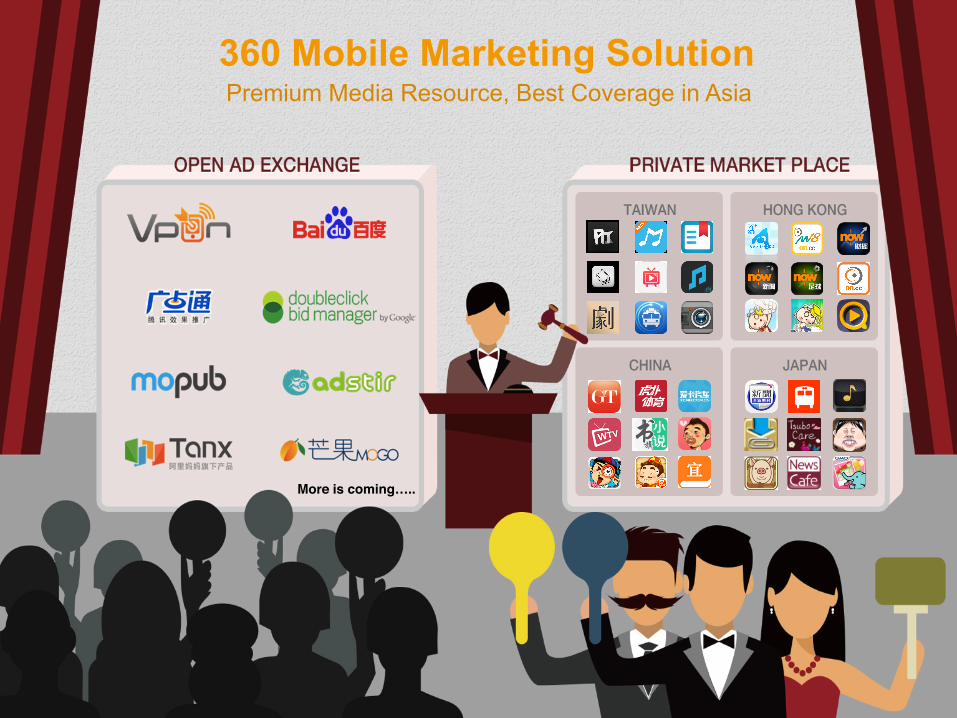
360 Mobile Marketing Solution Premium Media Resource, Best Coverage in Asia
More is coming…..
• Tourism Goldmine of Chinese Outbound Travelers
Market StaGsGcs & Case Studies
• Hong Kong Mobile Market • Users Behavioral PaNern
Contents

82.2M Outbound Chinese Travelers When everyone is concerning the GDP growth in China, does it means that
Chinese Travelers’ spending is decreasing?
For Chinese travelers who can afford overseas travel, there is still an all-out shopping bonanza that travel brands can plan on growing exponentially over the next five years. By 2020, it’s predicted outbound Chinese business and leisure travelers will spend upwards of $422 billion per year, and that’s only counting their retail purchases.
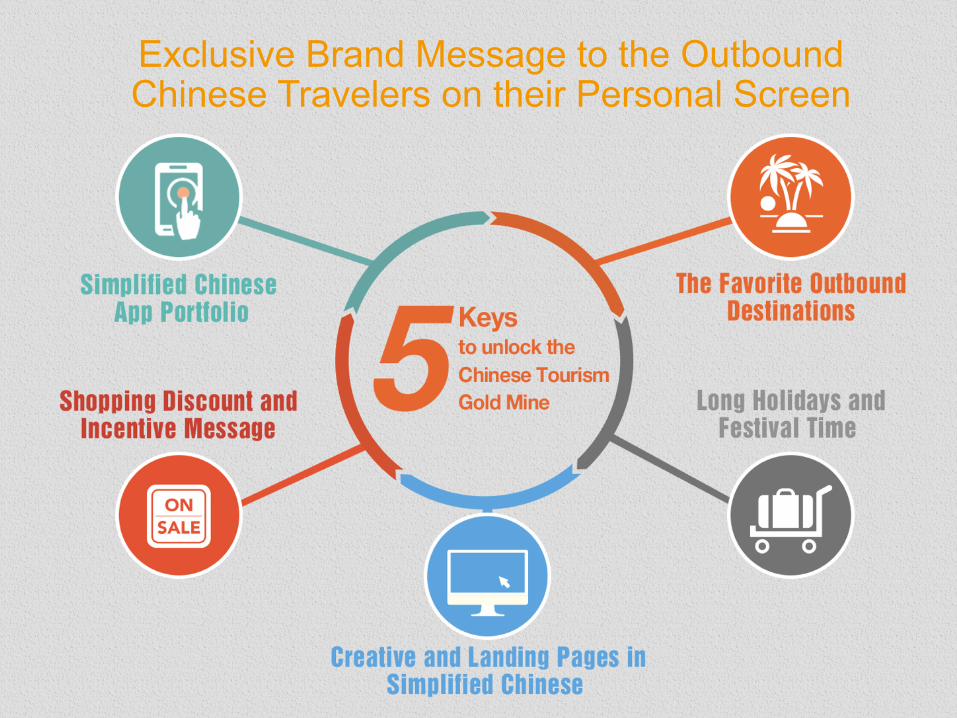
Exclusive Brand Message to the Outbound Chinese Travelers on their Personal Screen
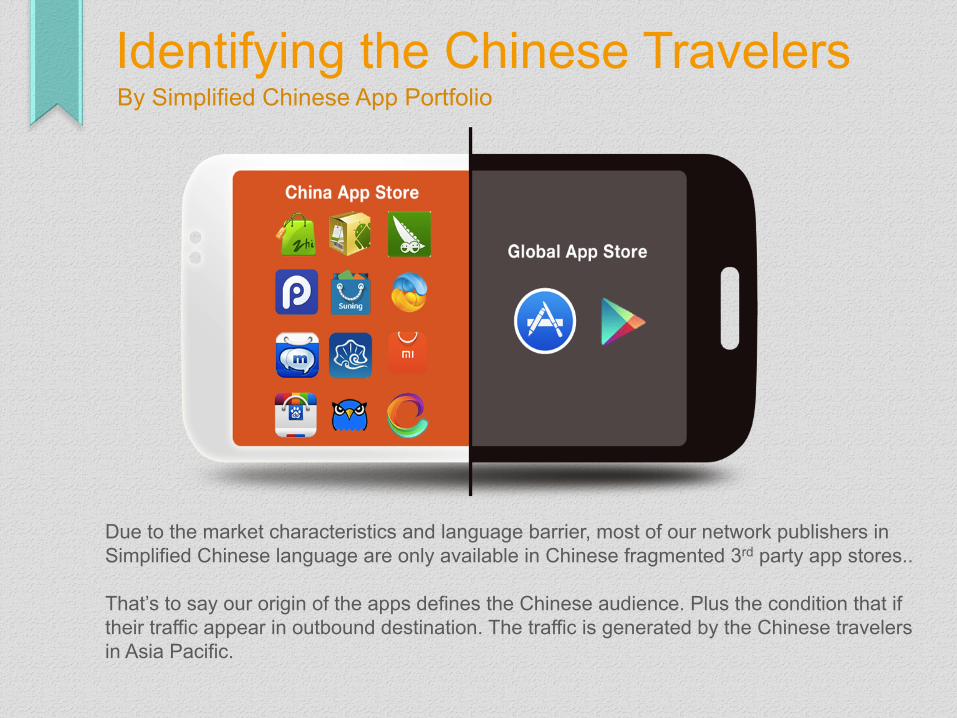
Due to the market characteristics and language barrier, most of our network publishers in Simplified Chinese language are only available in Chinese fragmented 3rd party app stores.. That’s to say our origin of the apps defines the Chinese audience. Plus the condition that if their traffic appear in outbound destination. The traffic is generated by the Chinese travelers in Asia Pacific.
Identifying the Chinese Travelers By Simplified Chinese App Portfolio
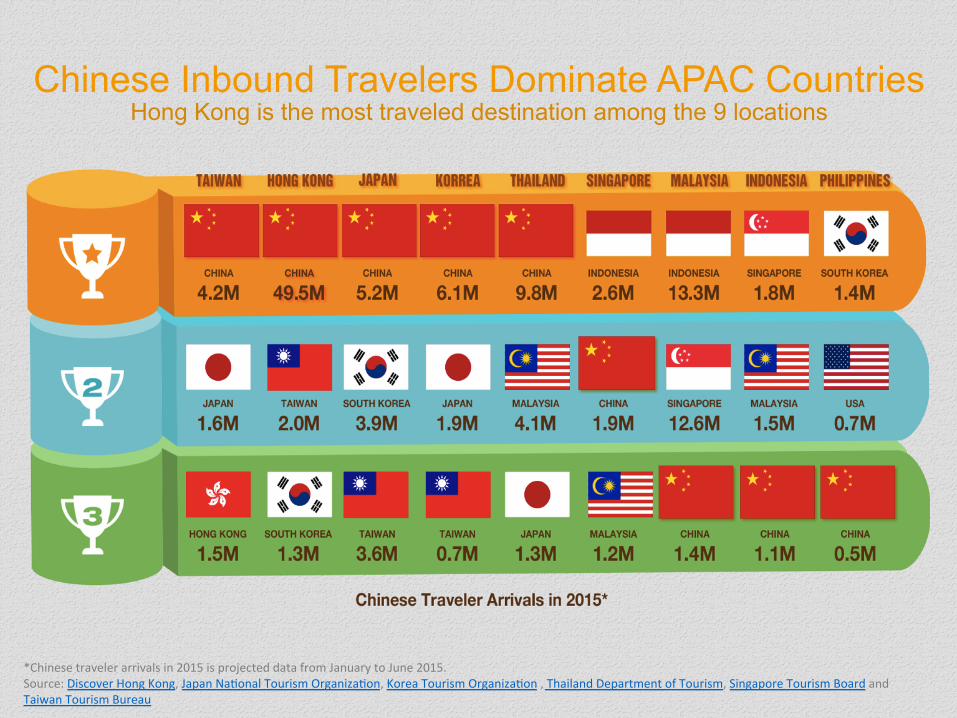
Chinese Inbound Travelers Dominate APAC Countries Hong Kong is the most traveled destination among the 9 locations
*Chinese traveler arrivals in 2015 is projected data from January to June 2015. Source: Discover Hong Kong, Japan NaGonal Tourism OrganizaGon, Korea Tourism OrganizaGon , Thailand Department of Tourism, Singapore Tourism Board and Taiwan Tourism Bureau
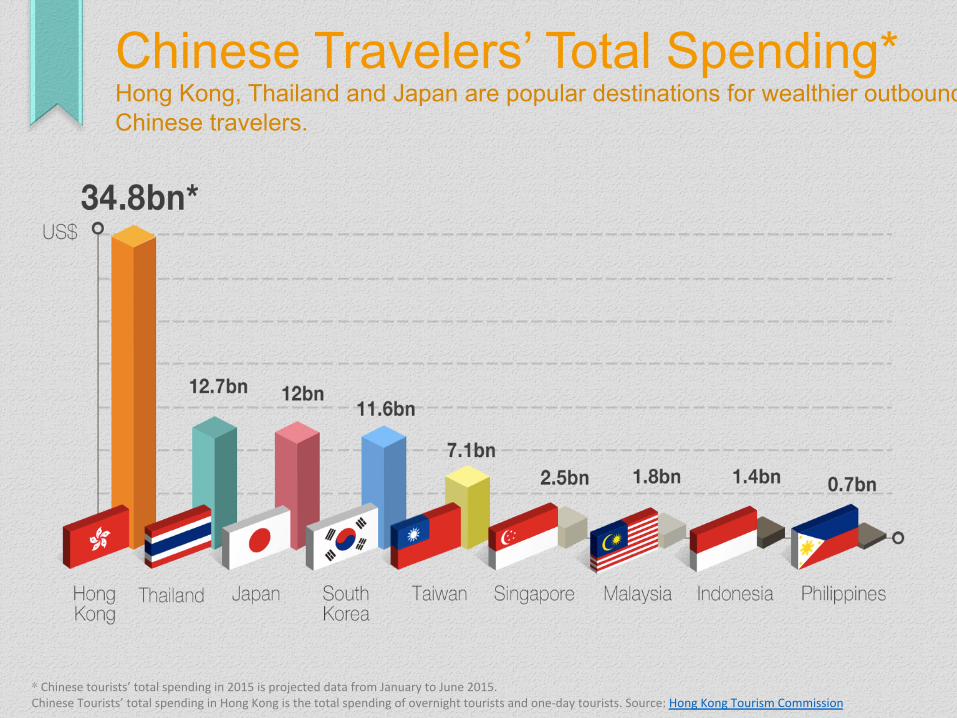
* Chinese tourists’ total spending in 2015 is projected data from January to June 2015. Chinese Tourists’ total spending in Hong Kong is the total spending of overnight tourists and one-‐day tourists. Source: Hong Kong Tourism Commission
Chinese Travelers’ Total Spending* Hong Kong, Thailand and Japan are popular destinations for wealthier outbound Chinese travelers.
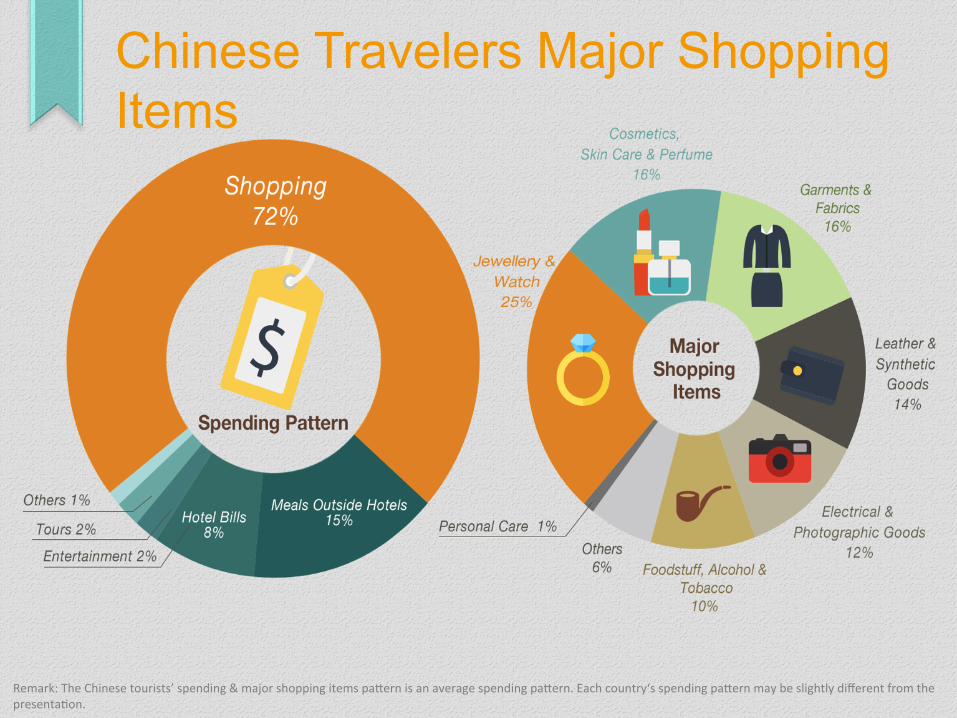
Remark: The Chinese tourists’ spending & major shopping items paNern is an average spending paNern. Each country‘s spending paNern may be slightly different from the presentaGon.
Chinese Travelers Major Shopping Items
The Overview of Chinese Travelers • Hong Kong • Macau • Asia Pacific
Understanding the Chinese Travelers
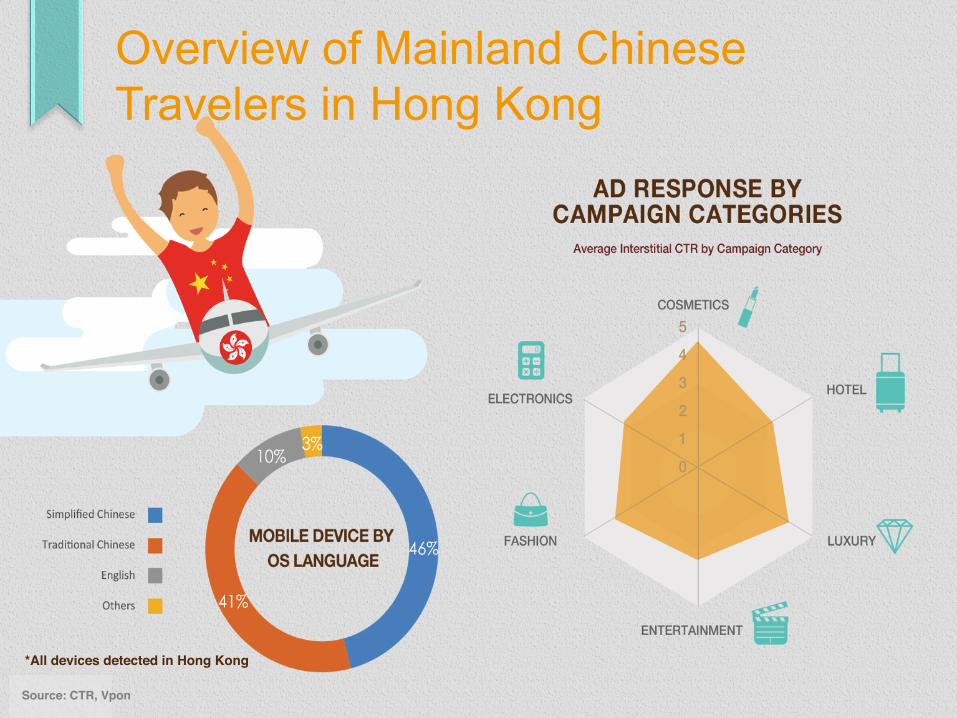
Overview of Mainland Chinese Travelers in Hong Kong
*All devices detected in Hong Kong
Source: CTR, Vpon
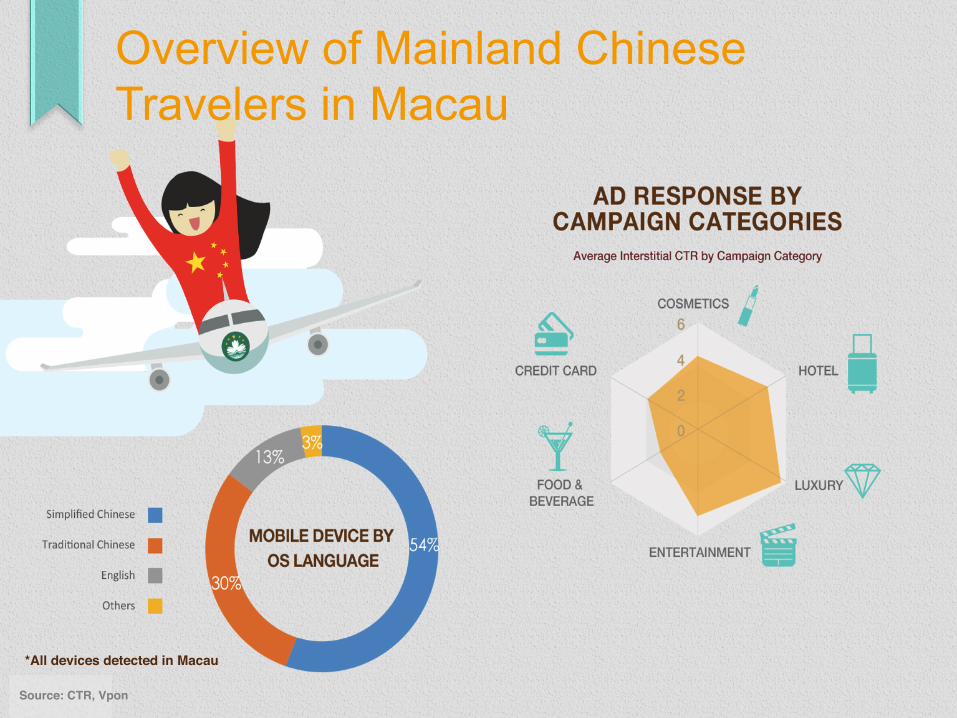
Overview of Mainland Chinese Travelers in Macau
*All devices detected in Macau
Source: CTR, Vpon
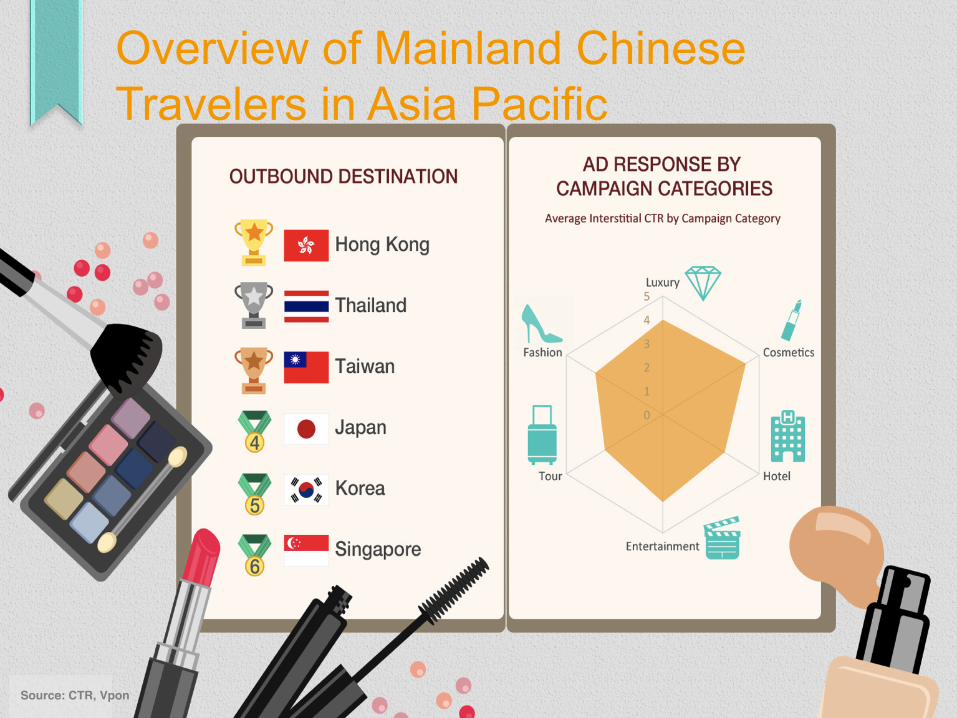
Overview of Mainland Chinese Travelers in Asia Pacific
Source: CTR, Vpon

Key Factors affecGng Campaign Performance • FesGve Season • Mobile OperaGng System (OS) • CreaGve Language • Travel DesGnaGon Preference
Understanding the Chinese Travelers
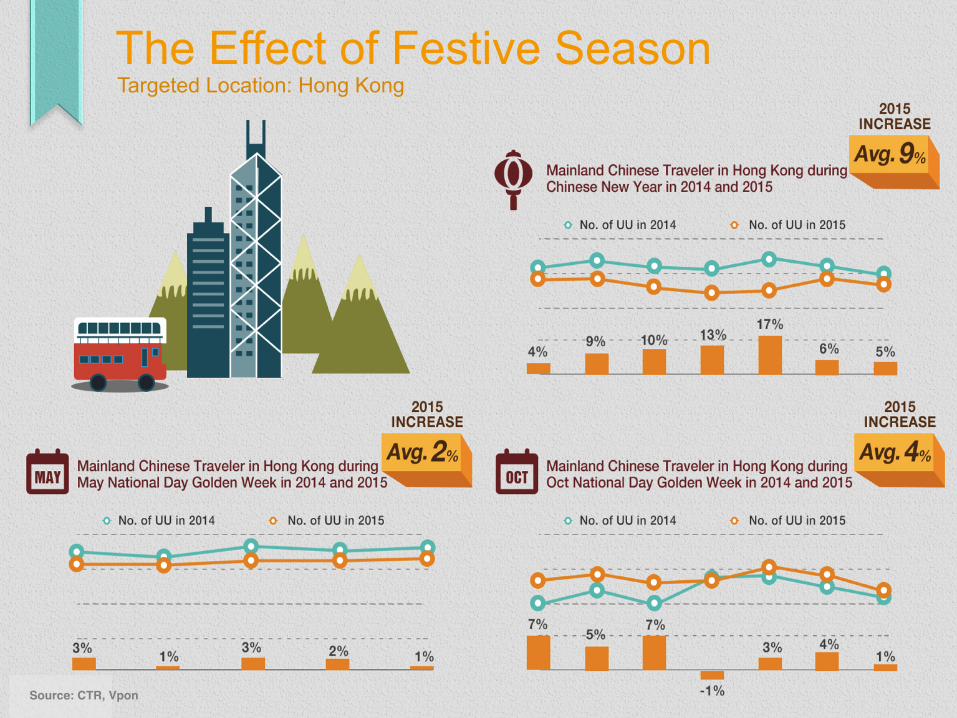
The Effect of Festive Season Targeted Location: Hong Kong
Source: CTR, Vpon
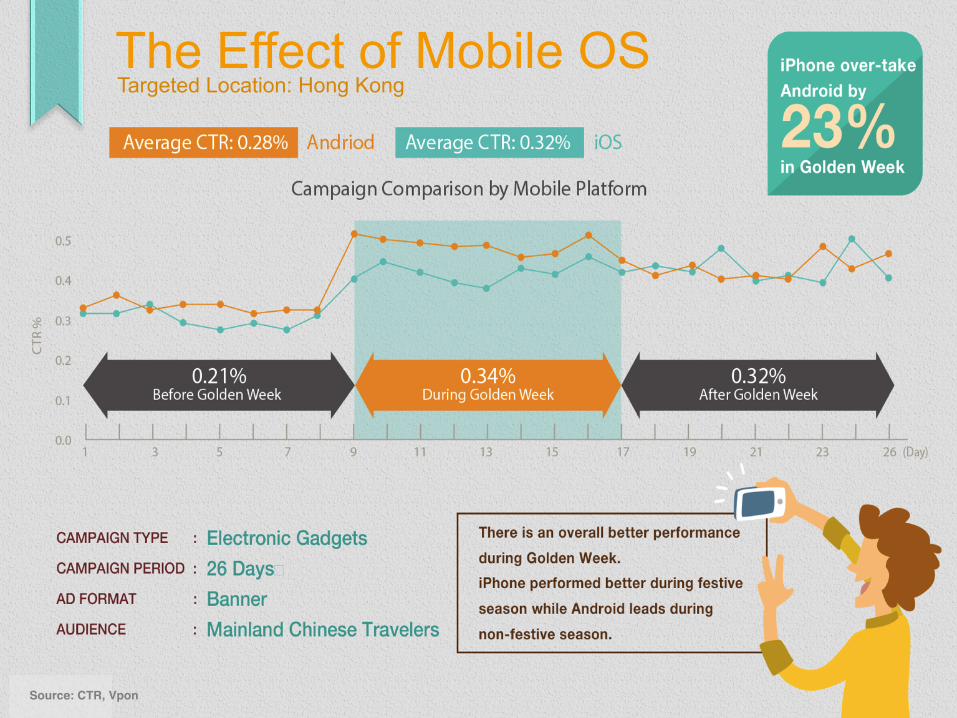
The Effect of Mobile OS Targeted Location: Hong Kong
Source: CTR, Vpon
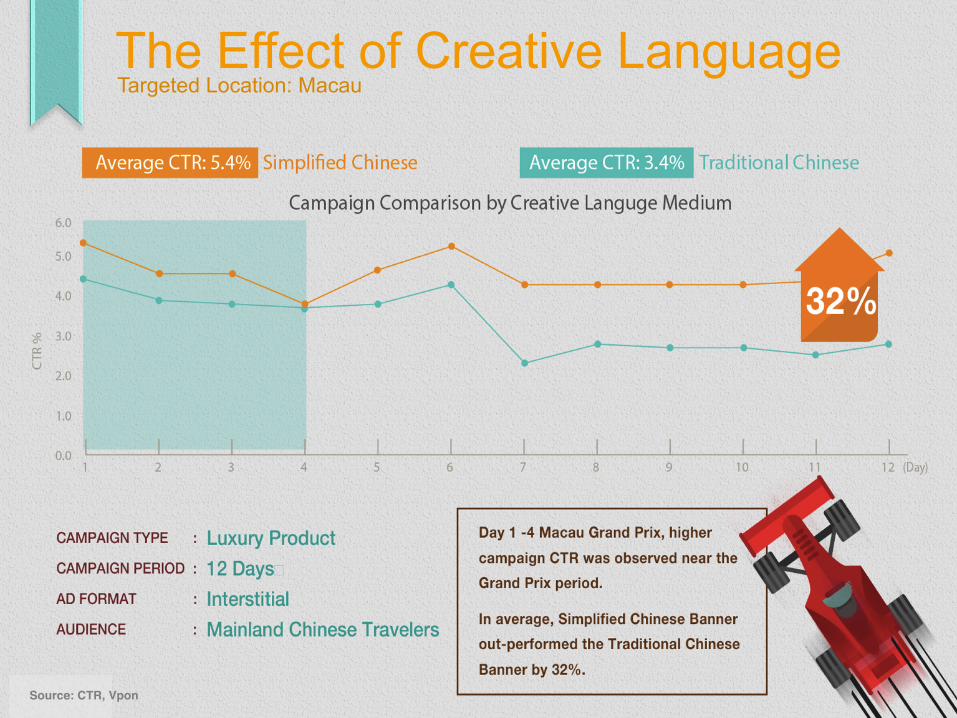
The Effect of Creative Language Targeted Location: Macau
Source: CTR, Vpon
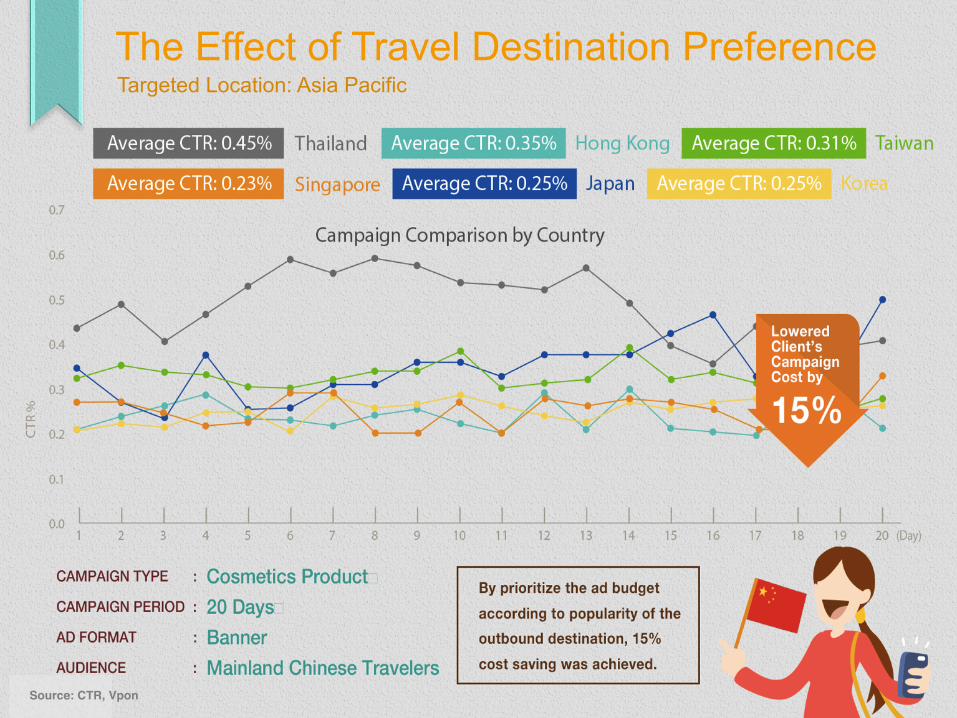
The Effect of Travel Destination Preference Targeted Location: Asia Pacific
Source: CTR, Vpon
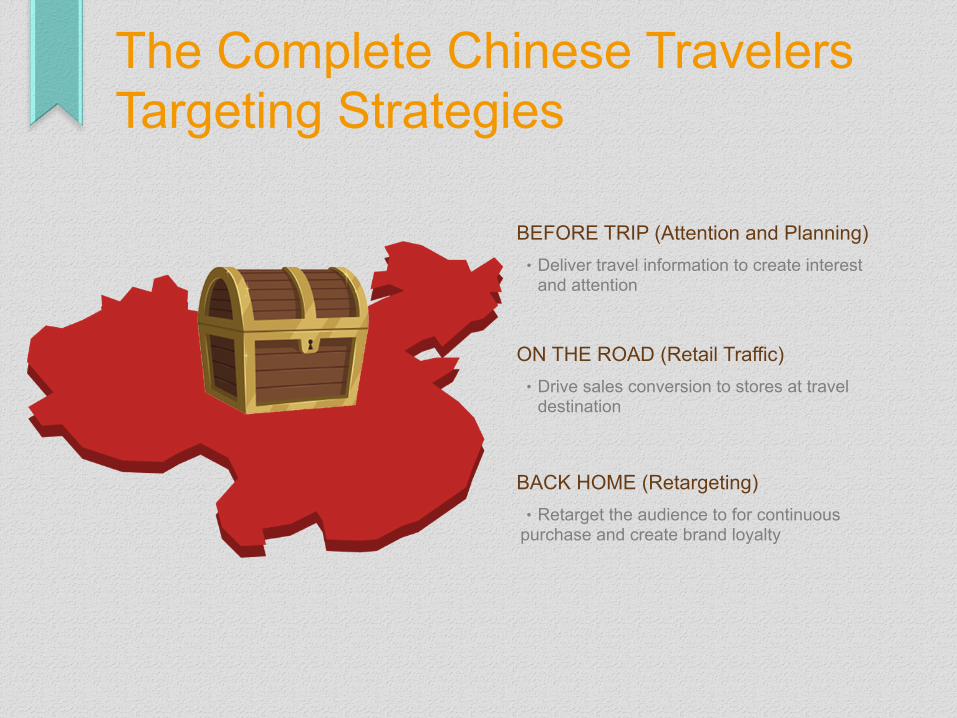
The Complete Chinese Travelers Targeting Strategies
BEFORE TRIP (Attention and Planning) ‧Deliver travel information to create interest and attention
ON THE ROAD (Retail Traffic) ‧Drive sales conversion to stores at travel destination
BACK HOME (Retargeting) ‧Retarget the audience to for continuous purchase and create brand loyalty

Hong Kong Mobile Market

Unique Users Reached: 7.3M+ Number of active unique mobile users reached by Vpon grows rapidly with more than 30% growth in 2015.
Source, UU Vpon
Source, UU Vpon
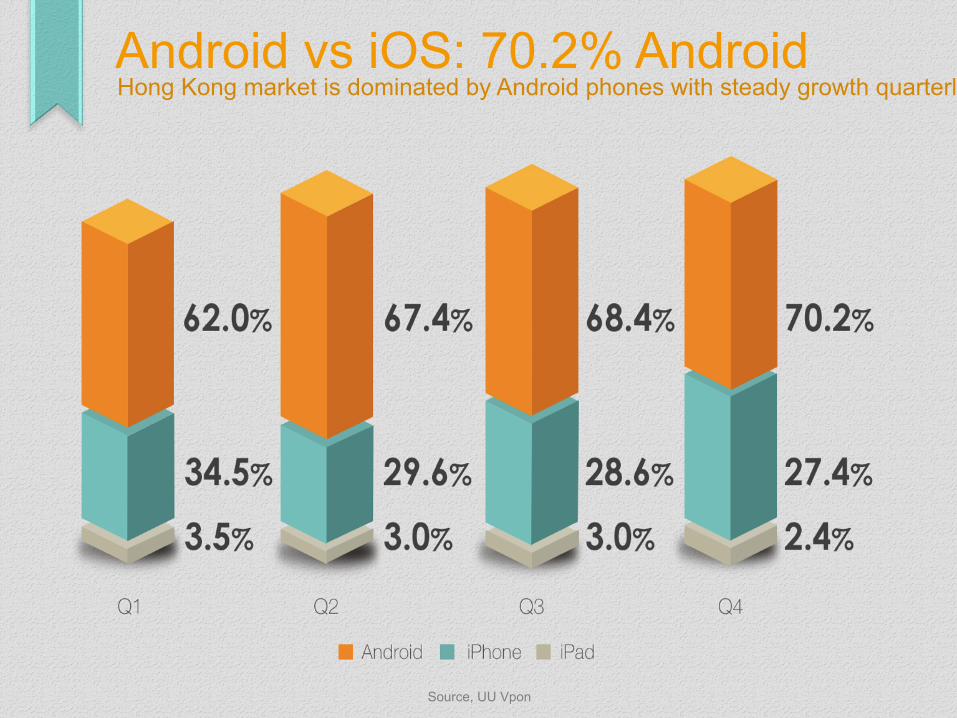
Android vs iOS: 70.2% Android Hong Kong market is dominated by Android phones with steady growth quarterly.

Source, UU Vpon
47.0% Phablet Phablet (screen size between 5.3” to 6.9”) dominates among Android users. More iOS users prefer phone screen size than phablet screen size.
Source, UU Vpon
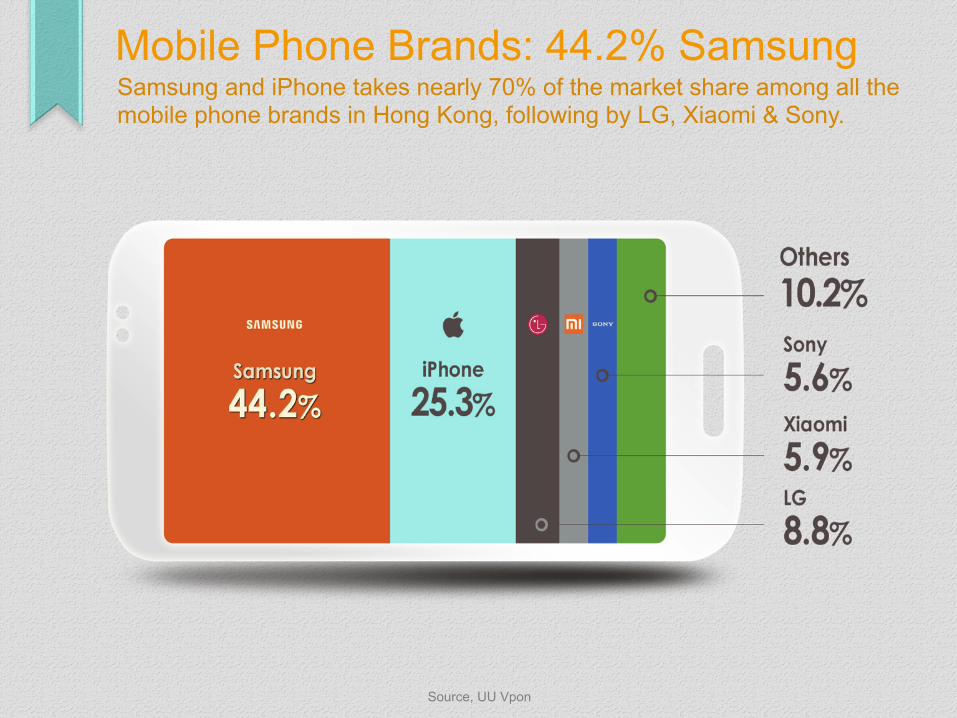
Mobile Phone Brands: 44.2% Samsung Samsung and iPhone takes nearly 70% of the market share among all the mobile phone brands in Hong Kong, following by LG, Xiaomi & Sony.
Source, UU Vpon
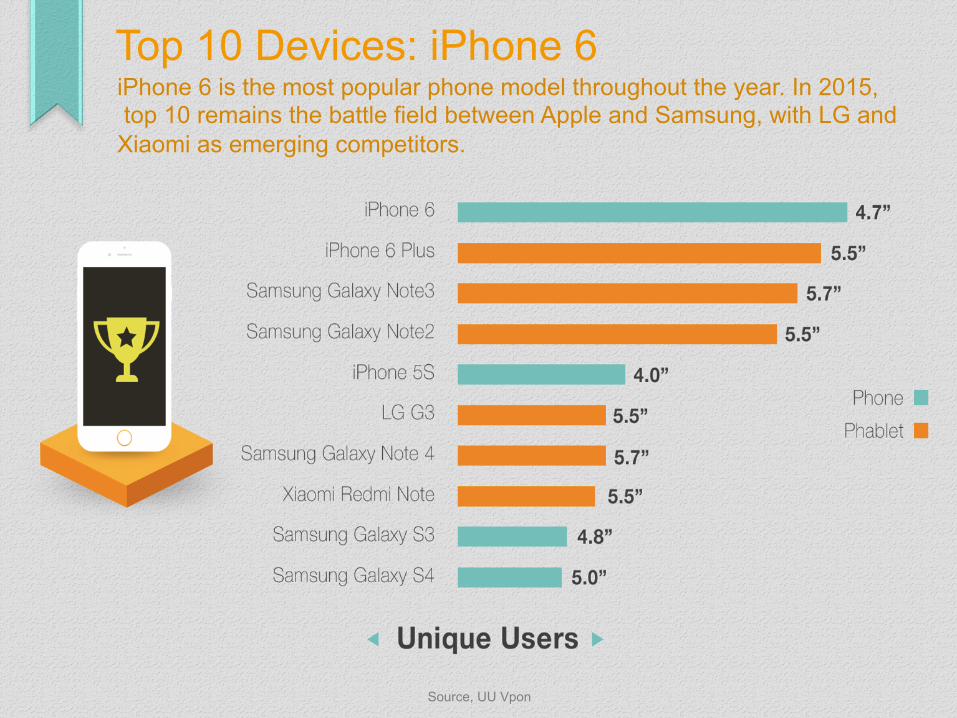
Top 10 Devices: iPhone 6 iPhone 6 is the most popular phone model throughout the year. In 2015, top 10 remains the battle field between Apple and Samsung, with LG and Xiaomi as emerging competitors.
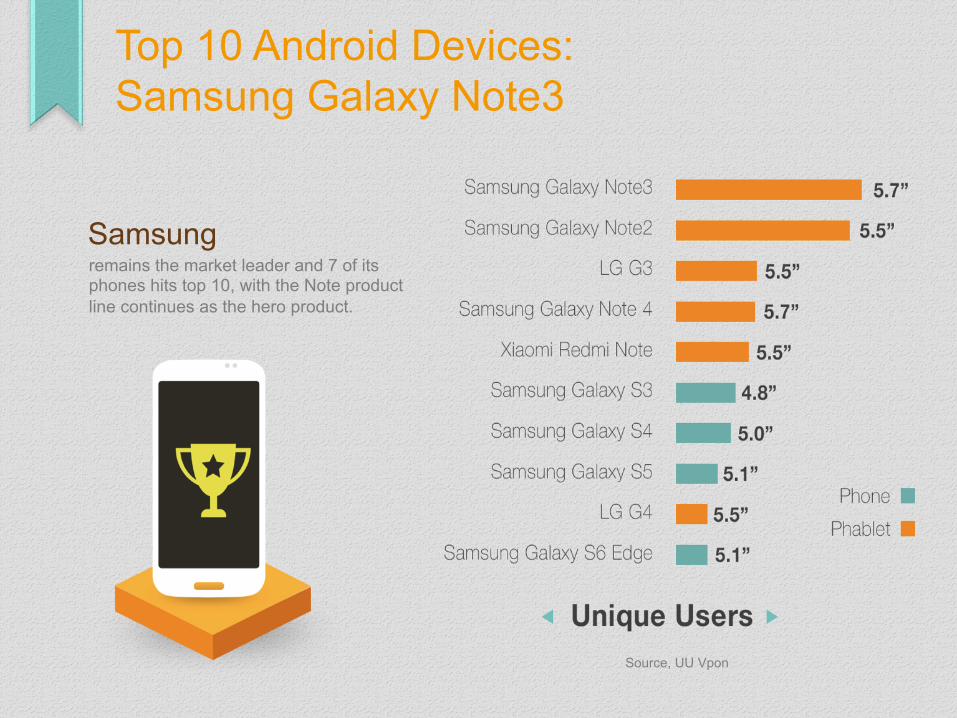
Top 10 Android Devices: Samsung Galaxy Note3
Samsung remains the market leader and 7 of its phones hits top 10, with the Note product line continues as the hero product.
Source, UU Vpon
Source, UU Vpon
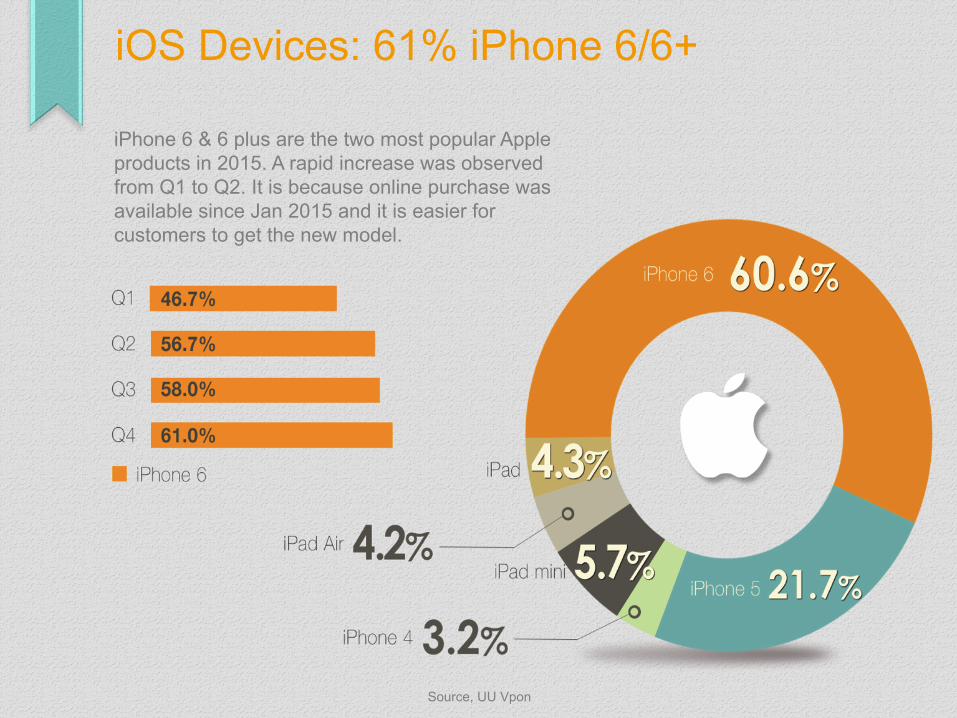
iOS Devices: 61% iPhone 6/6+
iPhone 6 & 6 plus are the two most popular Apple products in 2015. A rapid increase was observed from Q1 to Q2. It is because online purchase was available since Jan 2015 and it is easier for customers to get the new model.
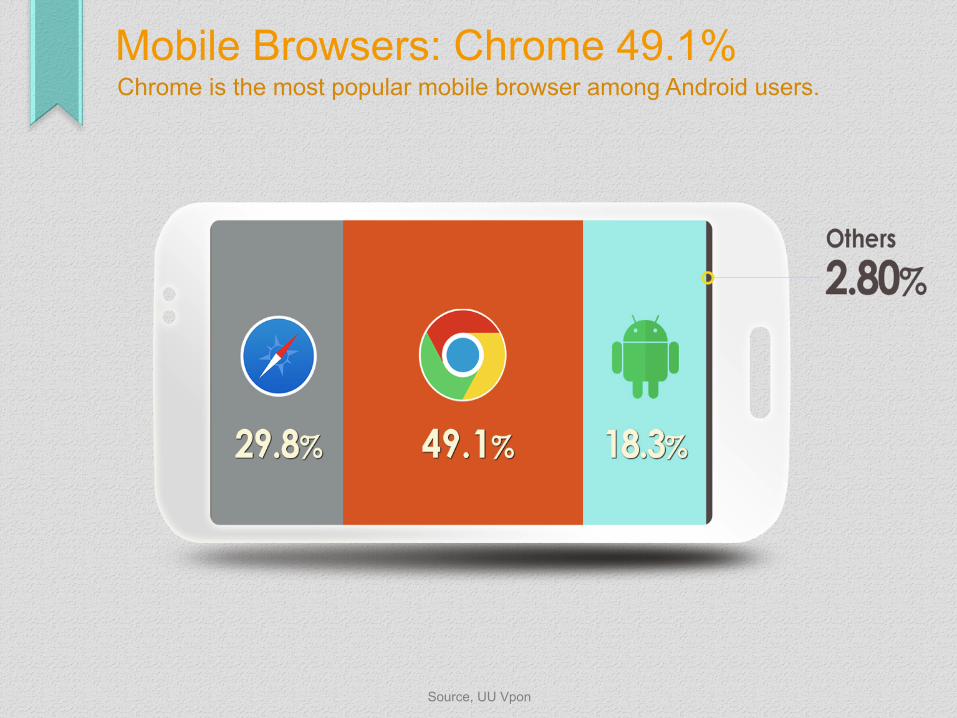
Mobile Browsers: Chrome 49.1% Chrome is the most popular mobile browser among Android users.
Source, UU Vpon
Source, UU Vpon
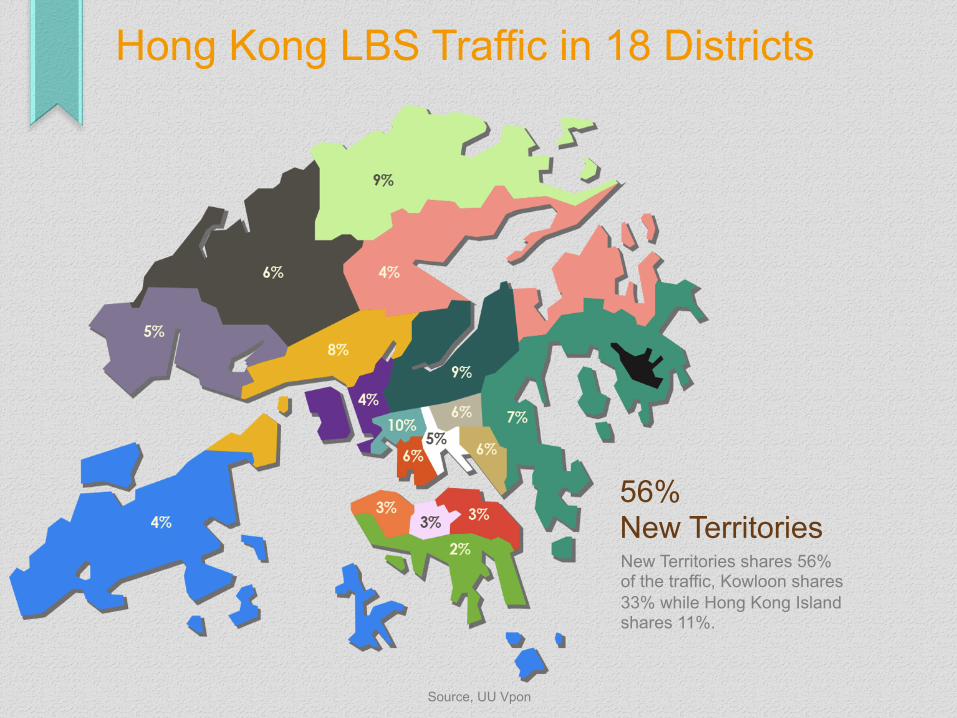
Hong Kong LBS Traffic in 18 Districts
56% New Territories New Territories shares 56% of the traffic, Kowloon shares 33% while Hong Kong Island shares 11%.
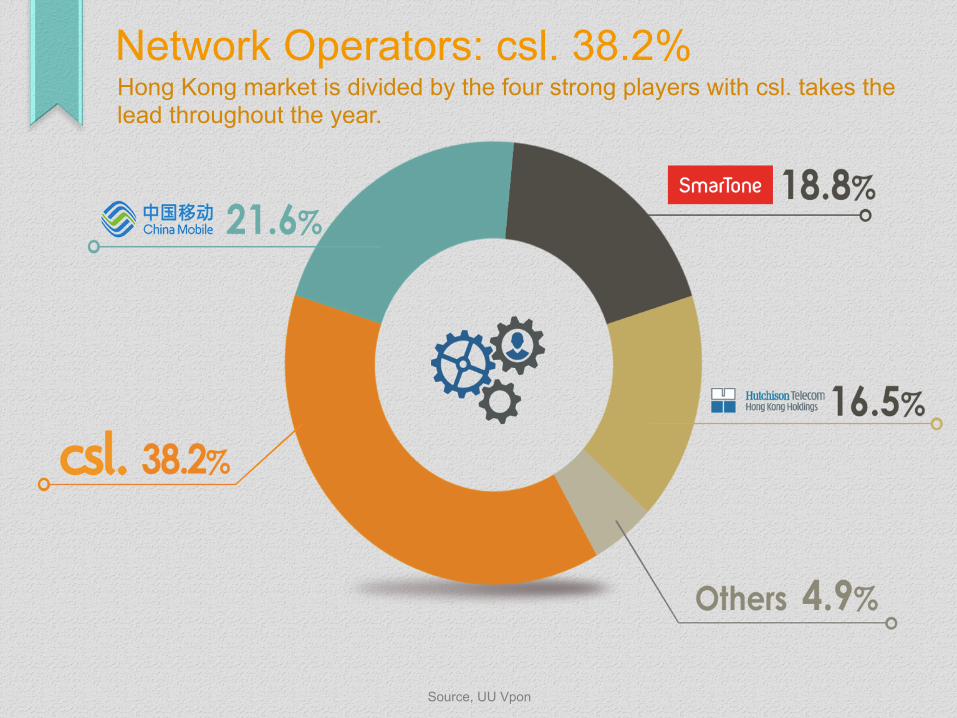
Network Operators: csl. 38.2% Hong Kong market is divided by the four strong players with csl. takes the lead throughout the year.
Source, UU Vpon

Users Behavioral Pattern

Mobile Internet Access
In general, users slightly prefer using WiFi than cellular, especially for Video and Education related apps. Cellular are used for Life apps.
Source, UU Vpon
Source, UU Vpon
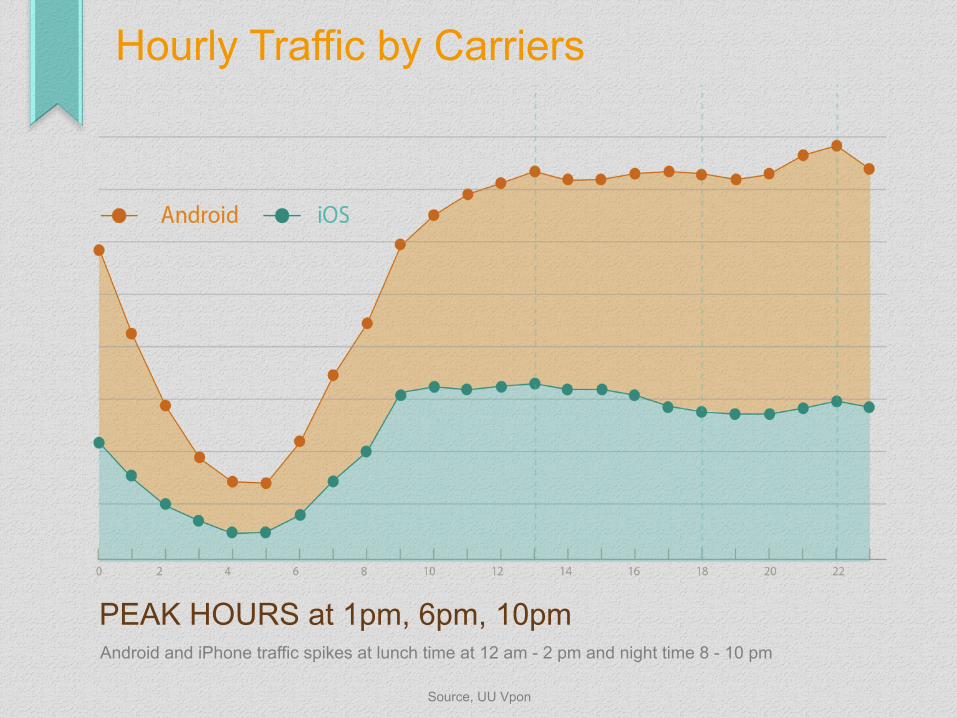
Hourly Traffic by Carriers
PEAK HOURS at 1pm, 6pm, 10pm Android and iPhone traffic spikes at lunch time at 12 am - 2 pm and night time 8 - 10 pm
Source, UU Vpon
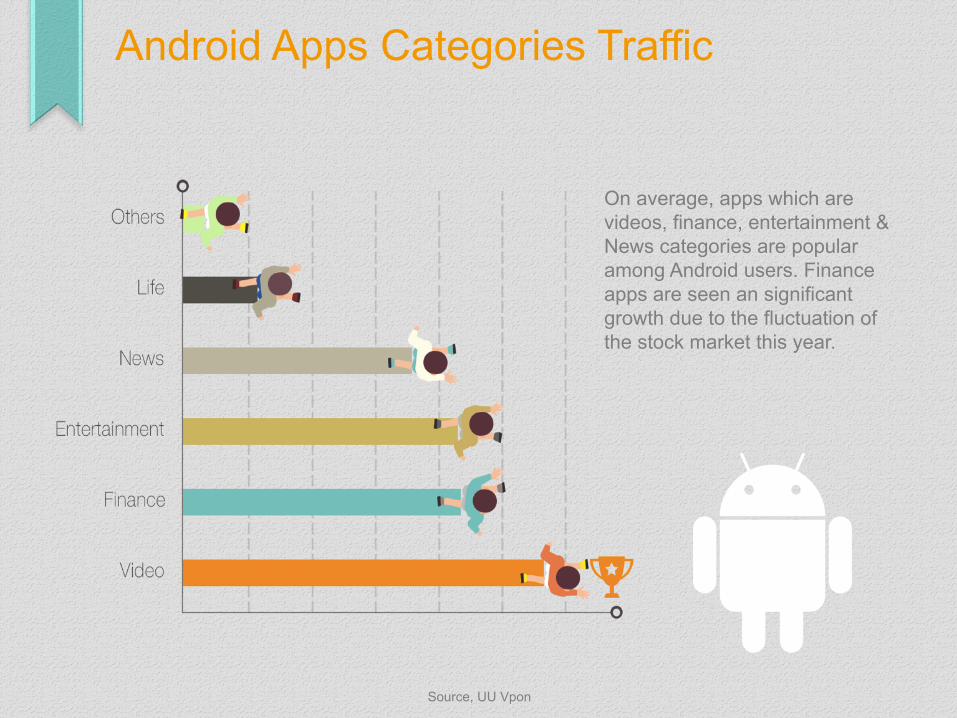
Android Apps Categories Traffic
On average, apps which are videos, finance, entertainment & News categories are popular among Android users. Finance apps are seen an significant growth due to the fluctuation of the stock market this year.
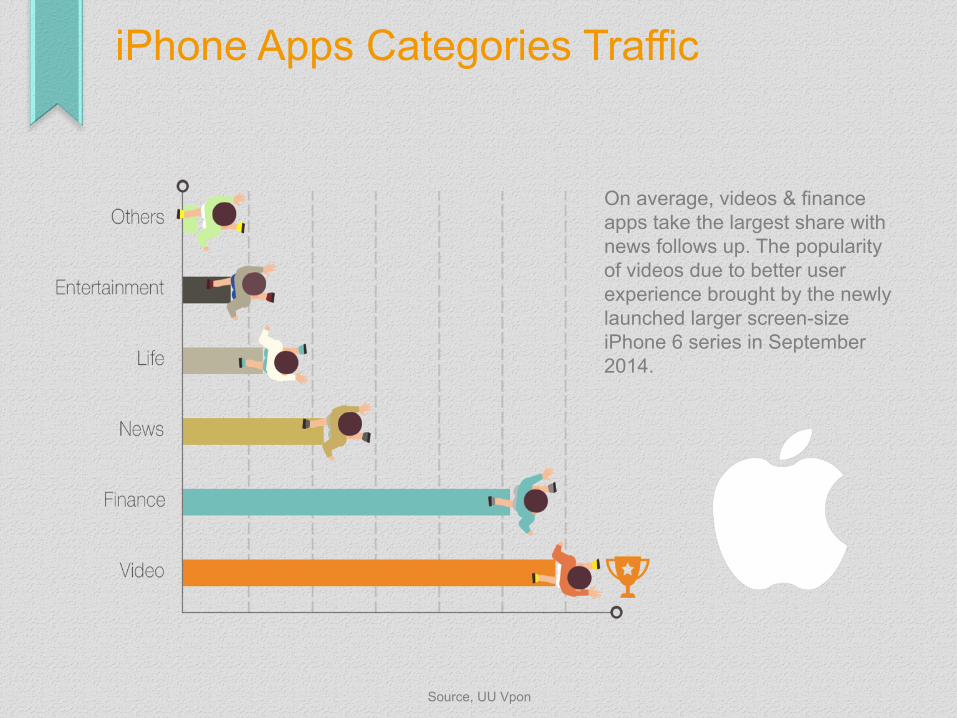
iPhone Apps Categories Traffic
On average, videos & finance apps take the largest share with news follows up. The popularity of videos due to better user experience brought by the newly launched larger screen-size iPhone 6 series in September 2014.
Source, UU Vpon

For publishers:[email protected] For advertisers:[email protected] Call us at 27487376 for more informaGon
www.vpon.com