Hong Kong Poverty Situation Report 2016 (November 2017) · Hong Kong Poverty Situation Report 2016...
246
Transcript of Hong Kong Poverty Situation Report 2016 (November 2017) · Hong Kong Poverty Situation Report 2016...


Hong Kong Poverty Situation Report 2016 Table of Contents
i
Table of Contents
Page
Table of Contents i
List of Figures iii
List of Tables vi
Executive Summary viii
Chapter 1: Introduction 1
1.I Guiding Principles of the Government in Regard to
Poverty Alleviation 1
1.II The “Poverty Line” and the Poverty Situation Report 1
1.III Key Poverty Alleviation Efforts after Setting the
Poverty Line
2
1.IV Commitment to Poverty Alleviation 6
1.V Related Studies under the Poverty Line Framework 6
1.VI Structure of Poverty Situation Report 7
Chapter 2: Poverty Situation and Its Trend from 2009 to 2016 9
2.I Major Factors Affecting Poverty Statistics 9
2.II Household Income Distribution 14
2.III The Poverty Line 17
2.IV Poverty Situation and Policy Effectiveness in Poverty
Alleviation
18
2.V Poverty Statistics by Age Group and Gender 27
2.VI Poverty Statistics by Age of Household Head 30
2.VII Key Observations 52
Box 2.1 Poverty Situation after Taking into Account Non-
Recurrent Cash Benefits
34
Box 2.2 Poverty Situation after Taking into Account In-kind
Benefits
36
Box 2.3 Poverty Situation of the Elderly 40
Box 2.4 Decomposition of Changes in the Poverty Rate, 2009-
2016
45
Chapter 3: Further Analysis of the 2016 Poverty Situation 56
3.I Poverty Situation by Selected Household Group 57
3.II Analysis of Causes of Poverty by Characteristic of
Selected Household Groups
70
3.III Poverty Situation by District 77
3.IV Key Observations 83
3.V A Synopsis of Poverty Situation after Recurrent Cash
Intervention by Selected Household Group
90
3.VI A Synopsis of Poverty Situation after Recurrent Cash
Intervention by District Council District
106
Hong Kong Poverty Situation Report 2016 Table of Contents
ii
Page
Box 3.1 Poverty Situation of Single-Parent and New-Arrival
Households
62
Box 3.2 Poverty Situation of Non-CSSA Working Households 73
Box 3.3 The Situation of “At-risk-of-poverty” Households 86
Chapter 4: Policy Implications 124
Appendices
1 Poverty Line and Its Analytical Framework 127
2 Quantitative Indicators of the Poverty Line 134
3 Policy Intervention - Coverage, Estimation and Limitations 135
4 In-kind Transfer from Provision of Public Rental Housing -
Estimation and Limitations
140
5 Statistical Appendix 143
Glossary 210
Abbreviations 216
References 217
Hong Kong Poverty Situation Report 2016 List of Figures
iii
List of Figures
Page
Figure 2.1 Labour market situation: unemployment rate, wages and
average employment earnings
10
Figure 2.2 Elderly population and number of economically inactive
households, 2009-2016
11
Figure 2.3 Average household size of overall households and
the share of small households, 2009-2016
12
Figure 2.4 Recurrent government expenditure on social welfare,
2009/10-2017/18
13
Figure 2.5 Key statistics of household income before policy intervention,
2009-2016
15
Figure 2.6 Pre-intervention household income distribution by whether
receiving recurrent cash benefits, 2016
16
Figure 2.7 Pre- and post-intervention household income distribution,
2016
17
Figure 2.8 Poverty lines by household size, 2009-2016 18
Figure 2.9 Poor population and poverty rate, 2009-2016 19
Figure 2.10 Effectiveness of recurrent cash benefits in poverty alleviation,
2009-2016
20
Figure 2.11 Poverty gaps, 2009-2016 21
Figure 2.12 Poor population and poverty rate by economic characteristic of
households, 2009-2016
22
Figure 2.13 Annual total poverty gap by economic characteristic of
households, 2009-2016
24
Figure 2.14 Effectiveness of selected recurrent cash benefits in poverty
alleviation, 2016
25
Figure 2.15 Effectiveness of selected recurrent cash benefits in poverty
alleviation on children, 2016
26
Figure 2.16 Poor population and poverty rate by age, 2009-2016 28
Figure 2.17 Poor population and poverty rate by gender, 2009-2016 30
Figure 2.18 Poor population and poverty rate by age of household head,
2009-2016
33
Figure 2.19 Poor population and poverty rate after taking into account
non-recurrent cash benefits , 2009-2016
34
Figure 2.20 Effectiveness of non-recurrent cash benefits in poverty
alleviation, 2009-2016
35
Figure 2.21 Poor population and poverty rate after taking into account in-
kind benefits, 2009-2016
37
Figure 2.22 Effectiveness of in-kind benefits in poverty alleviation, 2009-
2016
37
Figure 2.23 Comparison of effectiveness in poverty alleviation of PRH
provision and selected recurrent cash benefits, 2016
38
Figure 2.24 Estimated average transfer per household by policy category,
2009-2016
39
Hong Kong Poverty Situation Report 2016 List of Figures
iv
Page
Figure 2.25 Poor elders by whether receiving CSSA and economic activity
status, 2016
40
Figure 2.26 Elders by social security coverage, 2016 41
Figure 2.27 Poor elders living in non-CSSA households by social security
coverage and housing type, 2016
42
Figure 2.28 Poor population and poverty rate of elders by economic
activity status, 2009-2016
43
Figure 2.29 Comparison of effectiveness of selected recurrent cash benefits
and PRH provision in poverty alleviation on elders, 2016
44
Figure 2.30 Actual and projected share of elderly population in total
population
51
Figure 3.1 Selected household groups by socio-economic and housing
characteristic and age of household head under the analytical
framework
56
Figure 3.2 Poverty rate and poor population by selected socio-economic
group, 2016
57
Figure 3.3 Poor population and poverty rate of single-parent households,
2009-2016
62
Figure 3.4 Poor population and poverty rate of new-arrival households,
2009-2016
63
Figure 3.5 Selected socio-economic characteristics of single-parent and
new-arrival poor households, 2016
64
Figure 3.6 Poverty rate and poor population by housing type, 2016 66
Figure 3.7 Selected socio-economic characteristics of poor households by
housing type, 2016
67
Figure 3.8 Poverty rate and poor population by age of household head,
2016
69
Figure 3.9 The higher the proportion of full-time workers, the lower the
poverty rate
71
Figure 3.10 Household groups with higher proportion of higher-skilled
workers among employed persons had lower poverty rate
72
Figure 3.11 Proportion of dependants and economically inactive members
in poor households, 2016
72
Figure 3.12 Year-on-year change in the number of non-CSSA working
poor households by selected socio-economic characteristic,
2016
74
Figure 3.13 Selected socio-economic characteristics of poor households,
2016
75
Figure 3.14 Poverty rate and poor population by District Council district,
2016
78
Figure 3.15 Poverty map by District Council district, 2016 79
Figure 3.16 Proportion of full-time working population and poverty rate
by District Council district, 2016
80
Figure 3.17 Proportion of higher-skilled workers and poverty rate by
District Council district, 2016
81
Hong Kong Poverty Situation Report 2016 List of Figures
v
Page
Figure 3.18 At-risk-of-poverty rate and poverty rate, 2009-2016 87
Figure A.1 Poverty lines by household size, 2009-2016 127
Figure A.2 Schematic representation of pre- and post-intervention
household income
129
Figure A.3 Schematic representation of the poverty line and its analytical
framework
131
Hong Kong Poverty Situation Report 2016 List of Tables
vi
List of Tables
Page
Table 2.1 Pre-intervention household income, 2009-2016 14
Table 2.2 Pre- and post-intervention poor households and population
and their annual changes by economic characteristic of
households, 2016
23
Table 2.3 Pre- and post-intervention poor population, poverty rates
and their annual changes by age, 2016
27
Table 2.4 Pre- and post-intervention poor population, poverty rates and
their annual changes by gender, 2016
29
Table 2.5 Pre- and post-intervention poor households, poor population
and their annual changes by age of household head, 2016
32
Table 2.6 Estimated transfer and standalone poverty alleviation impact
by selected policy item, 2016
39
Table 2.7 Decomposition of changes in the poverty rate, 2009-2016 46
Table 2.8 Decomposition of changes in the size of the poor population,
2009-2016
48
Table 2.9 Observed changes in the poor population and the age-
household size specific poverty rate effect after policy
intervention, 2009-2016
49
Table 2.10 Age-household size specific poverty rate effect before and
after policy intervention, 2009-2016
50
Table 3.1 CSSA poor households by selected socio-economic group,
2016
58
Table 3.2 Poverty indicators and their changes by selected household
group, 2016
61
Table 3.3 Poverty indicators and their changes by housing type, 2016 68
Table 3.4 Poverty indicators and their changes by age of household
head, 2016
70
Table 3.5 Effectiveness of LIFA in poverty alleviation for selected
household groups, 2016
73
Table 3.6 Poverty statistics of non-CSSA working households after
policy intervention, 2009-2016
74
Table 3.7 Different types of non-CSSA working households, 2016 76
Table 3.8 Selected socio-economic characteristics of districts with
higher-than-overall poverty rates, 2016
82
Table 3.9 Selected percentages of the median household income before
policy intervention by household size, 2016
86
Table 3.10 Number of at-risk-of-poverty households and population
therein before and after policy intervention, 2015-2016
87
Table 3.11 Comparison of households with incomes between 50% and
60% of the median and poor households in terms of selected
socio-economic characteristics before policy intervention,
2016
88
Hong Kong Poverty Situation Report 2016 List of Tables
vii
Page
Table A.1 Five selected key household characteristics for focused
analysis under the analytical framework
132
Table A.2 Quantitative indicators of the poverty line 134
Table A.3 Detailed coverage of policy measures recommended by CoP 137
Hong Kong Poverty Situation Report 2016
Executive Summary
viii
Executive Summary
Introduction
ES.1 The Government of the Hong Kong Special Administrative Region attaches
great importance to the poverty issue in Hong Kong. In September 2013, the
first-term Commission on Poverty (CoP) announced the first official poverty
line. The second-term CoP has followed the poverty line framework, and
continues to review the current framework’s application and explore
enhancement proposals and recommendations.
ES.2 Setting the poverty line helps the Government better understand the forms
and situations of poverty in Hong Kong for identifying needy groups.
Through the efficient use of public resources, and the efforts of CoP and the
Community Care Fund (CCF), the Government has introduced a series of
measures over the past few years to tackle poverty and support the
disadvantaged, covering a wide range of areas to benefit various needy
groups.
ES.3 Regarding recurrent cash benefits, the Old Age Living Allowance (OALA)
was fully implemented in 2013. Its poverty alleviation effect on elders was
very significant. To provide support for more elderly persons in need, the
asset limits for OALA have been relaxed since May 2017, and the proposed
Higher Old Age Living Allowance (HOALA) will also be implemented in
mid-2018. The Government has improved the Comprehensive Social
Security Assistance (CSSA) application arrangement for elderly persons as
well. Starting from February 2017, while preserving the requirement that
CSSA applicants must apply on a household basis, the Social Welfare
Department has abolished the arrangement for the relatives to make a
declaration on whether they provide financial support to the elderly persons
who apply for CSSA on their own (e.g. an elderly person who does not live
with his / her children) (the so-called “bad son statement”). In addition, the
Low-income Working Family Allowance (LIFA) Scheme was rolled out in
2016, which aims at relieving the financial burden of low-income working
families. The poverty alleviation effect of LIFA was first reflected in the
analysis of the post-intervention (recurrent cash) poverty statistics in 2016.
The Government is making preparation for implementing a series of
improvement measures in April 2018 so as to benefit more working
households.
ES.4 The CCF is an integral part of the Government’s poverty alleviation
blueprint, serving the functions of plugging gaps in the existing system and
Hong Kong Poverty Situation Report 2016
Executive Summary
ix
implementing pilot schemes. Since its establishment in 2011, 12
programmes have been incorporated into the Government’s regular
assistance programmes. The CCF Task Force under CoP will continue to
roll out more assistance programmes to meet the needs of different groups
and strengthen support for grassroots families.
ES.5 As in last year’s Poverty Situation Report, this Report continues to analyse
poverty statistics by socio-economic characteristic, type of housing and
district of households, and provide an analysis by age group of household
head as another perspective to illustrate the relationship between economic
growth and income poverty. A box article is still in place to decompose the
impact of changes in the population age structure and dwindling household
size on the poverty rate movements in recent years.
ES.6 It should be noted that, in this Report, the analysis on poverty statistics after
policy intervention has already taken into account the poverty alleviation
measures launched in or before 2016, such as the implementation of LIFA in
2016. As for the measures rolled out in 2017 and afterwards, their poverty
alleviation impacts will only be reflected in the poverty statistics for the
subsequent rounds.
Poverty Situation and Its Trend from 2009 to 2016
ES.7 Under the current poverty line framework, poverty statistics are affected by
various factors. Major factors include swings in economic cycles, changes
in demographic and household composition, and the Government’s poverty
alleviation efforts. These factors continued to impact on the poverty
statistics in 2016. On the back of moderate economic expansion and a
largely stable labour market, the grassroots enjoyed sustained income
growth. As such, the size of the poor population in working households fell
to a record low, and the poverty indicators of children showed further
improvements. Meanwhile, the increasing government expenditure on social
welfare helped narrow the poverty gap. The effectiveness of recurrent cash
benefits such as CSSA, OALA, etc. in poverty alleviation was significant.
ES.8 However, as more elders (aged 65 and above) retired with no employment
earnings (yet some may be “asset-rich, income-poor”), coupled with a broad-
based uplift of the poverty line thresholds alongside employment earnings
growth, the number of poor elders went up. The ongoing trend of population
ageing and increasing number of small families resulting from changes in
family structure have, to a certain extent, masked the positive effect of
steady economic development on poverty prevention and alleviation as well
as the effectiveness of the Government’s poverty alleviation measures. All
Hong Kong Poverty Situation Report 2016
Executive Summary
x
these in turn exerted further upward pressure on the overall poverty
indicators. This also highlights the limitations of poverty line-related
statistics, which must be interpreted with caution.
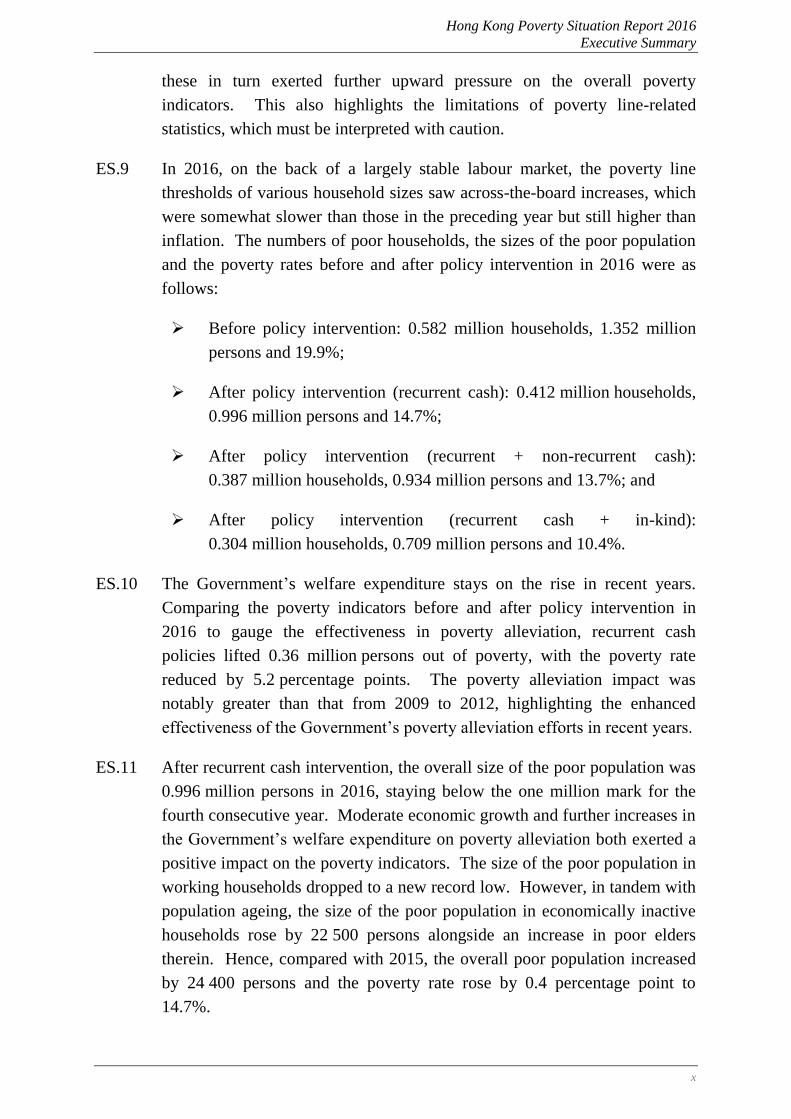
ES.9 In 2016, on the back of a largely stable labour market, the poverty line
thresholds of various household sizes saw across-the-board increases, which
were somewhat slower than those in the preceding year but still higher than
inflation. The numbers of poor households, the sizes of the poor population
and the poverty rates before and after policy intervention in 2016 were as
follows:
Before policy intervention: 0.582 million households, 1.352 million
persons and 19.9%;
After policy intervention (recurrent cash): 0.412 million households,
0.996 million persons and 14.7%;
After policy intervention (recurrent + non-recurrent cash):
0.387 million households, 0.934 million persons and 13.7%; and
After policy intervention (recurrent cash + in-kind):
0.304 million households, 0.709 million persons and 10.4%.
ES.10 The Government’s welfare expenditure stays on the rise in recent years.
Comparing the poverty indicators before and after policy intervention in
2016 to gauge the effectiveness in poverty alleviation, recurrent cash
policies lifted 0.36 million persons out of poverty, with the poverty rate
reduced by 5.2 percentage points. The poverty alleviation impact was
notably greater than that from 2009 to 2012, highlighting the enhanced
effectiveness of the Government’s poverty alleviation efforts in recent years.
ES.11 After recurrent cash intervention, the overall size of the poor population was
0.996 million persons in 2016, staying below the one million mark for the
fourth consecutive year. Moderate economic growth and further increases in
the Government’s welfare expenditure on poverty alleviation both exerted a
positive impact on the poverty indicators. The size of the poor population in
working households dropped to a new record low. However, in tandem with
population ageing, the size of the poor population in economically inactive
households rose by 22 500 persons alongside an increase in poor elders
therein. Hence, compared with 2015, the overall poor population increased
by 24 400 persons and the poverty rate rose by 0.4 percentage point to
14.7%.
Hong Kong Poverty Situation Report 2016
Executive Summary
xi
ES.12 Analysed by age, the respective sizes of the poor population and the poverty
rates after recurrent cash intervention in 2016 were:
Elders aged 65 and above: 0.337 million persons and 31.6%;
Persons aged 18 to 64: 0.487 million persons and 10.3%; and
Children aged below 18: 0.172 million persons and 17.2%.
ES.13 After policy intervention in 2016, the number of poor children aged below
18 and their poverty rate fell to their lowest levels since the availability of
data, and by 10 700 persons and 0.8 percentage point respectively when
compared with 2015. Against the backdrop of a declining proportion of
poor population receiving CSSA, the number of poor persons aged 18 to 64
increased by 6 200 and their poverty rate edged up by 0.2 percentage point;
further coupled with the trend of population ageing, the poor population and
poverty rate of elders aged 65 and above increased by 28 900 persons and
1.5 percentage points respectively.
ES.14 Analysed by gender, the respective sizes of the poor population and the
poverty rates after recurrent cash intervention in 2016 are:
Males: 0.456 million persons and 14.0%; and
Females: 0.540 million persons and 15.3%.
ES.15 Analysed by age of household head, the numbers of poor households, the
sizes of the poor population and the poverty rates after recurrent cash
intervention in 2016 were as follows:
Households with head aged 18 to 64: 0.213 million households,
0.610 million persons and 11.2%; and
Households with elderly head aged 65 and above: 0.199 million
households, 0.385 million persons and 28.2%.
ES.16 It must be pointed out that adopting household income as the sole indicator
for measuring poverty may overstate the poverty situation since some “asset-
rich, income-poor” persons may be classified as poor. In fact, among the
poor population after recurrent cash intervention in 2016, 84.6%
(842 900 persons) resided in non-CSSA households, among whom 539 800
persons (64.0%) had no financial needs, which were up by 27 500 persons
and 0.3 percentage point when compared with the corresponding figures in
2015 (512 300 persons and 63.7%). Among some 0.34 million poor elders,
87.6% (295 400 persons) resided in non-CSSA households and over 70% of
Hong Kong Poverty Situation Report 2016
Executive Summary
xii
them (211 100 persons) had no financial needs to apply for CSSA. In
addition, over 60% of the poor elderly households resided in owner-
occupied housing without mortgages, representing the highest share in eight
years. This reflects that many poor elders do have considerable assets.
ES.17 Analysed by existing recurrent cash benefit, CSSA remains the most
effective poverty alleviation measure, reducing the poor population by
around 0.19 million persons and the overall poverty rate by 2.8 percentage
points in 2016. The effectiveness of OALA, which targets at elders with
financial needs, was also notable in lifting around 0.1 million persons out of
poverty and lowering the overall poverty rate by 1.5 percentage points,
second only to CSSA. Launched in 2016, LIFA also lifted over 0.02 million
persons out of poverty and lowered the overall poverty rate by
0.3 percentage point. Apart from these recurrent cash measures, public
rental housing (PRH) provision, though not a cash benefit, is undeniably
effective in significantly improving the living environment and living
standards of grassroots families. It is estimated to have reduced the poor
population by over 0.23 million persons and the overall poverty rate by
3.4 percentage points, demonstrating its sizeable effect on poverty
alleviation.
ES.18 The overall poverty indicators generally stayed at relatively low levels in
2016, reflecting the significance of economic development and job creation
on one hand, and the substantial achievements of the Government’s poverty
alleviation work on the other.
ES.19 Summing up the development of the poverty situation over the past eight
years, the size of the poor population after policy intervention shrank by
47 500 persons cumulatively. Further decomposition of this reduction
shows that the factors of changes in age structure and household downsizing
amid population ageing, as well as population growth are estimated to have
added 46 100, 26 900 and 40 200 persons respectively to the poor
population. A detailed data analysis indicates that the interplay of other
fundamental factors affecting the poverty situation over the past few years,
including economic growth, favourable employment situation and
strengthened poverty alleviation efforts of the Government, etc., helped lift
160 800 persons out of poverty in total, though 70% of such poverty
reduction effect was offset by changes in the above-mentioned three
demographic factors. Looking forward, as the elderly population is
estimated to grow substantially from 1.16 million in 2016 to 2.37 million in
2036 and the proportion of elders will increase from the current one-sixth to
over three tenths of the population, population ageing will become more
Hong Kong Poverty Situation Report 2016
Executive Summary
xiii
acute and is expected to exert mounting upward pressure on the overall
poverty rate. This structural trend, coupled with the expected uplift in the
poverty line thresholds alongside wage growth, signifies the looming
difficulty in the future to continuously bring down the poverty rates. The
Government will monitor the poverty situation and its trend in Hong Kong,
and continue to support the most needy groups in the community with
appropriate measures.
Further Analysis of the 2016 Poverty Situation
ES.20 In 2016, the poverty rates of unemployed, economically inactive and elderly
households after recurrent cash intervention were the highest (69.8%, 59.2%
and 48.8% respectively) among all socio-economic groups. The
corresponding poverty rate of working households was relatively low
(8.0%), demonstrating that employment is the best way to prevent poverty.
ES.21 Further analysis of the forms of poverty shows that household groups with
higher proportions of working population and higher skill levels among
employed persons tended to benefit more from the improved labour market
conditions, and had lower poverty rates than other groups. This signifies the
importance of employment and skills upgrading in poverty alleviation and
prevention. On the other hand, families with a higher dependency ratio were
generally at a higher risk of falling below the poverty line.
ES.22 Comparing 2016 with 2015, the poverty rates of most socio-economic
groups after recurrent cash intervention fell. Improvements were
particularly notable in CSSA, single-parent, new-arrival and with-children
households. Overall speaking, the groups with improved poverty situation
all saw increases in the shares of employed persons engaged in higher-
skilled occupations.
ES.23 In 2016, around 40% of the non-CSSA poor households were working
households with incomes still below the poverty lines. Focusing on some
0.14 million non-CSSA working poor households after recurrent cash
intervention (with 0.45 million persons) in 2016, their poverty situation was
largely similar to that in previous years. With larger household size and
heavy family burdens, these households need more assistance. In this
respect, the LIFA Scheme successfully lifted 5 600 non-CSSA working
households and 22 900 persons therein (of which 9 500 were children) out of
poverty in 2016, with the corresponding poverty rate reduced by
0.4 percentage point. The effectiveness of the Scheme in poverty alleviation
was even more pronounced for with-children and single-parent poor
households, bringing down their poverty rates by 0.8 and 0.9 percentage
Hong Kong Poverty Situation Report 2016
Executive Summary
xiv
point respectively.
ES.24 Analysed by housing type, after recurrent cash intervention, over 40% of the
poor population resided in PRH, some 45% lived in owner-occupied housing
and nearly 9% were private tenants. The poverty situation of PRH
households showed improvement, with their poverty rate falling to an eight-
year low. The poverty rate of owner-occupier households edged up, with
around two-thirds of the increase in its poor population being elders.
ES.25 Indeed, for groups that lacked recurrent employment earnings (including
elderly persons aged 65 and above, elderly households, households with
elderly head and economically inactive households), their poverty rates were
persistently high. Conceivably, as members in these groups have mostly
retired, their poverty rates, which are defined by income, tend to be
relatively high and bear no significant direct relationship with economic
cycles.
ES.26 The role of employment in poverty prevention is obvious when analysing the
changes in poverty figures between 2009 and 2016. With the Hong Kong
economy staying on an uptrend after 2009, labour market conditions have
remained favourable. This, coupled with the implementation of Statutory
Minimum Wage (SMW) since May 2011 and two rounds of upward
adjustment of the SMW rate in 2013 and 2015 respectively, has resulted in
an appreciable increase in the earnings of grassroots workers. The poor
population in working households decreased further to a record low, with a
cumulative reduction of 13% since 2009. As earnings generally picked up,
the poverty situations of most socio-economic household groups showed
different extents of improvement in 2016 when compared with 2009. In
2016, household groups with higher proportions of full-time working
population, including new-arrival, with-children and working households, all
recorded their lowest poverty rates in eight years. These figures fully reflect
the importance of employment in poverty prevention.
ES.27 In contrast, elderly and economically inactive households as well as
households with elderly head, having relatively low proportions of working
population and mostly in lack of recurrent employment earnings, recorded
increases in their poor population (by 30%, 16% and 16% respectively) in
2016 over 2009, on the back of the increasingly apparent impact of
population ageing.
ES.28 Analysed by the 18 districts in Hong Kong, the five districts with the highest
post-intervention poverty rates in 2016 were North district, Sham Shui Po,
Yuen Long, Kwai Tsing and Kwun Tong. Districts with higher poverty rates
Hong Kong Poverty Situation Report 2016
Executive Summary
xv
generally had lower proportions of working population and higher shares of
workers engaged in lower-skilled occupations. Their child poverty rates also
tended to be higher than the overall figure. This is consistent with the
analysis in terms of socio-economic characteristics.
Policy Implications
ES.29 The official poverty line and analytical framework set by CoP provides an
objective basis for the formulation and enhancement of targeted initiatives to
assist grassroots families and the underprivileged. Meanwhile, CoP will
continue to review the application of the poverty line framework and explore
options and recommendations for its enhancements, in order to fulfil and
strengthen the three functions of the poverty line: to quantify the poverty
situation, to guide policy directions, and to quantitatively assess policy
effectiveness.
ES.30 Thanks to the gradual upturn of the job market since 2009, many
economically active households were lifted out of poverty. Up to 2016, the
post-intervention (recurrent cash) poor population of working and
unemployed households decreased cumulatively by 13% and 48%
respectively, with the former even down to the lowest level in eight years.
Moreover, those groups with higher proportions of full-timers and higher-
skilled working members typically face lower poverty risks.
ES.31 The analysis affirms that creating more quality jobs by propelling economic
development along with skills upgrading and reducing skills mismatch
through manpower training are conducive to alleviating poverty at source.
The Government will continue to encourage young people and adults to be
self-reliant through employment and assist them in enhancing their skills to
seize various development opportunities.
ES.32 Although the poverty situations of certain groups with relatively higher
proportions of full-time working population, such as single-parent and new-
arrival households, improved in recent years, their poverty rates were still
above the overall average. The Government will continue to assist the needy
in these families in seeking employment while stepping up measures in child
care services, with a view to increasing their labour force participation.
ES.33 In parallel to promoting employment, the Government also puts in place a
reasonable and sustainable social security and welfare system to help those
who cannot provide for themselves. Various poverty alleviation measures
will continue to provide assistance to the grassroots. In 2017/18, the
Government’s recurrent expenditure on social welfare is estimated to be
Hong Kong Poverty Situation Report 2016
Executive Summary
xvi
around $73.3 billion, up by $9.5 billion or 14.9% as compared with 2016/17.
While CSSA will continue to serve the important function of a social safety
net, OALA sustains the provision of cash assistance to those elders with
financial needs, and LIFA also offers assistance to low-income working
families. The Government has completed a comprehensive policy review on
the LIFA Scheme. The Chief Executive’s 2017 Policy Address released in
October 2017 announced a series of improvement measures to the Scheme
so as to benefit more working households. In addition, the LIFA Scheme
will be renamed as the “Working Family Allowance” Scheme. The
Government plans to implement the relevant measures on 1 April 2018.
ES.34 Recurrent cash measures aside, the Government has also put in place various
non-recurrent and in-kind benefits to alleviate the living burden of grassroots
households, among which the provision of PRH has a visible effect on
poverty alleviation. Specifically, the provision of PRH reduced the poverty
rate by 3.4 percentage points in 2016, reflecting its indisputable
effectiveness in poverty alleviation. The provision of PRH can help relieve
the burden of household expenditure and significantly improve the living
environment of grassroots families. The Government will continue to step
up its efforts in providing PRH units for the grassroots with housing needs.
ES.35 Amid the increasingly ageing demographic structure in Hong Kong, the
proportion of elders is estimated to rise persistently to over three-tenths of
the total population in 2036, almost doubling the current level. Since the
launch of OALA in 2013, the number of elderly recipients has reached over
0.46 million as at end-September 2017, and its poverty alleviation effect on
elders is very significant. Nonetheless, the 2016 statistics showed that,
among the 295 400 elders in non-CSSA poor households, 24 200 elders in
receipt of OALA still had financial needs. Upon its implementation in mid-
2018, the HOALA would provide further assistance to these poor elders.
ES.36 On the other hand, since the poverty line analysis under the core analytical
framework does not take assets into account, some “asset-rich, income-poor”
elders are classified as poor elders. Among some 0.34 million poor elders,
87.6% resided in non-CSSA households, and around 0.21 million of these
poor elders had no financial needs. Over 60% of the poor elderly
households resided in owner-occupied housing without mortgages,
representing the highest share in eight years. This also reflects that many
poor elders do have some assets. In this connection, the Hong Kong
Mortgage Corporation Limited announced in April 2017 a life annuity
scheme to help the elderly turn cash lump sums into life-long streams of
fixed monthly income. Scheduled for launching in mid-2018, the annuity
Hong Kong Poverty Situation Report 2016
Executive Summary
xvii
scheme would provide those elders with some assets an additional financial
planning option to manage their longevity risk by turning their assets into
regular income streams.
ES.37 Moreover, the labour force participation rate (LFPR) of elders has trended
up from 5.5% in 2009 to 9.9% in 2016. That of elders aged 65-69 increased
even more notably, up from 13.5% to 20.7%. Given the longer life
expectancy of our population, encouraging more employable elders with
better health conditions to stay in or re-enter the labour market would help
relieve labour force shrinkage in the future and bring a positive effect on
poverty prevention.
ES.38 The Elderly Services Programme Plan (ESPP), formulated by the Elderly
Commission and released in June 2017, proposed four strategic directions
and 20 recommendations on the future development of elderly services,
including improving the quality of elderly services and strengthening the
planning in service supply, land, manpower and financial input. The
Government has accepted in principle the strategic directions and
recommendations in ESPP, and will proceed to make arrangements for the
implementation of the recommendations.
ES.39 Thanks to the sustained growth of our economy and the tight labour market
amid the broadly benign global economic environment, earnings of
grassroots workers have recorded appreciable gains in 2017. Coupled with
the implementation of the various poverty alleviation measures mentioned
above, the living standard of low-income persons is expected to improve.
The Government will continue to monitor the poverty situation in Hong
Kong and the effectiveness of different poverty alleviation items, with a
view to providing more appropriate policies and measures to the needy.
Hong Kong Poverty Situation Report 2016
Chapter 1: Introduction
P. 1
1 Introduction
1.I Guiding Principles of the Government in Regard to Poverty Alleviation
1.1 The Government of the Hong Kong Special Administrative Region attaches
great importance to the poverty issue in Hong Kong. The direction of the
Government’s poverty alleviation policy is to encourage young people and
adults to be self-reliant through employment, while putting in place a
reasonable and sustainable social security and welfare system to offer help to
those who cannot provide for themselves, with the aim of rendering
appropriate assistance to the needy. The Government also closely monitors
the poverty situation and its trend in Hong Kong as well as supports the
underprivileged through appropriate policies and initiatives.
1.II The “Poverty Line” and the Poverty Situation Report
1.2 The Commission on Poverty (CoP) was reinstated in December 2012 to
deliberate on various policies and measures in support of the Government’s
poverty alleviation work for achieving the objectives of preventing and
alleviating poverty. One of the foremost tasks for CoP was to set a well-
recognised poverty line for Hong Kong.
1.3 Having considered the three primary functions (i.e. to analyse the poverty
situation, to assist policy formulation and to assess policy effectiveness) and
the five guiding principles (i.e. ready measurability, international
comparability, regular data availability, cost-effectiveness, and amenability to
compilation and interpretation) of setting the poverty line as an important
policy tool, and with due reference to local and international experience, the
first-term CoP eventually agreed, after iterative discussions, that the poverty
line should be based on the concept of “relative poverty” and set at 50% of the
median monthly household income before policy intervention (i.e. before
taxation and social welfare transfer)1. The poverty line thresholds are set on
the basis of household income before policy intervention, so as to avoid
distortion by the Government’s policy measures and to reflect the most
genuine situation of a household.
1.4 In September 2013, the first-term CoP announced the first official poverty line
for Hong Kong. Poverty statistics have since been updated annually. The
second-term CoP followed the poverty line framework adopted by the first-
1 For details of the poverty line framework, please refer to Appendix 1.
Hong Kong Poverty Situation Report 2016
Chapter 1: Introduction
P. 2
term CoP of which the term ended in November 20142. The updated analysis
of the poverty situation in Hong Kong was released at the two CoP Summits
held in October 2015 and 2016 respectively. The official poverty line, which
is already widely accepted by the public, academic research institutions and
social welfare organisations, provides a common basis for examining the
poverty situation in Hong Kong.
1.III Key Poverty Alleviation Efforts after Setting the Poverty Line
1.5 Setting the poverty line helps the Government better understand the forms and
situations of poverty in Hong Kong for identifying needy groups. Through
the efficient use of public resources, and the efforts of CoP and the
Community Care Fund (CCF), the Government has introduced a series of
measures over the past few years to tackle poverty and support the
disadvantaged, covering a wide range of areas to benefit various needy
groups.
(a) Recurrent cash assistance3
1.6 Regarding the existing recurrent cash benefits, the Old Age Living Allowance
(OALA) was fully implemented in 2013. With over 0.46 million elderly
recipients as at end-September 2017, its poverty alleviation effect on elders
was very significant. To strengthen support for the elderly persons with
financial needs, the Government also took steps to improve OALA in two
aspects: (i) relaxing the asset limits for OALA from May 2017 to benefit more
elderly persons with financial needs4; and (ii) making preparation for adding a
higher tier of assistance (Higher Old Age Living Allowance (HOALA)) for
eligible elderly persons with more financial needs5, by providing a monthly
2 In April 2016, the second-term CoP continued the discussion on the poverty line framework initiated by the
first-term CoP in 2013 in response to the views of the public and academia on enhancing the framework.
CoP discussed, among other things, the proposed incorporation of the effectiveness of public rental
housing (PRH) provision in poverty alleviation into the framework. In this respect, CoP in principle
recognised the important role of PRH in poverty alleviation and also took note of the visible difference in
living quality between PRH households and low-income households living in private rental housing.
However, seeing no pressing need to enhance the framework or to refine the compilation of poverty
statistics under the framework, CoP decided that the effectiveness of PRH provision and other means-
tested in-kind benefits should continue to be used as supplementary reference. In the long run, however,
CoP agreed to further review the application of the current framework and explore enhancement proposals
and recommendations.
3 Under the poverty line framework endorsed by CoP, recurrent cash assistance includes Comprehensive
Social Security Assistance, Old Age Living Allowance, Old Age Allowance, Disability Allowance, Low-
income Working Family Allowance, Work Incentive Transport Subsidy, etc. Please refer to Appendix 3
for details.
4 The asset limits are raised from $225,000 to $329,000 for elderly singletons and from $341,000 to
$499,000 for elderly couples.
5 The asset limits for elderly singletons and elderly couples receiving HOALA are $144,000 and $218,000
respectively.
Hong Kong Poverty Situation Report 2016
Chapter 1: Introduction
P. 3
allowance of $3,435, which would be about one-third more than the existing
amount ($2,565). As the measure would take retrospective effect from 1 May
2017, eligible beneficiaries of HOALA who are currently receiving OALA
would receive an additional one-off sum of over $10,000 upon the launch of
HOALA.
1.7 The Government has also improved the Comprehensive Social Security
Assistance (CSSA) application arrangement for elderly persons. Starting
from February 2017, while preserving the requirement that CSSA applicants
must apply on a household basis, the Social Welfare Department (SWD) has
abolished the arrangement for the relatives to make a declaration on whether
they provide financial support to the elderly persons who apply for CSSA on
their own (e.g. an elderly person who does not live with his / her children)
(the so-called “bad son statement”). At present, only the elderly applicants
are required to submit the information6.
1.8 Furthermore, non-CSSA working poor families have heavy family burdens
and need more assistance as revealed in the poverty situation reports of the
previous several years. In order to relieve the financial burden of these low-
income working families, the Government launched the Low-income
Working Family Allowance (LIFA), with its allowance tied to the
employment and working hours of applicants for encouraging self-reliance.
Child Allowance to eligible children / young members of the families is also
disbursed for easing inter-generational poverty. The poverty alleviation effect
of LIFA was first reflected in the analysis of the post-intervention (recurrent
cash) poverty statistics in 2016. The LIFA Scheme has been open for
applications since May 20167. As at end-September 2017, over 91 000
applications have been received. Among them, over 81 000 applications have
been granted the allowance, benefiting more than 36 000 low-income working
families, including over 57 000 children / young people. Since its
implementation, the Government has rolled out some measures to refine the
LIFA Scheme and streamline its application process8. Furthermore, the
6 Furthermore, in view of the improved life expectancy of the population and a policy of encouraging the
young-olds to join the workforce, the Government will raise the eligibility age for elderly CSSA from 60 to
65. Elderly persons aged between 60 and 64 who are receiving CSSA before the new policy takes effect
will not be affected. The CSSA payments of disabled persons or persons in ill health will also not be
affected by the new policy, i.e. they will, regardless of their age, receive CSSA payments which are higher
than those applicable to able-bodied adults.
7 First-round applications were accepted in three phases with all the claim periods starting from November
2015.
8 Apart from abolishing the absence rule (the requirement that all household members included in a LIFA
application should not be absent from Hong Kong for more than 30 days in any six-month claim period)
with effect from 6 December 2016, the Working Family Allowance Office of the Working Family and
Student Financial Assistance Agency has also simplified the LIFA application form to make it more user-
friendly, having regard to the feedback of stakeholders and the operating experience of the Office.
Hong Kong Poverty Situation Report 2016
Chapter 1: Introduction
P. 4
Government has completed a comprehensive policy review on the Scheme.
The Chief Executive’s 2017 Policy Address released in October 2017
announced a series of improvement measures9 so as to benefit more working
households. In addition, the LIFA Scheme will be renamed as the “Working
Family Allowance” Scheme. The Government plans to implement the
relevant measures on 1 April 2018.
(b) Community Care Fund
1.9 The CCF is an integral part of the Government’s poverty alleviation blueprint,
serving the functions of plugging gaps in the existing system and
implementing pilot schemes. Since its establishment in 2011, the CCF has
launched 44 assistance programmes. Among them, 12 programmes10
have
been incorporated into the Government’s regular assistance programmes. In
addition, the Government plans to incorporate the “Dementia Community
Support Scheme” into its regular assistance programmes after the pilot period.
1.10 The CCF Task Force under CoP will continue to ensure the efficient use of
CCF’s resources in rolling out more appropriate assistance programmes to
meet the needs of different groups and strengthen support for grassroots
families. CoP approved to launch six new CCF programmes11
in 2016. In
2017, CoP approved to launch eight new programmes, among which five have
9 The measures include: (i) extending the Scheme to cover singletons; (ii) introducing a tier with the income
limit pitched at 70% of the median monthly domestic household income (MMDHI), and adopting the
MMDHI of economically active households as the basis for calculating the income limit; (iii) for the
working hour requirement, adding a new tier of 168 hours a month for non-single-parent households and a
new tier of 54 hours a month for single-parent households. Households meeting the respective monthly
working hour requirements are eligible for higher rates of allowance; (iv) allowing household members to
aggregate working hours for assessing the allowance; and (v) increasing all rates of allowance, and adding
another tier of 3/4 allowance rate between the current full-rate allowance and half-rate allowance.
10 Including (1) “Subsidy for Needy Patients of Hospital Authority who Marginally Fall Outside the
Samaritan Fund (SF) Safety Net for the Use of SF Subsidised Drugs”, (2) “Financial Assistance for Non-
school-attending Ethnic Minorities and New Arrivals from the Mainland for Taking Language
Examinations”, (3) “Subsidy for Non-school-attending Ethnic Minorities and New Arrivals from the
Mainland Participating in Language Courses”, (4) “Subsidy for Tenants Purchase Scheme Flat Owners on
CSSA”, (5) “Subsidy to Meet Lunch Expenses at Whole-day Primary Schools for Students from Low-
income Families”, (6) “Training Subsidy for Children who are on the Waiting List for Subvented Pre-
school Rehabilitation Services”, (7) “Special Subsidy to Persons with Severe Physical Disabilities for
Renting Respiratory Support Medical Equipment”, (8) “Special Subsidy to Persons with Severe Physical
Disabilities for Purchasing Medical Consumables Related to Respiratory Support Medical Equipment”, (9)
“Enhancement of the Flat Rate Grant under the School Textbook Assistance Scheme”, (10) “Enhancement
of the Financial Assistance for Needy Students Pursuing Programmes Below Sub-degree Level”, (11)
“Extra Travel Subsidy for Needy Special School Students” and (12) “Provision of Funding for Ordinary
Schools to Arrange Special Education Needs Coordinators Pilot Scheme”.
11 Including (1) “Provision of a One-off Grant for School-related Expenses to Kindergarten Students”, (2)
“Free Cervical Cancer Vaccination Pilot Scheme”, (3) “Pilot Scheme on Raising the Maximum Level of
Disregarded Earnings for Recipients with Disabilities under the CSSA Scheme”, (4) “Pilot Scheme on
Providing Subsidy for Higher Disability Allowance Recipients in Paid Employment to Hire Carers”, (5)
“Pilot Scheme on Living Allowance for Low-income Carers of Persons with Disabilities” and (6)
“Dementia Community Support Scheme”.
Hong Kong Poverty Situation Report 2016
Chapter 1: Introduction
P. 5
been implemented, namely “Subsidy for Eligible Patients to Purchase Ultra-
expensive Drugs”, “Subsidy for Eligible Patients of Hospital Authority to
Purchase Specified Implantable Medical Devices for Interventional
Procedures”, “Subsidy for Persons Holding Non-local Qualifications to
Conduct Qualifications Assessment”, “Pilot Scheme on Providing Special
Subsidy for Persons with Permanent Stoma from Low-income Families for
Purchasing Medical Consumables” and “Pilot Scheme on Relaxing the
Household Income Limit of the Fee-waiving Subsidy Scheme under the After
School Care Programme for Low-income Families and Increasing Fee-
waiving Subsidy Places”. The remaining three new pilot schemes will be
progressively implemented from the end of 2017 to the first quarter of 2018,
including “Pilot Scheme on Subsidised Cervical Cancer Screening and
Preventive Education for Eligible Low-income Women”, “Pilot Scheme on
Home Care and Support for Elderly Persons with Mild Impairment” and
“Pilot Scheme on Support for Elderly Persons Discharged from Public
Hospitals After Treatment”. In addition, the CCF has expanded or enhanced
some existing programmes12
for more effective provision of assistance to
those in need.
(c) Making available more public housing resources
1.11 To cater for the housing needs of the grassroots, the Government has been
allocating resources to increase public rental housing (PRH) supply.
According to the estimation as at September 2017, the Hong Kong Housing
Authority (HA) and the Hong Kong Housing Society will produce a total of
about 100 300 public housing units, including about 75 200 PRH units and
25 100 subsidised sale flats in the five-year period from 2017/18 to 2021/22.
1.12 The Government’s commitment to increasing public housing supply has been
set out in the Long Term Housing Strategy (LTHS) promulgated in December
2014. Based on the results of the housing demand projection as presented in
the LTHS Annual Progress Report 2016, the total housing supply target for
the ten-year period from 2017/18 to 2026/27 is 460 000 units. With the public
/ private split maintained at 60:40, the public housing supply target will be
280 000 units, including 200 000 PRH units.
1.13 As set out in The Chief Executive’s 2017 Policy Address, the Government will
step up its efforts in helping those relatively better-off PRH tenants to move
12 For example, to enable more elderly persons who have financial difficulties but not receiving CSSA to
benefit from free removable dentures and other related dental services, the “Elderly Dental Assistance
Programme” was expanded to cover OALA recipients in three phases: covering elderly persons aged 80 or
above starting from September 2015 (the first phase), those aged 75 or above from October 2016 (the
second phase) and those aged 70 or above from July 2017 (the third phase).
Hong Kong Poverty Situation Report 2016
Chapter 1: Introduction
P. 6
up the housing ladder so that they can vacate their units for allocation to the
needy. HA is conducting a review on the Green Form Subsidised Home
Ownership Pilot Scheme (GSH). If HA agrees to regularising GSH and
providing more GSH flats for sale, it will not only assist PRH tenants to
become home-owners, but will also recover more PRH units for allocation.
1.IV Commitment to Poverty Alleviation
1.14 The continuous increase in government spending on welfare reflects the
Government’s commitment to poverty alleviation. In 2017/18, the recurrent
government expenditure on social welfare is estimated to be $73.3 billion. It
accounts for 20% of the total estimated recurrent government expenditure and
is the second largest recurrent expenditure item after education. Compared
with 2012/13, the expenditure in this area has registered a cumulative increase
of 71%. Given the successive implementation and enhancement of various
new poverty alleviation initiatives alongside the trend of an ageing
population, the resources allocated to poverty alleviation work are expected to
increase continuously in the period ahead. It must be stressed that an ageing
population should not be considered a threat to our public finance, but an
opportunity for the community to devise a variety of effective elderly care
services such that our senior citizens will have marvellous golden years.
1.V Related Studies under the Poverty Line Framework
1.15 The Government will continue to monitor the poverty situation in Hong Kong
and to evaluate the effectiveness of poverty alleviation policies. In addition to
updating the statistics pertaining to the official poverty line, the Government
has also conducted further studies to supplement the poverty analysis such as
the 2015 Study on Earnings Mobility and the Supplementary Poverty Line
Analysis: Expenditure Patterns of Poor Households in 2015 (in the form of an
information paper) released in May 2016 and April 2017 respectively. The
following supplementary analyses are also included in this Poverty Situation
Report for 2016:
(i) Poverty situation by age of household head: the existing poverty line
only takes income into account while most elders do not have
employment income. This may result in overestimating the elderly
poverty counts. It is anticipated that this problem will be aggravated by
more acute population ageing down the road. Apart from analysing the
economic characteristics of households, this Report continues to adopt
the recommendation of Professor Richard Wong Yue-chim to analyse
poverty statistics by age group of household head, which is free from
the impact of economic cycles, as another perspective to illustrate the
Hong Kong Poverty Situation Report 2016
Chapter 1: Introduction
P. 7
relationship between economic growth and income poverty
(Sections 2.VI and 3.I(c)).
(ii) Analysis of the impact of demographic factors on the trend of the
poverty rate: this Report continues to apply the methodology adopted
in Professor Paul Yip Siu-fai’s study to analyse the impact of various
factors on the trend of the poverty rate from 2009 to 2016 by
quantifying the extent to which demographic factors (including changes
in the age structure and dwindling household size) have partly offset
the poverty alleviation effect brought about by sustained economic
growth and the Government’s measures (Box 2.4).
(iii) Supplementary poverty lines: for the purpose of monitoring the
circumstances of households at different risks of poverty, this Report
continues to provide an update of the situation of households and
persons with income below 60% of the median, give a brief account of
their socio-economic characteristics, and compare them with persons in
households below the current poverty line (50% of the median
household income) (Box 3.3).
1.16 In addition, based on the findings of the 2016 Population By-census, the
Government has also conducted the following studies:
(i) Study on income disparity: the Gini Coefficient is compiled every
five years by the Census and Statistics Department (C&SD) based on
the population census / by-census data to reflect the income disparity in
Hong Kong. Drawing reference from the updated figures of the 2016
Population By-census, the Government has conducted an in-depth
study on income distribution and trend of income disparity for the
previous years. Various underlying socio-economic factors were also
discussed. The findings of the study were already released in June
2017.
(ii) An update on the poverty situation of ethnic minorities (EMs):
subsequent to the release of the Hong Kong Poverty Situation Report
on Ethnic Minorities 2014 at the end of 2015, the Government will
update the poverty situation of EMs based on the 2016 Population By-
census data to facilitate continuous monitoring of their poverty risk.
1.VI Structure of Poverty Situation Report
1.17 As in previous years, this year’s Poverty Situation Report quantifies the
poverty situation in Hong Kong under the poverty line framework (please
Hong Kong Poverty Situation Report 2016
Chapter 1: Introduction
P. 8
refer to Appendix 1 for details), and analyses the poor population according
to the following household characteristics:
(i) Social (ii) Economic (iii) Housing (iv) District (v) Age of
household head
Elderly
Youth
With-children
CSSA
Single-parent
New-arrival
Economically
inactive
Working
Unemployed
PRH tenants
Private
tenants13
Owner-
occupiers
By the 18
District
Council
districts
Elders aged 65
and above
Persons aged 18
to 64
1.18 The ensuing three chapters cover the following:
Chapter 2 analyses the poverty situation in Hong Kong and its trend
from 2009 to 2016, as well as the impact of demographic factors on the
trend of poverty.
Chapter 3 provides an in-depth analysis of households and people in
poverty before and after policy intervention in 2016, with a breakdown
by type of housing, socio-economic characteristic, age group of
household head and district, to shed light on the forms and causes of
poverty.
Chapter 4 concludes with policy implications based on the report
findings.
1.19 It should be noted that, in this Report, the analysis on poverty statistics after
policy intervention has already taken into account the poverty alleviation
measures launched in or before 2016, such as the implementation of LIFA in
May 2016. As for the above-mentioned measures rolled out in 2017 and
afterwards, their poverty alleviation impacts will only be reflected in the
poverty statistics for the subsequent rounds.
13 Refer to domestic households renting and residing in private permanent housing or temporary housing.
Please see Glossary for details.
Hong Kong Poverty Situation Report 2016
Chapter 2: Poverty Situation and Its Trend from 2009 to 2016
P. 9
2 Poverty Situation and Its Trend from 2009 to 2016
2.1 The poverty line framework helps quantify the poverty situation in Hong
Kong and facilitates the understanding of the different forms of poverty
among various groups. This Chapter starts with examining the various major
factors (i.e. economic ups and downs, demographic and household
composition, and the Government’s efforts in poverty alleviation) and their
changes in recent years that have implications for the poverty statistics14
. The
Chapter then presents the latest poverty situation in Hong Kong with the
updated poverty line and statistics based on the 2016 household income
statistics released by C&SD, followed by assessments of the effectiveness of
the Government’s poverty alleviation measures over the past year.
2.I Major Factors Affecting Poverty Statistics
(a) Economic cycles
2.2 Economic growth and labour market stability contribute to the improvement
in employment earnings of economically active grassroots households,
thereby reducing their poverty risks. After the shock of the global financial
crisis in 2008, the Hong Kong economy has experienced a speedy recovery
since 2010, recording an average annual growth rate of 3.4% in real terms,
alongside a notable fall in the unemployment rate and continuous growth in
employment earnings. The poverty rate of economically active households
before policy intervention also fell in tandem (see Section 2.IV(b) for
details). This affirms that sustaining economic development for generating
more jobs is crucial in lifting those who actively participate in the labour
market and their family members out of poverty.
2.3 In 2016, the Hong Kong economy grew moderately by 2.0% in real terms.
The labour market was largely stable, with total employment rising further to
a new high of 3 787 100. The overall unemployment rate and that of lower-
skilled workers, albeit edging up to 3.4% and 3.6% respectively when
compared with 2015, were still at relatively low levels. Wages and earnings
grew at a somewhat slower pace, but still faster than inflation. Grassroots
workers enjoyed notable wage growth, outpacing the increase in overall
wages (Figure 2.1).
14 Poverty statistics in this Report cover domestic households only.
Hong Kong Poverty Situation Report 2016
Chapter 2: Poverty Situation and Its Trend from 2009 to 2016
P. 10
Figure 2.1: Labour market situation:
unemployment rate, wages and average employment earnings
(b) Demographic and household composition factors
2.4 Since most elders are retirees without employment earnings, their poverty risk
is naturally far higher than that of households with employment earnings
(please refer to Box 2.3 for a detailed analysis of the elderly poverty
situation). Hence, with increasing proportions of elderly and economically
inactive households, the size of the poor population and the poverty rate,
which are measured solely by household income, are inevitably subject to
upward pressure. Against the backdrop of persistent population ageing, the
elderly population aged 65 and above residing in domestic households15
has
increased cumulatively by 0.249 million persons at an average annual rate of
3.9% over the past seven years, much higher than that of total population at
0.6%. The proportion of elders was on the rise as well, from 12.5% (817 300
persons) in 2009 to 15.7% (1 066 800 persons) in 2016. Over the same
period, the number of economically inactive households also increased
persistently, with the share of elderly population therein up to nearly 60% in
2016 (Figure 2.2).
15 Figures exclude foreign domestic helpers (FDHs).
3.6
3.4
2
3
4
5
6
7
2008 2009 2010 2011 2012 2013 2014 2015 2016
(a) Unemployment rate
0
Lower-skilled
Overall
4.7
3.7
-2
0
2
4
6
8
10
12
2008 2009 2010 2011 2012 2013 2014 2015 2016
Average employment earnings of full-time employees
in the lowest decile group
Wages
(b) Nominal wages and average employment earnings
Grassroots
Overall wages
Percent (%) Rate of change (%)
Note: Figures of unemployment rates and average employment earnings in 2012-2015 have been revised to take into account
the results of the 2016 Population By-census.
Sources: General Household Survey; and Labour Earnings Survey, Census and Statistics Department.
Hong Kong Poverty Situation Report 2016
Chapter 2: Poverty Situation and Its Trend from 2009 to 2016
P. 11
Figure 2.2: Elderly population and number of economically inactive households,
2009-2016
2.5 Population ageing, growing prevalence of people remaining single or getting
divorces, as well as low fertility rate all contribute to the continuous trend of
smaller household size in Hong Kong. The average household size trended
downwards in recent years from 2.85 persons in 2009 to 2.72 persons in 2016,
while the numbers and proportions of 1- and 2-person households stayed on
an upward trend (Figure 2.3) as more and more elders lived alone or with
their spouses only. Since many of these small households had no or just one
working member, the poverty rates of 1- and 2-person households were
markedly higher than those of larger households. As such, smaller household
size will also push up the overall poverty rate.
2.6 Focusing on the changes in demographic composition between 2015 and
201616
, there were 2 496 000 domestic households in Hong Kong in 2016,
representing an increase of 27 700 (or 1.1%) over 2015. Among these
households, the number of small families increased further, with the share of
1- and 2-person households in overall households up from 46.2% to 46.9%,
the average household size down (only 1.6 persons per household on average)
and the number of elderly households up (6.3% or 19 000 households). On
the other hand, the total population living in domestic households was
6 795 000, up by 16 100 (or 0.2%) over 2015. Among them, the number of
children aged below 18 and that of adults aged 18 to 64 fell by 1.2% (or
16 The household figures for 2015 in paragraph 2.6 have been revised based on the results of the 2016
Population By-census.
817 836 858892
931974
1 0211 067
12.5 12.7 13.013.4
13.914.5
15.115.7
0
2
4
6
8
10
12
14
16
18
2009 2010 2011 2012 2013 2014 2015 2016
0
200
400
600
800
1 000
1 200
1 400
(a) Elderly population
Elderly population (LHS) Share of elders in total population (RHS)
Percent (%)
382
404410 417 422
446
468482
53.152.4
53.2
54.6
57.0 57.457.9
58.9
40
42
44
46
48
50
52
54
56
58
60
200
250
300
350
400
450
500
550
600
2009 2010 2011 2012 2013 2014 2015 2016
Number of households (LHS) Share of elderly population (RHS)
Number of households ('000)
(b) Economically inactive households
0 0
Population figures refer to persons in domestic households, excluding foreign domestic helpers and the institutional population. The source of the figures is different
from that adopted in Box 2.4.
Figures in 2012-2015 have been revised to take into account the results of the 2016 Population By-census.
General Household Survey, Census and Statistics Department.
Percent (%)Elderly population ('000)
Notes:
Source:
2009 2010 2011 2012 2013 2014 2015 2016
Elderly households
('000)216 229 235 245 264 279 300 319
2009 2010 2011 2012 2013 2014 2015 2016
Population in
economically inactive
households ('000)
658 699 696 710 705 743 779 800
Hong Kong Poverty Situation Report 2016
Chapter 2: Poverty Situation and Its Trend from 2009 to 2016
P. 12
11 700 persons) and 0.4% (or 17 800 persons) to 999 800 and 4 728 400
respectively. Amidst ongoing population ageing, the number of elders aged
65 and above increased by 4.5% (or 45 600 persons) to 1 066 800. With more
elders, the demographic dependency ratio17
in Hong Kong rose from 428 in
2015 to 437 in 2016, while the economic dependency ratio18
also went up
from 899 to 905 due to more retirees.
Figure 2.3: Average household size of overall households and
the share of small households, 2009-2016
2.7 All in all, demographic and household composition have exerted upward
pressure on the overall poverty statistics. These structural factors to a certain
extent offset the poverty alleviation effect brought about by economic growth
and the Government’s measures (please refer to Box 2.4 for details about the
impacts of population ageing and household size on the poverty rate).
Nevertheless, with the poverty line adopting household income as the sole
basis for measurement, some “asset-rich, income-poor” may thus be classified
as poor population. Conceivably, this would be particularly prominent among
retired persons without employment earnings, resulting in a probable
overstatement of the poverty situation.
17 The demographic dependency ratio is the number of persons aged below 18 and aged 65 and above per
1 000 persons aged 18 to 64.
18 The economic dependency ratio is the number of economically inactive persons per 1 000 economically
active persons.
2.85
2.83
2.81
2.80
2.78
2.77
2.75
2.72
2009 2010 2011 2012 2013 2014 2015 2016
2.60
2.62
2.64
2.66
2.68
2.70
2.72
2.74
2.76
2.78
2.80
2.82
2.84
2.86
2.88
Note: Figures in 2012-2015 have been revised to take into account the results of the 2016 Population By-census.Source: General Household Survey, Census and Statistics Department.
(a) Average household size of overall households
Average number of persons
0
16.6 16.8 17.2 17.3 17.4 17.7 18.4 19.2
26.2 26.2 26.4 26.7 27.5 27.6 27.8 27.8
0
5
10
15
20
25
30
35
40
45
50
2009 2010 2011 2012 2013 2014 2015 2016
2-person households 1-person households
Percent (%)
(b) Share of 1-person and 2-person households within all
households
Hong Kong Poverty Situation Report 2016
Chapter 2: Poverty Situation and Its Trend from 2009 to 2016
P. 13
(c) Government’s efforts in poverty alleviation
2.8 In parallel with promoting employment, the Government seeks to provide
support under the social security system on a reasonable and sustainable basis
for those who cannot provide for themselves. The Government has
committed increasingly more resources on welfare, with the recurrent
expenditure on social welfare up from about $39 billion in 2009/10 to about
$64 billion in 2016/17, accounting for 18.5% of total recurrent expenditure.
Recurrent cash benefit schemes such as CSSA, and those rolled out in recent
years including OALA and LIFA, continued to play an important role in
poverty alleviation in 2016 and have eased the poverty situation. In 2017/18,
the Government’s recurrent expenditure on social welfare is estimated to grow
further to $73.3 billion, with its share in total recurrent expenditure rising to
nearly one-fifth (19.8%), indicating the persistently strengthened poverty
alleviation efforts (Figure 2.4). A detailed analysis on the effectiveness of
recurrent cash benefits in poverty alleviation is at Section 2.IV(c), whereas
the poverty situations after taking into account non-recurrent cash benefits and
in-kind benefits are at Boxes 2.1 and 2.2 respectively.
Figure 2.4: Recurrent government expenditure on social welfare,
2009/10-2017/18*
2.9 The poverty situations before and after policy intervention in 2016 are
analysed in the ensuing paragraphs of this Chapter.
39.4 37.6
40.3 42.8
51.6 54.3
58.3
63.8
73.3
17.8
16.8 16.616.3
18.217.8 18.0
18.5
19.8
12
14
16
18
20
22
24
30
40
50
60
70
80
90
100
110
2009/10 2010/11 2011/12 2012/13 2013/14 2014/15 2015/16 2016/17 2017/18
Recurrent government expenditure on social welfare (LHS)
Share in recurrent government expenditure (RHS)
0
Source:
Notes: (*)
0
Launch of OALA
Launch of LIFA, improvement of
CSSA application arrangement
for elders^
Relaxation of
OALA asset
limits
(^)
($Bn) Percent (%)
Figures for 2015/16 and before are actual figures. Those for 2016/17 and 2017/18 are revised estimates and estimates respectively.
Starting from February 2017, SWD has abolished the arrangement for the relatives to make a declaration on whether they provide
financial support to the elderly persons who apply for CSSA on their own (e.g. an elderly person who does not live with his/her
children) (the so-called “bad son statement”). At present, only the elderly applicants are required to submit the information.
Financial Services and the Treasury Bureau.
Hong Kong Poverty Situation Report 2016
Chapter 2: Poverty Situation and Its Trend from 2009 to 2016
P. 14
2.II Household Income Distribution
(a) Before policy intervention
2.10 With a largely stable labour market amid further moderate economic growth
in 2016, household income saw broad-based increase. The pre-intervention19
monthly median household income20
was $25,000 in 2016, up by 4.2% over a
year earlier (Table 2.1). When compared with 2009, income grew by 44.1%
cumulatively. After netting out the impact of inflation, the increase was
11.9% in real terms, indicating a generally favourable income condition over
the past seven years.
2.11 However, the income condition of overall households continued to be
constrained by ongoing population ageing: the number of elderly households
was on the rise, at a growth rate much higher than that of overall households
in 2016. As most members in elderly households are retirees with no
employment earnings, these households have long been classified as “low-
income household” groups in statistical analyses with low income growth.
The 15th and 25th percentiles of the pre-intervention monthly median
household income were $5,000 and $11,000 respectively, virtually unchanged
when compared with 2015.
Table 2.1: Pre-intervention household income, 2009-2016
Percentile Nominal household income ($, per month) Annual change (%)
2009 2010 2011 2012 2013 2014 2015 2016 2010 2011 2012 2013 2014 2015 2016
85th 43,300 45,000 48,000 50,000 53,000 55,200 60,000 60,700 +3.9 +6.7 +4.2 +6.0 +4.2 +8.7 +1.2
75th 31,000 32,000 34,800 36,500 40,000 40,700 43,800 45,000 +3.2 +8.6 +5.0 +9.6 +1.8 +7.5 +2.9
50th
(Median) 17,400 18,000 19,200 20,000 21,800 22,600 24,000 25,000 +3.7 +6.7 +4.2 +9.0 +3.7 +6.2 +4.2
25th 8,000 8,400 9,000 9,900 10,000 10,500 11,000 11,000 +5.0 +7.1 +10.0 +1.0 +5.0 +4.8 @
15th 4,500 4,500 5,000 5,000 5,100 5,000 5,000 5,000 @ +11.1 @ +2.0 -2.0 @ @
Notes: (@) Annual change is less than 0.05%.
Annual changes are calculated based on unrounded figures.
Source: General Household Survey, Census and Statistics Department.
19 “Pre-intervention monthly median household income” refers to original household (excluding FDHs)
income before policy intervention, i.e. it only includes a household’s own employment earnings and other
cash income, without deducting taxes but excluding cash allowances. For the definitions of different types
of household income, please refer to Appendix 1 and the Glossary.
20 Unless otherwise specified, all household income figures are quoted on a monthly basis and rounded to the
nearest hundred.
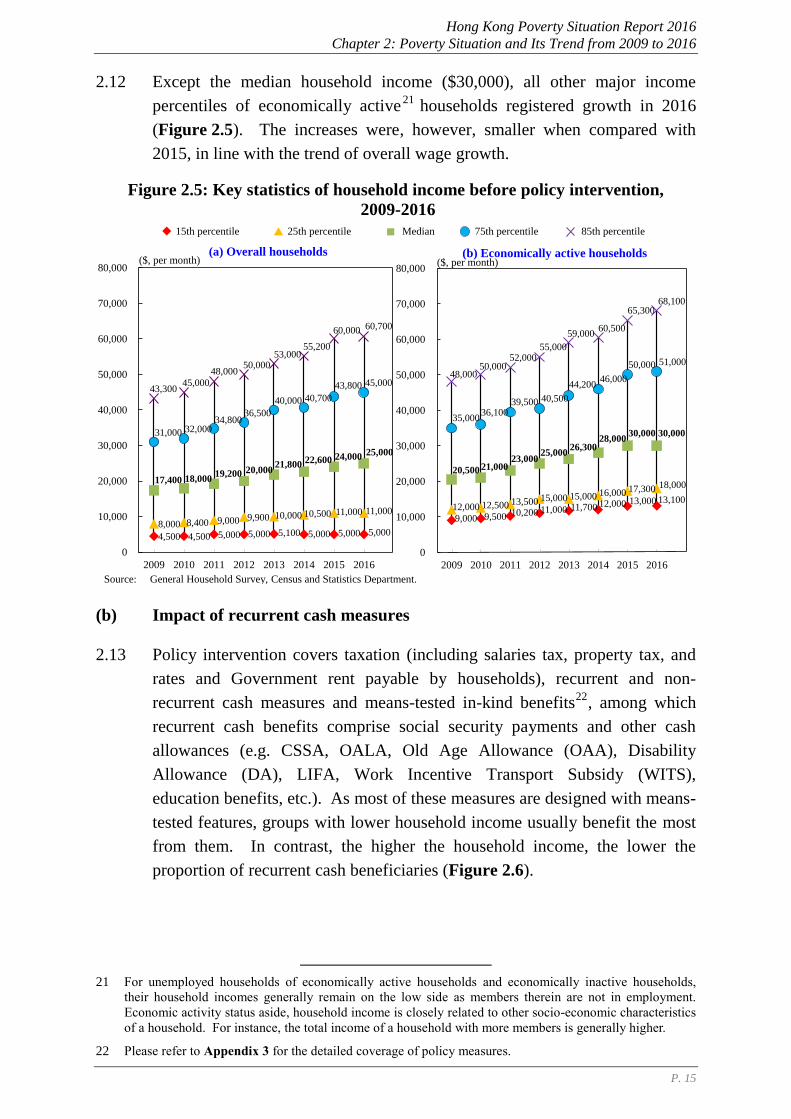
Hong Kong Poverty Situation Report 2016
Chapter 2: Poverty Situation and Its Trend from 2009 to 2016
P. 15
2.12 Except the median household income ($30,000), all other major income
percentiles of economically active21
households registered growth in 2016
(Figure 2.5). The increases were, however, smaller when compared with
2015, in line with the trend of overall wage growth.
Figure 2.5: Key statistics of household income before policy intervention,
2009-2016
(b) Impact of recurrent cash measures
2.13 Policy intervention covers taxation (including salaries tax, property tax, and
rates and Government rent payable by households), recurrent and non-
recurrent cash measures and means-tested in-kind benefits22
, among which
recurrent cash benefits comprise social security payments and other cash
allowances (e.g. CSSA, OALA, Old Age Allowance (OAA), Disability
Allowance (DA), LIFA, Work Incentive Transport Subsidy (WITS),
education benefits, etc.). As most of these measures are designed with means-
tested features, groups with lower household income usually benefit the most
from them. In contrast, the higher the household income, the lower the
proportion of recurrent cash beneficiaries (Figure 2.6).
21 For unemployed households of economically active households and economically inactive households,
their household incomes generally remain on the low side as members therein are not in employment.
Economic activity status aside, household income is closely related to other socio-economic characteristics
of a household. For instance, the total income of a household with more members is generally higher.
22 Please refer to Appendix 3 for the detailed coverage of policy measures.
15th percentile 25th percentile Median 75th percentile 85th percentile
4,500 4,500 5,000 5,000 5,100 5,000 5,000 5,0008,000 8,400 9,000 9,900 10,000 10,500 11,000 11,000
17,400 18,00019,200 20,000
21,80022,600 24,000 25,000
31,000 32,00034,800
36,500
40,000 40,700
43,800 45,00043,300
45,000
48,00050,000
53,00055,200
60,000 60,700
0
10,000
20,000
30,000
40,000
50,000
60,000
70,000
80,000
2009 2010 2011 2012 2013 2014 2015 2016
(a) Overall households($, per month)
9,000 9,500 10,200 11,000 11,700 12,000 13,000 13,10012,000 12,500 13,500 15,000 15,000 16,000 17,300 18,000
20,500 21,00023,000
25,00026,300
28,00030,000 30,000
35,00036,100
39,500 40,500
44,20046,000
50,000 51,000
48,00050,000
52,00055,000
59,00060,500
65,30068,100
0
10,000
20,000
30,000
40,000
50,000
60,000
70,000
80,000
2009 2010 2011 2012 2013 2014 2015 2016
(b) Economically active households($, per month)
Source: General Household Survey, Census and Statistics Department.
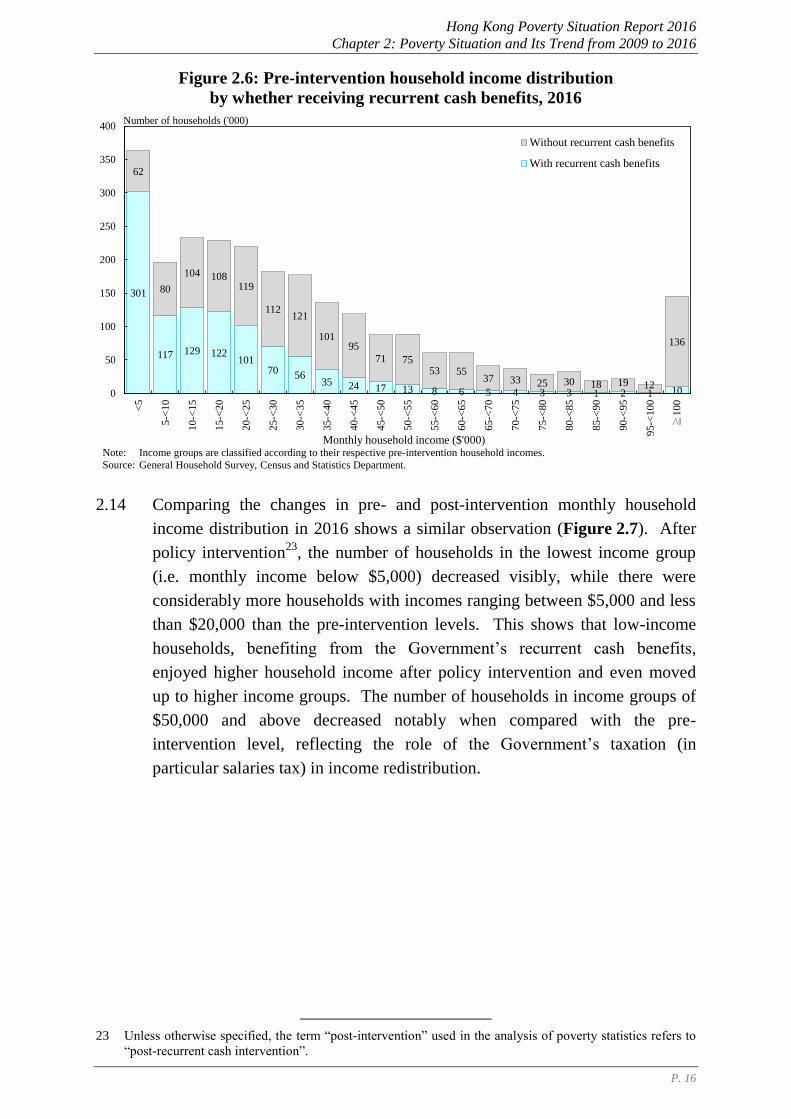
Hong Kong Poverty Situation Report 2016
Chapter 2: Poverty Situation and Its Trend from 2009 to 2016
P. 16
Figure 2.6: Pre-intervention household income distribution
by whether receiving recurrent cash benefits, 2016
2.14 Comparing the changes in pre- and post-intervention monthly household
income distribution in 2016 shows a similar observation (Figure 2.7). After
policy intervention23
, the number of households in the lowest income group
(i.e. monthly income below $5,000) decreased visibly, while there were
considerably more households with incomes ranging between $5,000 and less
than $20,000 than the pre-intervention levels. This shows that low-income
households, benefiting from the Government’s recurrent cash benefits,
enjoyed higher household income after policy intervention and even moved
up to higher income groups. The number of households in income groups of
$50,000 and above decreased notably when compared with the pre-
intervention level, reflecting the role of the Government’s taxation (in
particular salaries tax) in income redistribution.
23 Unless otherwise specified, the term “post-intervention” used in the analysis of poverty statistics refers to
“post-recurrent cash intervention”.
301
117 129 122 101
70 56
35 24 17 13 8 6 5 4 3 3 1 2 1 10
62
80
104 108 119
112 121
101 95
71 75 53 55
37 33 25 30 18 19 12
136
0
50
100
150
200
250
300
350
400<
5
5-<
10
10
-<1
5
15
-<2
0
20
-<2
5
25
-<3
0
30
-<3
5
35
-<4
0
40
-<4
5
45
-<5
0
50
-<5
5
55
-<6
0
60
-<6
5
65
-<7
0
70
-<7
5
75
-<8
0
80
-<8
5
85
-<9
0
90
-<9
5
95
-<1
00
≧1
00
Without recurrent cash benefits
With recurrent cash benefits
Monthly household income ($'000)
Number of households ('000)
Note:
Source:
Income groups are classified according to their respective pre-intervention household incomes.
General Household Survey, Census and Statistics Department.
Hong Kong Poverty Situation Report 2016
Chapter 2: Poverty Situation and Its Trend from 2009 to 2016
P. 17
Figure 2.7: Pre- and post-intervention household income distribution, 2016
2.III The Poverty Line
2.15 As mentioned above, on the back of moderate economic growth and a largely
stable labour market, grassroots workers enjoyed further earnings growth in
2016. Against this backdrop, the median household income as well as the
poverty line thresholds24
set on the basis of the concept of “relative poverty”
saw across-the-board increases, which were somewhat slower than those in
the preceding year but still higher than inflation. The poverty line thresholds
of various household sizes recorded increases of around 3-7%25
respectively
(Figure 2.8)26
.
24 There are views that in addition to the poverty line at 50% of the median household income, multiple
poverty lines should be set, e.g. at 60% of the median, to better examine the households at different levels
of poverty risk. Box 3.3 analyses the at-risk-of-poverty situation of households with incomes below 60%
of the pre-intervention median household income, and their socio-economic characteristics.
25 The annual changes in poverty line thresholds are calculated based on unrounded figures.
26 Even though a significant proportion of singleton households was retired elders, the continuous increase in
labour force participation rate of singleton households with household incomes below the median as well
as the wage growth of grassroots workers pushed up the poverty line threshold of these households for the
second consecutive year.
0
50
100
150
200
250
300
350
400
<5
5-<
10
10
-<1
5
15
-<2
0
20
-<2
5
25
-<3
0
30
-<3
5
35-<
40
40
-<4
5
45
-<5
0
50
-<5
5
55
-<6
0
60
-<6
5
65
-<7
0
70
-<7
5
75
-<8
0
80
-<8
5
85
-<9
0
90
-<9
5
95
-<1
00
≧1
00
Pre-intervention
Post-intervention (recurrent cash)
Source: General Household Survey, Census and Statistics Department.
Monthly household income ($'000)
Median household income
Pre-intervention: $25,000
Post-intervention (recurrent cash): $24,900
Number of households ('000)
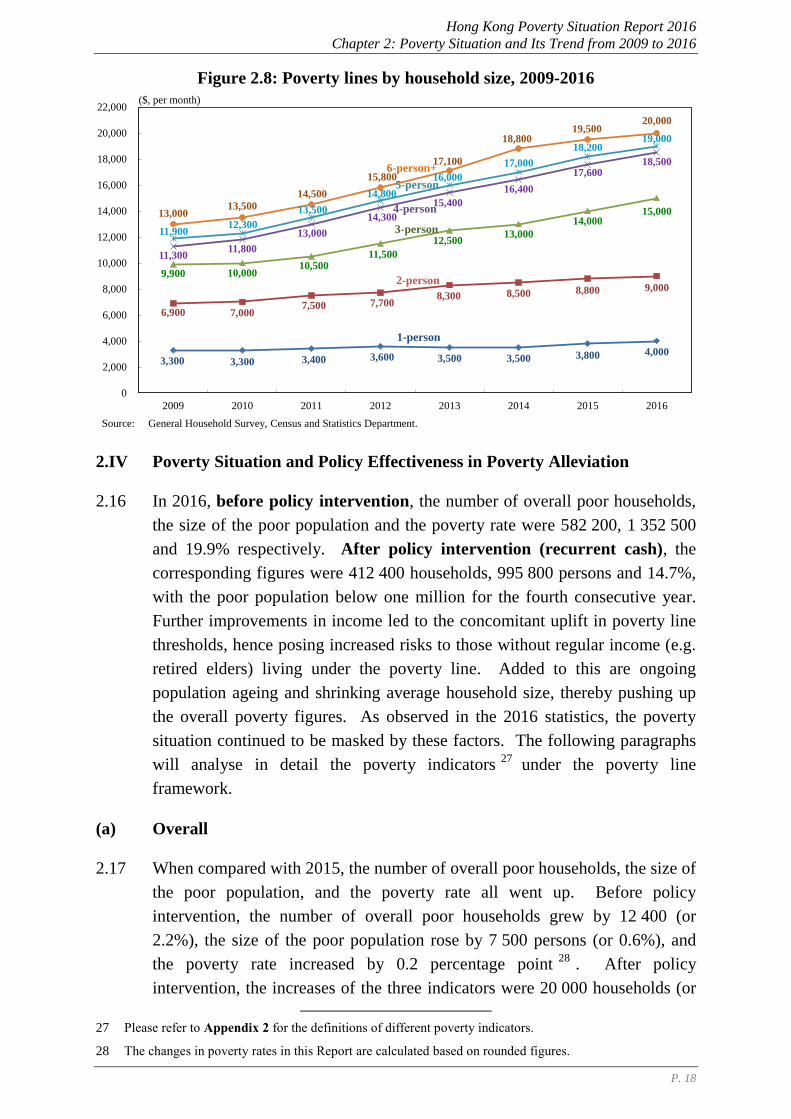
Hong Kong Poverty Situation Report 2016
Chapter 2: Poverty Situation and Its Trend from 2009 to 2016
P. 18
Figure 2.8: Poverty lines by household size, 2009-2016
2.IV Poverty Situation and Policy Effectiveness in Poverty Alleviation
2.16 In 2016, before policy intervention, the number of overall poor households,
the size of the poor population and the poverty rate were 582 200, 1 352 500
and 19.9% respectively. After policy intervention (recurrent cash), the
corresponding figures were 412 400 households, 995 800 persons and 14.7%,
with the poor population below one million for the fourth consecutive year.
Further improvements in income led to the concomitant uplift in poverty line
thresholds, hence posing increased risks to those without regular income (e.g.
retired elders) living under the poverty line. Added to this are ongoing
population ageing and shrinking average household size, thereby pushing up
the overall poverty figures. As observed in the 2016 statistics, the poverty
situation continued to be masked by these factors. The following paragraphs
will analyse in detail the poverty indicators27
under the poverty line
framework.
(a) Overall
2.17 When compared with 2015, the number of overall poor households, the size of
the poor population, and the poverty rate all went up. Before policy
intervention, the number of overall poor households grew by 12 400 (or
2.2%), the size of the poor population rose by 7 500 persons (or 0.6%), and
the poverty rate increased by 0.2 percentage point28
. After policy
intervention, the increases of the three indicators were 20 000 households (or
27 Please refer to Appendix 2 for the definitions of different poverty indicators.
28 The changes in poverty rates in this Report are calculated based on rounded figures.
3,300 3,300 3,400 3,600 3,500 3,500 3,800 4,000
6,900 7,000 7,500 7,700
8,300 8,500 8,800 9,000
9,900 10,000 10,500
11,500
12,500 13,000
14,000 15,000
11,300 11,800
13,000
14,300
15,400
16,400
17,600 18,500
11,900 12,300
13,500
14,800
16,000
17,000
18,200 19,000
13,000 13,500
14,500
15,800
17,100
18,800 19,500
20,000
0
2,000
4,000
6,000
8,000
10,000
12,000
14,000
16,000
18,000
20,000
22,000
2009 2010 2011 2012 2013 2014 2015 2016
Source: General Household Survey, Census and Statistics Department.
($, per month)
1-person
3-person
4-person
5-person
6-person+
2-person
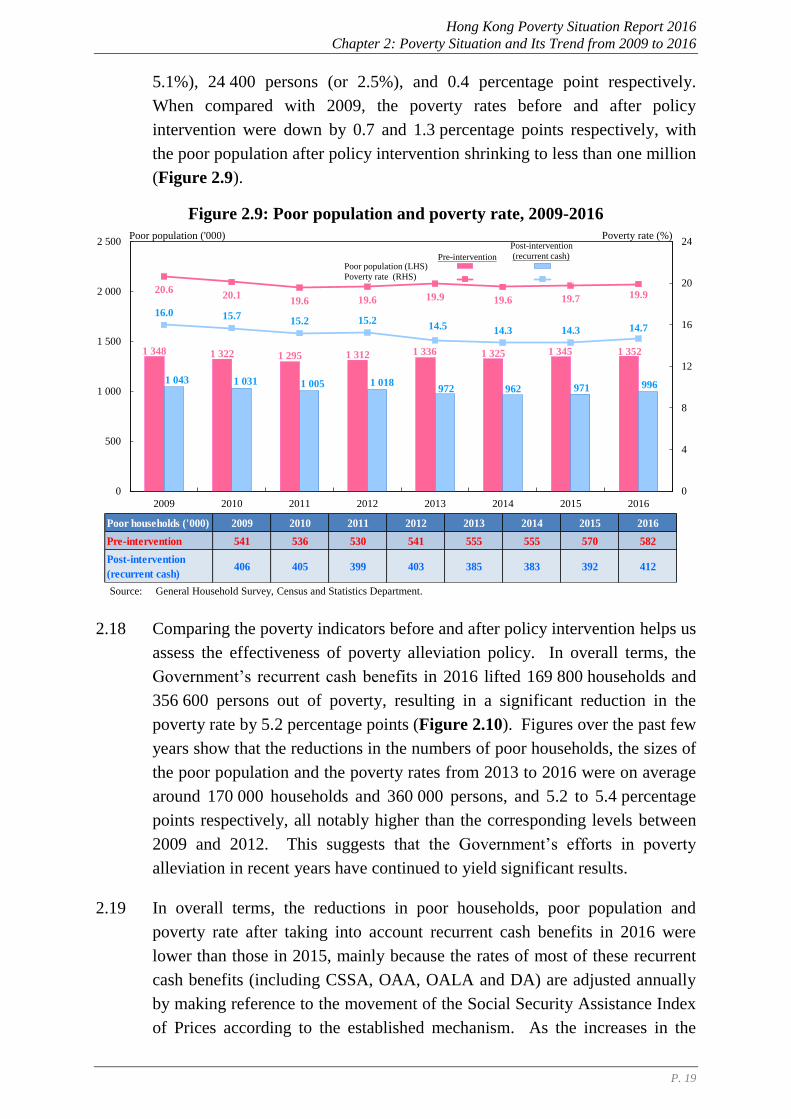
Hong Kong Poverty Situation Report 2016
Chapter 2: Poverty Situation and Its Trend from 2009 to 2016
P. 19
5.1%), 24 400 persons (or 2.5%), and 0.4 percentage point respectively.
When compared with 2009, the poverty rates before and after policy
intervention were down by 0.7 and 1.3 percentage points respectively, with
the poor population after policy intervention shrinking to less than one million
(Figure 2.9).
Figure 2.9: Poor population and poverty rate, 2009-2016
2.18 Comparing the poverty indicators before and after policy intervention helps us
assess the effectiveness of poverty alleviation policy. In overall terms, the
Government’s recurrent cash benefits in 2016 lifted 169 800 households and
356 600 persons out of poverty, resulting in a significant reduction in the
poverty rate by 5.2 percentage points (Figure 2.10). Figures over the past few
years show that the reductions in the numbers of poor households, the sizes of
the poor population and the poverty rates from 2013 to 2016 were on average
around 170 000 households and 360 000 persons, and 5.2 to 5.4 percentage
points respectively, all notably higher than the corresponding levels between
2009 and 2012. This suggests that the Government’s efforts in poverty
alleviation in recent years have continued to yield significant results.
2.19 In overall terms, the reductions in poor households, poor population and
poverty rate after taking into account recurrent cash benefits in 2016 were
lower than those in 2015, mainly because the rates of most of these recurrent
cash benefits (including CSSA, OAA, OALA and DA) are adjusted annually
by making reference to the movement of the Social Security Assistance Index
of Prices according to the established mechanism. As the increases in the
1 348 1 322 1 295 1 312 1 336 1 325 1 345 1 352
1 043 1 031 1 005 1 018972 962 971 996
20.620.1
19.6 19.6 19.9 19.6 19.7 19.9
16.0 15.715.2 15.2
14.5 14.3 14.3 14.7
0
4
8
12
16
20
24
0
500
1 000
1 500
2 000
2 500
2009 2010 2011 2012 2013 2014 2015 2016
數列2 數列1數列3 數列4
Source: General Household Survey, Census and Statistics Department.
Poor population ('000) Poverty rate (%)
Poor population (LHS)
Poverty rate (RHS)
Pre-intervention
Post-intervention
(recurrent cash)
Poor households ('000) 2009 2010 2011 2012 2013 2014 2015 2016
Pre-intervention 541 536 530 541 555 555 570 582
Post-intervention
(recurrent cash)406 405 399 403 385 383 392 412
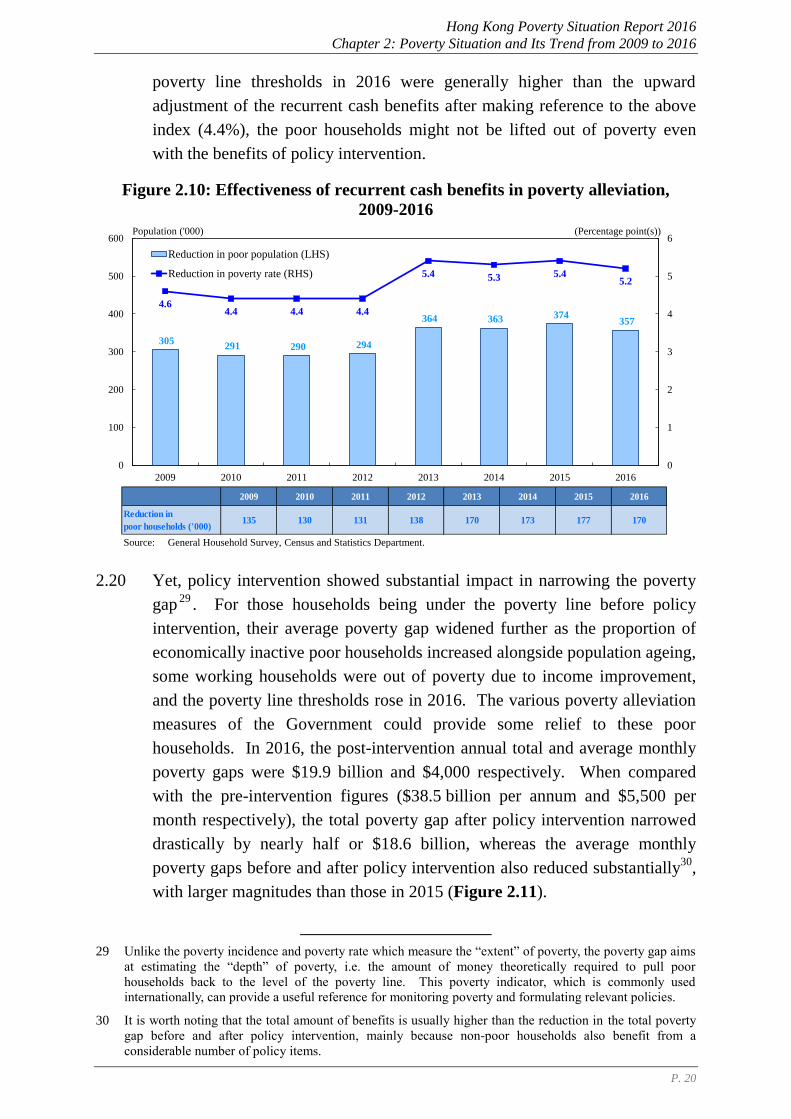
Hong Kong Poverty Situation Report 2016
Chapter 2: Poverty Situation and Its Trend from 2009 to 2016
P. 20
poverty line thresholds in 2016 were generally higher than the upward
adjustment of the recurrent cash benefits after making reference to the above
index (4.4%), the poor households might not be lifted out of poverty even
with the benefits of policy intervention.
Figure 2.10: Effectiveness of recurrent cash benefits in poverty alleviation,
2009-2016
2.20 Yet, policy intervention showed substantial impact in narrowing the poverty
gap29
. For those households being under the poverty line before policy
intervention, their average poverty gap widened further as the proportion of
economically inactive poor households increased alongside population ageing,
some working households were out of poverty due to income improvement,
and the poverty line thresholds rose in 2016. The various poverty alleviation
measures of the Government could provide some relief to these poor
households. In 2016, the post-intervention annual total and average monthly
poverty gaps were $19.9 billion and $4,000 respectively. When compared
with the pre-intervention figures ($38.5 billion per annum and $5,500 per
month respectively), the total poverty gap after policy intervention narrowed
drastically by nearly half or $18.6 billion, whereas the average monthly
poverty gaps before and after policy intervention also reduced substantially30
,
with larger magnitudes than those in 2015 (Figure 2.11).
29 Unlike the poverty incidence and poverty rate which measure the “extent” of poverty, the poverty gap aims
at estimating the “depth” of poverty, i.e. the amount of money theoretically required to pull poor
households back to the level of the poverty line. This poverty indicator, which is commonly used
internationally, can provide a useful reference for monitoring poverty and formulating relevant policies.
30 It is worth noting that the total amount of benefits is usually higher than the reduction in the total poverty
gap before and after policy intervention, mainly because non-poor households also benefit from a
considerable number of policy items.
305291 290 294
364 363 374357
4.6 4.4 4.4 4.4
5.4 5.3 5.4 5.2
0
1
2
3
4
5
6
0
100
200
300
400
500
600
2009 2010 2011 2012 2013 2014 2015 2016
Reduction in poor population (LHS)
Reduction in poverty rate (RHS)
Source: General Household Survey, Census and Statistics Department.
Population ('000) (Percentage point(s))
2009 2010 2011 2012 2013 2014 2015 2016
Reduction in
poor households ('000)135 130 131 138 170 173 177 170
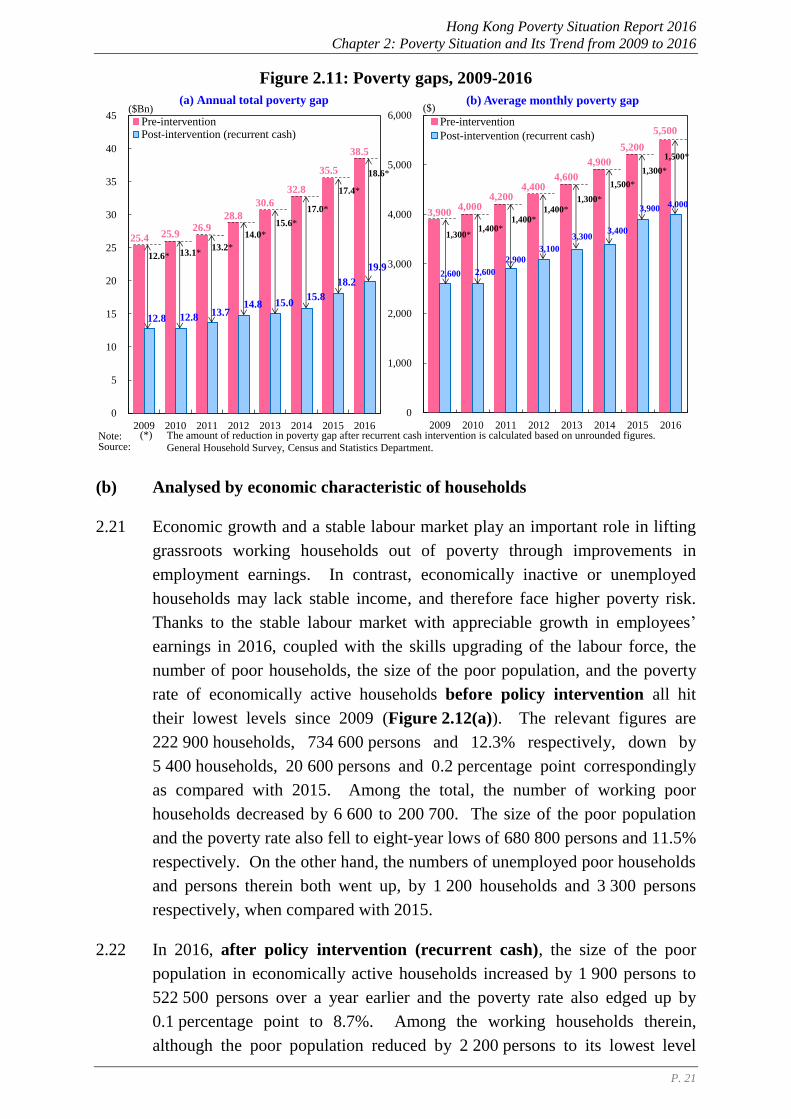
Hong Kong Poverty Situation Report 2016
Chapter 2: Poverty Situation and Its Trend from 2009 to 2016
P. 21
Figure 2.11: Poverty gaps, 2009-2016
(b) Analysed by economic characteristic of households
2.21 Economic growth and a stable labour market play an important role in lifting
grassroots working households out of poverty through improvements in
employment earnings. In contrast, economically inactive or unemployed
households may lack stable income, and therefore face higher poverty risk.
Thanks to the stable labour market with appreciable growth in employees’
earnings in 2016, coupled with the skills upgrading of the labour force, the
number of poor households, the size of the poor population, and the poverty
rate of economically active households before policy intervention all hit
their lowest levels since 2009 (Figure 2.12(a)). The relevant figures are
222 900 households, 734 600 persons and 12.3% respectively, down by
5 400 households, 20 600 persons and 0.2 percentage point correspondingly
as compared with 2015. Among the total, the number of working poor
households decreased by 6 600 to 200 700. The size of the poor population
and the poverty rate also fell to eight-year lows of 680 800 persons and 11.5%
respectively. On the other hand, the numbers of unemployed poor households
and persons therein both went up, by 1 200 households and 3 300 persons
respectively, when compared with 2015.
2.22 In 2016, after policy intervention (recurrent cash), the size of the poor
population in economically active households increased by 1 900 persons to
522 500 persons over a year earlier and the poverty rate also edged up by
0.1 percentage point to 8.7%. Among the working households therein,
although the poor population reduced by 2 200 persons to its lowest level
25.4 25.9 26.9
28.8
30.6
32.8
35.5
38.5
12.8 12.8 13.7
14.8 15.0 15.8
18.2
19.9
0
5
10
15
20
25
30
35
40
45
2009 2010 2011 2012 2013 2014 2015 2016
Pre-interventionPost-intervention (recurrent cash)
3,9004,000
4,2004,400
4,600
4,900
5,200
5,500
2,600 2,600
2,900
3,100
3,300 3,400
3,900 4,000
0
1,000
2,000
3,000
4,000
5,000
6,000
2009 2010 2011 2012 2013 2014 2015 2016
(b) Average monthly poverty gap
Pre-intervention
Post-intervention (recurrent cash)
($)
1,300*
1,400*1,400*
1,300*
1,400*
1,500*
1,300*
1,500*
($Bn)(a) Annual total poverty gap
12.6* 13.1*
14.0*
15.6*
13.2*
Note: Source:
(*) The amount of reduction in poverty gap after recurrent cash intervention is calculated based on unrounded figures.
General Household Survey, Census and Statistics Department.
17.0*
17.4*
18.6*
Hong Kong Poverty Situation Report 2016
Chapter 2: Poverty Situation and Its Trend from 2009 to 2016
P. 22
since the poverty statistics became available, the reduction still failed to offset
the rise of poor population in unemployed households (4 100 persons).
Comparing the pre- and post-intervention poverty statistics, recurrent cash
benefits in 2016 lifted 212 100 persons in economically active households out
of poverty, bringing down the poverty rate by 3.6 percentage points. Both
figures, however, were slightly lower than those in 2015 (234 600 persons and
3.9 percentage points respectively). This was mainly because most of the
poor population in working households had already been lifted out of poverty
through employment before policy intervention. The proportions of poor
households and persons therein benefiting from policy intervention were also
lower than those in the previous year.
Figure 2.12: Poor population and poverty rate by economic characteristic of
households, 2009-2016
2.23 Economically inactive households had a much higher poverty rate than that of
economically active households (Figure 2.12(b)) as its poverty situation was
mainly subject to the impact of population ageing. The number of poor
persons in these households increased by 28 100 before policy intervention
as compared with 2015 (Table 2.2), among which about 70%
(19 500 persons) were elders aged 65 and above. The poverty rate rose by 1.2
percentage points to 77.3%. After policy intervention, the size of the poor
population was 473 300 persons, up by 22 500 persons from the 2015 level,
likewise due to more poor elders therein (24 200 persons). The poverty rate
also rose by 1.0 percentage point to 59.2%. The above suggests that along
with population ageing and increasingly more retired elderly households, both
829779 753 763 789 759 755 735
634 601569 584 564 537 521 523
14.1 13.2
12.7 12.8 13.1 12.6 12.5 12.3
10.8 10.2
9.6 9.8 9.4
8.9 8.6 8.7
0
2
4
6
8
10
12
14
16
0
200
400
600
800
1 000
1 200
1 400
1 600
2009 2010 2011 2012 2013 2014 2015 2016
數列3 數列2數列4 數列1
519 543 542 549 547 566 590 618
409 430 437 434 408 425 451 473
62.2 61.5 62.7 61.2 58.2 57.6 58.2 59.2
78.9 77.7 77.9 77.4 78.1 76.6 76.1 77.3
0
10
20
30
40
50
60
70
80
90
0
200
400
600
800
1 000
1 200
1 400
1 600
2009 2010 2011 2012 2013 2014 2015 2016
(b) Economically inactive households
Poverty rate (%)Poor population ('000)
Source: General Household Survey, Census and Statistics Department.
(a) Economically active households
Poverty rate (%)Poor population ('000)
Pre-intervention
Post-intervention
(recurrent cash)Poor population (LHS)
Poverty rate (RHS)
Poor households ('000) 2009 2010 2011 2012 2013 2014 2015 2016
Pre-intervention 253 233 225 230 241 230 228 223
Post-intervention
(recurrent cash)194 181 169 175 173 164 159 163
Share within overall population (%) 2009 2010 2011 2012 2013 2014 2015 2016
Persons in economiccally inactive
households10.1 10.6 10.5 10.6 10.5 10.9 11.4 11.8
Poor households ('000) 2009 2010 2011 2012 2013 2014 2015 2016
Pre-intervention 288 302 305 311 314 325 341 359
Post-intervention
(Recurrent cash)213 224 229 228 211 218 234 249
Hong Kong Poverty Situation Report 2016
Chapter 2: Poverty Situation and Its Trend from 2009 to 2016
P. 23
the numbers of economically inactive poor households and the persons therein
increased before and after policy intervention.
Table 2.2: Pre- and post-intervention poor households and population
and their annual changes by economic characteristic of households, 2016
Poor households ('000) Poor population ('000)
2015 2016 Annual
change@
Change
compared
with 2009@
2015 2016 Annual
change@
Change
compared
with 2009@
Pre-intervention
Economically active
households 228.3 222.9 -5.4 -29.7 755.2 734.6 -20.6 -94.8
Working households 207.3 200.7 -6.6 -12.5 704.7 680.8 -23.9 -44.4
Unemployed households 21.0 22.2 +1.2 -17.3 50.5 53.8 +3.3 -50.3
Economically inactive
households 341.5 359.3 +17.8 +70.8 589.8 617.9 +28.1 +98.8
Overall 569.8 582.2 +12.4 +41.1 1 345.0 1 352.5 +7.5 +4.1
Post-intervention (recurrent cash)
Economically active
households 158.7 163.0 +4.3 -30.7 520.6 522.5 +1.9 -111.7
Working households 141.1 143.9 +2.8 -16.5 477.4 475.2 -2.2 -68.1
Unemployed households 17.6 19.1 +1.5 -14.2 43.2 47.3 +4.1 -43.6
Economically inactive
households 233.6 249.3 +15.7 +36.8 450.8 473.3 +22.5 +64.1
Overall 392.4 412.4 +20.0 +6.1 971.4 995.8 +24.4 -47.5
Note: (@) Changes are computed based on unrounded figures.
Source: General Household Survey, Census and Statistics Department.
2.24 The effectiveness of poverty alleviation policies was more visible in
economically inactive households as the shares of poor households and
persons covered by policy intervention therein were higher than those in
economically active households. In 2016, 144 600 persons in economically
inactive households were lifted out of poverty as a result of recurrent cash
benefits, with a reduction in poverty rate as high as 18.1 percentage points.
Both figures were higher than those in 2015 (139 000 persons and
17.9 percentage points respectively). Analysing the policy effectiveness in
terms of poverty gap gave similar observations. Recurrent cash benefits
helped narrow the total poverty gap in 2016 by $18.6 billion, with around
70% of this reduction ($13.0 billion) attributable to economically inactive
households below the poverty line before policy intervention (Figure 2.13).
Hong Kong Poverty Situation Report 2016
Chapter 2: Poverty Situation and Its Trend from 2009 to 2016
P. 24
Figure 2.13: Annual total poverty gap by economic characteristic of households,
2009-2016
2.25 In sum, the size of poor population in working households declined further in
2016. However, with the notable increase of 22 500 poor persons in
economically inactive households as well as the additional 4 100 poor persons
in unemployed households, the size of the overall poor population (after
policy intervention) increased by 24 400 persons in 2016 as compared with
2015. These figures show that while employment status has a certain bearing
on household income, the structural uptrend in the number of retired elders
amid population ageing continues to exert upward pressure on the poverty
indicators, which are defined solely by income.
2.26 As revealed by the poverty statistics in the past eight years, the size of the
poor population in both working and unemployed households registered
substantial cumulative declines, while only that of economically inactive
households stayed on the rise. These starkly opposite movements highlight
the counteracting impacts of employment and population ageing on poverty
figures.
(c) Poverty alleviation effectiveness of selected recurrent cash benefits
2.27 Meanwhile, the Government has been providing some assistance to the
livelihood of the grassroots through various recurrent cash benefits. In 2016,
the poverty situation after policy intervention improved markedly over the
pre-intervention situation. Recurrent cash policies successfully lifted
169 800 households (356 600 persons) out of poverty, with the poverty rate
9.9 9.3 9.3
9.8 10.8 11.2
11.7 12.6
6.0 5.4 5.4
5.8 5.9 5.8 6.3
7.0
0
2
4
6
8
10
12
14
16
18
20
22
24
26
28
2009 2010 2011 2012 2013 2014 2015 2016
Pre-intervention
Post-intervention (recurrent cash)
15.5 16.6
17.6
19.0 19.8
21.6
23.8
25.9
6.8 7.4
8.3 9.0 9.1
10.0
11.8 12.9
0
2
4
6
8
10
12
14
16
18
20
22
24
26
28
2009 2010 2011 2012 2013 2014 2015 2016
Pre-intervention
Post-intervention (recurrent cash)
8.7*
(69%)
9.2*
(70%)
9.3*
(70%)
10.0*
(72%)
($Bn)(b) Economically inactive households
11.6*
(68%)
12.0*
(69%)
13.0*
(70%)
4.0*
(31%)3.9*
(30%)3.9*
(30%)
4.0*
(28%)
4.9*
(32%)
10.7*
(68%)
Notes: (*)( )
The amount of reduction in total poverty gap after recurrent cash intervention is calculated based on unrounded figures.
Figures in parentheses denote the shares in total reductions.
General Household Survey, Census and Statistics Department.
($Bn)(a) Economically active households
Source:
5.4*
(32%)
5.3*
(31%)
5.6*
(30%)
Hong Kong Poverty Situation Report 2016
Chapter 2: Poverty Situation and Its Trend from 2009 to 2016
P. 25
reduced by 5.2 percentage points. Among the various recurrent cash benefits,
CSSA remained the most effective poverty alleviation measure, lifting some
106 500 beneficiary households (189 100 persons) out of poverty and
reducing the overall poverty rate by 2.8 percentage points after policy
intervention. With its effectiveness second only to CSSA, OALA yielded
pronounced results in poverty alleviation as well, lifting 48 800 households
and 103 300 persons (including 69 100 elders and 34 200 family members
residing with them) out of poverty and lowering the overall poverty rate by
1.5 percentage points. Education benefits also lowered the overall poverty
rate, by 0.8 percentage point. As for LIFA, launched in 2016, it also lifted
around 5 600 beneficiary households (22 900 persons) out of poverty, with the
overall poverty rate reduced by 0.3 percentage point (Figure 2.14).
Figure 2.14: Effectiveness of selected recurrent cash benefits
in poverty alleviation, 2016
2.28 Compared with 2015, some of the recurrent cash benefits brought smaller
reductions in poor population and poverty rate. Apart from the difference in
pace between adjusting most recurrent cash benefits and the uplift of poverty
line thresholds, this was also attributable to the distinct circumstances of
individual items. For instance, alongside a persistent decline in the overall
number of CSSA beneficiaries in recent years, the size of poor population
lifted out of poverty owing to CSSA decreased, but the reduction in the
poverty rate was largely comparable to that in 2015. Although the overall
number of poor elders receiving OALA increased, the rise was mainly from
persons living alone or with only one family member and those residing in
economically inactive households, whose income was generally low.
189
103
56
23 22 24
1
357
2.8
1.5
0.80.3 0.3 0.3 @
5.2
0
1
2
3
4
5
6
7
0
50
100
150
200
250
300
350
400
CSSA OALA Education
benefits
LIFA OAA DA WITS All recurrent
cash benefits
Reduction in poor population (LHS)
Reduction in poverty rate (RHS)
Population ('000) (Percentage point(s))
Note: (@)
Source:
Less than 0.05 percentage point.
General Household Survey, Census and Statistics Department.
CSSA OALA Education benefits LIFA OAA DA WITS All recurrent cash benefits
Reduction in poor
households ('000)107 49 15 6 10 8 1 170
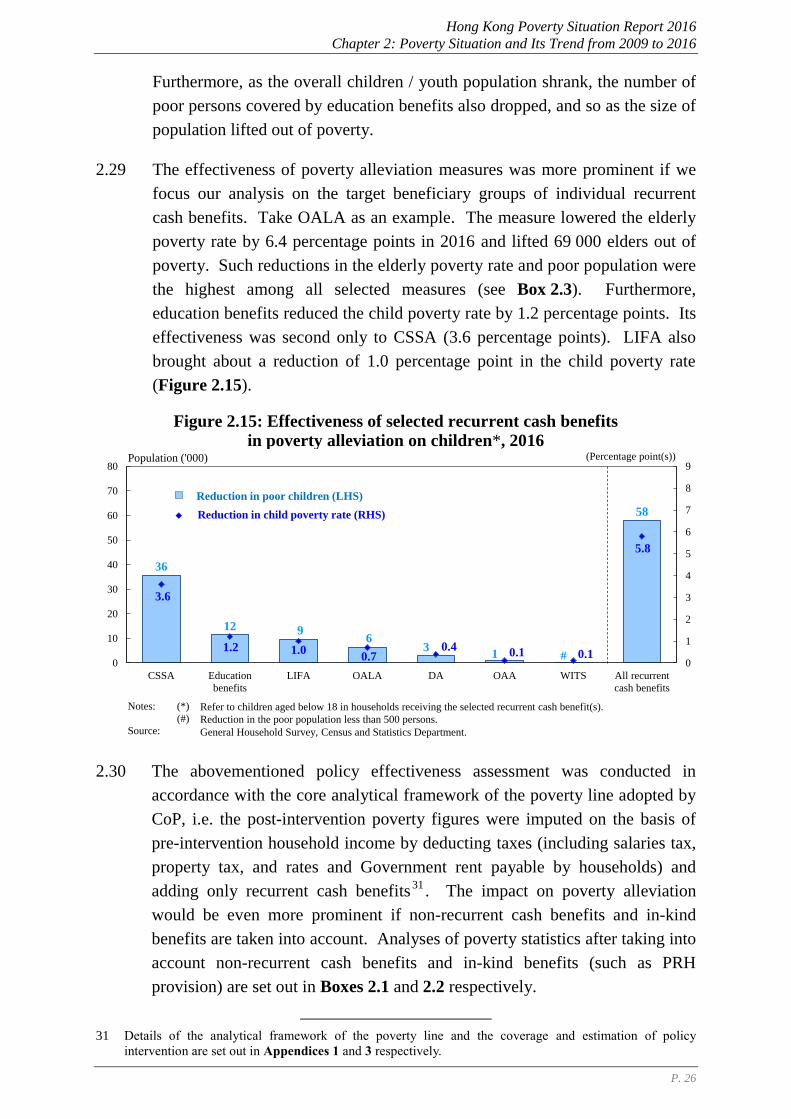
Hong Kong Poverty Situation Report 2016
Chapter 2: Poverty Situation and Its Trend from 2009 to 2016
P. 26
Furthermore, as the overall children / youth population shrank, the number of
poor persons covered by education benefits also dropped, and so as the size of
population lifted out of poverty.
2.29 The effectiveness of poverty alleviation measures was more prominent if we
focus our analysis on the target beneficiary groups of individual recurrent
cash benefits. Take OALA as an example. The measure lowered the elderly
poverty rate by 6.4 percentage points in 2016 and lifted 69 000 elders out of
poverty. Such reductions in the elderly poverty rate and poor population were
the highest among all selected measures (see Box 2.3). Furthermore,
education benefits reduced the child poverty rate by 1.2 percentage points. Its
effectiveness was second only to CSSA (3.6 percentage points). LIFA also
brought about a reduction of 1.0 percentage point in the child poverty rate
(Figure 2.15).
Figure 2.15: Effectiveness of selected recurrent cash benefits
in poverty alleviation on children*, 2016
2.30 The abovementioned policy effectiveness assessment was conducted in
accordance with the core analytical framework of the poverty line adopted by
CoP, i.e. the post-intervention poverty figures were imputed on the basis of
pre-intervention household income by deducting taxes (including salaries tax,
property tax, and rates and Government rent payable by households) and
adding only recurrent cash benefits31
. The impact on poverty alleviation
would be even more prominent if non-recurrent cash benefits and in-kind
benefits are taken into account. Analyses of poverty statistics after taking into
account non-recurrent cash benefits and in-kind benefits (such as PRH
provision) are set out in Boxes 2.1 and 2.2 respectively.
31 Details of the analytical framework of the poverty line and the coverage and estimation of policy
intervention are set out in Appendices 1 and 3 respectively.
36
12 9 6
3 1 #
58
3.6
1.2 1.0 0.7
0.4 0.1 0.1
5.8
0
1
2
3
4
5
6
7
8
9
0
10
20
30
40
50
60
70
80
CSSA Education
benefits
LIFA OALA DA OAA WITS All recurrent
cash benefits
Population ('000) (Percentage point(s))
Reduction in poor children (LHS)
Reduction in child poverty rate (RHS)
2016年選定恆常現金項目對兒童*的扶貧成效
Notes: (*)
Source:
Refer to children aged below 18 in households receiving the selected recurrent cash benefit(s).
Reduction in the poor population less than 500 persons.
General Household Survey, Census and Statistics Department.
(#)
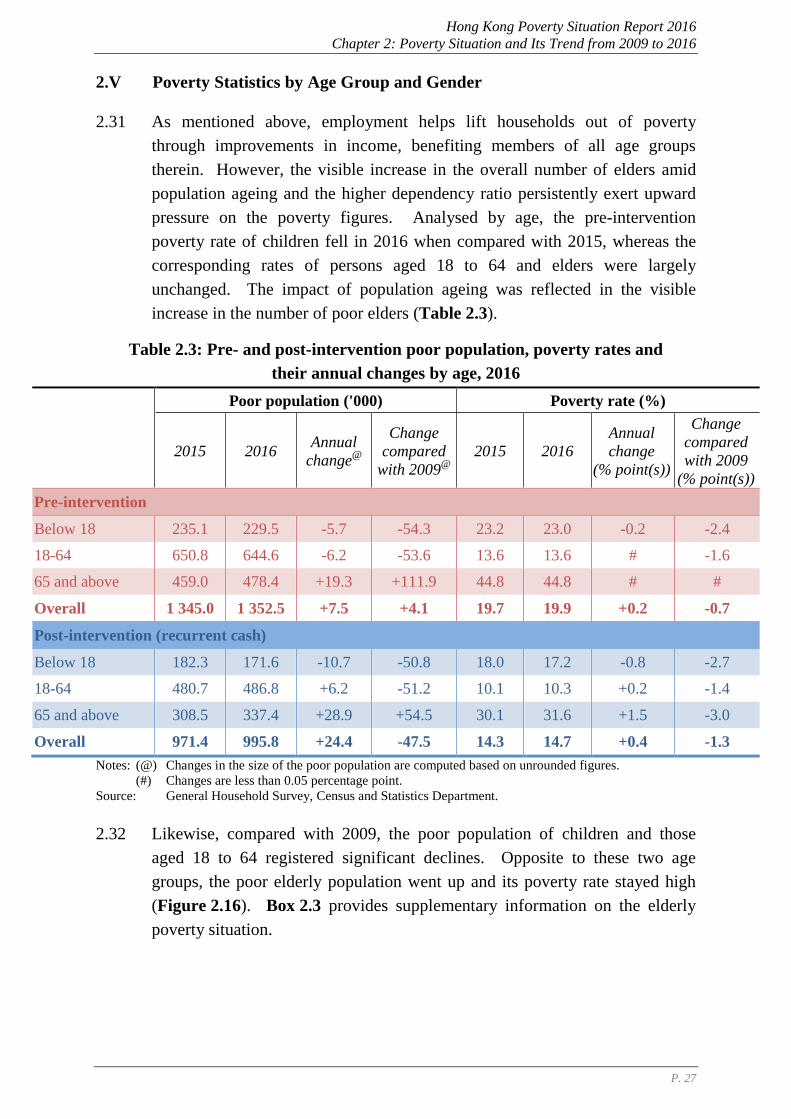
Hong Kong Poverty Situation Report 2016
Chapter 2: Poverty Situation and Its Trend from 2009 to 2016
P. 27
2.V Poverty Statistics by Age Group and Gender
2.31 As mentioned above, employment helps lift households out of poverty
through improvements in income, benefiting members of all age groups
therein. However, the visible increase in the overall number of elders amid
population ageing and the higher dependency ratio persistently exert upward
pressure on the poverty figures. Analysed by age, the pre-intervention
poverty rate of children fell in 2016 when compared with 2015, whereas the
corresponding rates of persons aged 18 to 64 and elders were largely
unchanged. The impact of population ageing was reflected in the visible
increase in the number of poor elders (Table 2.3).
Table 2.3: Pre- and post-intervention poor population, poverty rates and
their annual changes by age, 2016
Poor population ('000) Poverty rate (%)
2015 2016 Annual
change@
Change
compared
with 2009@
2015 2016
Annual
change
(% point(s))
Change
compared
with 2009
(% point(s))
Pre-intervention
Below 18 235.1 229.5 -5.7 -54.3 23.2 23.0 -0.2 -2.4
18-64 650.8 644.6 -6.2 -53.6 13.6 13.6 # -1.6
65 and above 459.0 478.4 +19.3 +111.9 44.8 44.8 # #
Overall 1 345.0 1 352.5 +7.5 +4.1 19.7 19.9 +0.2 -0.7
Post-intervention (recurrent cash)
Below 18 182.3 171.6 -10.7 -50.8 18.0 17.2 -0.8 -2.7
18-64 480.7 486.8 +6.2 -51.2 10.1 10.3 +0.2 -1.4
65 and above 308.5 337.4 +28.9 +54.5 30.1 31.6 +1.5 -3.0
Overall 971.4 995.8 +24.4 -47.5 14.3 14.7 +0.4 -1.3
Notes: (@) Changes in the size of the poor population are computed based on unrounded figures.
(#) Changes are less than 0.05 percentage point.
Source: General Household Survey, Census and Statistics Department.
2.32 Likewise, compared with 2009, the poor population of children and those
aged 18 to 64 registered significant declines. Opposite to these two age
groups, the poor elderly population went up and its poverty rate stayed high
(Figure 2.16). Box 2.3 provides supplementary information on the elderly
poverty situation.
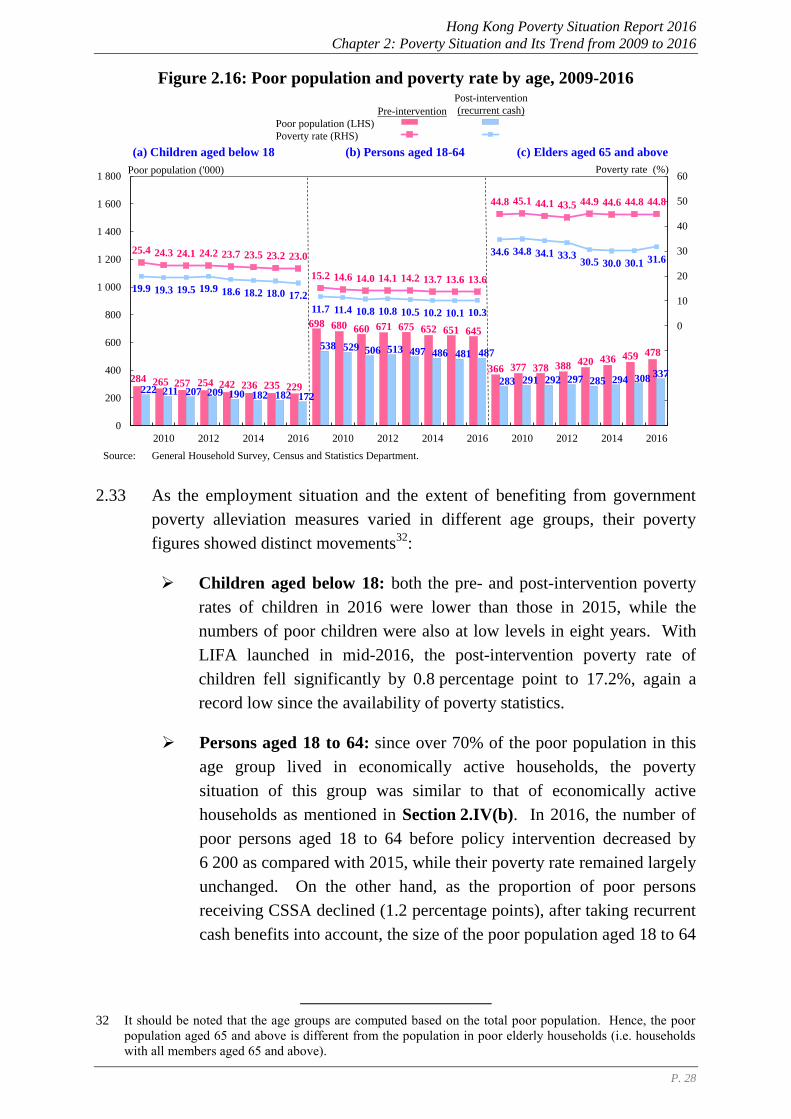
Hong Kong Poverty Situation Report 2016
Chapter 2: Poverty Situation and Its Trend from 2009 to 2016
P. 28
Figure 2.16: Poor population and poverty rate by age, 2009-2016
2.33 As the employment situation and the extent of benefiting from government
poverty alleviation measures varied in different age groups, their poverty
figures showed distinct movements32
:
Children aged below 18: both the pre- and post-intervention poverty
rates of children in 2016 were lower than those in 2015, while the
numbers of poor children were also at low levels in eight years. With
LIFA launched in mid-2016, the post-intervention poverty rate of
children fell significantly by 0.8 percentage point to 17.2%, again a
record low since the availability of poverty statistics.
Persons aged 18 to 64: since over 70% of the poor population in this
age group lived in economically active households, the poverty
situation of this group was similar to that of economically active
households as mentioned in Section 2.IV(b). In 2016, the number of
poor persons aged 18 to 64 before policy intervention decreased by
6 200 as compared with 2015, while their poverty rate remained largely
unchanged. On the other hand, as the proportion of poor persons
receiving CSSA declined (1.2 percentage points), after taking recurrent
cash benefits into account, the size of the poor population aged 18 to 64
32 It should be noted that the age groups are computed based on the total poor population. Hence, the poor
population aged 65 and above is different from the population in poor elderly households (i.e. households
with all members aged 65 and above).
284 265 257 254 242 236 235 229
698 680 660 671 675 652 651 645
366 377 378 388 420 436 459 478
222 211 207 209 190 182 182 172
538 529 506 513 497 486 481 487
283 291 292 297 285 294 308337
25.4 24.3 24.1 24.2 23.7 23.5 23.2 23.0
15.2 14.6 14.0 14.1 14.2 13.7 13.6 13.6
44.8 45.1 44.1 43.5 44.9 44.6 44.8 44.8
19.9 19.3 19.5 19.9 18.6 18.2 18.0 17.2
11.7 11.4 10.8 10.8 10.5 10.2 10.1 10.3
34.6 34.8 34.1 33.330.5 30.0 30.1 31.6
(40)
(30)
(20)
(10)
0
10
20
30
40
50
60
0
200
400
600
800
1 000
1 200
1 400
1 600
1 800
2010 2012 2014 2016 2010 2012 2014 2016 2010 2012 2014 2016
數列3 數列2數列4 數列1
Pre-intervention
Post-intervention
(recurrent cash)
Poor population (LHS)
Poverty rate (RHS)
(a) Children aged below 18 (b) Persons aged 18-64 (c) Elders aged 65 and above
Poor population ('000) Poverty rate (%)
Source: General Household Survey, Census and Statistics Department.
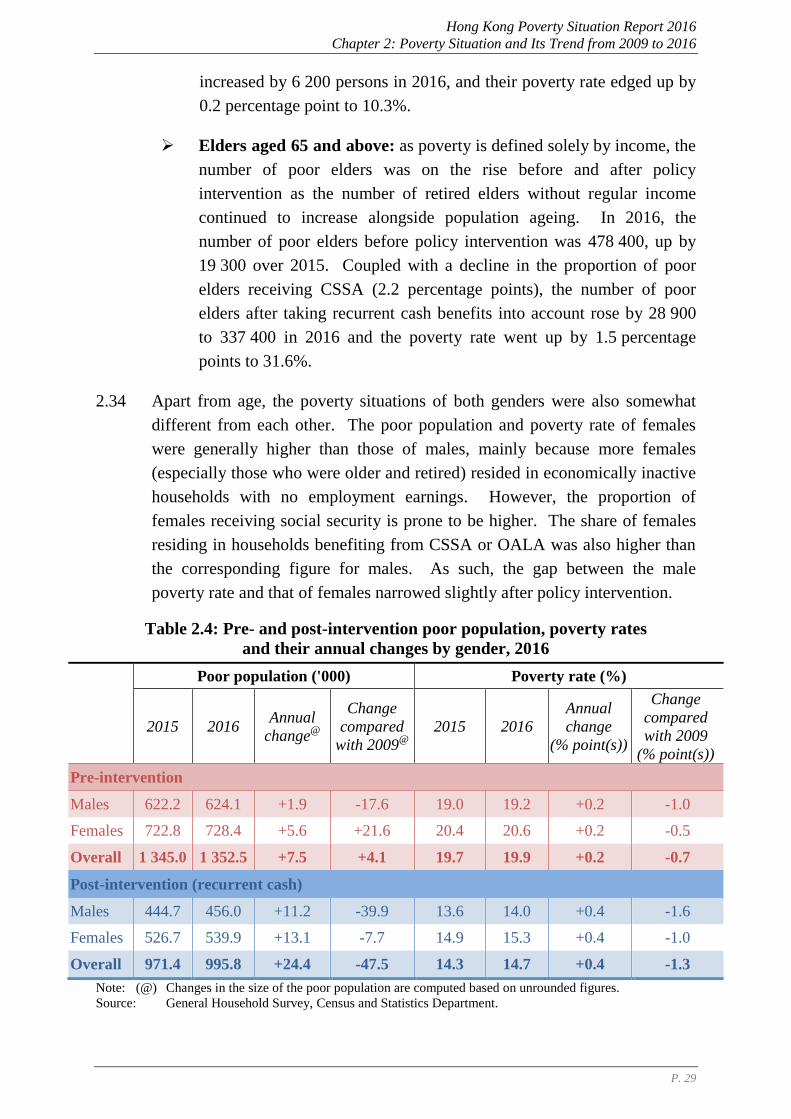
Hong Kong Poverty Situation Report 2016
Chapter 2: Poverty Situation and Its Trend from 2009 to 2016
P. 29
increased by 6 200 persons in 2016, and their poverty rate edged up by
0.2 percentage point to 10.3%.
Elders aged 65 and above: as poverty is defined solely by income, the
number of poor elders was on the rise before and after policy
intervention as the number of retired elders without regular income
continued to increase alongside population ageing. In 2016, the
number of poor elders before policy intervention was 478 400, up by
19 300 over 2015. Coupled with a decline in the proportion of poor
elders receiving CSSA (2.2 percentage points), the number of poor
elders after taking recurrent cash benefits into account rose by 28 900
to 337 400 in 2016 and the poverty rate went up by 1.5 percentage
points to 31.6%.
2.34 Apart from age, the poverty situations of both genders were also somewhat
different from each other. The poor population and poverty rate of females
were generally higher than those of males, mainly because more females
(especially those who were older and retired) resided in economically inactive
households with no employment earnings. However, the proportion of
females receiving social security is prone to be higher. The share of females
residing in households benefiting from CSSA or OALA was also higher than
the corresponding figure for males. As such, the gap between the male
poverty rate and that of females narrowed slightly after policy intervention.
Table 2.4: Pre- and post-intervention poor population, poverty rates
and their annual changes by gender, 2016
Poor population ('000) Poverty rate (%)
2015 2016 Annual
change@
Change
compared
with 2009@
2015 2016
Annual
change
(% point(s))
Change
compared
with 2009
(% point(s))
Pre-intervention
Males 622.2 624.1 +1.9 -17.6 19.0 19.2 +0.2 -1.0
Females 722.8 728.4 +5.6 +21.6 20.4 20.6 +0.2 -0.5
Overall 1 345.0 1 352.5 +7.5 +4.1 19.7 19.9 +0.2 -0.7
Post-intervention (recurrent cash)
Males 444.7 456.0 +11.2 -39.9 13.6 14.0 +0.4 -1.6
Females 526.7 539.9 +13.1 -7.7 14.9 15.3 +0.4 -1.0
Overall 971.4 995.8 +24.4 -47.5 14.3 14.7 +0.4 -1.3
Note: (@) Changes in the size of the poor population are computed based on unrounded figures.
Source: General Household Survey, Census and Statistics Department.
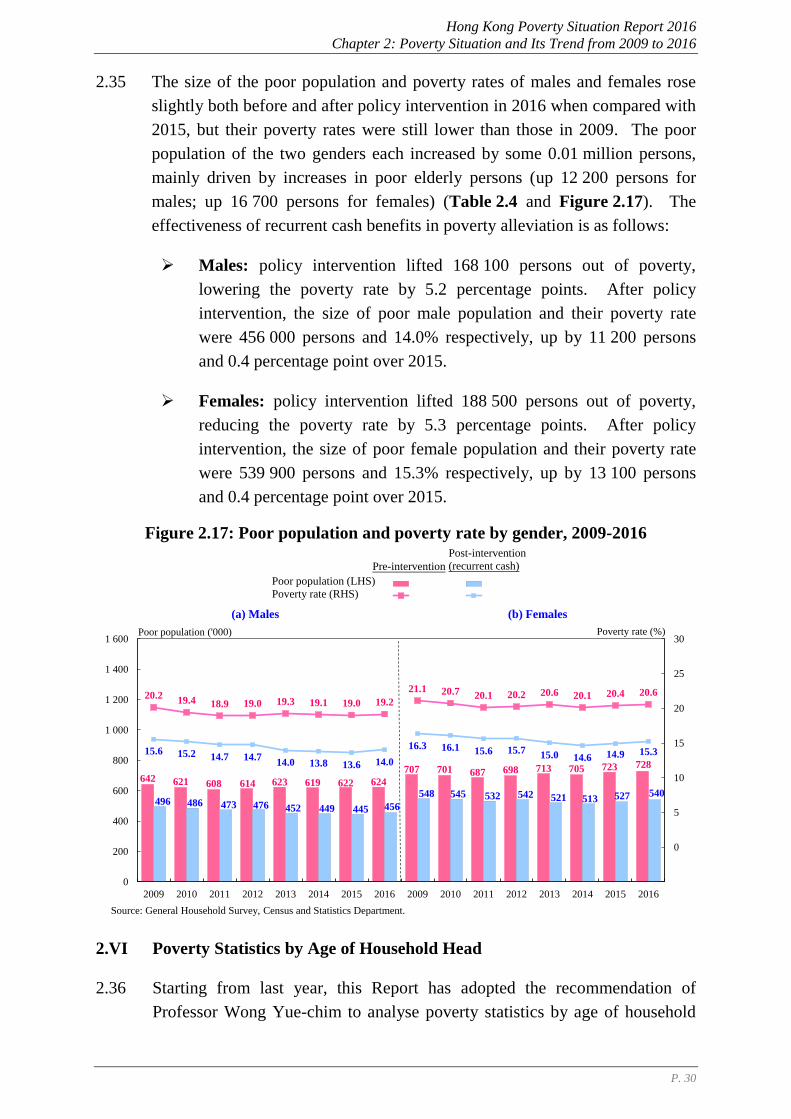
Hong Kong Poverty Situation Report 2016
Chapter 2: Poverty Situation and Its Trend from 2009 to 2016
P. 30
2.35 The size of the poor population and poverty rates of males and females rose
slightly both before and after policy intervention in 2016 when compared with
2015, but their poverty rates were still lower than those in 2009. The poor
population of the two genders each increased by some 0.01 million persons,
mainly driven by increases in poor elderly persons (up 12 200 persons for
males; up 16 700 persons for females) (Table 2.4 and Figure 2.17). The
effectiveness of recurrent cash benefits in poverty alleviation is as follows:
Males: policy intervention lifted 168 100 persons out of poverty,
lowering the poverty rate by 5.2 percentage points. After policy
intervention, the size of poor male population and their poverty rate
were 456 000 persons and 14.0% respectively, up by 11 200 persons
and 0.4 percentage point over 2015.
Females: policy intervention lifted 188 500 persons out of poverty,
reducing the poverty rate by 5.3 percentage points. After policy
intervention, the size of poor female population and their poverty rate
were 539 900 persons and 15.3% respectively, up by 13 100 persons
and 0.4 percentage point over 2015.
Figure 2.17: Poor population and poverty rate by gender, 2009-2016
2.VI Poverty Statistics by Age of Household Head
2.36 Starting from last year, this Report has adopted the recommendation of
Professor Wong Yue-chim to analyse poverty statistics by age of household
642 621 608 614 623 619 622 624
707 701 687 698 713 705 723 728
496 486 473 476 452 449 445 456
548 545 532 542 521 513 527 540
20.219.4 18.9 19.0 19.3 19.1 19.0 19.2
21.1 20.7 20.1 20.2 20.6 20.1 20.4 20.6
15.6 15.2 14.7 14.714.0 13.8 13.6 14.0
16.3 16.1 15.6 15.715.0 14.6 14.9 15.3
(5)
0
5
10
15
20
25
30
0
200
400
600
800
1 000
1 200
1 400
1 600
2009 2010 2011 2012 2013 2014 2015 2016 2009 2010 2011 2012 2013 2014 2015 2016
數列3 post pppre pp 數列1
Poor population ('000)
Pre-intervention
Post-intervention
(recurrent cash)
Poor population (LHS)
Poverty rate (RHS)
Poverty rate (%)
(a) Males (b) Females
Source: General Household Survey, Census and Statistics Department.
Hong Kong Poverty Situation Report 2016
Chapter 2: Poverty Situation and Its Trend from 2009 to 2016
P. 31
head, which is free from the impact of economic cycles33
, as another
perspective to illustrate the relationship between economic growth and
income poverty. As the key decision maker of a family, the age of a
household head is closely related to the economic characteristics of the
household. For the overall households and poor households, those with head
aged 18 to 64 mostly have economically active family members, and are
therefore often lifted out of poverty through employment. As for households
with elderly head aged 65 and above, they are mostly economically inactive
with no employment earnings; their pre-intervention poverty rate is thus much
higher than that of the preceding group and the overall figure.
2.37 As there is considerable overlapping in the household groups identified by age
of household head and by household economic characteristic, the poverty
analysis of the two classification methods yields similar observations
(Table 2.5 and Figure 2.18):
Households with head aged 18 to 64: over the past few years, on the
back of moderate economic growth and a largely stable labour market
in Hong Kong, the poverty rates of households with head aged 18 to 64
before and after policy intervention were largely on a downtrend,
broadly similar to the situation of economically active households.
Before policy intervention, the number of poor households with head
aged 18 to 64 decreased from 311 500 in 2009 to 280 700 in 2016, and
the size of their poor population also shrank from 919 000 persons to a
new record low of 804 200 persons over the same period. Although the
poverty rate in 2016 edged up by 0.1 percentage point to 14.8% over
2015, it was still lower than the 2009 level by 1.9 percentage points.
After taking recurrent cash benefits into account, the number of poor
households and the size of the poor population in this group in 2016
increased slightly by 1 900 households and 3 000 persons respectively
over a year earlier. The poverty rate also edged up by 0.1 percentage
point to 11.2%, though still lower than the corresponding figure in
2009.
Households with elderly head aged 65 and above: as the majority of
households with elderly head were economically inactive with no
employment earnings, the direct impacts of economic cycles and labour
market conditions on these households were relatively small. Their
pre-intervention poverty rate was therefore generally higher, more than
33 Please refer to Box 2.4 of the Hong Kong Poverty Situation Report 2015 for a detailed analysis of the
poverty situation and trends of households with head in different age groups, and their relationship with
economic cycles as well as their poverty characteristics.
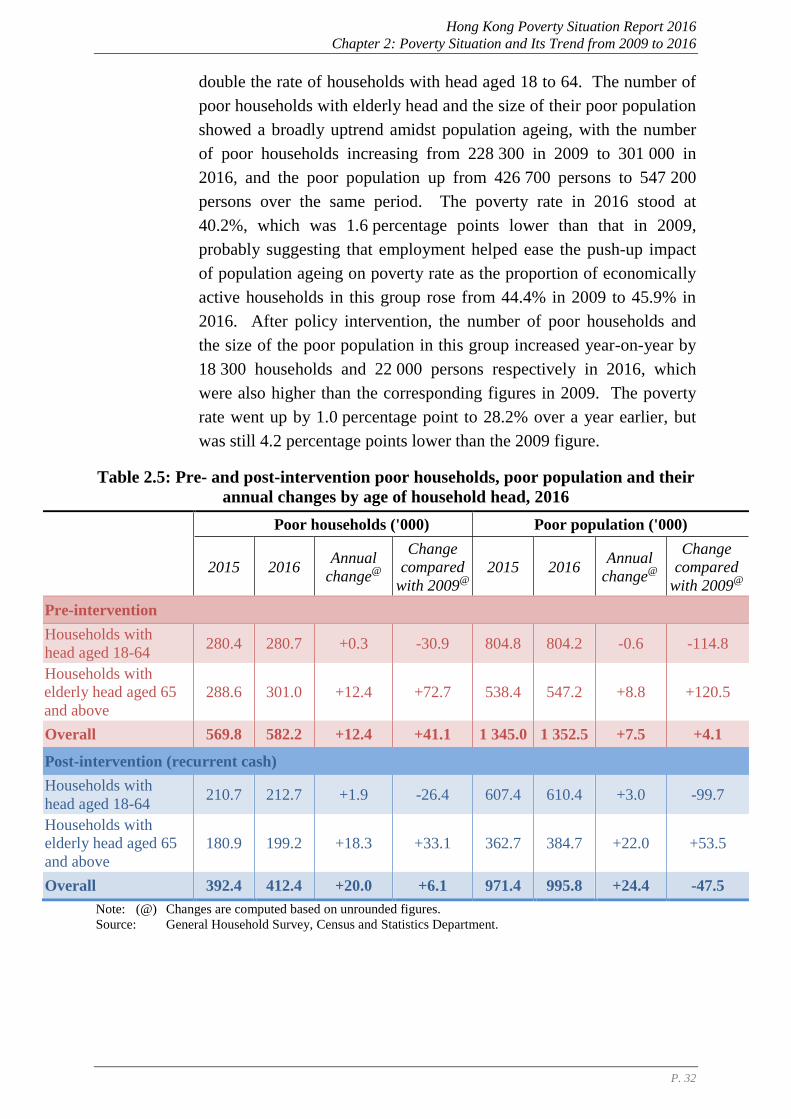
Hong Kong Poverty Situation Report 2016
Chapter 2: Poverty Situation and Its Trend from 2009 to 2016
P. 32
double the rate of households with head aged 18 to 64. The number of
poor households with elderly head and the size of their poor population
showed a broadly uptrend amidst population ageing, with the number
of poor households increasing from 228 300 in 2009 to 301 000 in
2016, and the poor population up from 426 700 persons to 547 200
persons over the same period. The poverty rate in 2016 stood at
40.2%, which was 1.6 percentage points lower than that in 2009,
probably suggesting that employment helped ease the push-up impact
of population ageing on poverty rate as the proportion of economically
active households in this group rose from 44.4% in 2009 to 45.9% in
2016. After policy intervention, the number of poor households and
the size of the poor population in this group increased year-on-year by
18 300 households and 22 000 persons respectively in 2016, which
were also higher than the corresponding figures in 2009. The poverty
rate went up by 1.0 percentage point to 28.2% over a year earlier, but
was still 4.2 percentage points lower than the 2009 figure.
Table 2.5: Pre- and post-intervention poor households, poor population and their
annual changes by age of household head, 2016
Poor households ('000) Poor population ('000)
2015 2016 Annual
change@
Change
compared
with 2009@
2015 2016 Annual
change@
Change
compared
with 2009@
Pre-intervention
Households with
head aged 18-64 280.4 280.7 +0.3 -30.9 804.8 804.2 -0.6 -114.8
Households with
elderly head aged 65
and above
288.6 301.0 +12.4 +72.7 538.4 547.2 +8.8 +120.5
Overall 569.8 582.2 +12.4 +41.1 1 345.0 1 352.5 +7.5 +4.1
Post-intervention (recurrent cash)
Households with
head aged 18-64 210.7 212.7 +1.9 -26.4 607.4 610.4 +3.0 -99.7
Households with
elderly head aged 65
and above
180.9 199.2 +18.3 +33.1 362.7 384.7 +22.0 +53.5
Overall 392.4 412.4 +20.0 +6.1 971.4 995.8 +24.4 -47.5
Note: (@) Changes are computed based on unrounded figures.
Source: General Household Survey, Census and Statistics Department.
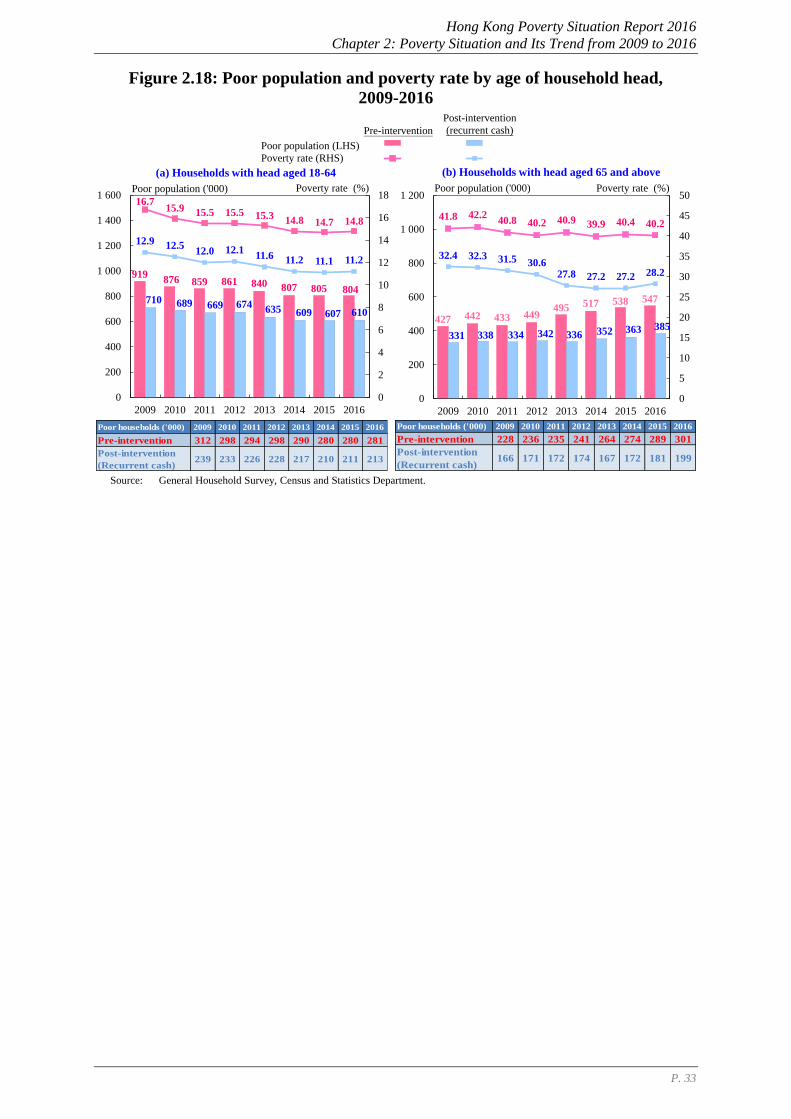
Hong Kong Poverty Situation Report 2016
Chapter 2: Poverty Situation and Its Trend from 2009 to 2016
P. 33
Figure 2.18: Poor population and poverty rate by age of household head,
2009-2016
919876 859 861 840 807 805 804
710 689 669 674635 609 607 610
16.715.9 15.5 15.5 15.3
14.8 14.7 14.8
12.9 12.512.0 12.1
11.6 11.2 11.1 11.2
0
2
4
6
8
10
12
14
16
18
0
200
400
600
800
1 000
1 200
1 400
1 600
2009 2010 2011 2012 2013 2014 2015 2016
數列3 數列2
數列4 數列1
(a) Households with head aged 18-64
427 442 433 449495 517 538 547
331 338 334 342 336 352 363 385
32.4 32.3 31.5 30.627.8 27.2 27.2 28.2
41.8 42.240.8 40.2 40.9 39.9 40.4 40.2
0
5
10
15
20
25
30
35
40
45
50
0
200
400
600
800
1 000
1 200
2009 2010 2011 2012 2013 2014 2015 2016
(b) Households with head aged 65 and above
Source: General Household Survey, Census and Statistics Department.
Poor population (LHS)
Poverty rate (RHS)
Pre-intervention
Post-intervention
(recurrent cash)
Poor population ('000) Poor population ('000) Poverty rate (%)Poverty rate (%)
Poor households ('000) 2009 2010 2011 2012 2013 2014 2015 2016
Pre-intervention 312 298 294 298 290 280 280 281
Post-intervention
(Recurrent cash)239 233 226 228 217 210 211 213
Poor households ('000) 2009 2010 2011 2012 2013 2014 2015 2016
Pre-intervention 228 236 235 241 264 274 289 301
Post-intervention
(Recurrent cash)166 171 172 174 167 172 181 199
Hong Kong Poverty Situation Report 2016
Chapter 2: Poverty Situation and Its Trend from 2009 to 2016
P. 34
Box 2.1
Poverty Situation after Taking into Account
Non-Recurrent Cash Benefits
Apart from recurrent cash benefits, the Government has also provided many non-recurrent cash benefits
34 (including one-off measures) in recent years to relieve
the financial burden of the general public, including the provision of rates waivers and additional social security payments, etc., which involve a considerable amount of public funds every year. Concurrently, the CCF has also launched various programmes to provide assistance to the underprivileged and grassroots families. While the core analytical framework for assessing the policy effectiveness in poverty alleviation only covers recurrent cash policies, the impact of non-recurrent cash measures should not be overlooked. This box article analyses the poverty situation in Hong Kong after taking into account non-recurrent cash measures.
2. The statistics of 2016 show that as compared with the figures before policy intervention, 195 000 households and 418 700 persons were lifted out of poverty after policy intervention (recurrent + non-recurrent cash), with the poverty rate reduced by 6.2 percentage points to 13.7% (Figure 2.19)
35. The reduction in the poverty rate was
less than that in 2015 (6.9 percentage points), mainly due to a smaller amount of non-recurrent cash subsidies involved in 2016 as compared with 2015. In the 2016/17 financial year, for instance, the Government provided recipients of CSSA, OAA, OALA and DA with extra payment equal to one-month allowance payment, which was less than the two-month extra payment provided in the previous year.
Figure 2.19: Poor population and poverty rate after taking into account
non-recurrent cash benefits, 2009-2016
34 For the coverage and estimation of non-recurrent cash benefits, please refer to Appendix 3.
35 As shown in Figure 2.19, the one-off “Scheme $6,000” was covered only in 2011 and 2012. This was the
main factor behind the more notable declines in the poor population and the poverty rate in these two
years. After factoring in the effect of “Scheme $6,000”, the poor population and the poverty rate in 2011
(and 2012) were 720 200 (804 900) and 10.9% (12.0%) respectively. This also demonstrates the additional
fluctuation in poverty figures caused by non-recurrent cash measures.
1 348 1 322 1 295 1 312 1 336 1 325 1 345 1 352
1 043 1 031 1 005 1 018 972 962 971 996
937 910
720 805
847 892 873
934
[876 (13.2%)][882 (13.2%)]
0
200
400
600
800
1 000
1 200
1 400
1 600
2009 2010 2011 2012 2013 2014 2015 2016
(20.1%)(20.6%) (19.6%)
(16.0%) (15.7%) (15.2%)
(14.3%)
(19.6%)
(15.2%)
(13.8%)
(10.9%)(12.0%)
(19.9%)
(12.6%)
(14.5%)
Pre-intervention
Post-intervention
(recurrent cash)
Post-intervention
(recurrent + non-
recurrent cash)
Poor population ('000)
Notes: .( ) [ ]
Figures in parentheses denote the corresponding poverty rates.
Figures in square brackets denote the corresponding poverty figures, taking into account non-recurrent cash benefits, with
the effect of “Scheme $6,000” excluded. As "Scheme $6,000" was covered in 2011 and 2012 only, there were no
corresponding figures for other years.
General Household Survey, Census and Statistics Department.Source:
(13.2%)
(14.3%)
(19.6%) (19.7%)
(14.3%)
(12.8%)
(19.9%)
(14.7%)
(13.7%)
Poor households ('000) 2009 2010 2011 2012 2013 2014 2015 2016
Pre-intervention 541 536 530 541 555 555 570 582
Post-intervention (recurrent cash) 406 405 399 403 385 383 392 412
Post-intervention
(recurrent + non-recurrent cash)361 354 281 [339] 312 [341] 333 355 354 387
Hong Kong Poverty Situation Report 2016
Chapter 2: Poverty Situation and Its Trend from 2009 to 2016
P. 35
Box 2.1 (Cont’d)
3. As compared with the poverty situation when only recurrent cash benefits are
taken into account, an additional 25 200 households (62 000 persons) were lifted out
of poverty as a result of the non-recurrent cash measures in 2016, and the poverty rate
was thereby further reduced by 1.0 percentage point (Figure 2.20). Please refer to
Appendix 5 for the detailed poverty figures after taking into account non-recurrent
cash benefits.
Figure 2.20: Effectiveness of non-recurrent cash benefits in poverty alleviation,
2009-2016
4. Nevertheless, it is worth noting that non-recurrent cash benefits are much less
cost-effective in alleviating poverty than recurrent cash measures. The estimated
proportion of recurrent cash benefits received by poor households was 66.7%, while
that of non-recurrent cash items was merely 11.8%. This is because some of the non-
recurrent cash measures36 either adopt income thresholds that are far more lenient than
the poverty line or have no income test at all. Since these measures are not targeted at
poor households, their cost-effectiveness in poverty alleviation is lower than that of
recurrent cash benefits that are mainly targeted at the grassroots.
36 However, programmes funded by the CCF aim at assisting people with financial difficulties. It should also
be pointed out that low-income households benefiting from non-recurrent cash items under the CCF
programmes might also be covered by other measures, bringing about a considerable composite effect of
poverty alleviation.
305291 290 294
364 363 374357
412 412 419 431
490
433
472
419
4.64.4 4.4 4.4
5.4 5.3 5.45.2
6.3 6.3 6.4 6.4
7.3
6.4
6.9
6.2
0
1
2
3
4
5
6
7
8
0
100
200
300
400
500
600
2009 2010 2011 2012 2013 2014 2015 2016
數列1 數列2數列3 數列4
Reduction inPost-intervention
(recurrent cash)
Post-intervention
(recurrent + non-recurrent cash) Poor population (LHS)
Poverty rate (RHS)Population ('000) (Percentage point(s))
Note:
Source:
Excluding the effect of “Scheme $6,000”.
General Household Survey, Census and Statistics Department.
Reduction in poor households ('000) 2009 2010 2011 2012 2013 2014 2015 2016
Post-intervention (recurrent cash) 135 130 131 138 170 173 177 170
Post-intervention
(recurrent + non-recurrent cash)180 181 192 199 222 200 216 195
Hong Kong Poverty Situation Report 2016
Chapter 2: Poverty Situation and Its Trend from 2009 to 2016
P. 36
Box 2.2
Poverty Situation after Taking into Account In-kind Benefits
While the current core analytical framework of the poverty line only covers
recurrent cash benefits, the Government has also been rendering assistance to the
grassroots through a number of in-kind benefits which involve a substantial amount of
resources. Among these means-tested benefits, the provision of PRH is of particular
importance.
2. The provision of PRH is undoubtedly effective in substantially reducing the
housing expenditure of grassroots families and thereby improving their livelihood. As
mentioned in Section 1.II, the second-term CoP recognised in principle the
important role of PRH provision in poverty alleviation at its meeting in April 2016.
However, as a wide range of policy measures targeted at poor households have been
put in place by the Government, CoP saw no pressing need to enhance the analytical
framework of the poverty line or to refine the poverty statistics compiled under the
current framework. In addition, considering that the welfare transfer of PRH is not an
actual cash subsidy, its quantification as part of household income remains
controversial37. Hence, as in the case of non-recurrent cash benefits, currently the
effectiveness of in-kind benefits in poverty alleviation is separately assessed as
supplementary reference. Such estimation aims at quantifying the effectiveness of
PRH provision and other in-kind benefits in poverty alleviation, but does not purport
to downplay the poverty situation in Hong Kong.
Estimation results
3. In 2016, the size of the poor population and the poverty rate after policy
intervention (recurrent cash + in-kind benefits) were 708 600 persons and 10.4%
respectively (Figure 2.21).
37 For the estimation and limitations of the in-kind transfer from PRH provision, please refer to Appendix 4.
Hong Kong Poverty Situation Report 2016
Chapter 2: Poverty Situation and Its Trend from 2009 to 2016
P. 37
Box 2.2 (Cont’d)
Figure 2.21: Poor population and poverty rate after taking into account
in-kind benefits, 2009-2016
4. In comparison with the poverty situation after recurrent cash intervention, PRH
provision and other means-tested in-kind benefits in 2016 lifted the income of an
additional 108 300 households (287 300 persons) to or above the poverty line, and
reduced the poverty rate further by 4.3 percentage points (Figure 2.22).
Figure 2.22: Effectiveness of in-kind benefits in poverty alleviation, 2009-2016
1 348 1 322 1 295 1 312 1 336 1 325 1 345 1 352
1 043 1 031 1 005 1 018972 962 971
996
726 699 675 674 656 648 669 709
0
200
400
600
800
1 000
1 200
1 400
1 600
2009 2010 2011 2012 2013 2014 2015 2016
(20.1%)(20.6%)(19.6%)
(16.0%) (15.7%) (15.2%)
(11.1%)
(19.6%)
(15.2%)
(10.6%) (10.2%) (10.1%)
(19.9%)
(14.5%)
(9.8%)Post-intervention (recurrent cash + in-kind)
Pre-intervention
Post-intervention
(recurrent cash)
Poor population ('000)
Note: ( ) Figures in parentheses denote the corresponding poverty rates.
Source: General Household Survey, Census and Statistics Department.
(14.3%)
(9.6%)
(19.6%) (19.7%)
(14.3%)
(9.8%)
(14.7%)
(19.9%)
(10.4%)
Poor households ('000) 2009 2010 2011 2012 2013 2014 2015 2016
Pre-intervention 541 536 530 541 555 555 570 582
Post-intervention (recurrent cash) 406 405 399 403 385 383 392 412
Post-intervention
(recurrent cash + in-kind)284 278 271 272 269 271 281 304
305 291 290 294
364 363
374 357
622 623 620 638680 677 676
644
4.64.4 4.4 4.4
5.4 5.3 5.4 5.2
9.5 9.5 9.4 9.5 10.1 10.0 9.9
9.5
0
2
4
6
8
10
12
0
100
200
300
400
500
600
700
800
900
2009 2010 2011 2012 2013 2014 2015 2016
數列1 數列2數列3 數列4 (Percentage point(s))Population ('000)
Post-intervention
(recurrent cash)
Post-intervention
(recurrent cash + in-kind)Reduction in
Poor population (LHS)
Poverty rate (RHS)
Source: General Household Survey, Census and Statistics Department.
Reduction in poor households ('000) 2009 2010 2011 2012 2013 2014 2015 2016
Post-intervention (recurrent cash) 135 130 131 138 170 173 177 170
Post-intervention
(recurrent cash + in-kind)257 257 260 269 286 285 288 278
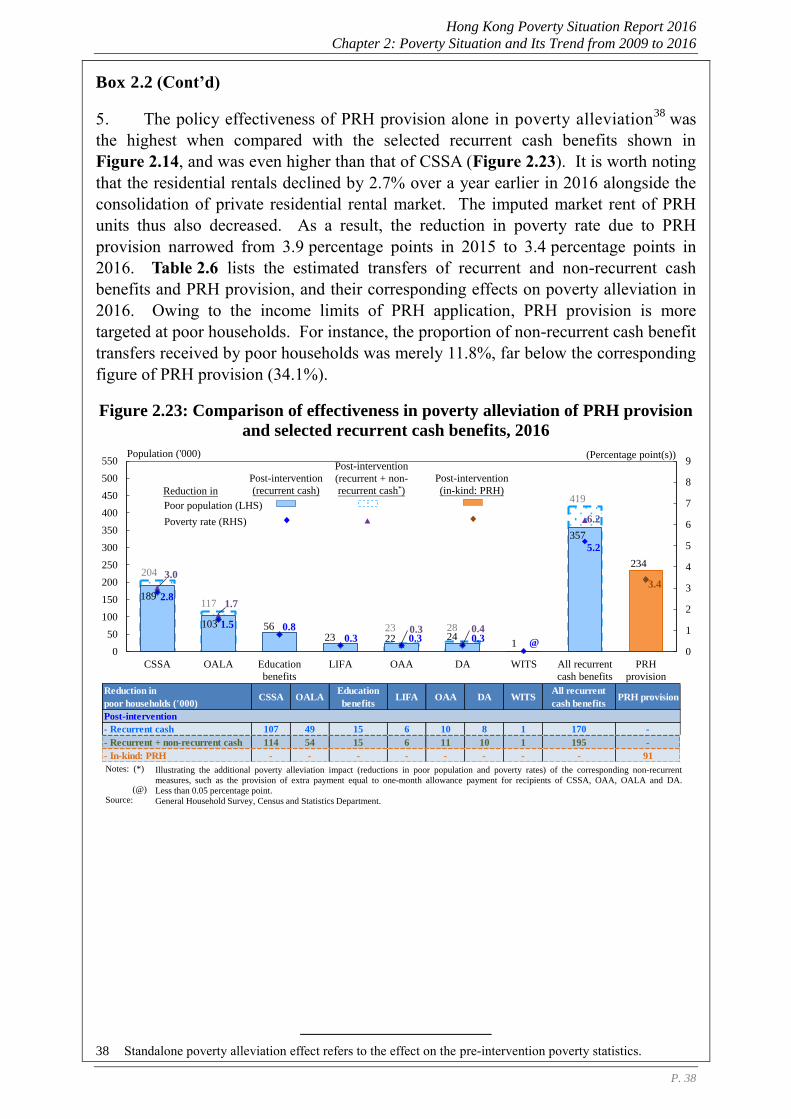
Hong Kong Poverty Situation Report 2016
Chapter 2: Poverty Situation and Its Trend from 2009 to 2016
P. 38
Box 2.2 (Cont’d)
5. The policy effectiveness of PRH provision alone in poverty alleviation38 was
the highest when compared with the selected recurrent cash benefits shown in
Figure 2.14, and was even higher than that of CSSA (Figure 2.23). It is worth noting
that the residential rentals declined by 2.7% over a year earlier in 2016 alongside the
consolidation of private residential rental market. The imputed market rent of PRH
units thus also decreased. As a result, the reduction in poverty rate due to PRH
provision narrowed from 3.9 percentage points in 2015 to 3.4 percentage points in
2016. Table 2.6 lists the estimated transfers of recurrent and non-recurrent cash
benefits and PRH provision, and their corresponding effects on poverty alleviation in
2016. Owing to the income limits of PRH application, PRH provision is more
targeted at poor households. For instance, the proportion of non-recurrent cash benefit
transfers received by poor households was merely 11.8%, far below the corresponding
figure of PRH provision (34.1%).
Figure 2.23: Comparison of effectiveness in poverty alleviation of PRH provision
and selected recurrent cash benefits, 2016
38 Standalone poverty alleviation effect refers to the effect on the pre-intervention poverty statistics.
204
117
23 28
419
189
103 56 23 22 24
1
357
234 3.0
1.7
0.3 0.4
6.2
2.8
1.5 0.8 0.3 0.3 0.3 @
5.2
3.4
0
1
2
3
4
5
6
7
8
9
0
50
100
150
200
250
300
350
400
450
500
550
CSSA OALA Education
benefits
LIFA OAA DA WITS All recurrent
cash benefits
PRH
provision
Population ('000) (Percentage point(s))
Post-intervention
(recurrent cash)
Post-intervention
(recurrent + non-
recurrent cash*)
Post-intervention
(in-kind: PRH)Reduction in
Poor population (LHS)
Poverty rate (RHS)
Notes: (*)
(@)
Source:
Illustrating the additional poverty alleviation impact (reductions in poor population and poverty rates) of the corresponding non-recurrent
measures, such as the provision of extra payment equal to one-month allowance payment for recipients of CSSA, OAA, OALA and DA.
Less than 0.05 percentage point.
General Household Survey, Census and Statistics Department.
PRH provisionReduction in
poor households ('000)CSSA OALA
Education
benefitsLIFA OAA DA WITS
All recurrent
cash benefitsPRH provision
- Recurrent cash 107 49 15 6 10 8 1 170 -
- Recurrent + non-recurrent cash 114 54 15 6 11 10 1 195 -
- In-kind: PRH - - - - - - - - 91
Post-intervention
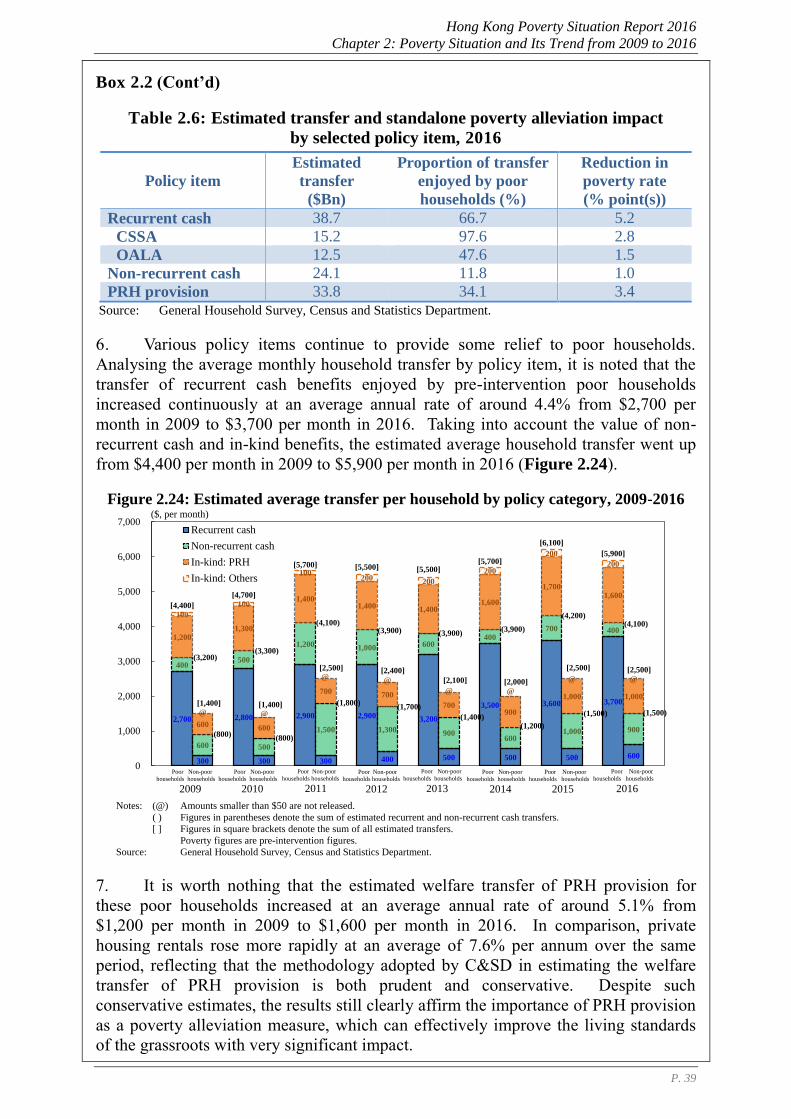
Hong Kong Poverty Situation Report 2016
Chapter 2: Poverty Situation and Its Trend from 2009 to 2016
P. 39
Box 2.2 (Cont’d)
Table 2.6: Estimated transfer and standalone poverty alleviation impact
by selected policy item, 2016
Policy item
Estimated
transfer
($Bn)
Proportion of transfer
enjoyed by poor
households (%)
Reduction in
poverty rate
(% point(s))
Recurrent cash 38.7 66.7 5.2
CSSA 15.2 97.6 2.8
OALA 12.5 47.6 1.5
Non-recurrent cash 24.1 11.8 1.0
PRH provision 33.8 34.1 3.4 Source: General Household Survey, Census and Statistics Department.
6. Various policy items continue to provide some relief to poor households.
Analysing the average monthly household transfer by policy item, it is noted that the
transfer of recurrent cash benefits enjoyed by pre-intervention poor households
increased continuously at an average annual rate of around 4.4% from $2,700 per
month in 2009 to $3,700 per month in 2016. Taking into account the value of non-
recurrent cash and in-kind benefits, the estimated average household transfer went up
from $4,400 per month in 2009 to $5,900 per month in 2016 (Figure 2.24).
Figure 2.24: Estimated average transfer per household by policy category, 2009-2016
7. It is worth nothing that the estimated welfare transfer of PRH provision for
these poor households increased at an average annual rate of around 5.1% from
$1,200 per month in 2009 to $1,600 per month in 2016. In comparison, private
housing rentals rose more rapidly at an average of 7.6% per annum over the same
period, reflecting that the methodology adopted by C&SD in estimating the welfare
transfer of PRH provision is both prudent and conservative. Despite such
conservative estimates, the results still clearly affirm the importance of PRH provision
as a poverty alleviation measure, which can effectively improve the living standards
of the grassroots with very significant impact.
2,700
300
2,800
300
2,900
300
2,900
400
3,200
500
3,500
500
3,600
500
3,700
600
400
600
500
500
1,200
1,500
1,000
1,300
600
900
400
600
700
1,000
400
900
1,200
600
1,300
600
1,400
700
1,400
700
1,400
700
1,600
900
1,700
1,000
1,600
1,000
100
@
100
@
100
@
200
@
200
@
200
@
200
@
200
@
[4,400]
[1,400]
[4,700]
[1,400]
[5,700]
[2,500]
[5,500]
[2,400]
[5,500]
[2,100]
[5,700]
[2,000]
[6,100]
[2,500]
[5,900]
[2,500]
0
1,000
2,000
3,000
4,000
5,000
6,000
7,000Recurrent cash
Non-recurrent cash
In-kind: PRH
In-kind: Others
(3,300)
(4,100)
(3,900)
(800)
(3,900)
(800)
(1,800)(1,700)
($, per month)
Notes: (@)
. ( )
. [ ]
Source:
Amounts smaller than $50 are not released.
Figures in parentheses denote the sum of estimated recurrent and non-recurrent cash transfers.
Figures in square brackets denote the sum of all estimated transfers.
Poverty figures are pre-intervention figures.
General Household Survey, Census and Statistics Department.
Poor Non-poor
households households
2009
Poor Non-poor
households households
2010
Poor Non-poor
households households
2011
Poor Non-poor
households households
2012
Poor Non-poor
households households
2013
(4,200)
(1,500)
(3,200)
(1,400)(1,200)
(3,900)
Poor Non-poor
households households
2014
Poor Non-poor
households households
2015
(4,100)
(1,500)
Poor Non-poor
households households
2016
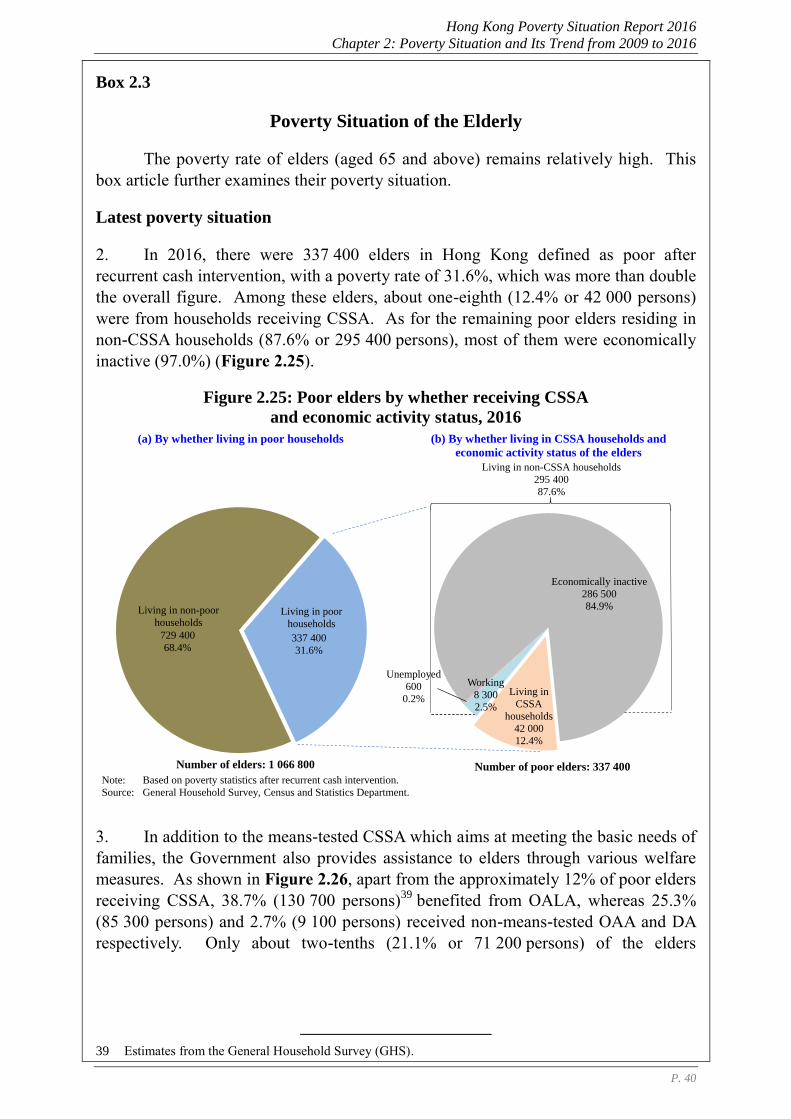
Hong Kong Poverty Situation Report 2016
Chapter 2: Poverty Situation and Its Trend from 2009 to 2016
P. 40
Box 2.3
Poverty Situation of the Elderly
The poverty rate of elders (aged 65 and above) remains relatively high. This
box article further examines their poverty situation.
Latest poverty situation
2. In 2016, there were 337 400 elders in Hong Kong defined as poor after
recurrent cash intervention, with a poverty rate of 31.6%, which was more than double
the overall figure. Among these elders, about one-eighth (12.4% or 42 000 persons)
were from households receiving CSSA. As for the remaining poor elders residing in
non-CSSA households (87.6% or 295 400 persons), most of them were economically
inactive (97.0%) (Figure 2.25).
Figure 2.25: Poor elders by whether receiving CSSA
and economic activity status, 2016
3. In addition to the means-tested CSSA which aims at meeting the basic needs of
families, the Government also provides assistance to elders through various welfare
measures. As shown in Figure 2.26, apart from the approximately 12% of poor elders
receiving CSSA, 38.7% (130 700 persons)39 benefited from OALA, whereas 25.3%
(85 300 persons) and 2.7% (9 100 persons) received non-means-tested OAA and DA
respectively. Only about two-tenths (21.1% or 71 200 persons) of the elders
39 Estimates from the General Household Survey (GHS).
Working
8 300
2.5%
Unemployed
600
0.2%
Economically inactive
286 500
84.9%
Living in
CSSA
households
42 000
12.4%
Living in non-CSSA households
295 400
87.6%
Note:
Source:
(a) By whether living in poor households (b) By whether living in CSSA households and
economic activity status of the elders
Number of elders: 1 066 800 Number of poor elders: 337 400
337 400
31.6%
729 400
68.4%
Living in poor
households
Living in non-poor
households
Based on poverty statistics after recurrent cash intervention.
General Household Survey, Census and Statistics Department.
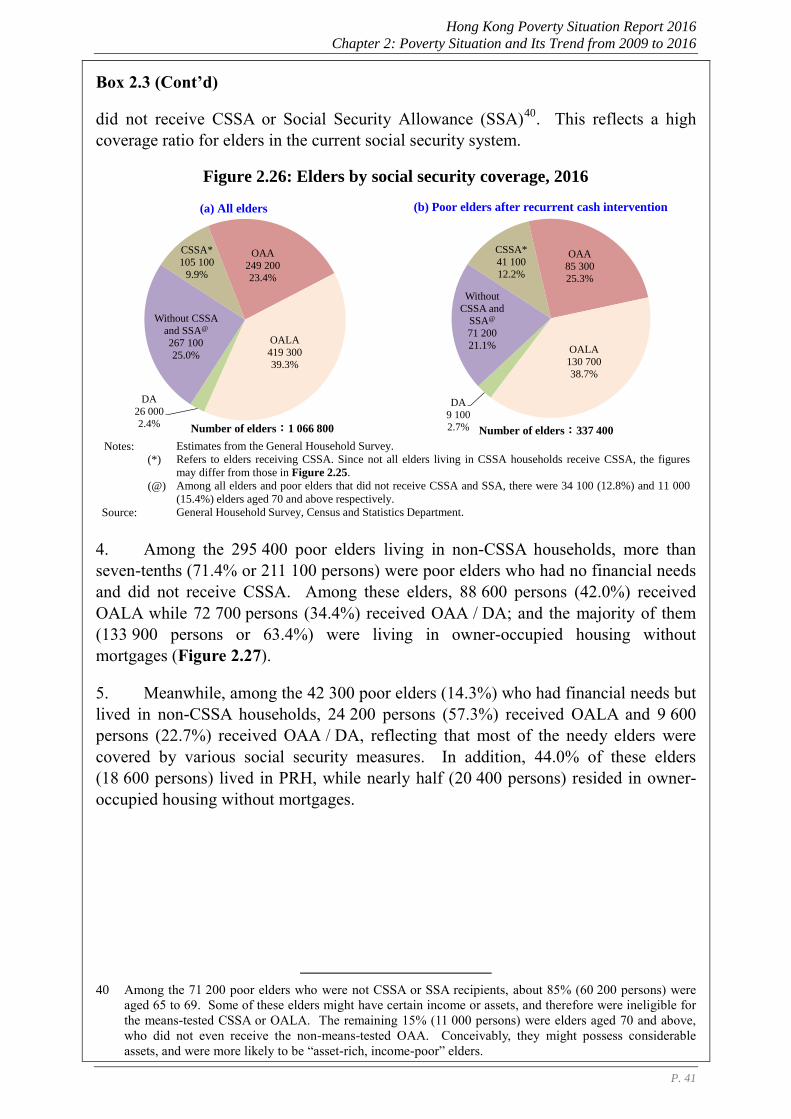
Hong Kong Poverty Situation Report 2016
Chapter 2: Poverty Situation and Its Trend from 2009 to 2016
P. 41
Box 2.3 (Cont’d)
did not receive CSSA or Social Security Allowance (SSA)40. This reflects a high
coverage ratio for elders in the current social security system.
Figure 2.26: Elders by social security coverage, 2016
4. Among the 295 400 poor elders living in non-CSSA households, more than
seven-tenths (71.4% or 211 100 persons) were poor elders who had no financial needs
and did not receive CSSA. Among these elders, 88 600 persons (42.0%) received
OALA while 72 700 persons (34.4%) received OAA / DA; and the majority of them
(133 900 persons or 63.4%) were living in owner-occupied housing without
mortgages (Figure 2.27).
5. Meanwhile, among the 42 300 poor elders (14.3%) who had financial needs but
lived in non-CSSA households, 24 200 persons (57.3%) received OALA and 9 600
persons (22.7%) received OAA / DA, reflecting that most of the needy elders were
covered by various social security measures. In addition, 44.0% of these elders
(18 600 persons) lived in PRH, while nearly half (20 400 persons) resided in owner-
occupied housing without mortgages.
40 Among the 71 200 poor elders who were not CSSA or SSA recipients, about 85% (60 200 persons) were
aged 65 to 69. Some of these elders might have certain income or assets, and therefore were ineligible for
the means-tested CSSA or OALA. The remaining 15% (11 000 persons) were elders aged 70 and above,
who did not even receive the non-means-tested OAA. Conceivably, they might possess considerable
assets, and were more likely to be “asset-rich, income-poor” elders.
CSSA*
105 100
9.9%
OAA
249 200
23.4%
OALA
419 300
39.3%
DA
26 000
2.4%
Without CSSA
and SSA@
267 100
25.0%
CSSA*
41 100
12.2%
OAA
85 300
25.3%
OALA
130 700
38.7%
DA
9 100
2.7%
Without
CSSA and
SSA@
71 200
21.1%
(b) Poor elders after recurrent cash intervention
Number of elders:337 400
(a) All elders
Number of elders:1 066 800
Estimates from the General Household Survey.
Refers to elders receiving CSSA. Since not all elders living in CSSA households receive CSSA, the figures
may differ from those in Figure 2.25.
Among all elders and poor elders that did not receive CSSA and SSA, there were 34 100 (12.8%) and 11 000
(15.4%) elders aged 70 and above respectively.
General Household Survey, Census and Statistics Department.
Notes: _____
(*)..
(@)
Source:_____
_
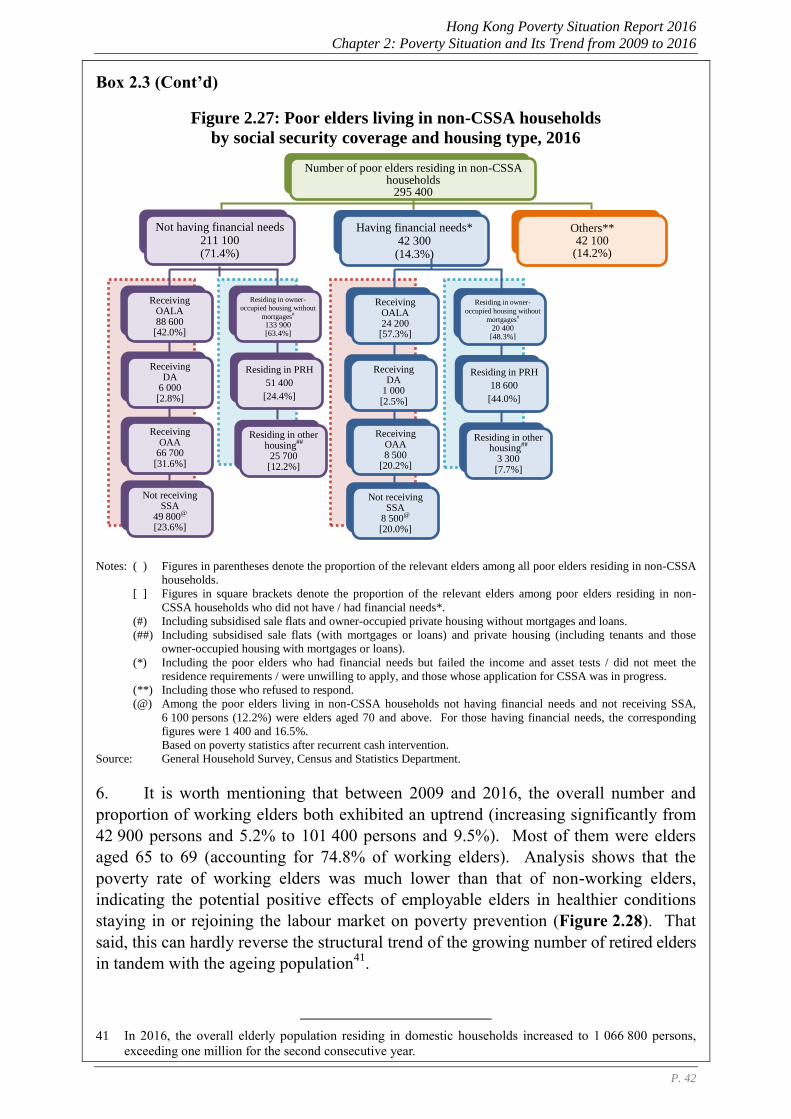
Hong Kong Poverty Situation Report 2016
Chapter 2: Poverty Situation and Its Trend from 2009 to 2016
P. 42
Box 2.3 (Cont’d)
Figure 2.27: Poor elders living in non-CSSA households
by social security coverage and housing type, 2016
Notes: ( ) Figures in parentheses denote the proportion of the relevant elders among all poor elders residing in non-CSSA
households.
[ ] Figures in square brackets denote the proportion of the relevant elders among poor elders residing in non-
CSSA households who did not have / had financial needs*.
(#) Including subsidised sale flats and owner-occupied private housing without mortgages and loans.
(##) Including subsidised sale flats (with mortgages or loans) and private housing (including tenants and those
owner-occupied housing with mortgages or loans).
(*) Including the poor elders who had financial needs but failed the income and asset tests / did not meet the
residence requirements / were unwilling to apply, and those whose application for CSSA was in progress.
(**) Including those who refused to respond.
(@) Among the poor elders living in non-CSSA households not having financial needs and not receiving SSA,
6 100 persons (12.2%) were elders aged 70 and above. For those having financial needs, the corresponding
figures were 1 400 and 16.5%.
Based on poverty statistics after recurrent cash intervention.
Source: General Household Survey, Census and Statistics Department.
6. It is worth mentioning that between 2009 and 2016, the overall number and
proportion of working elders both exhibited an uptrend (increasing significantly from
42 900 persons and 5.2% to 101 400 persons and 9.5%). Most of them were elders
aged 65 to 69 (accounting for 74.8% of working elders). Analysis shows that the
poverty rate of working elders was much lower than that of non-working elders,
indicating the potential positive effects of employable elders in healthier conditions
staying in or rejoining the labour market on poverty prevention (Figure 2.28). That
said, this can hardly reverse the structural trend of the growing number of retired elders
in tandem with the ageing population41.
41 In 2016, the overall elderly population residing in domestic households increased to 1 066 800 persons,
exceeding one million for the second consecutive year.
Receiving OALA 88 600
[42.0%]
Receiving OAA
66 700 [31.6%]
Not receiving SSA
49 800@
[23.6%]
Residing in owner-
occupied housing without
mortgages#
133 900 [63.4%]
Not having financial needs 211 100 (71.4%)
Residing in PRH
51 400
[24.4%]
Residing in other housing
##
25 700 [12.2%]
Having financial needs* 42 300
(14.3%)
Others** 42 100
(14.2%)
Residing in owner-
occupied housing without
mortgages#
20 400 [48.3%]
Residing in PRH
18 600
[44.0%]
Residing in other housing
##
3 300 [7.7%]
Receiving OALA 24 200
[57.3%]
Receiving DA
1 000 [2.5%]
Receiving OAA 8 500
[20.2%]
Not receiving SSA
8 500@
[20.0%]
Number of poor elders residing in non-CSSA households
295 400
26
Receiving DA
6 000 [2.8%]
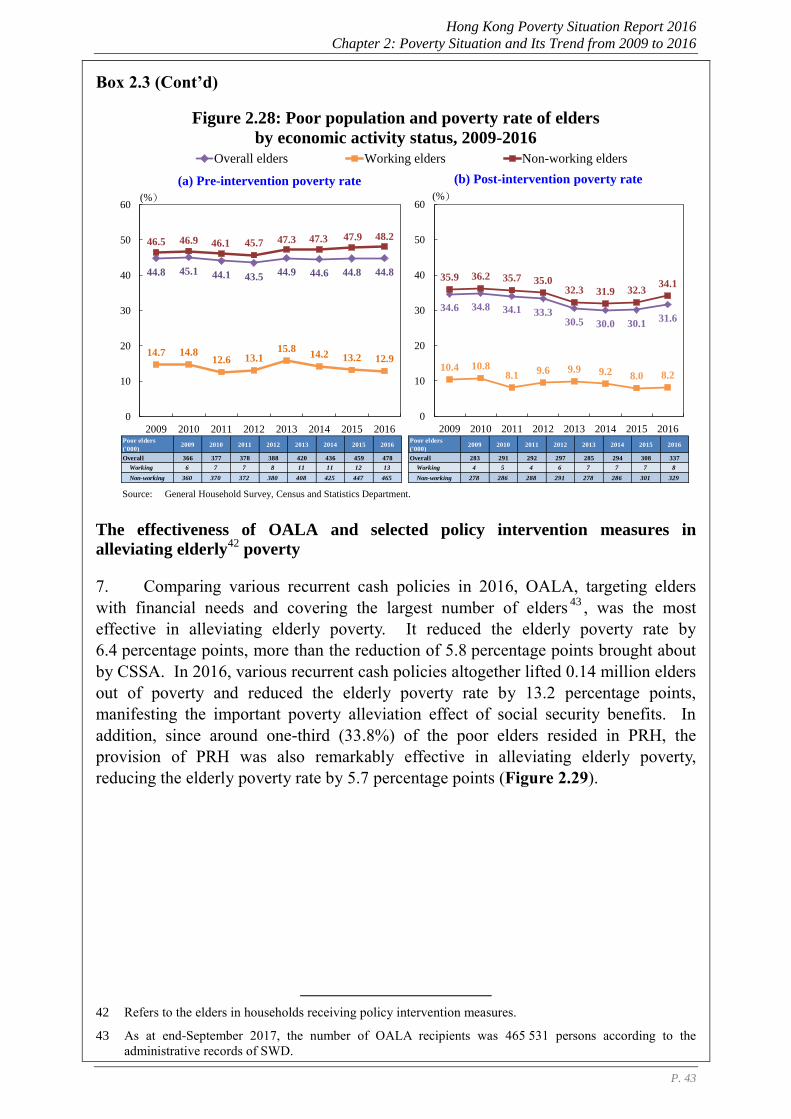
Hong Kong Poverty Situation Report 2016
Chapter 2: Poverty Situation and Its Trend from 2009 to 2016
P. 43
Box 2.3 (Cont’d)
Figure 2.28: Poor population and poverty rate of elders
by economic activity status, 2009-2016
The effectiveness of OALA and selected policy intervention measures in
alleviating elderly42
poverty
7. Comparing various recurrent cash policies in 2016, OALA, targeting elders
with financial needs and covering the largest number of elders43, was the most
effective in alleviating elderly poverty. It reduced the elderly poverty rate by
6.4 percentage points, more than the reduction of 5.8 percentage points brought about
by CSSA. In 2016, various recurrent cash policies altogether lifted 0.14 million elders
out of poverty and reduced the elderly poverty rate by 13.2 percentage points,
manifesting the important poverty alleviation effect of social security benefits. In
addition, since around one-third (33.8%) of the poor elders resided in PRH, the
provision of PRH was also remarkably effective in alleviating elderly poverty,
reducing the elderly poverty rate by 5.7 percentage points (Figure 2.29).
42 Refers to the elders in households receiving policy intervention measures.
43 As at end-September 2017, the number of OALA recipients was 465 531 persons according to the
administrative records of SWD.
44.8 45.1 44.1 43.544.9 44.6 44.8 44.8
14.7 14.812.6 13.1
15.814.2 13.2 12.9
46.5 46.9 46.1 45.7 47.3 47.3 47.9 48.2
0
10
20
30
40
50
60
2009 2010 2011 2012 2013 2014 2015 2016
Overall elders Working elders Non-working elders
(%)
34.6 34.8 34.1 33.330.5 30.0 30.1
31.6
10.4 10.88.1
9.6 9.9 9.2 8.0 8.2
35.9 36.2 35.7 35.032.3 31.9 32.3
34.1
0
10
20
30
40
50
60
2009 2010 2011 2012 2013 2014 2015 2016
(%)
(b) Post-intervention poverty rate(a) Pre-intervention poverty rate
Source: General Household Survey, Census and Statistics Department.
Poor elders
('000)2009 2010 2011 2012 2013 2014 2015 2016
Overall 366 377 378 388 420 436 459 478
Working 6 7 7 8 11 11 12 13
Non-working 360 370 372 380 408 425 447 465
Poor elders
('000)2009 2010 2011 2012 2013 2014 2015 2016
Overall 283 291 292 297 285 294 308 337
Working 4 5 4 6 7 7 7 8
Non-working 278 286 288 291 278 286 301 329
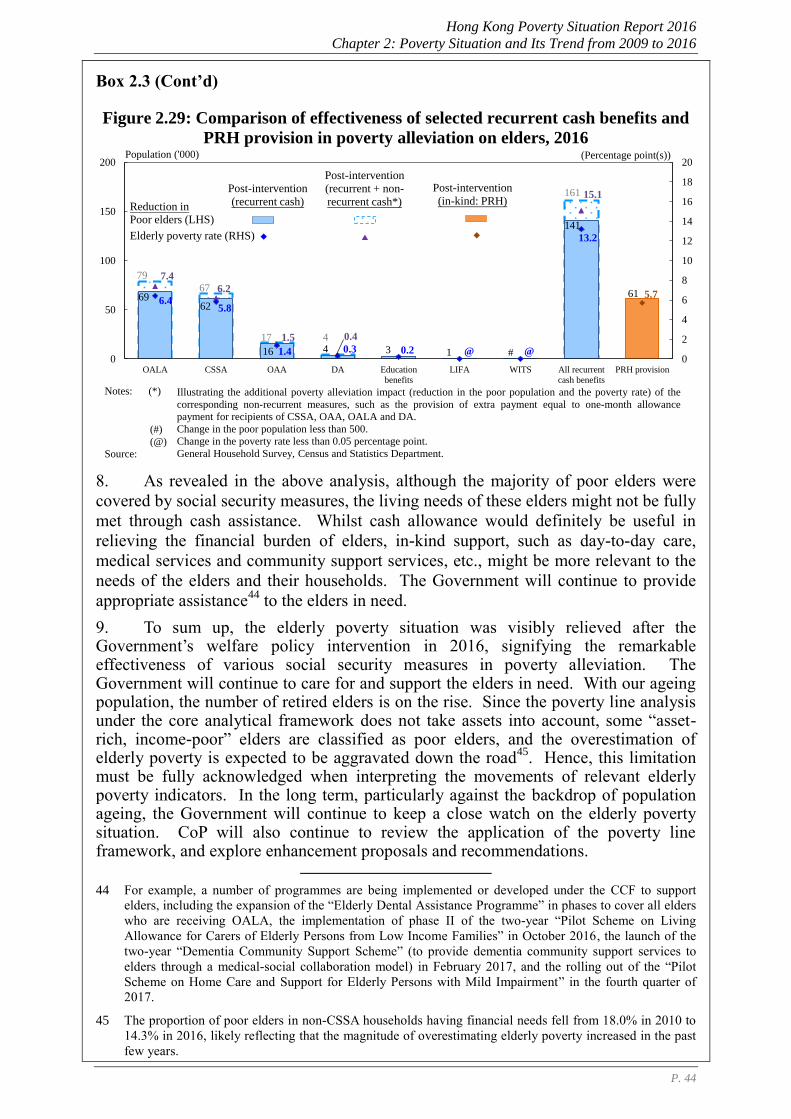
Hong Kong Poverty Situation Report 2016
Chapter 2: Poverty Situation and Its Trend from 2009 to 2016
P. 44
Box 2.3 (Cont’d)
Figure 2.29: Comparison of effectiveness of selected recurrent cash benefits and
PRH provision in poverty alleviation on elders, 2016
8. As revealed in the above analysis, although the majority of poor elders were
covered by social security measures, the living needs of these elders might not be fully
met through cash assistance. Whilst cash allowance would definitely be useful in
relieving the financial burden of elders, in-kind support, such as day-to-day care,
medical services and community support services, etc., might be more relevant to the
needs of the elders and their households. The Government will continue to provide
appropriate assistance44 to the elders in need.
9. To sum up, the elderly poverty situation was visibly relieved after the Government’s welfare policy intervention in 2016, signifying the remarkable effectiveness of various social security measures in poverty alleviation. The Government will continue to care for and support the elders in need. With our ageing population, the number of retired elders is on the rise. Since the poverty line analysis under the core analytical framework does not take assets into account, some “asset-rich, income-poor” elders are classified as poor elders, and the overestimation of elderly poverty is expected to be aggravated down the road
45. Hence, this limitation
must be fully acknowledged when interpreting the movements of relevant elderly poverty indicators. In the long term, particularly against the backdrop of population ageing, the Government will continue to keep a close watch on the elderly poverty situation. CoP will also continue to review the application of the poverty line framework, and explore enhancement proposals and recommendations.
44 For example, a number of programmes are being implemented or developed under the CCF to support
elders, including the expansion of the “Elderly Dental Assistance Programme” in phases to cover all elders
who are receiving OALA, the implementation of phase II of the two-year “Pilot Scheme on Living
Allowance for Carers of Elderly Persons from Low Income Families” in October 2016, the launch of the
two-year “Dementia Community Support Scheme” (to provide dementia community support services to
elders through a medical-social collaboration model) in February 2017, and the rolling out of the “Pilot
Scheme on Home Care and Support for Elderly Persons with Mild Impairment” in the fourth quarter of
2017.
45 The proportion of poor elders in non-CSSA households having financial needs fell from 18.0% in 2010 to
14.3% in 2016, likely reflecting that the magnitude of overestimating elderly poverty increased in the past
few years.
79
67
17 4
161
69 62
16 4 3 1 #
141
61
7.4
6.2
1.5 0.4
15.1
6.4 5.8
1.4 0.3 0.2 @ @
13.2
5.7
0
2
4
6
8
10
12
14
16
18
20
0
50
100
150
200
OALA CSSA OAA DA Education
benefits
LIFA WITS All recurrent
cash benefits
PRH provision
Notes: (*)
(#)
(@)
Source:
Population ('000) (Percentage point(s))
Poor elders (LHS)
Elderly poverty rate (RHS)
Post-intervention
(recurrent cash)
Post-intervention
(recurrent + non-
recurrent cash*)
Post-intervention
(in-kind: PRH)Reduction in
Illustrating the additional poverty alleviation impact (reduction in the poor population and the poverty rate) of the
corresponding non-recurrent measures, such as the provision of extra payment equal to one-month allowance
payment for recipients of CSSA, OAA, OALA and DA.
Change in the poor population less than 500.
Change in the poverty rate less than 0.05 percentage point.
General Household Survey, Census and Statistics Department.
Hong Kong Poverty Situation Report 2016
Chapter 2: Poverty Situation and Its Trend from 2009 to 2016
P. 45
Box 2.4
Decomposition of Changes in the Poverty Rate, 2009-2016
As mentioned in Section 2.I, the local poverty situation is affected by the
concurrent interplay of a number of factors, among which some are working in
opposite directions. The observed poverty statistics are the results of the combined
effect of all relevant factors. For example, most of the elders are retirees. They
generally lived alone or with their spouses only, with a relatively small household size
and little or even no regular income. Under the current poverty line framework which
adopts household income as the sole indicator for defining poverty, some elders are
likely to be classified as “poor”. As such, population ageing tends to push up the
poverty indicators. On the other hand, the poverty situation is also subject to swings
in economic cycles. For instance, during an economic upcycle amid a tight labour
market in recent years, economically active households in which most members are
working-age would likely benefit from more job opportunities and higher employment
earnings, resulting in lower poverty risk. In view of the above, this box article adopts
the methodology used in Box 2.5 of the Hong Kong Poverty Situation Report 2015 for
analysing the impact of structural trends in the population age profile and smaller
household size on the poverty rate movements in recent years.
Decomposition of poverty rate and poor population
2. To better examine the impact of demographic factors on the poverty rate over
time, we have made reference to the study by Yip et al. in 201646 which adopted Das
Gupta’s decomposition method47 to break down changes in the poverty rate during a
period into the following three components:
Changes in the overall poverty rate during the period = I + J + R (1)48
where “I” is the age structure effect, “J” is the household size effect, and “R” is the
age-household size specific poverty rate effect which is a residual representing all
other factors such as the effects of economic growth and labour market performance,
the poverty alleviation impact of government policies, etc.
3. Between 2009 and 2016, the overall pre- and post-intervention poverty rates as
measured under the current poverty line framework dropped cumulatively by 0.7 and
1.3 percentage points respectively. Both the changes in age structure and smaller
household size lifted the overall poverty rates visibly during the period (Table 2.7).
Specifically, the combined effect of the changes in age structure and smaller
household size should have pushed up the pre- and post-intervention poverty rates by
1.42 and 1.10 percentage points respectively if other factors (as reflected in the age-
household size specific poverty rates) had remained unchanged between 2009 and
2016.
46 Yip, P. S. F., Wong, J. H. K., Li, B. Y. G., Zhang, Y., Kwok, C. L., & Chen, M. N. (2016). Assessing the
impact of population dynamics on poverty measures: A decomposition analysis. Social Indicators
Research.
47 Gupta, P. D. (1978). A general method of decomposing a difference between two rates into several
components. Demography, 15(1), 99-112.
48 For details of the estimation methodology, please refer to the Technical note at the end of Box 2.5 in the
Hong Kong Poverty Situation Report 2015.
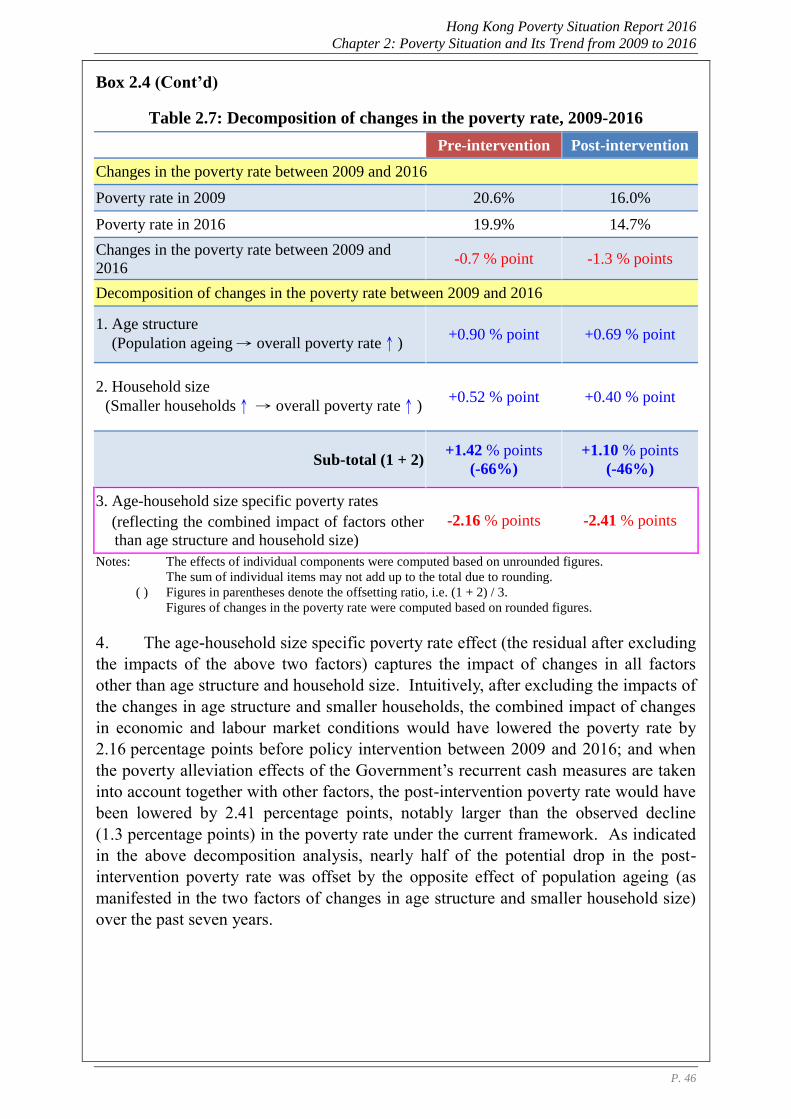
Hong Kong Poverty Situation Report 2016
Chapter 2: Poverty Situation and Its Trend from 2009 to 2016
P. 46
Box 2.4 (Cont’d)
Table 2.7: Decomposition of changes in the poverty rate, 2009-2016
Pre-intervention Post-intervention
Changes in the poverty rate between 2009 and 2016
Poverty rate in 2009 20.6% 16.0%
Poverty rate in 2016 19.9% 14.7%
Changes in the poverty rate between 2009 and
2016 -0.7 % point -1.3 % points
Decomposition of changes in the poverty rate between 2009 and 2016
1. Age structure
(Population ageing → overall poverty rate↑) +0.90 % point +0.69 % point
2. Household size
(Smaller households↑ → overall poverty rate↑) +0.52 % point +0.40 % point
Sub-total (1 + 2) +1.42 % points
(-66%)
+1.10 % points
(-46%)
3. Age-household size specific poverty rates
(reflecting the combined impact of factors other
than age structure and household size)
-2.16 % points -2.41 % points
Notes: The effects of individual components were computed based on unrounded figures.
The sum of individual items may not add up to the total due to rounding.
( ) Figures in parentheses denote the offsetting ratio, i.e. (1 + 2) / 3.
Figures of changes in the poverty rate were computed based on rounded figures.
4. The age-household size specific poverty rate effect (the residual after excluding
the impacts of the above two factors) captures the impact of changes in all factors
other than age structure and household size. Intuitively, after excluding the impacts of
the changes in age structure and smaller households, the combined impact of changes
in economic and labour market conditions would have lowered the poverty rate by
2.16 percentage points before policy intervention between 2009 and 2016; and when
the poverty alleviation effects of the Government’s recurrent cash measures are taken
into account together with other factors, the post-intervention poverty rate would have
been lowered by 2.41 percentage points, notably larger than the observed decline
(1.3 percentage points) in the poverty rate under the current framework. As indicated
in the above decomposition analysis, nearly half of the potential drop in the post-
intervention poverty rate was offset by the opposite effect of population ageing (as
manifested in the two factors of changes in age structure and smaller household size)
over the past seven years.
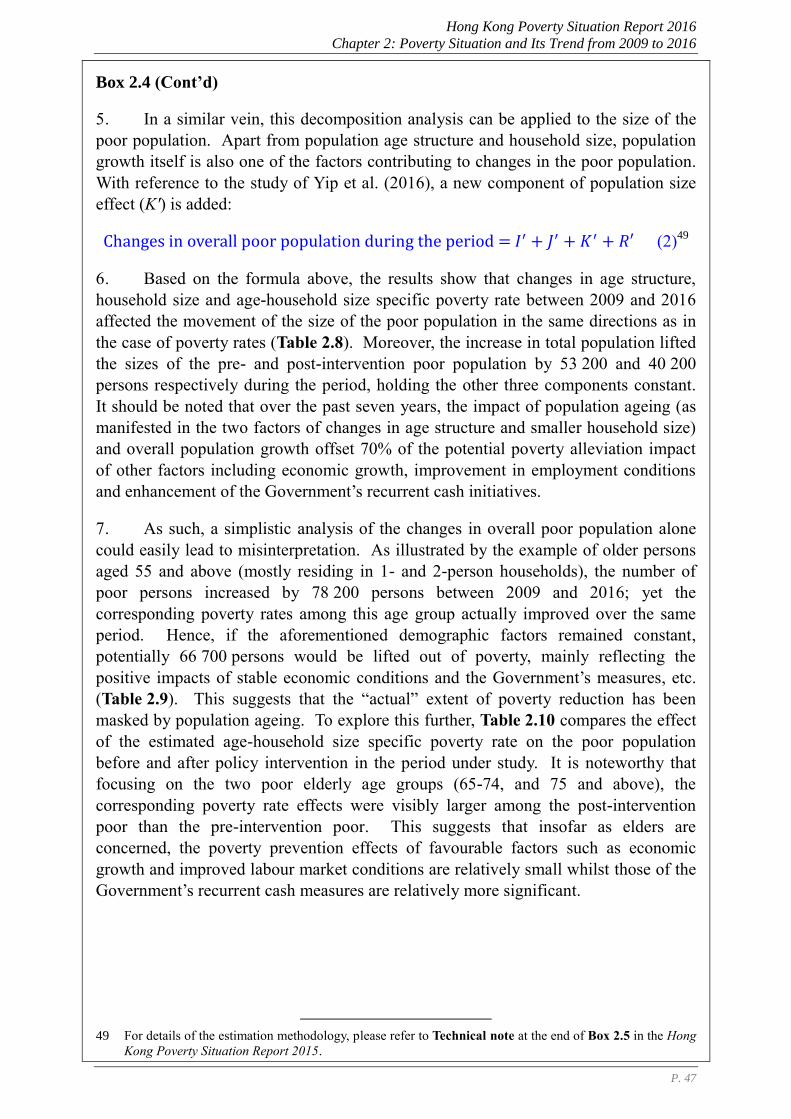
Hong Kong Poverty Situation Report 2016
Chapter 2: Poverty Situation and Its Trend from 2009 to 2016
P. 47
Box 2.4 (Cont’d)
5. In a similar vein, this decomposition analysis can be applied to the size of the
poor population. Apart from population age structure and household size, population
growth itself is also one of the factors contributing to changes in the poor population.
With reference to the study of Yip et al. (2016), a new component of population size
effect (K') is added:
Changes in overall poor population during the period = 𝐼′ + 𝐽′ + 𝐾′ + 𝑅′ (2)49
6. Based on the formula above, the results show that changes in age structure,
household size and age-household size specific poverty rate between 2009 and 2016
affected the movement of the size of the poor population in the same directions as in
the case of poverty rates (Table 2.8). Moreover, the increase in total population lifted
the sizes of the pre- and post-intervention poor population by 53 200 and 40 200
persons respectively during the period, holding the other three components constant.
It should be noted that over the past seven years, the impact of population ageing (as
manifested in the two factors of changes in age structure and smaller household size)
and overall population growth offset 70% of the potential poverty alleviation impact
of other factors including economic growth, improvement in employment conditions
and enhancement of the Government’s recurrent cash initiatives.
7. As such, a simplistic analysis of the changes in overall poor population alone
could easily lead to misinterpretation. As illustrated by the example of older persons
aged 55 and above (mostly residing in 1- and 2-person households), the number of
poor persons increased by 78 200 persons between 2009 and 2016; yet the
corresponding poverty rates among this age group actually improved over the same
period. Hence, if the aforementioned demographic factors remained constant,
potentially 66 700 persons would be lifted out of poverty, mainly reflecting the
positive impacts of stable economic conditions and the Government’s measures, etc.
(Table 2.9). This suggests that the “actual” extent of poverty reduction has been
masked by population ageing. To explore this further, Table 2.10 compares the effect
of the estimated age-household size specific poverty rate on the poor population
before and after policy intervention in the period under study. It is noteworthy that
focusing on the two poor elderly age groups (65-74, and 75 and above), the
corresponding poverty rate effects were visibly larger among the post-intervention
poor than the pre-intervention poor. This suggests that insofar as elders are
concerned, the poverty prevention effects of favourable factors such as economic
growth and improved labour market conditions are relatively small whilst those of the
Government’s recurrent cash measures are relatively more significant.
49 For details of the estimation methodology, please refer to Technical note at the end of Box 2.5 in the Hong
Kong Poverty Situation Report 2015.
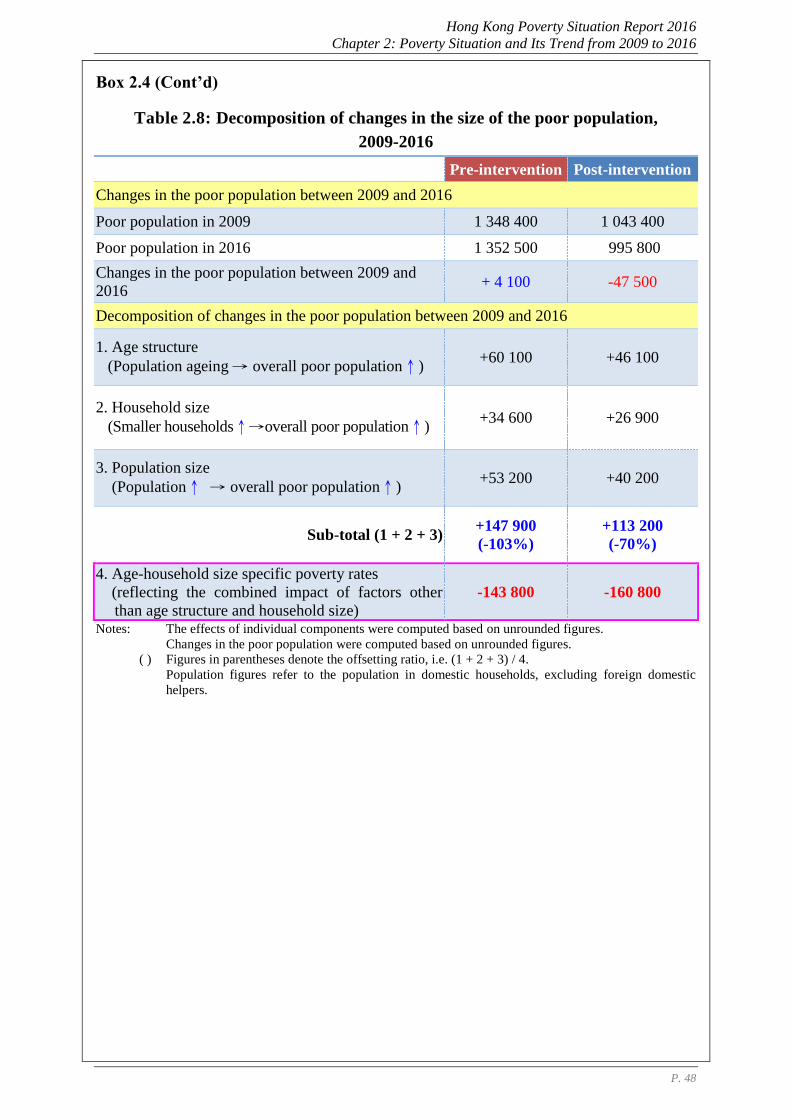
Hong Kong Poverty Situation Report 2016
Chapter 2: Poverty Situation and Its Trend from 2009 to 2016
P. 48
Box 2.4 (Cont’d)
Table 2.8: Decomposition of changes in the size of the poor population,
2009-2016
Pre-intervention Post-intervention
Changes in the poor population between 2009 and 2016
Poor population in 2009 1 348 400 1 043 400
Poor population in 2016 1 352 500 995 800
Changes in the poor population between 2009 and
2016 + 4 100 -47 500
Decomposition of changes in the poor population between 2009 and 2016
1. Age structure
(Population ageing → overall poor population↑) +60 100 +46 100
2. Household size
(Smaller households↑→overall poor population↑) +34 600 +26 900
3. Population size (Population↑ → overall poor population↑)
+53 200 +40 200
Sub-total (1 + 2 + 3) +147 900
(-103%)
+113 200
(-70%)
4. Age-household size specific poverty rates
(reflecting the combined impact of factors other
than age structure and household size)
-143 800 -160 800
Notes: The effects of individual components were computed based on unrounded figures.
Changes in the poor population were computed based on unrounded figures.
( ) Figures in parentheses denote the offsetting ratio, i.e. (1 + 2 + 3) / 4.
Population figures refer to the population in domestic households, excluding foreign domestic
helpers.
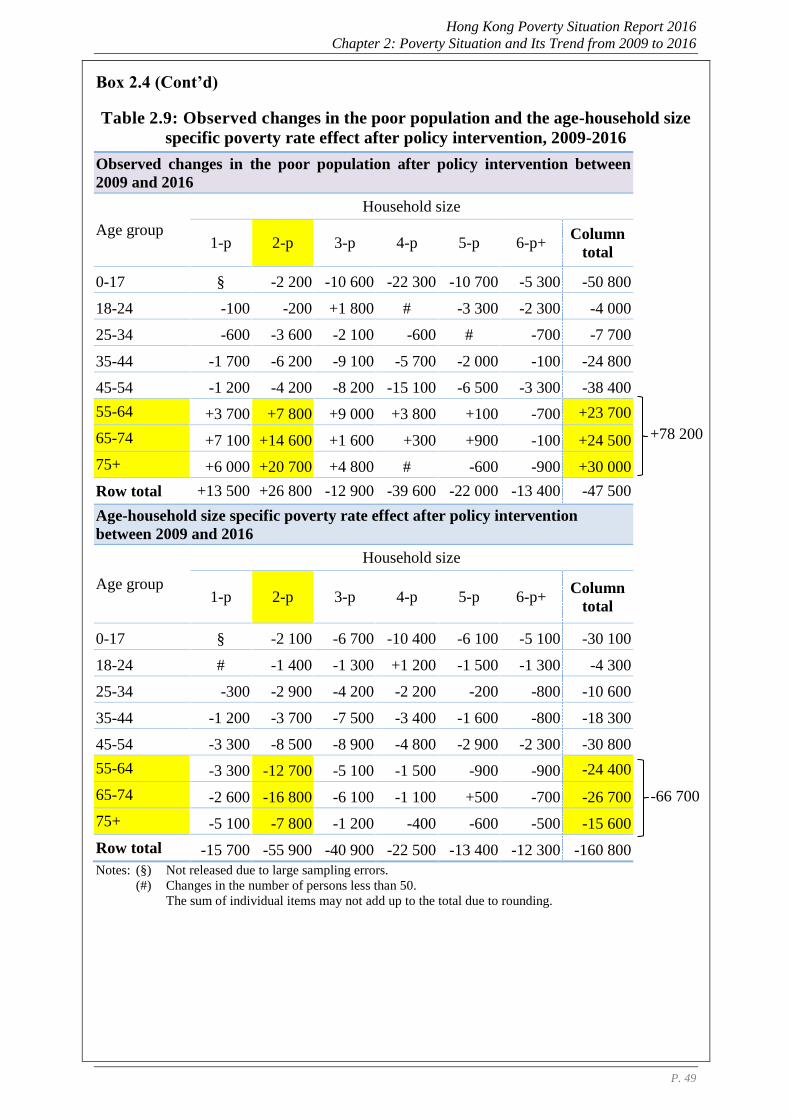
Hong Kong Poverty Situation Report 2016
Chapter 2: Poverty Situation and Its Trend from 2009 to 2016
P. 49
Box 2.4 (Cont’d)
Table 2.9: Observed changes in the poor population and the age-household size
specific poverty rate effect after policy intervention, 2009-2016
Observed changes in the poor population after policy intervention between
2009 and 2016
Age group
Household size
1-p 2-p 3-p 4-p 5-p 6-p+ Column
total
0-17 § -2 200 -10 600 -22 300 -10 700 -5 300 -50 800
18-24 -100 -200 +1 800 # -3 300 -2 300 -4 000
25-34 -600 -3 600 -2 100 -600 # -700 -7 700
35-44 -1 700 -6 200 -9 100 -5 700 -2 000 -100 -24 800
45-54 -1 200 -4 200 -8 200 -15 100 -6 500 -3 300 -38 400
55-64 +3 700 +7 800 +9 000 +3 800 +100 -700 +23 700
65-74 +7 100 +14 600 +1 600 +300 +900 -100 +24 500
75+ +6 000 +20 700 +4 800 # -600 -900 +30 000
Row total +13 500 +26 800 -12 900 -39 600 -22 000 -13 400 -47 500
Age-household size specific poverty rate effect after policy intervention
between 2009 and 2016
Age group
Household size
1-p 2-p 3-p 4-p 5-p 6-p+ Column
total
0-17 § -2 100 -6 700 -10 400 -6 100 -5 100 -30 100
18-24 # -1 400 -1 300 +1 200 -1 500 -1 300 -4 300
25-34 -300 -2 900 -4 200 -2 200 -200 -800 -10 600
35-44 -1 200 -3 700 -7 500 -3 400 -1 600 -800 -18 300
45-54 -3 300 -8 500 -8 900 -4 800 -2 900 -2 300 -30 800
55-64 -3 300 -12 700 -5 100 -1 500 -900 -900 -24 400
65-74 -2 600 -16 800 -6 100 -1 100 +500 -700 -26 700
75+ -5 100 -7 800 -1 200 -400 -600 -500 -15 600
Row total -15 700 -55 900 -40 900 -22 500 -13 400 -12 300 -160 800
Notes: (§) Not released due to large sampling errors.
(#) Changes in the number of persons less than 50.
The sum of individual items may not add up to the total due to rounding.
+78 200
-66 700
Hong Kong Poverty Situation Report 2016
Chapter 2: Poverty Situation and Its Trend from 2009 to 2016
P. 50
Box 2.4 (Cont’d)
Table 2.10: Age-household size specific poverty rate effect
before and after policy intervention, 2009-2016
Age-household size specific poverty rate effect before policy intervention between 2009
and 2016
Age group
Household size
1-p 2-p 3-p 4-p 5-p 6-p+ Column
total
As % of
change*
0-17 § -3 400 -12 100 -7 700 -300 -3 900 -27 300 +19.0%
18-24 -200 -1 900 -3 300 +500 # -2 200 -7 000 +4.9%
25-34 -700 -3 100 -6 400 -1 600 +2 200 +800 -8 600 +6.0%
35-44 -100 -4 200 -9 500 -1 500 +1 700 # -13 600 +9.5%
45-54 -3 900 -10 400 -10 800 -2 900 -1 000 -2 600 -31 500 +21.9%
55-64 -4 700 -20 200 -8 600 -1 600 -400 -600 -36 000 +25.1%
65-74 -4 500 -13 000 -4 300 -700 +1 600 +200 -20 700 +14.4%
75+ -100 -3 000 +2 400 +1 100 +600 +100 +1 000 -0.7%
Row total -13 900 -59 000 -52 600 -14 300 +4 300 -8 300 -143 800 +100.0%
As % of
change* +9.7% +41.0% +36.6% +9.9% -3.0% +5.8% +100.0% -
Age-household size specific poverty rate effect after policy intervention between 2009 and
2016
Age group
Household size
1-p 2-p 3-p 4-p 5-p 6-p+ Column
total
As % of
change*
0-17 § -2 100 -6 700 -10 400 -6 100 -5 100 -30 100 +18.7%
18-24 # -1 400 -1 300 +1 200 -1 500 -1 300 -4 300 +2.7%
25-34 -300 -2 900 -4 200 -2 200 -200 -800 -10 600 +6.6%
35-44 -1 200 -3 700 -7 500 -3 400 -1 600 -800 -18 300 +11.4%
45-54 -3 300 -8 500 -8 900 -4 800 -2 900 -2 300 -30 800 +19.1%
55-64 -3 300 -12 700 -5 100 -1 500 -900 -900 -24 400 +15.2%
65-74 -2 600 -16 800 -6 100 -1 100 +500 -700 -26 700 +16.6%
75+ -5 100 -7 800 -1 200 -400 -600 -500 -15 600 +9.7%
Row total -15 700 -55 900 -40 900 -22 500 -13 400 -12 300 -160 800 +100.0%
As % of
change* +9.8% +34.8% +25.5% +14.0% +8.3% +7.7% +100.0% -
Notes: (*) Figures are calculated based on unrounded figures.
(§) Not released due to large sampling errors.
(#) Changes in the number of persons less than 50.
The sum of individual items may not add up to the total due to rounding.
Hong Kong Poverty Situation Report 2016
Chapter 2: Poverty Situation and Its Trend from 2009 to 2016
P. 51
Box 2.4 (Cont’d)
Expected increasing effects of age structure and household size
8. In view of the above analysis, changes in the population age profile and the
trend towards smaller household size amid population ageing have an apparent lifting
effect on the statistical measures of the poverty rate and the poor population under the
current poverty line framework. Looking ahead, as population ageing will accelerate
in the next 20 years with the projected proportion of elders staying on the rise and
reaching 31.1% of the total population by 2036 (almost double the current level), the
above lifting effect, especially on the elderly poverty statistics, is expected to become
increasingly pronounced (Figure 2.30).
Figure 2.30: Actual and projected share of elderly population
in total population
Concluding remarks
9. Given the ongoing trend of population ageing, the combined effect of age
structure and smaller household size is anticipated to keep offsetting the impacts of
improved economic and labour market conditions as well as the Government’s
measures on poverty alleviation. This structural trend, coupled with the expected
uplift in the poverty line thresholds alongside wage growth, signifies the looming
difficulty in bringing down the poverty rates down the road. The Government will
take proactive measures to tackle challenges from the ageing population on various
fronts. Meanwhile, apart from monitoring the poverty situation and its trend in Hong
Kong, the Government will continue to provide appropriate assistance to local
grassroots households to ease their poverty situation and to achieve poverty
prevention.
898 918 941 979 1 019 1 063 1 114 1 162
1 823
2 372
2 590
13.4 13.6 13.9 14.3 14.8 15.4 16.016.6
24.6
31.1
36.6
0
5
10
15
20
25
30
35
40
2009 2010 2011 2012 2013 2014 2015 2016 2026 2036 2066
0
500
1 000
1 500
2 000
2 500
3 000
3 500
4 000
千 Elderly population (LHS)
Share in total population (RHS)
Population ('000)
Actual Projections
Notes:
Source:
Percent (%)
Population figures refer to Hong Kong resident population, excluding foreign domestic helpers. The source of the figures is different
from that adopted in paragraph 2.4.
Figures in 2012-2015 have been revised to take into account the results of the 2016 Population By-census.
Demographic Statistics Section, Census and Statistics Department.
Hong Kong Poverty Situation Report 2016
Chapter 2: Poverty Situation and Its Trend from 2009 to 2016
P. 52
2.VII Key Observations
2.38 Under the current poverty line framework, poverty statistics are affected by
various factors. Major factors include swings in economic cycles, changes in
demographic and household composition, and the Government’s poverty
alleviation efforts. These factors continued to impact on the poverty statistics
in 2016. On the back of moderate economic expansion and a largely stable
labour market, the grassroots enjoyed sustained income growth. As such, the
size of the poor population in working households fell to a record low, and the
poverty indicators of children showed further improvements. Meanwhile, the
increasing government expenditure on social welfare helped narrow the
poverty gap. The effectiveness of recurrent cash benefits such as CSSA,
OALA, etc. in poverty alleviation remained significant.
2.39 However, as more elders retired with no employment earnings (yet some may
be “asset-rich, income-poor”), coupled with a broad-based uplift of the
poverty line thresholds alongside employment earnings growth, the number of
poor elders went up. The ongoing trend of population ageing and increasing
number of small families resulting from changes in family structure have, to a
certain extent, masked the positive effect of steady economic development on
poverty prevention and alleviation as well as the effectiveness of the
Government’s poverty alleviation measures. All these in turn exerted further
upward pressure on the overall poverty indicators. This also highlights the
limitations of poverty line-related statistics, which must be interpreted with
caution.
2.40 Given the above factors, the numbers of poor households, the sizes of the poor
population and the poverty rates before and after policy intervention in 2016
were as follows:
Before policy intervention: 0.582 million households, 1.352 million
persons and 19.9%;
After policy intervention (recurrent cash): 0.412 million households,
0.996 million persons and 14.7%;
After policy intervention (recurrent + non-recurrent cash):
0.387 million households, 0.934 million persons and 13.7%; and
After policy intervention (recurrent cash + in-kind):
0.304 million households, 0.709 million persons and 10.4%.
2.41 The Government’s welfare expenditure stays on the rise in recent years.
Comparing the poverty indicators before and after policy intervention in 2016
to gauge the effectiveness in poverty alleviation, recurrent cash policies lifted
Hong Kong Poverty Situation Report 2016
Chapter 2: Poverty Situation and Its Trend from 2009 to 2016
P. 53
0.36 million persons out of poverty, with the poverty rate reduced by
5.2 percentage points. The poverty alleviation impact was notably greater
than that from 2009 to 2012, highlighting the enhanced effectiveness of the
Government’s poverty alleviation efforts in recent years.
2.42 After recurrent cash intervention, the overall size of the poor population was
0.996 million persons in 2016, staying below the one million mark for the
fourth consecutive year. Moderate economic growth and further increases in
the Government’s welfare expenditure on poverty alleviation both exerted a
positive impact on the poverty indicators. The size of the poor population in
working households dropped to a new record low. However, in tandem with
population ageing, the size of the poor population in economically inactive
households rose by 22 500 persons alongside an increase in poor elders
therein. Hence, compared with 2015, the overall poor population increased by
24 400 persons and the poverty rate rose by 0.4 percentage point to 14.7%.
2.43 Analysed by age, the respective sizes of the poor population and the poverty
rates after recurrent cash intervention in 2016 were:
Elders aged 65 and above: 0.337 million persons and 31.6%;
Persons aged 18 to 64: 0.487 million persons and 10.3%; and
Children aged below 18: 0.172 million persons and 17.2%.
2.44 After policy intervention in 2016, the number of poor children aged below 18
and their poverty rate fell to their lowest levels since the availability of data,
and by 10 700 persons and 0.8 percentage point respectively when compared
with 2015. Against the backdrop of a declining proportion of poor population
receiving CSSA, the number of poor persons aged 18 to 64 increased by
6 200 and their poverty rate edged up by 0.2 percentage point; further coupled
with the trend of population ageing, the poor population and poverty rate of
elders aged 65 and above increased by 28 900 persons and 1.5 percentage
points respectively.
2.45 Analysed by gender, the respective sizes of the poor population and the
poverty rates after recurrent cash intervention in 2016 were:
Males: 0.456 million persons and 14.0%; and
Females: 0.540 million persons and 15.3%.
2.46 Compared with 2015, the poor population of both males and females
increased after policy intervention in 2016, mainly driven by the increase in
poor elders. The poverty rates of both genders rose by 0.4 percentage point,
but still lower than the 2009 levels by 1.6 and 1.0 percentage point
respectively.
Hong Kong Poverty Situation Report 2016
Chapter 2: Poverty Situation and Its Trend from 2009 to 2016
P. 54
2.47 Analysed by age of household head, the numbers of poor households, the
sizes of the poor population and the poverty rates after recurrent cash
intervention in 2016 were as follows:
Households with head aged 18 to 64: 0.213 million households,
0.610 million persons and 11.2%; and
Households with elderly head aged 65 and above: 0.199 million
households, 0.385 million persons and 28.2%.
2.48 After policy intervention, the number of poor households with head aged 18
to 64 and the size of their poor population rose slightly by 1 900 households
and 3 000 persons respectively in 2016 over a year earlier, yet both lower than
the corresponding figures in 2009. Their poverty rate edged up by
0.1 percentage point to 11.2% when compared with 2015. For households
with elderly head aged 65 and above, the number of poor households and the
size of their poor population increased by 18 300 households and 22 000
persons respectively over a year earlier. Both were higher than the
corresponding figures in 2009. Their poverty rate also rose by 1.0 percentage
point from its year-ago level to 28.2%, but still 4.2 percentage points lower
than the 2009 level.
2.49 It must be pointed out that adopting household income as the sole indicator
for measuring poverty may overstate the poverty situation since some “asset-
rich, income-poor” persons may be classified as poor. In fact, among the poor
population after recurrent cash intervention in 2016, 84.6% (842 900 persons)
resided in non-CSSA households, among whom 539 800 persons (64.0%) had
no financial needs, which were up by 27 500 persons and 0.3 percentage point
when compared with the corresponding figures in 2015 (512 300 persons and
63.7%). Among some 0.34 million poor elders, 87.6% (295 400 persons)
resided in non-CSSA households and over 70% of them (211 100 persons)
had no financial needs to apply for CSSA. In addition, over 60% of the poor
elderly households resided in owner-occupied housing without mortgages,
representing the highest share in eight years. This reflects that many poor
elders do have considerable assets.
2.50 On the other hand, there were 24 200 poor elders in non-CSSA households
who received OALA but still had financial needs in 2016. More targeted
assistance for these elders warrants further exploration.
2.51 Analysed by existing recurrent cash benefit, CSSA remains the most effective
poverty alleviation measure, reducing the poor population by around 0.19
million persons and the overall poverty rate by 2.8 percentage points in 2016.
The effectiveness of OALA, which targets at elders with financial needs, was
Hong Kong Poverty Situation Report 2016
Chapter 2: Poverty Situation and Its Trend from 2009 to 2016
P. 55
also notable in lifting around 0.1 million persons out of poverty and lowering
the poverty rate by 1.5 percentage points, second only to CSSA. Launched in
2016, LIFA also lifted over 0.02 million persons out of poverty and lowered
the poverty rate by 0.3 percentage point. Apart from these recurrent cash
measures, PRH provision, though not a cash benefit, is undeniably effective in
significantly improving the living environment and living standards of
grassroots families. It is estimated to have reduced the poor population by
over 0.23 million persons and the poverty rate by 3.4 percentage points,
demonstrating its sizeable effect on poverty alleviation.
2.52 The overall poverty indicators generally stayed at relatively low levels in
2016, reflecting the significance of economic development and job creation
on one hand, and the substantial achievements of the Government’s poverty
alleviation work on the other.
2.53 Summing up the development of the poverty situation over the past eight
years, the size of the poor population after policy intervention shrank by
47 500 persons cumulatively. Further decomposition of this reduction shows
that the factors of changes in age structure and household downsizing amid
population ageing, as well as population growth are estimated to have added
46 100, 26 900 and 40 200 persons respectively to the poor population. A
detailed data analysis indicates that the interplay of other fundamental factors
affecting the poverty situation over the past few years, including economic
growth, favourable employment situation and strengthened poverty alleviation
efforts of the Government, etc., helped lift 160 800 persons out of poverty in
total, though 70% of such poverty reduction effect was offset by changes in
the above-mentioned three demographic factors. Looking forward, as the
elderly population is estimated to grow substantially from 1.16 million in
201650
to 2.37 million in 2036 and the proportion of elders will increase from
the current one-sixth to over three-tenths of the population, population ageing
will become more acute and is expected to exert mounting upward pressure on
the overall poverty rate. This structural trend, coupled with the expected
uplift in the poverty line thresholds alongside wage growth, signifies the
looming difficulty in the future to continuously bring down the poverty rates.
The Government will monitor the poverty situation and its trend in Hong
Kong, and continue to support the most needy groups in the community with
appropriate measures.
50 Population figures refer to Hong Kong resident population (excluding foreign domestic helpers) and differ
from those in domestic households.
Hong Kong Poverty Situation Report 2016
Chapter 3: Further Analysis of the 2016 Poverty Situation
P. 56
3 Further Analysis of the 2016 Poverty Situation
3.1 Based on the analytical framework endorsed by CoP51
, this Chapter examines
the poverty situation by household group in terms of socio-economic and
housing characteristics, and by age of household head (Figure 3.1), with
particular focus on selected groups that are usually perceived by the
community as relatively underprivileged and in need of assistance, so as to
shed light on the forms and causes of poverty in Hong Kong in 2016.
Figure 3.1: Selected household groups by socio-economic and housing
characteristic and age of household head under the analytical framework
Note: Some of the above household groups are not mutually exclusive. For example, some elderly
households may be classified as economically inactive households, while unemployed households may
be receiving CSSA, and some with-children households may also be single-parent households, etc.
Please refer to the Glossary for their respective definitions.
3.2 This Chapter is broadly divided into three sections: (i) examining the latest
poverty situation of different household groups by socio-economic and
housing characteristic, as well as the age of household head; (ii) analysing the
forms and causes of poverty; and (iii) analysing the poverty situation by
district. A synopsis of each poor household group by household
characteristic and District Council district is presented with handy statistics
and diagrams at the end of this Chapter for quick reference. Detailed
statistics in table form are shown in Appendix 5.
51 Please refer to Appendix 1 for details of the analytical framework of the poverty line.
Poor households
Social
characteristics
Elderly
With-children
有兒童住戶
Youth
Single-parent
New-arrival
Economic
characteristics
Owner-occupiers
Economically
inactive
Economically
active
Working
Unemployed
Including:
Housing
characteristics
Households with
head aged
18 to 64
Households with
head aged 65
and above
With / without
mortgages
Private tenants
Age of
household head
Including:
CSSA PRH
Hong Kong Poverty Situation Report 2016
Chapter 3: Further Analysis of the 2016 Poverty Situation
P. 57
3.I Poverty Situation by Selected Household Group
(a) Analysis in terms of socio-economic characteristics
3.3 Figure 3.2 shows the sizes of the poor population and poverty rates of
different socio-economic household groups before and after policy
intervention52
. The observations are as follows:
In terms of social characteristics, most of the poor persons were from
with-children, CSSA and elderly households both before and after
policy intervention. The size of the poor population in youth
households was the smallest (less than 5 000 persons). Analysing the
0.996 million post-intervention poor persons by economic
characteristic, the shares of those residing in working households and
economically inactive households were similar, at 47.7% and 47.5%
respectively. Less than 5% (4.8%) of the poor persons were from
unemployed households.
Figure 3.2: Poverty rate and poor population
by selected socio-economic group, 2016
52 Unless otherwise specified, “after / post-intervention” refers to “after / post-recurrent cash intervention”.
96.6
70.5
47.1
36.5
20.6
5.8
79.4 77.3
11.5
19.9
43.248.8
34.430.1
15.3
4.7
69.8
59.2
8.0
14.7
[53.4][21.7]
[12.7][6.4]
[5.3]
[1.1]
[9.6]
[18.1]
[3.5][5.2]
0
10
20
30
40
50
60
70
80
90
100
CSSA Elderly Single-parent New-arrival With-children Youth Unemployed Economically
inactive
Working Overall
Pre-intervention
Post-intervention (recurrent cash)
Poverty rate (%)
Social groups Economic groups
342.1 315.4
94.4 79.5
547.8
4.3 53.8
617.9 680.8
1 352.5
152.9 218.6
68.9 65.5
407.6
3.6 47.3
473.3 475.2
995.8
0
200
400
600
800
1 000
1 200
1 400
1 600
CSSA Elderly Single-parent New-arrival With-children Youth Unemployed Economically
inactive
Working Overall
Pre-intervention
Post-intervention (recurrent cash)
住戶數目 59.4 140.1 24.3 19.2 114.1 1.9 19.1 249.3 143.9 412.4
166.0 221.3 32.9 23.1 148.9 2.3 22.2 359.3 200.7 582.2
Poor population ('000)
Note: [ ]Source:
Figures in square brackets denote the percentage point(s) reductions in the poverty rates.General Household Survey, Census and Statistics Department.
Number of
households
('000)
Social groups Economic groups
Hong Kong Poverty Situation Report 2016
Chapter 3: Further Analysis of the 2016 Poverty Situation
P. 58
In terms of poverty rates, CSSA, elderly and single-parent households
(grouped by social attribute) as well as unemployed and economically
inactive households (grouped by economic attribute) were in acute
poverty before policy intervention, with their poverty rates ranging
from nearly 50% to over 90%. However, their poverty rates all fell
significantly after the Government’s recurrent cash intervention,
demonstrating the important function of such cash benefits in income
redistribution. Among these measures, CSSA, as the social safety net,
was particularly effective in poverty alleviation, as evidenced by the
largest reduction in the poverty rate of CSSA households (comparing
the situations before and after policy intervention). As the proportions
of elderly, single-parent and with-children poor households receiving
CSSA were larger, the reductions in their poverty rates were also very
visible. Analysed by economic characteristic, with nearly 30% of
unemployed households and about 35% of economically inactive
households receiving CSSA, the poverty situations of these households
also eased somewhat after policy intervention (Table 3.1).
Table 3.1: CSSA poor households by selected socio-economic group, 2016
Household group
Number of poor households before policy
intervention ('000)
Corresponding
proportion
(%) Total CSSA-receiving
Social group
CSSA 166.0 166.0 100.0
Elderly 221.3 65.4 29.6
Single-parent 32.9 20.3 61.8
New-arrival 23.1 6.1 26.5
With-children 148.9 48.3 32.4
Youth 2.3 § §
Economic group
Unemployed 22.2 6.4 28.8
Economically inactive 359.3 128.2 35.7
Working 200.7 31.4 15.6
Overall 582.2 166.0 28.5
Notes: (§) Not released due to large sampling errors.
Based on poverty statistics before recurrent cash intervention.
Source: General Household Survey, Census and Statistics Department.
Hong Kong Poverty Situation Report 2016
Chapter 3: Further Analysis of the 2016 Poverty Situation
P. 59
3.4 The poverty situation of most socio-economic groups was alleviated as
compared with 2015 (Table 3.2). Based on the changes in post-intervention
poverty rate as an indicator, the poverty situation of various household
groups can be classified into three categories:
Improved poverty situation: in 2016, the numbers of poor
households, the sizes of the poor population and the poverty rates of
CSSA, single-parent, new-arrival and with-children households all fell
over the previous year and reached record lows. The year-on-year
reductions in poverty rates of these groups ranged from 0.7 to
1.7 percentage points. Thanks to the broadly stable labour market in
2016 and faster-than-overall wage growth of grassroots workers,
coupled with larger proportions of higher-skilled workers among
employed persons in these households, their poverty situations (except
CSSA households)53
generally improved even before policy
intervention. In particular, the post-intervention poverty rates of new-
arrival, single-parent and with-children poor households declined
further, which was closely related to the higher shares of these
households that were receiving recurrent cash benefits (such as CSSA,
LIFA, education benefits, etc.). The post-intervention poverty rate of
CSSA poor households recorded a notable decline of 1.2 percentage
points over the previous year, manifesting the important function of
recurrent cash benefits in income redistribution.
Similar poverty situation as that of the preceding year: the poor
population of working households shrank further over a year earlier
while their poverty rate remained unchanged. Although the poor
population in unemployed households increased, its poverty rate edged
down by 0.1 percentage point.
Notable rise in poverty rate: the poverty rates of elderly,
economically inactive and youth households rose by 1.8, 1.0 and
1.1 percentage points respectively. The pre-intervention poverty rate
of elderly households actually declined, reflecting a slight increase in
the share of full-time working elders therein (up from 4.6% to 4.8%).
After policy intervention, both the number of poor households and the
size of the poor population of elderly households increased over a year
earlier and the poverty rate rose, probably related to a drop in the
proportion of pre-intervention poor CSSA households therein (down
from 32.7% to 29.6%). As nearly 60% of economically inactive
53 In 2016, the poverty rate of CSSA households before policy intervention (96.6%) edged up by
0.1 percentage point over a year earlier.
Hong Kong Poverty Situation Report 2016
Chapter 3: Further Analysis of the 2016 Poverty Situation
P. 60
households were elderly households, the increases in the number of
poor households and the size of poor population were similar to those
of poor elderly households. As for poor youth households, their
poverty rate went up before policy intervention, primarily because the
share of economically inactive persons therein increased (up from
76.2% to 86.4%) and these households typically did not take up CSSA.
3.5 Although the poverty situations of single-parent and new-arrival households
improved in 2016, both the pre- and post-intervention poverty rates of these
households were still relatively high, more than double the overall levels.
This situation warrants attention. Box 3.1 further analyses the poverty
situation of these two groups and the causes of their poverty.
3.6 It is worth mentioning that Hong Kong’s macroeconomic conditions held
broadly stable and the unemployment rate fell notably after 2009. For most
of the groups with higher proportions of full-time working population,
including new-arrival, with-children and working households, their post-
intervention poor population and poverty rates all fell to eight-year lows. As
many families were able to exit from the CSSA net and became self-reliant
during the period, the numbers of households and individuals receiving
CSSA continued to decline. The numbers of CSSA poor households and
poor persons living therein, and the corresponding poverty rate were at their
lowest levels in eight years. Moreover, when compared with 2009, the
number of persons in poor unemployed households in 2016 decreased
markedly by nearly 50%, and that of poor working households also fell by
12.5%. However, as the elderly and economically inactive households lacked
employment earnings, their poverty rates, though improved somewhat, were
still three to four times the overall level. This clearly underscores the
importance of sustained economic development in lifting low-income
working families out of poverty. However, retired households without
employment earnings are less likely to benefit from such favourable factors
as economic growth and a stable labour market.
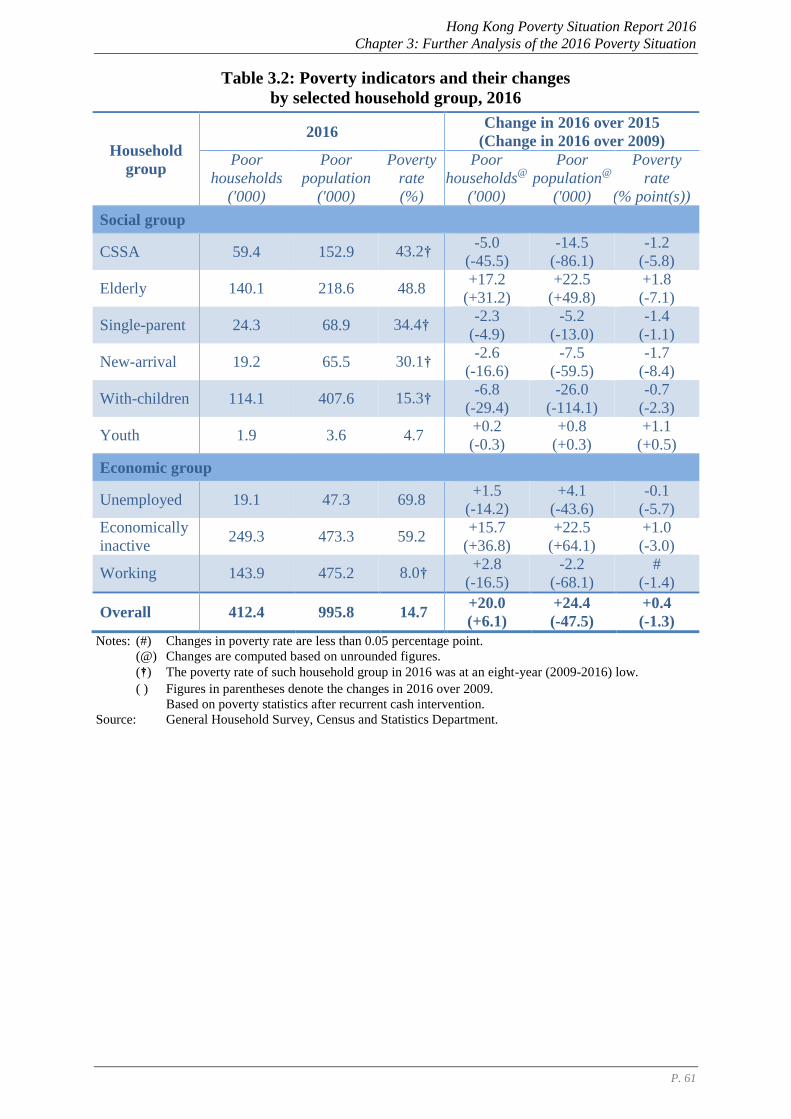
Hong Kong Poverty Situation Report 2016
Chapter 3: Further Analysis of the 2016 Poverty Situation
P. 61
Table 3.2: Poverty indicators and their changes
by selected household group, 2016
Household
group
2016 Change in 2016 over 2015
(Change in 2016 over 2009)
Poor
households
('000)
Poor
population
('000)
Poverty
rate
(%)
Poor
households@
('000)
Poor
population@
('000)
Poverty
rate
(% point(s))
Social group
CSSA 59.4 152.9 43.2† -5.0
(-45.5)
-14.5
(-86.1)
-1.2
(-5.8)
Elderly 140.1 218.6 48.8 +17.2
(+31.2)
+22.5
(+49.8)
+1.8
(-7.1)
Single-parent 24.3 68.9 34.4† -2.3
(-4.9)
-5.2
(-13.0)
-1.4
(-1.1)
New-arrival 19.2 65.5 30.1† -2.6
(-16.6)
-7.5
(-59.5)
-1.7
(-8.4)
With-children 114.1 407.6 15.3† -6.8
(-29.4)
-26.0
(-114.1)
-0.7
(-2.3)
Youth 1.9 3.6 4.7 +0.2
(-0.3)
+0.8
(+0.3)
+1.1
(+0.5)
Economic group
Unemployed 19.1 47.3 69.8 +1.5
(-14.2)
+4.1
(-43.6)
-0.1
(-5.7)
Economically
inactive 249.3 473.3 59.2
+15.7
(+36.8)
+22.5
(+64.1)
+1.0
(-3.0)
Working 143.9 475.2 8.0† +2.8
(-16.5)
-2.2
(-68.1)
#
(-1.4)
Overall 412.4 995.8 14.7 +20.0
(+6.1)
+24.4
(-47.5)
+0.4
(-1.3)
Notes: (#) Changes in poverty rate are less than 0.05 percentage point.
(@) Changes are computed based on unrounded figures.
(†) The poverty rate of such household group in 2016 was at an eight-year (2009-2016) low.
( ) Figures in parentheses denote the changes in 2016 over 2009.
Based on poverty statistics after recurrent cash intervention.
Source: General Household Survey, Census and Statistics Department.
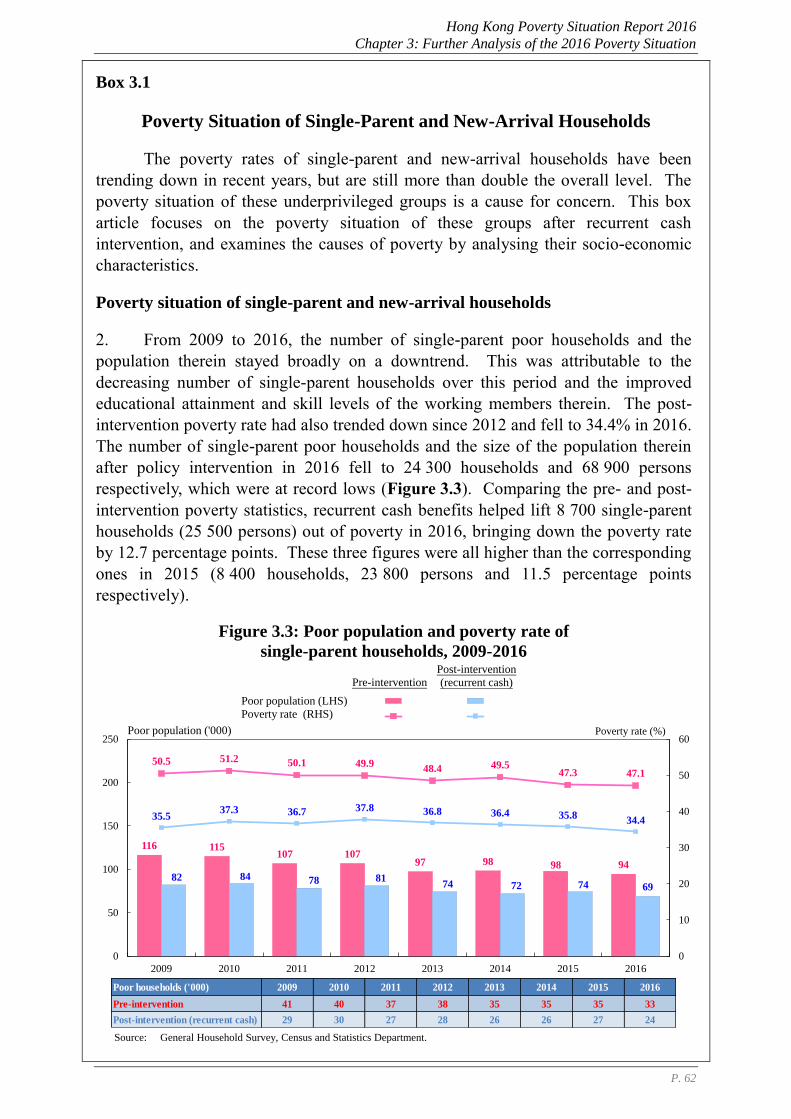
Hong Kong Poverty Situation Report 2016
Chapter 3: Further Analysis of the 2016 Poverty Situation
P. 62
Box 3.1
Poverty Situation of Single-Parent and New-Arrival Households
The poverty rates of single-parent and new-arrival households have been
trending down in recent years, but are still more than double the overall level. The
poverty situation of these underprivileged groups is a cause for concern. This box
article focuses on the poverty situation of these groups after recurrent cash
intervention, and examines the causes of poverty by analysing their socio-economic
characteristics.
Poverty situation of single-parent and new-arrival households
2. From 2009 to 2016, the number of single-parent poor households and the
population therein stayed broadly on a downtrend. This was attributable to the
decreasing number of single-parent households over this period and the improved
educational attainment and skill levels of the working members therein. The post-
intervention poverty rate had also trended down since 2012 and fell to 34.4% in 2016.
The number of single-parent poor households and the size of the population therein
after policy intervention in 2016 fell to 24 300 households and 68 900 persons
respectively, which were at record lows (Figure 3.3). Comparing the pre- and post-
intervention poverty statistics, recurrent cash benefits helped lift 8 700 single-parent
households (25 500 persons) out of poverty in 2016, bringing down the poverty rate
by 12.7 percentage points. These three figures were all higher than the corresponding
ones in 2015 (8 400 households, 23 800 persons and 11.5 percentage points
respectively).
Figure 3.3: Poor population and poverty rate of
single-parent households, 2009-2016
116 115107 107
97 98 98 94
82 84 78 8174 72 74 69
50.5 51.2 50.1 49.9 48.4 49.5
47.3 47.1
35.5 37.3 36.7 37.8 36.8 36.4 35.8
34.4
0
10
20
30
40
50
60
0
50
100
150
200
250
2009 2010 2011 2012 2013 2014 2015 2016
數列3 數列2
數列4 數列1
Source: General Household Survey, Census and Statistics Department.
Poverty rate (%)Poor population ('000)
Pre-intervention
Post-intervention
(recurrent cash)
Poor population (LHS)
Poverty rate (RHS)
Poor households ('000) 2009 2010 2011 2012 2013 2014 2015 2016
Pre-intervention 41 40 37 38 35 35 35 33
Post-intervention (recurrent cash) 29 30 27 28 26 26 27 24
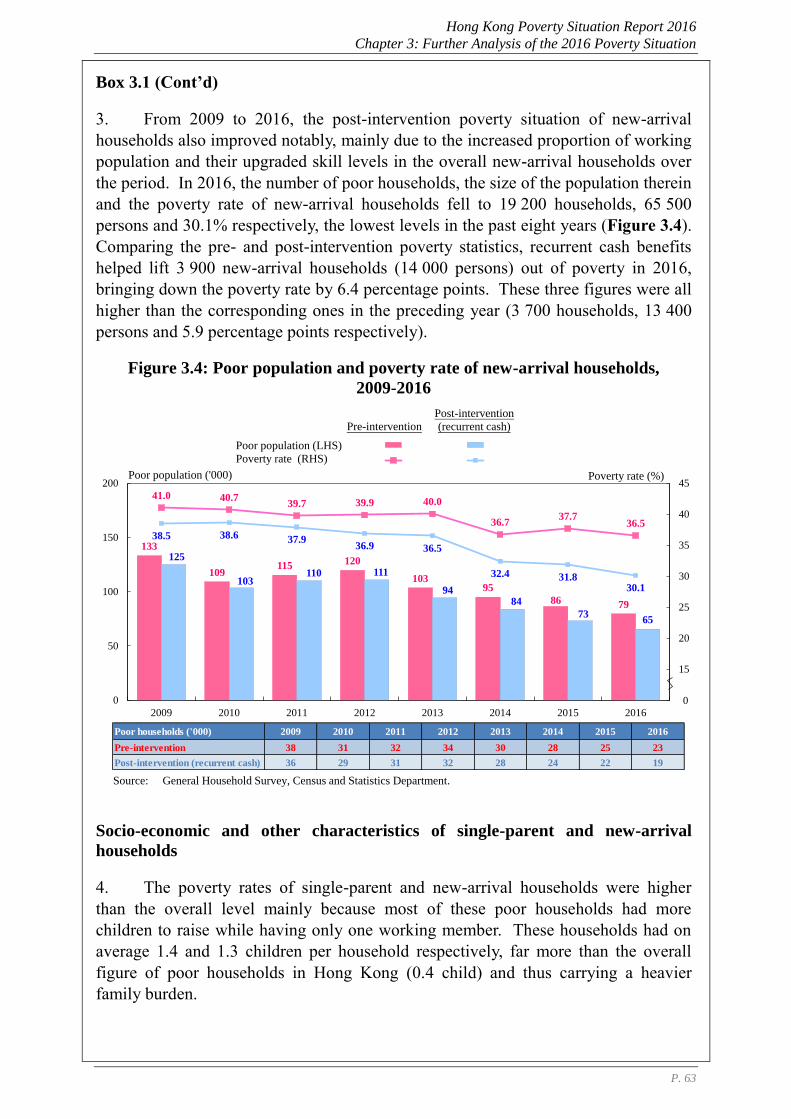
Hong Kong Poverty Situation Report 2016
Chapter 3: Further Analysis of the 2016 Poverty Situation
P. 63
Box 3.1 (Cont’d)
3. From 2009 to 2016, the post-intervention poverty situation of new-arrival
households also improved notably, mainly due to the increased proportion of working
population and their upgraded skill levels in the overall new-arrival households over
the period. In 2016, the number of poor households, the size of the population therein
and the poverty rate of new-arrival households fell to 19 200 households, 65 500
persons and 30.1% respectively, the lowest levels in the past eight years (Figure 3.4).
Comparing the pre- and post-intervention poverty statistics, recurrent cash benefits
helped lift 3 900 new-arrival households (14 000 persons) out of poverty in 2016,
bringing down the poverty rate by 6.4 percentage points. These three figures were all
higher than the corresponding ones in the preceding year (3 700 households, 13 400
persons and 5.9 percentage points respectively).
Figure 3.4: Poor population and poverty rate of new-arrival households,
2009-2016
Socio-economic and other characteristics of single-parent and new-arrival
households
4. The poverty rates of single-parent and new-arrival households were higher
than the overall level mainly because most of these poor households had more
children to raise while having only one working member. These households had on
average 1.4 and 1.3 children per household respectively, far more than the overall
figure of poor households in Hong Kong (0.4 child) and thus carrying a heavier
family burden.
133
109115 120
10395
86 79
125
103110 111
9484
7365
41.0 40.7 39.7 39.9 40.0
36.7 37.7
36.5
38.5 38.6 37.9 36.9 36.5
32.4 31.8 30.1
10
15
20
25
30
35
40
45
0
50
100
150
200
2009 2010 2011 2012 2013 2014 2015 2016
數列3 數列2
數列4 數列1
Source: General Household Survey, Census and Statistics Department.
Poverty rate (%)Poor population ('000)
Pre-intervention
Post-intervention
(recurrent cash)
0
Poor population (LHS)
Poverty rate (RHS)
Poor households ('000) 2009 2010 2011 2012 2013 2014 2015 2016
Pre-intervention 38 31 32 34 30 28 25 23
Post-intervention (recurrent cash) 36 29 31 32 28 24 22 19
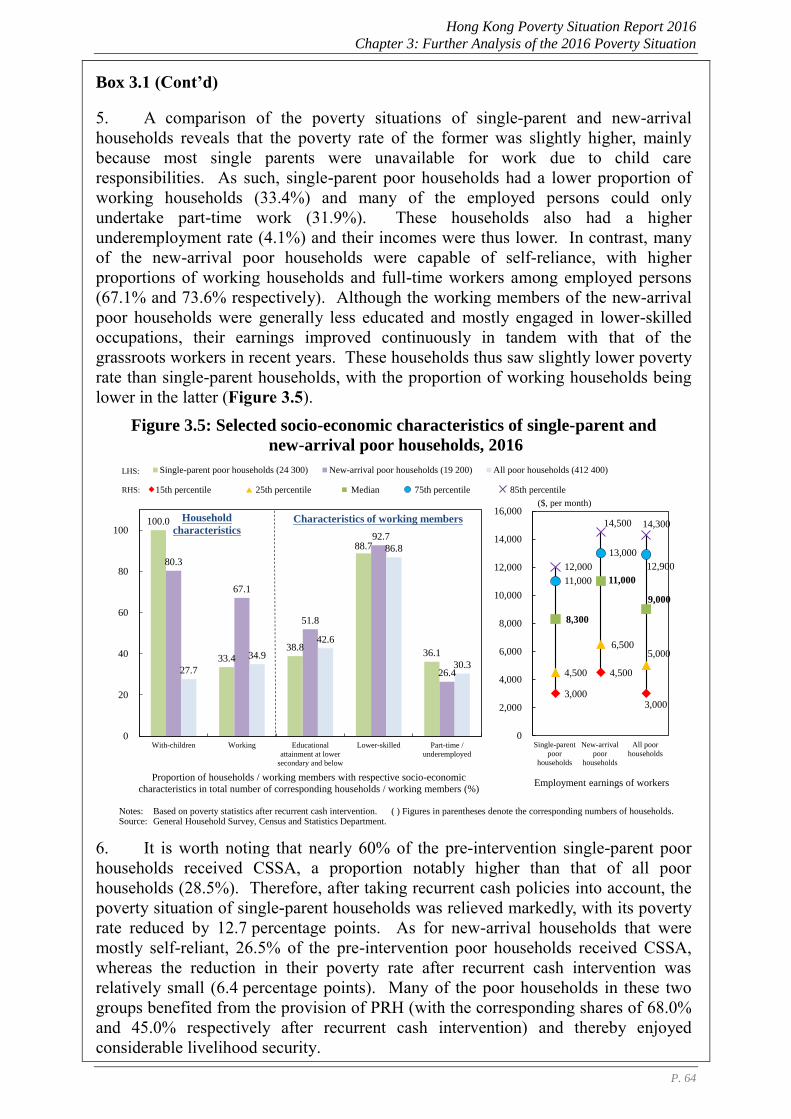
Hong Kong Poverty Situation Report 2016
Chapter 3: Further Analysis of the 2016 Poverty Situation
P. 64
Box 3.1 (Cont’d)
5. A comparison of the poverty situations of single-parent and new-arrival
households reveals that the poverty rate of the former was slightly higher, mainly
because most single parents were unavailable for work due to child care
responsibilities. As such, single-parent poor households had a lower proportion of
working households (33.4%) and many of the employed persons could only
undertake part-time work (31.9%). These households also had a higher
underemployment rate (4.1%) and their incomes were thus lower. In contrast, many
of the new-arrival poor households were capable of self-reliance, with higher
proportions of working households and full-time workers among employed persons
(67.1% and 73.6% respectively). Although the working members of the new-arrival
poor households were generally less educated and mostly engaged in lower-skilled
occupations, their earnings improved continuously in tandem with that of the
grassroots workers in recent years. These households thus saw slightly lower poverty
rate than single-parent households, with the proportion of working households being
lower in the latter (Figure 3.5).
Figure 3.5: Selected socio-economic characteristics of single-parent and
new-arrival poor households, 2016
6. It is worth noting that nearly 60% of the pre-intervention single-parent poor
households received CSSA, a proportion notably higher than that of all poor
households (28.5%). Therefore, after taking recurrent cash policies into account, the
poverty situation of single-parent households was relieved markedly, with its poverty
rate reduced by 12.7 percentage points. As for new-arrival households that were
mostly self-reliant, 26.5% of the pre-intervention poor households received CSSA,
whereas the reduction in their poverty rate after recurrent cash intervention was
relatively small (6.4 percentage points). Many of the poor households in these two
groups benefited from the provision of PRH (with the corresponding shares of 68.0%
and 45.0% respectively after recurrent cash intervention) and thereby enjoyed
considerable livelihood security.
100.0
33.4 38.8
88.7
36.1
80.3
67.1
51.8
92.7
26.427.7
34.9
42.6
86.8
30.3
0
20
40
60
80
100
With-children Working Educational
attainment at lower
secondary and below
Lower-skilled Part-time /
underemployed
Single-parent poor households (24 300) New-arrival poor households (19 200) All poor households (412 400)
Proportion of households / working members with respective socio-economic
characteristics in total number of corresponding households / working members (%)
Notes:Source:
Based on poverty statistics after recurrent cash intervention. ( ) Figures in parentheses denote the corresponding numbers of households.General Household Survey, Census and Statistics Department.
3,000
4,500
3,000
4,500
6,500 5,000
8,300
11,000
9,000
11,000
13,000
12,900 12,000
14,500 14,300
0
2,000
4,000
6,000
8,000
10,000
12,000
14,000
16,000
Single-parent
poor
households
New-arrival
poor
households
All poor
households
($, per month)
Employment earnings of workers
15th percentile 25th percentile Median 75th percentile 85th percentile
LHS:
RHS:
Household
characteristicsCharacteristics of working members
Hong Kong Poverty Situation Report 2016
Chapter 3: Further Analysis of the 2016 Poverty Situation
P. 65
(b) Analysis by housing type
3.7 Analysing poverty statistics by housing type (Figure 3.6), key observations
are as follows:
The majority of the poor population resided in PRH or owner-
occupied housing: nearly half of the poor population (49.4% or
668 400 persons) resided in PRH before policy intervention. After
policy intervention, more than four-tenths of the poor population
resided in PRH (41.6% or 414 700 persons), whereas 45.9% of the
poor population (457 400 persons) resided in owner-occupier
households. Private tenants made up only 8.8% of the poor
population, comprising 87 200 persons.
Owner-occupier poor households were mostly without mortgages54
and the poor population therein were mostly elders: after policy
intervention, among the poor population residing in owner-occupied
housing, nearly nine-tenths (87.2%) were in households without
mortgages. Their poverty rate (17.1%) was visibly higher than that of
their counterparts with mortgages (4.8%). A point worth noting was
that more than eight-tenths (83.3%) of the poor population in the
former group were economically inactive, and among them more than
half (54.8%) were elders. Conceivably, some of them were “asset-
rich, income-poor” retired elders, as evidenced by the fact that nearly
three quarters (74.7%) of poor elders residing in non-CSSA owner-
occupier households without mortgages had no financial needs.
More significant poverty alleviation effect of policy intervention on
PRH poor households: compared with other housing types, relatively
more poor households in PRH received CSSA or OALA. Although
the pre-intervention poverty rate of PRH households was
comparatively high, the reduction in poverty rate after factoring in the
recurrent cash benefits was notable (12.4 percentage points), indicating
that many of these low-income households could be lifted out of
poverty after benefiting from the Government’s policy intervention.
3.8 As pointed out in Section 2.IV(c), the post-intervention poverty statistics
have taken into account the effects of recurrent cash benefits and taxation.
As the analytical framework of the poverty line focuses on lower-income
household groups, their post-intervention incomes are generally not much
54 In this Report, owner-occupied housing with mortgages refers to housing of this kind with mortgages or
loans. Owner-occupied housing without mortgages refers to housing of this kind without mortgages and
loans.
Hong Kong Poverty Situation Report 2016
Chapter 3: Further Analysis of the 2016 Poverty Situation
P. 66
affected by taxation (in particular salaries tax). Nevertheless, in tandem with
the uptrend of private property prices over the past few years, the rates /
Government rent payable by the households residing in private properties
went up. As revealed in the poverty statistics over the past few years, against
the backdrop of population ageing, an increasing proportion of post-
intervention poor households resided in owner-occupied housing or were
private tenants (up from 50.0% in 2009 to 58.4% in 2016), conceivably with
many elders therein with low or even without income. The increase in rates /
Government rent as indirect taxes has some bearing on the post-intervention
incomes of these households.
Figure 3.6: Poverty rate and poor population by housing type, 2016
3.9 Observations based on the analysis of the socio-economic characteristics of
households by housing type are as follows (Figure 3.7):
668.4
446.4510.0
135.063.6
1 352.5
414.7 398.8457.4
87.2 58.6
995.8
0
200
400
600
800
1 000
1 200
1 400
1 600
PRH Owner-occupiers -
without mortgages
Owner-
occupiers
Private tenants Owner-occupiers -
with mortgages
Overall
Pre-intervention
Post-intervention (recurrent cash)
152.5 188.8 209.2 31.6 20.4 412.4
283.3 206.2 227.9 50.5 21.7 582.2
*
Notes:(^)
[ ]Source:
Including those with and without mortgages and loans.
Including PRH households, private tenant households and owner-occupier households, as well as other households
(including rent-free households and households with accommodation provided by employers).
Figures in square brackets denote the percentage point(s) reductions in the poverty rate.
General Household Survey, Census and Statistics Department.
^
Poor population ('000)
Number of
households
('000)
(*)
32.5
19.1
14.4 14.2
5.3
19.920.1
17.1
12.9
9.2
4.8
14.7
0
5
10
15
20
25
30
35
40
45
50
PRH Owner-occupiers -
without mortgages
Owner-
occupiers
Private tenants Owner-occupiers -
with mortgages
Overall
Pre-intervention
Post-intervention (recurrent cash)
[12.4]
[2.0]
[1.5]
[5.0]
[5.2]
[0.5]
*
^
Poverty rate (%)
Hong Kong Poverty Situation Report 2016
Chapter 3: Further Analysis of the 2016 Poverty Situation
P. 67
One characteristic common to PRH tenants and private tenants in
poverty was a visibly higher proportion of with-children households
(38.4% and 56.0% respectively) than the 27.7% of overall poor
households, reflecting their heavier family burdens. Moreover, within
these two groups, about 45% were working households (higher than
the 27.3% for owner-occupier households) and about 70% of their
working members were in full-time employment. However, with
lower educational attainment and mostly engaged in lower-skilled
occupations, their employment earnings were generally not high.
Nearly two-thirds (66.5%) of the poor households in owner-occupied
housing had elderly members and 43.2% of the poor population
therein were elders. It is noteworthy that the majority (90.2%) of
households in this housing type were without mortgages and only
3.4% were on CSSA. Furthermore, most of the persons residing in the
non-CSSA households in this housing type (69.6%) did not apply for
CSSA due to no financial needs, suggesting that quite a number of
them might be retired elders with some assets.
Figure 3.7: Selected socio-economic characteristics of poor households
by housing type, 2016
3.10 In 2016, the number of PRH poor households, the poor population therein
and their poverty rate after policy intervention all declined as compared with
2015, with the three figures hitting new lows in eight years. Their poverty
29.1
38.4
51.5 45.1
50.6
92.7
30.9
21.6
56.0
23.2
43.2
34.8
78.2
22.6
3.4
16.1
66.5
27.3
35.5
82.1
31.3
14.4
27.7
57.4
34.9
42.6
86.8
30.3
0
20
40
60
80
100
120
CSSA With-children With-elder(s) Working Educational
attainment at lower
secondary and below
Lower-skilled Part-time /
underemployed
PRH poor households (152 500) Private tenant poor households (31 600)
Owner-occupier poor households (209 200) All poor households^ (412 400)
Household characteristics Characteristics of working members
Notes: (^)
( )
Source:
Including PRH households, private tenant households and owner-occupier households, as well as other households (including rent-free households and households with accommodation provided by employers).Figures in parentheses denote the corresponding numbers of households.Based on poverty statistics after recurrent cash intervention.General Household Survey, Census and Statistics Department.
Proportion of households / working members with respective socio-economic characteristics in
total number of corresponding households / working members (%)
Hong Kong Poverty Situation Report 2016
Chapter 3: Further Analysis of the 2016 Poverty Situation
P. 68
situation improved before policy intervention as the proportions of working
population and workers engaged in higher-skilled occupations in this group
increased. Among private tenants, the number of poor households and the
size of the poor population increased slightly, while the poverty rate
remained unchanged at 9.2% as compared with 2015. For owner-occupier
households, the size of the poor population therein went up, with around two-
thirds of the increase being elders. Its poverty rate also rose, by
1.2 percentage points to 12.9%, mainly due to a higher proportion of poor
elders and a lower proportion of full-time workers in this group (Table 3.3).
Table 3.3: Poverty indicators and their changes
by housing type, 2016
Housing
type
2016 Change in 2016 over 2015
(Change in 2016 over 2009)
Poor
households
('000)
Poor
population
('000)
Poverty
rate
(%)
Poor
households@
('000)
Poor
population@
('000)
Poverty
rate
(% point(s))
PRH 152.5 414.7 20.1† -4.9
(-35.4)
-21.6
(-95.3)
-1.0
(-5.6)
Private
tenants 31.6 87.2 9.2
+0.5
(+9.6)
+0.8
(+27.5)
#
(+0.8)
Owner-
occupiers 209.2 457.4 12.9
+21.4
(+28.2)
+38.9
(+11.8)
+1.2
(+0.6)
Overall^ 412.4 995.8 14.7 +20.0
(+6.1)
+24.4
(-47.5)
+0.4
(-1.3)
Notes: (@) Changes are computed based on unrounded figures.
(#) Changes are less than 0.05 percentage point.
(^) Including PRH households, private tenant households and owner-occupier households, as well as
other households (including rent-free households and households with accommodation provided by
employers).
(†) The poverty rate of such housing type in 2016 was at an eight-year (2009-2016) low.
( ) Figures in parentheses denote the changes in 2016 over 2009.
Based on poverty statistics after recurrent cash intervention.
Source: General Household Survey, Census and Statistics Department.
(c) Analysis in terms of age of household head
3.11 Section 2.VI has analysed the poverty situation and its trend by age of
household head from 2009 to 2016. Focusing on the situation in 2016, the
pre-intervention poverty rate of households with elderly head aged 65 and
above was 40.2%, much higher than the 14.8% for households with head
aged 18 to 64. After policy intervention, the poverty rate of the households
with elderly head was reduced substantially to 28.2%, as the proportion of
these households benefiting from the Government’s recurrent cash benefits
was high. This reduction of 12.0 percentage points in the poverty rate was
much larger than the corresponding 3.6 percentage points for households with
head aged 18 to 64, thanks in particular to OALA, which has significantly
Hong Kong Poverty Situation Report 2016
Chapter 3: Further Analysis of the 2016 Poverty Situation
P. 69
alleviated the poverty situation of households with elderly head since its
launch in 2013. However, the poverty rate of these households was still
relatively high, about double the overall level (14.7%) (Figure 3.8).
Figure 3.8: Poverty rate and poor population
by age of household head, 2016
3.12 Comparing 2016 with 2015, among households with head aged 18 to 64, as
the proportion of elderly population and the unemployment rate of
economically active members therein increased at the same time, the pre-
intervention poverty rate edged up by 0.1 percentage point. Moreover, as the
proportion of CSSA households in this group fell, the poverty rate increased
by 0.1 percentage point even after policy intervention. For households with
elderly head, the post-intervention poverty rate rose by 1.0 percentage point
as well. This might be related to the decline in the proportion of CSSA
households in this group (Table 3.4).
14.8
40.2
19.9
11.2
28.2
14.7
0
5
10
15
20
25
30
35
40
45
50
Households with head
aged 18-64
Households with head
aged 65 and above
Overall
Pre-intervention
Post-intervention (recurrent cash)
[3.6]
[12.0]
[5.2]
^
Poverty rate (%)
804.2
547.2
1 352.5
610.4
384.7
995.8
0
200
400
600
800
1 000
1 200
1 400
1 600
Households with head
aged 18-64
Households with head
aged 65 and above
Overall
Pre-intervention
Post-intervention (recurrent cash)
212.7 199.2 412.4
280.7 301.0 582.2
Notes: (^) [ ]
Source:
Including households with head aged below 18.Figures in square brackets denote the percentage point(s) reductions in the poverty rate.
General Household Survey, Census and Statistics Department.
^
Poor population ('000)
Number of
households
('000)
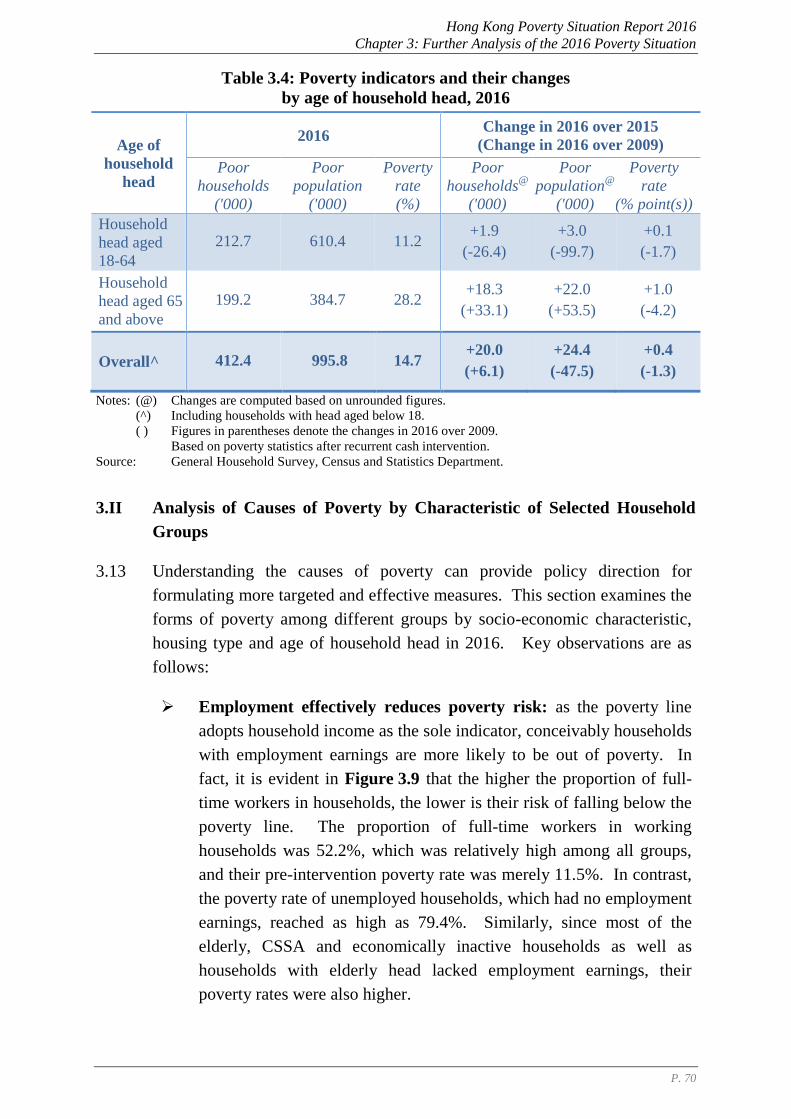
Hong Kong Poverty Situation Report 2016
Chapter 3: Further Analysis of the 2016 Poverty Situation
P. 70
Table 3.4: Poverty indicators and their changes
by age of household head, 2016
Age of
household
head
2016 Change in 2016 over 2015
(Change in 2016 over 2009)
Poor
households
('000)
Poor
population
('000)
Poverty
rate
(%)
Poor
households@
('000)
Poor
population@
('000)
Poverty
rate
(% point(s))
Household
head aged
18-64
212.7 610.4 11.2 +1.9
(-26.4)
+3.0
(-99.7)
+0.1
(-1.7)
Household
head aged 65
and above
199.2 384.7 28.2 +18.3
(+33.1)
+22.0
(+53.5)
+1.0
(-4.2)
Overall^ 412.4 995.8 14.7 +20.0
(+6.1)
+24.4
(-47.5)
+0.4
(-1.3)
Notes: (@) Changes are computed based on unrounded figures.
(^) Including households with head aged below 18.
( ) Figures in parentheses denote the changes in 2016 over 2009.
Based on poverty statistics after recurrent cash intervention.
Source: General Household Survey, Census and Statistics Department.
3.II Analysis of Causes of Poverty by Characteristic of Selected Household
Groups
3.13 Understanding the causes of poverty can provide policy direction for
formulating more targeted and effective measures. This section examines the
forms of poverty among different groups by socio-economic characteristic,
housing type and age of household head in 2016. Key observations are as
follows:
Employment effectively reduces poverty risk: as the poverty line
adopts household income as the sole indicator, conceivably households
with employment earnings are more likely to be out of poverty. In
fact, it is evident in Figure 3.9 that the higher the proportion of full-
time workers in households, the lower is their risk of falling below the
poverty line. The proportion of full-time workers in working
households was 52.2%, which was relatively high among all groups,
and their pre-intervention poverty rate was merely 11.5%. In contrast,
the poverty rate of unemployed households, which had no employment
earnings, reached as high as 79.4%. Similarly, since most of the
elderly, CSSA and economically inactive households as well as
households with elderly head lacked employment earnings, their
poverty rates were also higher.
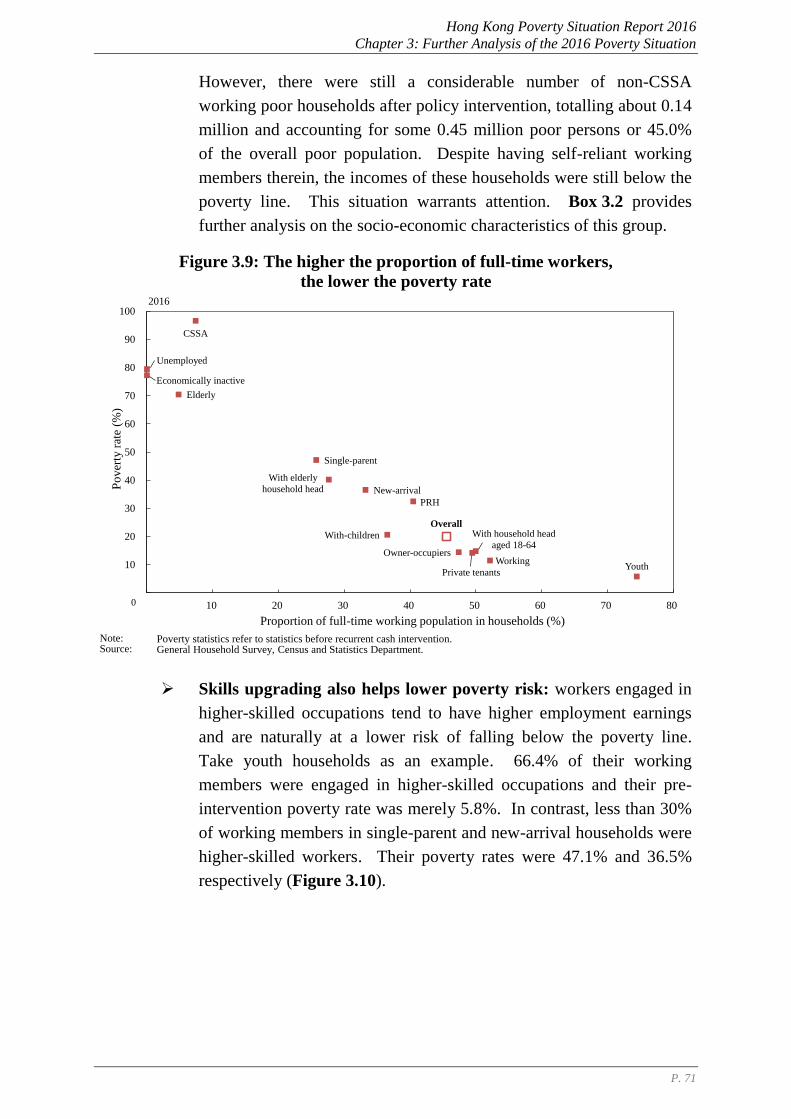
Hong Kong Poverty Situation Report 2016
Chapter 3: Further Analysis of the 2016 Poverty Situation
P. 71
However, there were still a considerable number of non-CSSA
working poor households after policy intervention, totalling about 0.14
million and accounting for some 0.45 million poor persons or 45.0%
of the overall poor population. Despite having self-reliant working
members therein, the incomes of these households were still below the
poverty line. This situation warrants attention. Box 3.2 provides
further analysis on the socio-economic characteristics of this group.
Figure 3.9: The higher the proportion of full-time workers,
the lower the poverty rate
Skills upgrading also helps lower poverty risk: workers engaged in
higher-skilled occupations tend to have higher employment earnings
and are naturally at a lower risk of falling below the poverty line.
Take youth households as an example. 66.4% of their working
members were engaged in higher-skilled occupations and their pre-
intervention poverty rate was merely 5.8%. In contrast, less than 30%
of working members in single-parent and new-arrival households were
higher-skilled workers. Their poverty rates were 47.1% and 36.5%
respectively (Figure 3.10).
CSSA
Elderly
Single-parent
New-arrival
With-children
Youth
Unemployed
Economically inactive
Working
PRH
Private tenants
Owner-occupiers
With household head
aged 18-64
With elderly
household head
Overall
0
10
20
30
40
50
60
70
80
90
100
0 10 20 30 40 50 60 70 80
Note:Source:
Po
ver
ty r
ate
(%)
Proportion of full-time working population in households (%)
0
Poverty statistics refer to statistics before recurrent cash intervention.General Household Survey, Census and Statistics Department.
2016
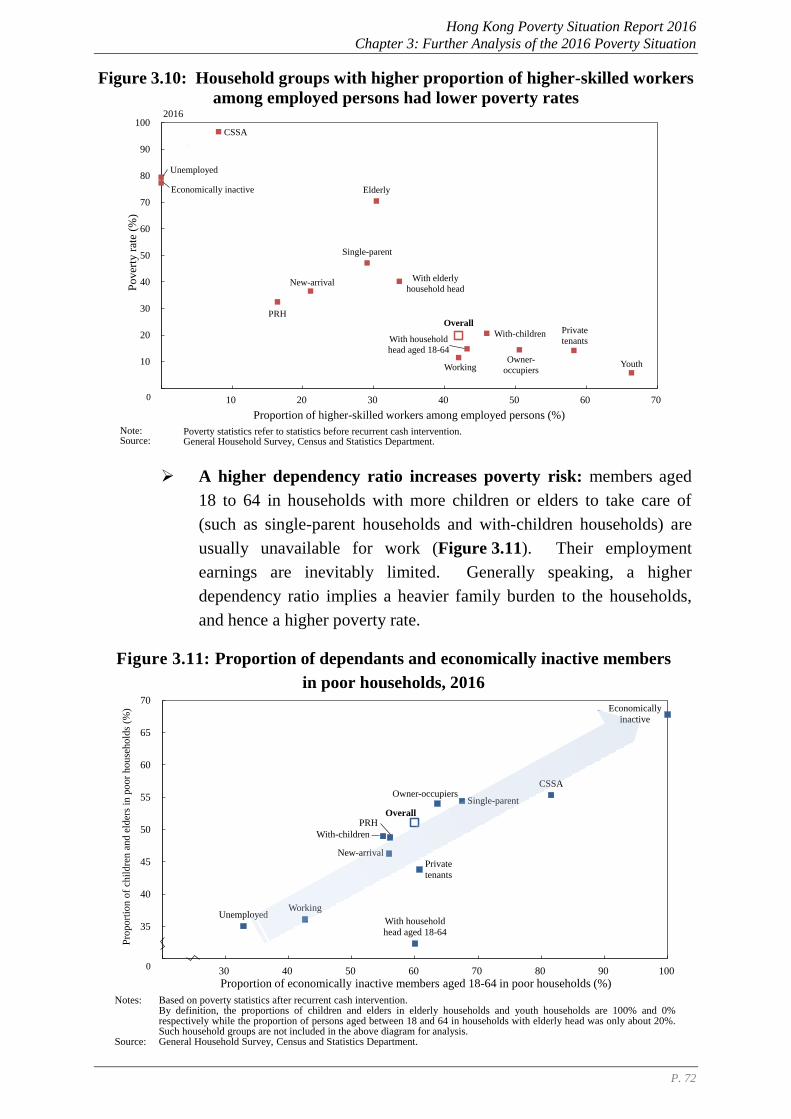
Hong Kong Poverty Situation Report 2016
Chapter 3: Further Analysis of the 2016 Poverty Situation
P. 72
Figure 3.10: Household groups with higher proportion of higher-skilled workers
among employed persons had lower poverty rates
A higher dependency ratio increases poverty risk: members aged
18 to 64 in households with more children or elders to take care of
(such as single-parent households and with-children households) are
usually unavailable for work (Figure 3.11). Their employment
earnings are inevitably limited. Generally speaking, a higher
dependency ratio implies a heavier family burden to the households,
and hence a higher poverty rate.
Figure 3.11: Proportion of dependants and economically inactive members
in poor households, 2016
CSSA
Elderly
Single-parent
New-arrival
With-children
Youth
Unemployed
Economically inactive
Working
PRH
Private
tenants
Owner-
occupiers
With household
head aged 18-64
With elderly
household head
Overall
0
10
20
30
40
50
60
70
80
90
100
0 10 20 30 40 50 60 70
Po
ver
ty r
ate
(%)
Proportion of higher-skilled workers among employed persons (%)
0
Note:Source:
Poverty statistics refer to statistics before recurrent cash intervention.General Household Survey, Census and Statistics Department.
2016
CSSA
Single-parent
New-arrival
With-children
Unemployed
Economically
inactive
Working
PRH
Private
tenants
Owner-occupiers
With household
head aged 18-64
Overall
30
35
40
45
50
55
60
65
70
20 30 40 50 60 70 80 90 100
Based on poverty statistics after recurrent cash intervention.By definition, the proportions of children and elders in elderly households and youth households are 100% and 0%respectively while the proportion of persons aged between 18 and 64 in households with elderly head was only about 20%.Such household groups are not included in the above diagram for analysis.General Household Survey, Census and Statistics Department.
Proportion of economically inactive members aged 18-64 in poor households (%)
Pro
port
ion
of
chil
dre
n a
nd e
lder
s in
poor
house
hold
s (%
)
0
Notes:
Source:
2016
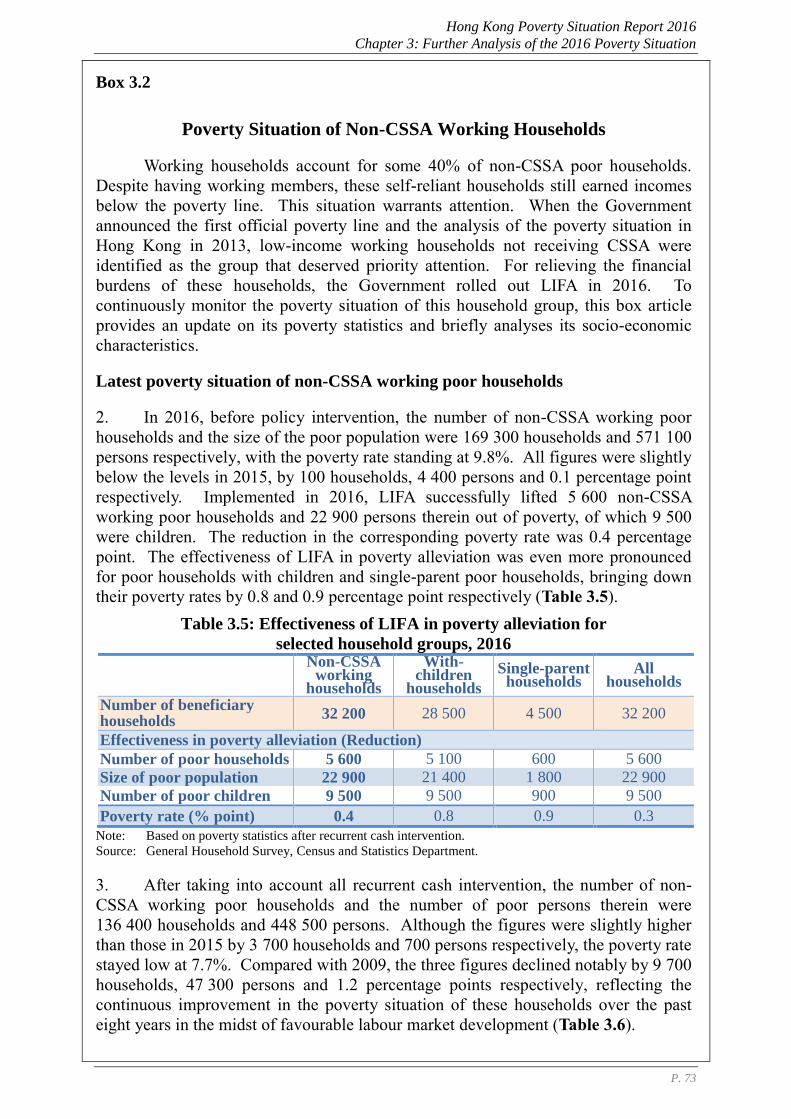
Hong Kong Poverty Situation Report 2016
Chapter 3: Further Analysis of the 2016 Poverty Situation
P. 73
Box 3.2
Poverty Situation of Non-CSSA Working Households
Working households account for some 40% of non-CSSA poor households.
Despite having working members, these self-reliant households still earned incomes
below the poverty line. This situation warrants attention. When the Government
announced the first official poverty line and the analysis of the poverty situation in
Hong Kong in 2013, low-income working households not receiving CSSA were
identified as the group that deserved priority attention. For relieving the financial
burdens of these households, the Government rolled out LIFA in 2016. To
continuously monitor the poverty situation of this household group, this box article
provides an update on its poverty statistics and briefly analyses its socio-economic
characteristics.
Latest poverty situation of non-CSSA working poor households
2. In 2016, before policy intervention, the number of non-CSSA working poor
households and the size of the poor population were 169 300 households and 571 100
persons respectively, with the poverty rate standing at 9.8%. All figures were slightly
below the levels in 2015, by 100 households, 4 400 persons and 0.1 percentage point
respectively. Implemented in 2016, LIFA successfully lifted 5 600 non-CSSA
working poor households and 22 900 persons therein out of poverty, of which 9 500
were children. The reduction in the corresponding poverty rate was 0.4 percentage
point. The effectiveness of LIFA in poverty alleviation was even more pronounced
for poor households with children and single-parent poor households, bringing down
their poverty rates by 0.8 and 0.9 percentage point respectively (Table 3.5).
Table 3.5: Effectiveness of LIFA in poverty alleviation for
selected household groups, 2016
Non-CSSA
working households
With-children
households
Single-parent households
All households
Number of beneficiary households
32 200 28 500 4 500 32 200
Effectiveness in poverty alleviation (Reduction)
Number of poor households 5 600 5 100 600 5 600
Size of poor population 22 900 21 400 1 800 22 900
Number of poor children 9 500 9 500 900 9 500
Poverty rate (% point) 0.4 0.8 0.9 0.3
Note: Based on poverty statistics after recurrent cash intervention.
Source: General Household Survey, Census and Statistics Department.
3. After taking into account all recurrent cash intervention, the number of non-
CSSA working poor households and the number of poor persons therein were
136 400 households and 448 500 persons. Although the figures were slightly higher
than those in 2015 by 3 700 households and 700 persons respectively, the poverty rate
stayed low at 7.7%. Compared with 2009, the three figures declined notably by 9 700
households, 47 300 persons and 1.2 percentage points respectively, reflecting the
continuous improvement in the poverty situation of these households over the past
eight years in the midst of favourable labour market development (Table 3.6).
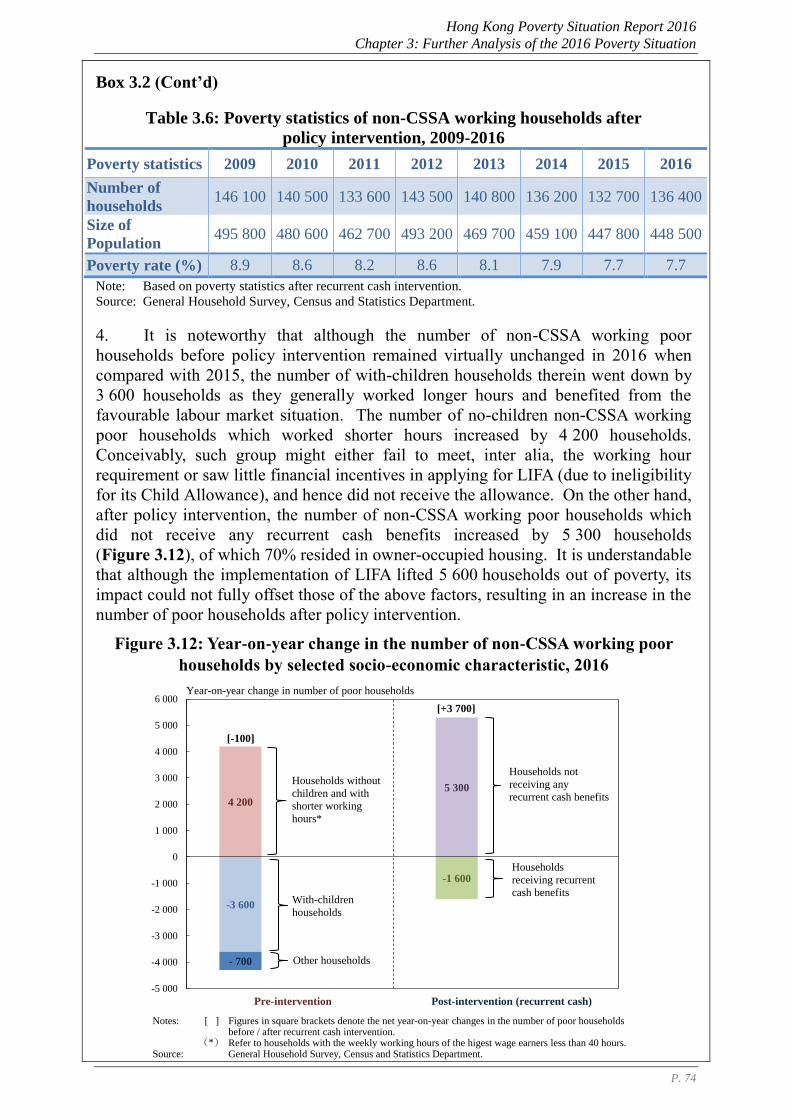
Hong Kong Poverty Situation Report 2016
Chapter 3: Further Analysis of the 2016 Poverty Situation
P. 74
Box 3.2 (Cont’d)
Table 3.6: Poverty statistics of non-CSSA working households after
policy intervention, 2009-2016
Poverty statistics 2009 2010 2011 2012 2013 2014 2015 2016
Number of
households 146 100 140 500 133 600 143 500 140 800 136 200 132 700 136 400
Size of
Population 495 800 480 600 462 700 493 200 469 700 459 100 447 800 448 500
Poverty rate (%) 8.9 8.6 8.2 8.6 8.1 7.9 7.7 7.7
Note: Based on poverty statistics after recurrent cash intervention.
Source: General Household Survey, Census and Statistics Department.
4. It is noteworthy that although the number of non-CSSA working poor
households before policy intervention remained virtually unchanged in 2016 when
compared with 2015, the number of with-children households therein went down by
3 600 households as they generally worked longer hours and benefited from the
favourable labour market situation. The number of no-children non-CSSA working
poor households which worked shorter hours increased by 4 200 households.
Conceivably, such group might either fail to meet, inter alia, the working hour
requirement or saw little financial incentives in applying for LIFA (due to ineligibility
for its Child Allowance), and hence did not receive the allowance. On the other hand,
after policy intervention, the number of non-CSSA working poor households which
did not receive any recurrent cash benefits increased by 5 300 households
(Figure 3.12), of which 70% resided in owner-occupied housing. It is understandable
that although the implementation of LIFA lifted 5 600 households out of poverty, its
impact could not fully offset those of the above factors, resulting in an increase in the
number of poor households after policy intervention.
Figure 3.12: Year-on-year change in the number of non-CSSA working poor
households by selected socio-economic characteristic, 2016
4 200
-3 600
5 300
- 700
-1 600
-5 000
-4 000
-3 000
-2 000
-1 000
0
1 000
2 000
3 000
4 000
5 000
6 000
1 2 3 4
Figures in square brackets denote the net year-on-year changes in the number of poor households before / after recurrent cash intervention.Refer to households with the weekly working hours of the higest wage earners less than 40 hours.General Household Survey, Census and Statistics Department.
Notes: [ ]
(*)Source:
Year-on-year change in number of poor households
[-100]
[+3 700]
Households without
children and with
shorter working
hours*
Pre-intervention Post-intervention (recurrent cash)
With-children
households
Other households
Households not
receiving any
recurrent cash benefits
Households
receiving recurrent
cash benefits
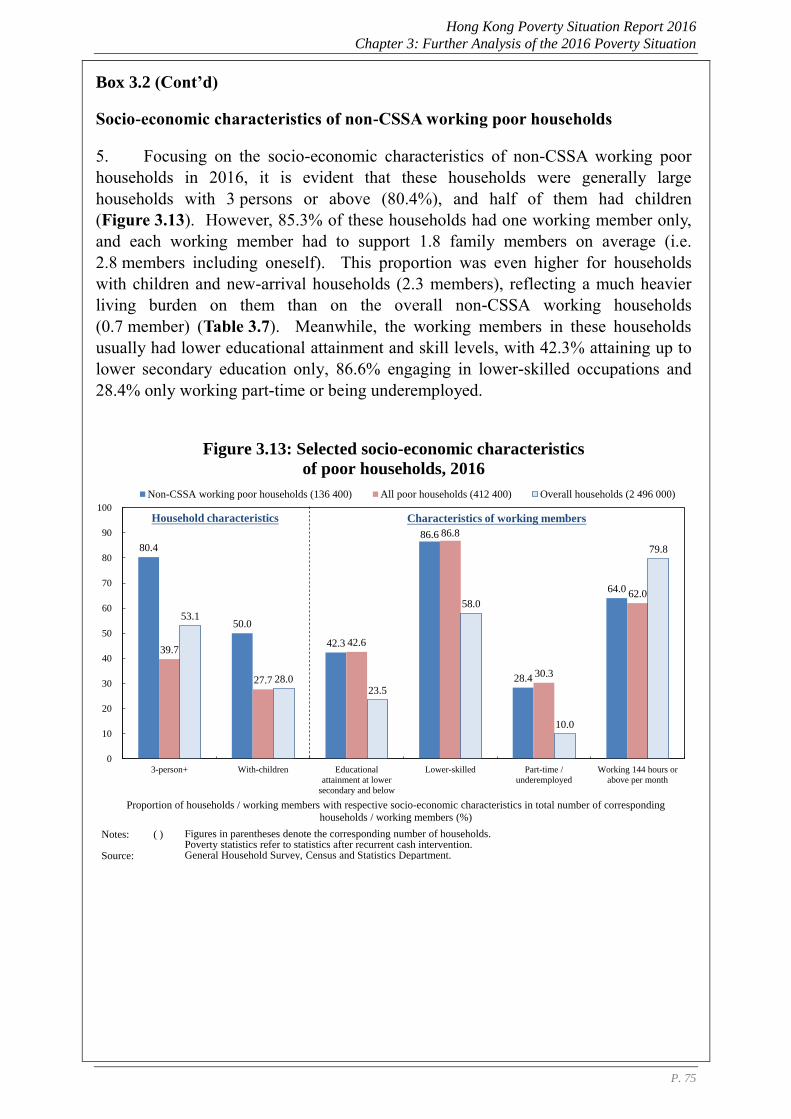
Hong Kong Poverty Situation Report 2016
Chapter 3: Further Analysis of the 2016 Poverty Situation
P. 75
Box 3.2 (Cont’d)
Socio-economic characteristics of non-CSSA working poor households
5. Focusing on the socio-economic characteristics of non-CSSA working poor
households in 2016, it is evident that these households were generally large
households with 3 persons or above (80.4%), and half of them had children
(Figure 3.13). However, 85.3% of these households had one working member only,
and each working member had to support 1.8 family members on average (i.e.
2.8 members including oneself). This proportion was even higher for households
with children and new-arrival households (2.3 members), reflecting a much heavier
living burden on them than on the overall non-CSSA working households
(0.7 member) (Table 3.7). Meanwhile, the working members in these households
usually had lower educational attainment and skill levels, with 42.3% attaining up to
lower secondary education only, 86.6% engaging in lower-skilled occupations and
28.4% only working part-time or being underemployed.
Figure 3.13: Selected socio-economic characteristics
of poor households, 2016
80.4
50.0
42.3
86.6
28.4
64.0
39.7
27.7
42.6
86.8
30.3
62.0
53.1
28.023.5
58.0
10.0
79.8
0
10
20
30
40
50
60
70
80
90
100
3-person+ With-children Educational
attainment at lower
secondary and below
Lower-skilled Part-time /
underemployed
Working 144 hours or
above per month
Non-CSSA working poor households (136 400) All poor households (412 400) Overall households (2 496 000)
Household characteristics Characteristics of working members
Notes: ( )
Source:
Figures in parentheses denote the corresponding number of households.Poverty statistics refer to statistics after recurrent cash intervention.General Household Survey, Census and Statistics Department.
Proportion of households / working members with respective socio-economic characteristics in total number of corresponding
households / working members (%)
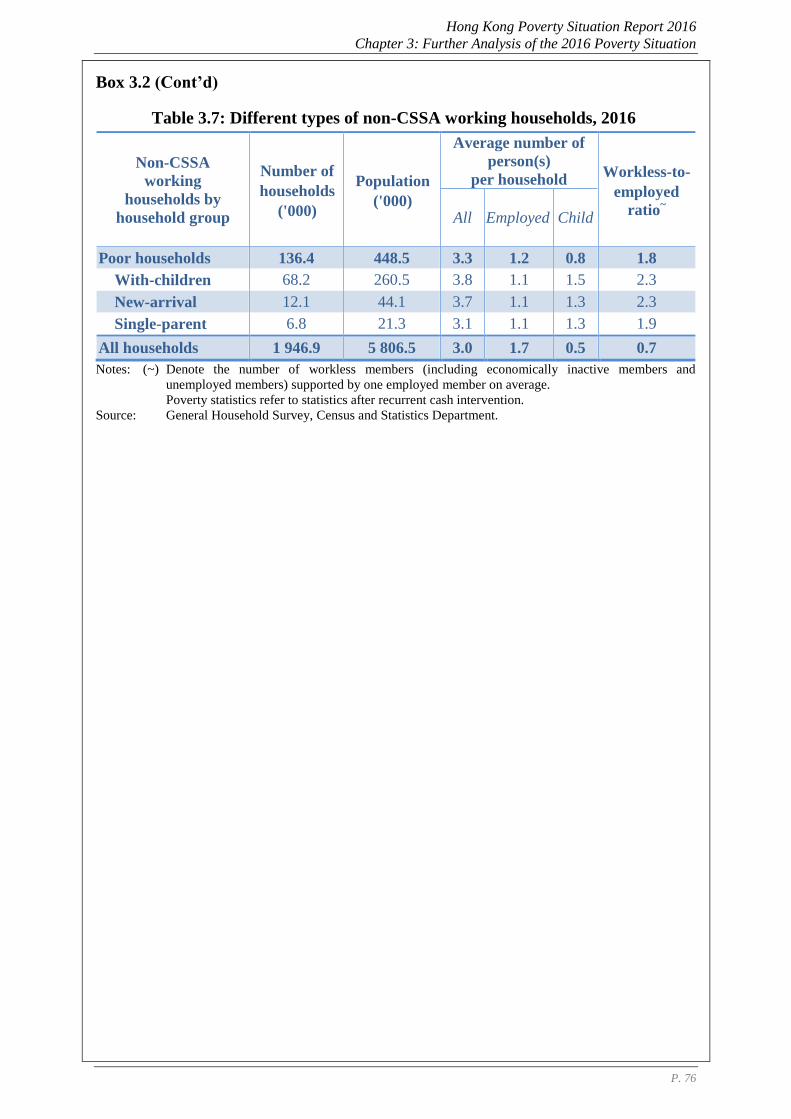
Hong Kong Poverty Situation Report 2016
Chapter 3: Further Analysis of the 2016 Poverty Situation
P. 76
Box 3.2 (Cont’d)
Table 3.7: Different types of non-CSSA working households, 2016
Non-CSSA
working
households by
household group
Number of
households
('000)
Population
('000)
Average number of
person(s)
per household Workless-to-
employed
ratio~
All Employed Child
Poor households 136.4 448.5 3.3 1.2 0.8 1.8
With-children 68.2 260.5 3.8 1.1 1.5 2.3
New-arrival 12.1 44.1 3.7 1.1 1.3 2.3
Single-parent 6.8 21.3 3.1 1.1 1.3 1.9
All households 1 946.9 5 806.5 3.0 1.7 0.5 0.7
Notes: (~) Denote the number of workless members (including economically inactive members and
unemployed members) supported by one employed member on average.
Poverty statistics refer to statistics after recurrent cash intervention.
Source: General Household Survey, Census and Statistics Department.
Hong Kong Poverty Situation Report 2016
Chapter 3: Further Analysis of the 2016 Poverty Situation
P. 77
3.III Poverty Situation by District
3.14 The methodology for compiling population estimates by age and gender in
each District Council district for a particular year when a Population Census /
By-census has been undertaken is different from that for the years between
the conduct of Population Census and By-census55
. Given that the poverty
statistics by District Council district compiled in 2016 involved the use of the
2016 Population By-census results, the estimation methodology was different
from that in previous years. Hence, the figures for 2016 are not strictly
comparable with the corresponding figures for or before 2015. This section,
therefore, will focus on analysing the poverty situation by district in 2016.
3.15 Analysed by the 18 District Council districts, districts with larger poor
population before policy intervention in 2016 included Sham Shui Po, Kwun
Tong, Kwai Tsing, Yuen Long and Tuen Mun. Their poverty rates were also
higher than the overall average level. The size of the poor population in Sha
Tin was also substantial, but its poverty rate was lower than the overall
average. North district had a relatively small poor population but a
comparably high poverty rate. Its pre-intervention poverty rate was just
lower than those of Sham Shui Po, Kwun Tong and Kwai Tsing. North
district had the lowest proportions of economically active households and
full-time working population among the 18 districts, and its proportion of
higher-skilled workers among employed persons (33.3%) was comparable to
those of the districts in relatively acute poverty (e.g. Yuen Long). Residents
in North district were, therefore, more prone to higher poverty risk.
Nevertheless, the poverty situation generally improved across all districts
after policy intervention, with the improvement in the poverty rate more
visible in those districts that had higher proportions of pre-intervention poor
households receiving CSSA (Figure 3.14).
55 For a particular year when a Population Census / By-census has been undertaken (the latest Population
Census and By-census were conducted in 2011 and 2016 respectively), population estimates by age and
sex in each District Council district are compiled based on the results of the Population Census / By-
census. For the years between the conduct of Population Census and By-census (e.g. 2012 to 2015),
population estimates by age and sex in each District Council district are computed based on the number of
quarters in each district (with reference to the frame of quarters maintained by C&SD and up-to-date
information from various government departments on new completion and demolition) and the average
number of persons per unit of quarters (based on the results of the GHS, the latest Population Census / By-
census and administrative records).
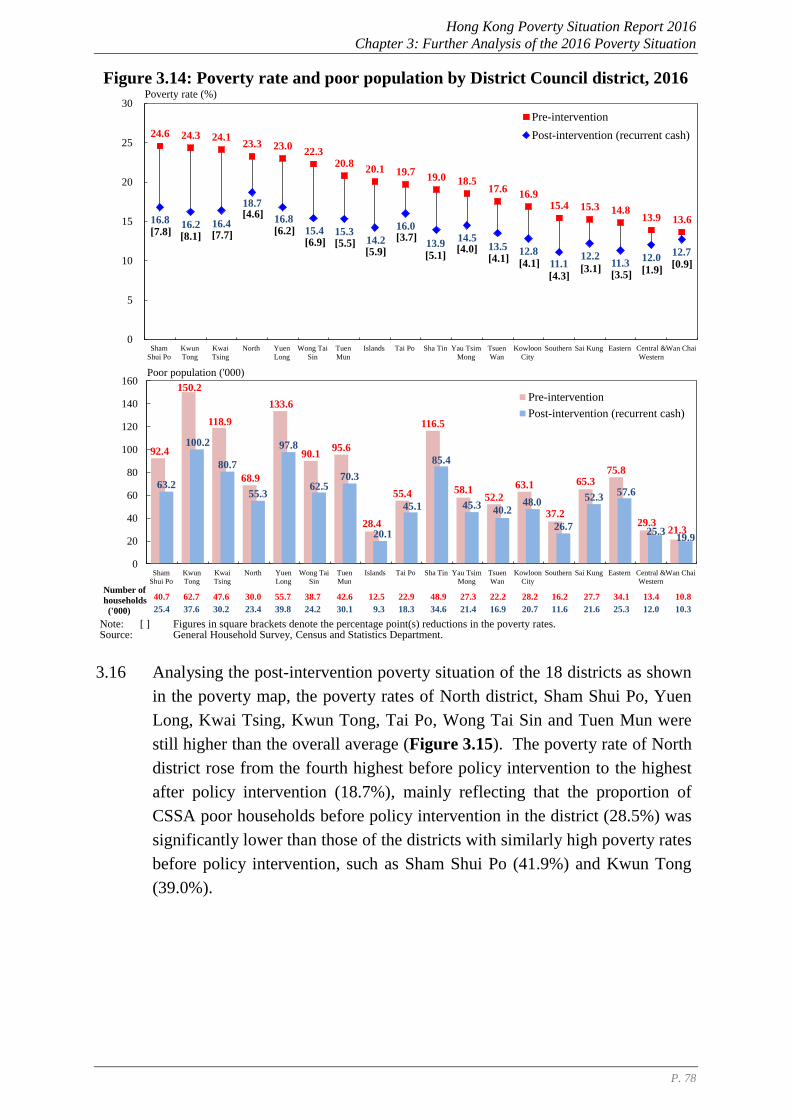
Hong Kong Poverty Situation Report 2016
Chapter 3: Further Analysis of the 2016 Poverty Situation
P. 78
Figure 3.14: Poverty rate and poor population by District Council district, 2016
3.16 Analysing the post-intervention poverty situation of the 18 districts as shown
in the poverty map, the poverty rates of North district, Sham Shui Po, Yuen
Long, Kwai Tsing, Kwun Tong, Tai Po, Wong Tai Sin and Tuen Mun were
still higher than the overall average (Figure 3.15). The poverty rate of North
district rose from the fourth highest before policy intervention to the highest
after policy intervention (18.7%), mainly reflecting that the proportion of
CSSA poor households before policy intervention in the district (28.5%) was
significantly lower than those of the districts with similarly high poverty rates
before policy intervention, such as Sham Shui Po (41.9%) and Kwun Tong
(39.0%).
24.6 24.3 24.123.3 23.0
22.320.8
20.1 19.719.0 18.5
17.616.9
15.4 15.3 14.813.9 13.616.8 16.2 16.4
18.7
16.815.4 15.3
14.2
16.0
13.914.5
13.5 12.8
11.112.2
11.312.0
12.7
[7.8] [8.1] [7.7]
[4.6]
[6.2][6.9] [5.5]
[5.9]
[3.7]
[5.1][4.0]
[4.1][4.1]
[4.3][3.1]
[3.5][1.9]
[0.9]
0
5
10
15
20
25
30
Sham
Shui Po
Kwun
Tong
Kwai
Tsing
North Yuen
Long
Wong Tai
Sin
Tuen
Mun
Islands Tai Po Sha Tin Yau Tsim
Mong
Tsuen
Wan
Kowloon
City
Southern Sai Kung Eastern Central &
Western
Wan Chai
Pre-intervention
Post-intervention (recurrent cash)
Poverty rate (%)
92.4
150.2
118.9
68.9
133.6
90.1 95.6
28.4
55.4
116.5
58.1 52.2
63.1
37.2
65.3 75.8
29.3 21.3
63.2
100.2
80.7
55.3
97.8
62.5 70.3
20.1
45.1
85.4
45.3 40.2
48.0
26.7
52.3 57.6
25.3 19.9
0
20
40
60
80
100
120
140
160
Sham
Shui Po
Kwun
Tong
Kwai
Tsing
North Yuen
Long
Wong Tai
Sin
Tuen
Mun
Islands Tai Po Sha Tin Yau Tsim
Mong
Tsuen
Wan
Kowloon
City
Southern Sai Kung Eastern Central &
Western
Wan Chai
Pre-intervention
Post-intervention (recurrent cash)
Poor population ('000)
Note: [ ]Source:
Figures in square brackets denote the percentage point(s) reductions in the poverty rates.General Household Survey, Census and Statistics Department.
Number of
households
('000)
40.7 62.7 47.6 30.0 55.7 38.7 42.6 12.5 22.9 48.9 27.3 22.2 28.2 16.2 27.7 34.1 13.4 10.8
25.4 37.6 30.2 23.4 39.8 24.2 30.1 9.3 18.3 34.6 21.4 16.9 20.7 11.6 21.6 25.3 12.0 10.3
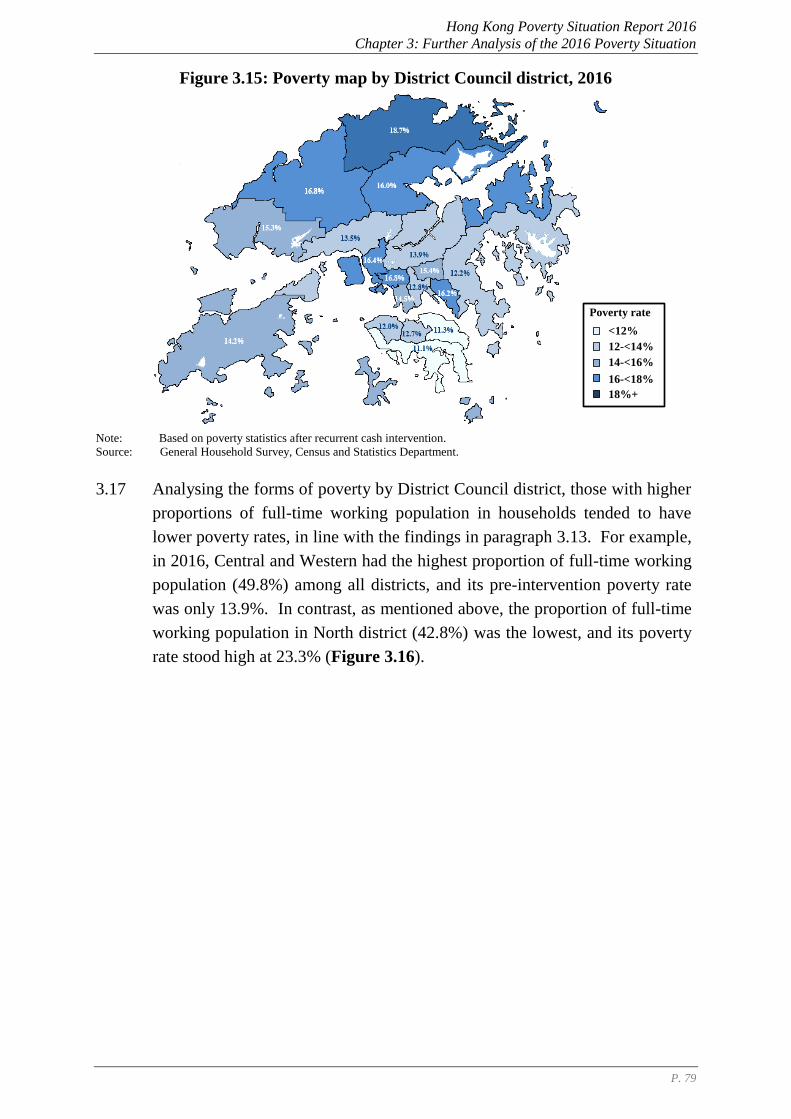
Hong Kong Poverty Situation Report 2016
Chapter 3: Further Analysis of the 2016 Poverty Situation
P. 79
Figure 3.15: Poverty map by District Council district, 2016
Note: Based on poverty statistics after recurrent cash intervention.
Source: General Household Survey, Census and Statistics Department.
3.17 Analysing the forms of poverty by District Council district, those with higher
proportions of full-time working population in households tended to have
lower poverty rates, in line with the findings in paragraph 3.13. For example,
in 2016, Central and Western had the highest proportion of full-time working
population (49.8%) among all districts, and its pre-intervention poverty rate
was only 13.9%. In contrast, as mentioned above, the proportion of full-time
working population in North district (42.8%) was the lowest, and its poverty
rate stood high at 23.3% (Figure 3.16).
Note:Source:
Based on poverty statistics after recurrent cash intervention.General Household Survey, Census and Statistics Department.
Poverty rate
<12%
12-<14%
14-<16%
16-<18%
18%+
圖3.14:2016年貧窮地圖,按區議會分區劃分
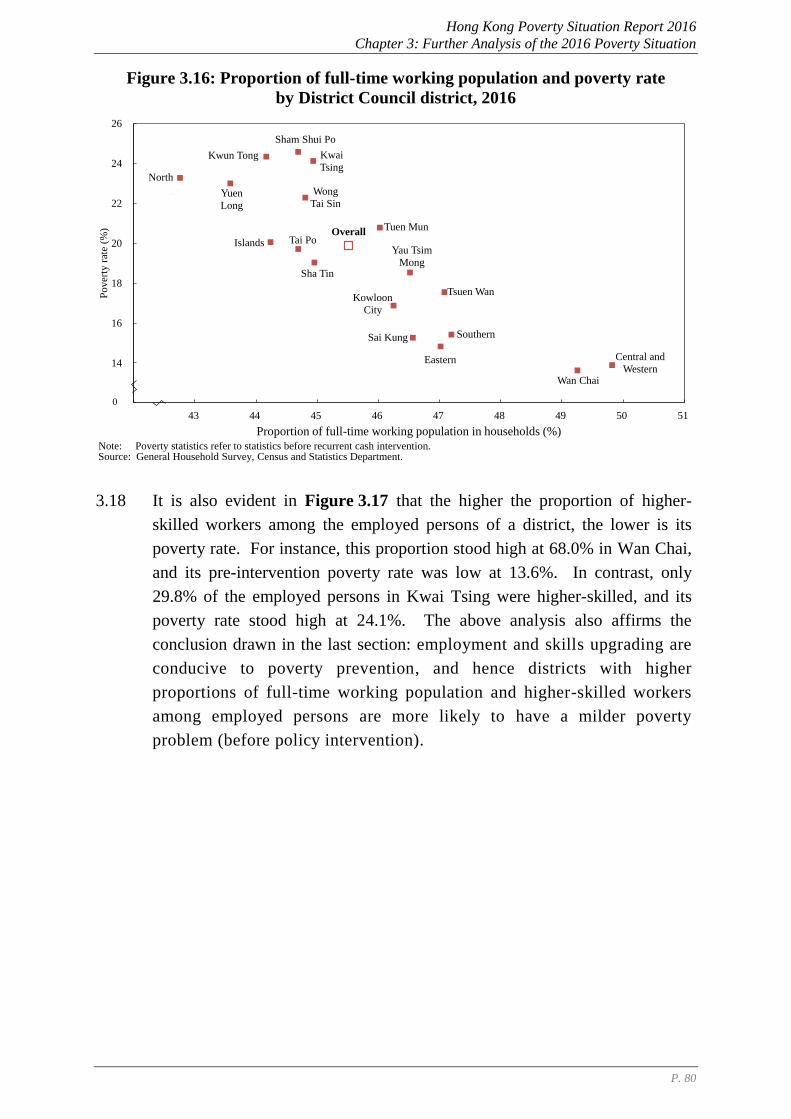
Hong Kong Poverty Situation Report 2016
Chapter 3: Further Analysis of the 2016 Poverty Situation
P. 80
Figure 3.16: Proportion of full-time working population and poverty rate
by District Council district, 2016
3.18 It is also evident in Figure 3.17 that the higher the proportion of higher-
skilled workers among the employed persons of a district, the lower is its
poverty rate. For instance, this proportion stood high at 68.0% in Wan Chai,
and its pre-intervention poverty rate was low at 13.6%. In contrast, only
29.8% of the employed persons in Kwai Tsing were higher-skilled, and its
poverty rate stood high at 24.1%. The above analysis also affirms the
conclusion drawn in the last section: employment and skills upgrading are
conducive to poverty prevention, and hence districts with higher
proportions of full-time working population and higher-skilled workers
among employed persons are more likely to have a milder poverty
problem (before policy intervention).
Central and
WesternWan Chai
Eastern
Southern
Yau Tsim
Mong
Sham Shui Po
Kowloon
City
Wong
Tai Sin
Kwun Tong Kwai
Tsing
Tsuen Wan
Tuen Mun
Yuen
Long
North
Tai Po
Sha Tin
Sai Kung
IslandsOverall
12
14
16
18
20
22
24
26
42 43 44 45 46 47 48 49 50 51
Pover
ty r
ate
(%)
Proportion of full-time working population in households (%)
0
0
Note: Poverty statistics refer to statistics before recurrent cash intervention.Source: General Household Survey, Census and Statistics Department.
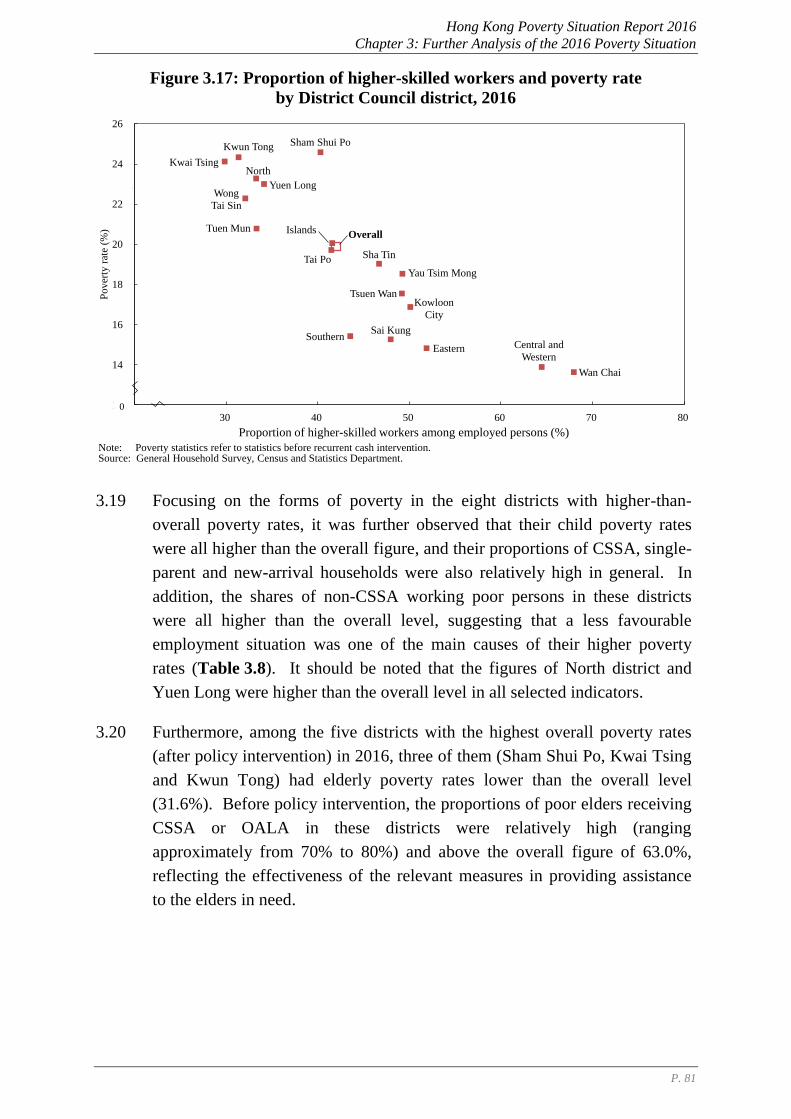
Hong Kong Poverty Situation Report 2016
Chapter 3: Further Analysis of the 2016 Poverty Situation
P. 81
Figure 3.17: Proportion of higher-skilled workers and poverty rate
by District Council district, 2016
3.19 Focusing on the forms of poverty in the eight districts with higher-than-
overall poverty rates, it was further observed that their child poverty rates
were all higher than the overall figure, and their proportions of CSSA, single-
parent and new-arrival households were also relatively high in general. In
addition, the shares of non-CSSA working poor persons in these districts
were all higher than the overall level, suggesting that a less favourable
employment situation was one of the main causes of their higher poverty
rates (Table 3.8). It should be noted that the figures of North district and
Yuen Long were higher than the overall level in all selected indicators.
3.20 Furthermore, among the five districts with the highest overall poverty rates
(after policy intervention) in 2016, three of them (Sham Shui Po, Kwai Tsing
and Kwun Tong) had elderly poverty rates lower than the overall level
(31.6%). Before policy intervention, the proportions of poor elders receiving
CSSA or OALA in these districts were relatively high (ranging
approximately from 70% to 80%) and above the overall figure of 63.0%,
reflecting the effectiveness of the relevant measures in providing assistance
to the elders in need.
Central and
Western
Wan Chai
EasternSouthern
Kowloon
City
Sham Shui Po
Yau Tsim Mong
Wong
Tai Sin
Kwun Tong
Kwai Tsing
Tsuen Wan
Tuen Mun
Yuen Long
North
Tai Po Sha Tin
Sai Kung
Islands Overall
12
14
16
18
20
22
24
26
20 30 40 50 60 70 80
Pover
ty r
ate
(%)
Proportion of higher-skilled workers among employed persons (%)
0
Note: Poverty statistics refer to statistics before recurrent cash intervention.Source: General Household Survey, Census and Statistics Department.
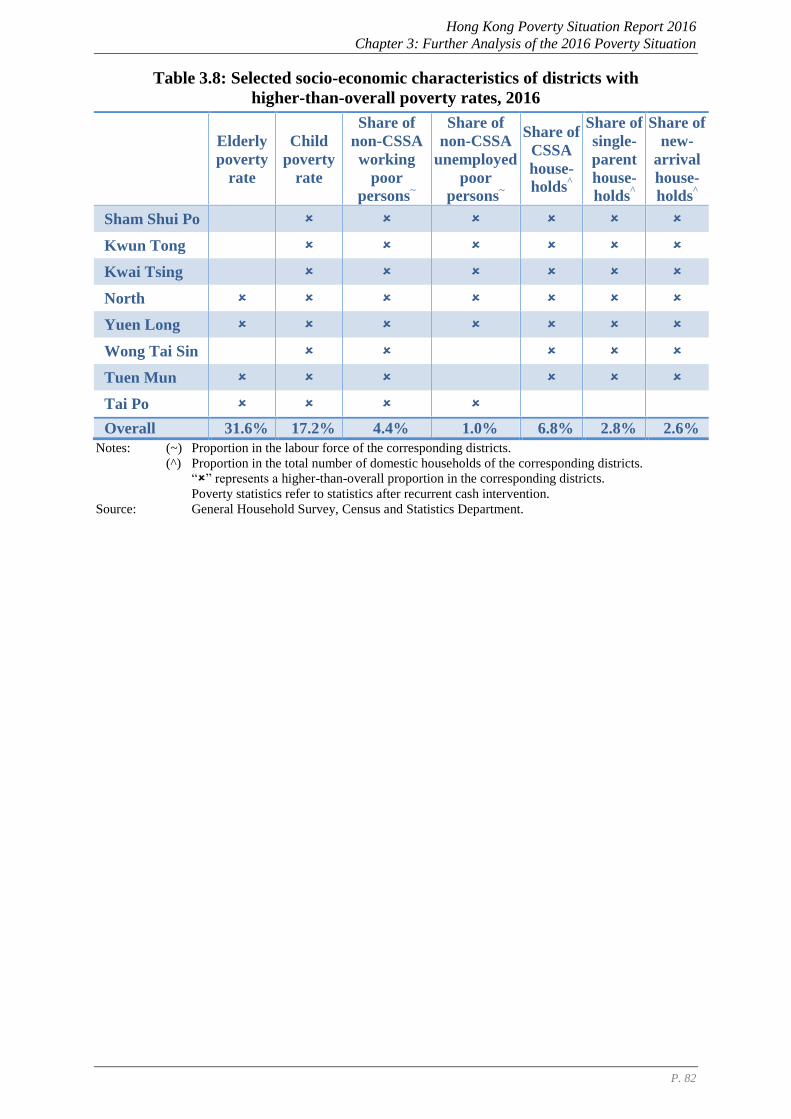
Hong Kong Poverty Situation Report 2016
Chapter 3: Further Analysis of the 2016 Poverty Situation
P. 82
Table 3.8: Selected socio-economic characteristics of districts with
higher-than-overall poverty rates, 2016
Elderly
poverty
rate
Child
poverty
rate
Share of
non-CSSA
working
poor
persons~
Share of
non-CSSA
unemployed
poor
persons~
Share of
CSSA
house-
holds^
Share of
single-
parent
house-
holds^
Share of
new-
arrival
house-
holds^
Sham Shui Po
Kwun Tong
Kwai Tsing
North
Yuen Long
Wong Tai Sin
Tuen Mun
Tai Po
Overall 31.6% 17.2% 4.4% 1.0% 6.8% 2.8% 2.6%
Notes: (~) Proportion in the labour force of the corresponding districts.
(^) Proportion in the total number of domestic households of the corresponding districts.
“” represents a higher-than-overall proportion in the corresponding districts.
Poverty statistics refer to statistics after recurrent cash intervention.
Source: General Household Survey, Census and Statistics Department.
Hong Kong Poverty Situation Report 2016
Chapter 3: Further Analysis of the 2016 Poverty Situation
P. 83
3.IV Key Observations
3.21 In 2016, the post-intervention poverty rates of unemployed, economically
inactive and elderly households were the highest (69.8%, 59.2% and 48.8%
respectively) among all socio-economic groups. The corresponding poverty
rate of working households was relatively low (8.0%), demonstrating that
employment is the best way to prevent poverty.
3.22 Further analysis of the forms of poverty shows that household groups with
higher proportions of working population and higher skill levels among
employed persons tended to benefit more from the improved labour market
conditions, and had lower poverty rates than other groups. This signifies the
importance of employment and skills upgrading in poverty alleviation and
prevention. On the other hand, families with a higher dependency ratio were
generally at a higher risk of falling below the poverty line. For instance, the
poverty rates of single-parent and new-arrival households after policy
intervention (34.4% and 30.1% respectively) were more than double the
overall figure. This was partly because around 60% of the single-parent poor
households lacked members available for work due to child care
responsibilities whilst the working members in new-arrival poor households
were mostly engaged in lower-skilled occupations (92.7%) with relatively
low income, despite their higher share of working households. Furthermore,
the larger household size and heavy family burden of both groups also
resulted in a higher risk of falling below the poverty line.
3.23 Comparing 2016 with 2015, the post-intervention poverty rates of most
socio-economic groups fell. Improvements were particularly notable in
CSSA, single-parent, new-arrival and with-children households. Overall
speaking, the groups with improved poverty situation all saw increases in the
shares of employed persons engaged in higher-skilled occupations.
3.24 In 2016, around 40% of the non-CSSA poor households were working
households with incomes still below the poverty lines. Focusing on some
0.14 million non-CSSA post-intervention working poor households (with
0.45 million persons) in 2016, their poverty situation was largely similar to
that in previous years. With larger household size and heavy family burdens,
these households need more assistance. In this respect, the LIFA Scheme,
which aims at providing targeted relief to the financial burden of low-income
households with special attention to single-parent and with-children / youth
working families, has been implemented since May 2016. The Scheme
successfully lifted 5 600 non-CSSA working households and 22 900 persons
therein (of which 9 500 were children) out of poverty in 2016, with the
Hong Kong Poverty Situation Report 2016
Chapter 3: Further Analysis of the 2016 Poverty Situation
P. 84
corresponding poverty rate reduced by 0.4 percentage point. The
effectiveness of the Scheme in poverty alleviation was even more
pronounced for with-children and single-parent poor households, bringing
down their poverty rates by 0.8 and 0.9 percentage point respectively.
3.25 Analysed by housing type, after recurrent cash intervention, over 40% of the
poor population resided in PRH, some 45% lived in owner-occupied housing
and nearly 9% were private tenants. The poverty situation of PRH
households showed improvement, with their poverty rate falling to an eight-
year low. The poverty rate of owner-occupier households edged up, with
around two-thirds of the increase in its poor population being elders.
3.26 Indeed, for groups that lacked recurrent employment earnings (including
elderly persons aged 65 and above, elderly households, households with
elderly head and economically inactive households), their poverty rates were
persistently high. Conceivably, as members in these groups have mostly
retired, their poverty rates, which are defined by income, tend to be relatively
high and bear no significant direct relationship with economic cycles.
3.27 The role of employment in poverty prevention is obvious when analysing the
changes in poverty figures between 2009 and 2016. With the Hong Kong
economy staying on an uptrend after 2009, labour market conditions have
remained favourable. This, coupled with the implementation of Statutory
Minimum Wage (SMW) since May 2011 and two rounds of upward
adjustment of the SMW rate in 2013 and 2015 respectively, has resulted in an
appreciable increase in the earnings of grassroots workers. The poor
population in working households decreased further to a record low, with a
cumulative reduction of 13% since 2009. As earnings generally picked up,
the poverty situations of most socio-economic household groups showed
different extents of improvement in 2016 when compared with 2009. In
2016, household groups with higher proportions of full-time working
population, including new-arrival, with-children and working households, all
recorded their lowest poverty rates in eight years. These figures fully reflect
the importance of employment in poverty prevention.
3.28 In contrast, elderly and economically inactive households as well as
households with elderly head, having relatively low proportions of working
population and mostly in lack of recurrent employment earnings, recorded
increases in their poor population (by 30%, 16% and 16% respectively) in
2016 over 2009, on the back of the increasingly apparent impact of
population ageing.
Hong Kong Poverty Situation Report 2016
Chapter 3: Further Analysis of the 2016 Poverty Situation
P. 85
3.29 Analysed by the 18 districts in Hong Kong, the five districts with the highest
post-intervention poverty rates in 2016 were North district, Sham Shui Po,
Yuen Long, Kwai Tsing and Kwun Tong. Districts with higher poverty rates
generally had lower proportions of working population and higher shares of
workers engaged in lower-skilled occupations. Their child poverty rates also
tended to be higher than the overall figure. This is consistent with the
analysis in terms of socio-economic characteristics.
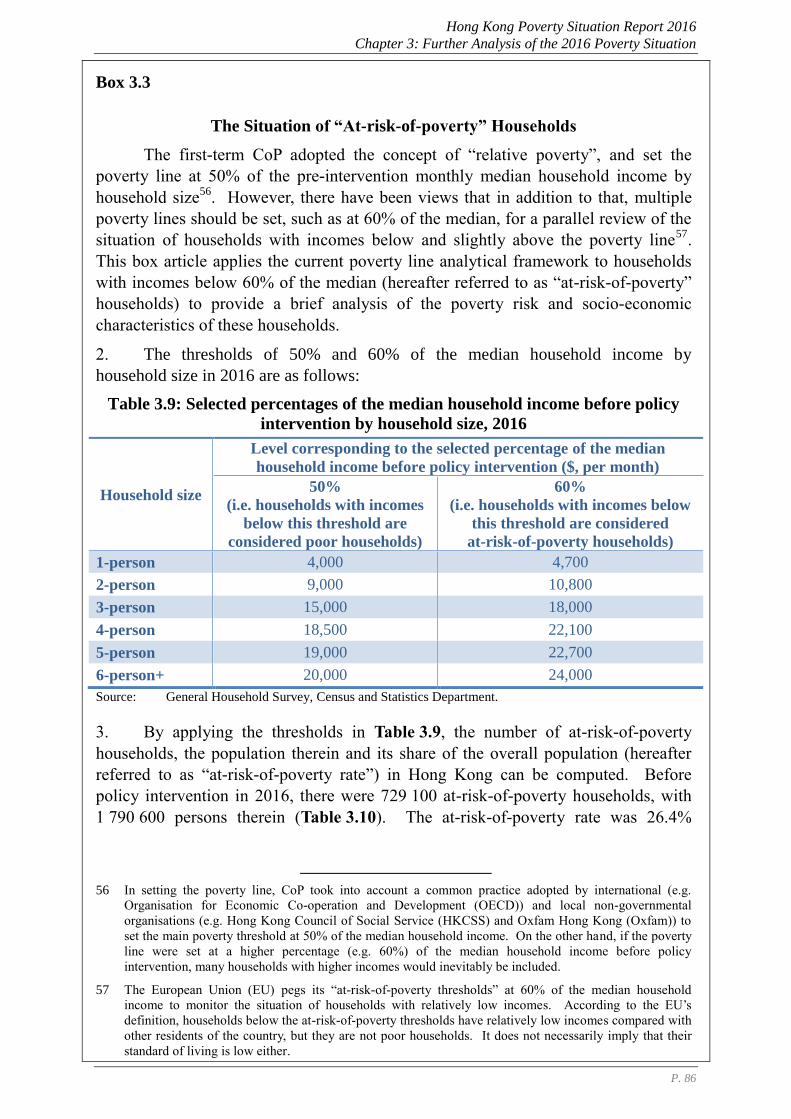
Hong Kong Poverty Situation Report 2016
Chapter 3: Further Analysis of the 2016 Poverty Situation
P. 86
Box 3.3
The Situation of “At-risk-of-poverty” Households
The first-term CoP adopted the concept of “relative poverty”, and set the
poverty line at 50% of the pre-intervention monthly median household income by
household size56. However, there have been views that in addition to that, multiple
poverty lines should be set, such as at 60% of the median, for a parallel review of the
situation of households with incomes below and slightly above the poverty line57.
This box article applies the current poverty line analytical framework to households
with incomes below 60% of the median (hereafter referred to as “at-risk-of-poverty”
households) to provide a brief analysis of the poverty risk and socio-economic
characteristics of these households.
2. The thresholds of 50% and 60% of the median household income by
household size in 2016 are as follows:
Table 3.9: Selected percentages of the median household income before policy
intervention by household size, 2016
Household size
Level corresponding to the selected percentage of the median
household income before policy intervention ($, per month)
50%
(i.e. households with incomes
below this threshold are
considered poor households)
60%
(i.e. households with incomes below
this threshold are considered
at-risk-of-poverty households)
1-person 4,000 4,700
2-person 9,000 10,800
3-person 15,000 18,000
4-person 18,500 22,100
5-person 19,000 22,700
6-person+ 20,000 24,000
Source: General Household Survey, Census and Statistics Department.
3. By applying the thresholds in Table 3.9, the number of at-risk-of-poverty
households, the population therein and its share of the overall population (hereafter
referred to as “at-risk-of-poverty rate”) in Hong Kong can be computed. Before
policy intervention in 2016, there were 729 100 at-risk-of-poverty households, with
1 790 600 persons therein (Table 3.10). The at-risk-of-poverty rate was 26.4%
56 In setting the poverty line, CoP took into account a common practice adopted by international (e.g.
Organisation for Economic Co-operation and Development (OECD)) and local non-governmental
organisations (e.g. Hong Kong Council of Social Service (HKCSS) and Oxfam Hong Kong (Oxfam)) to
set the main poverty threshold at 50% of the median household income. On the other hand, if the poverty
line were set at a higher percentage (e.g. 60%) of the median household income before policy
intervention, many households with higher incomes would inevitably be included.
57 The European Union (EU) pegs its “at-risk-of-poverty thresholds” at 60% of the median household
income to monitor the situation of households with relatively low incomes. According to the EU’s
definition, households below the at-risk-of-poverty thresholds have relatively low incomes compared with
other residents of the country, but they are not poor households. It does not necessarily imply that their
standard of living is low either.
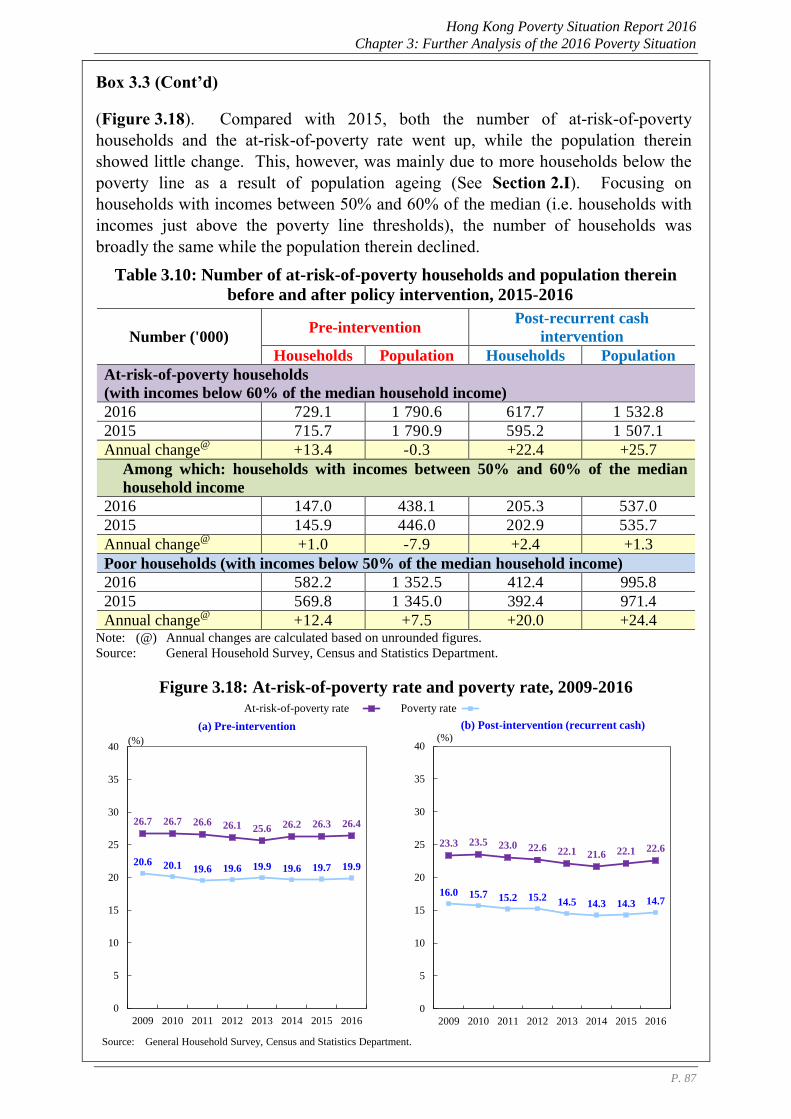
Hong Kong Poverty Situation Report 2016
Chapter 3: Further Analysis of the 2016 Poverty Situation
P. 87
Box 3.3 (Cont’d)
(Figure 3.18). Compared with 2015, both the number of at-risk-of-poverty
households and the at-risk-of-poverty rate went up, while the population therein
showed little change. This, however, was mainly due to more households below the
poverty line as a result of population ageing (See Section 2.I). Focusing on
households with incomes between 50% and 60% of the median (i.e. households with
incomes just above the poverty line thresholds), the number of households was
broadly the same while the population therein declined.
Table 3.10: Number of at-risk-of-poverty households and population therein
before and after policy intervention, 2015-2016
Number ('000) Pre-intervention
Post-recurrent cash
intervention
Households Population Households Population
At-risk-of-poverty households
(with incomes below 60% of the median household income)
2016 729.1 1 790.6 617.7 1 532.8
2015 715.7 1 790.9 595.2 1 507.1
Annual change@
+13.4 -0.3 +22.4 +25.7
Among which: households with incomes between 50% and 60% of the median
household income
2016 147.0 438.1 205.3 537.0
2015 145.9 446.0 202.9 535.7
Annual change@
+1.0 -7.9 +2.4 +1.3
Poor households (with incomes below 50% of the median household income)
2016 582.2 1 352.5 412.4 995.8
2015 569.8 1 345.0 392.4 971.4
Annual change@
+12.4 +7.5 +20.0 +24.4 Note: (@) Annual changes are calculated based on unrounded figures.
Source: General Household Survey, Census and Statistics Department.
Figure 3.18: At-risk-of-poverty rate and poverty rate, 2009-2016
26.7 26.7 26.6 26.1 25.6 26.2 26.3 26.4
20.6 20.1 19.6 19.6 19.9 19.6 19.7 19.9
0
5
10
15
20
25
30
35
40
2009 2010 2011 2012 2013 2014 2015 2016
risk poorAt-risk-of-poverty rate Poverty rate
(%)
(a) Pre-intervention
16.0 15.7 15.2 15.214.5 14.3 14.3 14.7
23.3 23.5 23.0 22.6 22.1 21.6 22.1 22.6
0
5
10
15
20
25
30
35
40
2009 2010 2011 2012 2013 2014 2015 2016
(%)
(b) Post-intervention (recurrent cash)
Source: General Household Survey, Census and Statistics Department.
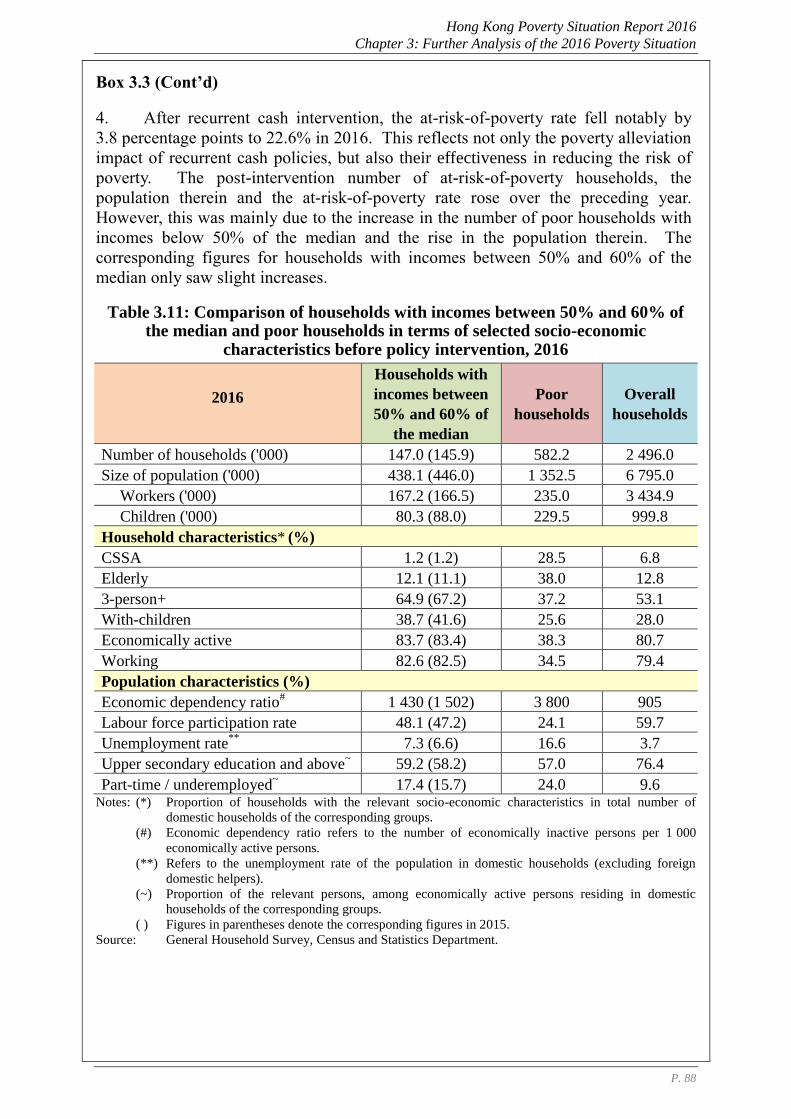
Hong Kong Poverty Situation Report 2016
Chapter 3: Further Analysis of the 2016 Poverty Situation
P. 88
Box 3.3 (Cont’d)
4. After recurrent cash intervention, the at-risk-of-poverty rate fell notably by
3.8 percentage points to 22.6% in 2016. This reflects not only the poverty alleviation
impact of recurrent cash policies, but also their effectiveness in reducing the risk of
poverty. The post-intervention number of at-risk-of-poverty households, the
population therein and the at-risk-of-poverty rate rose over the preceding year.
However, this was mainly due to the increase in the number of poor households with
incomes below 50% of the median and the rise in the population therein. The
corresponding figures for households with incomes between 50% and 60% of the
median only saw slight increases.
Table 3.11: Comparison of households with incomes between 50% and 60% of the median and poor households in terms of selected socio-economic
characteristics before policy intervention, 2016
2016
Households with
incomes between
50% and 60% of
the median
Poor
households
Overall
households
Number of households ('000) 147.0 (145.9) 582.2 2 496.0
Size of population ('000) 438.1 (446.0) 1 352.5 6 795.0
Workers ('000) 167.2 (166.5) 235.0 3 434.9
Children ('000) 80.3 (88.0) 229.5 999.8
Household characteristics* (%)
CSSA 1.2 (1.2) 28.5 6.8
Elderly 12.1 (11.1) 38.0 12.8
3-person+ 64.9 (67.2) 37.2 53.1
With-children 38.7 (41.6) 25.6 28.0
Economically active 83.7 (83.4) 38.3 80.7
Working 82.6 (82.5) 34.5 79.4
Population characteristics (%)
Economic dependency ratio# 1 430 (1 502) 3 800 905
Labour force participation rate 48.1 (47.2) 24.1 59.7
Unemployment rate**
7.3 (6.6) 16.6 3.7
Upper secondary education and above~ 59.2 (58.2) 57.0 76.4
Part-time / underemployed~ 17.4 (15.7) 24.0 9.6
Notes: (*) Proportion of households with the relevant socio-economic characteristics in total number of
domestic households of the corresponding groups.
(#) Economic dependency ratio refers to the number of economically inactive persons per 1 000
economically active persons.
(**) Refers to the unemployment rate of the population in domestic households (excluding foreign
domestic helpers).
(~) Proportion of the relevant persons, among economically active persons residing in domestic
households of the corresponding groups.
( ) Figures in parentheses denote the corresponding figures in 2015.
Source: General Household Survey, Census and Statistics Department.
Hong Kong Poverty Situation Report 2016
Chapter 3: Further Analysis of the 2016 Poverty Situation
P. 89
Box 3.3 (Cont’d)
5. Table 3.11 shows a clear comparison of the differences in major socio-
economic characteristics of households with incomes between 50% and 60% of the
median and those of poor households before policy intervention:
Higher labour force participation rate (LFPR): Among households
with incomes between 50% and 60% of the median, the LFPR was
48.1%, much higher than the corresponding figure of 24.1% for poor
households.
Better employment situation: Among households with incomes
between 50% and 60% of the median, the unemployment rate and the
proportions of part-timers / underemployed persons were 7.3% and
17.4% respectively, both substantially lower than the corresponding
figures for poor households (16.6% and 24.0% respectively).
Higher educational attainment: Among households with incomes
between 50% and 60% of the median, 59.2% of the economically active
persons residing therein had attained upper secondary education and
above, higher than the corresponding figure of 57.0% for poor
households.
More family members with a smaller proportion of elderly
households: Among households with incomes between 50% and 60%
of the median, 64.9% were 3-person-and-above households (37.2% for
poor households), while only 12.1% were elderly households (38.0% for
poor households).
It is evident in the above analyses that households with incomes between 50% and
60% of the median generally fared better than poor households in terms of
employment situation and educational attainment, etc.
6. While setting the poverty line at 50% of the median household income helps
us focus more on the socio-economic groups most in need and formulate the
appropriate and effective poverty alleviation policies for optimal use of limited
resources, the Government not only supports households living below the poverty
line, but also assists families at higher risk of poverty. Of the estimated transfers of
all recurrent cash measures amounting to $38.7 billion in 2016, $25.8 billion (66.7%)
were received by poor households, $2.5 billion (6.5%) by households with incomes
between 50% and 60% of the median, and $2.1 billion (5.5%) by households with
incomes between 60% and 70% of the median. It should be noted that the poverty
line is not equivalent to a “poverty alleviation line”. The Government’s social
security policies in support of the underprivileged are not confined to poor
households. For example, the income test thresholds of OALA are far more lenient
than the poverty line. Furthermore, with its implementation in May 2016, LIFA not
only provides more support to households with incomes at or below 50% of the
median, but also benefits eligible families with incomes over 50% but not higher than
60% of the median. A Child Allowance is also in place in addition to a Basic / Higher
Allowance to ease intergenerational poverty.
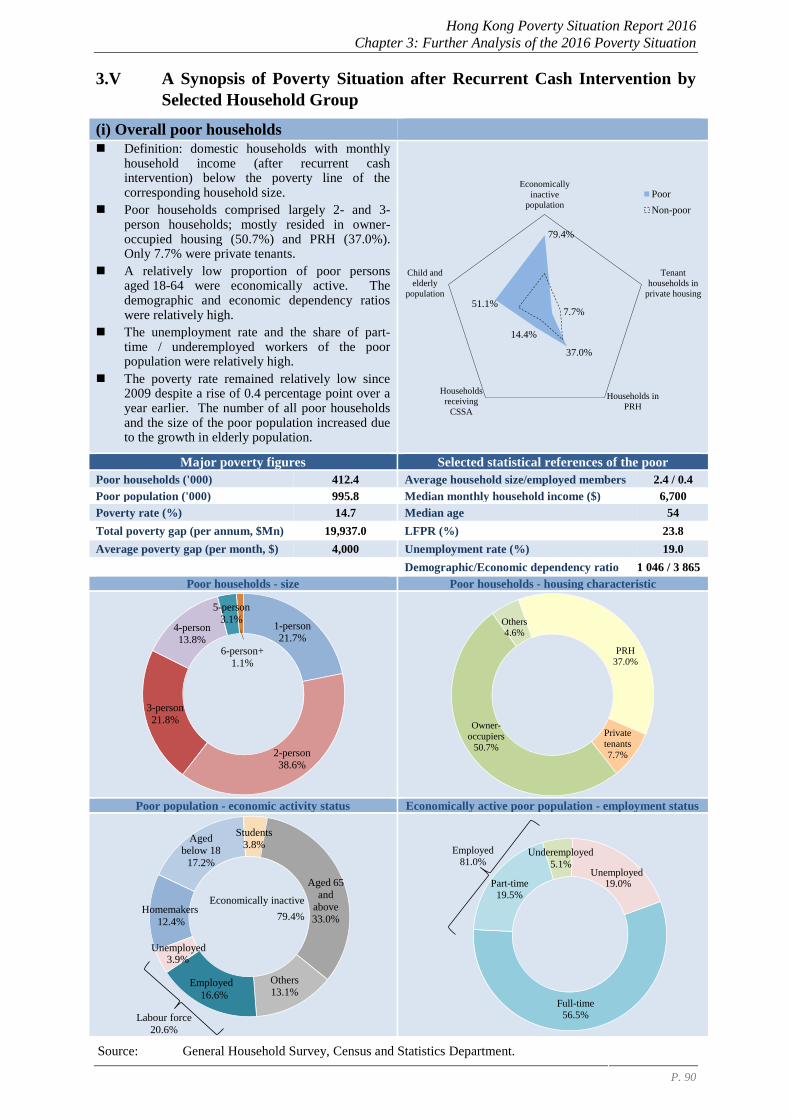
Hong Kong Poverty Situation Report 2016
Chapter 3: Further Analysis of the 2016 Poverty Situation
P. 90
3.V A Synopsis of Poverty Situation after Recurrent Cash Intervention by
Selected Household Group
(i) Overall poor households Definition: domestic households with monthly
household income (after recurrent cash intervention) below the poverty line of the corresponding household size.
Poor households comprised largely 2- and 3-person households; mostly resided in owner-occupied housing (50.7%) and PRH (37.0%). Only 7.7% were private tenants.
A relatively low proportion of poor persons aged 18-64 were economically active. The demographic and economic dependency ratios were relatively high.
The unemployment rate and the share of part-time / underemployed workers of the poor population were relatively high.
The poverty rate remained relatively low since 2009 despite a rise of 0.4 percentage point over a year earlier. The number of all poor households and the size of the poor population increased due to the growth in elderly population.
Major poverty figures Selected statistical references of the poor
Poor households ('000) 412.4 Average household size/employed members 2.4 / 0.4
Poor population ('000) 995.8 Median monthly household income ($) 6,700
Poverty rate (%) 14.7 Median age 54
Total poverty gap (per annum, $Mn) 19,937.0 LFPR (%) 23.8
Average poverty gap (per month, $) 4,000 Unemployment rate (%) 19.0
Demographic/Economic dependency ratio 1 046 / 3 865
Poor households - size Poor households - housing characteristic
Poor population - economic activity status Economically active poor population - employment status
79.4%
7.7%
37.0%
14.4%
51.1%
Economically
inactive
population
Tenant
households in
private housing
Households in
PRH
Households
receiving
CSSA
Child and
elderly
population
Poor
Non-poor
1-person
21.7%
2-person
38.6%
3-person
21.8%
4-person
13.8%
5-person
3.1%
6-person+
1.1%
PRH
37.0%
Private tenants
7.7%
Owner-
occupiers
50.7%
Others4.6%
12.4%
Aged
below 18
17.2%
Students
3.8%
Aged 65
and
above
33.0%
Others
13.1%16.6%
3.9%
Labour force
20.6%
Economically inactive
79.4%
Employed
Homemakers
Unemployed
Full-time
56.5%
Part-time
19.5%
5.1%
19.0%
Employed
81.0%Underemployed
Unemployed
Source: General Household Survey, Census and Statistics Department.
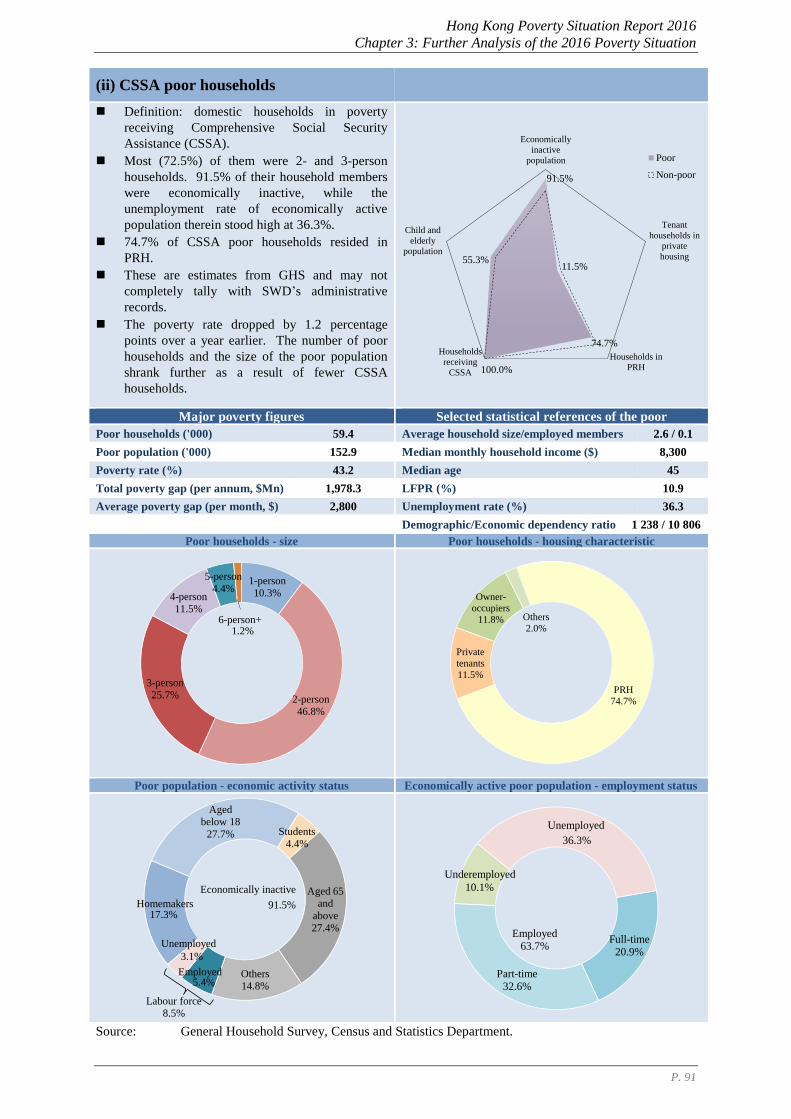
Hong Kong Poverty Situation Report 2016
Chapter 3: Further Analysis of the 2016 Poverty Situation
P. 91
(ii) CSSA poor households
Definition: domestic households in poverty
receiving Comprehensive Social Security
Assistance (CSSA). Most (72.5%) of them were 2- and 3-person
households. 91.5% of their household members
were economically inactive, while the
unemployment rate of economically active
population therein stood high at 36.3%. 74.7% of CSSA poor households resided in
PRH. These are estimates from GHS and may not
completely tally with SWD’s administrative
records.
The poverty rate dropped by 1.2 percentage
points over a year earlier. The number of poor
households and the size of the poor population
shrank further as a result of fewer CSSA
households.
Major poverty figures Selected statistical references of the poor
Poor households ('000) 59.4 Average household size/employed members 2.6 / 0.1
Poor population ('000) 152.9 Median monthly household income ($) 8,300
Poverty rate (%) 43.2 Median age 45
Total poverty gap (per annum, $Mn) 1,978.3 LFPR (%) 10.9
Average poverty gap (per month, $) 2,800 Unemployment rate (%) 36.3
Demographic/Economic dependency ratio 1 238 / 10 806
Poor households - size Poor households - housing characteristic
Poor population - economic activity status Economically active poor population - employment status
Source: General Household Survey, Census and Statistics Department.
91.5%
11.5%
74.7%
100.0%
55.3%
Economically
inactive
population
Tenant
households in
private
housing
Households in
PRH
Households
receiving
CSSA
Child and
elderly
population
Poor
Non-poor
1-person10.3%
2-person
46.8%
3-person
25.7%
4-person
11.5%
5-person4.4%
1.2%6-person+
PRH
74.7%
Private
tenants
11.5%
Owner-
occupiers
11.8% Others
2.0%
17.3%
Aged
below 18
27.7% Students
4.4%
Aged 65
and
above
27.4%
Others14.8%5.4%
3.1%
Labour force
8.5%
Economically inactive
91.5%
Employed
Homemakers
Unemployed Full-time20.9%
Part-time
32.6%
10.1%
36.3%
Employed
63.7%
Underemployed
Unemployed
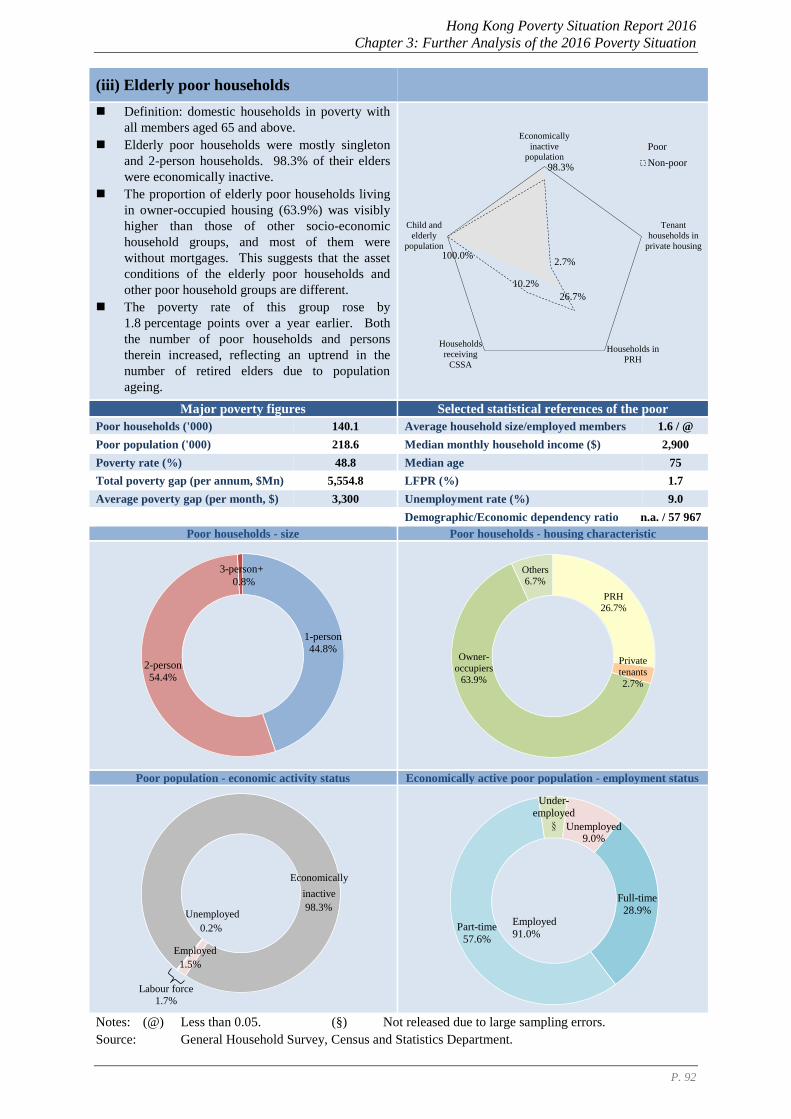
Hong Kong Poverty Situation Report 2016
Chapter 3: Further Analysis of the 2016 Poverty Situation
P. 92
(iii) Elderly poor households
Definition: domestic households in poverty with
all members aged 65 and above. Elderly poor households were mostly singleton
and 2-person households. 98.3% of their elders
were economically inactive. The proportion of elderly poor households living
in owner-occupied housing (63.9%) was visibly
higher than those of other socio-economic
household groups, and most of them were
without mortgages. This suggests that the asset
conditions of the elderly poor households and
other poor household groups are different. The poverty rate of this group rose by
1.8 percentage points over a year earlier. Both
the number of poor households and persons
therein increased, reflecting an uptrend in the
number of retired elders due to population
ageing.
Major poverty figures Selected statistical references of the poor
Poor households ('000) 140.1 Average household size/employed members 1.6 / @
Poor population ('000) 218.6 Median monthly household income ($) 2,900
Poverty rate (%) 48.8 Median age 75
Total poverty gap (per annum, $Mn) 5,554.8 LFPR (%) 1.7
Average poverty gap (per month, $) 3,300 Unemployment rate (%) 9.0
Demographic/Economic dependency ratio n.a. / 57 967
Poor households - size Poor households - housing characteristic
Poor population - economic activity status Economically active poor population - employment status
Notes: (@) Less than 0.05. (§) Not released due to large sampling errors.
Source: General Household Survey, Census and Statistics Department.
98.3%
2.7%
26.7%
10.2%
100.0%
Economically
inactive
population
Tenant
households in
private housing
Households in
PRH
Households
receiving
CSSA
Child and
elderly
population
Poor
Non-poor
1-person
44.8%
2-person
54.4%
0.8%
3-person+
PRH
26.7%
Private tenants
2.7%
Owner-occupiers
63.9%
Others
6.7%
98.3%
1.5%
0.2%
Labour force
1.7%
Unemployed
Economically
inactive
Employed
Full-time28.9%
Part-time
57.6%
9.0%
Employed
91.0%
Under-employed
§ Unemployed
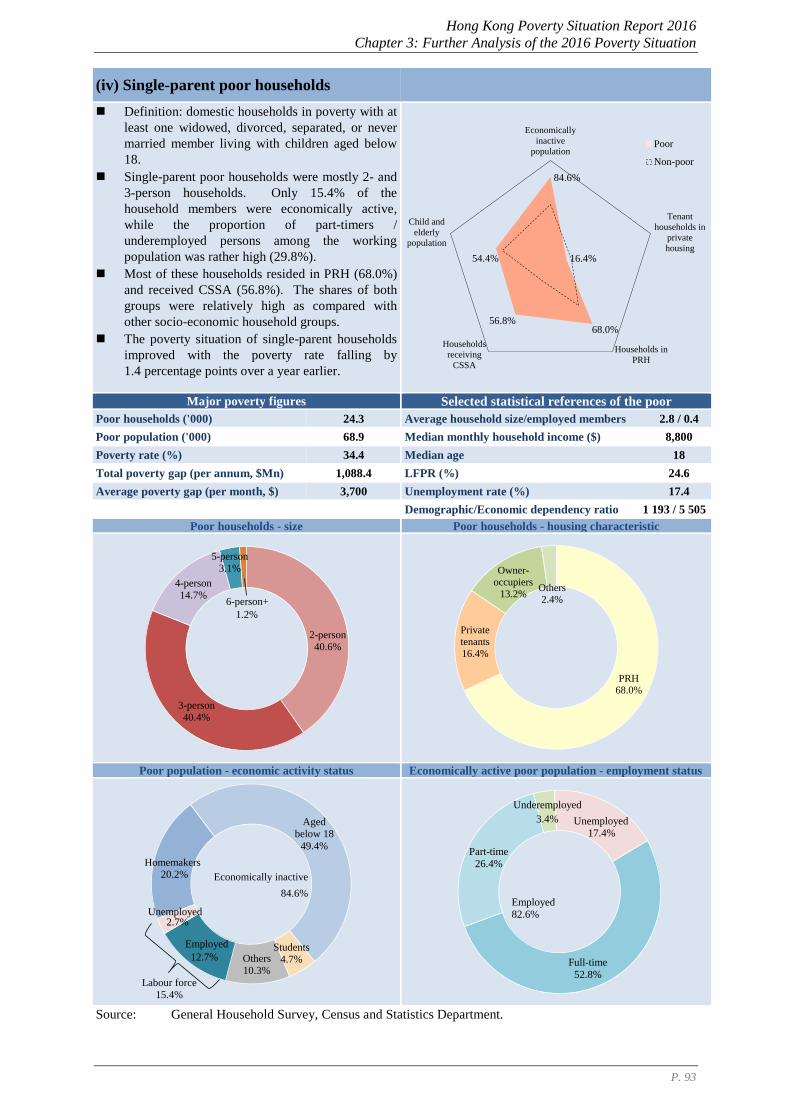
Hong Kong Poverty Situation Report 2016
Chapter 3: Further Analysis of the 2016 Poverty Situation
P. 93
(iv) Single-parent poor households
Definition: domestic households in poverty with at
least one widowed, divorced, separated, or never
married member living with children aged below
18.
Single-parent poor households were mostly 2- and
3-person households. Only 15.4% of the
household members were economically active,
while the proportion of part-timers /
underemployed persons among the working
population was rather high (29.8%).
Most of these households resided in PRH (68.0%)
and received CSSA (56.8%). The shares of both
groups were relatively high as compared with
other socio-economic household groups.
The poverty situation of single-parent households
improved with the poverty rate falling by
1.4 percentage points over a year earlier.
Major poverty figures Selected statistical references of the poor
Poor households ('000) 24.3 Average household size/employed members 2.8 / 0.4
Poor population ('000) 68.9 Median monthly household income ($) 8,800
Poverty rate (%) 34.4 Median age 18
Total poverty gap (per annum, $Mn) 1,088.4 LFPR (%) 24.6
Average poverty gap (per month, $) 3,700 Unemployment rate (%) 17.4
Demographic/Economic dependency ratio 1 193 / 5 505
Poor households - size Poor households - housing characteristic
Poor population - economic activity status Economically active poor population - employment status
Source: General Household Survey, Census and Statistics Department.
84.6%
16.4%
68.0%56.8%
54.4%
Economically
inactive
population
Tenant
households in
private
housing
Households in
PRH
Households
receiving
CSSA
Child and
elderly
population
Poor
Non-poor
2-person
40.6%
3-person40.4%
4-person
14.7%
5-person
3.1%
1.2%
6-person+
PRH
68.0%
Private
tenants
16.4%
Owner-
occupiers
13.2%Others
2.4%
20.2%
Aged
below 18
49.4%
Students4.7%Others
10.3%
12.7%
2.7%
Labour force
15.4%
Economically inactive
84.6%
Unemployed
Homemakers
Employed
Full-time
52.8%
Part-time
26.4%
3.4%
17.4%
Employed82.6%
Underemployed
Unemployed
Hong Kong Poverty Situation Report 2016
Chapter 3: Further Analysis of the 2016 Poverty Situation
P. 94
(v) New-arrival poor households
Definition: domestic households in poverty with
at least one member who is One-way Permit
Holder and has resided in Hong Kong for less
than seven years. New-arrival poor households were mostly 3- and
4-person households. Their LFPR was relatively
high among various household groups. However,
with a low proportion (7.3%) of higher-skilled
workers, their household incomes were quite low. The proportions of new-arrival poor households
residing in PRH (45.0%) and private rental
housing (36.7%) were relatively high among poor
households. The poverty situation of new-arrival households
improved with the poverty rate falling by
1.7 percentage points over a year earlier.
Major poverty figures Selected statistical references of the poor
Poor households ('000) 19.2 Average household size/employed members 3.4 / 0.7
Poor population ('000) 65.5 Median monthly household income ($) 12,000
Poverty rate (%) 30.1 Median age 33
Total poverty gap (per annum, $Mn) 937.4 LFPR (%) 37.2
Average poverty gap (per month, $) 4,100 Unemployment rate (%) 11.7
Demographic/Economic dependency ratio 860 / 3 088
Poor households - size Poor households - housing characteristic
Poor population - economic activity status Economically active poor population - employment status
Note: (§) Not released due to large sampling errors.
Source: General Household Survey, Census and Statistics Department.
75.5%
36.7%
45.0%
22.1%
46.2%
Economically
inactive
population
Tenant
households in
private
housing
Households in
PRH
Households
receiving
CSSA
Child and
elderly
population
Poor
Non-poor
1-person
§2-person
17.1%
3-person37.6%
4-person
31.6%
5-person
10.4%
2.5%
6-person+
PRH
45.0%Private
tenants
36.7%
Owner-occupiers
15.9%
Others
2.4%
20.4%
Aged
below 18
36.9%
Students2.3%
Aged 65
and
above
8.6%Others
7.3%21.6%
2.9%
Labour force
24.5%
Economically inactive
75.5%
Unemployed
Homemakers
Employed
Full-time
65.0%
Part-time
17.5%
5.8%
11.7%
Employed
88.3%
Unemployed
Underemployed
Hong Kong Poverty Situation Report 2016
Chapter 3: Further Analysis of the 2016 Poverty Situation
P. 95
(vi) Poor households with children
Definition: domestic households in poverty with
at least one member aged below 18.
Poor households with children comprised mostly
3- and 4-person households. Their average
household size (3.6 persons) was relatively large.
Over three-quarters of the members in the
households were economically inactive,
conceivably due to the child care responsibilities
of members aged 18-64.
51.4% of poor households with children resided
in PRH, a proportion higher than that of overall
poor households (37.0%).
The poverty situation of households with children
improved with the poverty rate falling by
0.7 percentage point over a year earlier.
Major poverty figures Selected statistical references of the poor
Poor households ('000) 114.1 Average household size/employed members 3.6 / 0.7
Poor population ('000) 407.6 Median monthly household income ($) 12,400
Poverty rate (%) 15.3 Median age 31
Total poverty gap (per annum, $Mn) 6,149.1 LFPR (%) 35.3
Average poverty gap (per month, $) 4,500 Unemployment rate (%) 12.7
Demographic/Economic dependency ratio 960 / 3 258
Poor households - size Poor households - housing characteristic
Poor population - economic activity status Economically active poor population - employment status
Source: General Household Survey, Census and Statistics Department.
76.5%
15.5%
51.4%
23.5%
49.0%
Economically
inactive
population
Tenant
households in
private
housing
Households in
PRH
Households
receiving
CSSA
Child and
elderly
population
Poor
Non-poor
2-person
11.9%
3-person
36.8%4-person
37.1%
5-person
10.1%
3.8%6-person+
PRH51.4%
Private tenants
15.5%
Owner-
occupiers
29.5%
Others
3.6%
18.8%
Aged
below 18
41.9%
Aged 65 and
above
6.6%Others9.3%
20.5%
3.0%
Labour force
23.5%
Economically inactive
76.5%
Unemployed
Homemakers
Employed
Full-time66.3%
Part-time
16.8%
4.2%
12.7%
Employed
87.3%
Underemployed
Unemployed
Hong Kong Poverty Situation Report 2016
Chapter 3: Further Analysis of the 2016 Poverty Situation
P. 96
(vii) Youth poor households
Definition: domestic households in poverty with all members aged 18-29.
Comprising largely singleton households, both the number of youth poor households and the size of their population were small. The majority of household members were economically inactive ones who were mostly students. The unemployment rate of the labour force therein stood high at 38.9%.
Compared with other groups, private tenant households accounted for a particularly high proportion (59.9%).
The poverty rate of youth households rose by 1.1 percentage points over a year earlier, faring worse than other household groups.
Major poverty figures Selected statistical references of the poor
Poor households ('000) 1.9 Average household size/employed members 1.8 / 0.2
Poor population ('000) 3.6 Median monthly household income ($) 2,900
Poverty rate (%) 4.7 Median age 24
Total poverty gap (per annum, $Mn) 93.1 LFPR (%) 18.7
Average poverty gap (per month, $) 4,000 Unemployment rate (%) 38.9
Demographic/Economic dependency ratio n.a. / 4 353
Poor households - size Poor households - housing characteristic
Poor population - economic activity status Economically active poor population - employment status
Notes: (-) Not applicable.
(§) Not released due to large sampling errors.
Source: General Household Survey, Census and Statistics Department.
81.3%
59.9%
§
Economically
inactive
population
Tenant
households in
private
housing
Households in
PRH
Households
receiving
CSSA
Child and
elderly
population
Poor
Non-poor
-
1-person
59.7%2-person
14.2%
26.1%3-person+
PRH
§
Private
tenants
59.9%
Owner-
occupiers
21.7%
Others
§
Students
52.2%
Others
29.1%11.4%
7.3%
Labour force
18.7%
Economically inactive
81.3%
Unemployed
Employed 61.1%
38.9%
Employed
Unemployed
Hong Kong Poverty Situation Report 2016
Chapter 3: Further Analysis of the 2016 Poverty Situation
P. 97
(viii) Unemployed poor households
Definition: domestic households in poverty with all
economically active members being unemployed.
Unemployed poor households were mostly 1- to 3-
person households. The proportion of CSSA
households (19.2%) was higher than that of overall
poor households.
About three-tenths (30.9%) of the unemployed
members were long-term unemployed (viz.
unemployed for 6 months and above).
The proportions of the households residing in PRH
(37.7%) and owner-occupied housing (45.2%) were
similar to those of overall poor households.
Both the number of poor households and the size of
their poor population went up due to a rise in the
overall number of unemployed households.
However, the poverty rate of unemployed
households edged down by 0.1 percentage point
over a year earlier.
Major poverty figures Selected statistical references of the poor
Poor households ('000) 19.1 Average household size/employed members 2.5 / n.a.
Poor population ('000) 47.3 Median monthly household income ($) 4,900
Poverty rate (%) 69.8 Median age 45
Total poverty gap (per annum, $Mn) 1,488.9 LFPR (%) 51.8
Average poverty gap (per month, $) 6,500 Unemployment rate (%) 100.0
Demographic/Economic dependency ratio 540 / 1 226
Poor households - size Poor households - housing characteristic
Poor population - economic activity status Poor population - duration of unemployment
Note: (§) Not released due to large sampling errors.
Source: General Household Survey, Census and Statistics Department.
55.1%
13.4%
37.7%
19.2%
35.0%
Economically
inactive
population
Tenant
households in
private
housing
Households in
PRH
Households
receiving
CSSA
Child and
elderly
population
Poor
Non-poor
1-person21.2%
2-person
32.6%
3-person
28.9%
4-person
13.2%
5-person
3.2%
§
6-person+PRH
37.7%
Private tenants
13.4%
Owner-
occupiers
45.2%
Others
3.7%
11.1%
Aged
below 18
16.6%Students
2.9%
Others
24.5%
44.9%
Economically inactive
55.1%
Unemployed
Homemakers
<1 month
14.3%
1-<3
months
38.0%
3-<6
months
16.7%
6-<12
months
13.5%
12-<18
months
5.3%
18
months+
12.0%
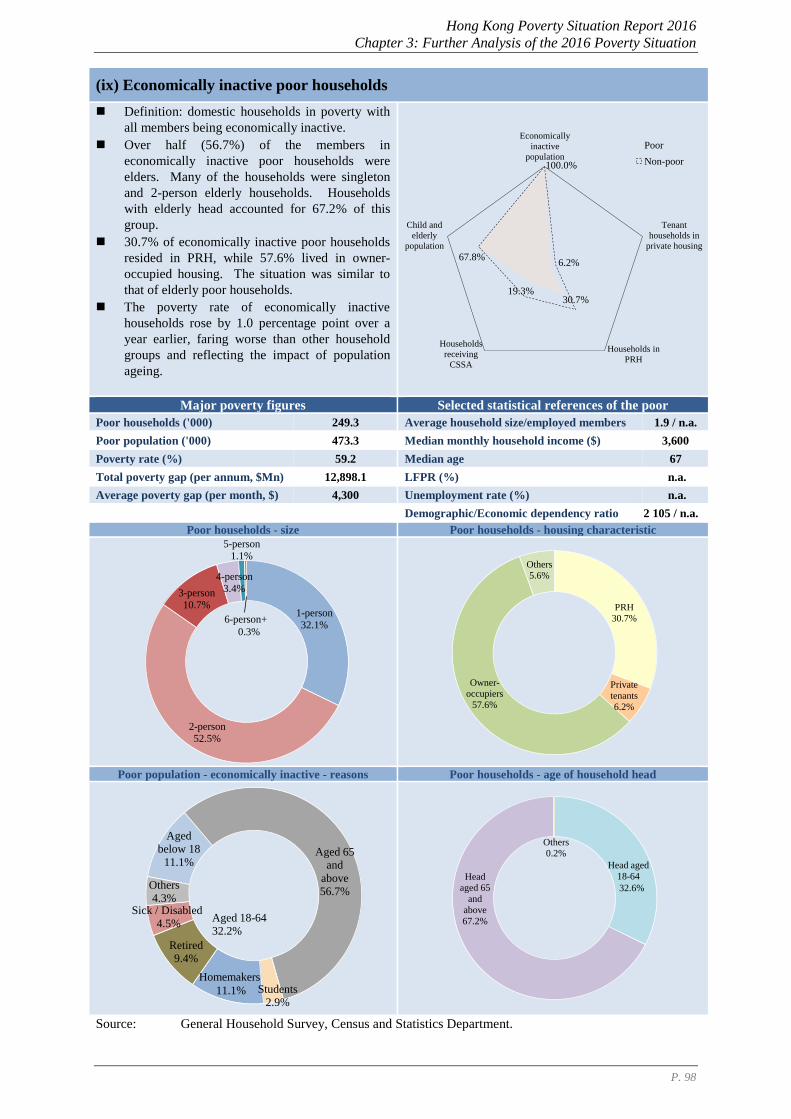
Hong Kong Poverty Situation Report 2016
Chapter 3: Further Analysis of the 2016 Poverty Situation
P. 98
(ix) Economically inactive poor households
Definition: domestic households in poverty with
all members being economically inactive.
Over half (56.7%) of the members in
economically inactive poor households were
elders. Many of the households were singleton
and 2-person elderly households. Households
with elderly head accounted for 67.2% of this
group.
30.7% of economically inactive poor households
resided in PRH, while 57.6% lived in owner-
occupied housing. The situation was similar to
that of elderly poor households.
The poverty rate of economically inactive
households rose by 1.0 percentage point over a
year earlier, faring worse than other household
groups and reflecting the impact of population
ageing.
Major poverty figures Selected statistical references of the poor
Poor households ('000) 249.3 Average household size/employed members 1.9 / n.a.
Poor population ('000) 473.3 Median monthly household income ($) 3,600
Poverty rate (%) 59.2 Median age 67
Total poverty gap (per annum, $Mn) 12,898.1 LFPR (%) n.a.
Average poverty gap (per month, $) 4,300 Unemployment rate (%) n.a.
Demographic/Economic dependency ratio 2 105 / n.a.
Poor households - size Poor households - housing characteristic
Poor population - economically inactive - reasons Poor households - age of household head
Source: General Household Survey, Census and Statistics Department.
100.0%
6.2%
30.7%19.3%
67.8%
Economically
inactive
population
Tenant
households in
private housing
Households in
PRH
Households
receiving
CSSA
Child and
elderly
population
Poor
Non-poor
1-person32.1%
2-person
52.5%
3-person
10.7%
4-person
3.4%
5-person
1.1%
0.3%
6-person+
PRH
30.7%
Private
tenants
6.2%
Owner-occupiers
57.6%
Others
5.6%
Aged
below 18
11.1%Aged 65
and
above
56.7%
Students 2.9%
11.1%
Retired
9.4%
4.5%
Others
4.3%
Aged 18-64
32.2%
Sick / Disabled
Homemakers
32.6%
Head
aged 65
and
above
67.2%
Others
0.2%
Head aged
18-64
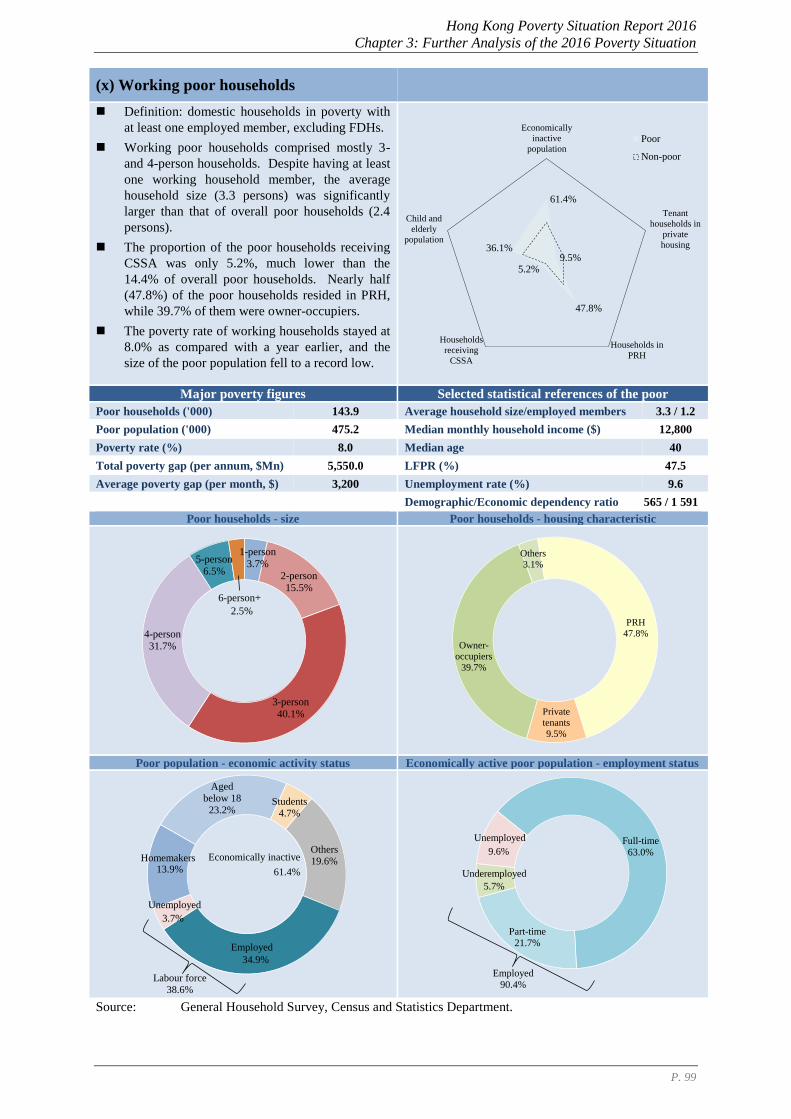
Hong Kong Poverty Situation Report 2016
Chapter 3: Further Analysis of the 2016 Poverty Situation
P. 99
(x) Working poor households
Definition: domestic households in poverty with
at least one employed member, excluding FDHs.
Working poor households comprised mostly 3-
and 4-person households. Despite having at least
one working household member, the average
household size (3.3 persons) was significantly
larger than that of overall poor households (2.4
persons).
The proportion of the poor households receiving
CSSA was only 5.2%, much lower than the
14.4% of overall poor households. Nearly half
(47.8%) of the poor households resided in PRH,
while 39.7% of them were owner-occupiers.
The poverty rate of working households stayed at
8.0% as compared with a year earlier, and the
size of the poor population fell to a record low.
Major poverty figures Selected statistical references of the poor
Poor households ('000) 143.9 Average household size/employed members 3.3 / 1.2
Poor population ('000) 475.2 Median monthly household income ($) 12,800
Poverty rate (%) 8.0 Median age 40
Total poverty gap (per annum, $Mn) 5,550.0 LFPR (%) 47.5
Average poverty gap (per month, $) 3,200 Unemployment rate (%) 9.6
Demographic/Economic dependency ratio 565 / 1 591
Poor households - size Poor households - housing characteristic
Poor population - economic activity status Economically active poor population - employment status
Source: General Household Survey, Census and Statistics Department.
61.4%
9.5%
47.8%
5.2%
36.1%
Economically
inactive
population
Tenant
households in
private
housing
Households in
PRH
Households
receiving
CSSA
Child and
elderly
population
Poor
Non-poor
1-person3.7%
2-person
15.5%
3-person
40.1%
4-person31.7%
5-person
6.5%
2.5%
6-person+
PRH
47.8%
Private
tenants
9.5%
Owner-occupiers
39.7%
Others
3.1%
13.9%
Aged
below 18
23.2%Students
4.7%
Others
19.6%
34.9%
3.7%
Labour force
38.6%
Economically inactive
61.4%
Employed
Homemakers
Unemployed
Full-time
63.0%
Part-time
21.7%
5.7%
9.6%
Employed
90.4%
Underemployed
Unemployed
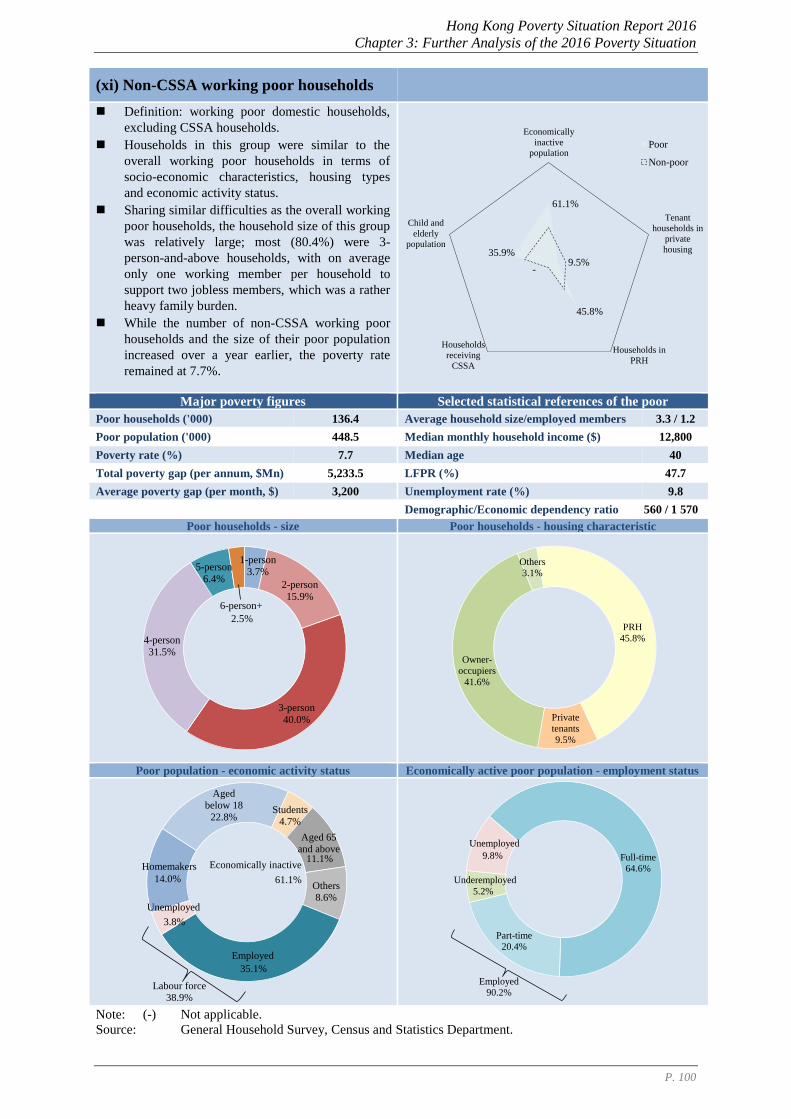
Hong Kong Poverty Situation Report 2016
Chapter 3: Further Analysis of the 2016 Poverty Situation
P. 100
(xi) Non-CSSA working poor households
Definition: working poor domestic households,
excluding CSSA households.
Households in this group were similar to the
overall working poor households in terms of
socio-economic characteristics, housing types
and economic activity status.
Sharing similar difficulties as the overall working
poor households, the household size of this group
was relatively large; most (80.4%) were 3-
person-and-above households, with on average
only one working member per household to
support two jobless members, which was a rather
heavy family burden.
While the number of non-CSSA working poor
households and the size of their poor population
increased over a year earlier, the poverty rate
remained at 7.7%.
Major poverty figures Selected statistical references of the poor
Poor households ('000) 136.4 Average household size/employed members 3.3 / 1.2
Poor population ('000) 448.5 Median monthly household income ($) 12,800
Poverty rate (%) 7.7 Median age 40
Total poverty gap (per annum, $Mn) 5,233.5 LFPR (%) 47.7
Average poverty gap (per month, $) 3,200 Unemployment rate (%) 9.8
Demographic/Economic dependency ratio 560 / 1 570
Poor households - size Poor households - housing characteristic
Poor population - economic activity status Economically active poor population - employment status
Note: (-) Not applicable.
Source: General Household Survey, Census and Statistics Department.
61.1%
9.5%
45.8%
-
35.9%
Economically
inactive
population
Tenant
households in
private
housing
Households in
PRH
Households
receiving
CSSA
Child and
elderly
population
Poor
Non-poor
1-person3.7%
2-person15.9%
3-person
40.0%
4-person31.5%
5-person
6.4%
2.5%
6-person+
PRH
45.8%
Private tenants
9.5%
Owner-
occupiers
41.6%
Others
3.1%
14.0%
Aged below 18
22.8%Students
4.7%
11.1%
Others8.6%
35.1%
3.8%
Labour force
38.9%
Economically inactive
61.1%
Unemployed
Homemakers
Aged 65
and above
Employed
Full-time
64.6%
Part-time
20.4%
5.2%
9.8%
Employed
90.2%
Unemployed
Underemployed
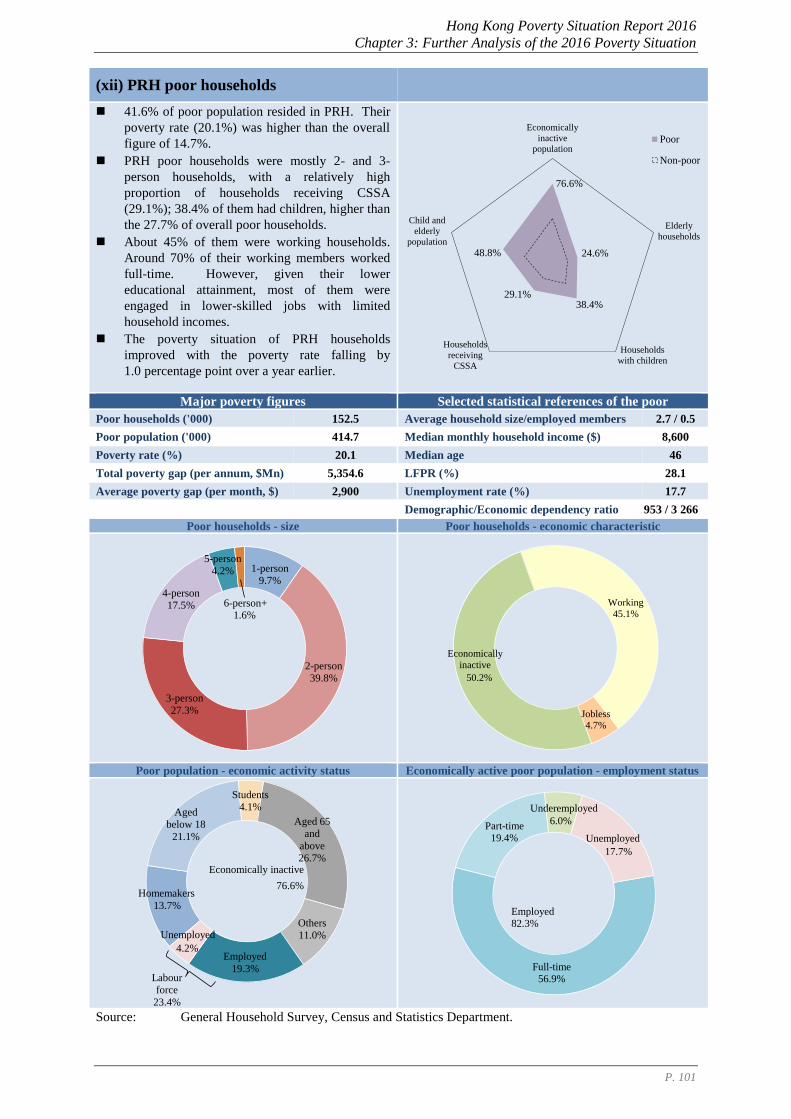
Hong Kong Poverty Situation Report 2016
Chapter 3: Further Analysis of the 2016 Poverty Situation
P. 101
(xii) PRH poor households
41.6% of poor population resided in PRH. Their
poverty rate (20.1%) was higher than the overall
figure of 14.7%.
PRH poor households were mostly 2- and 3-
person households, with a relatively high
proportion of households receiving CSSA
(29.1%); 38.4% of them had children, higher than
the 27.7% of overall poor households.
About 45% of them were working households.
Around 70% of their working members worked
full-time. However, given their lower
educational attainment, most of them were
engaged in lower-skilled jobs with limited
household incomes.
The poverty situation of PRH households
improved with the poverty rate falling by
1.0 percentage point over a year earlier.
Major poverty figures Selected statistical references of the poor
Poor households ('000) 152.5 Average household size/employed members 2.7 / 0.5
Poor population ('000) 414.7 Median monthly household income ($) 8,600
Poverty rate (%) 20.1 Median age 46
Total poverty gap (per annum, $Mn) 5,354.6 LFPR (%) 28.1
Average poverty gap (per month, $) 2,900 Unemployment rate (%) 17.7
Demographic/Economic dependency ratio 953 / 3 266
Poor households - size Poor households - economic characteristic
Poor population - economic activity status Economically active poor population - employment status
Source: General Household Survey, Census and Statistics Department.
76.6%
24.6%
38.4%29.1%
48.8%
Economically
inactive
population
Elderly
households
Households
with children
Households
receiving
CSSA
Child and
elderly
population
Poor
Non-poor
1-person
9.7%
2-person
39.8%
3-person
27.3%
4-person
17.5%
5-person
4.2%
1.6%6-person+ Working
45.1%
Jobless4.7%
50.2%
Economically
inactive
13.7%
Aged
below 18
21.1%
Students
4.1%
Aged 65
and
above26.7%
Others
11.0%
19.3%
4.2%
Labour
force
23.4%
Economically inactive
76.6%Homemakers
Unemployed
EmployedFull-time
56.9%
Part-time19.4%
6.0%
17.7%
Employed
82.3%
Underemployed
Unemployed
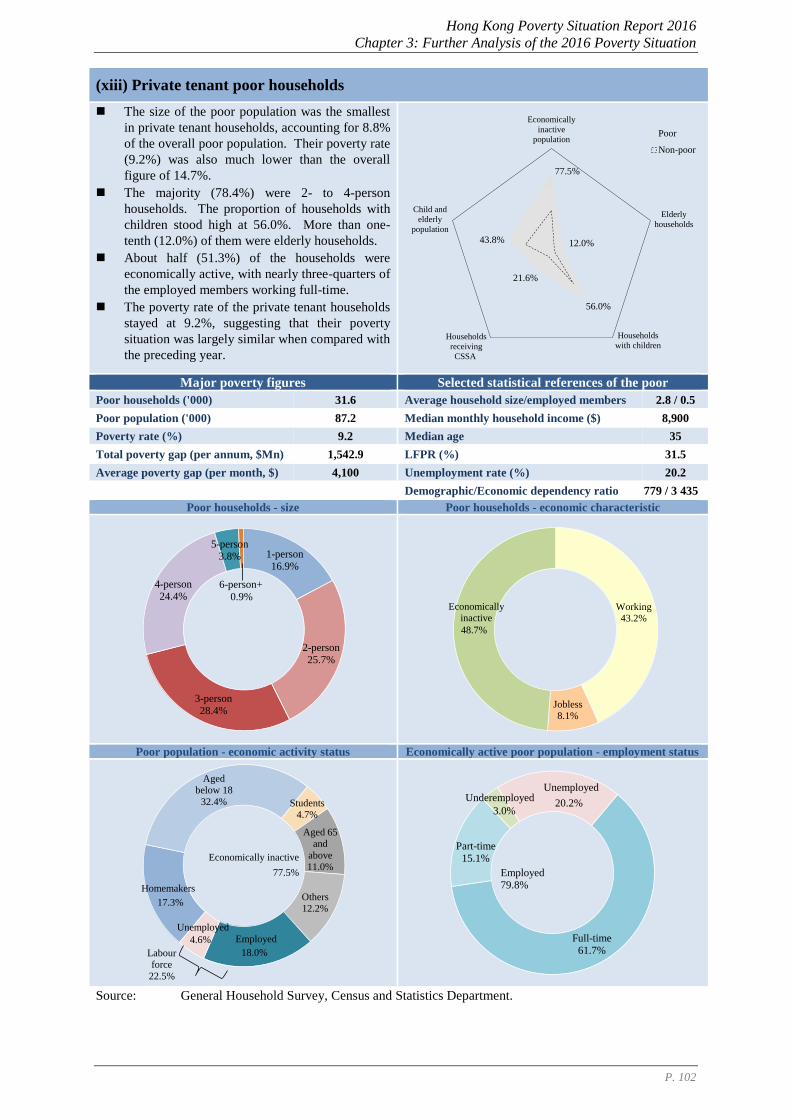
Hong Kong Poverty Situation Report 2016
Chapter 3: Further Analysis of the 2016 Poverty Situation
P. 102
(xiii) Private tenant poor households
The size of the poor population was the smallest
in private tenant households, accounting for 8.8%
of the overall poor population. Their poverty rate
(9.2%) was also much lower than the overall
figure of 14.7%.
The majority (78.4%) were 2- to 4-person
households. The proportion of households with
children stood high at 56.0%. More than one-
tenth (12.0%) of them were elderly households.
About half (51.3%) of the households were
economically active, with nearly three-quarters of
the employed members working full-time.
The poverty rate of the private tenant households
stayed at 9.2%, suggesting that their poverty
situation was largely similar when compared with
the preceding year.
Major poverty figures Selected statistical references of the poor
Poor households ('000) 31.6 Average household size/employed members 2.8 / 0.5
Poor population ('000) 87.2 Median monthly household income ($) 8,900
Poverty rate (%) 9.2 Median age 35
Total poverty gap (per annum, $Mn) 1,542.9 LFPR (%) 31.5
Average poverty gap (per month, $) 4,100 Unemployment rate (%) 20.2
Demographic/Economic dependency ratio 779 / 3 435
Poor households - size Poor households - economic characteristic
Poor population - economic activity status Economically active poor population - employment status
Source: General Household Survey, Census and Statistics Department.
77.5%
12.0%
56.0%
21.6%
43.8%
Economically
inactive
population
Elderly
households
Households
with children
Child and
elderly
population
Poor
Non-poor
Households
receiving
CSSA
1-person
16.9%
2-person
25.7%
3-person
28.4%
4-person24.4%
5-person
3.8%
0.9%
6-person+
Working
43.2%
Jobless
8.1%
48.7%
Economicallyinactive
17.3%
Aged
below 18
32.4% Students
4.7%
Aged 65
and
above
11.0%
Others
12.2%
18.0%
4.6%
Labour
force
22.5%
Economically inactive
77.5%
Homemakers
Unemployed
Employed Full-time
61.7%
Part-time
15.1%
3.0%20.2%
Employed79.8%
UnderemployedUnemployed
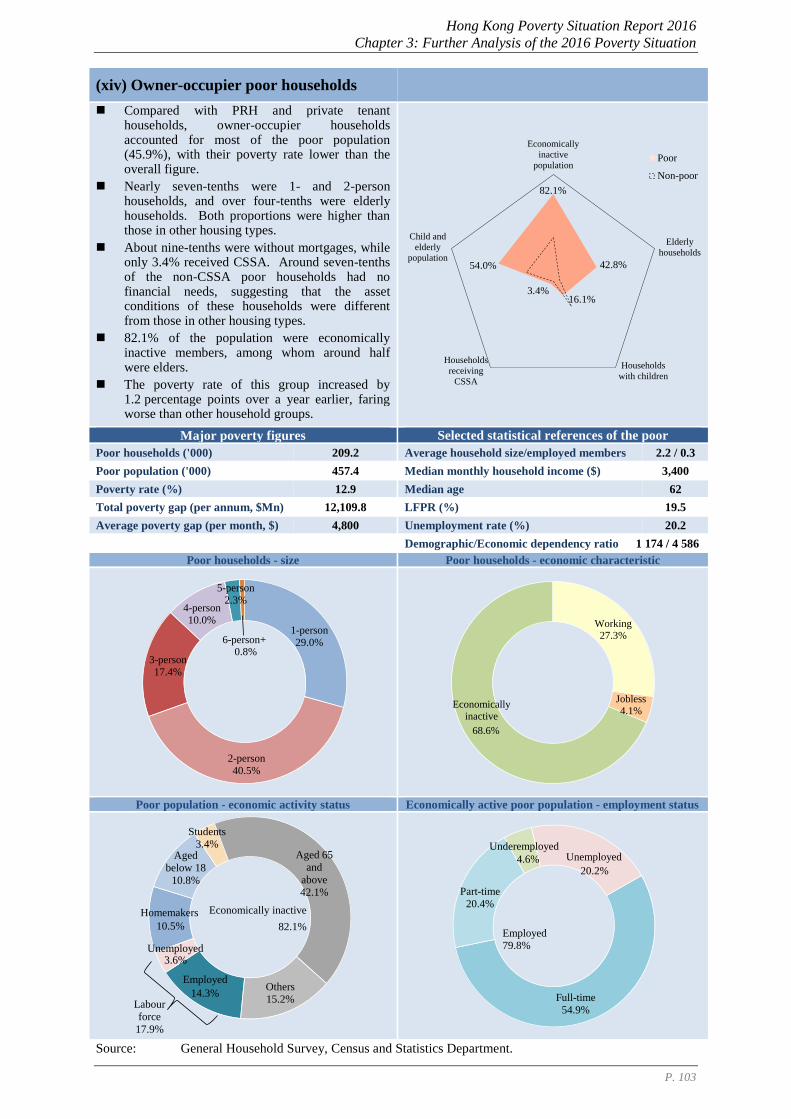
Hong Kong Poverty Situation Report 2016
Chapter 3: Further Analysis of the 2016 Poverty Situation
P. 103
(xiv) Owner-occupier poor households
Compared with PRH and private tenant households, owner-occupier households accounted for most of the poor population (45.9%), with their poverty rate lower than the overall figure.
Nearly seven-tenths were 1- and 2-person households, and over four-tenths were elderly households. Both proportions were higher than those in other housing types.
About nine-tenths were without mortgages, while only 3.4% received CSSA. Around seven-tenths of the non-CSSA poor households had no financial needs, suggesting that the asset conditions of these households were different from those in other housing types.
82.1% of the population were economically inactive members, among whom around half were elders.
The poverty rate of this group increased by 1.2 percentage points over a year earlier, faring worse than other household groups.
Major poverty figures Selected statistical references of the poor
Poor households ('000) 209.2 Average household size/employed members 2.2 / 0.3
Poor population ('000) 457.4 Median monthly household income ($) 3,400
Poverty rate (%) 12.9 Median age 62
Total poverty gap (per annum, $Mn) 12,109.8 LFPR (%) 19.5
Average poverty gap (per month, $) 4,800 Unemployment rate (%) 20.2
Demographic/Economic dependency ratio 1 174 / 4 586
Poor households - size Poor households - economic characteristic
Poor population - economic activity status Economically active poor population - employment status
Source: General Household Survey, Census and Statistics Department.
82.1%
42.8%
16.1%3.4%
54.0%
Economically
inactive
population
Elderly
households
Households
with children
Households
receiving
CSSA
Child and
elderly
population
Poor
Non-poor
1-person
29.0%
2-person
40.5%
3-person
17.4%
4-person
10.0%
5-person
2.3%
0.8%6-person+
Working
27.3%
Jobless4.1%
68.6%
Economically
inactive
10.5%
Aged
below 18
10.8%
Students3.4%
Aged 65 and
above
42.1%
Others
15.2%14.3%
3.6%
Labour
force
17.9%
Economically inactive
82.1%
Homemakers
Unemployed
Employed
Full-time
54.9%
Part-time
20.4%
4.6%20.2%
Employed
79.8%
UnderemployedUnemployed
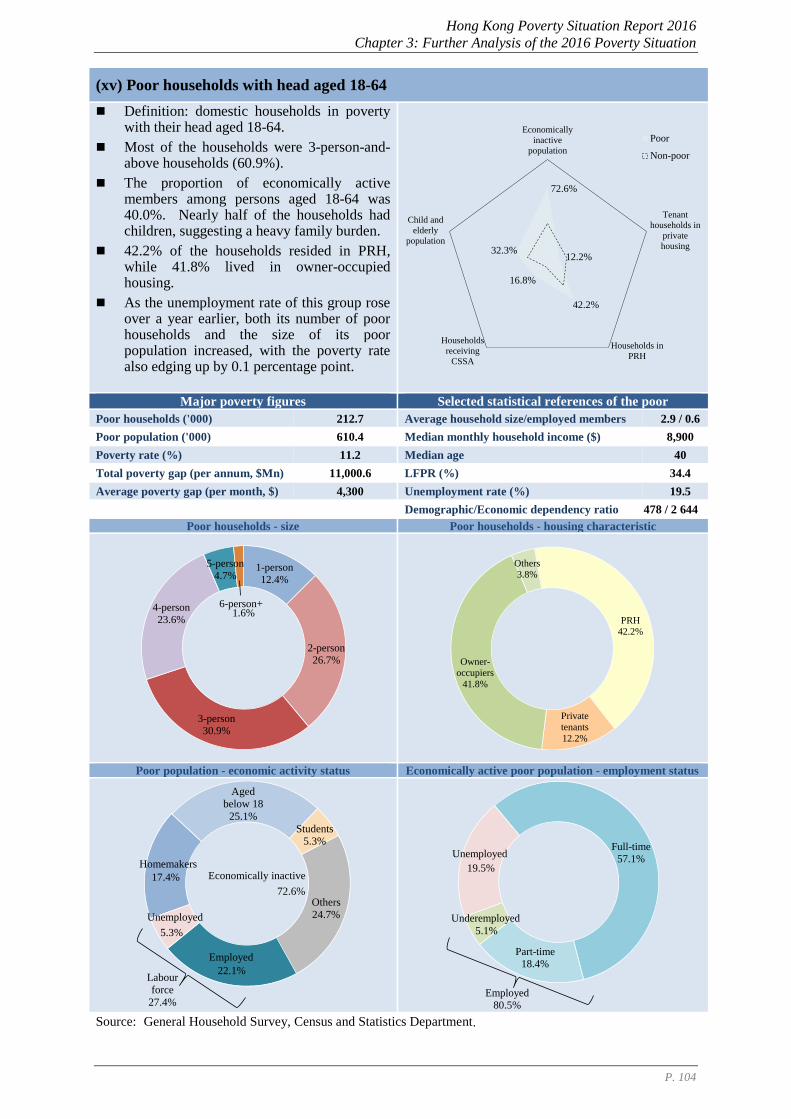
Hong Kong Poverty Situation Report 2016
Chapter 3: Further Analysis of the 2016 Poverty Situation
P. 104
(xv) Poor households with head aged 18-64
Definition: domestic households in poverty with their head aged 18-64.
Most of the households were 3-person-and-above households (60.9%).
The proportion of economically active members among persons aged 18-64 was 40.0%. Nearly half of the households had children, suggesting a heavy family burden.
42.2% of the households resided in PRH, while 41.8% lived in owner-occupied housing.
As the unemployment rate of this group rose over a year earlier, both its number of poor households and the size of its poor population increased, with the poverty rate also edging up by 0.1 percentage point.
Major poverty figures Selected statistical references of the poor
Poor households ('000) 212.7 Average household size/employed members 2.9 / 0.6
Poor population ('000) 610.4 Median monthly household income ($) 8,900
Poverty rate (%) 11.2 Median age 40
Total poverty gap (per annum, $Mn) 11,000.6 LFPR (%) 34.4
Average poverty gap (per month, $) 4,300 Unemployment rate (%) 19.5
Demographic/Economic dependency ratio 478 / 2 644
Poor households - size Poor households - housing characteristic
Poor population - economic activity status Economically active poor population - employment status
Source: General Household Survey, Census and Statistics Department.
72.6%
12.2%
42.2%
16.8%
32.3%
Economically
inactive
population
Tenant
households in
private
housing
Households in
PRH
Households
receiving
CSSA
Child and
elderly
population
Poor
Non-poor
1-person
12.4%
2-person
26.7%
3-person30.9%
4-person23.6%
5-person4.7%
1.6%6-person+
PRH
42.2%
Private
tenants
12.2%
Owner-
occupiers
41.8%
Others
3.8%
17.4%
Aged
below 18
25.1%
Students
5.3%
Others
24.7%
22.1%
5.3%
Labour
force
27.4%
Economically inactive
72.6%
Homemakers
Unemployed
Employed
Full-time
57.1%
Part-time
18.4%
5.1%
19.5%
Employed80.5%
Underemployed
Unemployed
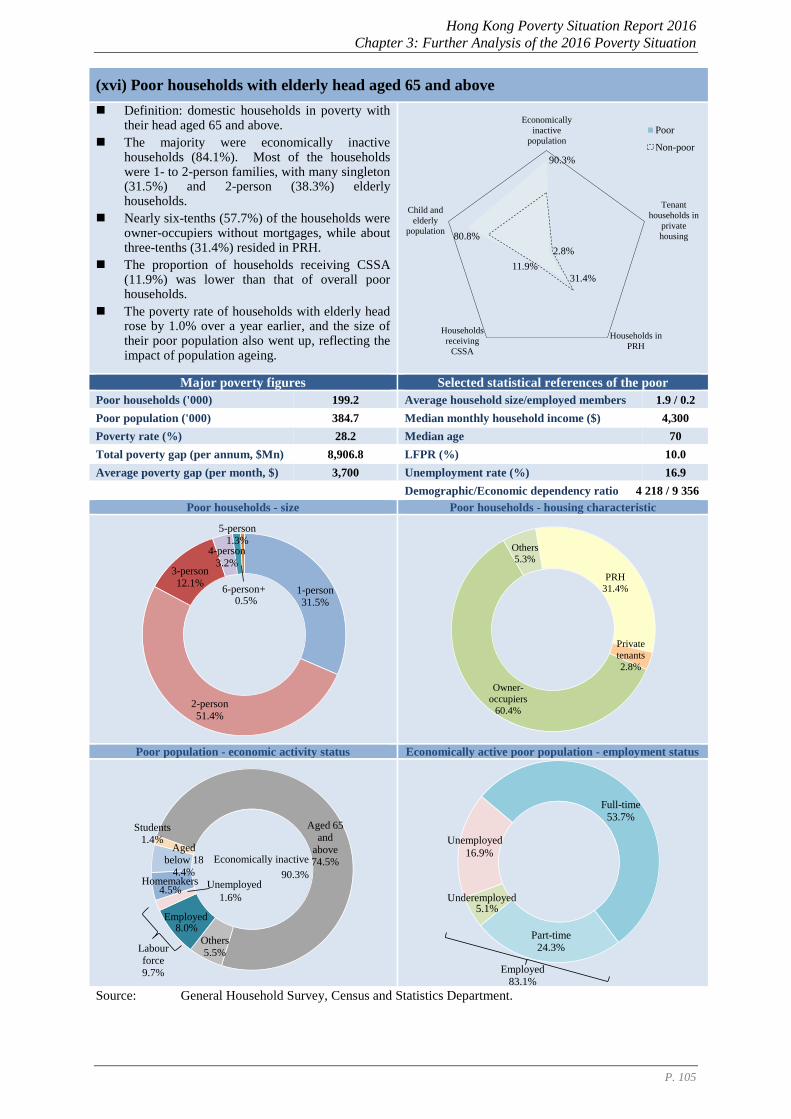
Hong Kong Poverty Situation Report 2016
Chapter 3: Further Analysis of the 2016 Poverty Situation
P. 105
(xvi) Poor households with elderly head aged 65 and above
Definition: domestic households in poverty with their head aged 65 and above.
The majority were economically inactive households (84.1%). Most of the households were 1- to 2-person families, with many singleton (31.5%) and 2-person (38.3%) elderly households.
Nearly six-tenths (57.7%) of the households were owner-occupiers without mortgages, while about three-tenths (31.4%) resided in PRH.
The proportion of households receiving CSSA (11.9%) was lower than that of overall poor households.
The poverty rate of households with elderly head rose by 1.0% over a year earlier, and the size of their poor population also went up, reflecting the impact of population ageing.
Major poverty figures Selected statistical references of the poor
Poor households ('000) 199.2 Average household size/employed members 1.9 / 0.2
Poor population ('000) 384.7 Median monthly household income ($) 4,300
Poverty rate (%) 28.2 Median age 70
Total poverty gap (per annum, $Mn) 8,906.8 LFPR (%) 10.0
Average poverty gap (per month, $) 3,700 Unemployment rate (%) 16.9
Demographic/Economic dependency ratio 4 218 / 9 356
Poor households - size Poor households - housing characteristic
Poor population - economic activity status Economically active poor population - employment status
Source: General Household Survey, Census and Statistics Department.
90.3%
2.8%
31.4%
11.9%
80.8%
Economically
inactive
population
Tenant
households in
private
housing
Households in
PRH
Households
receiving
CSSA
Child and
elderly
population
Poor
Non-poor
1-person
31.5%
2-person51.4%
3-person
12.1%
4-person
3.2%
5-person
1.3%
0.5%6-person+
PRH
31.4%
Private
tenants
2.8%
Owner-occupiers
60.4%
Others
5.3%
4.5%
Aged
below 18
4.4%
Students
1.4%
Aged 65
and
above
74.5%
Others5.5%
8.0%
1.6%
Labour
force
9.7%
Economically inactive
90.3%Homemakers Unemployed
Employed
Full-time
53.7%
Part-time
24.3%
5.1%
16.9%
Employed
83.1%
Underemployed
Unemployed
Hong Kong Poverty Situation Report 2016
Chapter 3: Further Analysis of the 2016 Poverty Situation
P. 106
3.VI A Synopsis of Poverty Situation after Recurrent Cash Intervention by
District Council District
(i) Central and Western Among the poor population in Central and
Western, the proportion of elders was relatively
high, with the median age reaching 63. The
majority (83.6%) of its poor population were
economically inactive. Only 2.9% of the poor households resided in PRH,
while a high proportion of 80.0% were owner-
occupiers, the highest among all districts. Of these
households, 93.5% were without mortgages.
97.8% of the poor households did not receive
CSSA, the highest among the 18 districts. The
majority of its non-CSSA poor households (80.5%)
had no financial needs.
The poverty rate of Central and Western was the
third lowest among the 18 districts, only higher
than those of Eastern and Southern districts.
Major poverty figures Selected statistical references of the poor
Poor households ('000) 12.0 Average household size/employed members 2.1 / 0.3
Poor population ('000) 25.3 Median monthly household income ($) 3,000
Poverty rate (%) 12.0 Median age 63
Total poverty gap (per annum, $Mn) 749.5 LFPR (%) 17.6
Average poverty gap (per month, $) 5,200 Unemployment rate (%) 22.2
Ranking in 18 districts by poverty rate
(in descending order) 16 / 18 Demographic/Economic dependency ratio 1 386 / 5 112
Poor households - size Poor households - housing characteristic
Poor population - economic activity status Economically active poor population - employment status
83.6%
7.5%
2.9%2.2%
58.1%
Economically
inactive
population
Tenant
households in
private
housing
Households in
PRH
Households
receiving
CSSA
Child and
elderly
population
Poor
Non-poor
1-person
32.2%
2-person
37.7%
3-person
20.3%
4-person
7.7%
2.2%
5-person+PRH
2.9%
Private
tenants
7.5%
Owner-
occupiers
80.0%
Others
9.6%
9.5%
Aged
below 18
10.7%
Students
3.3%
Aged 65 and
above
46.2%
Others
14.0%12.7%
3.6%
Labour force
16.4%
Economically inactive
83.6%Homemakers
Unemployed
Employed
Full-time
53.0%
Part-time
18.7%
6.2%
22.2%
Employed
77.8%
Underemployed
Unemployed
Source: General Household Survey, Census and Statistics Department.
Hong Kong Poverty Situation Report 2016
Chapter 3: Further Analysis of the 2016 Poverty Situation
P. 107
(ii) Wan Chai
Similar to the poverty situation in Central and Western, the median age of the poor population in Wan Chai was high at 64, and nearly half of the poor population were elders. Most of the poor were economically inactive, without employment earnings.
77.3% of the poor households were owner-occupiers. This high proportion was second only to that of Central and Western.
95.6% of the poor households did not receive CSSA. Among them, 76.8% were households with no financial needs.
The poverty rate of Wan Chai was 12.7%, lower than the overall figure of 14.7%.
Major poverty figures Selected statistical references of the poor
Poor households ('000) 10.3 Average household size/employed members 1.9 / 0.2
Poor population ('000) 19.9 Median monthly household income ($) 1,600
Poverty rate (%) 12.7 Median age 64
Total poverty gap (per annum, $Mn) 668.3 LFPR (%) 16.1
Average poverty gap (per month, $) 5,400 Unemployment rate (%) 19.5
Ranking in 18 districts by poverty rate
(in descending order) 14 / 18 Demographic/Economic dependency ratio 1 351 / 5 581
Poor households – size Poor households - housing characteristic
Poor population - economic activity status Economically active poor population - employment status
Note: (§) Not released due to large sampling errors.
Source: General Household Survey, Census and Statistics Department.
84.8%
10.2%
3.6%4.4%
57.5%
Economically
inactive
population
Tenant
households in
private
housing
Households in
PRH
Households
receiving
CSSA
Child and
elderly
population
Poor
Non-poor
1-person
36.9%
2-person
41.7%
3-person12.6%
4-person8.5%
§
5-person+
PRH
3.6%
Private
tenants
10.2%
Owner-occupiers
77.3%
Others
8.9%
6.6%
Aged
below 18
9.3%
Students
2.4%
Aged 65 and
above
46.6%
Others
19.9%12.2%
3.0%
Labour force
15.2%
Economically inactive
84.8%Homemakers
Unemployed
Employed
Full-time48.3%
Part-time
27.0%
§
19.5%
Employed
80.5%
Underemployed
Unemployed
Hong Kong Poverty Situation Report 2016
Chapter 3: Further Analysis of the 2016 Poverty Situation
P. 108
(iii) Eastern
Despite a lower proportion of elders compared
with Central and Western and Wan Chai on
Hong Kong Island, the median age of the poor population in Eastern district still reached 59.
Only about a quarter (25.3%) of the poor
households in Eastern district lived in PRH,
while about six-tenths (62.1%) were owner-occupiers.
The proportion of the poor households receiving
CSSA was quite low (7.1%). Among the non-
CSSA poor households, 74.5% had no financial needs.
The poverty rate of Eastern district was the
second lowest among the 18 districts, only higher than that of Southern district.
Major poverty figures Selected statistical references of the poor
Poor households ('000) 25.3 Average household size/employed members 2.3 / 0.3
Poor population ('000) 57.6 Median monthly household income ($) 4,300
Poverty rate (%) 11.3 Median age 59
Total poverty gap (per annum, $Mn) 1,438.0 LFPR (%) 20.7
Average poverty gap (per month, $) 4,700 Unemployment rate (%) 21.1
Ranking in 18 districts by poverty rate
(in descending order) 17 / 18 Demographic/Economic dependency ratio 1 096 / 4 355
Poor households - size Poor households - housing characteristic
Poor population - economic activity status Economically active poor population - employment status
Source: General Household Survey, Census and Statistics Department.
81.3%
6.0%
25.3%7.1%
52.3%
Economically
inactive
population
Tenant
households in
private
housing
Households in
PRH
Households
receiving
CSSA
Child and
elderly
population
Poor
Non-poor
1-person27.0%
2-person
38.1%
3-person20.0%
4-person
11.3%
5-person
2.3%
1.3%
6-person+ PRH
25.3%
Private
tenants
6.0%
Owner-
occupiers
62.1%
Others
6.6%
10.3%
Aged
below 18
12.5%
Students
3.6%Aged 65
and
above38.9%
Others
16.0%14.7%
3.9%
Labour force
18.7%
Economically inactive
81.3%Homemakers
Unemployed
Employed
Full-time
54.7%
Part-time
20.9%
3.2%
21.1%
Employed
78.8%
Underemployed
Unemployed
Hong Kong Poverty Situation Report 2016
Chapter 3: Further Analysis of the 2016 Poverty Situation
P. 109
(iv) Southern
When compared with other districts on Hong Kong Island, the poor population in Southern district was slightly younger, though the median age still reached 57. The proportion of working households (35.1%) was also relatively high.
Among the four districts on Hong Kong Island, Southern district had the highest proportion of poor households residing in PRH (35.8%) and the lowest in owner-occupied housing (53.7%).
More than nine-tenths of the poor households did not receive CSSA, of which about three quarters (75.3%) had no financial needs.
The poverty rate of Southern district (11.1%) was the lowest among the 18 districts.
Major poverty figures Selected statistical references of the poor
Poor households ('000) 11.6 Average household size/employed members 2.3 / 0.4
Poor population ('000) 26.7 Median monthly household income ($) 5,700
Poverty rate (%) 11.1 Median age 57
Total poverty gap (per annum, $Mn) 568.0 LFPR (%) 24.7
Average poverty gap (per month, $) 4,100 Unemployment rate (%) 16.3
Ranking in 18 districts by poverty rate
(in descending order) 18 / 18 Demographic/Economic dependency ratio 1 107 / 3 668
Poor households - size Poor households - housing characteristic
Poor population - economic activity status Economically active poor population - employment status
Note: (§) Not released due to large sampling errors.
Source: General Household Survey, Census and Statistics Department.
78.6%
7.1%
35.8%
9.2%
52.5%
Economically
inactive
population
Tenant
households in
private
housing
Households in
PRH
Households
receiving
CSSA
Child and
elderly
population
Poor
Non-poor
1-person
26.1%
2-person
36.8%
3-person
21.2%
4-person
13.5%
2.5%
5-person+
PRH
35.8%
Private
tenants
7.1%
Owner-
occupiers
53.7%
Others
3.3%
10.9%
Aged
below 18
16.4%
Students2.6%
Aged 65
and
above34.9%
Others
13.8%17.9%
3.5%
Labour force
21.4%
Economically inactive
78.6%
Homemakers
Unemployed
Employed
Full-time
58.5%
Part-time
20.9%
§
16.3%
Employed
83.7%
Underemployed
Unemployed
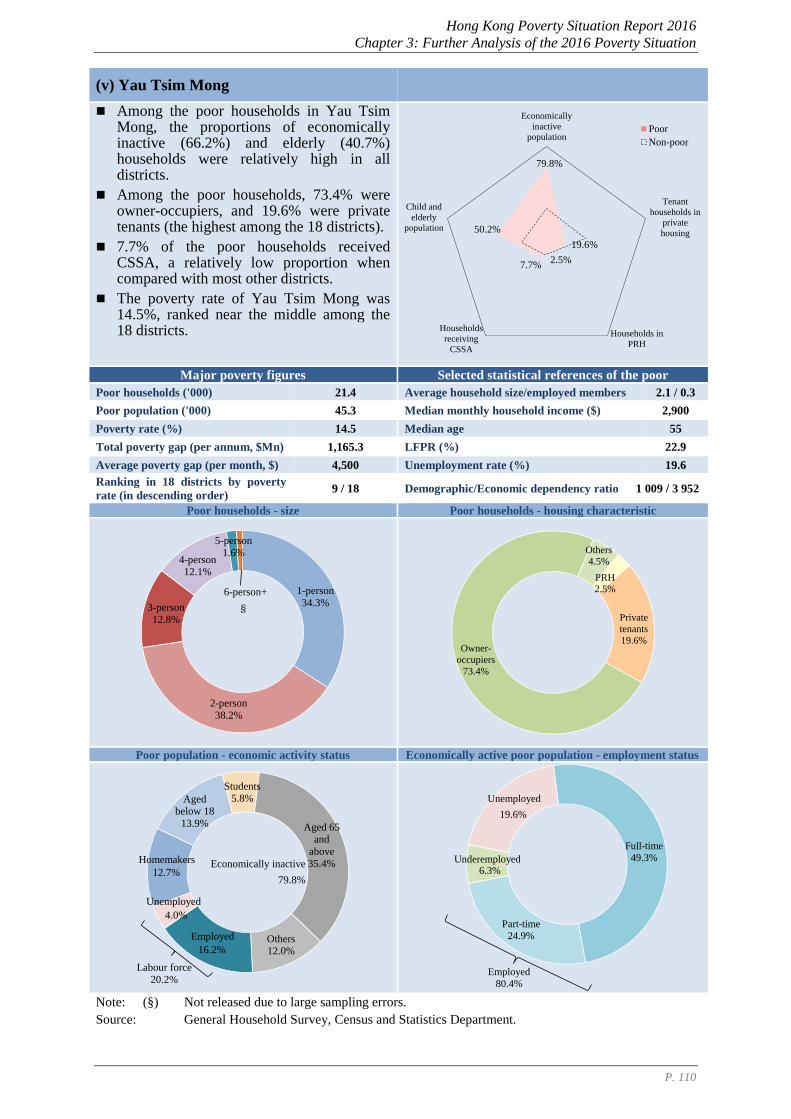
Hong Kong Poverty Situation Report 2016
Chapter 3: Further Analysis of the 2016 Poverty Situation
P. 110
(v) Yau Tsim Mong
Among the poor households in Yau Tsim Mong, the proportions of economically inactive (66.2%) and elderly (40.7%) households were relatively high in all districts.
Among the poor households, 73.4% were owner-occupiers, and 19.6% were private tenants (the highest among the 18 districts).
7.7% of the poor households received CSSA, a relatively low proportion when compared with most other districts.
The poverty rate of Yau Tsim Mong was 14.5%, ranked near the middle among the 18 districts.
Major poverty figures Selected statistical references of the poor
Poor households ('000) 21.4 Average household size/employed members 2.1 / 0.3
Poor population ('000) 45.3 Median monthly household income ($) 2,900
Poverty rate (%) 14.5 Median age 55
Total poverty gap (per annum, $Mn) 1,165.3 LFPR (%) 22.9
Average poverty gap (per month, $) 4,500 Unemployment rate (%) 19.6
Ranking in 18 districts by poverty
rate (in descending order) 9 / 18 Demographic/Economic dependency ratio 1 009 / 3 952
Poor households - size Poor households - housing characteristic
Poor population - economic activity status Economically active poor population - employment status
Note: (§) Not released due to large sampling errors.
Source: General Household Survey, Census and Statistics Department.
79.8%
19.6%
2.5%7.7%
50.2%
Economically
inactive
population
Tenant
households in
private
housing
Households in
PRH
Households
receiving
CSSA
Child and
elderly
population
Poor
Non-poor
1-person
34.3%
2-person
38.2%
3-person
12.8%
4-person
12.1%
5-person1.6%
§
6-person+
PRH2.5%
Private tenants
19.6%Owner-
occupiers
73.4%
Others
4.5%
12.7%
Aged
below 18
13.9%
Students
5.8%
Aged 65
and
above
35.4%
Others
12.0%16.2%
4.0%
Labour force20.2%
Economically inactive
79.8%
Homemakers
Unemployed
Employed
Full-time
49.3%
Part-time
24.9%
6.3%
19.6%
Employed
80.4%
Underemployed
Unemployed
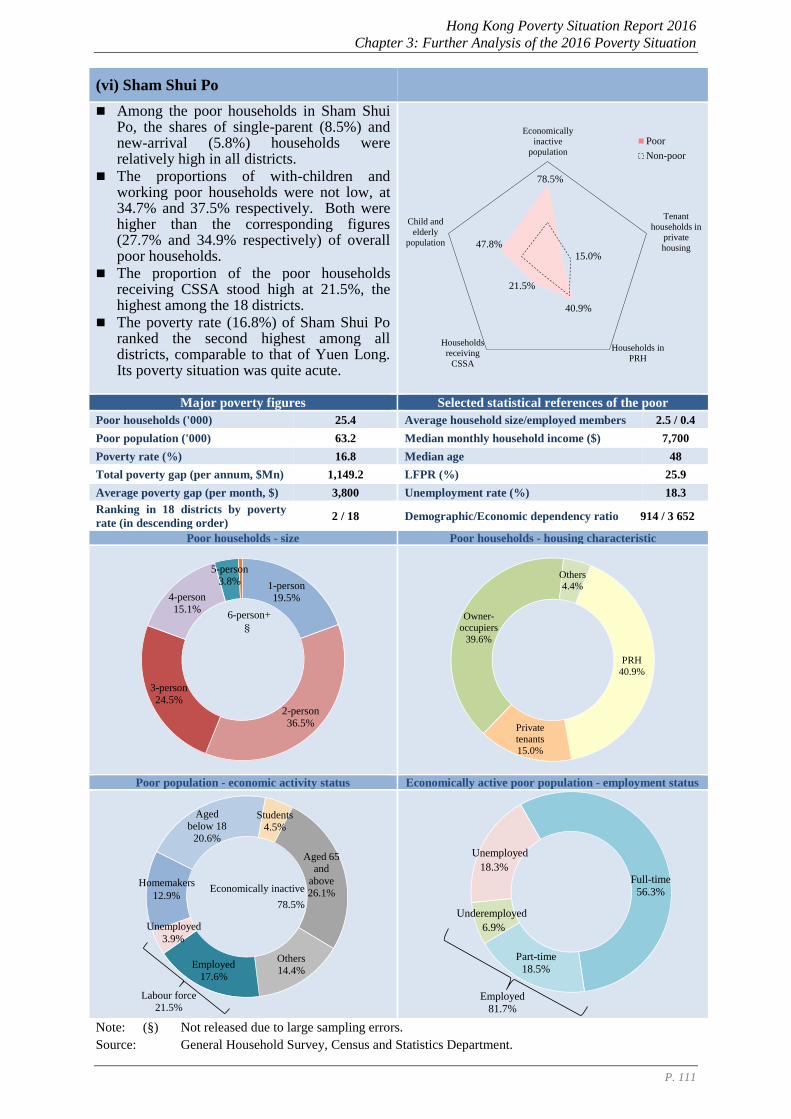
Hong Kong Poverty Situation Report 2016
Chapter 3: Further Analysis of the 2016 Poverty Situation
P. 111
(vi) Sham Shui Po
Among the poor households in Sham Shui Po, the shares of single-parent (8.5%) and new-arrival (5.8%) households were relatively high in all districts.
The proportions of with-children and working poor households were not low, at 34.7% and 37.5% respectively. Both were higher than the corresponding figures (27.7% and 34.9% respectively) of overall poor households.
The proportion of the poor households receiving CSSA stood high at 21.5%, the highest among the 18 districts.
The poverty rate (16.8%) of Sham Shui Po ranked the second highest among all districts, comparable to that of Yuen Long. Its poverty situation was quite acute.
Major poverty figures Selected statistical references of the poor
Poor households ('000) 25.4 Average household size/employed members 2.5 / 0.4
Poor population ('000) 63.2 Median monthly household income ($) 7,700
Poverty rate (%) 16.8 Median age 48
Total poverty gap (per annum, $Mn) 1,149.2 LFPR (%) 25.9
Average poverty gap (per month, $) 3,800 Unemployment rate (%) 18.3
Ranking in 18 districts by poverty
rate (in descending order) 2 / 18 Demographic/Economic dependency ratio 914 / 3 652
Poor households - size Poor households - housing characteristic
Poor population - economic activity status Economically active poor population - employment status
Note: (§) Not released due to large sampling errors.
Source: General Household Survey, Census and Statistics Department.
78.5%
15.0%
40.9%
21.5%
47.8%
Economically
inactive
population
Tenant
households in
private
housing
Households in
PRH
Households
receiving
CSSA
Child and
elderly
population
Poor
Non-poor
1-person
19.5%
2-person
36.5%
3-person
24.5%
4-person
15.1%
5-person
3.8%
§6-person+
PRH
40.9%
Private
tenants
15.0%
Owner-
occupiers
39.6%
Others
4.4%
12.9%
Aged below 18
20.6%
Students
4.5%
Aged 65
and
above26.1%
Others
14.4%17.6%
3.9%
Labour force
21.5%
Economically inactive
78.5%
Homemakers
Unemployed
Employed
Full-time
56.3%
Part-time
18.5%
6.9%
18.3%
Employed
81.7%
Unemployed
Underemployed
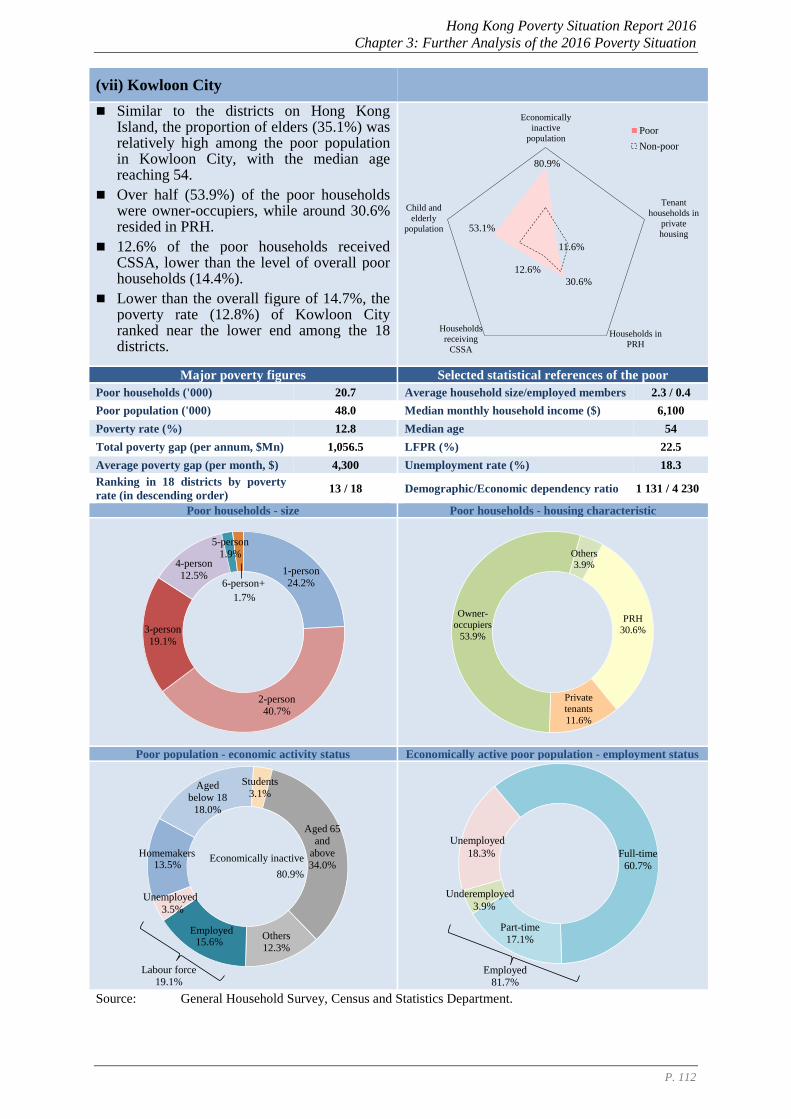
Hong Kong Poverty Situation Report 2016
Chapter 3: Further Analysis of the 2016 Poverty Situation
P. 112
(vii) Kowloon City
Similar to the districts on Hong Kong Island, the proportion of elders (35.1%) was relatively high among the poor population in Kowloon City, with the median age reaching 54.
Over half (53.9%) of the poor households were owner-occupiers, while around 30.6% resided in PRH.
12.6% of the poor households received CSSA, lower than the level of overall poor households (14.4%).
Lower than the overall figure of 14.7%, the poverty rate (12.8%) of Kowloon City ranked near the lower end among the 18 districts.
Major poverty figures Selected statistical references of the poor
Poor households ('000) 20.7 Average household size/employed members 2.3 / 0.4
Poor population ('000) 48.0 Median monthly household income ($) 6,100
Poverty rate (%) 12.8 Median age 54
Total poverty gap (per annum, $Mn) 1,056.5 LFPR (%) 22.5
Average poverty gap (per month, $) 4,300 Unemployment rate (%) 18.3
Ranking in 18 districts by poverty
rate (in descending order) 13 / 18 Demographic/Economic dependency ratio 1 131 / 4 230
Poor households - size Poor households - housing characteristic
Poor population - economic activity status Economically active poor population - employment status
Source: General Household Survey, Census and Statistics Department.
80.9%
11.6%
30.6%
12.6%
53.1%
Economically
inactive
population
Tenant
households in
private
housing
Households in
PRH
Households
receiving
CSSA
Child and
elderly
population
Poor
Non-poor
1-person
24.2%
2-person
40.7%
3-person19.1%
4-person
12.5%
5-person
1.9%
1.7%
6-person+
PRH
30.6%
Private
tenants
11.6%
Owner-
occupiers
53.9%
Others
3.9%
13.5%
Aged
below 18
18.0%
Students
3.1%
Aged 65
and
above
34.0%
Others12.3%
15.6%
3.5%
Labour force19.1%
Economically inactive
80.9%
Homemakers
Unemployed
Employed
Full-time
60.7%
Part-time
17.1%
3.9%
18.3%
Employed81.7%
Unemployed
Underemployed
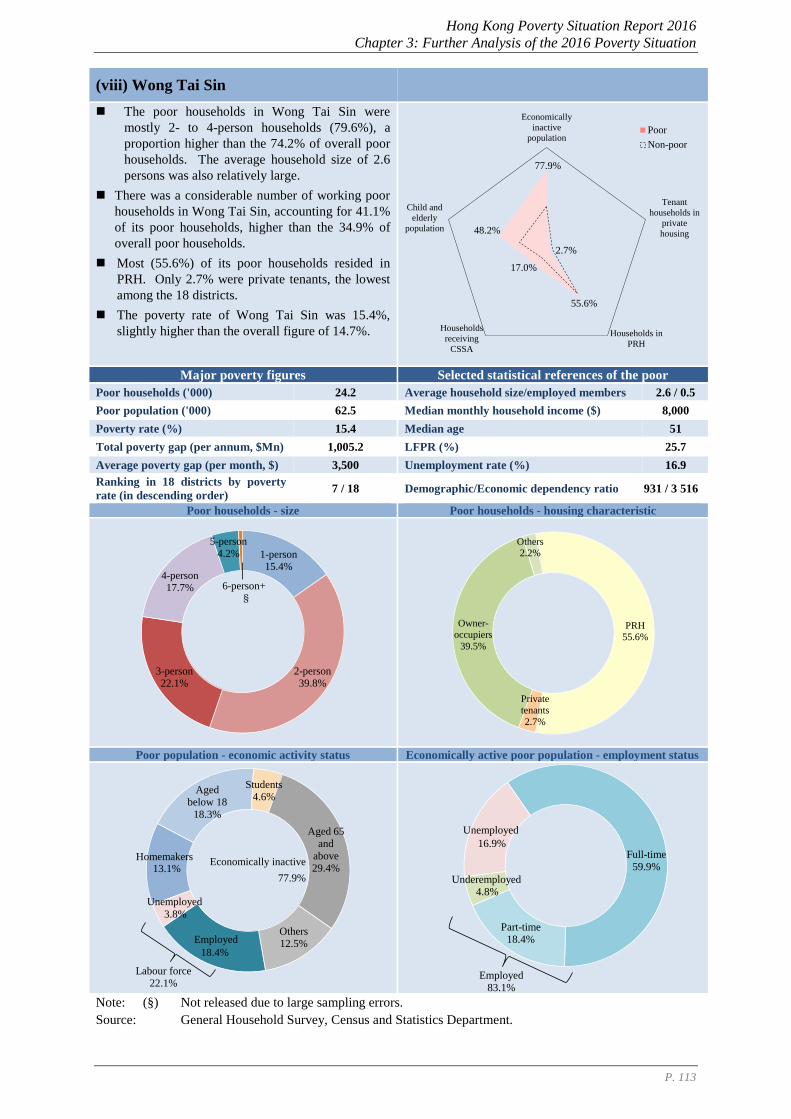
Hong Kong Poverty Situation Report 2016
Chapter 3: Further Analysis of the 2016 Poverty Situation
P. 113
(viii) Wong Tai Sin
The poor households in Wong Tai Sin were
mostly 2- to 4-person households (79.6%), a
proportion higher than the 74.2% of overall poor
households. The average household size of 2.6
persons was also relatively large.
There was a considerable number of working poor
households in Wong Tai Sin, accounting for 41.1%
of its poor households, higher than the 34.9% of
overall poor households.
Most (55.6%) of its poor households resided in
PRH. Only 2.7% were private tenants, the lowest
among the 18 districts.
The poverty rate of Wong Tai Sin was 15.4%,
slightly higher than the overall figure of 14.7%.
Major poverty figures Selected statistical references of the poor
Poor households ('000) 24.2 Average household size/employed members 2.6 / 0.5
Poor population ('000) 62.5 Median monthly household income ($) 8,000
Poverty rate (%) 15.4 Median age 51
Total poverty gap (per annum, $Mn) 1,005.2 LFPR (%) 25.7
Average poverty gap (per month, $) 3,500 Unemployment rate (%) 16.9
Ranking in 18 districts by poverty
rate (in descending order) 7 / 18 Demographic/Economic dependency ratio 931 / 3 516
Poor households - size Poor households - housing characteristic
Poor population - economic activity status Economically active poor population - employment status
Note: (§) Not released due to large sampling errors.
Source: General Household Survey, Census and Statistics Department.
77.9%
2.7%
55.6%
17.0%
48.2%
Economically
inactive
population
Tenant
households in
private
housing
Households in
PRH
Households
receiving
CSSA
Child and
elderly
population
Poor
Non-poor
1-person15.4%
2-person
39.8%3-person
22.1%
4-person
17.7%
5-person4.2%
§6-person+
PRH
55.6%
Private
tenants
2.7%
Owner-
occupiers
39.5%
Others
2.2%
13.1%
Aged
below 18
18.3%
Students
4.6%
Aged 65 and
above
29.4%
Others
12.5%18.4%
3.8%
Labour force
22.1%
Economically inactive
77.9%
Homemakers
Unemployed
Employed
Full-time
59.9%
Part-time
18.4%
4.8%
16.9%
Employed
83.1%
Underemployed
Unemployed
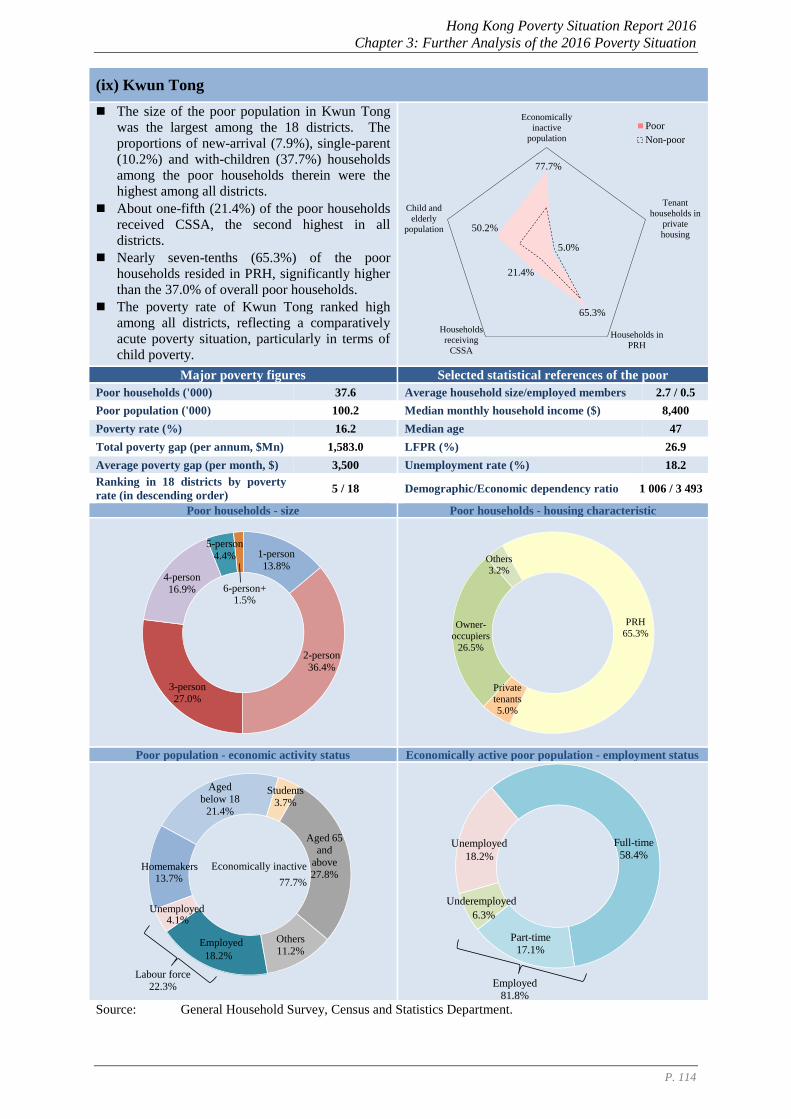
Hong Kong Poverty Situation Report 2016
Chapter 3: Further Analysis of the 2016 Poverty Situation
P. 114
(ix) Kwun Tong
The size of the poor population in Kwun Tong
was the largest among the 18 districts. The
proportions of new-arrival (7.9%), single-parent
(10.2%) and with-children (37.7%) households
among the poor households therein were the
highest among all districts.
About one-fifth (21.4%) of the poor households
received CSSA, the second highest in all
districts.
Nearly seven-tenths (65.3%) of the poor
households resided in PRH, significantly higher
than the 37.0% of overall poor households.
The poverty rate of Kwun Tong ranked high
among all districts, reflecting a comparatively
acute poverty situation, particularly in terms of
child poverty.
Major poverty figures Selected statistical references of the poor
Poor households ('000) 37.6 Average household size/employed members 2.7 / 0.5
Poor population ('000) 100.2 Median monthly household income ($) 8,400
Poverty rate (%) 16.2 Median age 47
Total poverty gap (per annum, $Mn) 1,583.0 LFPR (%) 26.9
Average poverty gap (per month, $) 3,500 Unemployment rate (%) 18.2
Ranking in 18 districts by poverty
rate (in descending order) 5 / 18 Demographic/Economic dependency ratio 1 006 / 3 493
Poor households - size Poor households - housing characteristic
Poor population - economic activity status Economically active poor population - employment status
Source: General Household Survey, Census and Statistics Department.
77.7%
5.0%
65.3%
21.4%
50.2%
Economically
inactive
population
Tenant
households in
private
housing
Households in
PRH
Households
receiving
CSSA
Child and
elderly
population
Poor
Non-poor
1-person
13.8%
2-person
36.4%
3-person
27.0%
4-person
16.9%
5-person4.4%
1.5%6-person+
PRH
65.3%
Private
tenants
5.0%
Owner-
occupiers
26.5%
Others
3.2%
13.7%
Aged
below 18
21.4%
Students
3.7%
Aged 65
and
above
27.8%
Others
11.2%18.2%
4.1%
Labour force
22.3%
Economically inactive
77.7%
Homemakers
Unemployed
Employed
Full-time
58.4%
Part-time
17.1%
6.3%
18.2%
Employed
81.8%
Underemployed
Unemployed
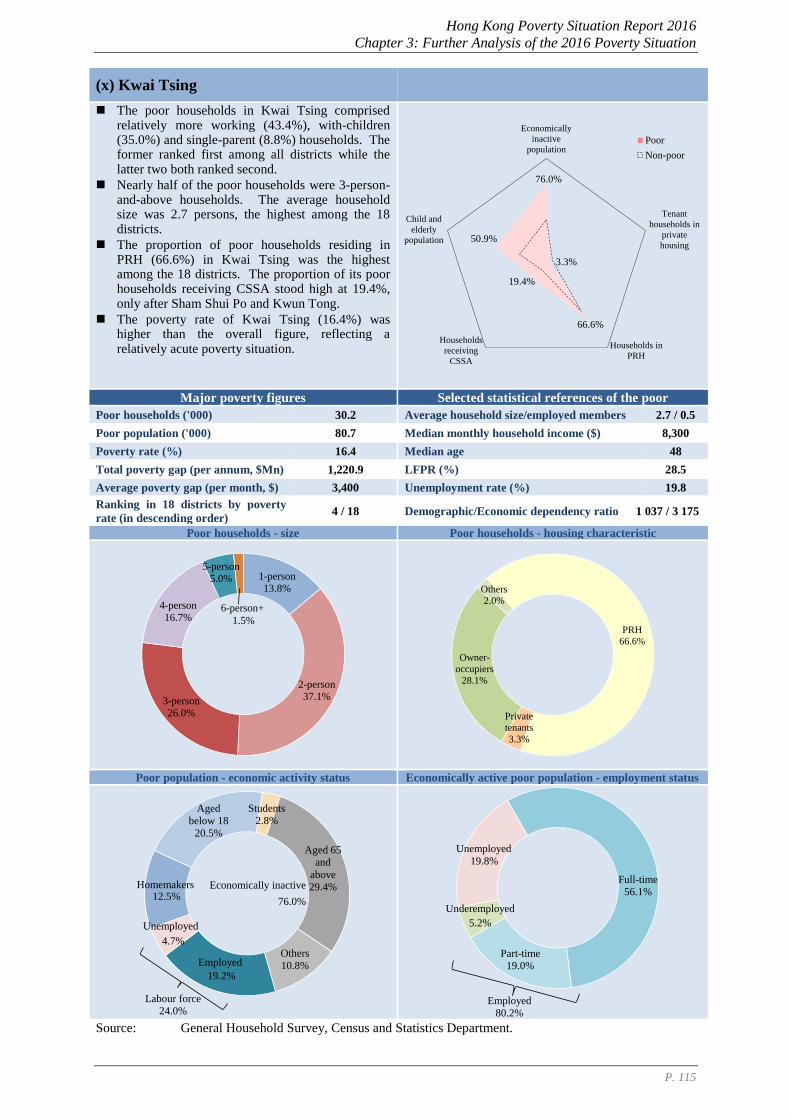
Hong Kong Poverty Situation Report 2016
Chapter 3: Further Analysis of the 2016 Poverty Situation
P. 115
(x) Kwai Tsing
The poor households in Kwai Tsing comprised relatively more working (43.4%), with-children (35.0%) and single-parent (8.8%) households. The former ranked first among all districts while the latter two both ranked second.
Nearly half of the poor households were 3-person-and-above households. The average household size was 2.7 persons, the highest among the 18 districts.
The proportion of poor households residing in PRH (66.6%) in Kwai Tsing was the highest among the 18 districts. The proportion of its poor households receiving CSSA stood high at 19.4%, only after Sham Shui Po and Kwun Tong.
The poverty rate of Kwai Tsing (16.4%) was higher than the overall figure, reflecting a relatively acute poverty situation.
Major poverty figures Selected statistical references of the poor
Poor households ('000) 30.2 Average household size/employed members 2.7 / 0.5
Poor population ('000) 80.7 Median monthly household income ($) 8,300
Poverty rate (%) 16.4 Median age 48
Total poverty gap (per annum, $Mn) 1,220.9 LFPR (%) 28.5
Average poverty gap (per month, $) 3,400 Unemployment rate (%) 19.8
Ranking in 18 districts by poverty
rate (in descending order) 4 / 18 Demographic/Economic dependency ratio 1 037 / 3 175
Poor households - size Poor households - housing characteristic
Poor population - economic activity status Economically active poor population - employment status
Source: General Household Survey, Census and Statistics Department.
76.0%
3.3%
66.6%
19.4%
50.9%
Economically
inactive
population
Tenant
households in
private
housing
Households in
PRH
Households
receiving
CSSA
Child and
elderly
population
Poor
Non-poor
1-person
13.8%
2-person
37.1%3-person
26.0%
4-person
16.7%
5-person
5.0%
1.5%
6-person+
PRH
66.6%
Private
tenants
3.3%
Owner-occupiers
28.1%
Others
2.0%
12.5%
Aged
below 18
20.5%
Students
2.8%
Aged 65
and
above29.4%
Others10.8%
19.2%
4.7%
Labour force
24.0%
Economically inactive
76.0%
Homemakers
Unemployed
Employed
Full-time
56.1%
Part-time
19.0%
5.2%
19.8%
Employed
80.2%
Underemployed
Unemployed

Hong Kong Poverty Situation Report 2016
Chapter 3: Further Analysis of the 2016 Poverty Situation
P. 116
(xi) Tsuen Wan
The proportion of elders (34.7%) among the
poor in Tsuen Wan was higher than those in
most other districts in the New Territories. The
share of economically inactive persons was
80.8%, also higher than those in other districts in
the New Territories (except Islands district).
Among the poor households, the share of private
tenants (10.2%) was relatively high, while that
of PRH households (28.6%) was lower than the
37.0% of overall poor households.
10.1% of the poor households received CSSA,
lower than the level of overall poor households.
With a poverty rate of 13.5%, the poverty
situation of Tsuen Wan stayed near the lower
end among the 18 districts.
Major poverty figures Selected statistical references of the poor
Poor households ('000) 16.9 Average household size/employed members 2.4 / 0.4
Poor population ('000) 40.2 Median monthly household income ($) 5,800
Poverty rate (%) 13.5 Median age 55
Total poverty gap (per annum, $Mn) 898.1 LFPR (%) 21.8
Average poverty gap (per month, $) 4,400 Unemployment rate (%) 22.4
Ranking in 18 districts by poverty
rate (in descending order) 12 / 18 Demographic/Economic dependency ratio 990 / 4 204
Poor households – size Poor households - housing characteristic
Poor population - economic activity status Economically active poor population - employment status
Note: (§) Not released due to large sampling errors.
Source: General Household Survey, Census and Statistics Department.
80.8%
10.2%
28.6%
10.1%
49.8%
Economically
inactive
population
Tenant
households in
private
housing
Households in
PRH
Households
receiving
CSSA
Child and
elderly
population
Poor
Non-poor
1-person
19.7%
2-person
43.5%
3-person
20.1%
4-person
13.8%
5-person
1.7%
§6-person+
PRH
28.6%
Private
tenants
10.2%
Owner-
occupiers
55.3%
Others
5.9%
11.3%
Aged
below 18
15.1%
Students
5.1%
Aged 65
and
above
33.9%
Others
15.4%14.9%
4.3%
Labour force
19.2%
Economically inactive
80.8%
Homemakers
Unemployed
Employed
Full-time
58.1%
Part-time
15.9%
3.6%
22.4%
Employed
77.6%
Underemployed
Unemployed

Hong Kong Poverty Situation Report 2016
Chapter 3: Further Analysis of the 2016 Poverty Situation
P. 117
(xii) Tuen Mun
Poor households in Tuen Mun comprised relatively more economically inactive households (61.1%), followed by working households (33.9%). These proportions were similar to the corresponding figures of overall poor households (60.5% and 34.9% respectively).
The proportion of households receiving CSSA was 17.2%, higher than the 14.4% of overall poor households.
43.0% of the poor households resided in PRH, which was a relatively high proportion.
With a poverty rate of 15.3%, the poverty situation of Tuen Mun was near the middle among the 18 districts.
Major poverty figures Selected statistical references of the poor
Poor households ('000) 30.1 Average household size/employed members 2.3 / 0.4
Poor population ('000) 70.3 Median monthly household income ($) 6,600
Poverty rate (%) 15.3 Median age 54
Total poverty gap (per annum, $Mn) 1,347.6 LFPR (%) 23.4
Average poverty gap (per month, $) 3,700 Unemployment rate (%) 19.7
Ranking in 18 districts by poverty
rate (in descending order) 8 / 18 Demographic/Economic dependency ratio 960 / 3 937
Poor households - size Poor households - housing characteristic
Poor population - economic activity status Economically active poor population - employment status
Source: General Household Survey, Census and Statistics Department.
79.7%
5.5%
43.0%
17.2%
49.0%
Economically
inactive
population
Tenant
households in
private
housing
Households in
PRH
Households
receiving
CSSA
Child and
elderly
population
Poor
Non-poor
1-person21.3%
2-person42.0%
3-person
22.4%
4-person
11.7%
5-person
1.7%
1.0%
6-person+
PRH
43.0%
Private
tenants
5.5%
Owner-
occupiers
46.9%
Others
4.6%
13.8%
Aged
below 18
16.2%
Students3.7%
Aged 65
and
above
32.0%
Others
14.0%16.3%
4.0%
Labour force
20.3%
Economically inactive
79.7%
Homemakers
Unemployed
Employed
Full-time53.9%
Part-time21.5%
4.9%
19.7%
Employed
80.3%
Underemployed
Unemployed

Hong Kong Poverty Situation Report 2016
Chapter 3: Further Analysis of the 2016 Poverty Situation
P. 118
(xiii) Yuen Long
Poor households in Yuen Long comprised relatively more single-parent (7.7%), with-children (31.7%) and new-arrival (5.4%) households.
The number of poor households in Yuen Long was the highest among the 18 districts, while the size of its poor population was the second highest, just after Kwun Tong.
17.2% of the poor households received CSSA, higher than the 14.4% of overall poor households.
The poverty rate (16.8%) of Yuen Long was the second highest among the 18 districts, reflecting a rather acute poverty situation.
Major poverty figures Selected statistical references of the poor
Poor households ('000) 39.8 Average household size/employed members 2.5 / 0.4
Poor population ('000) 97.8 Median monthly household income ($) 7,100
Poverty rate (%) 16.8 Median age 50
Total poverty gap (per annum, $Mn) 1,881.0 LFPR (%) 23.7
Average poverty gap (per month, $) 3,900 Unemployment rate (%) 18.1
Ranking in 18 districts by poverty
rate (in descending order) 2 / 18 Demographic/Economic dependency ratio 1 077 / 4 035
Poor households - size Poor households - housing characteristic
Poor population - economic activity status Economically active poor population - employment status
Source: General Household Survey, Census and Statistics Department.
80.1%
9.0%
35.8%
17.2%
51.8%
Economically
inactive
population
Tenant
households in
private
housing
Households in
PRH
Households
receiving
CSSA
Child and
elderly
population
Poor
Non-poor
1-person
22.7%
2-person
35.0%
3-person
23.1%
4-person
14.1%
5-person3.2%
1.8%6-person+
PRH
35.8%
Private
tenants
9.0%
Owner-
occupiers
50.3%
Others
5.0%
13.7%
Aged below 18
19.8%
Students
3.6%
Aged 65
and
above31.0%
Others
12.0%16.3%
3.6%
Labour force
19.9%
Economically inactive
80.1%
Homemakers
Unemployed
Employed
Full-time
58.1%
Part-time
18.7%
5.1%
18.1%
Employed
81.9%
Underemployed
Unemployed
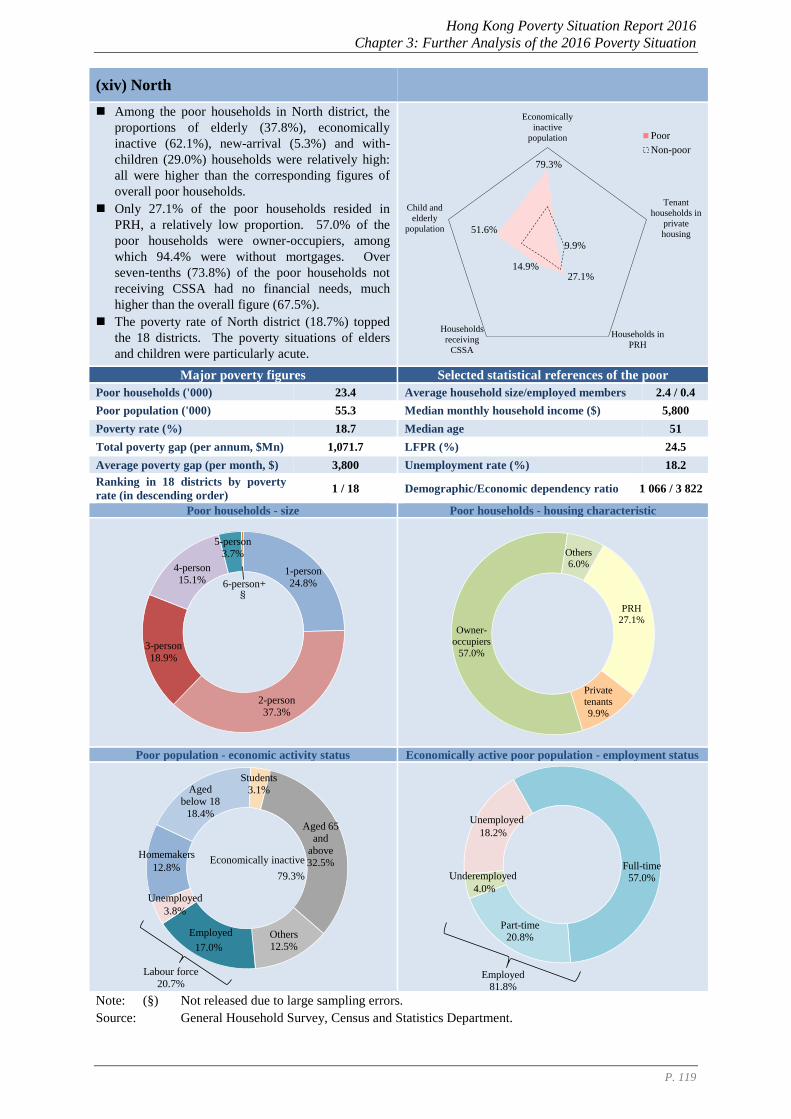
Hong Kong Poverty Situation Report 2016
Chapter 3: Further Analysis of the 2016 Poverty Situation
P. 119
(xiv) North
Among the poor households in North district, the
proportions of elderly (37.8%), economically
inactive (62.1%), new-arrival (5.3%) and with-
children (29.0%) households were relatively high:
all were higher than the corresponding figures of
overall poor households.
Only 27.1% of the poor households resided in
PRH, a relatively low proportion. 57.0% of the
poor households were owner-occupiers, among
which 94.4% were without mortgages. Over
seven-tenths (73.8%) of the poor households not
receiving CSSA had no financial needs, much
higher than the overall figure (67.5%).
The poverty rate of North district (18.7%) topped
the 18 districts. The poverty situations of elders
and children were particularly acute.
Major poverty figures Selected statistical references of the poor
Poor households ('000) 23.4 Average household size/employed members 2.4 / 0.4
Poor population ('000) 55.3 Median monthly household income ($) 5,800
Poverty rate (%) 18.7 Median age 51
Total poverty gap (per annum, $Mn) 1,071.7 LFPR (%) 24.5
Average poverty gap (per month, $) 3,800 Unemployment rate (%) 18.2
Ranking in 18 districts by poverty
rate (in descending order) 1 / 18 Demographic/Economic dependency ratio 1 066 / 3 822
Poor households - size Poor households - housing characteristic
Poor population - economic activity status Economically active poor population - employment status
Note: (§) Not released due to large sampling errors.
Source: General Household Survey, Census and Statistics Department.
79.3%
9.9%
27.1%14.9%
51.6%
Economically
inactive
population
Tenant
households in
private
housing
Households in
PRH
Households
receiving
CSSA
Child and
elderly
population
Poor
Non-poor
1-person
24.8%
2-person37.3%
3-person
18.9%
4-person
15.1%
5-person
3.7%
§6-person+
PRH
27.1%
Private
tenants
9.9%
Owner-
occupiers
57.0%
Others
6.0%
12.8%
Aged
below 18
18.4%
Students
3.1%
Aged 65 and
above
32.5%
Others
12.5%17.0%
3.8%
Labour force
20.7%
Economically inactive
79.3%
Homemakers
Unemployed
Employed
Full-time57.0%
Part-time
20.8%
4.0%
18.2%
Employed
81.8%
Underemployed
Unemployed
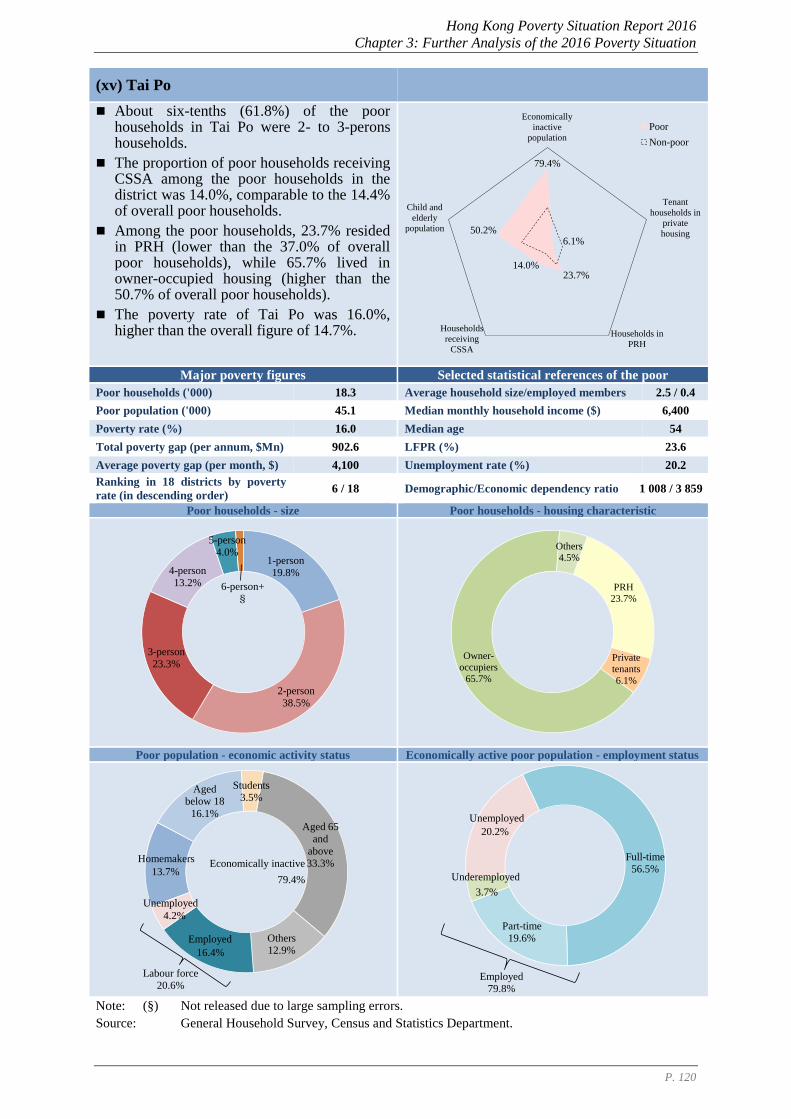
Hong Kong Poverty Situation Report 2016
Chapter 3: Further Analysis of the 2016 Poverty Situation
P. 120
(xv) Tai Po
About six-tenths (61.8%) of the poor households in Tai Po were 2- to 3-perons households.
The proportion of poor households receiving CSSA among the poor households in the district was 14.0%, comparable to the 14.4% of overall poor households.
Among the poor households, 23.7% resided in PRH (lower than the 37.0% of overall poor households), while 65.7% lived in owner-occupied housing (higher than the 50.7% of overall poor households).
The poverty rate of Tai Po was 16.0%, higher than the overall figure of 14.7%.
Major poverty figures Selected statistical references of the poor
Poor households ('000) 18.3 Average household size/employed members 2.5 / 0.4
Poor population ('000) 45.1 Median monthly household income ($) 6,400
Poverty rate (%) 16.0 Median age 54
Total poverty gap (per annum, $Mn) 902.6 LFPR (%) 23.6
Average poverty gap (per month, $) 4,100 Unemployment rate (%) 20.2
Ranking in 18 districts by poverty
rate (in descending order) 6 / 18 Demographic/Economic dependency ratio 1 008 / 3 859
Poor households - size Poor households - housing characteristic
Poor population - economic activity status Economically active poor population - employment status
Note: (§) Not released due to large sampling errors.
Source: General Household Survey, Census and Statistics Department.
79.4%
6.1%
23.7%14.0%
50.2%
Economically
inactive
population
Tenant
households in
private
housing
Households in
PRH
Households
receiving
CSSA
Child and
elderly
population
Poor
Non-poor
1-person
19.8%
2-person38.5%
3-person
23.3%
4-person
13.2%
5-person
4.0%
§6-person+ PRH
23.7%
Private
tenants
6.1%
Owner-
occupiers
65.7%
Others
4.5%
13.7%
Aged
below 18
16.1%
Students
3.5%
Aged 65
and
above
33.3%
Others
12.9%16.4%
4.2%
Labour force
20.6%
Economically inactive
79.4%
Homemakers
Unemployed
Employed
Full-time
56.5%
Part-time
19.6%
3.7%
20.2%
Employed79.8%
Underemployed
Unemployed
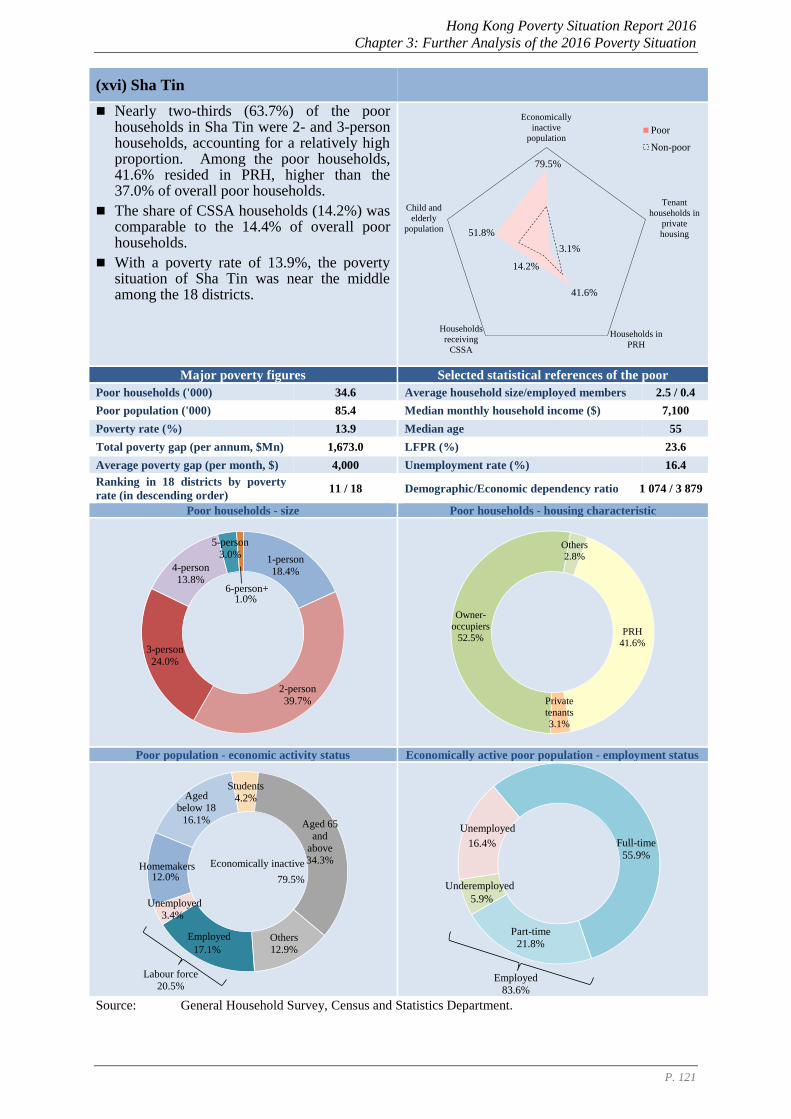
Hong Kong Poverty Situation Report 2016
Chapter 3: Further Analysis of the 2016 Poverty Situation
P. 121
(xvi) Sha Tin
Nearly two-thirds (63.7%) of the poor households in Sha Tin were 2- and 3-person households, accounting for a relatively high proportion. Among the poor households, 41.6% resided in PRH, higher than the 37.0% of overall poor households.
The share of CSSA households (14.2%) was comparable to the 14.4% of overall poor households.
With a poverty rate of 13.9%, the poverty situation of Sha Tin was near the middle among the 18 districts.
Major poverty figures Selected statistical references of the poor
Poor households ('000) 34.6 Average household size/employed members 2.5 / 0.4
Poor population ('000) 85.4 Median monthly household income ($) 7,100
Poverty rate (%) 13.9 Median age 55
Total poverty gap (per annum, $Mn) 1,673.0 LFPR (%) 23.6
Average poverty gap (per month, $) 4,000 Unemployment rate (%) 16.4
Ranking in 18 districts by poverty
rate (in descending order) 11 / 18 Demographic/Economic dependency ratio 1 074 / 3 879
Poor households - size Poor households - housing characteristic
Poor population - economic activity status Economically active poor population - employment status
Source: General Household Survey, Census and Statistics Department.
79.5%
3.1%
41.6%
14.2%
51.8%
Economically
inactive
population
Tenant
households in
private
housing
Households in
PRH
Households
receiving
CSSA
Child and
elderly
population
Poor
Non-poor
1-person
18.4%
2-person
39.7%
3-person
24.0%
4-person13.8%
5-person3.0%
1.0%6-person+
PRH
41.6%
Private
tenants
3.1%
Owner-
occupiers
52.5%
Others2.8%
12.0%
Aged
below 18
16.1%
Students
4.2%
Aged 65
and
above
34.3%
Others
12.9%17.1%
3.4%
Labour force
20.5%
Economically inactive
79.5%
Homemakers
Unemployed
Employed
Full-time
55.9%
Part-time
21.8%
5.9%
16.4%
Employed
83.6%
Underemployed
Unemployed
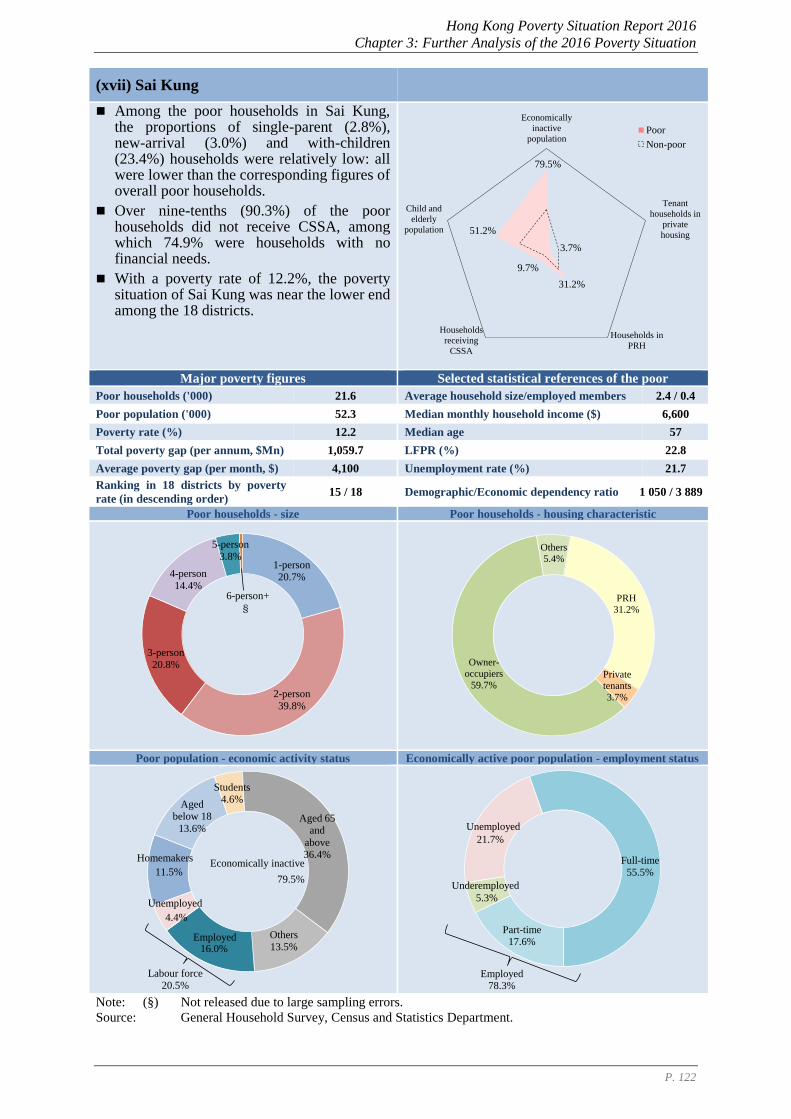
Hong Kong Poverty Situation Report 2016
Chapter 3: Further Analysis of the 2016 Poverty Situation
P. 122
(xvii) Sai Kung
Among the poor households in Sai Kung, the proportions of single-parent (2.8%), new-arrival (3.0%) and with-children (23.4%) households were relatively low: all were lower than the corresponding figures of overall poor households.
Over nine-tenths (90.3%) of the poor households did not receive CSSA, among which 74.9% were households with no financial needs.
With a poverty rate of 12.2%, the poverty situation of Sai Kung was near the lower end among the 18 districts.
Major poverty figures Selected statistical references of the poor
Poor households ('000) 21.6 Average household size/employed members 2.4 / 0.4
Poor population ('000) 52.3 Median monthly household income ($) 6,600
Poverty rate (%) 12.2 Median age 57
Total poverty gap (per annum, $Mn) 1,059.7 LFPR (%) 22.8
Average poverty gap (per month, $) 4,100 Unemployment rate (%) 21.7
Ranking in 18 districts by poverty
rate (in descending order) 15 / 18 Demographic/Economic dependency ratio 1 050 / 3 889
Poor households - size Poor households - housing characteristic
Poor population - economic activity status Economically active poor population - employment status
Note: (§) Not released due to large sampling errors.
Source: General Household Survey, Census and Statistics Department.
79.5%
3.7%
31.2%
9.7%
51.2%
Economically
inactive
population
Tenant
households in
private
housing
Households in
PRH
Households
receiving
CSSA
Child and
elderly
population
Poor
Non-poor
1-person
20.7%
2-person
39.8%
3-person
20.8%
4-person
14.4%
5-person
3.8%
§6-person+ PRH
31.2%
Private
tenants
3.7%
Owner-
occupiers
59.7%
Others5.4%
11.5%
Aged
below 18
13.6%
Students
4.6%
Aged 65 and
above
36.4%
Others
13.5%16.0%
4.4%
Labour force
20.5%
Economically inactive
79.5%
Homemakers
Unemployed
Employed
Full-time
55.5%
Part-time
17.6%
5.3%
21.7%
Employed
78.3%
Underemployed
Unemployed
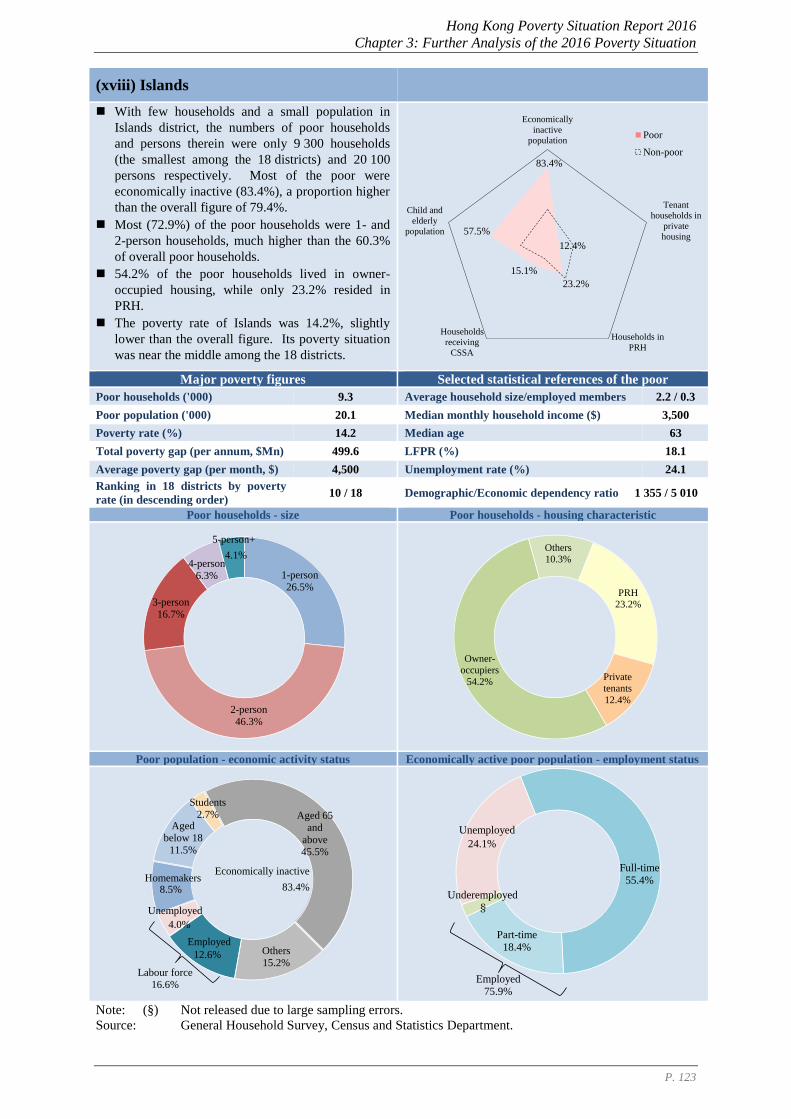
Hong Kong Poverty Situation Report 2016
Chapter 3: Further Analysis of the 2016 Poverty Situation
P. 123
(xviii) Islands
With few households and a small population in
Islands district, the numbers of poor households
and persons therein were only 9 300 households
(the smallest among the 18 districts) and 20 100
persons respectively. Most of the poor were
economically inactive (83.4%), a proportion higher
than the overall figure of 79.4%.
Most (72.9%) of the poor households were 1- and
2-person households, much higher than the 60.3%
of overall poor households.
54.2% of the poor households lived in owner-
occupied housing, while only 23.2% resided in
PRH.
The poverty rate of Islands was 14.2%, slightly
lower than the overall figure. Its poverty situation
was near the middle among the 18 districts.
Major poverty figures Selected statistical references of the poor
Poor households ('000) 9.3 Average household size/employed members 2.2 / 0.3
Poor population ('000) 20.1 Median monthly household income ($) 3,500
Poverty rate (%) 14.2 Median age 63
Total poverty gap (per annum, $Mn) 499.6 LFPR (%) 18.1
Average poverty gap (per month, $) 4,500 Unemployment rate (%) 24.1
Ranking in 18 districts by poverty
rate (in descending order) 10 / 18 Demographic/Economic dependency ratio 1 355 / 5 010
Poor households - size Poor households - housing characteristic
Poor population - economic activity status Economically active poor population - employment status
Note: (§) Not released due to large sampling errors.
Source: General Household Survey, Census and Statistics Department.
83.4%
12.4%
23.2%
15.1%
57.5%
Economically
inactive
population
Tenant
households in
private
housing
Households in
PRH
Households
receiving
CSSA
Child and
elderly
population
Poor
Non-poor
1-person
26.5%
2-person46.3%
3-person
16.7%
4-person
6.3%
4.1%
5-person+
PRH
23.2%
Private
tenants
12.4%
Owner-
occupiers
54.2%
Others
10.3%
8.5%
Aged
below 18
11.5%
Students
2.7% Aged 65
and
above45.5%
Others15.2%
12.6%
4.0%
Labour force
16.6%
Economically inactive
83.4%Homemakers
Unemployed
Employed
Full-time
55.4%
Part-time
18.4%
§
24.1%
Employed
75.9%
Underemployed
Unemployed
Hong Kong Poverty Situation Report 2016
Chapter 4: Policy Implications
P. 124
4 Policy Implications
4.1 The Government attaches great importance to poverty alleviation. Since its
establishment in late 2012, CoP has made relentless efforts in alleviating
poverty in Hong Kong. Setting an official poverty line and an analytical
framework that cater for the genuine situation in Hong Kong not only helps
quantify the poverty situation, but also helps guide policy directions and
quantitatively assess policy effectiveness. The groups that are most in need
are also identified, thereby providing an objective basis for the formulation
and enhancement of targeted initiatives to assist grassroots families and the
underprivileged. CoP will continue to review and enhance the poverty line
framework on its current basis.
4.2 In 2016, the size of the poor population and the poverty rate after policy
intervention (recurrent cash) were 0.996 million persons and 14.7%
respectively, marking the fourth consecutive year that the poor population
stayed below one million. Both indicators were also notably lower than those
before policy intervention (1.352 million persons and 19.9% respectively),
with 0.36 million persons lifted out of poverty and the poverty rate reduced by
5.2 percentage points as a result of the Government’s recurrent cash measures,
signifying the pronounced effect of these measures on poverty alleviation.
4.3 Thanks to the gradual upturn of the job market since 2009, many
economically active households were lifted out of poverty. Up to 2016, the
post-intervention (recurrent cash) poor population of working and
unemployed households decreased cumulatively by 13% and 48%
respectively, with the former even down to the lowest level in eight years.
Moreover, those groups with higher proportions of full-timers and higher-
skilled working members typically face lower poverty risks.
4.4 The analysis affirms that creating more quality jobs by propelling economic
development along with skills upgrading and reducing skills mismatch
through manpower training are conducive to alleviating poverty at source.
The Government will continue to encourage young people and adults to be
self-reliant through employment and assist them in enhancing their skills to
seize various development opportunities.
4.5 Although the poverty situations of certain groups with relatively higher
proportions of full-time working population, such as single-parent and new-
arrival households, improved in recent years, their poverty rates were still
above the overall average. The Government will continue to assist the needy
Hong Kong Poverty Situation Report 2016
Chapter 4: Policy Implications
P. 125
in these families in seeking employment while stepping up measures in child
care services, with a view to increasing their labour force participation.
4.6 In parallel to promoting employment, the Government also puts in place a
reasonable and sustainable social security and welfare system to help those
who cannot provide for themselves. Various poverty alleviation measures
will continue to provide assistance to the grassroots. In 2017/18, the
Government’s recurrent expenditure on social welfare is estimated to be
around $73.3 billion, up by $9.5 billion or 14.9% as compared with 2016/17.
While CSSA will continue to serve the important function of a social safety
net, OALA sustains the provision of cash assistance to those elders with
financial needs, and LIFA also offers assistance to low-income working
families. The Government has completed a comprehensive policy review on
the LIFA Scheme. The Chief Executive’s 2017 Policy Address released in
October 2017 announced a series of improvement measures to the Scheme so
as to benefit more working households. In addition, the LIFA Scheme will be
renamed as the “Working Family Allowance” Scheme. The Government
plans to implement the relevant measures on 1 April 2018.
4.7 Recurrent cash measures aside, the Government has also put in place various
non-recurrent and in-kind benefits to alleviate the living burden of grassroots
households, among which the provision of PRH has a visible effect on
poverty alleviation. Specifically, the provision of PRH reduced the poverty
rate by 3.4 percentage points in 2016, reflecting its indisputable effectiveness
in poverty alleviation. The provision of PRH can help relieve the burden of
household expenditure and significantly improve the living environment of
grassroots families. The Government will continue to step up its efforts in
providing PRH for the grassroots with housing needs.
4.8 Amid the increasingly ageing demographic structure in Hong Kong, the
proportion of elders is estimated to rise persistently to over three-tenths of the
total population in 2036, almost doubling the current level. Since the launch
of OALA in 2013, the number of elderly recipients has reached over 0.46
million as at end-September 2017, and its poverty alleviation effect on elders
is very significant. Nonetheless, the 2016 statistics showed that, among the
295 400 elders in non-CSSA poor households, 24 200 elders in receipt of
OALA still had financial needs. Upon its implementation in mid-2018, the
HOALA would provide further assistance to these poor elders.
4.9 On the other hand, since the poverty line analysis under the core analytical
framework does not take assets into account, some “asset-rich, income-poor”
elders are classified as poor elders. Among some 0.34 million poor elders,
Hong Kong Poverty Situation Report 2016
Chapter 4: Policy Implications
P. 126
87.6% resided in non-CSSA households, and around 0.21 million of these
poor elders had no financial needs. Over 60% of the poor elderly households
resided in owner-occupied housing without mortgages, representing the
highest share in eight years. This also reflects that many poor elders do have
some assets. In this connection, the Hong Kong Mortgage Corporation
Limited announced in April 2017 a life annuity scheme to help the elderly
turn cash lump sums into life-long streams of fixed monthly income.
Scheduled for launching in mid-2018, the annuity scheme would provide
those elders with some assets an additional financial planning option to
manage their longevity risk by turning their assets into regular income
streams.
4.10 Moreover, the LFPR of elders has trended up from 5.5% in 2009 to 9.9% in
2016. That of elders aged 65-69 increased even more notably, up from 13.5%
to 20.7%. Given the longer life expectancy of our population, encouraging
more employable elders with better health conditions to stay in or re-enter the
labour market would help relieve labour force shrinkage in the future and
bring a positive effect on poverty prevention.
4.11 The Elderly Services Programme Plan (ESPP), formulated by the Elderly
Commission and released in June 2017, proposed four strategic directions and
20 recommendations on the future development of elderly services, including
improving the quality of elderly services and strengthening the planning in
service supply, land, manpower and financial input. The Government has
accepted in principle the strategic directions and recommendations in ESPP,
and will proceed to make arrangements for the implementation of the
recommendations.
4.12 Thanks to the sustained growth of our economy and the tight labour market
amid the broadly benign global economic environment, earnings of grassroots
workers have recorded appreciable gains in 2017. Coupled with the
implementation of the various poverty alleviation measures mentioned above,
the living standard of low-income persons is expected to improve. The
Government will continue to monitor the poverty situation in Hong Kong and
the effectiveness of different poverty alleviation items, with a view to
providing more appropriate policies and measures to the needy.
Appendices
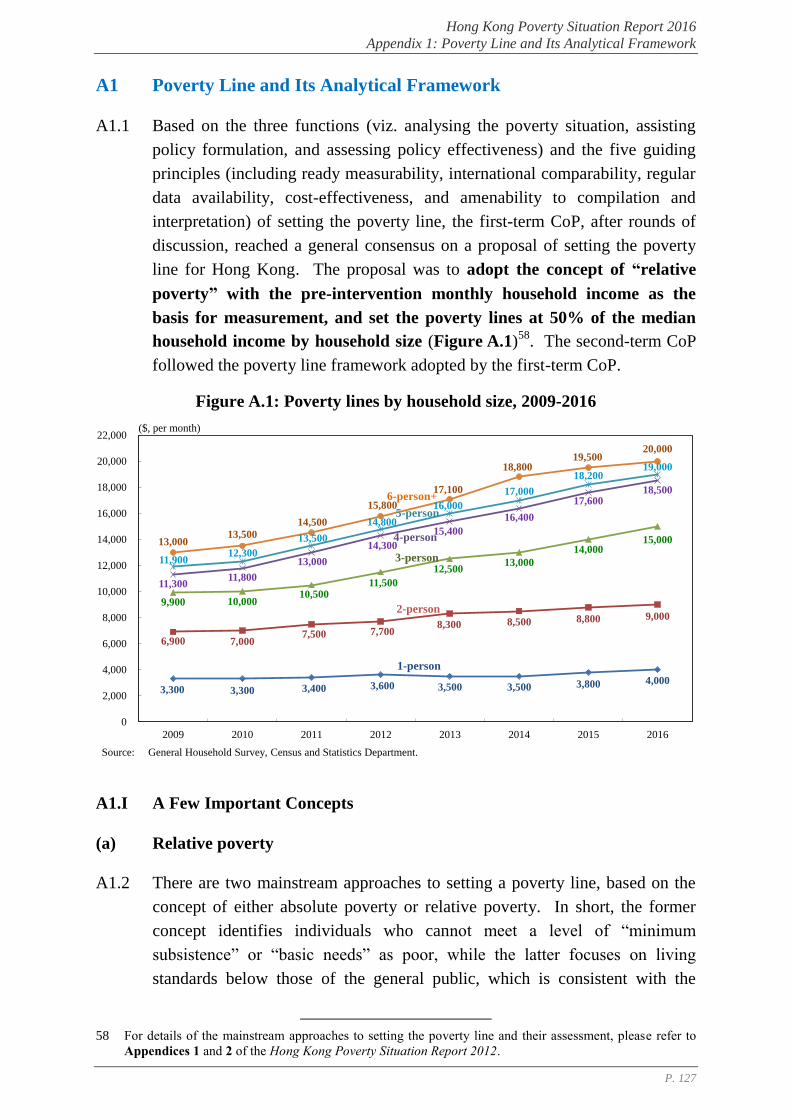
Hong Kong Poverty Situation Report 2016
Appendix 1: Poverty Line and Its Analytical Framework
P. 127
A1 Poverty Line and Its Analytical Framework
A1.1 Based on the three functions (viz. analysing the poverty situation, assisting
policy formulation, and assessing policy effectiveness) and the five guiding
principles (including ready measurability, international comparability, regular
data availability, cost-effectiveness, and amenability to compilation and
interpretation) of setting the poverty line, the first-term CoP, after rounds of
discussion, reached a general consensus on a proposal of setting the poverty
line for Hong Kong. The proposal was to adopt the concept of “relative
poverty” with the pre-intervention monthly household income as the
basis for measurement, and set the poverty lines at 50% of the median
household income by household size (Figure A.1)58
. The second-term CoP
followed the poverty line framework adopted by the first-term CoP.
Figure A.1: Poverty lines by household size, 2009-2016
A1.I A Few Important Concepts
(a) Relative poverty
A1.2 There are two mainstream approaches to setting a poverty line, based on the
concept of either absolute poverty or relative poverty. In short, the former
concept identifies individuals who cannot meet a level of “minimum
subsistence” or “basic needs” as poor, while the latter focuses on living
standards below those of the general public, which is consistent with the
58 For details of the mainstream approaches to setting the poverty line and their assessment, please refer to
Appendices 1 and 2 of the Hong Kong Poverty Situation Report 2012.
3,300 3,300 3,400 3,600 3,500 3,500 3,800 4,000
6,900 7,000 7,500 7,700
8,300 8,500 8,800 9,000
9,900 10,000 10,500
11,500
12,500 13,000
14,000 15,000
11,300 11,800
13,000
14,300
15,400
16,400
17,600 18,500
11,900 12,300
13,500
14,800
16,000
17,000
18,200 19,000
13,000 13,500
14,500
15,800
17,100
18,800 19,500
20,000
0
2,000
4,000
6,000
8,000
10,000
12,000
14,000
16,000
18,000
20,000
22,000
2009 2010 2011 2012 2013 2014 2015 2016
Source: General Household Survey, Census and Statistics Department.
($, per month)
1-person
3-person
4-person
5-person
6-person+
2-person
Hong Kong Poverty Situation Report 2016
Appendix 1: Poverty Line and Its Analytical Framework
P. 128
guiding poverty alleviation principle of enabling different strata of the society
to share the fruits of economic development.
A1.3 The first-term CoP noted that adopting the concept of “relative poverty” in
setting poverty lines is consistent with the current international practice of
most developed economies, such as OECD and the EU, and hence the
corresponding statistics so compiled would be more readily and broadly
comparable internationally. In addition, as Hong Kong is a mature and
developed economy, it would be difficult to form a broad consensus in the
community if only those living below the minimum subsistence level are
regarded as poor.
(b) Pre-intervention household income as the basis for measurement
A1.4 Having regard to the international experiences in adopting the concept of
“relative poverty”, the first-term CoP noted that many places set their poverty
lines by anchoring to a certain percentage of the median household income.
In other words, households with incomes below the selected percentage of the
median would be defined as poor59
.
A1.5 Moreover, recognising that one of the main functions of the poverty line is to
assess policy effectiveness, the first-term CoP decided to exclude the effects
of taxation and various cash benefits from household income in the estimation
of the poverty lines so as to prevent the poverty line thresholds from being
affected by policy intervention.
A1.6 Simply put, household income can be classified into the following two types:
(i) “Pre-intervention” household income: it literally refers to the
original household income without taxation or any other policy
intervention60. It includes only a household’s own employment
earnings and other cash income. Setting a poverty line threshold on
this basis can reveal the most fundamental situation of a household.
(ii) “Post-intervention” household income: on top of (i), by deducting
taxes and adding back all recurrent cash benefits (such as CSSA, OAA,
OALA, DA, WITS, LIFA, etc.61
), the derived household income can
59 There are views that the expenditure patterns of households should also be taken into account when setting
a poverty line, for example, using household income net of housing expenses to define poverty. However,
the related statistics are mainly from the Household Expenditure Survey conducted by C&SD once every
five years. The first-term CoP therefore reckoned that it would be difficult to provide timely updates if the
poverty line was based on such a concept. As such, the first-term CoP decided to adopt household income
as the basis for measuring poverty.
60 Please refer to the items listed in Table A.3 of Appendix 3.
61 For details of the benefit items and their estimation methodologies, please see Appendix 3.
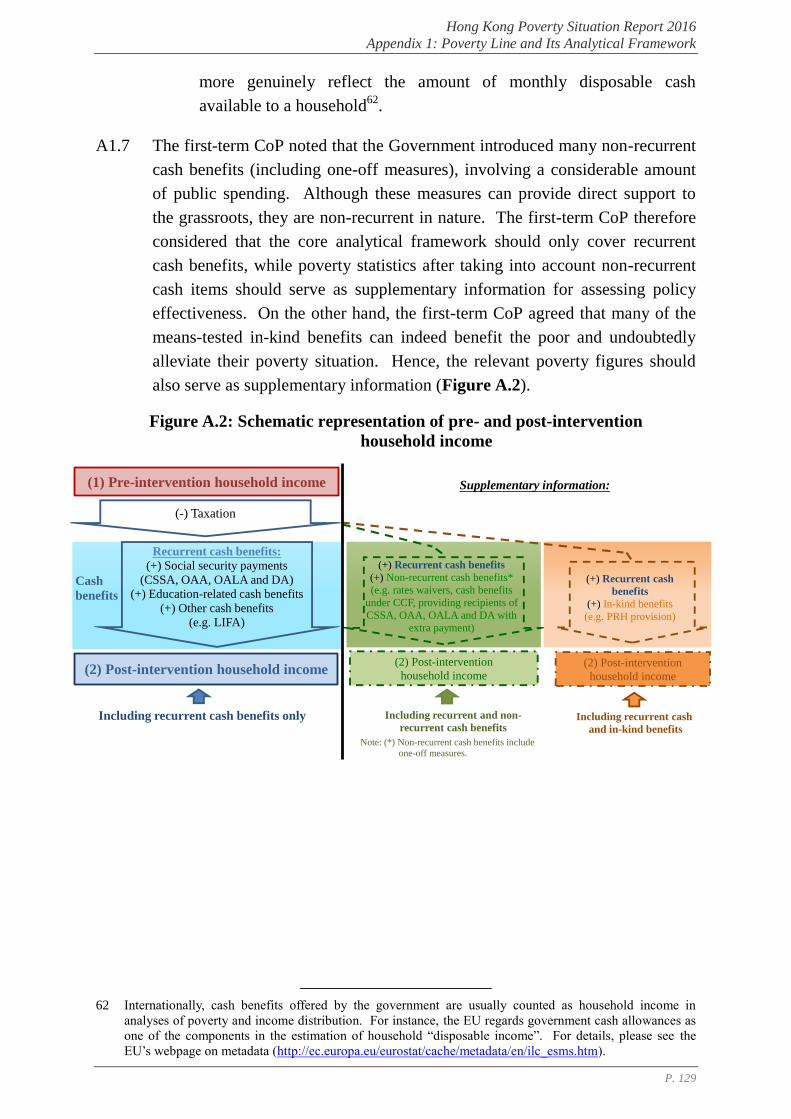
Hong Kong Poverty Situation Report 2016
Appendix 1: Poverty Line and Its Analytical Framework
P. 129
more genuinely reflect the amount of monthly disposable cash
available to a household62
.
A1.7 The first-term CoP noted that the Government introduced many non-recurrent
cash benefits (including one-off measures), involving a considerable amount
of public spending. Although these measures can provide direct support to
the grassroots, they are non-recurrent in nature. The first-term CoP therefore
considered that the core analytical framework should only cover recurrent
cash benefits, while poverty statistics after taking into account non-recurrent
cash items should serve as supplementary information for assessing policy
effectiveness. On the other hand, the first-term CoP agreed that many of the
means-tested in-kind benefits can indeed benefit the poor and undoubtedly
alleviate their poverty situation. Hence, the relevant poverty figures should
also serve as supplementary information (Figure A.2).
Figure A.2: Schematic representation of pre- and post-intervention
household income
62 Internationally, cash benefits offered by the government are usually counted as household income in
analyses of poverty and income distribution. For instance, the EU regards government cash allowances as
one of the components in the estimation of household “disposable income”. For details, please see the
EU’s webpage on metadata (http://ec.europa.eu/eurostat/cache/metadata/en/ilc_esms.htm).
Including recurrent and non-
recurrent cash benefits
(2) Post-intervention
household income
(+) Recurrent cash benefits
(+) Non-recurrent cash benefits*
(e.g. rates waivers, cash benefits
under CCF, providing recipients of
CSSA, OAA, OALA and DA with
extra payment)
Note: (*) Non-recurrent cash benefits include
one-off measures.
(2) Post-intervention household income
(1) Pre-intervention household income
Recurrent cash benefits:
(+) Social security payments
(CSSA, OAA, OALA and DA)
(+) Education-related cash benefits
(+) Other cash benefits
(e.g. LIFA)
(-) Taxation
Including recurrent cash benefits only
Supplementary information:
Figure A.2: Schematic representation of pre- and post-intervention household income
Cash
benefits
(+) Recurrent cash
benefits
(+) In-kind benefits
(e.g. PRH provision)
(2) Post-intervention
household income
Including recurrent cash
and in-kind benefits
Hong Kong Poverty Situation Report 2016
Appendix 1: Poverty Line and Its Analytical Framework
P. 130
(c) Setting the poverty line at 50% of the median household income by
household size
A1.8 The first-term CoP also noted that it has been a common practice, both
internationally and locally, to set the poverty line at 50% of the median
household income. For instance, OECD adopts 50% of the median household
income as the main poverty threshold. In Hong Kong, some non-
governmental organisations (such as HKCSS and Oxfam) have also adopted
50% of the median household income as the poverty line for years.
A1.9 Additionally, household size inevitably affects living needs. For example, a
2-person family normally consumes fewer resources than a 4-person family.
However, since some resources can be shared among household members, the
larger the household size, the greater the economies of scale, thus the lesser
average living needs of each family member. The first-term CoP had
deliberated on this matter63
.
A1.II Analytical Framework
A1.10 One of the major functions of the poverty line is to assess policy
effectiveness. By estimating two types of household income as illustrated
above, we can analyse the changes in poverty indicators before and after
policy intervention, so as to quantify and evaluate the effectiveness of existing
poverty alleviation measures. This can facilitate policy review (Figure A.3).
By the same token, the poverty line also serves as a tool for simulating the
effect of policy initiatives under deliberation on various poverty indicators,
thereby providing an objective policy guidance.
63 The first-term CoP agreed to make reference to the approach adopted by HKCSS and Oxfam, i.e. setting
different poverty lines according to household size. As far as the impact of household size on economies
of scale is concerned, one approach is to adopt the “equivalence scale”. Upon deliberation, the first-term
CoP concluded that internationally there was no universal standard for the equivalence scale, and its
application and estimation methodology were also controversial. It would be difficult for the public to
understand and interpret the figures, and therefore not meet the guiding principle of “amenability to
compilation and interpretation” in setting a poverty line. For details, please refer to Box 2.1 of the Hong
Kong Poverty Situation Report 2012.
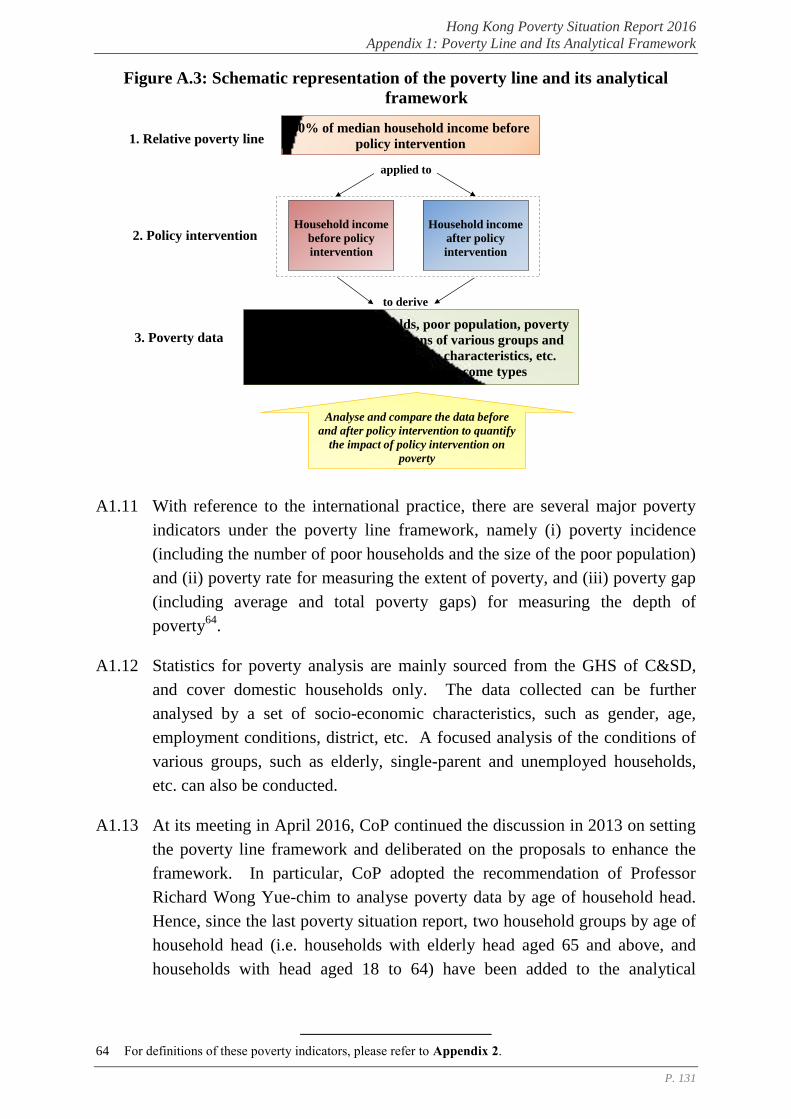
Hong Kong Poverty Situation Report 2016
Appendix 1: Poverty Line and Its Analytical Framework
P. 131
Figure A.3: Schematic representation of the poverty line and its analytical
framework
A1.11 With reference to the international practice, there are several major poverty
indicators under the poverty line framework, namely (i) poverty incidence
(including the number of poor households and the size of the poor population)
and (ii) poverty rate for measuring the extent of poverty, and (iii) poverty gap
(including average and total poverty gaps) for measuring the depth of
poverty64
.
A1.12 Statistics for poverty analysis are mainly sourced from the GHS of C&SD,
and cover domestic households only. The data collected can be further
analysed by a set of socio-economic characteristics, such as gender, age,
employment conditions, district, etc. A focused analysis of the conditions of
various groups, such as elderly, single-parent and unemployed households,
etc. can also be conducted.
A1.13 At its meeting in April 2016, CoP continued the discussion in 2013 on setting
the poverty line framework and deliberated on the proposals to enhance the
framework. In particular, CoP adopted the recommendation of Professor
Richard Wong Yue-chim to analyse poverty data by age of household head.
Hence, since the last poverty situation report, two household groups by age of
household head (i.e. households with elderly head aged 65 and above, and
households with head aged 18 to 64) have been added to the analytical
64 For definitions of these poverty indicators, please refer to Appendix 2.
1. Relative poverty line50% of median household income before
policy intervention
Household income
before policy
intervention
applied to
to derive
2. Policy intervention
3. Poverty dataNumber of poor households, poor population, poverty
rates, poverty gaps, situations of various groups and
districts, their socio-economic characteristics, etc.
under different household income types
Analyse and compare the data before
and after policy intervention to quantify
the impact of policy intervention on
poverty
Figure A.3: Schematic representation of the poverty line and its analytical framework
Household income
after policy
intervention
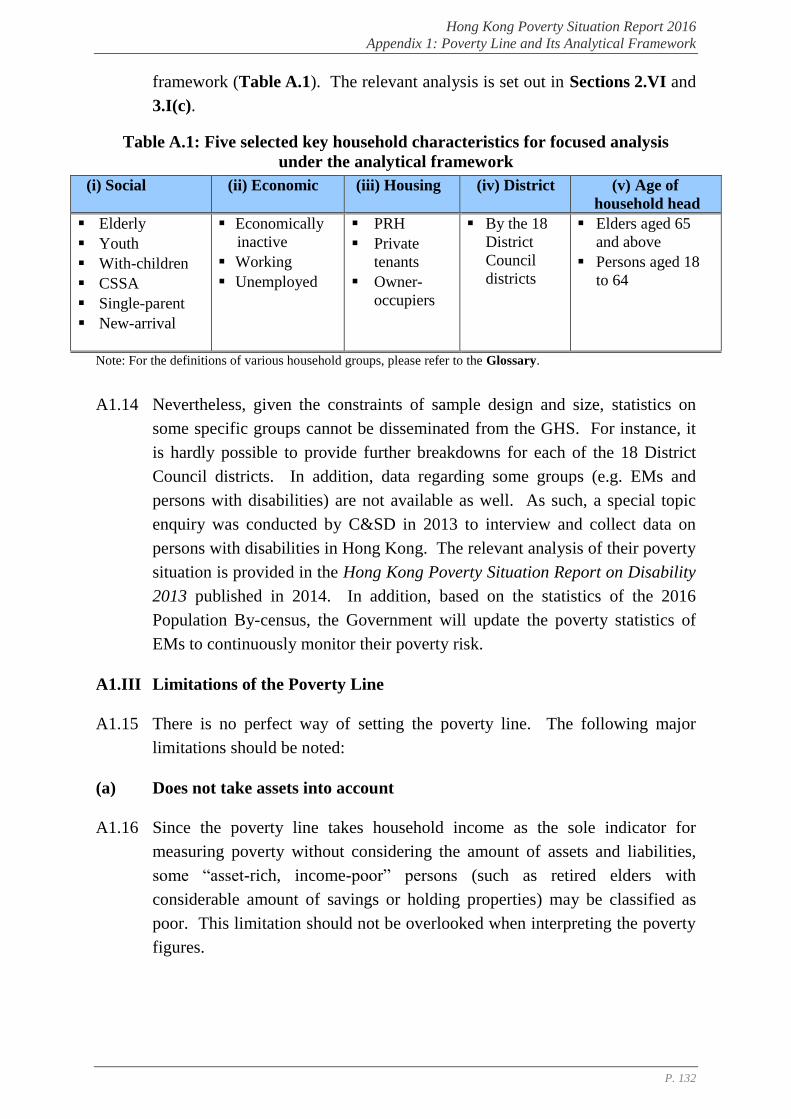
Hong Kong Poverty Situation Report 2016
Appendix 1: Poverty Line and Its Analytical Framework
P. 132
framework (Table A.1). The relevant analysis is set out in Sections 2.VI and
3.I(c).
Table A.1: Five selected key household characteristics for focused analysis
under the analytical framework
(i) Social (ii) Economic (iii) Housing (iv) District (v) Age of
household head
Elderly
Youth
With-children
CSSA
Single-parent
New-arrival
Economically
inactive
Working
Unemployed
PRH
Private
tenants
Owner-
occupiers
By the 18
District
Council
districts
Elders aged 65
and above
Persons aged 18
to 64
Note: For the definitions of various household groups, please refer to the Glossary.
A1.14 Nevertheless, given the constraints of sample design and size, statistics on
some specific groups cannot be disseminated from the GHS. For instance, it
is hardly possible to provide further breakdowns for each of the 18 District
Council districts. In addition, data regarding some groups (e.g. EMs and
persons with disabilities) are not available as well. As such, a special topic
enquiry was conducted by C&SD in 2013 to interview and collect data on
persons with disabilities in Hong Kong. The relevant analysis of their poverty
situation is provided in the Hong Kong Poverty Situation Report on Disability
2013 published in 2014. In addition, based on the statistics of the 2016
Population By-census, the Government will update the poverty statistics of
EMs to continuously monitor their poverty risk.
A1.III Limitations of the Poverty Line
A1.15 There is no perfect way of setting the poverty line. The following major
limitations should be noted:
(a) Does not take assets into account
A1.16 Since the poverty line takes household income as the sole indicator for
measuring poverty without considering the amount of assets and liabilities,
some “asset-rich, income-poor” persons (such as retired elders with
considerable amount of savings or holding properties) may be classified as
poor. This limitation should not be overlooked when interpreting the poverty
figures.
Hong Kong Poverty Situation Report 2016
Appendix 1: Poverty Line and Its Analytical Framework
P. 133
(b) The poverty line is not a “poverty alleviation line”
A1.17 As household assets are not taken into account, the poverty line should not be
taken as the eligibility criteria of any poverty alleviation initiatives. In other
words, setting the poverty line does not mean that the Government should
automatically offer subsidies to individuals or households below the poverty
line. On the contrary, even if the household incomes of some groups are
slightly above the poverty line, they may still be eligible for government
subsidies subject to meeting of the means tests for individual assistance
schemes65
.
A1.18 The poverty line is an analytical tool for identifying the poor population,
facilitating policy formulation, and assessing the effectiveness of government
policy intervention in poverty alleviation. As such, the poverty line should
not be linked directly to the means-tested mechanisms of assistance schemes.
(c) The poor population always exists statistically
A1.19 Under normal circumstances, there are always people in poverty statistically
before policy intervention based on a “relative poverty” line set at a
percentage of the pre-intervention median household income. This is because
under this concept, households with incomes “relatively” lower than that of
the overall median by a certain extent are, by definition, classified as poor.
Therefore, an economic upturn with a widespread improvement in household
income does not guarantee a decrease in the size of the poor population,
especially when the income growth of households below the poverty line is
less promising as compared to that of the overall household income (i.e.
median income).
65 In fact, the eligibility criteria on income of many of the existing assistance schemes are more lenient than
the poverty line thresholds. For example, the income limits for WITS range from about 60% to 100% of
the median monthly domestic household income of corresponding household sizes (based on the limits of
“effective income level”, i.e. the income before deducting an employee’s mandatory contribution to the
Mandatory Provident Fund Scheme). As for LIFA, a two-tier system for the allowance by household
income is adopted: household income at or lower than 50% of the median, and exceeding 50% but not
higher than 60% of the median.
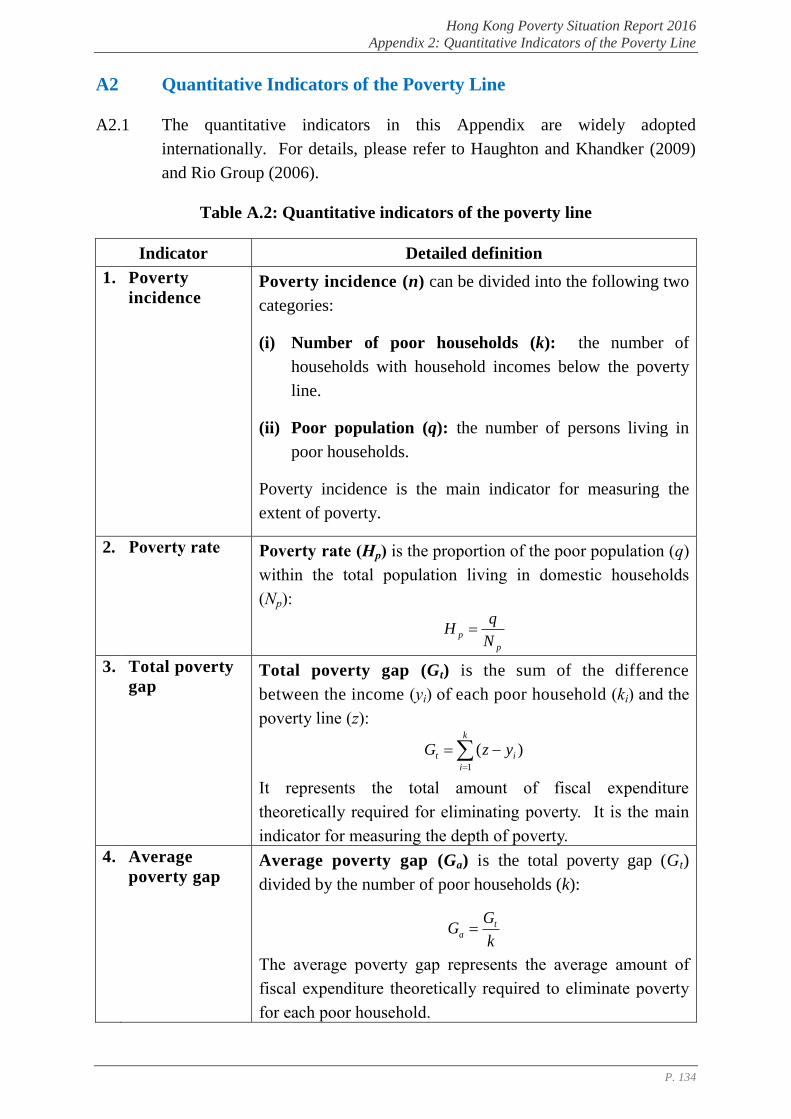
Hong Kong Poverty Situation Report 2016
Appendix 2: Quantitative Indicators of the Poverty Line
P. 134
A2 Quantitative Indicators of the Poverty Line
A2.1 The quantitative indicators in this Appendix are widely adopted
internationally. For details, please refer to Haughton and Khandker (2009)
and Rio Group (2006).
Table A.2: Quantitative indicators of the poverty line
Indicator Detailed definition
1. Poverty
incidence Poverty incidence (n) can be divided into the following two
categories:
(i) Number of poor households (k): the number of
households with household incomes below the poverty
line.
(ii) Poor population (q): the number of persons living in
poor households.
Poverty incidence is the main indicator for measuring the
extent of poverty.
2. Poverty rate Poverty rate (Hp) is the proportion of the poor population (q)
within the total population living in domestic households
(Np):
p
pN
qH
3. Total poverty
gap Total poverty gap (Gt) is the sum of the difference
between the income (yi) of each poor household (ki) and the
poverty line (z):
k
i
it yzG1
)(
It represents the total amount of fiscal expenditure
theoretically required for eliminating poverty. It is the main
indicator for measuring the depth of poverty.
4. Average
poverty gap Average poverty gap (Ga) is the total poverty gap (Gt)
divided by the number of poor households (k):
k
GG t
a
The average poverty gap represents the average amount of
fiscal expenditure theoretically required to eliminate poverty
for each poor household.
Hong Kong Poverty Situation Report 2016
Appendix 3: Policy Intervention - Coverage, Estimation and Limitations
P. 135
A3 Policy Intervention - Coverage, Estimation and Limitations
A3.1 Currently, household income data collected in the GHS of C&SD only include
household members’ employment earnings and investment income (including
regularly received rents, dividends, etc.), regular monthly social security
payments (such as CSSA, OAA, etc.) and other non-social-transfer cash
income (i.e. basic income).
A3.2 Given that one of the major functions of the poverty line is to assess the
effectiveness of poverty alleviation measures, it is necessary to further
estimate the changes in household income before and after policy intervention.
The ensuing paragraphs outline the coverage of these policy intervention
measures (Table A.3) and their corresponding estimation methodologies.
A3.I Policy Items Included in the Estimation of the Main Poverty Statistics
(a) Taxation
A3.3 Taxation includes (i) salaries tax paid by household members; (ii) property tax;
and (iii) rates and Government rent paid by households.
A3.4 The amount of salaries tax is estimated mainly based on the information
provided by respondents of the GHS on employment earnings and household
composition. The amount of property tax is imputed based on property rental
income as reported, while the imputation of rates and Government rent are
based primarily on the relevant data by type of housing (PRH: administrative
records provided by HA and the Hong Kong Housing Society; private housing:
the GHS and the population census / by-census results).
(b) Recurrent cash benefits
A3.5 Recurrent cash benefits can primarily be categorised into the following two
types:
Social security payments: including CSSA, OAA, OALA and DA.
As some GHS respondents were unwilling to reveal whether they were
CSSA recipients, C&SD has carried out a reconciliation exercise
between the GHS database and SWD’s administrative records in order
to obtain a more precise estimation of CSSA payments received by
households; and
Other recurrent cash benefits: referring to other Government
measures that provide cash assistance to eligible households /
individuals, such as the Financial Assistance Scheme for Post-
Hong Kong Poverty Situation Report 2016
Appendix 3: Policy Intervention - Coverage, Estimation and Limitations
P. 136
secondary Students, the WITS Scheme, the LIFA Scheme, etc. Since
relevant data on these measures are not directly available from existing
surveys, it is necessary for the corresponding bureaux / departments to
provide relevant information from their administrative records,
including the number of individual / household beneficiaries and their
socio-economic characteristics (such as household income, age profiles
of residents, etc.) for C&SD’s data imputation. The amounts of
benefits are imputed to the income of individuals / households
estimated to be the beneficiaries.
A3.II Policy Items Regarded as Supplementary Information
(a) Non-recurrent cash benefits (including one-off measures)
A3.6 The Government has provided a number of non-recurrent cash benefits
(including one-off measures) to the public in recent years. Although CoP
considered that the core analytical framework should only cover recurrent
cash benefits, the impact of non-recurrent cash benefits on the poverty
situation should still be estimated as supplementary information. The
estimation methodology of these benefits is similar to that of recurrent cash
benefits. Box 2.1 of this Report provides an overview of the poverty statistics
after factoring in non-recurrent cash benefits for reference.
(b) Means-tested in-kind benefits
A3.7 While considering that the core analysis should focus on the situation after
recurrent cash policy intervention, CoP recognised the comparable
significance of means-tested in-kind benefits as poverty alleviation measures.
Thus, their effectiveness should also be evaluated as a reference for policy
analysis. Box 2.2 provides an analysis of the poverty statistics after taking
into account the transfer of these means-tested in-kind benefits.
A3.8 Besides the estimation of means-tested in-kind benefits arising from PRH
provision, the amounts of other means-tested in-kind benefits are also imputed
by C&SD based on the socio-economic characteristics of individual /
household beneficiaries sourced from the administrative records of the
respective bureaux and departments. The amounts of benefits are then
imputed to the income of eligible individuals / households.
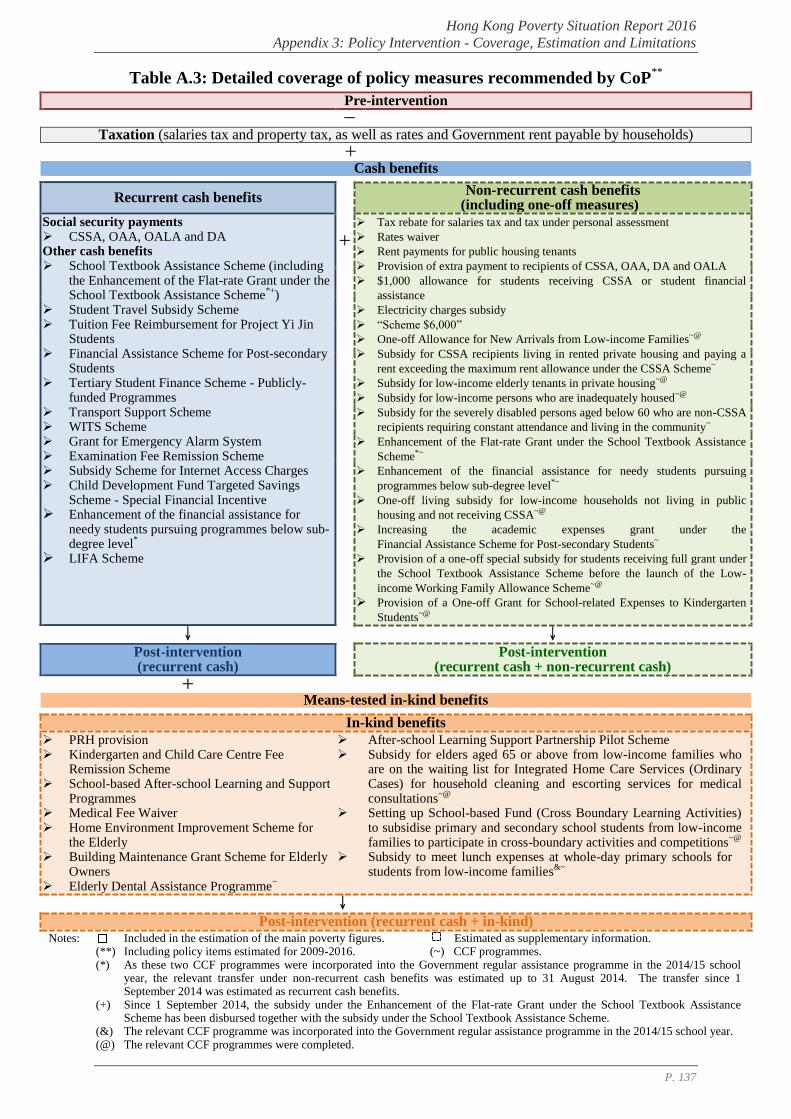
Hong Kong Poverty Situation Report 2016
Appendix 3: Policy Intervention - Coverage, Estimation and Limitations
P. 137
Table A.3: Detailed coverage of policy measures recommended by CoP**
Pre-intervention
- Taxation (salaries tax and property tax, as well as rates and Government rent payable by households)
+ Cash benefits
Recurrent cash benefits
Non-recurrent cash benefits
(including one-off measures)
Social security payments CSSA, OAA, OALA and DA Other cash benefits School Textbook Assistance Scheme (including
the Enhancement of the Flat-rate Grant under the School Textbook Assistance Scheme
*+)
Student Travel Subsidy Scheme Tuition Fee Reimbursement for Project Yi Jin
Students Financial Assistance Scheme for Post-secondary
Students Tertiary Student Finance Scheme - Publicly-
funded Programmes Transport Support Scheme WITS Scheme Grant for Emergency Alarm System Examination Fee Remission Scheme Subsidy Scheme for Internet Access Charges Child Development Fund Targeted Savings
Scheme - Special Financial Incentive Enhancement of the financial assistance for
needy students pursuing programmes below sub-degree level
* LIFA Scheme
+
Tax rebate for salaries tax and tax under personal assessment
Rates waiver
Rent payments for public housing tenants
Provision of extra payment to recipients of CSSA, OAA, DA and OALA
$1,000 allowance for students receiving CSSA or student financial
assistance
Electricity charges subsidy
“Scheme $6,000”
One-off Allowance for New Arrivals from Low-income Families~@
Subsidy for CSSA recipients living in rented private housing and paying a
rent exceeding the maximum rent allowance under the CSSA Scheme~
Subsidy for low-income elderly tenants in private housing~@
Subsidy for low-income persons who are inadequately housed~@
Subsidy for the severely disabled persons aged below 60 who are non-CSSA
recipients requiring constant attendance and living in the community~
Enhancement of the Flat-rate Grant under the School Textbook Assistance
Scheme*~
Enhancement of the financial assistance for needy students pursuing
programmes below sub-degree level*~
One-off living subsidy for low-income households not living in public
housing and not receiving CSSA~@
Increasing the academic expenses grant under the
Financial Assistance Scheme for Post-secondary Students~
Provision of a one-off special subsidy for students receiving full grant under
the School Textbook Assistance Scheme before the launch of the Low-
income Working Family Allowance Scheme~@
Provision of a One-off Grant for School-related Expenses to Kindergarten
Students~@
↓ ↓
Post-intervention (recurrent cash)
Post-intervention (recurrent cash + non-recurrent cash)
+ Means-tested in-kind benefits
In-kind benefits
PRH provision Kindergarten and Child Care Centre Fee
Remission Scheme School-based After-school Learning and Support
Programmes Medical Fee Waiver Home Environment Improvement Scheme for
the Elderly Building Maintenance Grant Scheme for Elderly
Owners Elderly Dental Assistance Programme
~
After-school Learning Support Partnership Pilot Scheme Subsidy for elders aged 65 or above from low-income families who
are on the waiting list for Integrated Home Care Services (Ordinary Cases) for household cleaning and escorting services for medical consultations
~@
Setting up School-based Fund (Cross Boundary Learning Activities) to subsidise primary and secondary school students from low-income families to participate in cross-boundary activities and competitions
~@
Subsidy to meet lunch expenses at whole-day primary schools for students from low-income families
&~
↓
Post-intervention (recurrent cash + in-kind) Notes: Included in the estimation of the main poverty figures. Estimated as supplementary information. (**) Including policy items estimated for 2009-2016. (~) CCF programmes. (*) As these two CCF programmes were incorporated into the Government regular assistance programme in the 2014/15 school
year, the relevant transfer under non-recurrent cash benefits was estimated up to 31 August 2014. The transfer since 1 September 2014 was estimated as recurrent cash benefits.
(+) Since 1 September 2014, the subsidy under the Enhancement of the Flat-rate Grant under the School Textbook Assistance Scheme has been disbursed together with the subsidy under the School Textbook Assistance Scheme.
(&) The relevant CCF programme was incorporated into the Government regular assistance programme in the 2014/15 school year. (@) The relevant CCF programmes were completed.
Hong Kong Poverty Situation Report 2016
Appendix 3: Policy Intervention - Coverage, Estimation and Limitations
P. 138
A3.9 The methodology for estimating PRH benefits is controversial. The estimates
also contribute substantially to the estimated sum of all in-kind benefits.
Please refer to Appendix 4 for details.
A3.III Measures Not Included
A3.10 For universal in-kind benefit transfers without means tests, such as public
medical services and education, CoP’s decision was that these measures
should not be included in the framework as they are neither targeted nor
means-tested and the general public are able to enjoy the benefits.
A3.IV Limitations
A3.11 CoP understood that the estimates of these benefits are subject to the
following major limitations:
(i) Estimation subject to statistical errors: inconsistencies may exist in
terms of classifications and definitions between the data collected from
the GHS and the administrative records. Also, if the detailed
information of some benefit items (e.g. the socio-economic
characteristics of beneficiaries) is not intact, estimations based on
administrative records may give rise to statistical errors;
(ii) Estimation results involve randomness: due to data limitations of the
GHS (e.g. data on household assets are unavailable), it may not be
possible to identify exactly the eligible individuals / households from
the survey even if detailed profiles are available from administrative
records. Only individuals / households with characteristics closest to
the eligibility criteria will be randomly selected from the database for
imputation. In other words, the resulting estimated poverty figures are
only one of the many possible random allocation outcomes;
(iii) Time series data before 2009 are unavailable: due to data
limitations, statistics on taxation and benefit transfers before 2009 are
not available; and
Hong Kong Poverty Situation Report 2016
Appendix 3: Policy Intervention - Coverage, Estimation and Limitations
P. 139
(iv) Figures different from those regularly released by the Government:
the poverty statistics in the Report are specifically estimated for setting
the poverty line, which will inevitably alter the distributions of
household income. Hence, the relevant statistical figures would
naturally deviate, to a certain degree, from those in the Quarterly
Report on General Household Survey regularly released by C&SD.
The two sets of data are not strictly comparable due to their differences
in estimation methodology.
A3.12 In view of the above limitations, the poverty figures should be studied with
care to avoid any misinterpretations of the statistics.
Hong Kong Poverty Situation Report 2016
Appendix 4: In-kind Transfer from Provision of Public Rental Housing - Estimation and Limitations
P. 140
A4 In-kind Transfer from Provision of Public Rental Housing –
Estimation and Limitations
A4.1 As illustrated in Box 2.2, apart from recurrent cash benefits, the Government
has also provided various means-tested in-kind benefits, with PRH provision
being the most important. In fact, the share of PRH in the total number of
living quarters in Hong Kong is higher than that of some developed
economies66
. The provision of PRH can undoubtedly alleviate the burden of
households in need and its effectiveness in poverty alleviation is undisputable.
Thus, CoP agreed that its policy effectiveness should also be assessed for
supplementary reference67
.
A4.I Estimation Methodology
A4.2 As PRH households do not receive housing benefits in cash, C&SD adopts the
marginal analysis approach to estimate the amount of PRH benefit transfer.
The concept is that if a PRH unit were leased in a hypothetical open market,
the difference between the market rent and the actual rent paid by the
household would be the opportunity cost for the provision of PRH by the
Government and also the housing benefits enjoyed by the household.
A4.3 This estimation methodology stems from the concept of opportunity cost and
is in line with the mainstream international practice (such as by OECD, the
EU and the International Labour Organization). In fact, this methodology of
estimating PRH benefits has been adopted by C&SD before. In 2007, C&SD
consulted various sectors (including academia) regarding the methodology for
estimating the value of different kinds of social transfers (mainly for the
compilation of the Gini Coefficient back then). The current approach was the
result after consultation and has gained wide acceptance.
A4.4 The estimation methodology of in-kind benefits arising from PRH provision is
as follows. First, the average market rent 68
of the past two years of a PRH
66 The share of public housing in the overall number of living quarters in Hong Kong was 29%, much higher
than that of other developed economies, including Denmark (20.0%), the UK (18.2%), France (17.4%),
Germany (4.2%) and Spain (2.4%).
67 At its meeting in April 2016, the second-term CoP examined proposals for enhancing the analytical
framework of the poverty line, including the proposed incorporation of the effectiveness of PRH provision
in poverty alleviation into the core analysis. Having noted the significant difference in living quality
between households in PRH and low-income tenant households in private housing, Members recognised
the provision of PRH as an important and effective measure in poverty alleviation. Yet, CoP considered
that there was at present no pressing need to enhance the analytical framework and modify the poverty
statistics under the current framework. The poverty statistics taking into account the effectiveness of PRH
provision in poverty alleviation will therefore remain as supplementary reference. In the long run,
however, CoP agreed to further explore this recommendation and other proposals for enhancing the
analytical framework.
68 All rents are net of rates, Government rents and management fees.
Hong Kong Poverty Situation Report 2016
Appendix 4: In-kind Transfer from Provision of Public Rental Housing - Estimation and Limitations
P. 141
unit is estimated using information provided by the Rating and Valuation
Department and HA. Then the housing benefit received by that household is
estimated by deducting the actual rent paid by the household as collected from
the GHS from the imputed market rent of that PRH unit.
A4.5 Starting from 2016, the new estimation methodology described in the
preceding paragraph has been used for estimating in-kind benefits arising
from PRH provisions. The concepts of the new and the old estimation
methodologies are basically the same, except that the new estimation
methodology will make use of more administrative data in respect of
individual PRH units in the estimation of the market rent, whereas the old
methodology made use of the average data of all PRH units in the same
building in the estimation. The difference in the estimated in-kind benefits
arising from PRH provision between the new and old estimation
methodologies is not significant. It has no impact on the estimated poverty
alleviation effect of the PRH provision.
A4.II Limitations
A4.6 CoP acknowledged that the estimation of housing benefits has the following
major limitations:
(i) The PRH benefits are not real cash assistance: to some extent, a
rise in private rent would increase the estimated housing benefits
imputed to PRH households, possibly lifting some households out of
poverty. However, the disposable income in their "pockets" does not
actually increase69
.
(ii) Estimated market rent of a PRH unit is not based on actual market
transactions: the estimation assumes that a PRH unit could be leased
in an open market, but such assumption is actually not achievable.
(iii) Using the two-year average market rent: regarding the estimation of
the market rent of a PRH unit, CoP examined whether the rent of a
particular year, the average rent of the past two years or that of the past
69 In its report released in 1995 (the 1995 National Academy of Sciences report), the US National Academy
of Sciences expressed concerns that the housing benefit transfer was not real cash assistance, which might
even be overestimated under certain circumstances. Take, for example, a couple with children residing in a
relatively large PRH unit. Later, with their children moving out, a smaller unit would suffice and yet the
elderly couple stays in the original unit, resulting in an overestimation of the value of PRH benefit transfer.
As recommended in the report, the imputed market rent should be capped at a certain proportion of the
poverty line. Members of CoP noted the recommendation at the CoP meeting in April 2016.
Hong Kong Poverty Situation Report 2016
Appendix 4: In-kind Transfer from Provision of Public Rental Housing - Estimation and Limitations
P. 142
few years70
should be used. Ultimately, CoP decided to adopt a two-
year average since most private rental flats are currently leased on a
two-year term. Whilst the choice inherits arbitrariness, the advantage
is that the imputed housing benefits can broadly reflect private rental
changes and somewhat avoid the influence of short-term fluctuations.
70 Using the market rent of a particular year would allow the PRH benefits to better reflect the current
situation but would be subject to larger fluctuations over time especially when the private rental market is
volatile. On the other hand, taking the average of the market rents of the past several years can smooth the
series, thereby producing a more stable estimate of the in-kind benefits arising from PRH provision.
However, it would then fail to fully reflect the latest situation.
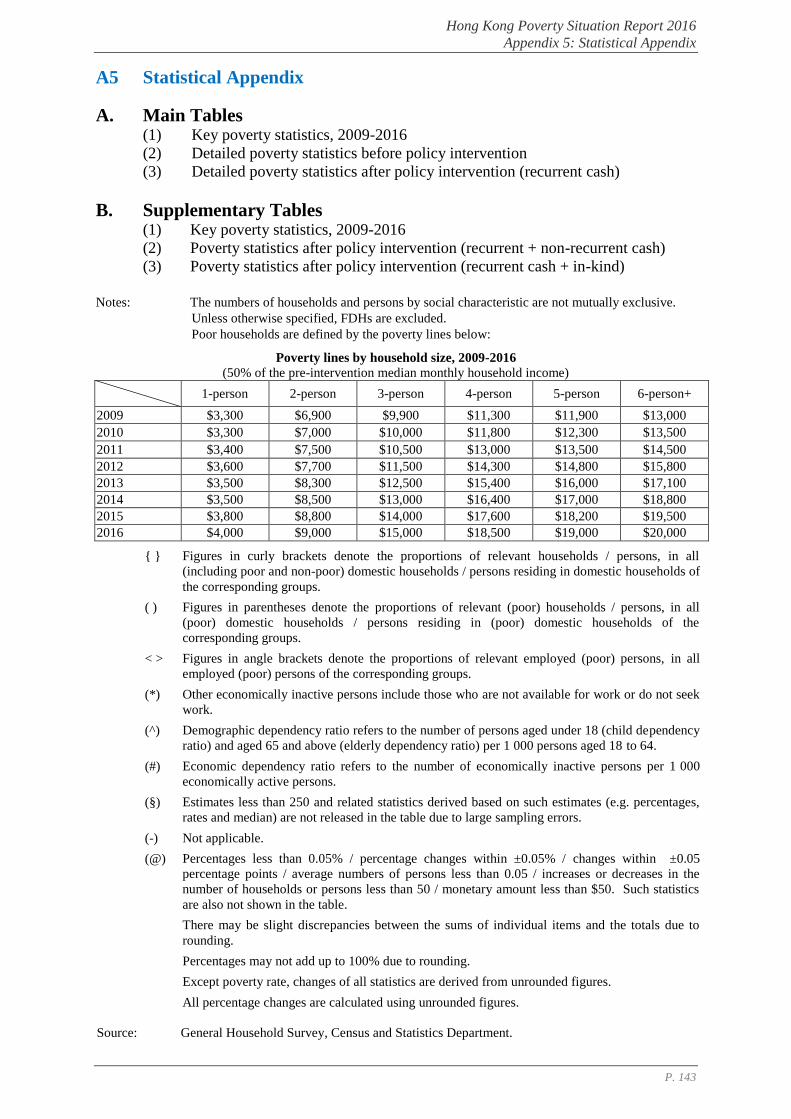
Hong Kong Poverty Situation Report 2016
Appendix 5: Statistical Appendix
P. 143
A5 Statistical Appendix
A. Main Tables (1) Key poverty statistics, 2009-2016
(2) Detailed poverty statistics before policy intervention
(3) Detailed poverty statistics after policy intervention (recurrent cash)
B. Supplementary Tables (1) Key poverty statistics, 2009-2016
(2) Poverty statistics after policy intervention (recurrent + non-recurrent cash)
(3) Poverty statistics after policy intervention (recurrent cash + in-kind)
Notes: The numbers of households and persons by social characteristic are not mutually exclusive.
Unless otherwise specified, FDHs are excluded.
Poor households are defined by the poverty lines below:
Poverty lines by household size, 2009-2016
(50% of the pre-intervention median monthly household income)
1-person 2-person 3-person 4-person 5-person 6-person+
2009 $3,300 $6,900 $9,900 $11,300 $11,900 $13,000
2010 $3,300 $7,000 $10,000 $11,800 $12,300 $13,500
2011 $3,400 $7,500 $10,500 $13,000 $13,500 $14,500
2012 $3,600 $7,700 $11,500 $14,300 $14,800 $15,800
2013 $3,500 $8,300 $12,500 $15,400 $16,000 $17,100
2014 $3,500 $8,500 $13,000 $16,400 $17,000 $18,800
2015 $3,800 $8,800 $14,000 $17,600 $18,200 $19,500
2016 $4,000 $9,000 $15,000 $18,500 $19,000 $20,000
{ } Figures in curly brackets denote the proportions of relevant households / persons, in all
(including poor and non-poor) domestic households / persons residing in domestic households of
the corresponding groups.
( ) Figures in parentheses denote the proportions of relevant (poor) households / persons, in all
(poor) domestic households / persons residing in (poor) domestic households of the
corresponding groups.
< > Figures in angle brackets denote the proportions of relevant employed (poor) persons, in all
employed (poor) persons of the corresponding groups.
(*) Other economically inactive persons include those who are not available for work or do not seek
work.
(^) Demographic dependency ratio refers to the number of persons aged under 18 (child dependency
ratio) and aged 65 and above (elderly dependency ratio) per 1 000 persons aged 18 to 64.
(#) Economic dependency ratio refers to the number of economically inactive persons per 1 000
economically active persons.
(§) Estimates less than 250 and related statistics derived based on such estimates (e.g. percentages,
rates and median) are not released in the table due to large sampling errors.
(-) Not applicable.
(@) Percentages less than 0.05% / percentage changes within ±0.05% / changes within ±0.05
percentage points / average numbers of persons less than 0.05 / increases or decreases in the
number of households or persons less than 50 / monetary amount less than $50. Such statistics
are also not shown in the table.
There may be slight discrepancies between the sums of individual items and the totals due to
rounding.
Percentages may not add up to 100% due to rounding.
Except poverty rate, changes of all statistics are derived from unrounded figures.
All percentage changes are calculated using unrounded figures.
Source: General Household Survey, Census and Statistics Department.
Hong Kong Poverty Situation Report 2016
Appendix 5: Statistical Appendix
P. 144
A. Main Tables
(1) Key poverty statistics, 2009-2016
Table A.1.1 Poverty indicators (compared with the previous year)
Table A.1.2 Poverty indicators (compared with the poverty indicators before
policy intervention)
(2) Detailed poverty statistics before policy intervention
Poverty indicators, 2009-2016
Table A.2.1 Poor households by selected household group
Table A.2.2 Poor population by selected household group
Table A.2.3 Poverty rate by selected household group
Table A.2.4 Total poverty gap by selected household group
Table A.2.5 Average poverty gap by selected household group
Detailed socio-economic characteristics of poor households, 2016
Table A.2.6 Socio-economic characteristics of poor households by selected
household group (1)
Table A.2.7 Socio-economic characteristics of poor households by selected
household group (2)
Table A.2.8 Socio-economic characteristics of poor households by District
Council district (1)
Table A.2.9 Socio-economic characteristics of poor households by District
Council district (2)
Table A.2.10 Socio-economic characteristics of poor households by District
Council district (3)
Table A.2.11 Socio-economic characteristics of poor households by housing
characteristic and age of household head
Detailed socio-economic characteristics of poor population, 2016
Table A.2.12 Socio-economic characteristics of poor population by selected
household group (1)
Table A.2.13 Socio-economic characteristics of poor population by selected
household group (2)
Table A.2.14 Socio-economic characteristics of poor population by District
Council district (1)
Table A.2.15 Socio-economic characteristics of poor population by District
Council district (2)
Table A.2.16 Socio-economic characteristics of poor population by District
Council district (3)
Table A.2.17 Socio-economic characteristics of poor population by housing
characteristic and age of household head
Hong Kong Poverty Situation Report 2016
Appendix 5: Statistical Appendix
P. 145
A. Main Tables (Cont’d)
(3) Detailed poverty statistics after policy intervention (recurrent cash)
Poverty indicators, 2009-2016
Table A.3.1a Poor households by selected household group
Table A.3.2a Poor population by selected household group
Table A.3.3a Poverty rate by selected household group
Table A.3.4a Total poverty gap by selected household group
Table A.3.5a Average poverty gap by selected household group
Poverty indicators, 2009-2016 (with the 2016 comparison of pre- and post-
intervention poverty indicators)
Table A.3.1b Poor households by selected household group
Table A.3.2b Poor population by selected household group
Table A.3.3b Poverty rate by selected household group
Table A.3.4b Total poverty gap by selected household group
Table A.3.5b Average poverty gap by selected household group
Detailed socio-economic characteristics of poor households, 2016
Table A.3.6 Socio-economic characteristics of poor households by selected
household group (1)
Table A.3.7 Socio-economic characteristics of poor households by selected
household group (2)
Table A.3.8 Socio-economic characteristics of poor households by District
Council district (1)
Table A.3.9 Socio-economic characteristics of poor households by District
Council district (2)
Table A.3.10 Socio-economic characteristics of poor households by District
Council district (3)
Table A.3.11 Socio-economic characteristics of poor households by housing
characteristic and age of household head
Detailed socio-economic characteristics of poor population, 2016
Table A.3.12 Socio-economic characteristics of poor population by selected
household group (1)
Table A.3.13 Socio-economic characteristics of poor population by selected
household group (2)
Table A.3.14 Socio-economic characteristics of poor population by District
Council district (1)
Table A.3.15 Socio-economic characteristics of poor population by District
Council district (2)
Table A.3.16 Socio-economic characteristics of poor population by District
Council district (3)
Table A.3.17 Socio-economic characteristics of poor population by housing
characteristic and age of household head
Hong Kong Poverty Situation Report 2016
Appendix 5: Statistical Appendix
P. 146
Table A.1.1: Poverty indicators, 2009-2016 (compared with the previous year)
(A) Before policy intervention
I. Poor households ('000) 541.1 535.5 530.3 540.6 554.9 555.2 569.8 582.2
II. Poor population ('000) 1 348.4 1 322.0 1 295.0 1 312.3 1 336.2 1 324.8 1 345.0 1 352.5
III. Poverty rate (%) 20.6 20.1 19.6 19.6 19.9 19.6 19.7 19.9
IV. Poverty gap
Annual total gap (HK$Mn) 32,785.4 35,544.7 38,510.3
Monthly average gap (HK$) 3,900 4,000 4,200 4,400 4,600 4,900 5,200 5,500
(B) After policy intervention (recurrent cash)
I. Poor households ('000) 406.3 405.3 398.8 403.0 384.8 382.6 392.4 412.4
II. Poor population ('000) 1 043.4 1 030.6 1 005.4 1 017.8 972.2 962.1 971.4 995.8
III. Poverty rate (%) 16.0 15.7 15.2 15.2 14.5 14.3 14.3 14.7
IV. Poverty gap
Annual total gap (HK$Mn) 15,819.8 18,152.1 19,937.0
Monthly average gap (HK$) 2,600 2,600 2,900 3,100 3,300 3,400 3,900 4,000
Change % change Change % change Change % change Change % change Change % change Change % change Change % change Change % change
(A) Before policy intervention
I. Poor households ('000) -5.5 -1.0 -5.2 -1.0 10.3 2.0 14.3 2.6 0.3 0.1 14.6 2.6 12.4 2.2
II. Poor population ('000) -26.4 -2.0 -27.0 -2.0 17.4 1.3 23.9 1.8 -11.4 -0.9 20.2 1.5 7.5 0.6
III. Poverty rate (%) -0.5 - -0.5 - @ - 0.3 - -0.3 - 0.1 - 0.2 -
IV. Poverty gap
Annual total gap (HK$Mn) 518.6 2.0 948.8 3.7 1,906.6 7.1 1,842.1 6.4 2,145.0 7.0 2,759.3 8.4 2,965.6 8.3
Monthly average gap (HK$) 100 3.1 200 4.7 200 5.0 200 3.7 300 6.9 300 5.6 300 6.0
(B) After policy intervention (recurrent cash)
I. Poor households ('000) -1.0 -0.2 -6.5 -1.6 4.2 1.1 -18.2 -4.5 -2.2 -0.6 9.8 2.6 20.0 5.1
II. Poor population ('000) -12.8 -1.2 -25.2 -2.4 12.4 1.2 -45.7 -4.5 -10.0 -1.0 9.3 1.0 24.4 2.5
III. Poverty rate (%) -0.3 - -0.5 - @ - -0.7 - -0.2 - @ - 0.4 -
IV. Poverty gap
Annual total gap (HK$Mn) 39.8 0.3 871.5 6.8 1,106.3 8.1 212.0 1.4 800.2 5.3 2,332.3 14.7 1,784.9 9.8
Monthly average gap (HK$) @ @ 200 8.5 200 6.9 200 6.2 200 5.9 400 11.9 200 4.5
2016
Compared with the previous year
20142012
-
2013
28,798.4 30,640.4
14,807.6 15,019.6
2015
-
2009 2010 2011
25,424.4 25,943.0 26,891.7
12,790.0 12,829.8 13,701.2
Hong Kong Poverty Situation Report 2016
Appendix 5: Statistical Appendix
P. 147
Table A.1.2: Poverty indicators, 2009-2016 (compared with the poverty
indicators before policy intervention)
(A) Before policy intervention
I. Poor households ('000) 541.1 535.5 530.3 540.6 554.9 555.2 569.8 582.2
II. Poor population ('000) 1 324.8 1 345.0 1 352.5
III. Poverty rate (%) 20.6 20.1 19.6 19.6 19.9 19.6 19.7 19.9
IV. Poverty gap
Annual total gap (HK$Mn) 32,785.4 35,544.7 38,510.3
Monthly average gap (HK$) 3,900 4,000 4,200 4,400 4,600 4,900 5,200 5,500
(B) After policy intervention (recurrent cash)
I. Poor households ('000) 406.3 405.3 398.8 403.0 384.8 382.6 392.4 412.4
II. Poor population ('000) 971.4 995.8
III. Poverty rate (%) 16.0 15.7 15.2 15.2 14.5 14.3 14.3 14.7
IV. Poverty gap
Annual total gap (HK$Mn) 18,152.1 19,937.0
Monthly average gap (HK$) 2,600 2,600 2,900 3,100 3,300 3,400 3,900 4,000
Change % change Change % change Change % change Change % change Change % change Change % change Change % change Change % change
I. Poor households ('000) -134.8 -24.9 -130.2 -24.3 -131.5 -24.8 -137.6 -25.5 -170.1 -30.7 -172.6 -31.1 -177.4 -31.1 -169.8 -29.2
II. Poor population ('000) -305.0 -22.6 -291.4 -22.0 -289.6 -22.4 -294.5 -22.4 -364.0 -27.2 -362.7 -27.4 -373.5 -27.8 -356.6 -26.4
III. Poverty rate (%) -4.6 - -4.4 - -4.4 - -4.4 - -5.4 - -5.3 - -5.4 - -5.2 -
IV. Poverty gap
Annual total gap (HK$Mn) -12,634.4 -49.7 -13,113.2 -50.5 -13,190.5 -49.1 -13,990.8 -48.6 -15,620.9 -51.0 -16,965.6 -51.7 -17,392.6 -48.9 -18,573.3 -48.2
Monthly average gap (HK$) -1,300 -33.0 -1,400 -34.7 -1,400 -32.3 -1,400 -31.0 -1,300 -29.3 -1,500 -30.0 -1,300 -25.8 -1,500 -26.9
1 043.4 1 030.6 1 005.4
2016
962.1 1 017.8
25,943.0
Compared with the poverty indicators before policy intervention
15,819.8
1 312.3
15,019.6
1 348.4
201520122011 20142013
972.2
12,829.8 13,701.2 14,807.6
1 336.2
30,640.428,798.4
1 295.0
26,891.725,424.4
12,790.0
1 322.0
2009 2010

Hong Kong Poverty Situation Report 2016
Appendix 5: Statistical Appendix
P. 148
Table A.2.1: Poor households by selected household group, 2009-2016
2009 2010 2011 2012 2013 2014 2015 2016Change
('000)
%
change
Change
('000)
%
change
Overall 541.1 535.5 530.3 540.6 554.9 555.2 569.8 582.2 12.4 2.2 41.1 7.6
I. Household size
1-person 133.6 137.7 141.6 146.6 146.9 152.6 161.7 174.7 13.1 8.1 41.1 30.7
2-person 172.3 170.1 171.2 170.8 183.7 185.4 191.0 191.0 @ @ 18.7 10.8
3-person 115.8 111.6 103.0 110.7 114.2 107.3 108.1 110.1 2.0 1.9 -5.8 -5.0
4-person 85.9 82.7 81.1 81.2 80.7 80.1 78.2 76.7 -1.5 -1.9 -9.1 -10.7
5-person 23.7 24.6 24.3 23.0 21.7 21.7 23.1 21.7 -1.4 -6.2 -2.0 -8.4
6-person+ 9.7 8.9 9.1 8.4 7.7 8.1 7.8 8.0 0.2 2.6 -1.7 -17.7
II. Social characteristics
CSSA households 206.7 207.3 202.2 194.8 186.3 177.3 172.5 166.0 -6.6 -3.8 -40.7 -19.7
Elderly households 158.4 166.8 167.6 172.3 186.3 193.4 207.3 221.3 14.0 6.7 62.8 39.6
Single-parent households 41.4 40.5 36.9 37.6 34.9 34.8 35.0 32.9 -2.0 -5.8 -8.5 -20.5
New-arrival households 37.8 30.6 32.3 34.1 30.4 27.8 25.4 23.1 -2.3 -9.1 -14.7 -38.8
Households with children 183.2 172.2 165.2 167.9 161.5 156.9 154.5 148.9 -5.6 -3.6 -34.3 -18.7
Youth households 2.8 2.5 2.7 3.3 2.1 2.3 2.3 2.3 @ @ -0.5 -17.4
III. Economic characteristics
Economically active households 252.6 233.5 224.9 230.1 241.2 230.0 228.3 222.9 -5.4 -2.4 -29.7 -11.8
Working households 213.2 201.8 199.0 205.7 217.0 208.0 207.3 200.7 -6.6 -3.2 -12.5 -5.8
Unemployed households 39.4 31.7 25.9 24.4 24.2 22.0 21.0 22.2 1.2 5.5 -17.3 -43.8
Economically inactive households 288.4 302.0 305.4 310.6 313.7 325.2 341.5 359.3 17.8 5.2 70.8 24.6
IV. Housing characteristics
Public rental housing 284.3 286.2 279.9 289.3 286.9 285.4 292.5 283.3 -9.2 -3.1 -1.1 -0.4
Tenants in private housing 44.1 37.3 38.7 40.5 44.0 43.4 46.7 50.5 3.9 8.3 6.4 14.6
Owner-occupiers 196.1 196.5 194.3 193.4 204.4 205.6 212.8 227.9 15.1 7.1 31.8 16.2
- with mortgages or loans 31.5 20.6 21.0 19.9 22.3 19.9 19.0 21.7 2.7 14.0 -9.8 -31.2
- without mortgages and loans 164.6 176.0 173.3 173.5 182.1 185.7 193.8 206.2 12.4 6.4 41.6 25.3
V. Age of household head
Household head aged between 18 and 64 311.5 297.8 294.3 298.2 290.1 280.5 280.4 280.7 0.3 0.1 -30.9 -9.9
Household head aged 65 and above 228.3 236.2 234.8 241.1 264.1 274.1 288.6 301.0 12.4 4.3 72.7 31.8
VI. District Council districts
Central and Western 14.2 14.0 13.2 14.5 14.3 14.8 15.4 13.4 -1.9 -12.6 -0.8 -5.5
Wan Chai 8.6 9.7 9.0 9.6 9.0 10.8 11.1 10.8 -0.3 -2.8 2.2 25.9
Eastern 36.5 37.1 38.2 39.2 40.8 40.1 41.6 34.1 -7.6 -18.2 -2.5 -6.8
Southern 16.5 16.4 15.3 16.0 16.8 16.9 16.2 16.2 @ @ -0.3 -1.9
Yau Tsim Mong 23.5 22.9 25.0 25.7 24.5 24.5 26.5 27.3 0.8 3.0 3.8 16.2
Sham Shui Po 39.2 37.9 39.7 39.8 39.8 41.2 39.9 40.7 0.8 1.9 1.5 3.9
Kowloon City 25.3 24.8 24.8 25.1 25.7 27.9 32.7 28.2 -4.5 -13.8 2.9 11.4
Wong Tai Sin 39.1 41.4 38.1 41.6 39.8 40.5 41.4 38.7 -2.7 -6.5 -0.3 -0.9
Kwun Tong 62.0 64.3 60.6 64.2 68.6 65.1 67.9 62.7 -5.2 -7.7 0.7 1.1
Kwai Tsing 47.8 48.6 47.2 44.7 46.9 49.2 46.6 47.6 1.1 2.3 -0.2 -0.4
Tsuen Wan 20.9 18.5 19.1 19.7 20.4 19.2 20.2 22.2 2.0 9.8 1.3 6.4
Tuen Mun 42.0 39.6 39.3 40.2 41.6 41.0 40.6 42.6 2.0 4.9 0.6 1.4
Yuen Long 48.8 50.3 47.0 49.5 45.9 46.6 49.2 55.7 6.5 13.2 6.9 14.1
North 25.0 24.0 25.1 24.1 24.0 24.0 22.6 30.0 7.3 32.3 4.9 19.6
Tai Po 18.5 18.2 17.7 16.7 18.9 19.7 18.9 22.9 4.0 21.0 4.4 23.7
Sha Tin 39.2 37.8 38.5 39.1 44.1 41.5 45.4 48.9 3.4 7.6 9.7 24.7
Sai Kung 21.2 18.9 20.7 20.9 22.8 22.1 22.4 27.7 5.3 23.9 6.5 30.6
Islands 12.7 10.7 11.5 10.1 11.1 10.2 11.1 12.5 1.4 12.6 -0.1 -1.2
Before policy intervention
2016 compared
with 2015
2016 compared
with 2009No. of households ('000)
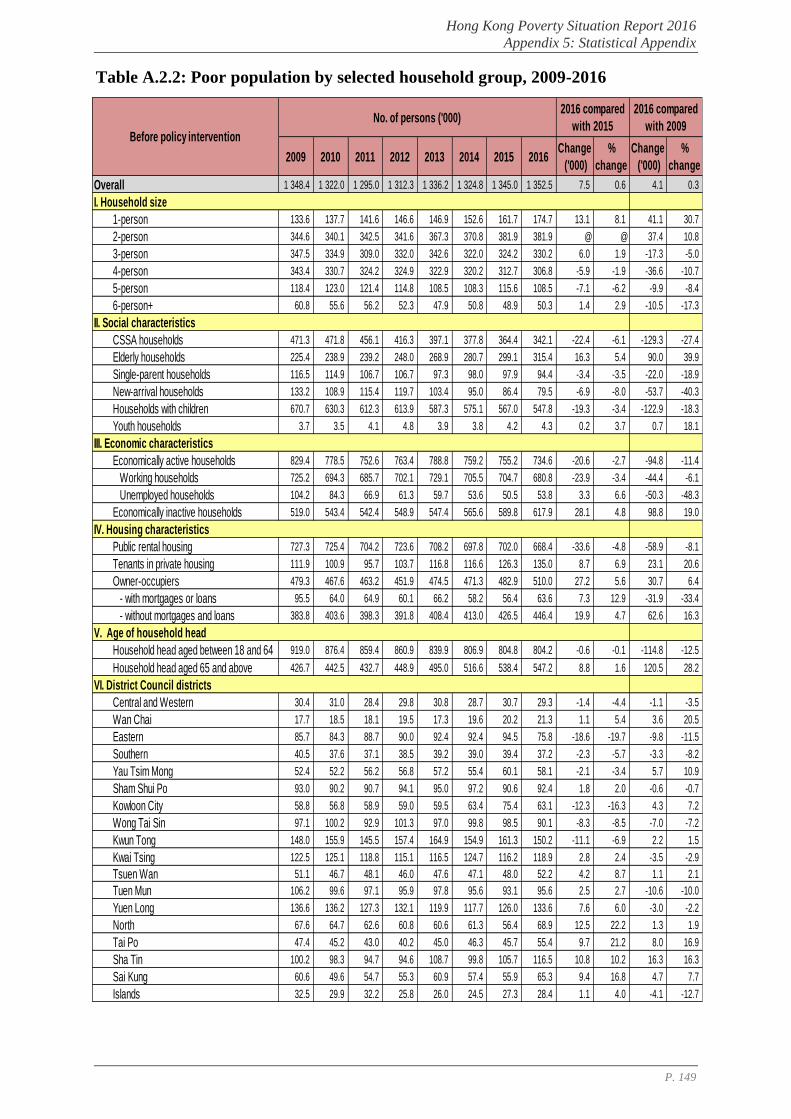
Hong Kong Poverty Situation Report 2016
Appendix 5: Statistical Appendix
P. 149
Table A.2.2: Poor population by selected household group, 2009-2016
2009 2010 2011 2012 2013 2014 2015 2016Change
('000)
%
change
Change
('000)
%
change
Overall 1 348.4 1 322.0 1 295.0 1 312.3 1 336.2 1 324.8 1 345.0 1 352.5 7.5 0.6 4.1 0.3
I. Household size
1-person 133.6 137.7 141.6 146.6 146.9 152.6 161.7 174.7 13.1 8.1 41.1 30.7
2-person 344.6 340.1 342.5 341.6 367.3 370.8 381.9 381.9 @ @ 37.4 10.8
3-person 347.5 334.9 309.0 332.0 342.6 322.0 324.2 330.2 6.0 1.9 -17.3 -5.0
4-person 343.4 330.7 324.2 324.9 322.9 320.2 312.7 306.8 -5.9 -1.9 -36.6 -10.7
5-person 118.4 123.0 121.4 114.8 108.5 108.3 115.6 108.5 -7.1 -6.2 -9.9 -8.4
6-person+ 60.8 55.6 56.2 52.3 47.9 50.8 48.9 50.3 1.4 2.9 -10.5 -17.3
II. Social characteristics
CSSA households 471.3 471.8 456.1 416.3 397.1 377.8 364.4 342.1 -22.4 -6.1 -129.3 -27.4
Elderly households 225.4 238.9 239.2 248.0 268.9 280.7 299.1 315.4 16.3 5.4 90.0 39.9
Single-parent households 116.5 114.9 106.7 106.7 97.3 98.0 97.9 94.4 -3.4 -3.5 -22.0 -18.9
New-arrival households 133.2 108.9 115.4 119.7 103.4 95.0 86.4 79.5 -6.9 -8.0 -53.7 -40.3
Households with children 670.7 630.3 612.3 613.9 587.3 575.1 567.0 547.8 -19.3 -3.4 -122.9 -18.3
Youth households 3.7 3.5 4.1 4.8 3.9 3.8 4.2 4.3 0.2 3.7 0.7 18.1
III. Economic characteristics
Economically active households 829.4 778.5 752.6 763.4 788.8 759.2 755.2 734.6 -20.6 -2.7 -94.8 -11.4
Working households 725.2 694.3 685.7 702.1 729.1 705.5 704.7 680.8 -23.9 -3.4 -44.4 -6.1
Unemployed households 104.2 84.3 66.9 61.3 59.7 53.6 50.5 53.8 3.3 6.6 -50.3 -48.3
Economically inactive households 519.0 543.4 542.4 548.9 547.4 565.6 589.8 617.9 28.1 4.8 98.8 19.0
IV. Housing characteristics
Public rental housing 727.3 725.4 704.2 723.6 708.2 697.8 702.0 668.4 -33.6 -4.8 -58.9 -8.1
Tenants in private housing 111.9 100.9 95.7 103.7 116.8 116.6 126.3 135.0 8.7 6.9 23.1 20.6
Owner-occupiers 479.3 467.6 463.2 451.9 474.5 471.3 482.9 510.0 27.2 5.6 30.7 6.4
- with mortgages or loans 95.5 64.0 64.9 60.1 66.2 58.2 56.4 63.6 7.3 12.9 -31.9 -33.4
- without mortgages and loans 383.8 403.6 398.3 391.8 408.4 413.0 426.5 446.4 19.9 4.7 62.6 16.3
V. Age of household head
Household head aged between 18 and 64 919.0 876.4 859.4 860.9 839.9 806.9 804.8 804.2 -0.6 -0.1 -114.8 -12.5
Household head aged 65 and above 426.7 442.5 432.7 448.9 495.0 516.6 538.4 547.2 8.8 1.6 120.5 28.2
VI. District Council districts
Central and Western 30.4 31.0 28.4 29.8 30.8 28.7 30.7 29.3 -1.4 -4.4 -1.1 -3.5
Wan Chai 17.7 18.5 18.1 19.5 17.3 19.6 20.2 21.3 1.1 5.4 3.6 20.5
Eastern 85.7 84.3 88.7 90.0 92.4 92.4 94.5 75.8 -18.6 -19.7 -9.8 -11.5
Southern 40.5 37.6 37.1 38.5 39.2 39.0 39.4 37.2 -2.3 -5.7 -3.3 -8.2
Yau Tsim Mong 52.4 52.2 56.2 56.8 57.2 55.4 60.1 58.1 -2.1 -3.4 5.7 10.9
Sham Shui Po 93.0 90.2 90.7 94.1 95.0 97.2 90.6 92.4 1.8 2.0 -0.6 -0.7
Kowloon City 58.8 56.8 58.9 59.0 59.5 63.4 75.4 63.1 -12.3 -16.3 4.3 7.2
Wong Tai Sin 97.1 100.2 92.9 101.3 97.0 99.8 98.5 90.1 -8.3 -8.5 -7.0 -7.2
Kwun Tong 148.0 155.9 145.5 157.4 164.9 154.9 161.3 150.2 -11.1 -6.9 2.2 1.5
Kwai Tsing 122.5 125.1 118.8 115.1 116.5 124.7 116.2 118.9 2.8 2.4 -3.5 -2.9
Tsuen Wan 51.1 46.7 48.1 46.0 47.6 47.1 48.0 52.2 4.2 8.7 1.1 2.1
Tuen Mun 106.2 99.6 97.1 95.9 97.8 95.6 93.1 95.6 2.5 2.7 -10.6 -10.0
Yuen Long 136.6 136.2 127.3 132.1 119.9 117.7 126.0 133.6 7.6 6.0 -3.0 -2.2
North 67.6 64.7 62.6 60.8 60.6 61.3 56.4 68.9 12.5 22.2 1.3 1.9
Tai Po 47.4 45.2 43.0 40.2 45.0 46.3 45.7 55.4 9.7 21.2 8.0 16.9
Sha Tin 100.2 98.3 94.7 94.6 108.7 99.8 105.7 116.5 10.8 10.2 16.3 16.3
Sai Kung 60.6 49.6 54.7 55.3 60.9 57.4 55.9 65.3 9.4 16.8 4.7 7.7
Islands 32.5 29.9 32.2 25.8 26.0 24.5 27.3 28.4 1.1 4.0 -4.1 -12.7
Before policy intervention
2016 compared
with 2015
2016 compared
with 2009No. of persons ('000)
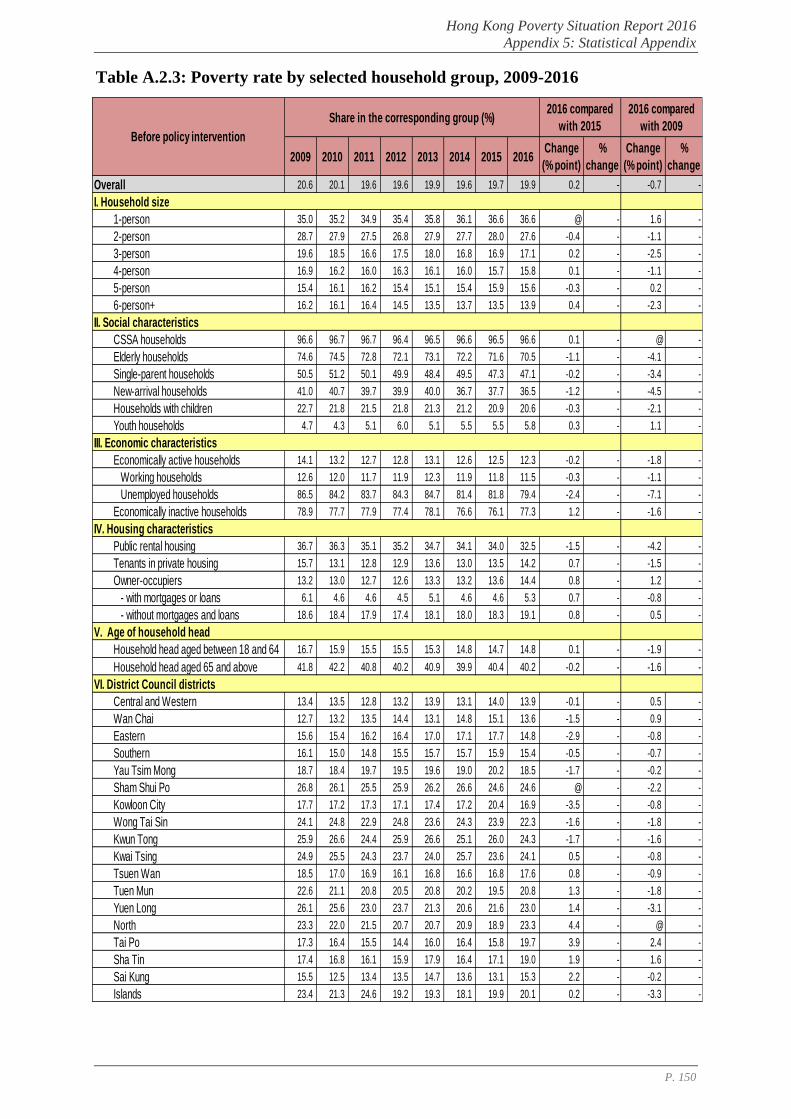
Hong Kong Poverty Situation Report 2016
Appendix 5: Statistical Appendix
P. 150
Table A.2.3: Poverty rate by selected household group, 2009-2016
2009 2010 2011 2012 2013 2014 2015 2016Change
(% point)
%
change
Change
(% point)
%
change
Overall 20.6 20.1 19.6 19.6 19.9 19.6 19.7 19.9 0.2 - -0.7 -
I. Household size
1-person 35.0 35.2 34.9 35.4 35.8 36.1 36.6 36.6 @ - 1.6 -
2-person 28.7 27.9 27.5 26.8 27.9 27.7 28.0 27.6 -0.4 - -1.1 -
3-person 19.6 18.5 16.6 17.5 18.0 16.8 16.9 17.1 0.2 - -2.5 -
4-person 16.9 16.2 16.0 16.3 16.1 16.0 15.7 15.8 0.1 - -1.1 -
5-person 15.4 16.1 16.2 15.4 15.1 15.4 15.9 15.6 -0.3 - 0.2 -
6-person+ 16.2 16.1 16.4 14.5 13.5 13.7 13.5 13.9 0.4 - -2.3 -
II. Social characteristics
CSSA households 96.6 96.7 96.7 96.4 96.5 96.6 96.5 96.6 0.1 - @ -
Elderly households 74.6 74.5 72.8 72.1 73.1 72.2 71.6 70.5 -1.1 - -4.1 -
Single-parent households 50.5 51.2 50.1 49.9 48.4 49.5 47.3 47.1 -0.2 - -3.4 -
New-arrival households 41.0 40.7 39.7 39.9 40.0 36.7 37.7 36.5 -1.2 - -4.5 -
Households with children 22.7 21.8 21.5 21.8 21.3 21.2 20.9 20.6 -0.3 - -2.1 -
Youth households 4.7 4.3 5.1 6.0 5.1 5.5 5.5 5.8 0.3 - 1.1 -
III. Economic characteristics
Economically active households 14.1 13.2 12.7 12.8 13.1 12.6 12.5 12.3 -0.2 - -1.8 -
Working households 12.6 12.0 11.7 11.9 12.3 11.9 11.8 11.5 -0.3 - -1.1 -
Unemployed households 86.5 84.2 83.7 84.3 84.7 81.4 81.8 79.4 -2.4 - -7.1 -
Economically inactive households 78.9 77.7 77.9 77.4 78.1 76.6 76.1 77.3 1.2 - -1.6 -
IV. Housing characteristics
Public rental housing 36.7 36.3 35.1 35.2 34.7 34.1 34.0 32.5 -1.5 - -4.2 -
Tenants in private housing 15.7 13.1 12.8 12.9 13.6 13.0 13.5 14.2 0.7 - -1.5 -
Owner-occupiers 13.2 13.0 12.7 12.6 13.3 13.2 13.6 14.4 0.8 - 1.2 -
- with mortgages or loans 6.1 4.6 4.6 4.5 5.1 4.6 4.6 5.3 0.7 - -0.8 -
- without mortgages and loans 18.6 18.4 17.9 17.4 18.1 18.0 18.3 19.1 0.8 - 0.5 -
V. Age of household head
Household head aged between 18 and 64 16.7 15.9 15.5 15.5 15.3 14.8 14.7 14.8 0.1 - -1.9 -
Household head aged 65 and above 41.8 42.2 40.8 40.2 40.9 39.9 40.4 40.2 -0.2 - -1.6 -
VI. District Council districts
Central and Western 13.4 13.5 12.8 13.2 13.9 13.1 14.0 13.9 -0.1 - 0.5 -
Wan Chai 12.7 13.2 13.5 14.4 13.1 14.8 15.1 13.6 -1.5 - 0.9 -
Eastern 15.6 15.4 16.2 16.4 17.0 17.1 17.7 14.8 -2.9 - -0.8 -
Southern 16.1 15.0 14.8 15.5 15.7 15.7 15.9 15.4 -0.5 - -0.7 -
Yau Tsim Mong 18.7 18.4 19.7 19.5 19.6 19.0 20.2 18.5 -1.7 - -0.2 -
Sham Shui Po 26.8 26.1 25.5 25.9 26.2 26.6 24.6 24.6 @ - -2.2 -
Kowloon City 17.7 17.2 17.3 17.1 17.4 17.2 20.4 16.9 -3.5 - -0.8 -
Wong Tai Sin 24.1 24.8 22.9 24.8 23.6 24.3 23.9 22.3 -1.6 - -1.8 -
Kwun Tong 25.9 26.6 24.4 25.9 26.6 25.1 26.0 24.3 -1.7 - -1.6 -
Kwai Tsing 24.9 25.5 24.3 23.7 24.0 25.7 23.6 24.1 0.5 - -0.8 -
Tsuen Wan 18.5 17.0 16.9 16.1 16.8 16.6 16.8 17.6 0.8 - -0.9 -
Tuen Mun 22.6 21.1 20.8 20.5 20.8 20.2 19.5 20.8 1.3 - -1.8 -
Yuen Long 26.1 25.6 23.0 23.7 21.3 20.6 21.6 23.0 1.4 - -3.1 -
North 23.3 22.0 21.5 20.7 20.7 20.9 18.9 23.3 4.4 - @ -
Tai Po 17.3 16.4 15.5 14.4 16.0 16.4 15.8 19.7 3.9 - 2.4 -
Sha Tin 17.4 16.8 16.1 15.9 17.9 16.4 17.1 19.0 1.9 - 1.6 -
Sai Kung 15.5 12.5 13.4 13.5 14.7 13.6 13.1 15.3 2.2 - -0.2 -
Islands 23.4 21.3 24.6 19.2 19.3 18.1 19.9 20.1 0.2 - -3.3 -
Before policy intervention
2016 compared
with 2015
2016 compared
with 2009Share in the corresponding group (%)
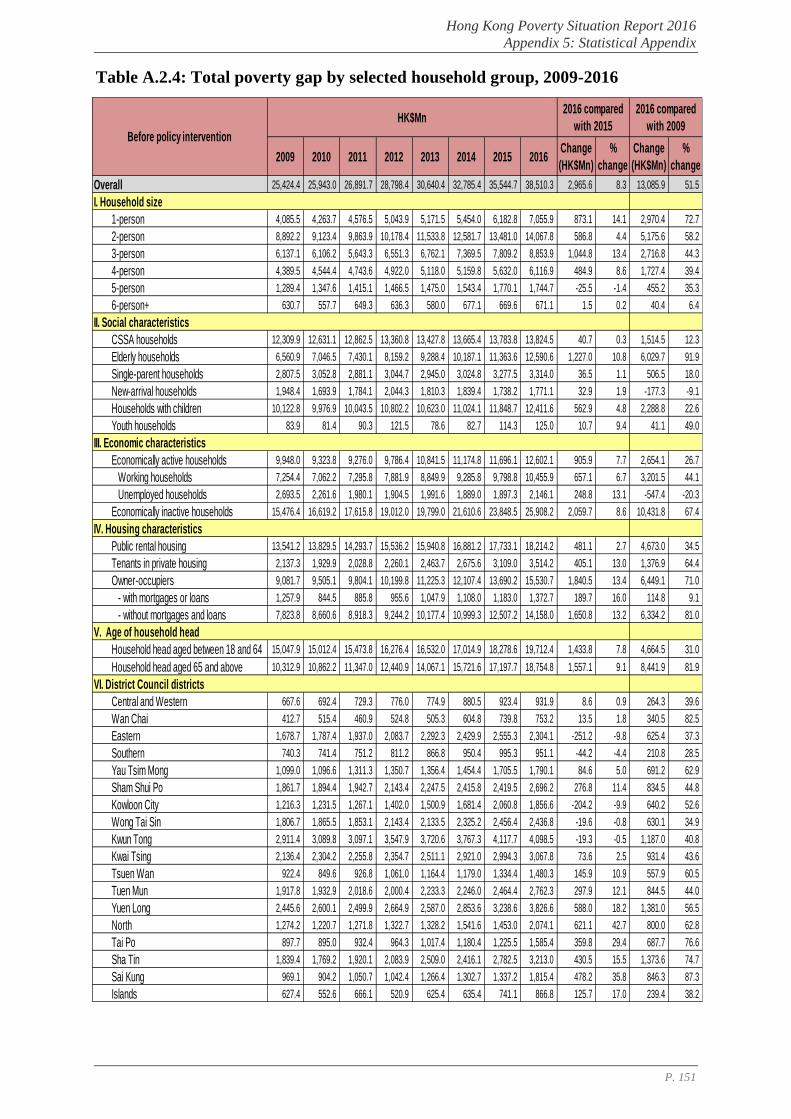
Hong Kong Poverty Situation Report 2016
Appendix 5: Statistical Appendix
P. 151
Table A.2.4: Total poverty gap by selected household group, 2009-2016
2009 2010 2011 2012 2013 2014 2015 2016Change
(HK$Mn)
%
change
Change
(HK$Mn)
%
change
Overall 25,424.4 25,943.0 26,891.7 28,798.4 30,640.4 32,785.4 35,544.7 38,510.3 2,965.6 8.3 13,085.9 51.5
I. Household size
1-person 4,085.5 4,263.7 4,576.5 5,043.9 5,171.5 5,454.0 6,182.8 7,055.9 873.1 14.1 2,970.4 72.7
2-person 8,892.2 9,123.4 9,863.9 10,178.4 11,533.8 12,581.7 13,481.0 14,067.8 586.8 4.4 5,175.6 58.2
3-person 6,137.1 6,106.2 5,643.3 6,551.3 6,762.1 7,369.5 7,809.2 8,853.9 1,044.8 13.4 2,716.8 44.3
4-person 4,389.5 4,544.4 4,743.6 4,922.0 5,118.0 5,159.8 5,632.0 6,116.9 484.9 8.6 1,727.4 39.4
5-person 1,289.4 1,347.6 1,415.1 1,466.5 1,475.0 1,543.4 1,770.1 1,744.7 -25.5 -1.4 455.2 35.3
6-person+ 630.7 557.7 649.3 636.3 580.0 677.1 669.6 671.1 1.5 0.2 40.4 6.4
II. Social characteristics
CSSA households 12,309.9 12,631.1 12,862.5 13,360.8 13,427.8 13,665.4 13,783.8 13,824.5 40.7 0.3 1,514.5 12.3
Elderly households 6,560.9 7,046.5 7,430.1 8,159.2 9,288.4 10,187.1 11,363.6 12,590.6 1,227.0 10.8 6,029.7 91.9
Single-parent households 2,807.5 3,052.8 2,881.1 3,044.7 2,945.0 3,024.8 3,277.5 3,314.0 36.5 1.1 506.5 18.0
New-arrival households 1,948.4 1,693.9 1,784.1 2,044.3 1,810.3 1,839.4 1,738.2 1,771.1 32.9 1.9 -177.3 -9.1
Households with children 10,122.8 9,976.9 10,043.5 10,802.2 10,623.0 11,024.1 11,848.7 12,411.6 562.9 4.8 2,288.8 22.6
Youth households 83.9 81.4 90.3 121.5 78.6 82.7 114.3 125.0 10.7 9.4 41.1 49.0
III. Economic characteristics
Economically active households 9,948.0 9,323.8 9,276.0 9,786.4 10,841.5 11,174.8 11,696.1 12,602.1 905.9 7.7 2,654.1 26.7
Working households 7,254.4 7,062.2 7,295.8 7,881.9 8,849.9 9,285.8 9,798.8 10,455.9 657.1 6.7 3,201.5 44.1
Unemployed households 2,693.5 2,261.6 1,980.1 1,904.5 1,991.6 1,889.0 1,897.3 2,146.1 248.8 13.1 -547.4 -20.3
Economically inactive households 15,476.4 16,619.2 17,615.8 19,012.0 19,799.0 21,610.6 23,848.5 25,908.2 2,059.7 8.6 10,431.8 67.4
IV. Housing characteristics
Public rental housing 13,541.2 13,829.5 14,293.7 15,536.2 15,940.8 16,881.2 17,733.1 18,214.2 481.1 2.7 4,673.0 34.5
Tenants in private housing 2,137.3 1,929.9 2,028.8 2,260.1 2,463.7 2,675.6 3,109.0 3,514.2 405.1 13.0 1,376.9 64.4
Owner-occupiers 9,081.7 9,505.1 9,804.1 10,199.8 11,225.3 12,107.4 13,690.2 15,530.7 1,840.5 13.4 6,449.1 71.0
- with mortgages or loans 1,257.9 844.5 885.8 955.6 1,047.9 1,108.0 1,183.0 1,372.7 189.7 16.0 114.8 9.1
- without mortgages and loans 7,823.8 8,660.6 8,918.3 9,244.2 10,177.4 10,999.3 12,507.2 14,158.0 1,650.8 13.2 6,334.2 81.0
V. Age of household head
Household head aged between 18 and 64 15,047.9 15,012.4 15,473.8 16,276.4 16,532.0 17,014.9 18,278.6 19,712.4 1,433.8 7.8 4,664.5 31.0
Household head aged 65 and above 10,312.9 10,862.2 11,347.0 12,440.9 14,067.1 15,721.6 17,197.7 18,754.8 1,557.1 9.1 8,441.9 81.9
VI. District Council districts
Central and Western 667.6 692.4 729.3 776.0 774.9 880.5 923.4 931.9 8.6 0.9 264.3 39.6
Wan Chai 412.7 515.4 460.9 524.8 505.3 604.8 739.8 753.2 13.5 1.8 340.5 82.5
Eastern 1,678.7 1,787.4 1,937.0 2,083.7 2,292.3 2,429.9 2,555.3 2,304.1 -251.2 -9.8 625.4 37.3
Southern 740.3 741.4 751.2 811.2 866.8 950.4 995.3 951.1 -44.2 -4.4 210.8 28.5
Yau Tsim Mong 1,099.0 1,096.6 1,311.3 1,350.7 1,356.4 1,454.4 1,705.5 1,790.1 84.6 5.0 691.2 62.9
Sham Shui Po 1,861.7 1,894.4 1,942.7 2,143.4 2,247.5 2,415.8 2,419.5 2,696.2 276.8 11.4 834.5 44.8
Kowloon City 1,216.3 1,231.5 1,267.1 1,402.0 1,500.9 1,681.4 2,060.8 1,856.6 -204.2 -9.9 640.2 52.6
Wong Tai Sin 1,806.7 1,865.5 1,853.1 2,143.4 2,133.5 2,325.2 2,456.4 2,436.8 -19.6 -0.8 630.1 34.9
Kwun Tong 2,911.4 3,089.8 3,097.1 3,547.9 3,720.6 3,767.3 4,117.7 4,098.5 -19.3 -0.5 1,187.0 40.8
Kwai Tsing 2,136.4 2,304.2 2,255.8 2,354.7 2,511.1 2,921.0 2,994.3 3,067.8 73.6 2.5 931.4 43.6
Tsuen Wan 922.4 849.6 926.8 1,061.0 1,164.4 1,179.0 1,334.4 1,480.3 145.9 10.9 557.9 60.5
Tuen Mun 1,917.8 1,932.9 2,018.6 2,000.4 2,233.3 2,246.0 2,464.4 2,762.3 297.9 12.1 844.5 44.0
Yuen Long 2,445.6 2,600.1 2,499.9 2,664.9 2,587.0 2,853.6 3,238.6 3,826.6 588.0 18.2 1,381.0 56.5
North 1,274.2 1,220.7 1,271.8 1,322.7 1,328.2 1,541.6 1,453.0 2,074.1 621.1 42.7 800.0 62.8
Tai Po 897.7 895.0 932.4 964.3 1,017.4 1,180.4 1,225.5 1,585.4 359.8 29.4 687.7 76.6
Sha Tin 1,839.4 1,769.2 1,920.1 2,083.9 2,509.0 2,416.1 2,782.5 3,213.0 430.5 15.5 1,373.6 74.7
Sai Kung 969.1 904.2 1,050.7 1,042.4 1,266.4 1,302.7 1,337.2 1,815.4 478.2 35.8 846.3 87.3
Islands 627.4 552.6 666.1 520.9 625.4 635.4 741.1 866.8 125.7 17.0 239.4 38.2
Before policy intervention
2016 compared
with 2015
2016 compared
with 2009HK$Mn
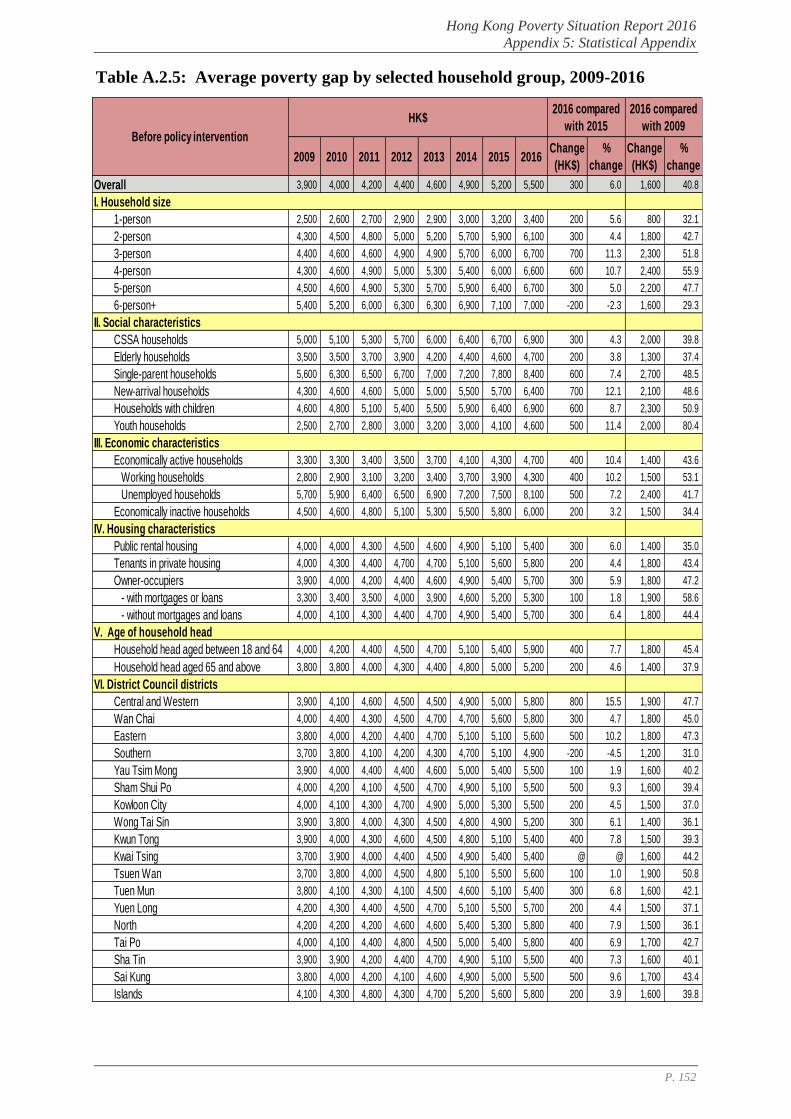
Hong Kong Poverty Situation Report 2016
Appendix 5: Statistical Appendix
P. 152
Table A.2.5: Average poverty gap by selected household group, 2009-2016
2009 2010 2011 2012 2013 2014 2015 2016Change
(HK$)
%
change
Change
(HK$)
%
change
Overall 3,900 4,000 4,200 4,400 4,600 4,900 5,200 5,500 300 6.0 1,600 40.8
I. Household size
1-person 2,500 2,600 2,700 2,900 2,900 3,000 3,200 3,400 200 5.6 800 32.1
2-person 4,300 4,500 4,800 5,000 5,200 5,700 5,900 6,100 300 4.4 1,800 42.7
3-person 4,400 4,600 4,600 4,900 4,900 5,700 6,000 6,700 700 11.3 2,300 51.8
4-person 4,300 4,600 4,900 5,000 5,300 5,400 6,000 6,600 600 10.7 2,400 55.9
5-person 4,500 4,600 4,900 5,300 5,700 5,900 6,400 6,700 300 5.0 2,200 47.7
6-person+ 5,400 5,200 6,000 6,300 6,300 6,900 7,100 7,000 -200 -2.3 1,600 29.3
II. Social characteristics
CSSA households 5,000 5,100 5,300 5,700 6,000 6,400 6,700 6,900 300 4.3 2,000 39.8
Elderly households 3,500 3,500 3,700 3,900 4,200 4,400 4,600 4,700 200 3.8 1,300 37.4
Single-parent households 5,600 6,300 6,500 6,700 7,000 7,200 7,800 8,400 600 7.4 2,700 48.5
New-arrival households 4,300 4,600 4,600 5,000 5,000 5,500 5,700 6,400 700 12.1 2,100 48.6
Households with children 4,600 4,800 5,100 5,400 5,500 5,900 6,400 6,900 600 8.7 2,300 50.9
Youth households 2,500 2,700 2,800 3,000 3,200 3,000 4,100 4,600 500 11.4 2,000 80.4
III. Economic characteristics
Economically active households 3,300 3,300 3,400 3,500 3,700 4,100 4,300 4,700 400 10.4 1,400 43.6
Working households 2,800 2,900 3,100 3,200 3,400 3,700 3,900 4,300 400 10.2 1,500 53.1
Unemployed households 5,700 5,900 6,400 6,500 6,900 7,200 7,500 8,100 500 7.2 2,400 41.7
Economically inactive households 4,500 4,600 4,800 5,100 5,300 5,500 5,800 6,000 200 3.2 1,500 34.4
IV. Housing characteristics
Public rental housing 4,000 4,000 4,300 4,500 4,600 4,900 5,100 5,400 300 6.0 1,400 35.0
Tenants in private housing 4,000 4,300 4,400 4,700 4,700 5,100 5,600 5,800 200 4.4 1,800 43.4
Owner-occupiers 3,900 4,000 4,200 4,400 4,600 4,900 5,400 5,700 300 5.9 1,800 47.2
- with mortgages or loans 3,300 3,400 3,500 4,000 3,900 4,600 5,200 5,300 100 1.8 1,900 58.6
- without mortgages and loans 4,000 4,100 4,300 4,400 4,700 4,900 5,400 5,700 300 6.4 1,800 44.4
V. Age of household head
Household head aged between 18 and 64 4,000 4,200 4,400 4,500 4,700 5,100 5,400 5,900 400 7.7 1,800 45.4
Household head aged 65 and above 3,800 3,800 4,000 4,300 4,400 4,800 5,000 5,200 200 4.6 1,400 37.9
VI. District Council districts
Central and Western 3,900 4,100 4,600 4,500 4,500 4,900 5,000 5,800 800 15.5 1,900 47.7
Wan Chai 4,000 4,400 4,300 4,500 4,700 4,700 5,600 5,800 300 4.7 1,800 45.0
Eastern 3,800 4,000 4,200 4,400 4,700 5,100 5,100 5,600 500 10.2 1,800 47.3
Southern 3,700 3,800 4,100 4,200 4,300 4,700 5,100 4,900 -200 -4.5 1,200 31.0
Yau Tsim Mong 3,900 4,000 4,400 4,400 4,600 5,000 5,400 5,500 100 1.9 1,600 40.2
Sham Shui Po 4,000 4,200 4,100 4,500 4,700 4,900 5,100 5,500 500 9.3 1,600 39.4
Kowloon City 4,000 4,100 4,300 4,700 4,900 5,000 5,300 5,500 200 4.5 1,500 37.0
Wong Tai Sin 3,900 3,800 4,000 4,300 4,500 4,800 4,900 5,200 300 6.1 1,400 36.1
Kwun Tong 3,900 4,000 4,300 4,600 4,500 4,800 5,100 5,400 400 7.8 1,500 39.3
Kwai Tsing 3,700 3,900 4,000 4,400 4,500 4,900 5,400 5,400 @ @ 1,600 44.2
Tsuen Wan 3,700 3,800 4,000 4,500 4,800 5,100 5,500 5,600 100 1.0 1,900 50.8
Tuen Mun 3,800 4,100 4,300 4,100 4,500 4,600 5,100 5,400 300 6.8 1,600 42.1
Yuen Long 4,200 4,300 4,400 4,500 4,700 5,100 5,500 5,700 200 4.4 1,500 37.1
North 4,200 4,200 4,200 4,600 4,600 5,400 5,300 5,800 400 7.9 1,500 36.1
Tai Po 4,000 4,100 4,400 4,800 4,500 5,000 5,400 5,800 400 6.9 1,700 42.7
Sha Tin 3,900 3,900 4,200 4,400 4,700 4,900 5,100 5,500 400 7.3 1,600 40.1
Sai Kung 3,800 4,000 4,200 4,100 4,600 4,900 5,000 5,500 500 9.6 1,700 43.4
Islands 4,100 4,300 4,800 4,300 4,700 5,200 5,600 5,800 200 3.9 1,600 39.8
Before policy intervention
2016 compared
with 2015
2016 compared
with 2009HK$
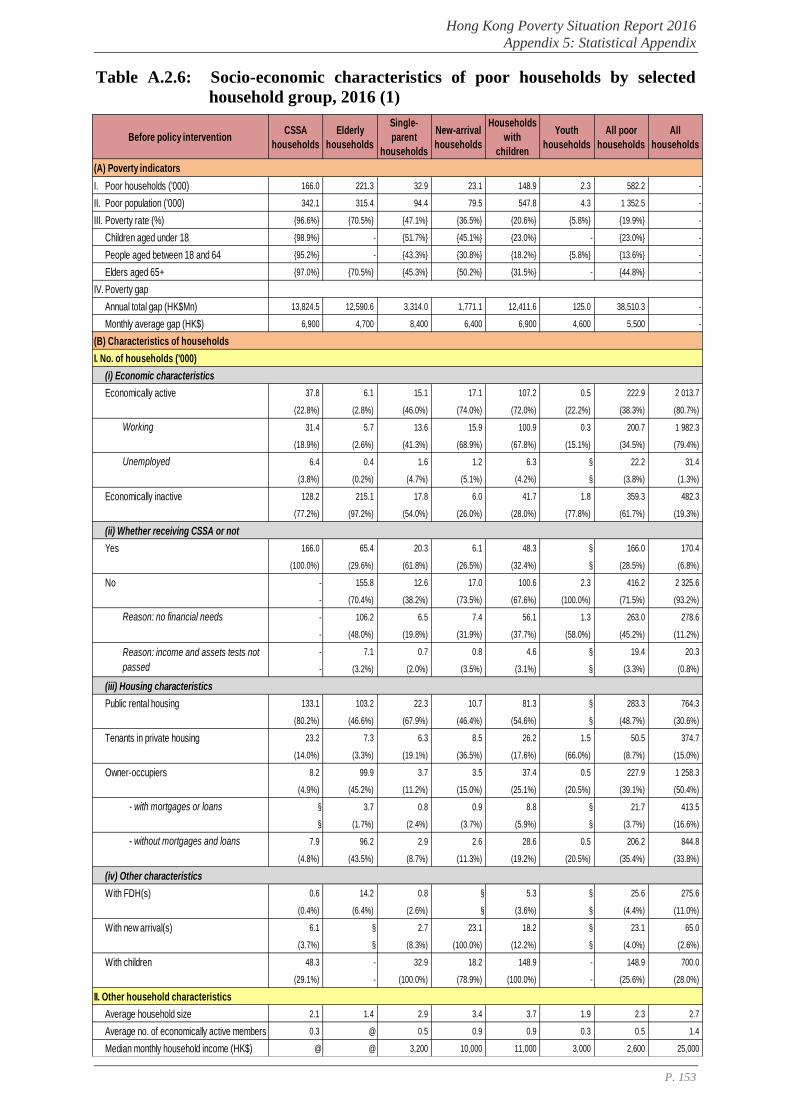
Hong Kong Poverty Situation Report 2016
Appendix 5: Statistical Appendix
P. 153
Table A.2.6: Socio-economic characteristics of poor households by selected
household group, 2016 (1)
CSSA
households
Elderly
households
Single-
parent
households
New-arrival
households
Households
with
children
Youth
households
All poor
households
All
households
(A) Poverty indicators
I. Poor households ('000) 166.0 221.3 32.9 23.1 148.9 2.3 582.2 -
II. Poor population ('000) 342.1 315.4 94.4 79.5 547.8 4.3 1 352.5 -
III. Poverty rate (%) {96.6%} {70.5%} {47.1%} {36.5%} {20.6%} {5.8%} {19.9%} -
Children aged under 18 {98.9%} - {51.7%} {45.1%} {23.0%} - {23.0%} -
People aged between 18 and 64 {95.2%} - {43.3%} {30.8%} {18.2%} {5.8%} {13.6%} -
Elders aged 65+ {97.0%} {70.5%} {45.3%} {50.2%} {31.5%} - {44.8%} -
IV. Poverty gap
Annual total gap (HK$Mn) 13,824.5 12,590.6 3,314.0 1,771.1 12,411.6 125.0 38,510.3 -
Monthly average gap (HK$) 6,900 4,700 8,400 6,400 6,900 4,600 5,500 -
(B) Characteristics of households
I. No. of households ('000)
(i) Economic characteristics
Economically active 37.8 6.1 15.1 17.1 107.2 0.5 222.9 2 013.7
(22.8%) (2.8%) (46.0%) (74.0%) (72.0%) (22.2%) (38.3%) (80.7%)
Working 31.4 5.7 13.6 15.9 100.9 0.3 200.7 1 982.3
(18.9%) (2.6%) (41.3%) (68.9%) (67.8%) (15.1%) (34.5%) (79.4%)
Unemployed 6.4 0.4 1.6 1.2 6.3 § 22.2 31.4
(3.8%) (0.2%) (4.7%) (5.1%) (4.2%) § (3.8%) (1.3%)
Economically inactive 128.2 215.1 17.8 6.0 41.7 1.8 359.3 482.3
(77.2%) (97.2%) (54.0%) (26.0%) (28.0%) (77.8%) (61.7%) (19.3%)
(ii) Whether receiving CSSA or not
Yes 166.0 65.4 20.3 6.1 48.3 § 166.0 170.4
(100.0%) (29.6%) (61.8%) (26.5%) (32.4%) § (28.5%) (6.8%)
No - 155.8 12.6 17.0 100.6 2.3 416.2 2 325.6
- (70.4%) (38.2%) (73.5%) (67.6%) (100.0%) (71.5%) (93.2%)
Reason: no financial needs - 106.2 6.5 7.4 56.1 1.3 263.0 278.6
- (48.0%) (19.8%) (31.9%) (37.7%) (58.0%) (45.2%) (11.2%)
- 7.1 0.7 0.8 4.6 § 19.4 20.3
- (3.2%) (2.0%) (3.5%) (3.1%) § (3.3%) (0.8%)
(iii) Housing characteristics
Public rental housing 133.1 103.2 22.3 10.7 81.3 § 283.3 764.3
(80.2%) (46.6%) (67.9%) (46.4%) (54.6%) § (48.7%) (30.6%)
Tenants in private housing 23.2 7.3 6.3 8.5 26.2 1.5 50.5 374.7
(14.0%) (3.3%) (19.1%) (36.5%) (17.6%) (66.0%) (8.7%) (15.0%)
Owner-occupiers 8.2 99.9 3.7 3.5 37.4 0.5 227.9 1 258.3
(4.9%) (45.2%) (11.2%) (15.0%) (25.1%) (20.5%) (39.1%) (50.4%)
- with mortgages or loans § 3.7 0.8 0.9 8.8 § 21.7 413.5
§ (1.7%) (2.4%) (3.7%) (5.9%) § (3.7%) (16.6%)
- without mortgages and loans 7.9 96.2 2.9 2.6 28.6 0.5 206.2 844.8
(4.8%) (43.5%) (8.7%) (11.3%) (19.2%) (20.5%) (35.4%) (33.8%)
(iv) Other characteristics
With FDH(s) 0.6 14.2 0.8 § 5.3 § 25.6 275.6
(0.4%) (6.4%) (2.6%) § (3.6%) § (4.4%) (11.0%)
With new arrival(s) 6.1 § 2.7 23.1 18.2 § 23.1 65.0
(3.7%) § (8.3%) (100.0%) (12.2%) § (4.0%) (2.6%)
With children 48.3 - 32.9 18.2 148.9 - 148.9 700.0
(29.1%) - (100.0%) (78.9%) (100.0%) - (25.6%) (28.0%)
II. Other household characteristics
Average household size 2.1 1.4 2.9 3.4 3.7 1.9 2.3 2.7
Average no. of economically active members 0.3 @ 0.5 0.9 0.9 0.3 0.5 1.4
Median monthly household income (HK$) @ @ 3,200 10,000 11,000 3,000 2,600 25,000
Before policy intervention
Reason: income and assets tests not
passed
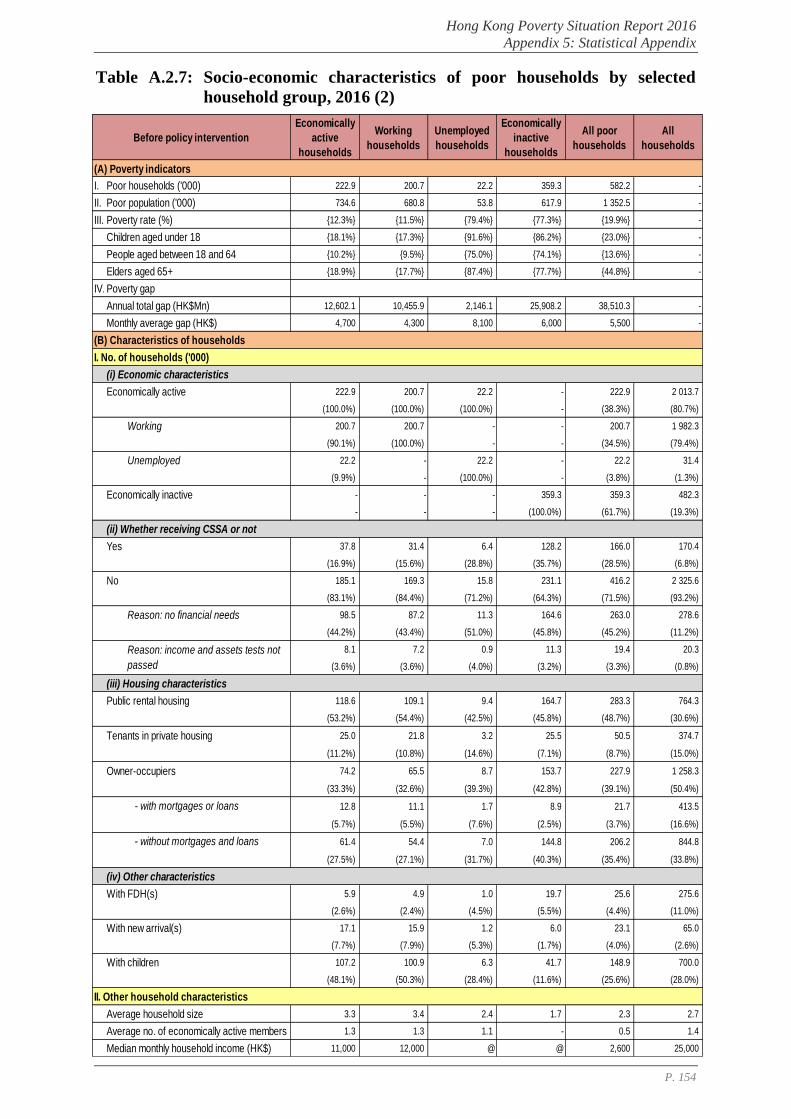
Hong Kong Poverty Situation Report 2016
Appendix 5: Statistical Appendix
P. 154
Table A.2.7: Socio-economic characteristics of poor households by selected
household group, 2016 (2)
Economically
active
households
Working
households
Unemployed
households
Economically
inactive
households
All poor
households
All
households
(A) Poverty indicators
I. Poor households ('000) 222.9 200.7 22.2 359.3 582.2 -
II. Poor population ('000) 734.6 680.8 53.8 617.9 1 352.5 -
III. Poverty rate (%) {12.3%} {11.5%} {79.4%} {77.3%} {19.9%} -
Children aged under 18 {18.1%} {17.3%} {91.6%} {86.2%} {23.0%} -
People aged between 18 and 64 {10.2%} {9.5%} {75.0%} {74.1%} {13.6%} -
Elders aged 65+ {18.9%} {17.7%} {87.4%} {77.7%} {44.8%} -
IV. Poverty gap
Annual total gap (HK$Mn) 12,602.1 10,455.9 2,146.1 25,908.2 38,510.3 -
Monthly average gap (HK$) 4,700 4,300 8,100 6,000 5,500 -
(B) Characteristics of households
I. No. of households ('000)
(i) Economic characteristics
Economically active 222.9 200.7 22.2 - 222.9 2 013.7
(100.0%) (100.0%) (100.0%) - (38.3%) (80.7%)
Working 200.7 200.7 - - 200.7 1 982.3
(90.1%) (100.0%) - - (34.5%) (79.4%)
Unemployed 22.2 - 22.2 - 22.2 31.4
(9.9%) - (100.0%) - (3.8%) (1.3%)
Economically inactive - - - 359.3 359.3 482.3
- - - (100.0%) (61.7%) (19.3%)
(ii) Whether receiving CSSA or not
Yes 37.8 31.4 6.4 128.2 166.0 170.4
(16.9%) (15.6%) (28.8%) (35.7%) (28.5%) (6.8%)
No 185.1 169.3 15.8 231.1 416.2 2 325.6
(83.1%) (84.4%) (71.2%) (64.3%) (71.5%) (93.2%)
Reason: no financial needs 98.5 87.2 11.3 164.6 263.0 278.6
(44.2%) (43.4%) (51.0%) (45.8%) (45.2%) (11.2%)
8.1 7.2 0.9 11.3 19.4 20.3
(3.6%) (3.6%) (4.0%) (3.2%) (3.3%) (0.8%)
(iii) Housing characteristics
Public rental housing 118.6 109.1 9.4 164.7 283.3 764.3
(53.2%) (54.4%) (42.5%) (45.8%) (48.7%) (30.6%)
Tenants in private housing 25.0 21.8 3.2 25.5 50.5 374.7
(11.2%) (10.8%) (14.6%) (7.1%) (8.7%) (15.0%)
Owner-occupiers 74.2 65.5 8.7 153.7 227.9 1 258.3
(33.3%) (32.6%) (39.3%) (42.8%) (39.1%) (50.4%)
- with mortgages or loans 12.8 11.1 1.7 8.9 21.7 413.5
(5.7%) (5.5%) (7.6%) (2.5%) (3.7%) (16.6%)
- without mortgages and loans 61.4 54.4 7.0 144.8 206.2 844.8
(27.5%) (27.1%) (31.7%) (40.3%) (35.4%) (33.8%)
(iv) Other characteristics
With FDH(s) 5.9 4.9 1.0 19.7 25.6 275.6
(2.6%) (2.4%) (4.5%) (5.5%) (4.4%) (11.0%)
With new arrival(s) 17.1 15.9 1.2 6.0 23.1 65.0
(7.7%) (7.9%) (5.3%) (1.7%) (4.0%) (2.6%)
With children 107.2 100.9 6.3 41.7 148.9 700.0
(48.1%) (50.3%) (28.4%) (11.6%) (25.6%) (28.0%)
II. Other household characteristics
Average household size 3.3 3.4 2.4 1.7 2.3 2.7
Average no. of economically active members 1.3 1.3 1.1 - 0.5 1.4
Median monthly household income (HK$) 11,000 12,000 @ @ 2,600 25,000
Before policy intervention
Reason: income and assets tests not
passed
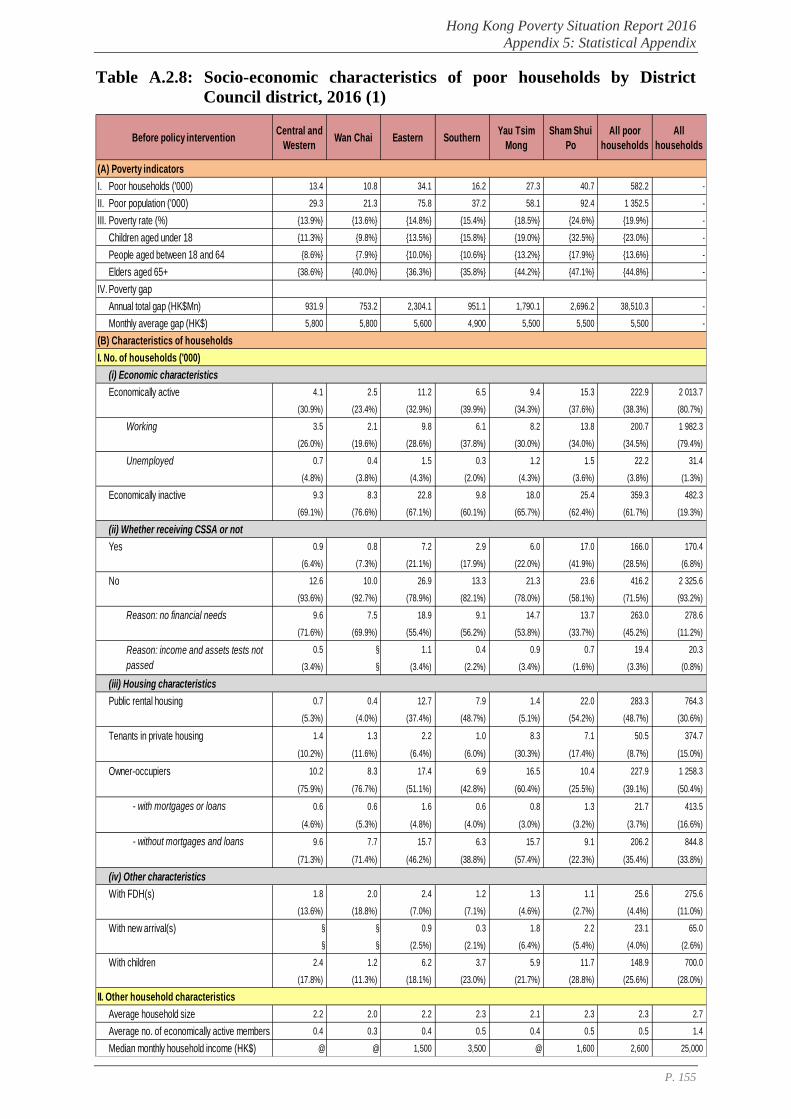
Hong Kong Poverty Situation Report 2016
Appendix 5: Statistical Appendix
P. 155
Table A.2.8: Socio-economic characteristics of poor households by District
Council district, 2016 (1)
Central and
WesternWan Chai Eastern Southern
Yau Tsim
Mong
Sham Shui
Po
All poor
households
All
households
(A) Poverty indicators
I. Poor households ('000) 13.4 10.8 34.1 16.2 27.3 40.7 582.2 -
II. Poor population ('000) 29.3 21.3 75.8 37.2 58.1 92.4 1 352.5 -
III. Poverty rate (%) {13.9%} {13.6%} {14.8%} {15.4%} {18.5%} {24.6%} {19.9%} -
Children aged under 18 {11.3%} {9.8%} {13.5%} {15.8%} {19.0%} {32.5%} {23.0%} -
People aged between 18 and 64 {8.6%} {7.9%} {10.0%} {10.6%} {13.2%} {17.9%} {13.6%} -
Elders aged 65+ {38.6%} {40.0%} {36.3%} {35.8%} {44.2%} {47.1%} {44.8%} -
IV. Poverty gap
Annual total gap (HK$Mn) 931.9 753.2 2,304.1 951.1 1,790.1 2,696.2 38,510.3 -
Monthly average gap (HK$) 5,800 5,800 5,600 4,900 5,500 5,500 5,500 -
(B) Characteristics of households
I. No. of households ('000)
(i) Economic characteristics
Economically active 4.1 2.5 11.2 6.5 9.4 15.3 222.9 2 013.7
(30.9%) (23.4%) (32.9%) (39.9%) (34.3%) (37.6%) (38.3%) (80.7%)
Working 3.5 2.1 9.8 6.1 8.2 13.8 200.7 1 982.3
(26.0%) (19.6%) (28.6%) (37.8%) (30.0%) (34.0%) (34.5%) (79.4%)
Unemployed 0.7 0.4 1.5 0.3 1.2 1.5 22.2 31.4
(4.8%) (3.8%) (4.3%) (2.0%) (4.3%) (3.6%) (3.8%) (1.3%)
Economically inactive 9.3 8.3 22.8 9.8 18.0 25.4 359.3 482.3
(69.1%) (76.6%) (67.1%) (60.1%) (65.7%) (62.4%) (61.7%) (19.3%)
(ii) Whether receiving CSSA or not
Yes 0.9 0.8 7.2 2.9 6.0 17.0 166.0 170.4
(6.4%) (7.3%) (21.1%) (17.9%) (22.0%) (41.9%) (28.5%) (6.8%)
No 12.6 10.0 26.9 13.3 21.3 23.6 416.2 2 325.6
(93.6%) (92.7%) (78.9%) (82.1%) (78.0%) (58.1%) (71.5%) (93.2%)
Reason: no financial needs 9.6 7.5 18.9 9.1 14.7 13.7 263.0 278.6
(71.6%) (69.9%) (55.4%) (56.2%) (53.8%) (33.7%) (45.2%) (11.2%)
0.5 § 1.1 0.4 0.9 0.7 19.4 20.3
(3.4%) § (3.4%) (2.2%) (3.4%) (1.6%) (3.3%) (0.8%)
(iii) Housing characteristics
Public rental housing 0.7 0.4 12.7 7.9 1.4 22.0 283.3 764.3
(5.3%) (4.0%) (37.4%) (48.7%) (5.1%) (54.2%) (48.7%) (30.6%)
Tenants in private housing 1.4 1.3 2.2 1.0 8.3 7.1 50.5 374.7
(10.2%) (11.6%) (6.4%) (6.0%) (30.3%) (17.4%) (8.7%) (15.0%)
Owner-occupiers 10.2 8.3 17.4 6.9 16.5 10.4 227.9 1 258.3
(75.9%) (76.7%) (51.1%) (42.8%) (60.4%) (25.5%) (39.1%) (50.4%)
- with mortgages or loans 0.6 0.6 1.6 0.6 0.8 1.3 21.7 413.5
(4.6%) (5.3%) (4.8%) (4.0%) (3.0%) (3.2%) (3.7%) (16.6%)
- without mortgages and loans 9.6 7.7 15.7 6.3 15.7 9.1 206.2 844.8
(71.3%) (71.4%) (46.2%) (38.8%) (57.4%) (22.3%) (35.4%) (33.8%)
(iv) Other characteristics
With FDH(s) 1.8 2.0 2.4 1.2 1.3 1.1 25.6 275.6
(13.6%) (18.8%) (7.0%) (7.1%) (4.6%) (2.7%) (4.4%) (11.0%)
With new arrival(s) § § 0.9 0.3 1.8 2.2 23.1 65.0
§ § (2.5%) (2.1%) (6.4%) (5.4%) (4.0%) (2.6%)
With children 2.4 1.2 6.2 3.7 5.9 11.7 148.9 700.0
(17.8%) (11.3%) (18.1%) (23.0%) (21.7%) (28.8%) (25.6%) (28.0%)
II. Other household characteristics
Average household size 2.2 2.0 2.2 2.3 2.1 2.3 2.3 2.7
Average no. of economically active members 0.4 0.3 0.4 0.5 0.4 0.5 0.5 1.4
Median monthly household income (HK$) @ @ 1,500 3,500 @ 1,600 2,600 25,000
Before policy intervention
Reason: income and assets tests not
passed
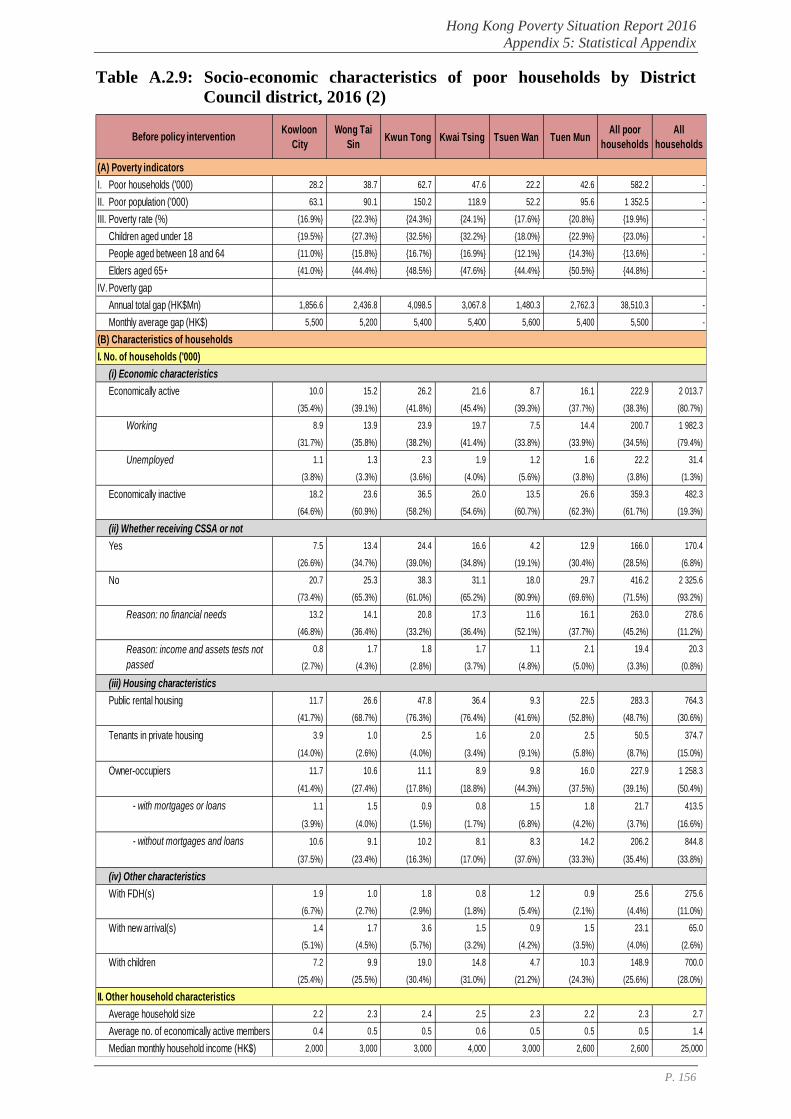
Hong Kong Poverty Situation Report 2016
Appendix 5: Statistical Appendix
P. 156
Table A.2.9: Socio-economic characteristics of poor households by District
Council district, 2016 (2)
Kowloon
City
Wong Tai
SinKwun Tong Kwai Tsing Tsuen Wan Tuen Mun
All poor
households
All
households
(A) Poverty indicators
I. Poor households ('000) 28.2 38.7 62.7 47.6 22.2 42.6 582.2 -
II. Poor population ('000) 63.1 90.1 150.2 118.9 52.2 95.6 1 352.5 -
III. Poverty rate (%) {16.9%} {22.3%} {24.3%} {24.1%} {17.6%} {20.8%} {19.9%} -
Children aged under 18 {19.5%} {27.3%} {32.5%} {32.2%} {18.0%} {22.9%} {23.0%} -
People aged between 18 and 64 {11.0%} {15.8%} {16.7%} {16.9%} {12.1%} {14.3%} {13.6%} -
Elders aged 65+ {41.0%} {44.4%} {48.5%} {47.6%} {44.4%} {50.5%} {44.8%} -
IV. Poverty gap
Annual total gap (HK$Mn) 1,856.6 2,436.8 4,098.5 3,067.8 1,480.3 2,762.3 38,510.3 -
Monthly average gap (HK$) 5,500 5,200 5,400 5,400 5,600 5,400 5,500 -
(B) Characteristics of households
I. No. of households ('000)
(i) Economic characteristics
Economically active 10.0 15.2 26.2 21.6 8.7 16.1 222.9 2 013.7
(35.4%) (39.1%) (41.8%) (45.4%) (39.3%) (37.7%) (38.3%) (80.7%)
Working 8.9 13.9 23.9 19.7 7.5 14.4 200.7 1 982.3
(31.7%) (35.8%) (38.2%) (41.4%) (33.8%) (33.9%) (34.5%) (79.4%)
Unemployed 1.1 1.3 2.3 1.9 1.2 1.6 22.2 31.4
(3.8%) (3.3%) (3.6%) (4.0%) (5.6%) (3.8%) (3.8%) (1.3%)
Economically inactive 18.2 23.6 36.5 26.0 13.5 26.6 359.3 482.3
(64.6%) (60.9%) (58.2%) (54.6%) (60.7%) (62.3%) (61.7%) (19.3%)
(ii) Whether receiving CSSA or not
Yes 7.5 13.4 24.4 16.6 4.2 12.9 166.0 170.4
(26.6%) (34.7%) (39.0%) (34.8%) (19.1%) (30.4%) (28.5%) (6.8%)
No 20.7 25.3 38.3 31.1 18.0 29.7 416.2 2 325.6
(73.4%) (65.3%) (61.0%) (65.2%) (80.9%) (69.6%) (71.5%) (93.2%)
Reason: no financial needs 13.2 14.1 20.8 17.3 11.6 16.1 263.0 278.6
(46.8%) (36.4%) (33.2%) (36.4%) (52.1%) (37.7%) (45.2%) (11.2%)
0.8 1.7 1.8 1.7 1.1 2.1 19.4 20.3
(2.7%) (4.3%) (2.8%) (3.7%) (4.8%) (5.0%) (3.3%) (0.8%)
(iii) Housing characteristics
Public rental housing 11.7 26.6 47.8 36.4 9.3 22.5 283.3 764.3
(41.7%) (68.7%) (76.3%) (76.4%) (41.6%) (52.8%) (48.7%) (30.6%)
Tenants in private housing 3.9 1.0 2.5 1.6 2.0 2.5 50.5 374.7
(14.0%) (2.6%) (4.0%) (3.4%) (9.1%) (5.8%) (8.7%) (15.0%)
Owner-occupiers 11.7 10.6 11.1 8.9 9.8 16.0 227.9 1 258.3
(41.4%) (27.4%) (17.8%) (18.8%) (44.3%) (37.5%) (39.1%) (50.4%)
- with mortgages or loans 1.1 1.5 0.9 0.8 1.5 1.8 21.7 413.5
(3.9%) (4.0%) (1.5%) (1.7%) (6.8%) (4.2%) (3.7%) (16.6%)
- without mortgages and loans 10.6 9.1 10.2 8.1 8.3 14.2 206.2 844.8
(37.5%) (23.4%) (16.3%) (17.0%) (37.6%) (33.3%) (35.4%) (33.8%)
(iv) Other characteristics
With FDH(s) 1.9 1.0 1.8 0.8 1.2 0.9 25.6 275.6
(6.7%) (2.7%) (2.9%) (1.8%) (5.4%) (2.1%) (4.4%) (11.0%)
With new arrival(s) 1.4 1.7 3.6 1.5 0.9 1.5 23.1 65.0
(5.1%) (4.5%) (5.7%) (3.2%) (4.2%) (3.5%) (4.0%) (2.6%)
With children 7.2 9.9 19.0 14.8 4.7 10.3 148.9 700.0
(25.4%) (25.5%) (30.4%) (31.0%) (21.2%) (24.3%) (25.6%) (28.0%)
II. Other household characteristics
Average household size 2.2 2.3 2.4 2.5 2.3 2.2 2.3 2.7
Average no. of economically active members 0.4 0.5 0.5 0.6 0.5 0.5 0.5 1.4
Median monthly household income (HK$) 2,000 3,000 3,000 4,000 3,000 2,600 2,600 25,000
Before policy intervention
Reason: income and assets tests not
passed

Hong Kong Poverty Situation Report 2016
Appendix 5: Statistical Appendix
P. 157
Table A.2.10: Socio-economic characteristics of poor households by District
Council district, 2016 (3)
Yuen Long North Tai Po Sha Tin Sai Kung IslandsAll poor
households
All
households
(A) Poverty indicators
I. Poor households ('000) 55.7 30.0 22.9 48.9 27.7 12.5 582.2 -
II. Poor population ('000) 133.6 68.9 55.4 116.5 65.3 28.4 1 352.5 -
III. Poverty rate (%) {23.0%} {23.3%} {19.7%} {19.0%} {15.3%} {20.1%} {19.9%} -
Children aged under 18 {29.8%} {26.5%} {20.8%} {20.7%} {14.2%} {19.0%} {23.0%} -
People aged between 18 and 64 {15.9%} {16.2%} {13.3%} {12.7%} {10.3%} {13.0%} {13.6%} -
Elders aged 65+ {48.8%} {52.3%} {48.9%} {44.4%} {39.6%} {51.3%} {44.8%} -
IV. Poverty gap
Annual total gap (HK$Mn) 3,826.6 2,074.1 1,585.4 3,213.0 1,815.4 866.8 38,510.3 -
Monthly average gap (HK$) 5,700 5,800 5,800 5,500 5,500 5,800 5,500 -
(B) Characteristics of households
I. No. of households ('000)
(i) Economic characteristics
Economically active 21.8 11.4 9.0 19.5 10.1 4.3 222.9 2 013.7
(39.1%) (38.1%) (39.2%) (39.9%) (36.3%) (34.7%) (38.3%) (80.7%)
Working 19.8 10.4 8.1 17.9 8.9 3.7 200.7 1 982.3
(35.5%) (34.8%) (35.2%) (36.7%) (32.3%) (29.2%) (34.5%) (79.4%)
Unemployed 2.0 1.0 0.9 1.6 1.1 0.7 22.2 31.4
(3.6%) (3.3%) (4.0%) (3.2%) (4.1%) (5.4%) (3.8%) (1.3%)
Economically inactive 33.9 18.5 13.9 29.4 17.6 8.2 359.3 482.3
(60.9%) (61.9%) (60.8%) (60.1%) (63.7%) (65.3%) (61.7%) (19.3%)
(ii) Whether receiving CSSA or not
Yes 17.5 8.5 4.8 12.0 5.8 3.4 166.0 170.4
(31.5%) (28.5%) (21.0%) (24.5%) (21.1%) (27.5%) (28.5%) (6.8%)
No 38.2 21.4 18.1 36.9 21.9 9.1 416.2 2 325.6
(68.5%) (71.5%) (79.0%) (75.5%) (78.9%) (72.5%) (71.5%) (93.2%)
Reason: no financial needs 23.7 15.5 11.9 23.3 15.4 6.6 263.0 278.6
(42.6%) (51.6%) (52.0%) (47.7%) (55.6%) (52.6%) (45.2%) (11.2%)
1.8 0.7 1.2 2.1 0.6 § 19.4 20.3
(3.2%) (2.4%) (5.1%) (4.4%) (2.0%) § (3.3%) (0.8%)
(iii) Housing characteristics
Public rental housing 24.2 10.9 7.4 25.4 11.2 4.6 283.3 764.3
(43.5%) (36.5%) (32.2%) (52.1%) (40.3%) (36.8%) (48.7%) (30.6%)
Tenants in private housing 6.9 3.5 1.5 1.4 0.9 1.6 50.5 374.7
(12.5%) (11.5%) (6.6%) (2.9%) (3.3%) (13.2%) (8.7%) (15.0%)
Owner-occupiers 22.2 14.0 13.1 21.0 14.4 5.3 227.9 1 258.3
(39.9%) (46.8%) (57.1%) (42.9%) (52.0%) (42.7%) (39.1%) (50.4%)
- with mortgages or loans 2.4 0.7 1.0 2.0 2.0 0.4 21.7 413.5
(4.3%) (2.2%) (4.3%) (4.0%) (7.3%) (3.5%) (3.7%) (16.6%)
- without mortgages and loans 19.9 13.4 12.1 19.0 12.4 4.9 206.2 844.8
(35.7%) (44.6%) (52.8%) (38.9%) (44.7%) (39.2%) (35.4%) (33.8%)
(iv) Other characteristics
With FDH(s) 2.2 1.4 0.8 1.8 1.4 0.7 25.6 275.6
(4.0%) (4.8%) (3.4%) (3.6%) (5.0%) (5.4%) (4.4%) (11.0%)
With new arrival(s) 2.5 1.2 0.7 1.5 0.8 § 23.1 65.0
(4.5%) (3.9%) (3.1%) (3.1%) (2.9%) § (4.0%) (2.6%)
With children 17.2 7.9 5.7 12.2 6.2 2.6 148.9 700.0
(30.9%) (26.4%) (25.1%) (24.9%) (22.4%) (20.6%) (25.6%) (28.0%)
II. Other household characteristics
Average household size 2.4 2.3 2.4 2.4 2.4 2.3 2.3 2.7
Average no. of economically active members 0.5 0.5 0.5 0.5 0.5 0.4 0.5 1.4
Median monthly household income (HK$) 3,000 1,200 3,000 3,000 3,000 @ 2,600 25,000
Before policy intervention
Reason: income and assets tests not
passed
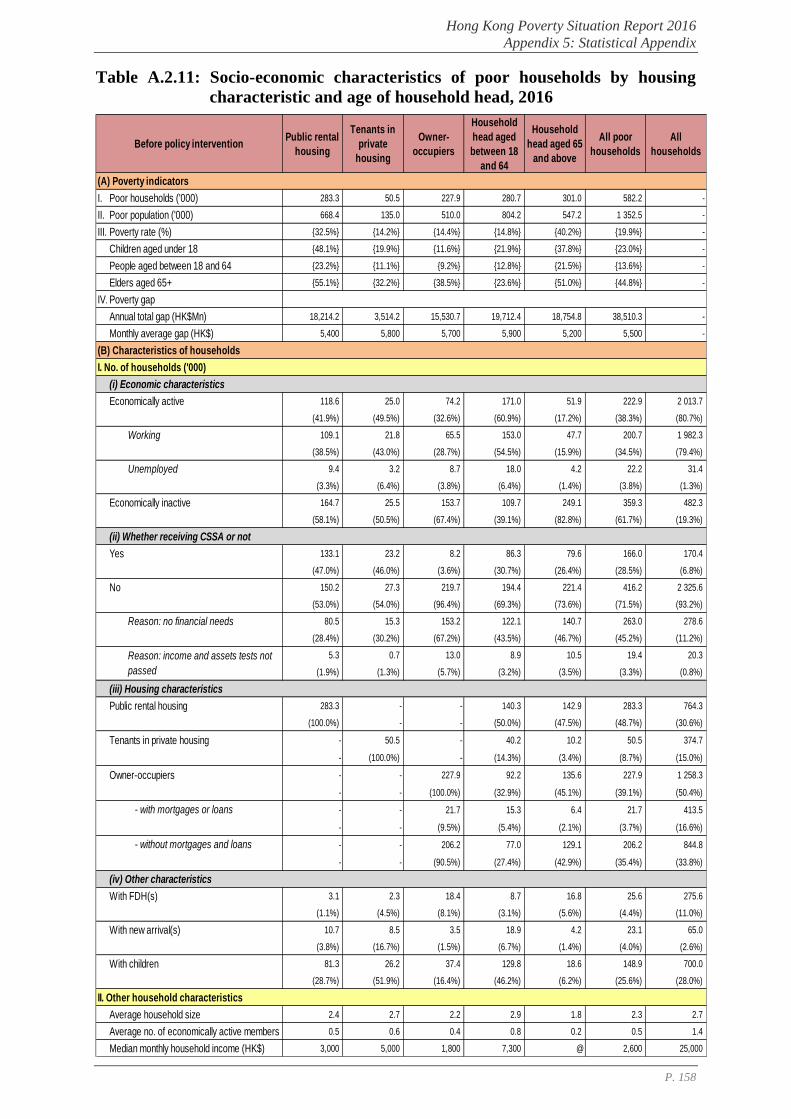
Hong Kong Poverty Situation Report 2016
Appendix 5: Statistical Appendix
P. 158
Table A.2.11: Socio-economic characteristics of poor households by housing
characteristic and age of household head, 2016
Public rental
housing
Tenants in
private
housing
Owner-
occupiers
Household
head aged
between 18
and 64
Household
head aged 65
and above
All poor
households
All
households
(A) Poverty indicators
I. Poor households ('000) 283.3 50.5 227.9 280.7 301.0 582.2 -
II. Poor population ('000) 668.4 135.0 510.0 804.2 547.2 1 352.5 -
III. Poverty rate (%) {32.5%} {14.2%} {14.4%} {14.8%} {40.2%} {19.9%} -
Children aged under 18 {48.1%} {19.9%} {11.6%} {21.9%} {37.8%} {23.0%} -
People aged between 18 and 64 {23.2%} {11.1%} {9.2%} {12.8%} {21.5%} {13.6%} -
Elders aged 65+ {55.1%} {32.2%} {38.5%} {23.6%} {51.0%} {44.8%} -
IV. Poverty gap
Annual total gap (HK$Mn) 18,214.2 3,514.2 15,530.7 19,712.4 18,754.8 38,510.3 -
Monthly average gap (HK$) 5,400 5,800 5,700 5,900 5,200 5,500 -
(B) Characteristics of households
I. No. of households ('000)
(i) Economic characteristics
Economically active 118.6 25.0 74.2 171.0 51.9 222.9 2 013.7
(41.9%) (49.5%) (32.6%) (60.9%) (17.2%) (38.3%) (80.7%)
Working 109.1 21.8 65.5 153.0 47.7 200.7 1 982.3
(38.5%) (43.0%) (28.7%) (54.5%) (15.9%) (34.5%) (79.4%)
Unemployed 9.4 3.2 8.7 18.0 4.2 22.2 31.4
(3.3%) (6.4%) (3.8%) (6.4%) (1.4%) (3.8%) (1.3%)
Economically inactive 164.7 25.5 153.7 109.7 249.1 359.3 482.3
(58.1%) (50.5%) (67.4%) (39.1%) (82.8%) (61.7%) (19.3%)
(ii) Whether receiving CSSA or not
Yes 133.1 23.2 8.2 86.3 79.6 166.0 170.4
(47.0%) (46.0%) (3.6%) (30.7%) (26.4%) (28.5%) (6.8%)
No 150.2 27.3 219.7 194.4 221.4 416.2 2 325.6
(53.0%) (54.0%) (96.4%) (69.3%) (73.6%) (71.5%) (93.2%)
Reason: no financial needs 80.5 15.3 153.2 122.1 140.7 263.0 278.6
(28.4%) (30.2%) (67.2%) (43.5%) (46.7%) (45.2%) (11.2%)
5.3 0.7 13.0 8.9 10.5 19.4 20.3
(1.9%) (1.3%) (5.7%) (3.2%) (3.5%) (3.3%) (0.8%)
(iii) Housing characteristics
Public rental housing 283.3 - - 140.3 142.9 283.3 764.3
(100.0%) - - (50.0%) (47.5%) (48.7%) (30.6%)
Tenants in private housing - 50.5 - 40.2 10.2 50.5 374.7
- (100.0%) - (14.3%) (3.4%) (8.7%) (15.0%)
Owner-occupiers - - 227.9 92.2 135.6 227.9 1 258.3
- - (100.0%) (32.9%) (45.1%) (39.1%) (50.4%)
- with mortgages or loans - - 21.7 15.3 6.4 21.7 413.5
- - (9.5%) (5.4%) (2.1%) (3.7%) (16.6%)
- without mortgages and loans - - 206.2 77.0 129.1 206.2 844.8
- - (90.5%) (27.4%) (42.9%) (35.4%) (33.8%)
(iv) Other characteristics
With FDH(s) 3.1 2.3 18.4 8.7 16.8 25.6 275.6
(1.1%) (4.5%) (8.1%) (3.1%) (5.6%) (4.4%) (11.0%)
With new arrival(s) 10.7 8.5 3.5 18.9 4.2 23.1 65.0
(3.8%) (16.7%) (1.5%) (6.7%) (1.4%) (4.0%) (2.6%)
With children 81.3 26.2 37.4 129.8 18.6 148.9 700.0
(28.7%) (51.9%) (16.4%) (46.2%) (6.2%) (25.6%) (28.0%)
II. Other household characteristics
Average household size 2.4 2.7 2.2 2.9 1.8 2.3 2.7
Average no. of economically active members 0.5 0.6 0.4 0.8 0.2 0.5 1.4
Median monthly household income (HK$) 3,000 5,000 1,800 7,300 @ 2,600 25,000
Before policy intervention
Reason: income and assets tests not
passed
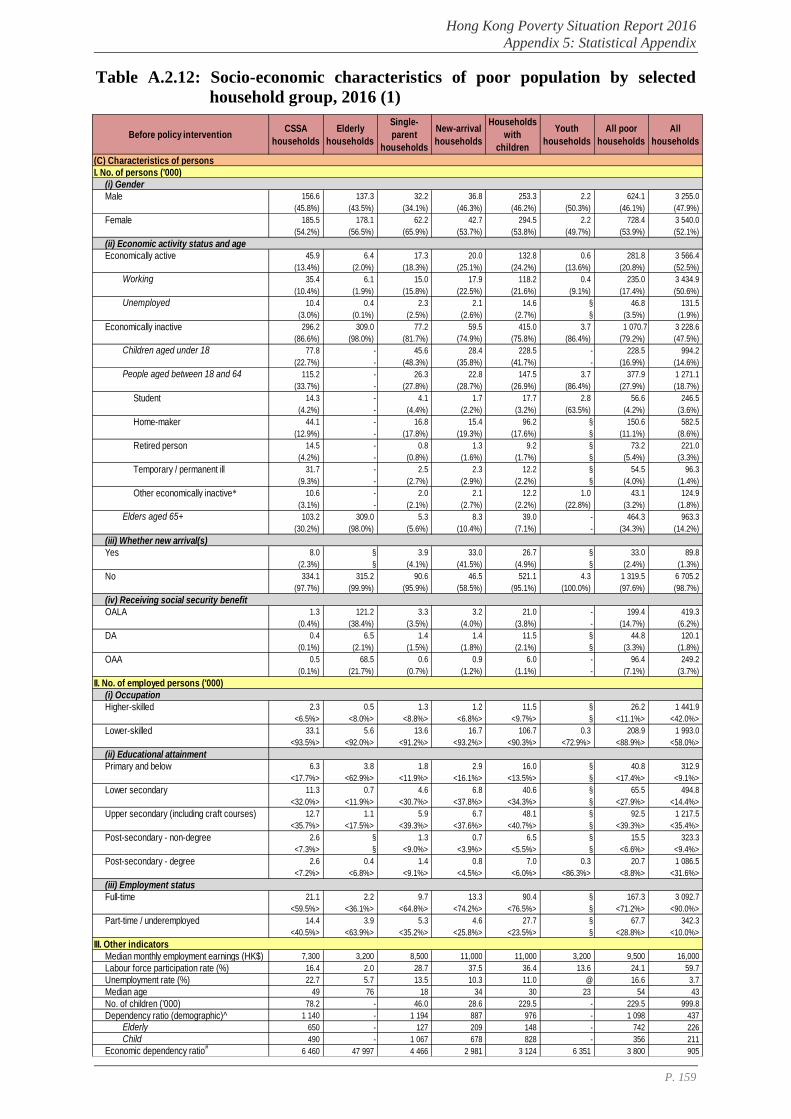
Hong Kong Poverty Situation Report 2016
Appendix 5: Statistical Appendix
P. 159
Table A.2.12: Socio-economic characteristics of poor population by selected
household group, 2016 (1)
CSSA
households
Elderly
households
Single-
parent
households
New-arrival
households
Households
with
children
Youth
households
All poor
households
All
households
(C) Characteristics of persons
I. No. of persons ('000)
(i) Gender
Male 156.6 137.3 32.2 36.8 253.3 2.2 624.1 3 255.0
(45.8%) (43.5%) (34.1%) (46.3%) (46.2%) (50.3%) (46.1%) (47.9%)
Female 185.5 178.1 62.2 42.7 294.5 2.2 728.4 3 540.0
(54.2%) (56.5%) (65.9%) (53.7%) (53.8%) (49.7%) (53.9%) (52.1%)
(ii) Economic activity status and age
Economically active 45.9 6.4 17.3 20.0 132.8 0.6 281.8 3 566.4
(13.4%) (2.0%) (18.3%) (25.1%) (24.2%) (13.6%) (20.8%) (52.5%)
Working 35.4 6.1 15.0 17.9 118.2 0.4 235.0 3 434.9
(10.4%) (1.9%) (15.8%) (22.5%) (21.6%) (9.1%) (17.4%) (50.6%)
Unemployed 10.4 0.4 2.3 2.1 14.6 § 46.8 131.5
(3.0%) (0.1%) (2.5%) (2.6%) (2.7%) § (3.5%) (1.9%)
Economically inactive 296.2 309.0 77.2 59.5 415.0 3.7 1 070.7 3 228.6
(86.6%) (98.0%) (81.7%) (74.9%) (75.8%) (86.4%) (79.2%) (47.5%)
Children aged under 18 77.8 - 45.6 28.4 228.5 - 228.5 994.2
(22.7%) - (48.3%) (35.8%) (41.7%) - (16.9%) (14.6%)
People aged between 18 and 64 115.2 - 26.3 22.8 147.5 3.7 377.9 1 271.1
(33.7%) - (27.8%) (28.7%) (26.9%) (86.4%) (27.9%) (18.7%)
Student 14.3 - 4.1 1.7 17.7 2.8 56.6 246.5
(4.2%) - (4.4%) (2.2%) (3.2%) (63.5%) (4.2%) (3.6%)
Home-maker 44.1 - 16.8 15.4 96.2 § 150.6 582.5
(12.9%) - (17.8%) (19.3%) (17.6%) § (11.1%) (8.6%)
Retired person 14.5 - 0.8 1.3 9.2 § 73.2 221.0
(4.2%) - (0.8%) (1.6%) (1.7%) § (5.4%) (3.3%)
Temporary / permanent ill 31.7 - 2.5 2.3 12.2 § 54.5 96.3
(9.3%) - (2.7%) (2.9%) (2.2%) § (4.0%) (1.4%)
Other economically inactive* 10.6 - 2.0 2.1 12.2 1.0 43.1 124.9
(3.1%) - (2.1%) (2.7%) (2.2%) (22.8%) (3.2%) (1.8%)
Elders aged 65+ 103.2 309.0 5.3 8.3 39.0 - 464.3 963.3
(30.2%) (98.0%) (5.6%) (10.4%) (7.1%) - (34.3%) (14.2%)
(iii) Whether new arrival(s)
Yes 8.0 § 3.9 33.0 26.7 § 33.0 89.8
(2.3%) § (4.1%) (41.5%) (4.9%) § (2.4%) (1.3%)
No 334.1 315.2 90.6 46.5 521.1 4.3 1 319.5 6 705.2
(97.7%) (99.9%) (95.9%) (58.5%) (95.1%) (100.0%) (97.6%) (98.7%)
(iv) Receiving social security benefit
OALA 1.3 121.2 3.3 3.2 21.0 - 199.4 419.3
(0.4%) (38.4%) (3.5%) (4.0%) (3.8%) - (14.7%) (6.2%)
DA 0.4 6.5 1.4 1.4 11.5 § 44.8 120.1
(0.1%) (2.1%) (1.5%) (1.8%) (2.1%) § (3.3%) (1.8%)
OAA 0.5 68.5 0.6 0.9 6.0 - 96.4 249.2
(0.1%) (21.7%) (0.7%) (1.2%) (1.1%) - (7.1%) (3.7%)
II. No. of employed persons ('000)
(i) Occupation
Higher-skilled 2.3 0.5 1.3 1.2 11.5 § 26.2 1 441.9
<6.5%> <8.0%> <8.8%> <6.8%> <9.7%> § <11.1%> <42.0%>
Lower-skilled 33.1 5.6 13.6 16.7 106.7 0.3 208.9 1 993.0
<93.5%> <92.0%> <91.2%> <93.2%> <90.3%> <72.9%> <88.9%> <58.0%>
(ii) Educational attainment
Primary and below 6.3 3.8 1.8 2.9 16.0 § 40.8 312.9
<17.7%> <62.9%> <11.9%> <16.1%> <13.5%> § <17.4%> <9.1%>
Lower secondary 11.3 0.7 4.6 6.8 40.6 § 65.5 494.8
<32.0%> <11.9%> <30.7%> <37.8%> <34.3%> § <27.9%> <14.4%>
Upper secondary (including craft courses) 12.7 1.1 5.9 6.7 48.1 § 92.5 1 217.5
<35.7%> <17.5%> <39.3%> <37.6%> <40.7%> § <39.3%> <35.4%>
Post-secondary - non-degree 2.6 § 1.3 0.7 6.5 § 15.5 323.3
<7.3%> § <9.0%> <3.9%> <5.5%> § <6.6%> <9.4%>
Post-secondary - degree 2.6 0.4 1.4 0.8 7.0 0.3 20.7 1 086.5
<7.2%> <6.8%> <9.1%> <4.5%> <6.0%> <86.3%> <8.8%> <31.6%>
(iii) Employment status
Full-time 21.1 2.2 9.7 13.3 90.4 § 167.3 3 092.7
<59.5%> <36.1%> <64.8%> <74.2%> <76.5%> § <71.2%> <90.0%>
Part-time / underemployed 14.4 3.9 5.3 4.6 27.7 § 67.7 342.3
<40.5%> <63.9%> <35.2%> <25.8%> <23.5%> § <28.8%> <10.0%>
III. Other indicators
Median monthly employment earnings (HK$) 7,300 3,200 8,500 11,000 11,000 3,200 9,500 16,000
Labour force participation rate (%) 16.4 2.0 28.7 37.5 36.4 13.6 24.1 59.7
Unemployment rate (%) 22.7 5.7 13.5 10.3 11.0 @ 16.6 3.7
Median age 49 76 18 34 30 23 54 43
No. of children ('000) 78.2 - 46.0 28.6 229.5 - 229.5 999.8
Dependency ratio (demographic)^ 1 140 - 1 194 887 976 - 1 098 437
Elderly 650 - 127 209 148 - 742 226
Child 490 - 1 067 678 828 - 356 211
Economic dependency ratio#
6 460 47 997 4 466 2 981 3 124 6 351 3 800 905
Before policy intervention
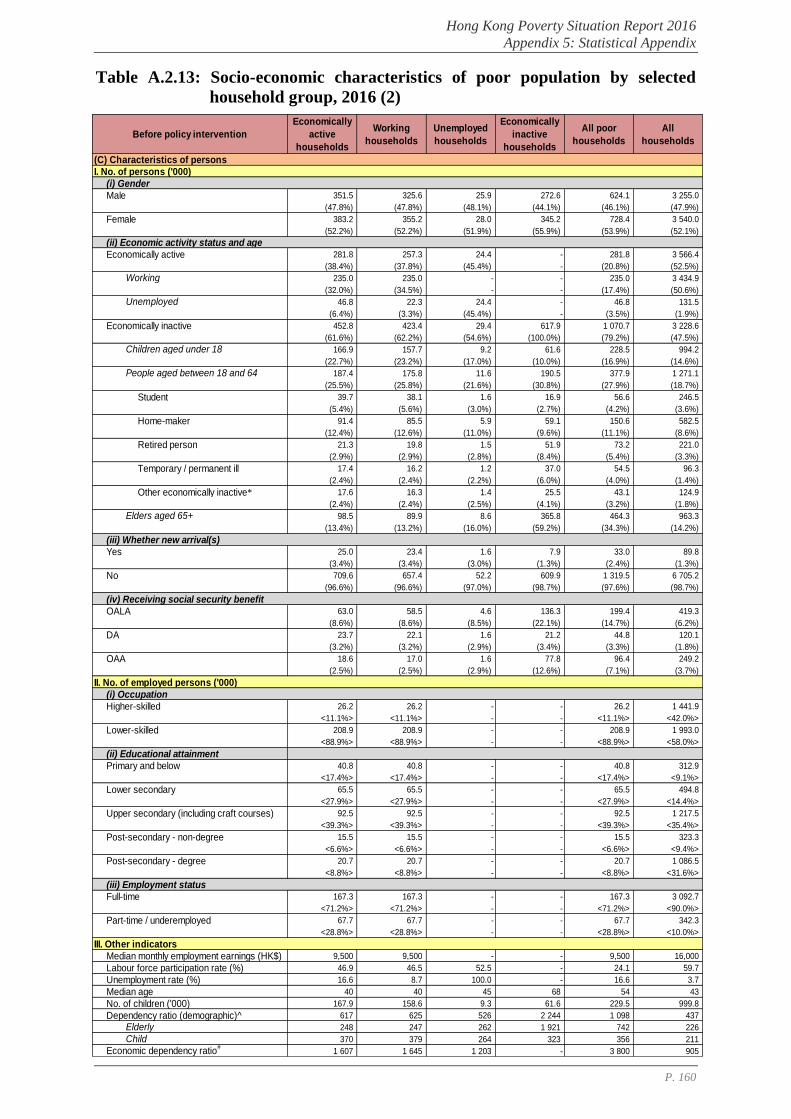
Hong Kong Poverty Situation Report 2016
Appendix 5: Statistical Appendix
P. 160
Table A.2.13: Socio-economic characteristics of poor population by selected
household group, 2016 (2)
Economically
active
households
Working
households
Unemployed
households
Economically
inactive
households
All poor
households
All
households
(C) Characteristics of persons
I. No. of persons ('000)
(i) Gender
Male 351.5 325.6 25.9 272.6 624.1 3 255.0
(47.8%) (47.8%) (48.1%) (44.1%) (46.1%) (47.9%)
Female 383.2 355.2 28.0 345.2 728.4 3 540.0
(52.2%) (52.2%) (51.9%) (55.9%) (53.9%) (52.1%)
(ii) Economic activity status and age
Economically active 281.8 257.3 24.4 - 281.8 3 566.4
(38.4%) (37.8%) (45.4%) - (20.8%) (52.5%)
Working 235.0 235.0 - - 235.0 3 434.9
(32.0%) (34.5%) - - (17.4%) (50.6%)
Unemployed 46.8 22.3 24.4 - 46.8 131.5
(6.4%) (3.3%) (45.4%) - (3.5%) (1.9%)
Economically inactive 452.8 423.4 29.4 617.9 1 070.7 3 228.6
(61.6%) (62.2%) (54.6%) (100.0%) (79.2%) (47.5%)
Children aged under 18 166.9 157.7 9.2 61.6 228.5 994.2
(22.7%) (23.2%) (17.0%) (10.0%) (16.9%) (14.6%)
People aged between 18 and 64 187.4 175.8 11.6 190.5 377.9 1 271.1
(25.5%) (25.8%) (21.6%) (30.8%) (27.9%) (18.7%)
Student 39.7 38.1 1.6 16.9 56.6 246.5
(5.4%) (5.6%) (3.0%) (2.7%) (4.2%) (3.6%)
Home-maker 91.4 85.5 5.9 59.1 150.6 582.5
(12.4%) (12.6%) (11.0%) (9.6%) (11.1%) (8.6%)
Retired person 21.3 19.8 1.5 51.9 73.2 221.0
(2.9%) (2.9%) (2.8%) (8.4%) (5.4%) (3.3%)
Temporary / permanent ill 17.4 16.2 1.2 37.0 54.5 96.3
(2.4%) (2.4%) (2.2%) (6.0%) (4.0%) (1.4%)
Other economically inactive* 17.6 16.3 1.4 25.5 43.1 124.9
(2.4%) (2.4%) (2.5%) (4.1%) (3.2%) (1.8%)
Elders aged 65+ 98.5 89.9 8.6 365.8 464.3 963.3
(13.4%) (13.2%) (16.0%) (59.2%) (34.3%) (14.2%)
(iii) Whether new arrival(s)
Yes 25.0 23.4 1.6 7.9 33.0 89.8
(3.4%) (3.4%) (3.0%) (1.3%) (2.4%) (1.3%)
No 709.6 657.4 52.2 609.9 1 319.5 6 705.2
(96.6%) (96.6%) (97.0%) (98.7%) (97.6%) (98.7%)
(iv) Receiving social security benefit
OALA 63.0 58.5 4.6 136.3 199.4 419.3
(8.6%) (8.6%) (8.5%) (22.1%) (14.7%) (6.2%)
DA 23.7 22.1 1.6 21.2 44.8 120.1
(3.2%) (3.2%) (2.9%) (3.4%) (3.3%) (1.8%)
OAA 18.6 17.0 1.6 77.8 96.4 249.2
(2.5%) (2.5%) (2.9%) (12.6%) (7.1%) (3.7%)
II. No. of employed persons ('000)
(i) Occupation
Higher-skilled 26.2 26.2 - - 26.2 1 441.9
<11.1%> <11.1%> - - <11.1%> <42.0%>
Lower-skilled 208.9 208.9 - - 208.9 1 993.0
<88.9%> <88.9%> - - <88.9%> <58.0%>
(ii) Educational attainment
Primary and below 40.8 40.8 - - 40.8 312.9
<17.4%> <17.4%> - - <17.4%> <9.1%>
Lower secondary 65.5 65.5 - - 65.5 494.8
<27.9%> <27.9%> - - <27.9%> <14.4%>
Upper secondary (including craft courses) 92.5 92.5 - - 92.5 1 217.5
<39.3%> <39.3%> - - <39.3%> <35.4%>
Post-secondary - non-degree 15.5 15.5 - - 15.5 323.3
<6.6%> <6.6%> - - <6.6%> <9.4%>
Post-secondary - degree 20.7 20.7 - - 20.7 1 086.5
<8.8%> <8.8%> - - <8.8%> <31.6%>
(iii) Employment status
Full-time 167.3 167.3 - - 167.3 3 092.7
<71.2%> <71.2%> - - <71.2%> <90.0%>
Part-time / underemployed 67.7 67.7 - - 67.7 342.3
<28.8%> <28.8%> - - <28.8%> <10.0%>
III. Other indicators
Median monthly employment earnings (HK$) 9,500 9,500 - - 9,500 16,000
Labour force participation rate (%) 46.9 46.5 52.5 - 24.1 59.7
Unemployment rate (%) 16.6 8.7 100.0 - 16.6 3.7
Median age 40 40 45 68 54 43
No. of children ('000) 167.9 158.6 9.3 61.6 229.5 999.8
Dependency ratio (demographic)^ 617 625 526 2 244 1 098 437
Elderly 248 247 262 1 921 742 226
Child 370 379 264 323 356 211
Economic dependency ratio#
1 607 1 645 1 203 - 3 800 905
Before policy intervention
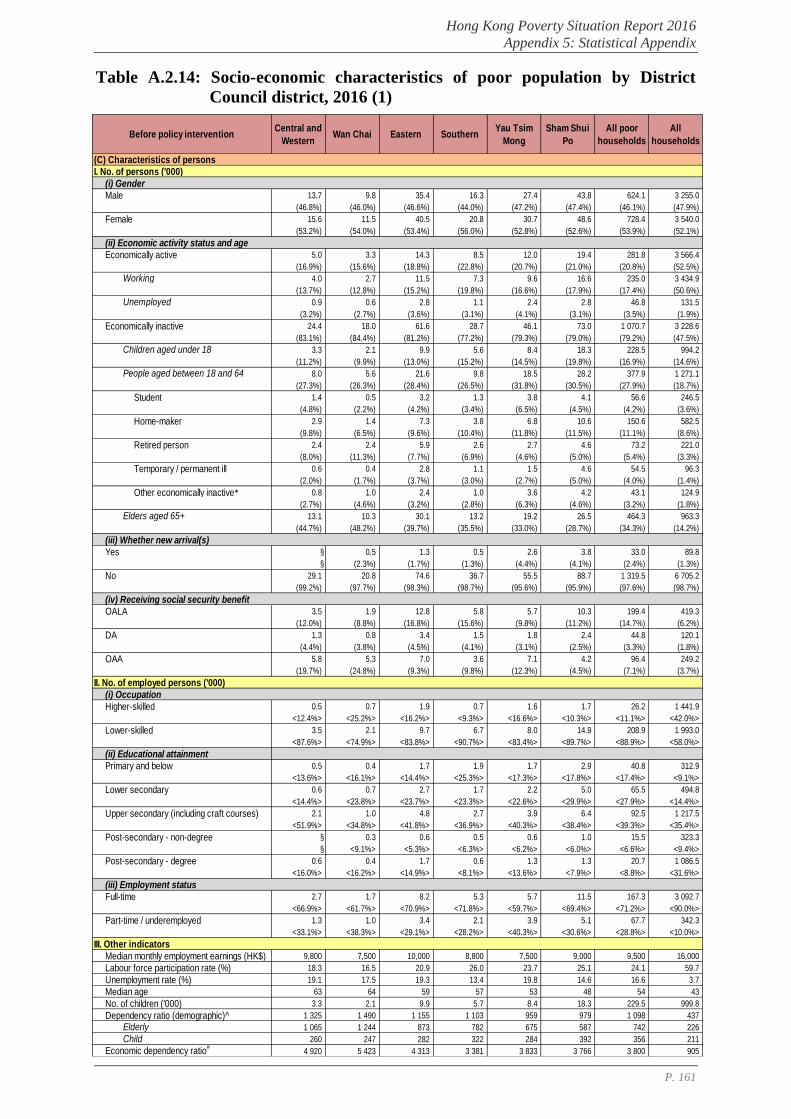
Hong Kong Poverty Situation Report 2016
Appendix 5: Statistical Appendix
P. 161
Table A.2.14: Socio-economic characteristics of poor population by District
Council district, 2016 (1)
Central and
WesternWan Chai Eastern Southern
Yau Tsim
Mong
Sham Shui
Po
All poor
households
All
households
(C) Characteristics of persons
I. No. of persons ('000)
(i) Gender
Male 13.7 9.8 35.4 16.3 27.4 43.8 624.1 3 255.0
(46.8%) (46.0%) (46.6%) (44.0%) (47.2%) (47.4%) (46.1%) (47.9%)
Female 15.6 11.5 40.5 20.8 30.7 48.6 728.4 3 540.0
(53.2%) (54.0%) (53.4%) (56.0%) (52.8%) (52.6%) (53.9%) (52.1%)
(ii) Economic activity status and age
Economically active 5.0 3.3 14.3 8.5 12.0 19.4 281.8 3 566.4
(16.9%) (15.6%) (18.8%) (22.8%) (20.7%) (21.0%) (20.8%) (52.5%)
Working 4.0 2.7 11.5 7.3 9.6 16.6 235.0 3 434.9
(13.7%) (12.8%) (15.2%) (19.8%) (16.6%) (17.9%) (17.4%) (50.6%)
Unemployed 0.9 0.6 2.8 1.1 2.4 2.8 46.8 131.5
(3.2%) (2.7%) (3.6%) (3.1%) (4.1%) (3.1%) (3.5%) (1.9%)
Economically inactive 24.4 18.0 61.6 28.7 46.1 73.0 1 070.7 3 228.6
(83.1%) (84.4%) (81.2%) (77.2%) (79.3%) (79.0%) (79.2%) (47.5%)
Children aged under 18 3.3 2.1 9.9 5.6 8.4 18.3 228.5 994.2
(11.2%) (9.9%) (13.0%) (15.2%) (14.5%) (19.8%) (16.9%) (14.6%)
People aged between 18 and 64 8.0 5.6 21.6 9.8 18.5 28.2 377.9 1 271.1
(27.3%) (26.3%) (28.4%) (26.5%) (31.8%) (30.5%) (27.9%) (18.7%)
Student 1.4 0.5 3.2 1.3 3.8 4.1 56.6 246.5
(4.8%) (2.2%) (4.2%) (3.4%) (6.5%) (4.5%) (4.2%) (3.6%)
Home-maker 2.9 1.4 7.3 3.8 6.8 10.6 150.6 582.5
(9.8%) (6.5%) (9.6%) (10.4%) (11.8%) (11.5%) (11.1%) (8.6%)
Retired person 2.4 2.4 5.9 2.6 2.7 4.6 73.2 221.0
(8.0%) (11.3%) (7.7%) (6.9%) (4.6%) (5.0%) (5.4%) (3.3%)
Temporary / permanent ill 0.6 0.4 2.8 1.1 1.5 4.6 54.5 96.3
(2.0%) (1.7%) (3.7%) (3.0%) (2.7%) (5.0%) (4.0%) (1.4%)
Other economically inactive* 0.8 1.0 2.4 1.0 3.6 4.2 43.1 124.9
(2.7%) (4.6%) (3.2%) (2.8%) (6.3%) (4.6%) (3.2%) (1.8%)
Elders aged 65+ 13.1 10.3 30.1 13.2 19.2 26.5 464.3 963.3
(44.7%) (48.2%) (39.7%) (35.5%) (33.0%) (28.7%) (34.3%) (14.2%)
(iii) Whether new arrival(s)
Yes § 0.5 1.3 0.5 2.6 3.8 33.0 89.8
§ (2.3%) (1.7%) (1.3%) (4.4%) (4.1%) (2.4%) (1.3%)
No 29.1 20.8 74.6 36.7 55.5 88.7 1 319.5 6 705.2
(99.2%) (97.7%) (98.3%) (98.7%) (95.6%) (95.9%) (97.6%) (98.7%)
(iv) Receiving social security benefit
OALA 3.5 1.9 12.8 5.8 5.7 10.3 199.4 419.3
(12.0%) (8.8%) (16.8%) (15.6%) (9.8%) (11.2%) (14.7%) (6.2%)
DA 1.3 0.8 3.4 1.5 1.8 2.4 44.8 120.1
(4.4%) (3.8%) (4.5%) (4.1%) (3.1%) (2.5%) (3.3%) (1.8%)
OAA 5.8 5.3 7.0 3.6 7.1 4.2 96.4 249.2
(19.7%) (24.8%) (9.3%) (9.8%) (12.3%) (4.5%) (7.1%) (3.7%)
II. No. of employed persons ('000)
(i) Occupation
Higher-skilled 0.5 0.7 1.9 0.7 1.6 1.7 26.2 1 441.9
<12.4%> <25.2%> <16.2%> <9.3%> <16.6%> <10.3%> <11.1%> <42.0%>
Lower-skilled 3.5 2.1 9.7 6.7 8.0 14.9 208.9 1 993.0
<87.6%> <74.9%> <83.8%> <90.7%> <83.4%> <89.7%> <88.9%> <58.0%>
(ii) Educational attainment
Primary and below 0.5 0.4 1.7 1.9 1.7 2.9 40.8 312.9
<13.6%> <16.1%> <14.4%> <25.3%> <17.3%> <17.8%> <17.4%> <9.1%>
Lower secondary 0.6 0.7 2.7 1.7 2.2 5.0 65.5 494.8
<14.4%> <23.8%> <23.7%> <23.3%> <22.6%> <29.9%> <27.9%> <14.4%>
Upper secondary (including craft courses) 2.1 1.0 4.8 2.7 3.9 6.4 92.5 1 217.5
<51.9%> <34.8%> <41.8%> <36.9%> <40.3%> <38.4%> <39.3%> <35.4%>
Post-secondary - non-degree § 0.3 0.6 0.5 0.6 1.0 15.5 323.3
§ <9.1%> <5.3%> <6.3%> <6.2%> <6.0%> <6.6%> <9.4%>
Post-secondary - degree 0.6 0.4 1.7 0.6 1.3 1.3 20.7 1 086.5
<16.0%> <16.2%> <14.9%> <8.1%> <13.6%> <7.9%> <8.8%> <31.6%>
(iii) Employment status
Full-time 2.7 1.7 8.2 5.3 5.7 11.5 167.3 3 092.7
<66.9%> <61.7%> <70.9%> <71.8%> <59.7%> <69.4%> <71.2%> <90.0%>
Part-time / underemployed 1.3 1.0 3.4 2.1 3.9 5.1 67.7 342.3
<33.1%> <38.3%> <29.1%> <28.2%> <40.3%> <30.6%> <28.8%> <10.0%>
III. Other indicators
Median monthly employment earnings (HK$) 9,800 7,500 10,000 8,800 7,500 9,000 9,500 16,000
Labour force participation rate (%) 18.3 16.5 20.9 26.0 23.7 25.1 24.1 59.7
Unemployment rate (%) 19.1 17.5 19.3 13.4 19.8 14.6 16.6 3.7
Median age 63 64 59 57 53 48 54 43
No. of children ('000) 3.3 2.1 9.9 5.7 8.4 18.3 229.5 999.8
Dependency ratio (demographic)^ 1 325 1 490 1 155 1 103 959 979 1 098 437
Elderly 1 065 1 244 873 782 675 587 742 226
Child 260 247 282 322 284 392 356 211
Economic dependency ratio#
4 920 5 423 4 313 3 381 3 833 3 766 3 800 905
Before policy intervention
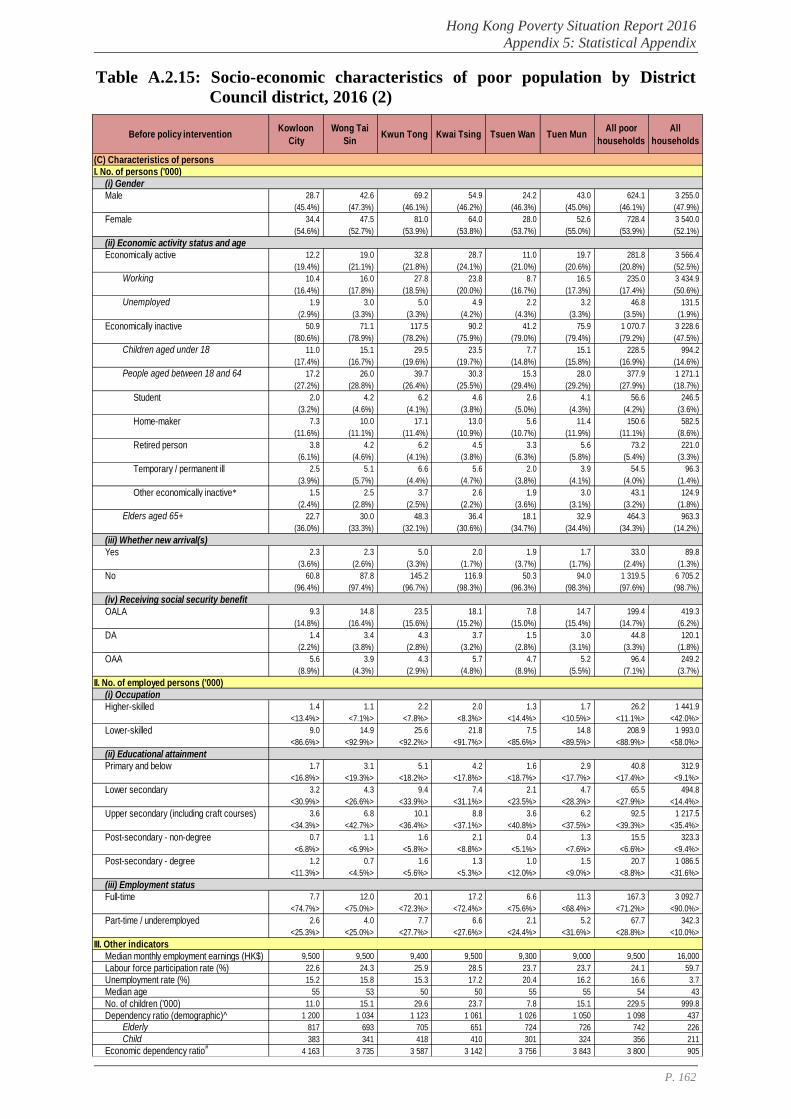
Hong Kong Poverty Situation Report 2016
Appendix 5: Statistical Appendix
P. 162
Table A.2.15: Socio-economic characteristics of poor population by District
Council district, 2016 (2)
Kowloon
City
Wong Tai
SinKwun Tong Kwai Tsing Tsuen Wan Tuen Mun
All poor
households
All
households
(C) Characteristics of persons
I. No. of persons ('000)
(i) Gender
Male 28.7 42.6 69.2 54.9 24.2 43.0 624.1 3 255.0
(45.4%) (47.3%) (46.1%) (46.2%) (46.3%) (45.0%) (46.1%) (47.9%)
Female 34.4 47.5 81.0 64.0 28.0 52.6 728.4 3 540.0
(54.6%) (52.7%) (53.9%) (53.8%) (53.7%) (55.0%) (53.9%) (52.1%)
(ii) Economic activity status and age
Economically active 12.2 19.0 32.8 28.7 11.0 19.7 281.8 3 566.4
(19.4%) (21.1%) (21.8%) (24.1%) (21.0%) (20.6%) (20.8%) (52.5%)
Working 10.4 16.0 27.8 23.8 8.7 16.5 235.0 3 434.9
(16.4%) (17.8%) (18.5%) (20.0%) (16.7%) (17.3%) (17.4%) (50.6%)
Unemployed 1.9 3.0 5.0 4.9 2.2 3.2 46.8 131.5
(2.9%) (3.3%) (3.3%) (4.2%) (4.3%) (3.3%) (3.5%) (1.9%)
Economically inactive 50.9 71.1 117.5 90.2 41.2 75.9 1 070.7 3 228.6
(80.6%) (78.9%) (78.2%) (75.9%) (79.0%) (79.4%) (79.2%) (47.5%)
Children aged under 18 11.0 15.1 29.5 23.5 7.7 15.1 228.5 994.2
(17.4%) (16.7%) (19.6%) (19.7%) (14.8%) (15.8%) (16.9%) (14.6%)
People aged between 18 and 64 17.2 26.0 39.7 30.3 15.3 28.0 377.9 1 271.1
(27.2%) (28.8%) (26.4%) (25.5%) (29.4%) (29.2%) (27.9%) (18.7%)
Student 2.0 4.2 6.2 4.6 2.6 4.1 56.6 246.5
(3.2%) (4.6%) (4.1%) (3.8%) (5.0%) (4.3%) (4.2%) (3.6%)
Home-maker 7.3 10.0 17.1 13.0 5.6 11.4 150.6 582.5
(11.6%) (11.1%) (11.4%) (10.9%) (10.7%) (11.9%) (11.1%) (8.6%)
Retired person 3.8 4.2 6.2 4.5 3.3 5.6 73.2 221.0
(6.1%) (4.6%) (4.1%) (3.8%) (6.3%) (5.8%) (5.4%) (3.3%)
Temporary / permanent ill 2.5 5.1 6.6 5.6 2.0 3.9 54.5 96.3
(3.9%) (5.7%) (4.4%) (4.7%) (3.8%) (4.1%) (4.0%) (1.4%)
Other economically inactive* 1.5 2.5 3.7 2.6 1.9 3.0 43.1 124.9
(2.4%) (2.8%) (2.5%) (2.2%) (3.6%) (3.1%) (3.2%) (1.8%)
Elders aged 65+ 22.7 30.0 48.3 36.4 18.1 32.9 464.3 963.3
(36.0%) (33.3%) (32.1%) (30.6%) (34.7%) (34.4%) (34.3%) (14.2%)
(iii) Whether new arrival(s)
Yes 2.3 2.3 5.0 2.0 1.9 1.7 33.0 89.8
(3.6%) (2.6%) (3.3%) (1.7%) (3.7%) (1.7%) (2.4%) (1.3%)
No 60.8 87.8 145.2 116.9 50.3 94.0 1 319.5 6 705.2
(96.4%) (97.4%) (96.7%) (98.3%) (96.3%) (98.3%) (97.6%) (98.7%)
(iv) Receiving social security benefit
OALA 9.3 14.8 23.5 18.1 7.8 14.7 199.4 419.3
(14.8%) (16.4%) (15.6%) (15.2%) (15.0%) (15.4%) (14.7%) (6.2%)
DA 1.4 3.4 4.3 3.7 1.5 3.0 44.8 120.1
(2.2%) (3.8%) (2.8%) (3.2%) (2.8%) (3.1%) (3.3%) (1.8%)
OAA 5.6 3.9 4.3 5.7 4.7 5.2 96.4 249.2
(8.9%) (4.3%) (2.9%) (4.8%) (8.9%) (5.5%) (7.1%) (3.7%)
II. No. of employed persons ('000)
(i) Occupation
Higher-skilled 1.4 1.1 2.2 2.0 1.3 1.7 26.2 1 441.9
<13.4%> <7.1%> <7.8%> <8.3%> <14.4%> <10.5%> <11.1%> <42.0%>
Lower-skilled 9.0 14.9 25.6 21.8 7.5 14.8 208.9 1 993.0
<86.6%> <92.9%> <92.2%> <91.7%> <85.6%> <89.5%> <88.9%> <58.0%>
(ii) Educational attainment
Primary and below 1.7 3.1 5.1 4.2 1.6 2.9 40.8 312.9
<16.8%> <19.3%> <18.2%> <17.8%> <18.7%> <17.7%> <17.4%> <9.1%>
Lower secondary 3.2 4.3 9.4 7.4 2.1 4.7 65.5 494.8
<30.9%> <26.6%> <33.9%> <31.1%> <23.5%> <28.3%> <27.9%> <14.4%>
Upper secondary (including craft courses) 3.6 6.8 10.1 8.8 3.6 6.2 92.5 1 217.5
<34.3%> <42.7%> <36.4%> <37.1%> <40.8%> <37.5%> <39.3%> <35.4%>
Post-secondary - non-degree 0.7 1.1 1.6 2.1 0.4 1.3 15.5 323.3
<6.8%> <6.9%> <5.8%> <8.8%> <5.1%> <7.6%> <6.6%> <9.4%>
Post-secondary - degree 1.2 0.7 1.6 1.3 1.0 1.5 20.7 1 086.5
<11.3%> <4.5%> <5.6%> <5.3%> <12.0%> <9.0%> <8.8%> <31.6%>
(iii) Employment status
Full-time 7.7 12.0 20.1 17.2 6.6 11.3 167.3 3 092.7
<74.7%> <75.0%> <72.3%> <72.4%> <75.6%> <68.4%> <71.2%> <90.0%>
Part-time / underemployed 2.6 4.0 7.7 6.6 2.1 5.2 67.7 342.3
<25.3%> <25.0%> <27.7%> <27.6%> <24.4%> <31.6%> <28.8%> <10.0%>
III. Other indicators
Median monthly employment earnings (HK$) 9,500 9,500 9,400 9,500 9,300 9,000 9,500 16,000
Labour force participation rate (%) 22.6 24.3 25.9 28.5 23.7 23.7 24.1 59.7
Unemployment rate (%) 15.2 15.8 15.3 17.2 20.4 16.2 16.6 3.7
Median age 55 53 50 50 55 55 54 43
No. of children ('000) 11.0 15.1 29.6 23.7 7.8 15.1 229.5 999.8
Dependency ratio (demographic)^ 1 200 1 034 1 123 1 061 1 026 1 050 1 098 437
Elderly 817 693 705 651 724 726 742 226
Child 383 341 418 410 301 324 356 211
Economic dependency ratio#
4 163 3 735 3 587 3 142 3 756 3 843 3 800 905
Before policy intervention
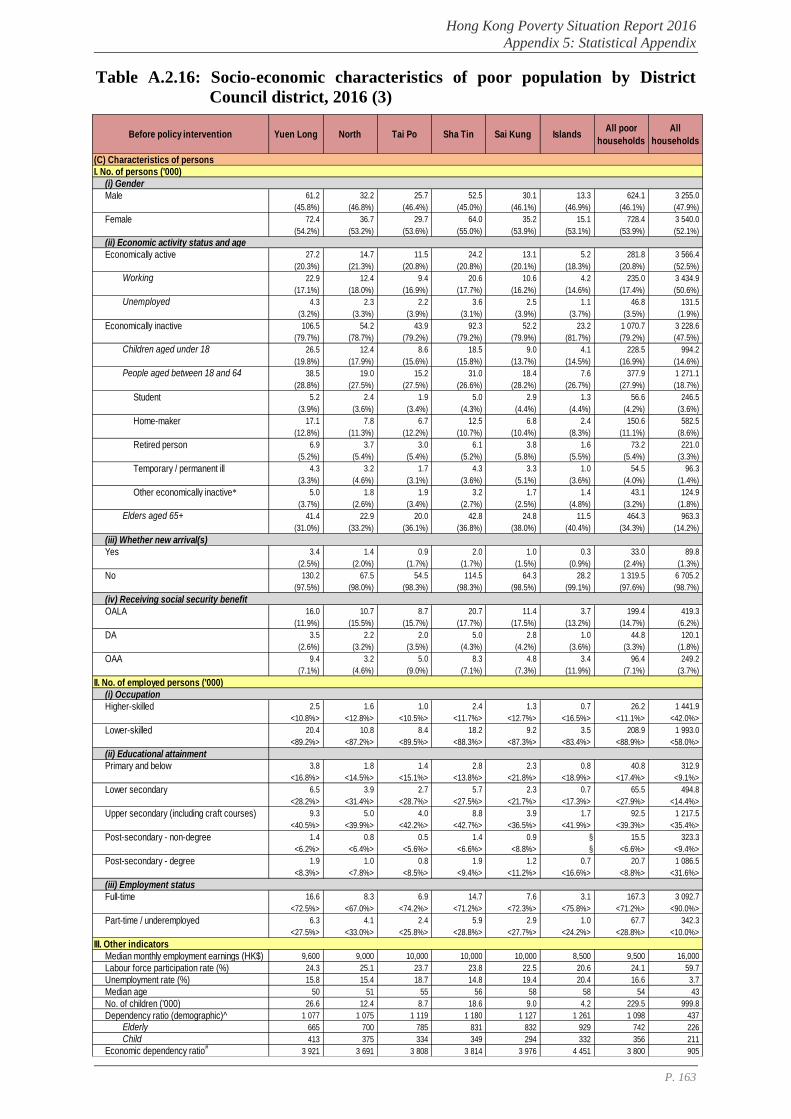
Hong Kong Poverty Situation Report 2016
Appendix 5: Statistical Appendix
P. 163
Table A.2.16: Socio-economic characteristics of poor population by District
Council district, 2016 (3)
Yuen Long North Tai Po Sha Tin Sai Kung IslandsAll poor
households
All
households
(C) Characteristics of persons
I. No. of persons ('000)
(i) Gender
Male 61.2 32.2 25.7 52.5 30.1 13.3 624.1 3 255.0
(45.8%) (46.8%) (46.4%) (45.0%) (46.1%) (46.9%) (46.1%) (47.9%)
Female 72.4 36.7 29.7 64.0 35.2 15.1 728.4 3 540.0
(54.2%) (53.2%) (53.6%) (55.0%) (53.9%) (53.1%) (53.9%) (52.1%)
(ii) Economic activity status and age
Economically active 27.2 14.7 11.5 24.2 13.1 5.2 281.8 3 566.4
(20.3%) (21.3%) (20.8%) (20.8%) (20.1%) (18.3%) (20.8%) (52.5%)
Working 22.9 12.4 9.4 20.6 10.6 4.2 235.0 3 434.9
(17.1%) (18.0%) (16.9%) (17.7%) (16.2%) (14.6%) (17.4%) (50.6%)
Unemployed 4.3 2.3 2.2 3.6 2.5 1.1 46.8 131.5
(3.2%) (3.3%) (3.9%) (3.1%) (3.9%) (3.7%) (3.5%) (1.9%)
Economically inactive 106.5 54.2 43.9 92.3 52.2 23.2 1 070.7 3 228.6
(79.7%) (78.7%) (79.2%) (79.2%) (79.9%) (81.7%) (79.2%) (47.5%)
Children aged under 18 26.5 12.4 8.6 18.5 9.0 4.1 228.5 994.2
(19.8%) (17.9%) (15.6%) (15.8%) (13.7%) (14.5%) (16.9%) (14.6%)
People aged between 18 and 64 38.5 19.0 15.2 31.0 18.4 7.6 377.9 1 271.1
(28.8%) (27.5%) (27.5%) (26.6%) (28.2%) (26.7%) (27.9%) (18.7%)
Student 5.2 2.4 1.9 5.0 2.9 1.3 56.6 246.5
(3.9%) (3.6%) (3.4%) (4.3%) (4.4%) (4.4%) (4.2%) (3.6%)
Home-maker 17.1 7.8 6.7 12.5 6.8 2.4 150.6 582.5
(12.8%) (11.3%) (12.2%) (10.7%) (10.4%) (8.3%) (11.1%) (8.6%)
Retired person 6.9 3.7 3.0 6.1 3.8 1.6 73.2 221.0
(5.2%) (5.4%) (5.4%) (5.2%) (5.8%) (5.5%) (5.4%) (3.3%)
Temporary / permanent ill 4.3 3.2 1.7 4.3 3.3 1.0 54.5 96.3
(3.3%) (4.6%) (3.1%) (3.6%) (5.1%) (3.6%) (4.0%) (1.4%)
Other economically inactive* 5.0 1.8 1.9 3.2 1.7 1.4 43.1 124.9
(3.7%) (2.6%) (3.4%) (2.7%) (2.5%) (4.8%) (3.2%) (1.8%)
Elders aged 65+ 41.4 22.9 20.0 42.8 24.8 11.5 464.3 963.3
(31.0%) (33.2%) (36.1%) (36.8%) (38.0%) (40.4%) (34.3%) (14.2%)
(iii) Whether new arrival(s)
Yes 3.4 1.4 0.9 2.0 1.0 0.3 33.0 89.8
(2.5%) (2.0%) (1.7%) (1.7%) (1.5%) (0.9%) (2.4%) (1.3%)
No 130.2 67.5 54.5 114.5 64.3 28.2 1 319.5 6 705.2
(97.5%) (98.0%) (98.3%) (98.3%) (98.5%) (99.1%) (97.6%) (98.7%)
(iv) Receiving social security benefit
OALA 16.0 10.7 8.7 20.7 11.4 3.7 199.4 419.3
(11.9%) (15.5%) (15.7%) (17.7%) (17.5%) (13.2%) (14.7%) (6.2%)
DA 3.5 2.2 2.0 5.0 2.8 1.0 44.8 120.1
(2.6%) (3.2%) (3.5%) (4.3%) (4.2%) (3.6%) (3.3%) (1.8%)
OAA 9.4 3.2 5.0 8.3 4.8 3.4 96.4 249.2
(7.1%) (4.6%) (9.0%) (7.1%) (7.3%) (11.9%) (7.1%) (3.7%)
II. No. of employed persons ('000)
(i) Occupation
Higher-skilled 2.5 1.6 1.0 2.4 1.3 0.7 26.2 1 441.9
<10.8%> <12.8%> <10.5%> <11.7%> <12.7%> <16.5%> <11.1%> <42.0%>
Lower-skilled 20.4 10.8 8.4 18.2 9.2 3.5 208.9 1 993.0
<89.2%> <87.2%> <89.5%> <88.3%> <87.3%> <83.4%> <88.9%> <58.0%>
(ii) Educational attainment
Primary and below 3.8 1.8 1.4 2.8 2.3 0.8 40.8 312.9
<16.8%> <14.5%> <15.1%> <13.8%> <21.8%> <18.9%> <17.4%> <9.1%>
Lower secondary 6.5 3.9 2.7 5.7 2.3 0.7 65.5 494.8
<28.2%> <31.4%> <28.7%> <27.5%> <21.7%> <17.3%> <27.9%> <14.4%>
Upper secondary (including craft courses) 9.3 5.0 4.0 8.8 3.9 1.7 92.5 1 217.5
<40.5%> <39.9%> <42.2%> <42.7%> <36.5%> <41.9%> <39.3%> <35.4%>
Post-secondary - non-degree 1.4 0.8 0.5 1.4 0.9 § 15.5 323.3
<6.2%> <6.4%> <5.6%> <6.6%> <8.8%> § <6.6%> <9.4%>
Post-secondary - degree 1.9 1.0 0.8 1.9 1.2 0.7 20.7 1 086.5
<8.3%> <7.8%> <8.5%> <9.4%> <11.2%> <16.6%> <8.8%> <31.6%>
(iii) Employment status
Full-time 16.6 8.3 6.9 14.7 7.6 3.1 167.3 3 092.7
<72.5%> <67.0%> <74.2%> <71.2%> <72.3%> <75.8%> <71.2%> <90.0%>
Part-time / underemployed 6.3 4.1 2.4 5.9 2.9 1.0 67.7 342.3
<27.5%> <33.0%> <25.8%> <28.8%> <27.7%> <24.2%> <28.8%> <10.0%>
III. Other indicators
Median monthly employment earnings (HK$) 9,600 9,000 10,000 10,000 10,000 8,500 9,500 16,000
Labour force participation rate (%) 24.3 25.1 23.7 23.8 22.5 20.6 24.1 59.7
Unemployment rate (%) 15.8 15.4 18.7 14.8 19.4 20.4 16.6 3.7
Median age 50 51 55 56 58 58 54 43
No. of children ('000) 26.6 12.4 8.7 18.6 9.0 4.2 229.5 999.8
Dependency ratio (demographic)^ 1 077 1 075 1 119 1 180 1 127 1 261 1 098 437
Elderly 665 700 785 831 832 929 742 226
Child 413 375 334 349 294 332 356 211
Economic dependency ratio#
3 921 3 691 3 808 3 814 3 976 4 451 3 800 905
Before policy intervention
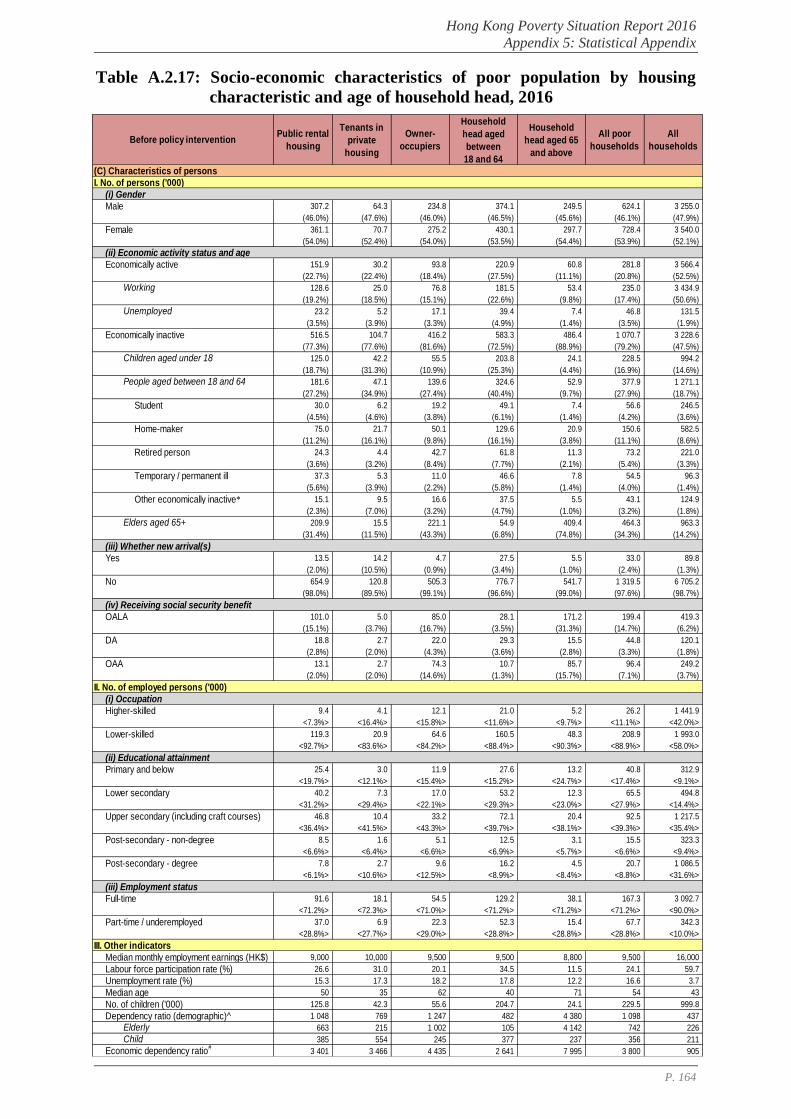
Hong Kong Poverty Situation Report 2016
Appendix 5: Statistical Appendix
P. 164
Table A.2.17: Socio-economic characteristics of poor population by housing
characteristic and age of household head, 2016
Public rental
housing
Tenants in
private
housing
Owner-
occupiers
Household
head aged
between
18 and 64
Household
head aged 65
and above
All poor
households
All
households
(C) Characteristics of persons
I. No. of persons ('000)
(i) Gender
Male 307.2 64.3 234.8 374.1 249.5 624.1 3 255.0
(46.0%) (47.6%) (46.0%) (46.5%) (45.6%) (46.1%) (47.9%)
Female 361.1 70.7 275.2 430.1 297.7 728.4 3 540.0
(54.0%) (52.4%) (54.0%) (53.5%) (54.4%) (53.9%) (52.1%)
(ii) Economic activity status and age
Economically active 151.9 30.2 93.8 220.9 60.8 281.8 3 566.4
(22.7%) (22.4%) (18.4%) (27.5%) (11.1%) (20.8%) (52.5%)
Working 128.6 25.0 76.8 181.5 53.4 235.0 3 434.9
(19.2%) (18.5%) (15.1%) (22.6%) (9.8%) (17.4%) (50.6%)
Unemployed 23.2 5.2 17.1 39.4 7.4 46.8 131.5
(3.5%) (3.9%) (3.3%) (4.9%) (1.4%) (3.5%) (1.9%)
Economically inactive 516.5 104.7 416.2 583.3 486.4 1 070.7 3 228.6
(77.3%) (77.6%) (81.6%) (72.5%) (88.9%) (79.2%) (47.5%)
Children aged under 18 125.0 42.2 55.5 203.8 24.1 228.5 994.2
(18.7%) (31.3%) (10.9%) (25.3%) (4.4%) (16.9%) (14.6%)
People aged between 18 and 64 181.6 47.1 139.6 324.6 52.9 377.9 1 271.1
(27.2%) (34.9%) (27.4%) (40.4%) (9.7%) (27.9%) (18.7%)
Student 30.0 6.2 19.2 49.1 7.4 56.6 246.5
(4.5%) (4.6%) (3.8%) (6.1%) (1.4%) (4.2%) (3.6%)
Home-maker 75.0 21.7 50.1 129.6 20.9 150.6 582.5
(11.2%) (16.1%) (9.8%) (16.1%) (3.8%) (11.1%) (8.6%)
Retired person 24.3 4.4 42.7 61.8 11.3 73.2 221.0
(3.6%) (3.2%) (8.4%) (7.7%) (2.1%) (5.4%) (3.3%)
Temporary / permanent ill 37.3 5.3 11.0 46.6 7.8 54.5 96.3
(5.6%) (3.9%) (2.2%) (5.8%) (1.4%) (4.0%) (1.4%)
Other economically inactive* 15.1 9.5 16.6 37.5 5.5 43.1 124.9
(2.3%) (7.0%) (3.2%) (4.7%) (1.0%) (3.2%) (1.8%)
Elders aged 65+ 209.9 15.5 221.1 54.9 409.4 464.3 963.3
(31.4%) (11.5%) (43.3%) (6.8%) (74.8%) (34.3%) (14.2%)
(iii) Whether new arrival(s)
Yes 13.5 14.2 4.7 27.5 5.5 33.0 89.8
(2.0%) (10.5%) (0.9%) (3.4%) (1.0%) (2.4%) (1.3%)
No 654.9 120.8 505.3 776.7 541.7 1 319.5 6 705.2
(98.0%) (89.5%) (99.1%) (96.6%) (99.0%) (97.6%) (98.7%)
(iv) Receiving social security benefit
OALA 101.0 5.0 85.0 28.1 171.2 199.4 419.3
(15.1%) (3.7%) (16.7%) (3.5%) (31.3%) (14.7%) (6.2%)
DA 18.8 2.7 22.0 29.3 15.5 44.8 120.1
(2.8%) (2.0%) (4.3%) (3.6%) (2.8%) (3.3%) (1.8%)
OAA 13.1 2.7 74.3 10.7 85.7 96.4 249.2
(2.0%) (2.0%) (14.6%) (1.3%) (15.7%) (7.1%) (3.7%)
II. No. of employed persons ('000)
(i) Occupation
Higher-skilled 9.4 4.1 12.1 21.0 5.2 26.2 1 441.9
<7.3%> <16.4%> <15.8%> <11.6%> <9.7%> <11.1%> <42.0%>
Lower-skilled 119.3 20.9 64.6 160.5 48.3 208.9 1 993.0
<92.7%> <83.6%> <84.2%> <88.4%> <90.3%> <88.9%> <58.0%>
(ii) Educational attainment
Primary and below 25.4 3.0 11.9 27.6 13.2 40.8 312.9
<19.7%> <12.1%> <15.4%> <15.2%> <24.7%> <17.4%> <9.1%>
Lower secondary 40.2 7.3 17.0 53.2 12.3 65.5 494.8
<31.2%> <29.4%> <22.1%> <29.3%> <23.0%> <27.9%> <14.4%>
Upper secondary (including craft courses) 46.8 10.4 33.2 72.1 20.4 92.5 1 217.5
<36.4%> <41.5%> <43.3%> <39.7%> <38.1%> <39.3%> <35.4%>
Post-secondary - non-degree 8.5 1.6 5.1 12.5 3.1 15.5 323.3
<6.6%> <6.4%> <6.6%> <6.9%> <5.7%> <6.6%> <9.4%>
Post-secondary - degree 7.8 2.7 9.6 16.2 4.5 20.7 1 086.5
<6.1%> <10.6%> <12.5%> <8.9%> <8.4%> <8.8%> <31.6%>
(iii) Employment status
Full-time 91.6 18.1 54.5 129.2 38.1 167.3 3 092.7
<71.2%> <72.3%> <71.0%> <71.2%> <71.2%> <71.2%> <90.0%>
Part-time / underemployed 37.0 6.9 22.3 52.3 15.4 67.7 342.3
<28.8%> <27.7%> <29.0%> <28.8%> <28.8%> <28.8%> <10.0%>
III. Other indicators
Median monthly employment earnings (HK$) 9,000 10,000 9,500 9,500 8,800 9,500 16,000
Labour force participation rate (%) 26.6 31.0 20.1 34.5 11.5 24.1 59.7
Unemployment rate (%) 15.3 17.3 18.2 17.8 12.2 16.6 3.7
Median age 50 35 62 40 71 54 43
No. of children ('000) 125.8 42.3 55.6 204.7 24.1 229.5 999.8
Dependency ratio (demographic)^ 1 048 769 1 247 482 4 380 1 098 437
Elderly 663 215 1 002 105 4 142 742 226
Child 385 554 245 377 237 356 211
Economic dependency ratio#
3 401 3 466 4 435 2 641 7 995 3 800 905
Before policy intervention
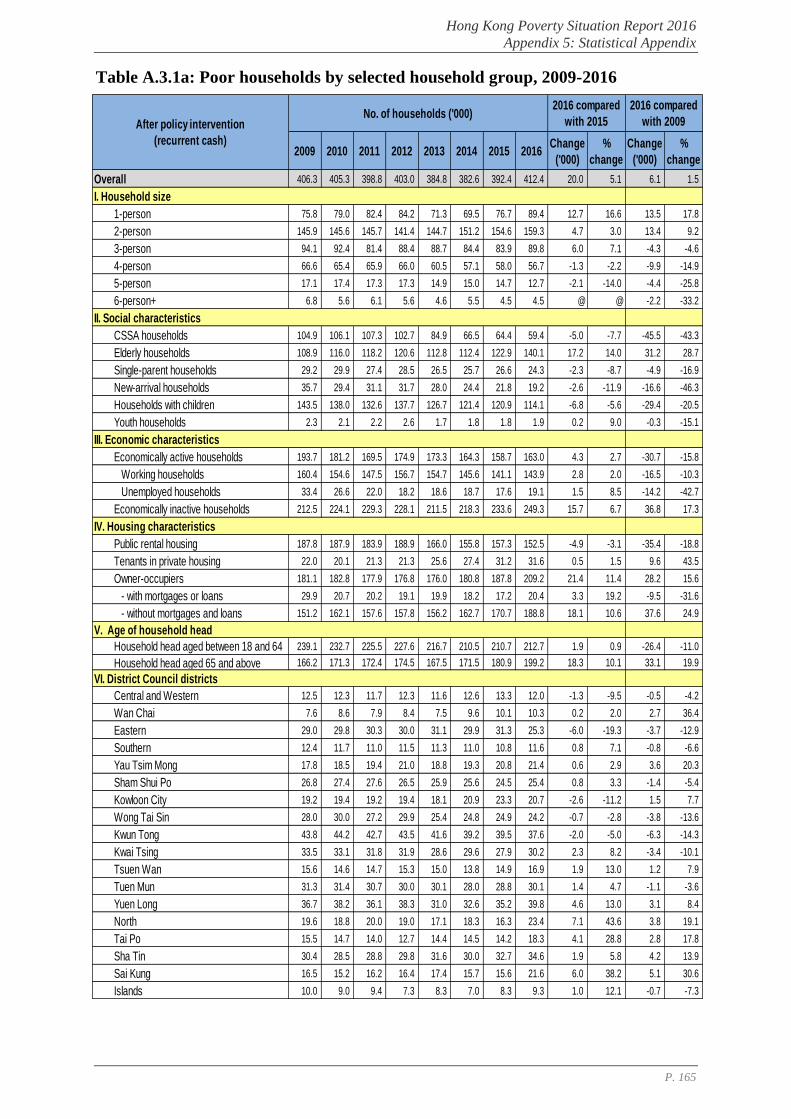
Hong Kong Poverty Situation Report 2016
Appendix 5: Statistical Appendix
P. 165
Table A.3.1a: Poor households by selected household group, 2009-2016
2009 2010 2011 2012 2013 2014 2015 2016Change
('000)
%
change
Change
('000)
%
change
Overall 406.3 405.3 398.8 403.0 384.8 382.6 392.4 412.4 20.0 5.1 6.1 1.5
I. Household size
1-person 75.8 79.0 82.4 84.2 71.3 69.5 76.7 89.4 12.7 16.6 13.5 17.8
2-person 145.9 145.6 145.7 141.4 144.7 151.2 154.6 159.3 4.7 3.0 13.4 9.2
3-person 94.1 92.4 81.4 88.4 88.7 84.4 83.9 89.8 6.0 7.1 -4.3 -4.6
4-person 66.6 65.4 65.9 66.0 60.5 57.1 58.0 56.7 -1.3 -2.2 -9.9 -14.9
5-person 17.1 17.4 17.3 17.3 14.9 15.0 14.7 12.7 -2.1 -14.0 -4.4 -25.8
6-person+ 6.8 5.6 6.1 5.6 4.6 5.5 4.5 4.5 @ @ -2.2 -33.2
II. Social characteristics
CSSA households 104.9 106.1 107.3 102.7 84.9 66.5 64.4 59.4 -5.0 -7.7 -45.5 -43.3
Elderly households 108.9 116.0 118.2 120.6 112.8 112.4 122.9 140.1 17.2 14.0 31.2 28.7
Single-parent households 29.2 29.9 27.4 28.5 26.5 25.7 26.6 24.3 -2.3 -8.7 -4.9 -16.9
New-arrival households 35.7 29.4 31.1 31.7 28.0 24.4 21.8 19.2 -2.6 -11.9 -16.6 -46.3
Households with children 143.5 138.0 132.6 137.7 126.7 121.4 120.9 114.1 -6.8 -5.6 -29.4 -20.5
Youth households 2.3 2.1 2.2 2.6 1.7 1.8 1.8 1.9 0.2 9.0 -0.3 -15.1
III. Economic characteristics
Economically active households 193.7 181.2 169.5 174.9 173.3 164.3 158.7 163.0 4.3 2.7 -30.7 -15.8
Working households 160.4 154.6 147.5 156.7 154.7 145.6 141.1 143.9 2.8 2.0 -16.5 -10.3
Unemployed households 33.4 26.6 22.0 18.2 18.6 18.7 17.6 19.1 1.5 8.5 -14.2 -42.7
Economically inactive households 212.5 224.1 229.3 228.1 211.5 218.3 233.6 249.3 15.7 6.7 36.8 17.3
IV. Housing characteristics
Public rental housing 187.8 187.9 183.9 188.9 166.0 155.8 157.3 152.5 -4.9 -3.1 -35.4 -18.8
Tenants in private housing 22.0 20.1 21.3 21.3 25.6 27.4 31.2 31.6 0.5 1.5 9.6 43.5
Owner-occupiers 181.1 182.8 177.9 176.8 176.0 180.8 187.8 209.2 21.4 11.4 28.2 15.6
- with mortgages or loans 29.9 20.7 20.2 19.1 19.9 18.2 17.2 20.4 3.3 19.2 -9.5 -31.6
- without mortgages and loans 151.2 162.1 157.6 157.8 156.2 162.7 170.7 188.8 18.1 10.6 37.6 24.9
V. Age of household head
Household head aged between 18 and 64 239.1 232.7 225.5 227.6 216.7 210.5 210.7 212.7 1.9 0.9 -26.4 -11.0
Household head aged 65 and above 166.2 171.3 172.4 174.5 167.5 171.5 180.9 199.2 18.3 10.1 33.1 19.9
VI. District Council districts
Central and Western 12.5 12.3 11.7 12.3 11.6 12.6 13.3 12.0 -1.3 -9.5 -0.5 -4.2
Wan Chai 7.6 8.6 7.9 8.4 7.5 9.6 10.1 10.3 0.2 2.0 2.7 36.4
Eastern 29.0 29.8 30.3 30.0 31.1 29.9 31.3 25.3 -6.0 -19.3 -3.7 -12.9
Southern 12.4 11.7 11.0 11.5 11.3 11.0 10.8 11.6 0.8 7.1 -0.8 -6.6
Yau Tsim Mong 17.8 18.5 19.4 21.0 18.8 19.3 20.8 21.4 0.6 2.9 3.6 20.3
Sham Shui Po 26.8 27.4 27.6 26.5 25.9 25.6 24.5 25.4 0.8 3.3 -1.4 -5.4
Kowloon City 19.2 19.4 19.2 19.4 18.1 20.9 23.3 20.7 -2.6 -11.2 1.5 7.7
Wong Tai Sin 28.0 30.0 27.2 29.9 25.4 24.8 24.9 24.2 -0.7 -2.8 -3.8 -13.6
Kwun Tong 43.8 44.2 42.7 43.5 41.6 39.2 39.5 37.6 -2.0 -5.0 -6.3 -14.3
Kwai Tsing 33.5 33.1 31.8 31.9 28.6 29.6 27.9 30.2 2.3 8.2 -3.4 -10.1
Tsuen Wan 15.6 14.6 14.7 15.3 15.0 13.8 14.9 16.9 1.9 13.0 1.2 7.9
Tuen Mun 31.3 31.4 30.7 30.0 30.1 28.0 28.8 30.1 1.4 4.7 -1.1 -3.6
Yuen Long 36.7 38.2 36.1 38.3 31.0 32.6 35.2 39.8 4.6 13.0 3.1 8.4
North 19.6 18.8 20.0 19.0 17.1 18.3 16.3 23.4 7.1 43.6 3.8 19.1
Tai Po 15.5 14.7 14.0 12.7 14.4 14.5 14.2 18.3 4.1 28.8 2.8 17.8
Sha Tin 30.4 28.5 28.8 29.8 31.6 30.0 32.7 34.6 1.9 5.8 4.2 13.9
Sai Kung 16.5 15.2 16.2 16.4 17.4 15.7 15.6 21.6 6.0 38.2 5.1 30.6
Islands 10.0 9.0 9.4 7.3 8.3 7.0 8.3 9.3 1.0 12.1 -0.7 -7.3
After policy intervention
(recurrent cash)
2016 compared
with 2015
2016 compared
with 2009No. of households ('000)
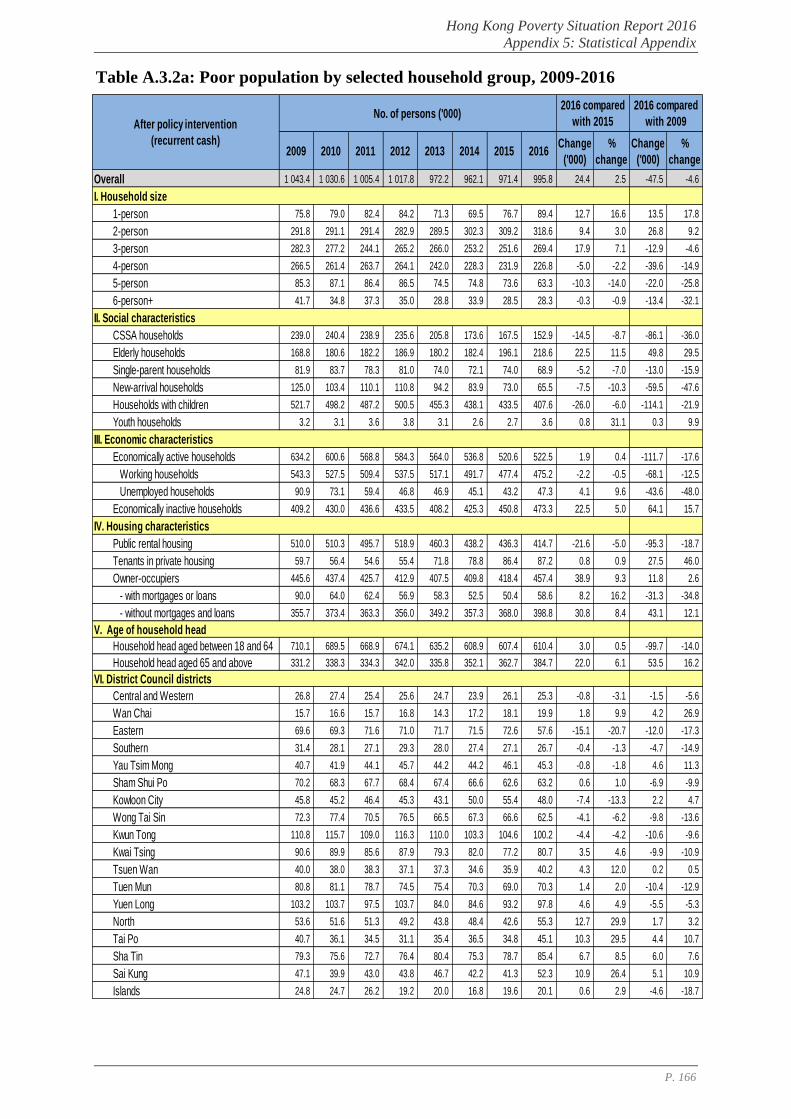
Hong Kong Poverty Situation Report 2016
Appendix 5: Statistical Appendix
P. 166
Table A.3.2a: Poor population by selected household group, 2009-2016
2009 2010 2011 2012 2013 2014 2015 2016Change
('000)
%
change
Change
('000)
%
change
Overall 1 043.4 1 030.6 1 005.4 1 017.8 972.2 962.1 971.4 995.8 24.4 2.5 -47.5 -4.6
I. Household size
1-person 75.8 79.0 82.4 84.2 71.3 69.5 76.7 89.4 12.7 16.6 13.5 17.8
2-person 291.8 291.1 291.4 282.9 289.5 302.3 309.2 318.6 9.4 3.0 26.8 9.2
3-person 282.3 277.2 244.1 265.2 266.0 253.2 251.6 269.4 17.9 7.1 -12.9 -4.6
4-person 266.5 261.4 263.7 264.1 242.0 228.3 231.9 226.8 -5.0 -2.2 -39.6 -14.9
5-person 85.3 87.1 86.4 86.5 74.5 74.8 73.6 63.3 -10.3 -14.0 -22.0 -25.8
6-person+ 41.7 34.8 37.3 35.0 28.8 33.9 28.5 28.3 -0.3 -0.9 -13.4 -32.1
II. Social characteristics
CSSA households 239.0 240.4 238.9 235.6 205.8 173.6 167.5 152.9 -14.5 -8.7 -86.1 -36.0
Elderly households 168.8 180.6 182.2 186.9 180.2 182.4 196.1 218.6 22.5 11.5 49.8 29.5
Single-parent households 81.9 83.7 78.3 81.0 74.0 72.1 74.0 68.9 -5.2 -7.0 -13.0 -15.9
New-arrival households 125.0 103.4 110.1 110.8 94.2 83.9 73.0 65.5 -7.5 -10.3 -59.5 -47.6
Households with children 521.7 498.2 487.2 500.5 455.3 438.1 433.5 407.6 -26.0 -6.0 -114.1 -21.9
Youth households 3.2 3.1 3.6 3.8 3.1 2.6 2.7 3.6 0.8 31.1 0.3 9.9
III. Economic characteristics
Economically active households 634.2 600.6 568.8 584.3 564.0 536.8 520.6 522.5 1.9 0.4 -111.7 -17.6
Working households 543.3 527.5 509.4 537.5 517.1 491.7 477.4 475.2 -2.2 -0.5 -68.1 -12.5
Unemployed households 90.9 73.1 59.4 46.8 46.9 45.1 43.2 47.3 4.1 9.6 -43.6 -48.0
Economically inactive households 409.2 430.0 436.6 433.5 408.2 425.3 450.8 473.3 22.5 5.0 64.1 15.7
IV. Housing characteristics
Public rental housing 510.0 510.3 495.7 518.9 460.3 438.2 436.3 414.7 -21.6 -5.0 -95.3 -18.7
Tenants in private housing 59.7 56.4 54.6 55.4 71.8 78.8 86.4 87.2 0.8 0.9 27.5 46.0
Owner-occupiers 445.6 437.4 425.7 412.9 407.5 409.8 418.4 457.4 38.9 9.3 11.8 2.6
- with mortgages or loans 90.0 64.0 62.4 56.9 58.3 52.5 50.4 58.6 8.2 16.2 -31.3 -34.8
- without mortgages and loans 355.7 373.4 363.3 356.0 349.2 357.3 368.0 398.8 30.8 8.4 43.1 12.1
V. Age of household head
Household head aged between 18 and 64 710.1 689.5 668.9 674.1 635.2 608.9 607.4 610.4 3.0 0.5 -99.7 -14.0
Household head aged 65 and above 331.2 338.3 334.3 342.0 335.8 352.1 362.7 384.7 22.0 6.1 53.5 16.2
VI. District Council districts
Central and Western 26.8 27.4 25.4 25.6 24.7 23.9 26.1 25.3 -0.8 -3.1 -1.5 -5.6
Wan Chai 15.7 16.6 15.7 16.8 14.3 17.2 18.1 19.9 1.8 9.9 4.2 26.9
Eastern 69.6 69.3 71.6 71.0 71.7 71.5 72.6 57.6 -15.1 -20.7 -12.0 -17.3
Southern 31.4 28.1 27.1 29.3 28.0 27.4 27.1 26.7 -0.4 -1.3 -4.7 -14.9
Yau Tsim Mong 40.7 41.9 44.1 45.7 44.2 44.2 46.1 45.3 -0.8 -1.8 4.6 11.3
Sham Shui Po 70.2 68.3 67.7 68.4 67.4 66.6 62.6 63.2 0.6 1.0 -6.9 -9.9
Kowloon City 45.8 45.2 46.4 45.3 43.1 50.0 55.4 48.0 -7.4 -13.3 2.2 4.7
Wong Tai Sin 72.3 77.4 70.5 76.5 66.5 67.3 66.6 62.5 -4.1 -6.2 -9.8 -13.6
Kwun Tong 110.8 115.7 109.0 116.3 110.0 103.3 104.6 100.2 -4.4 -4.2 -10.6 -9.6
Kwai Tsing 90.6 89.9 85.6 87.9 79.3 82.0 77.2 80.7 3.5 4.6 -9.9 -10.9
Tsuen Wan 40.0 38.0 38.3 37.1 37.3 34.6 35.9 40.2 4.3 12.0 0.2 0.5
Tuen Mun 80.8 81.1 78.7 74.5 75.4 70.3 69.0 70.3 1.4 2.0 -10.4 -12.9
Yuen Long 103.2 103.7 97.5 103.7 84.0 84.6 93.2 97.8 4.6 4.9 -5.5 -5.3
North 53.6 51.6 51.3 49.2 43.8 48.4 42.6 55.3 12.7 29.9 1.7 3.2
Tai Po 40.7 36.1 34.5 31.1 35.4 36.5 34.8 45.1 10.3 29.5 4.4 10.7
Sha Tin 79.3 75.6 72.7 76.4 80.4 75.3 78.7 85.4 6.7 8.5 6.0 7.6
Sai Kung 47.1 39.9 43.0 43.8 46.7 42.2 41.3 52.3 10.9 26.4 5.1 10.9
Islands 24.8 24.7 26.2 19.2 20.0 16.8 19.6 20.1 0.6 2.9 -4.6 -18.7
After policy intervention
(recurrent cash)
2016 compared
with 2015
2016 compared
with 2009No. of persons ('000)
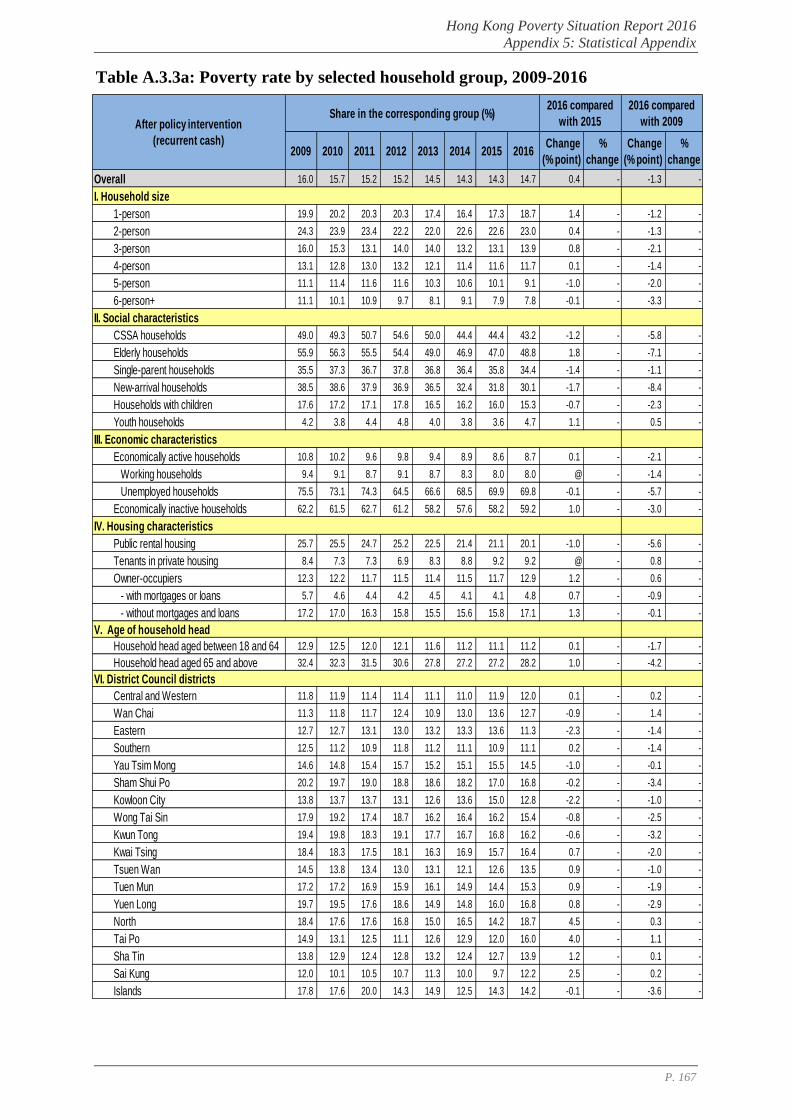
Hong Kong Poverty Situation Report 2016
Appendix 5: Statistical Appendix
P. 167
Table A.3.3a: Poverty rate by selected household group, 2009-2016
2009 2010 2011 2012 2013 2014 2015 2016 Change
(% point)
%
change
Change
(% point)
%
change
Overall 16.0 15.7 15.2 15.2 14.5 14.3 14.3 14.7 0.4 - -1.3 -
I. Household size
1-person 19.9 20.2 20.3 20.3 17.4 16.4 17.3 18.7 1.4 - -1.2 -
2-person 24.3 23.9 23.4 22.2 22.0 22.6 22.6 23.0 0.4 - -1.3 -
3-person 16.0 15.3 13.1 14.0 14.0 13.2 13.1 13.9 0.8 - -2.1 -
4-person 13.1 12.8 13.0 13.2 12.1 11.4 11.6 11.7 0.1 - -1.4 -
5-person 11.1 11.4 11.6 11.6 10.3 10.6 10.1 9.1 -1.0 - -2.0 -
6-person+ 11.1 10.1 10.9 9.7 8.1 9.1 7.9 7.8 -0.1 - -3.3 -
II. Social characteristics
CSSA households 49.0 49.3 50.7 54.6 50.0 44.4 44.4 43.2 -1.2 - -5.8 -
Elderly households 55.9 56.3 55.5 54.4 49.0 46.9 47.0 48.8 1.8 - -7.1 -
Single-parent households 35.5 37.3 36.7 37.8 36.8 36.4 35.8 34.4 -1.4 - -1.1 -
New-arrival households 38.5 38.6 37.9 36.9 36.5 32.4 31.8 30.1 -1.7 - -8.4 -
Households with children 17.6 17.2 17.1 17.8 16.5 16.2 16.0 15.3 -0.7 - -2.3 -
Youth households 4.2 3.8 4.4 4.8 4.0 3.8 3.6 4.7 1.1 - 0.5 -
III. Economic characteristics
Economically active households 10.8 10.2 9.6 9.8 9.4 8.9 8.6 8.7 0.1 - -2.1 -
Working households 9.4 9.1 8.7 9.1 8.7 8.3 8.0 8.0 @ - -1.4 -
Unemployed households 75.5 73.1 74.3 64.5 66.6 68.5 69.9 69.8 -0.1 - -5.7 -
Economically inactive households 62.2 61.5 62.7 61.2 58.2 57.6 58.2 59.2 1.0 - -3.0 -
IV. Housing characteristics
Public rental housing 25.7 25.5 24.7 25.2 22.5 21.4 21.1 20.1 -1.0 - -5.6 -
Tenants in private housing 8.4 7.3 7.3 6.9 8.3 8.8 9.2 9.2 @ - 0.8 -
Owner-occupiers 12.3 12.2 11.7 11.5 11.4 11.5 11.7 12.9 1.2 - 0.6 -
- with mortgages or loans 5.7 4.6 4.4 4.2 4.5 4.1 4.1 4.8 0.7 - -0.9 -
- without mortgages and loans 17.2 17.0 16.3 15.8 15.5 15.6 15.8 17.1 1.3 - -0.1 -
V. Age of household head
Household head aged between 18 and 64 12.9 12.5 12.0 12.1 11.6 11.2 11.1 11.2 0.1 - -1.7 -
Household head aged 65 and above 32.4 32.3 31.5 30.6 27.8 27.2 27.2 28.2 1.0 - -4.2 -
VI. District Council districts
Central and Western 11.8 11.9 11.4 11.4 11.1 11.0 11.9 12.0 0.1 - 0.2 -
Wan Chai 11.3 11.8 11.7 12.4 10.9 13.0 13.6 12.7 -0.9 - 1.4 -
Eastern 12.7 12.7 13.1 13.0 13.2 13.3 13.6 11.3 -2.3 - -1.4 -
Southern 12.5 11.2 10.9 11.8 11.2 11.1 10.9 11.1 0.2 - -1.4 -
Yau Tsim Mong 14.6 14.8 15.4 15.7 15.2 15.1 15.5 14.5 -1.0 - -0.1 -
Sham Shui Po 20.2 19.7 19.0 18.8 18.6 18.2 17.0 16.8 -0.2 - -3.4 -
Kowloon City 13.8 13.7 13.7 13.1 12.6 13.6 15.0 12.8 -2.2 - -1.0 -
Wong Tai Sin 17.9 19.2 17.4 18.7 16.2 16.4 16.2 15.4 -0.8 - -2.5 -
Kwun Tong 19.4 19.8 18.3 19.1 17.7 16.7 16.8 16.2 -0.6 - -3.2 -
Kwai Tsing 18.4 18.3 17.5 18.1 16.3 16.9 15.7 16.4 0.7 - -2.0 -
Tsuen Wan 14.5 13.8 13.4 13.0 13.1 12.1 12.6 13.5 0.9 - -1.0 -
Tuen Mun 17.2 17.2 16.9 15.9 16.1 14.9 14.4 15.3 0.9 - -1.9 -
Yuen Long 19.7 19.5 17.6 18.6 14.9 14.8 16.0 16.8 0.8 - -2.9 -
North 18.4 17.6 17.6 16.8 15.0 16.5 14.2 18.7 4.5 - 0.3 -
Tai Po 14.9 13.1 12.5 11.1 12.6 12.9 12.0 16.0 4.0 - 1.1 -
Sha Tin 13.8 12.9 12.4 12.8 13.2 12.4 12.7 13.9 1.2 - 0.1 -
Sai Kung 12.0 10.1 10.5 10.7 11.3 10.0 9.7 12.2 2.5 - 0.2 -
Islands 17.8 17.6 20.0 14.3 14.9 12.5 14.3 14.2 -0.1 - -3.6 -
After policy intervention
(recurrent cash)
2016 compared
with 2015
2016 compared
with 2009Share in the corresponding group (%)
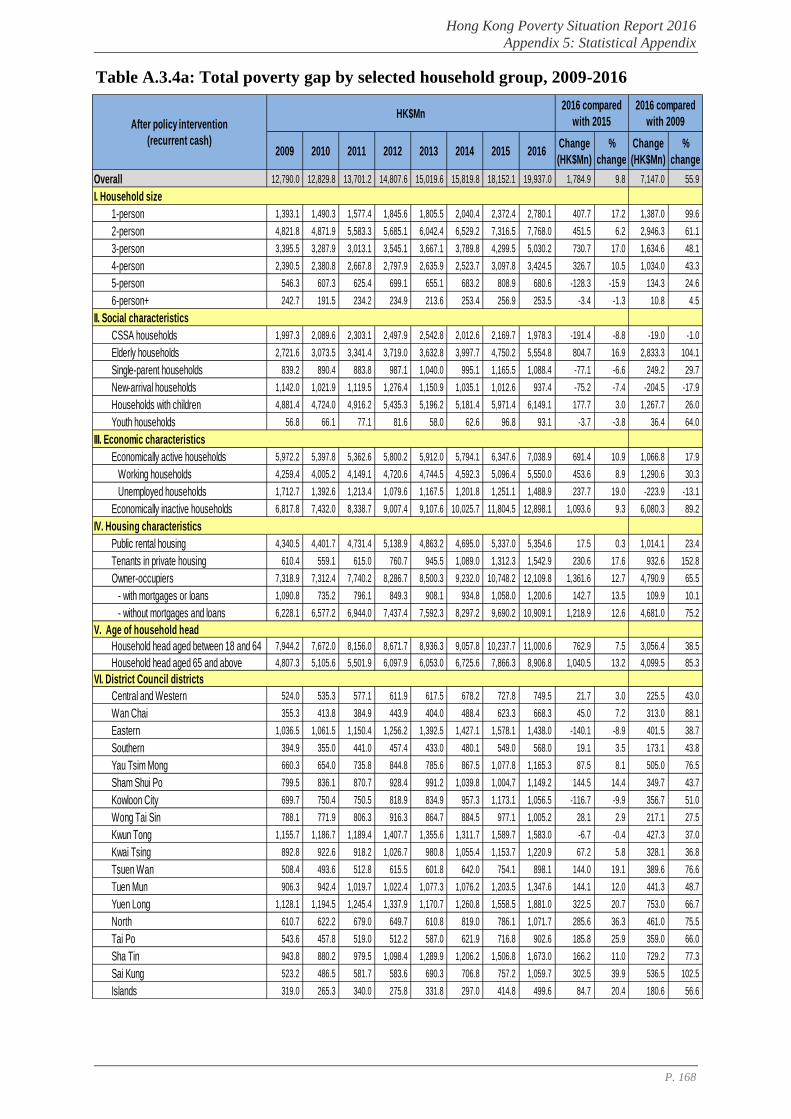
Hong Kong Poverty Situation Report 2016
Appendix 5: Statistical Appendix
P. 168
Table A.3.4a: Total poverty gap by selected household group, 2009-2016
2009 2010 2011 2012 2013 2014 2015 2016Change
(HK$Mn)
%
change
Change
(HK$Mn)
%
change
Overall 12,790.0 12,829.8 13,701.2 14,807.6 15,019.6 15,819.8 18,152.1 19,937.0 1,784.9 9.8 7,147.0 55.9
I. Household size
1-person 1,393.1 1,490.3 1,577.4 1,845.6 1,805.5 2,040.4 2,372.4 2,780.1 407.7 17.2 1,387.0 99.6
2-person 4,821.8 4,871.9 5,583.3 5,685.1 6,042.4 6,529.2 7,316.5 7,768.0 451.5 6.2 2,946.3 61.1
3-person 3,395.5 3,287.9 3,013.1 3,545.1 3,667.1 3,789.8 4,299.5 5,030.2 730.7 17.0 1,634.6 48.1
4-person 2,390.5 2,380.8 2,667.8 2,797.9 2,635.9 2,523.7 3,097.8 3,424.5 326.7 10.5 1,034.0 43.3
5-person 546.3 607.3 625.4 699.1 655.1 683.2 808.9 680.6 -128.3 -15.9 134.3 24.6
6-person+ 242.7 191.5 234.2 234.9 213.6 253.4 256.9 253.5 -3.4 -1.3 10.8 4.5
II. Social characteristics
CSSA households 1,997.3 2,089.6 2,303.1 2,497.9 2,542.8 2,012.6 2,169.7 1,978.3 -191.4 -8.8 -19.0 -1.0
Elderly households 2,721.6 3,073.5 3,341.4 3,719.0 3,632.8 3,997.7 4,750.2 5,554.8 804.7 16.9 2,833.3 104.1
Single-parent households 839.2 890.4 883.8 987.1 1,040.0 995.1 1,165.5 1,088.4 -77.1 -6.6 249.2 29.7
New-arrival households 1,142.0 1,021.9 1,119.5 1,276.4 1,150.9 1,035.1 1,012.6 937.4 -75.2 -7.4 -204.5 -17.9
Households with children 4,881.4 4,724.0 4,916.2 5,435.3 5,196.2 5,181.4 5,971.4 6,149.1 177.7 3.0 1,267.7 26.0
Youth households 56.8 66.1 77.1 81.6 58.0 62.6 96.8 93.1 -3.7 -3.8 36.4 64.0
III. Economic characteristics
Economically active households 5,972.2 5,397.8 5,362.6 5,800.2 5,912.0 5,794.1 6,347.6 7,038.9 691.4 10.9 1,066.8 17.9
Working households 4,259.4 4,005.2 4,149.1 4,720.6 4,744.5 4,592.3 5,096.4 5,550.0 453.6 8.9 1,290.6 30.3
Unemployed households 1,712.7 1,392.6 1,213.4 1,079.6 1,167.5 1,201.8 1,251.1 1,488.9 237.7 19.0 -223.9 -13.1
Economically inactive households 6,817.8 7,432.0 8,338.7 9,007.4 9,107.6 10,025.7 11,804.5 12,898.1 1,093.6 9.3 6,080.3 89.2
IV. Housing characteristics
Public rental housing 4,340.5 4,401.7 4,731.4 5,138.9 4,863.2 4,695.0 5,337.0 5,354.6 17.5 0.3 1,014.1 23.4
Tenants in private housing 610.4 559.1 615.0 760.7 945.5 1,089.0 1,312.3 1,542.9 230.6 17.6 932.6 152.8
Owner-occupiers 7,318.9 7,312.4 7,740.2 8,286.7 8,500.3 9,232.0 10,748.2 12,109.8 1,361.6 12.7 4,790.9 65.5
- with mortgages or loans 1,090.8 735.2 796.1 849.3 908.1 934.8 1,058.0 1,200.6 142.7 13.5 109.9 10.1
- without mortgages and loans 6,228.1 6,577.2 6,944.0 7,437.4 7,592.3 8,297.2 9,690.2 10,909.1 1,218.9 12.6 4,681.0 75.2
V. Age of household head
Household head aged between 18 and 64 7,944.2 7,672.0 8,156.0 8,671.7 8,936.3 9,057.8 10,237.7 11,000.6 762.9 7.5 3,056.4 38.5
Household head aged 65 and above 4,807.3 5,105.6 5,501.9 6,097.9 6,053.0 6,725.6 7,866.3 8,906.8 1,040.5 13.2 4,099.5 85.3
VI. District Council districts
Central and Western 524.0 535.3 577.1 611.9 617.5 678.2 727.8 749.5 21.7 3.0 225.5 43.0
Wan Chai 355.3 413.8 384.9 443.9 404.0 488.4 623.3 668.3 45.0 7.2 313.0 88.1
Eastern 1,036.5 1,061.5 1,150.4 1,256.2 1,392.5 1,427.1 1,578.1 1,438.0 -140.1 -8.9 401.5 38.7
Southern 394.9 355.0 441.0 457.4 433.0 480.1 549.0 568.0 19.1 3.5 173.1 43.8
Yau Tsim Mong 660.3 654.0 735.8 844.8 785.6 867.5 1,077.8 1,165.3 87.5 8.1 505.0 76.5
Sham Shui Po 799.5 836.1 870.7 928.4 991.2 1,039.8 1,004.7 1,149.2 144.5 14.4 349.7 43.7
Kowloon City 699.7 750.4 750.5 818.9 834.9 957.3 1,173.1 1,056.5 -116.7 -9.9 356.7 51.0
Wong Tai Sin 788.1 771.9 806.3 916.3 864.7 884.5 977.1 1,005.2 28.1 2.9 217.1 27.5
Kwun Tong 1,155.7 1,186.7 1,189.4 1,407.7 1,355.6 1,311.7 1,589.7 1,583.0 -6.7 -0.4 427.3 37.0
Kwai Tsing 892.8 922.6 918.2 1,026.7 980.8 1,055.4 1,153.7 1,220.9 67.2 5.8 328.1 36.8
Tsuen Wan 508.4 493.6 512.8 615.5 601.8 642.0 754.1 898.1 144.0 19.1 389.6 76.6
Tuen Mun 906.3 942.4 1,019.7 1,022.4 1,077.3 1,076.2 1,203.5 1,347.6 144.1 12.0 441.3 48.7
Yuen Long 1,128.1 1,194.5 1,245.4 1,337.9 1,170.7 1,260.8 1,558.5 1,881.0 322.5 20.7 753.0 66.7
North 610.7 622.2 679.0 649.7 610.8 819.0 786.1 1,071.7 285.6 36.3 461.0 75.5
Tai Po 543.6 457.8 519.0 512.2 587.0 621.9 716.8 902.6 185.8 25.9 359.0 66.0
Sha Tin 943.8 880.2 979.5 1,098.4 1,289.9 1,206.2 1,506.8 1,673.0 166.2 11.0 729.2 77.3
Sai Kung 523.2 486.5 581.7 583.6 690.3 706.8 757.2 1,059.7 302.5 39.9 536.5 102.5
Islands 319.0 265.3 340.0 275.8 331.8 297.0 414.8 499.6 84.7 20.4 180.6 56.6
After policy intervention
(recurrent cash)
2016 compared
with 2015
2016 compared
with 2009HK$Mn
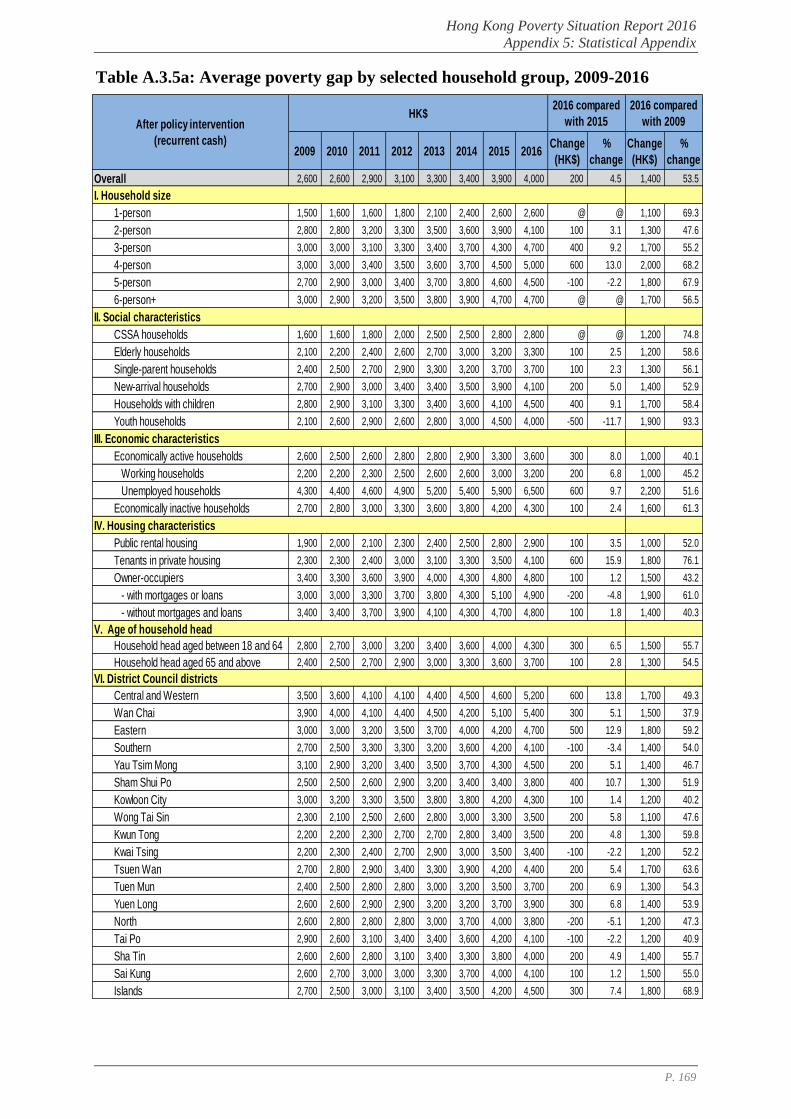
Hong Kong Poverty Situation Report 2016
Appendix 5: Statistical Appendix
P. 169
Table A.3.5a: Average poverty gap by selected household group, 2009-2016
2009 2010 2011 2012 2013 2014 2015 2016Change
(HK$)
%
change
Change
(HK$)
%
change
Overall 2,600 2,600 2,900 3,100 3,300 3,400 3,900 4,000 200 4.5 1,400 53.5
I. Household size
1-person 1,500 1,600 1,600 1,800 2,100 2,400 2,600 2,600 @ @ 1,100 69.3
2-person 2,800 2,800 3,200 3,300 3,500 3,600 3,900 4,100 100 3.1 1,300 47.6
3-person 3,000 3,000 3,100 3,300 3,400 3,700 4,300 4,700 400 9.2 1,700 55.2
4-person 3,000 3,000 3,400 3,500 3,600 3,700 4,500 5,000 600 13.0 2,000 68.2
5-person 2,700 2,900 3,000 3,400 3,700 3,800 4,600 4,500 -100 -2.2 1,800 67.9
6-person+ 3,000 2,900 3,200 3,500 3,800 3,900 4,700 4,700 @ @ 1,700 56.5
II. Social characteristics
CSSA households 1,600 1,600 1,800 2,000 2,500 2,500 2,800 2,800 @ @ 1,200 74.8
Elderly households 2,100 2,200 2,400 2,600 2,700 3,000 3,200 3,300 100 2.5 1,200 58.6
Single-parent households 2,400 2,500 2,700 2,900 3,300 3,200 3,700 3,700 100 2.3 1,300 56.1
New-arrival households 2,700 2,900 3,000 3,400 3,400 3,500 3,900 4,100 200 5.0 1,400 52.9
Households with children 2,800 2,900 3,100 3,300 3,400 3,600 4,100 4,500 400 9.1 1,700 58.4
Youth households 2,100 2,600 2,900 2,600 2,800 3,000 4,500 4,000 -500 -11.7 1,900 93.3
III. Economic characteristics
Economically active households 2,600 2,500 2,600 2,800 2,800 2,900 3,300 3,600 300 8.0 1,000 40.1
Working households 2,200 2,200 2,300 2,500 2,600 2,600 3,000 3,200 200 6.8 1,000 45.2
Unemployed households 4,300 4,400 4,600 4,900 5,200 5,400 5,900 6,500 600 9.7 2,200 51.6
Economically inactive households 2,700 2,800 3,000 3,300 3,600 3,800 4,200 4,300 100 2.4 1,600 61.3
IV. Housing characteristics
Public rental housing 1,900 2,000 2,100 2,300 2,400 2,500 2,800 2,900 100 3.5 1,000 52.0
Tenants in private housing 2,300 2,300 2,400 3,000 3,100 3,300 3,500 4,100 600 15.9 1,800 76.1
Owner-occupiers 3,400 3,300 3,600 3,900 4,000 4,300 4,800 4,800 100 1.2 1,500 43.2
- with mortgages or loans 3,000 3,000 3,300 3,700 3,800 4,300 5,100 4,900 -200 -4.8 1,900 61.0
- without mortgages and loans 3,400 3,400 3,700 3,900 4,100 4,300 4,700 4,800 100 1.8 1,400 40.3
V. Age of household head
Household head aged between 18 and 64 2,800 2,700 3,000 3,200 3,400 3,600 4,000 4,300 300 6.5 1,500 55.7
Household head aged 65 and above 2,400 2,500 2,700 2,900 3,000 3,300 3,600 3,700 100 2.8 1,300 54.5
VI. District Council districts
Central and Western 3,500 3,600 4,100 4,100 4,400 4,500 4,600 5,200 600 13.8 1,700 49.3
Wan Chai 3,900 4,000 4,100 4,400 4,500 4,200 5,100 5,400 300 5.1 1,500 37.9
Eastern 3,000 3,000 3,200 3,500 3,700 4,000 4,200 4,700 500 12.9 1,800 59.2
Southern 2,700 2,500 3,300 3,300 3,200 3,600 4,200 4,100 -100 -3.4 1,400 54.0
Yau Tsim Mong 3,100 2,900 3,200 3,400 3,500 3,700 4,300 4,500 200 5.1 1,400 46.7
Sham Shui Po 2,500 2,500 2,600 2,900 3,200 3,400 3,400 3,800 400 10.7 1,300 51.9
Kowloon City 3,000 3,200 3,300 3,500 3,800 3,800 4,200 4,300 100 1.4 1,200 40.2
Wong Tai Sin 2,300 2,100 2,500 2,600 2,800 3,000 3,300 3,500 200 5.8 1,100 47.6
Kwun Tong 2,200 2,200 2,300 2,700 2,700 2,800 3,400 3,500 200 4.8 1,300 59.8
Kwai Tsing 2,200 2,300 2,400 2,700 2,900 3,000 3,500 3,400 -100 -2.2 1,200 52.2
Tsuen Wan 2,700 2,800 2,900 3,400 3,300 3,900 4,200 4,400 200 5.4 1,700 63.6
Tuen Mun 2,400 2,500 2,800 2,800 3,000 3,200 3,500 3,700 200 6.9 1,300 54.3
Yuen Long 2,600 2,600 2,900 2,900 3,200 3,200 3,700 3,900 300 6.8 1,400 53.9
North 2,600 2,800 2,800 2,800 3,000 3,700 4,000 3,800 -200 -5.1 1,200 47.3
Tai Po 2,900 2,600 3,100 3,400 3,400 3,600 4,200 4,100 -100 -2.2 1,200 40.9
Sha Tin 2,600 2,600 2,800 3,100 3,400 3,300 3,800 4,000 200 4.9 1,400 55.7
Sai Kung 2,600 2,700 3,000 3,000 3,300 3,700 4,000 4,100 100 1.2 1,500 55.0
Islands 2,700 2,500 3,000 3,100 3,400 3,500 4,200 4,500 300 7.4 1,800 68.9
After policy intervention
(recurrent cash)
2016 compared
with 2015
2016 compared
with 2009HK$
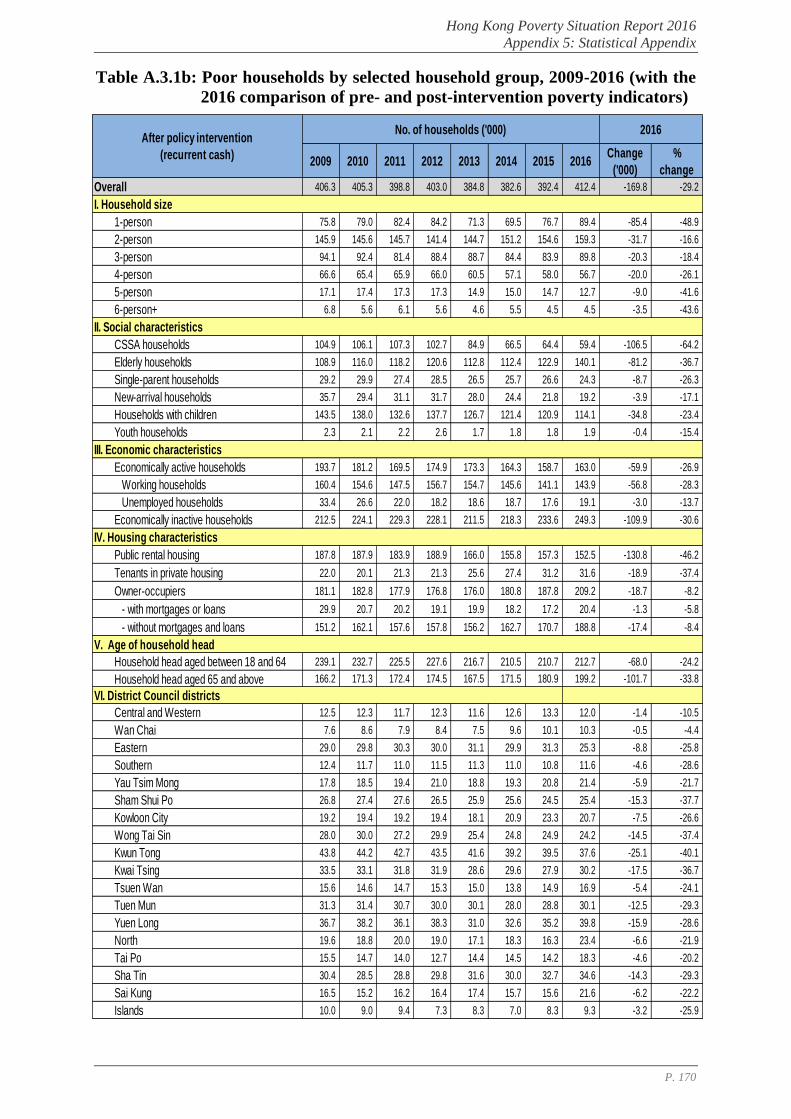
Hong Kong Poverty Situation Report 2016
Appendix 5: Statistical Appendix
P. 170
Table A.3.1b: Poor households by selected household group, 2009-2016 (with the
2016 comparison of pre- and post-intervention poverty indicators)
2009 2010 2011 2012 2013 2014 2015 2016Change
('000)
%
change
Overall 406.3 405.3 398.8 403.0 384.8 382.6 392.4 412.4 -169.8 -29.2
I. Household size
1-person 75.8 79.0 82.4 84.2 71.3 69.5 76.7 89.4 -85.4 -48.9
2-person 145.9 145.6 145.7 141.4 144.7 151.2 154.6 159.3 -31.7 -16.6
3-person 94.1 92.4 81.4 88.4 88.7 84.4 83.9 89.8 -20.3 -18.4
4-person 66.6 65.4 65.9 66.0 60.5 57.1 58.0 56.7 -20.0 -26.1
5-person 17.1 17.4 17.3 17.3 14.9 15.0 14.7 12.7 -9.0 -41.6
6-person+ 6.8 5.6 6.1 5.6 4.6 5.5 4.5 4.5 -3.5 -43.6
II. Social characteristics
CSSA households 104.9 106.1 107.3 102.7 84.9 66.5 64.4 59.4 -106.5 -64.2
Elderly households 108.9 116.0 118.2 120.6 112.8 112.4 122.9 140.1 -81.2 -36.7
Single-parent households 29.2 29.9 27.4 28.5 26.5 25.7 26.6 24.3 -8.7 -26.3
New-arrival households 35.7 29.4 31.1 31.7 28.0 24.4 21.8 19.2 -3.9 -17.1
Households with children 143.5 138.0 132.6 137.7 126.7 121.4 120.9 114.1 -34.8 -23.4
Youth households 2.3 2.1 2.2 2.6 1.7 1.8 1.8 1.9 -0.4 -15.4
III. Economic characteristics
Economically active households 193.7 181.2 169.5 174.9 173.3 164.3 158.7 163.0 -59.9 -26.9
Working households 160.4 154.6 147.5 156.7 154.7 145.6 141.1 143.9 -56.8 -28.3
Unemployed households 33.4 26.6 22.0 18.2 18.6 18.7 17.6 19.1 -3.0 -13.7
Economically inactive households 212.5 224.1 229.3 228.1 211.5 218.3 233.6 249.3 -109.9 -30.6
IV. Housing characteristics
Public rental housing 187.8 187.9 183.9 188.9 166.0 155.8 157.3 152.5 -130.8 -46.2
Tenants in private housing 22.0 20.1 21.3 21.3 25.6 27.4 31.2 31.6 -18.9 -37.4
Owner-occupiers 181.1 182.8 177.9 176.8 176.0 180.8 187.8 209.2 -18.7 -8.2
- with mortgages or loans 29.9 20.7 20.2 19.1 19.9 18.2 17.2 20.4 -1.3 -5.8
- without mortgages and loans 151.2 162.1 157.6 157.8 156.2 162.7 170.7 188.8 -17.4 -8.4
V. Age of household head
Household head aged between 18 and 64 239.1 232.7 225.5 227.6 216.7 210.5 210.7 212.7 -68.0 -24.2
Household head aged 65 and above 166.2 171.3 172.4 174.5 167.5 171.5 180.9 199.2 -101.7 -33.8
VI. District Council districts
Central and Western 12.5 12.3 11.7 12.3 11.6 12.6 13.3 12.0 -1.4 -10.5
Wan Chai 7.6 8.6 7.9 8.4 7.5 9.6 10.1 10.3 -0.5 -4.4
Eastern 29.0 29.8 30.3 30.0 31.1 29.9 31.3 25.3 -8.8 -25.8
Southern 12.4 11.7 11.0 11.5 11.3 11.0 10.8 11.6 -4.6 -28.6
Yau Tsim Mong 17.8 18.5 19.4 21.0 18.8 19.3 20.8 21.4 -5.9 -21.7
Sham Shui Po 26.8 27.4 27.6 26.5 25.9 25.6 24.5 25.4 -15.3 -37.7
Kowloon City 19.2 19.4 19.2 19.4 18.1 20.9 23.3 20.7 -7.5 -26.6
Wong Tai Sin 28.0 30.0 27.2 29.9 25.4 24.8 24.9 24.2 -14.5 -37.4
Kwun Tong 43.8 44.2 42.7 43.5 41.6 39.2 39.5 37.6 -25.1 -40.1
Kwai Tsing 33.5 33.1 31.8 31.9 28.6 29.6 27.9 30.2 -17.5 -36.7
Tsuen Wan 15.6 14.6 14.7 15.3 15.0 13.8 14.9 16.9 -5.4 -24.1
Tuen Mun 31.3 31.4 30.7 30.0 30.1 28.0 28.8 30.1 -12.5 -29.3
Yuen Long 36.7 38.2 36.1 38.3 31.0 32.6 35.2 39.8 -15.9 -28.6
North 19.6 18.8 20.0 19.0 17.1 18.3 16.3 23.4 -6.6 -21.9
Tai Po 15.5 14.7 14.0 12.7 14.4 14.5 14.2 18.3 -4.6 -20.2
Sha Tin 30.4 28.5 28.8 29.8 31.6 30.0 32.7 34.6 -14.3 -29.3
Sai Kung 16.5 15.2 16.2 16.4 17.4 15.7 15.6 21.6 -6.2 -22.2
Islands 10.0 9.0 9.4 7.3 8.3 7.0 8.3 9.3 -3.2 -25.9
2016After policy intervention
(recurrent cash)
No. of households ('000)
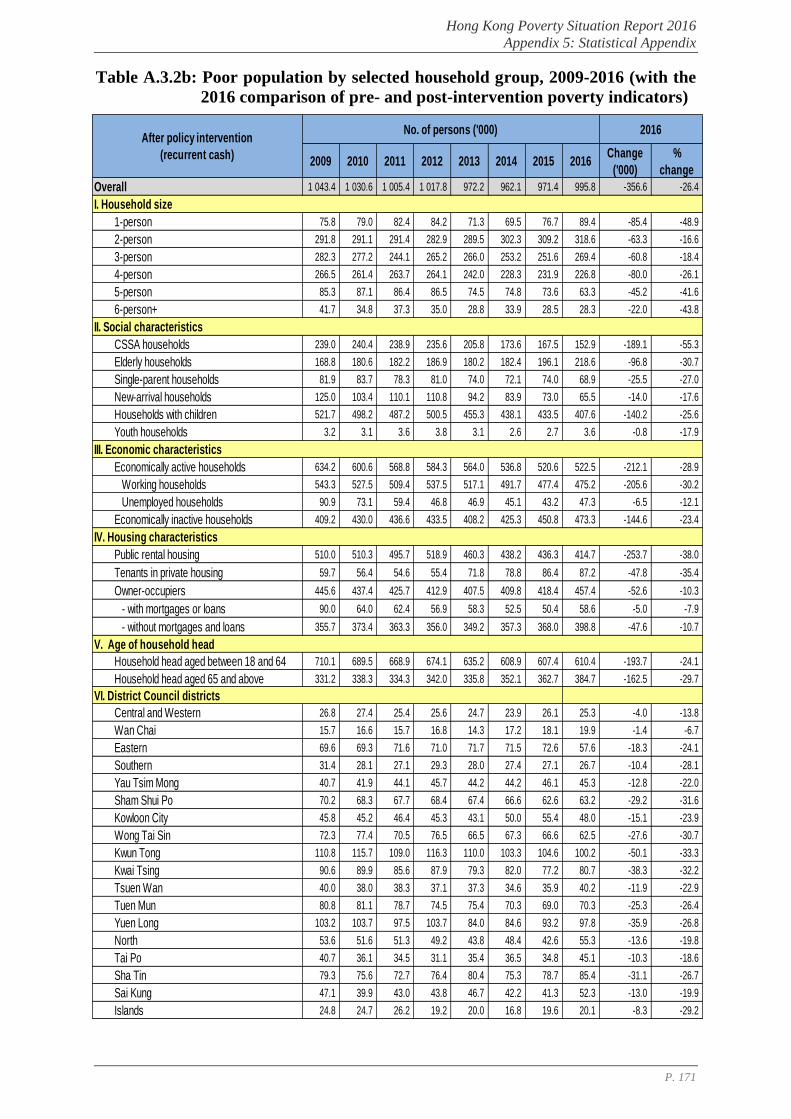
Hong Kong Poverty Situation Report 2016
Appendix 5: Statistical Appendix
P. 171
Table A.3.2b: Poor population by selected household group, 2009-2016 (with the
2016 comparison of pre- and post-intervention poverty indicators)
2009 2010 2011 2012 2013 2014 2015 2016Change
('000)
%
change
Overall 1 043.4 1 030.6 1 005.4 1 017.8 972.2 962.1 971.4 995.8 -356.6 -26.4
I. Household size
1-person 75.8 79.0 82.4 84.2 71.3 69.5 76.7 89.4 -85.4 -48.9
2-person 291.8 291.1 291.4 282.9 289.5 302.3 309.2 318.6 -63.3 -16.6
3-person 282.3 277.2 244.1 265.2 266.0 253.2 251.6 269.4 -60.8 -18.4
4-person 266.5 261.4 263.7 264.1 242.0 228.3 231.9 226.8 -80.0 -26.1
5-person 85.3 87.1 86.4 86.5 74.5 74.8 73.6 63.3 -45.2 -41.6
6-person+ 41.7 34.8 37.3 35.0 28.8 33.9 28.5 28.3 -22.0 -43.8
II. Social characteristics
CSSA households 239.0 240.4 238.9 235.6 205.8 173.6 167.5 152.9 -189.1 -55.3
Elderly households 168.8 180.6 182.2 186.9 180.2 182.4 196.1 218.6 -96.8 -30.7
Single-parent households 81.9 83.7 78.3 81.0 74.0 72.1 74.0 68.9 -25.5 -27.0
New-arrival households 125.0 103.4 110.1 110.8 94.2 83.9 73.0 65.5 -14.0 -17.6
Households with children 521.7 498.2 487.2 500.5 455.3 438.1 433.5 407.6 -140.2 -25.6
Youth households 3.2 3.1 3.6 3.8 3.1 2.6 2.7 3.6 -0.8 -17.9
III. Economic characteristics
Economically active households 634.2 600.6 568.8 584.3 564.0 536.8 520.6 522.5 -212.1 -28.9
Working households 543.3 527.5 509.4 537.5 517.1 491.7 477.4 475.2 -205.6 -30.2
Unemployed households 90.9 73.1 59.4 46.8 46.9 45.1 43.2 47.3 -6.5 -12.1
Economically inactive households 409.2 430.0 436.6 433.5 408.2 425.3 450.8 473.3 -144.6 -23.4
IV. Housing characteristics
Public rental housing 510.0 510.3 495.7 518.9 460.3 438.2 436.3 414.7 -253.7 -38.0
Tenants in private housing 59.7 56.4 54.6 55.4 71.8 78.8 86.4 87.2 -47.8 -35.4
Owner-occupiers 445.6 437.4 425.7 412.9 407.5 409.8 418.4 457.4 -52.6 -10.3
- with mortgages or loans 90.0 64.0 62.4 56.9 58.3 52.5 50.4 58.6 -5.0 -7.9
- without mortgages and loans 355.7 373.4 363.3 356.0 349.2 357.3 368.0 398.8 -47.6 -10.7
V. Age of household head
Household head aged between 18 and 64 710.1 689.5 668.9 674.1 635.2 608.9 607.4 610.4 -193.7 -24.1
Household head aged 65 and above 331.2 338.3 334.3 342.0 335.8 352.1 362.7 384.7 -162.5 -29.7
VI. District Council districts
Central and Western 26.8 27.4 25.4 25.6 24.7 23.9 26.1 25.3 -4.0 -13.8
Wan Chai 15.7 16.6 15.7 16.8 14.3 17.2 18.1 19.9 -1.4 -6.7
Eastern 69.6 69.3 71.6 71.0 71.7 71.5 72.6 57.6 -18.3 -24.1
Southern 31.4 28.1 27.1 29.3 28.0 27.4 27.1 26.7 -10.4 -28.1
Yau Tsim Mong 40.7 41.9 44.1 45.7 44.2 44.2 46.1 45.3 -12.8 -22.0
Sham Shui Po 70.2 68.3 67.7 68.4 67.4 66.6 62.6 63.2 -29.2 -31.6
Kowloon City 45.8 45.2 46.4 45.3 43.1 50.0 55.4 48.0 -15.1 -23.9
Wong Tai Sin 72.3 77.4 70.5 76.5 66.5 67.3 66.6 62.5 -27.6 -30.7
Kwun Tong 110.8 115.7 109.0 116.3 110.0 103.3 104.6 100.2 -50.1 -33.3
Kwai Tsing 90.6 89.9 85.6 87.9 79.3 82.0 77.2 80.7 -38.3 -32.2
Tsuen Wan 40.0 38.0 38.3 37.1 37.3 34.6 35.9 40.2 -11.9 -22.9
Tuen Mun 80.8 81.1 78.7 74.5 75.4 70.3 69.0 70.3 -25.3 -26.4
Yuen Long 103.2 103.7 97.5 103.7 84.0 84.6 93.2 97.8 -35.9 -26.8
North 53.6 51.6 51.3 49.2 43.8 48.4 42.6 55.3 -13.6 -19.8
Tai Po 40.7 36.1 34.5 31.1 35.4 36.5 34.8 45.1 -10.3 -18.6
Sha Tin 79.3 75.6 72.7 76.4 80.4 75.3 78.7 85.4 -31.1 -26.7
Sai Kung 47.1 39.9 43.0 43.8 46.7 42.2 41.3 52.3 -13.0 -19.9
Islands 24.8 24.7 26.2 19.2 20.0 16.8 19.6 20.1 -8.3 -29.2
After policy intervention
(recurrent cash)
2016No. of persons ('000)
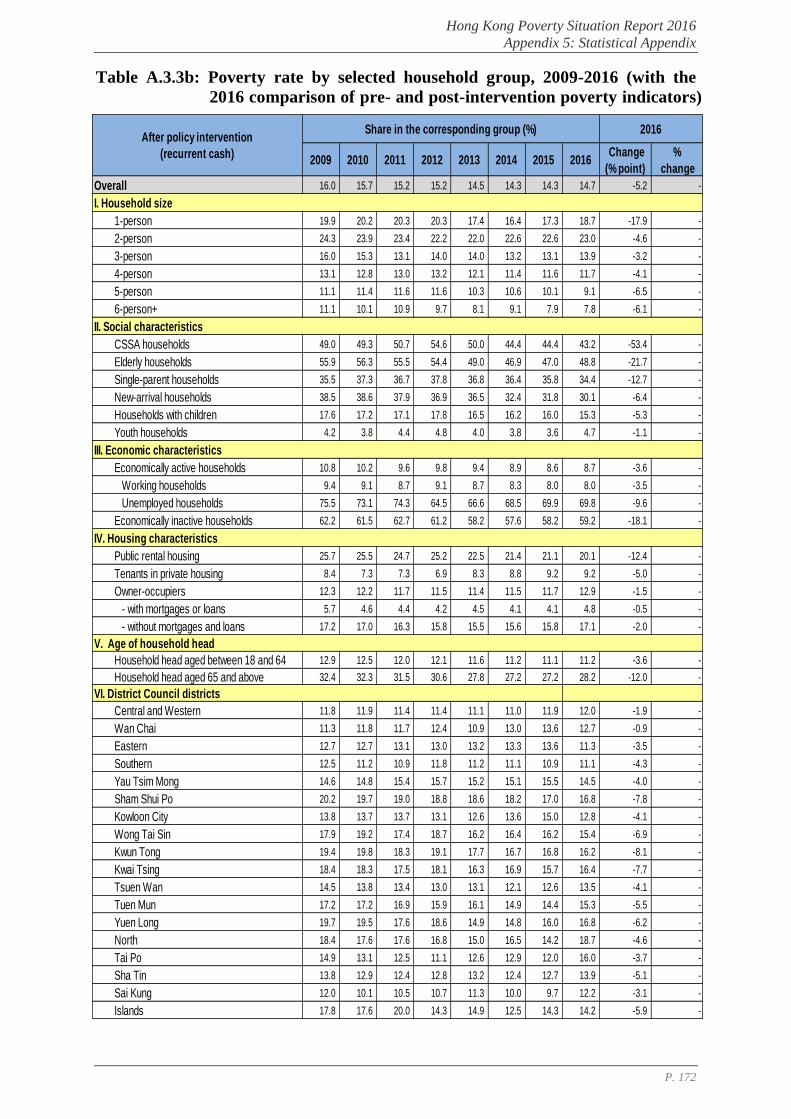
Hong Kong Poverty Situation Report 2016
Appendix 5: Statistical Appendix
P. 172
Table A.3.3b: Poverty rate by selected household group, 2009-2016 (with the
2016 comparison of pre- and post-intervention poverty indicators)
2009 2010 2011 2012 2013 2014 2015 2016 Change
(% point)
%
change
Overall 16.0 15.7 15.2 15.2 14.5 14.3 14.3 14.7 -5.2 -
I. Household size
1-person 19.9 20.2 20.3 20.3 17.4 16.4 17.3 18.7 -17.9 -
2-person 24.3 23.9 23.4 22.2 22.0 22.6 22.6 23.0 -4.6 -
3-person 16.0 15.3 13.1 14.0 14.0 13.2 13.1 13.9 -3.2 -
4-person 13.1 12.8 13.0 13.2 12.1 11.4 11.6 11.7 -4.1 -
5-person 11.1 11.4 11.6 11.6 10.3 10.6 10.1 9.1 -6.5 -
6-person+ 11.1 10.1 10.9 9.7 8.1 9.1 7.9 7.8 -6.1 -
II. Social characteristics
CSSA households 49.0 49.3 50.7 54.6 50.0 44.4 44.4 43.2 -53.4 -
Elderly households 55.9 56.3 55.5 54.4 49.0 46.9 47.0 48.8 -21.7 -
Single-parent households 35.5 37.3 36.7 37.8 36.8 36.4 35.8 34.4 -12.7 -
New-arrival households 38.5 38.6 37.9 36.9 36.5 32.4 31.8 30.1 -6.4 -
Households with children 17.6 17.2 17.1 17.8 16.5 16.2 16.0 15.3 -5.3 -
Youth households 4.2 3.8 4.4 4.8 4.0 3.8 3.6 4.7 -1.1 -
III. Economic characteristics
Economically active households 10.8 10.2 9.6 9.8 9.4 8.9 8.6 8.7 -3.6 -
Working households 9.4 9.1 8.7 9.1 8.7 8.3 8.0 8.0 -3.5 -
Unemployed households 75.5 73.1 74.3 64.5 66.6 68.5 69.9 69.8 -9.6 -
Economically inactive households 62.2 61.5 62.7 61.2 58.2 57.6 58.2 59.2 -18.1 -
IV. Housing characteristics
Public rental housing 25.7 25.5 24.7 25.2 22.5 21.4 21.1 20.1 -12.4 -
Tenants in private housing 8.4 7.3 7.3 6.9 8.3 8.8 9.2 9.2 -5.0 -
Owner-occupiers 12.3 12.2 11.7 11.5 11.4 11.5 11.7 12.9 -1.5 -
- with mortgages or loans 5.7 4.6 4.4 4.2 4.5 4.1 4.1 4.8 -0.5 -
- without mortgages and loans 17.2 17.0 16.3 15.8 15.5 15.6 15.8 17.1 -2.0 -
V. Age of household head
Household head aged between 18 and 64 12.9 12.5 12.0 12.1 11.6 11.2 11.1 11.2 -3.6 -
Household head aged 65 and above 32.4 32.3 31.5 30.6 27.8 27.2 27.2 28.2 -12.0 -
VI. District Council districts
Central and Western 11.8 11.9 11.4 11.4 11.1 11.0 11.9 12.0 -1.9 -
Wan Chai 11.3 11.8 11.7 12.4 10.9 13.0 13.6 12.7 -0.9 -
Eastern 12.7 12.7 13.1 13.0 13.2 13.3 13.6 11.3 -3.5 -
Southern 12.5 11.2 10.9 11.8 11.2 11.1 10.9 11.1 -4.3 -
Yau Tsim Mong 14.6 14.8 15.4 15.7 15.2 15.1 15.5 14.5 -4.0 -
Sham Shui Po 20.2 19.7 19.0 18.8 18.6 18.2 17.0 16.8 -7.8 -
Kowloon City 13.8 13.7 13.7 13.1 12.6 13.6 15.0 12.8 -4.1 -
Wong Tai Sin 17.9 19.2 17.4 18.7 16.2 16.4 16.2 15.4 -6.9 -
Kwun Tong 19.4 19.8 18.3 19.1 17.7 16.7 16.8 16.2 -8.1 -
Kwai Tsing 18.4 18.3 17.5 18.1 16.3 16.9 15.7 16.4 -7.7 -
Tsuen Wan 14.5 13.8 13.4 13.0 13.1 12.1 12.6 13.5 -4.1 -
Tuen Mun 17.2 17.2 16.9 15.9 16.1 14.9 14.4 15.3 -5.5 -
Yuen Long 19.7 19.5 17.6 18.6 14.9 14.8 16.0 16.8 -6.2 -
North 18.4 17.6 17.6 16.8 15.0 16.5 14.2 18.7 -4.6 -
Tai Po 14.9 13.1 12.5 11.1 12.6 12.9 12.0 16.0 -3.7 -
Sha Tin 13.8 12.9 12.4 12.8 13.2 12.4 12.7 13.9 -5.1 -
Sai Kung 12.0 10.1 10.5 10.7 11.3 10.0 9.7 12.2 -3.1 -
Islands 17.8 17.6 20.0 14.3 14.9 12.5 14.3 14.2 -5.9 -
After policy intervention
(recurrent cash)
2016Share in the corresponding group (%)
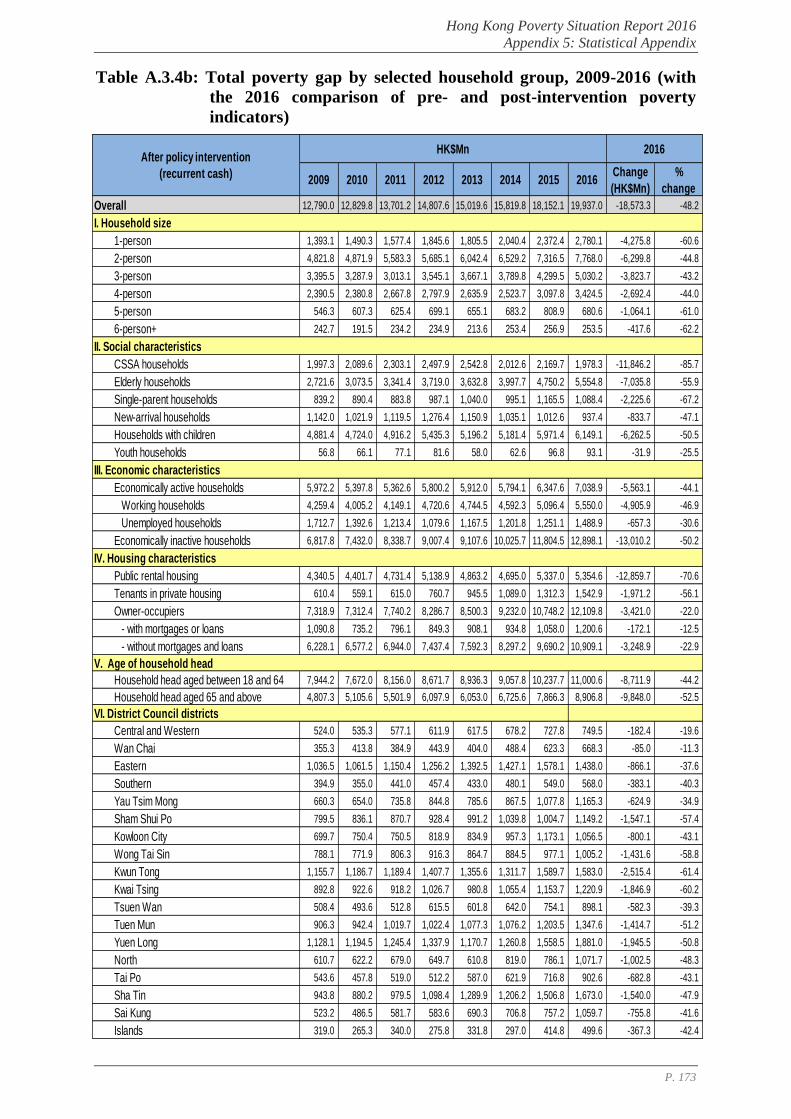
Hong Kong Poverty Situation Report 2016
Appendix 5: Statistical Appendix
P. 173
Table A.3.4b: Total poverty gap by selected household group, 2009-2016 (with
the 2016 comparison of pre- and post-intervention poverty
indicators)
2009 2010 2011 2012 2013 2014 2015 2016Change
(HK$Mn)
%
change
Overall 12,790.0 12,829.8 13,701.2 14,807.6 15,019.6 15,819.8 18,152.1 19,937.0 -18,573.3 -48.2
I. Household size
1-person 1,393.1 1,490.3 1,577.4 1,845.6 1,805.5 2,040.4 2,372.4 2,780.1 -4,275.8 -60.6
2-person 4,821.8 4,871.9 5,583.3 5,685.1 6,042.4 6,529.2 7,316.5 7,768.0 -6,299.8 -44.8
3-person 3,395.5 3,287.9 3,013.1 3,545.1 3,667.1 3,789.8 4,299.5 5,030.2 -3,823.7 -43.2
4-person 2,390.5 2,380.8 2,667.8 2,797.9 2,635.9 2,523.7 3,097.8 3,424.5 -2,692.4 -44.0
5-person 546.3 607.3 625.4 699.1 655.1 683.2 808.9 680.6 -1,064.1 -61.0
6-person+ 242.7 191.5 234.2 234.9 213.6 253.4 256.9 253.5 -417.6 -62.2
II. Social characteristics
CSSA households 1,997.3 2,089.6 2,303.1 2,497.9 2,542.8 2,012.6 2,169.7 1,978.3 -11,846.2 -85.7
Elderly households 2,721.6 3,073.5 3,341.4 3,719.0 3,632.8 3,997.7 4,750.2 5,554.8 -7,035.8 -55.9
Single-parent households 839.2 890.4 883.8 987.1 1,040.0 995.1 1,165.5 1,088.4 -2,225.6 -67.2
New-arrival households 1,142.0 1,021.9 1,119.5 1,276.4 1,150.9 1,035.1 1,012.6 937.4 -833.7 -47.1
Households with children 4,881.4 4,724.0 4,916.2 5,435.3 5,196.2 5,181.4 5,971.4 6,149.1 -6,262.5 -50.5
Youth households 56.8 66.1 77.1 81.6 58.0 62.6 96.8 93.1 -31.9 -25.5
III. Economic characteristics
Economically active households 5,972.2 5,397.8 5,362.6 5,800.2 5,912.0 5,794.1 6,347.6 7,038.9 -5,563.1 -44.1
Working households 4,259.4 4,005.2 4,149.1 4,720.6 4,744.5 4,592.3 5,096.4 5,550.0 -4,905.9 -46.9
Unemployed households 1,712.7 1,392.6 1,213.4 1,079.6 1,167.5 1,201.8 1,251.1 1,488.9 -657.3 -30.6
Economically inactive households 6,817.8 7,432.0 8,338.7 9,007.4 9,107.6 10,025.7 11,804.5 12,898.1 -13,010.2 -50.2
IV. Housing characteristics
Public rental housing 4,340.5 4,401.7 4,731.4 5,138.9 4,863.2 4,695.0 5,337.0 5,354.6 -12,859.7 -70.6
Tenants in private housing 610.4 559.1 615.0 760.7 945.5 1,089.0 1,312.3 1,542.9 -1,971.2 -56.1
Owner-occupiers 7,318.9 7,312.4 7,740.2 8,286.7 8,500.3 9,232.0 10,748.2 12,109.8 -3,421.0 -22.0
- with mortgages or loans 1,090.8 735.2 796.1 849.3 908.1 934.8 1,058.0 1,200.6 -172.1 -12.5
- without mortgages and loans 6,228.1 6,577.2 6,944.0 7,437.4 7,592.3 8,297.2 9,690.2 10,909.1 -3,248.9 -22.9
V. Age of household head
Household head aged between 18 and 64 7,944.2 7,672.0 8,156.0 8,671.7 8,936.3 9,057.8 10,237.7 11,000.6 -8,711.9 -44.2
Household head aged 65 and above 4,807.3 5,105.6 5,501.9 6,097.9 6,053.0 6,725.6 7,866.3 8,906.8 -9,848.0 -52.5
VI. District Council districts
Central and Western 524.0 535.3 577.1 611.9 617.5 678.2 727.8 749.5 -182.4 -19.6
Wan Chai 355.3 413.8 384.9 443.9 404.0 488.4 623.3 668.3 -85.0 -11.3
Eastern 1,036.5 1,061.5 1,150.4 1,256.2 1,392.5 1,427.1 1,578.1 1,438.0 -866.1 -37.6
Southern 394.9 355.0 441.0 457.4 433.0 480.1 549.0 568.0 -383.1 -40.3
Yau Tsim Mong 660.3 654.0 735.8 844.8 785.6 867.5 1,077.8 1,165.3 -624.9 -34.9
Sham Shui Po 799.5 836.1 870.7 928.4 991.2 1,039.8 1,004.7 1,149.2 -1,547.1 -57.4
Kowloon City 699.7 750.4 750.5 818.9 834.9 957.3 1,173.1 1,056.5 -800.1 -43.1
Wong Tai Sin 788.1 771.9 806.3 916.3 864.7 884.5 977.1 1,005.2 -1,431.6 -58.8
Kwun Tong 1,155.7 1,186.7 1,189.4 1,407.7 1,355.6 1,311.7 1,589.7 1,583.0 -2,515.4 -61.4
Kwai Tsing 892.8 922.6 918.2 1,026.7 980.8 1,055.4 1,153.7 1,220.9 -1,846.9 -60.2
Tsuen Wan 508.4 493.6 512.8 615.5 601.8 642.0 754.1 898.1 -582.3 -39.3
Tuen Mun 906.3 942.4 1,019.7 1,022.4 1,077.3 1,076.2 1,203.5 1,347.6 -1,414.7 -51.2
Yuen Long 1,128.1 1,194.5 1,245.4 1,337.9 1,170.7 1,260.8 1,558.5 1,881.0 -1,945.5 -50.8
North 610.7 622.2 679.0 649.7 610.8 819.0 786.1 1,071.7 -1,002.5 -48.3
Tai Po 543.6 457.8 519.0 512.2 587.0 621.9 716.8 902.6 -682.8 -43.1
Sha Tin 943.8 880.2 979.5 1,098.4 1,289.9 1,206.2 1,506.8 1,673.0 -1,540.0 -47.9
Sai Kung 523.2 486.5 581.7 583.6 690.3 706.8 757.2 1,059.7 -755.8 -41.6
Islands 319.0 265.3 340.0 275.8 331.8 297.0 414.8 499.6 -367.3 -42.4
After policy intervention
(recurrent cash)
2016HK$Mn
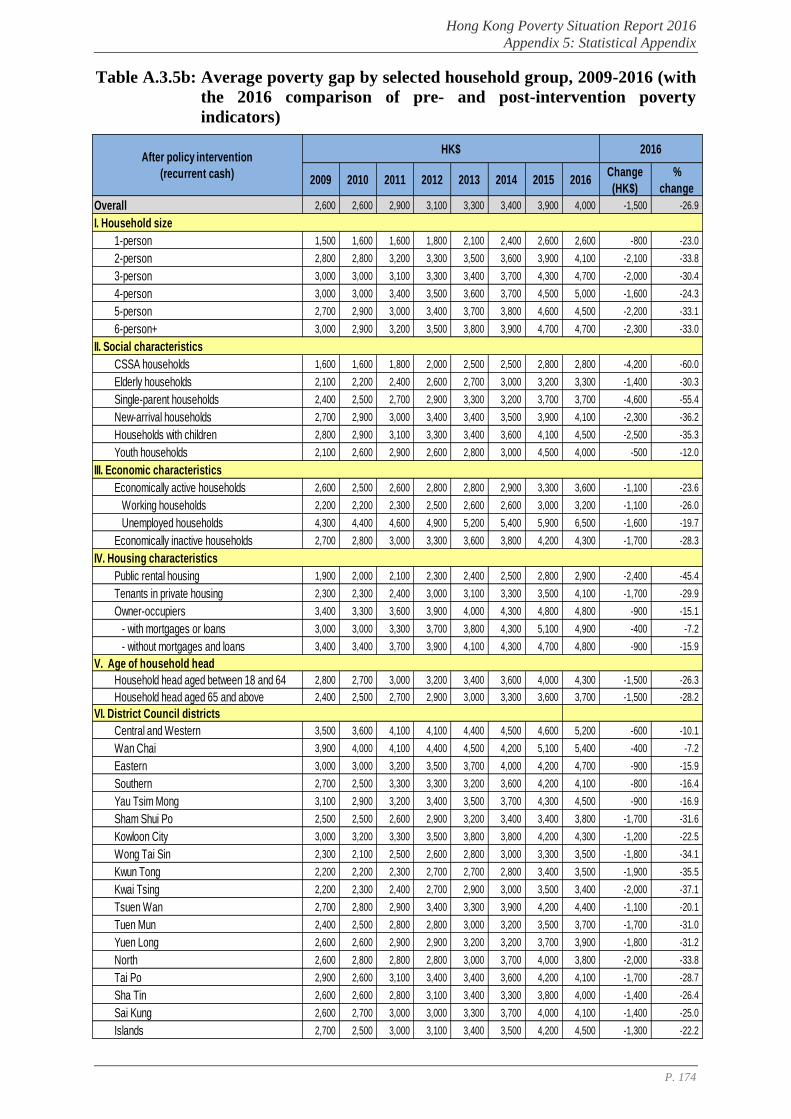
Hong Kong Poverty Situation Report 2016
Appendix 5: Statistical Appendix
P. 174
Table A.3.5b: Average poverty gap by selected household group, 2009-2016 (with
the 2016 comparison of pre- and post-intervention poverty
indicators)
2009 2010 2011 2012 2013 2014 2015 2016Change
(HK$)
%
change
Overall 2,600 2,600 2,900 3,100 3,300 3,400 3,900 4,000 -1,500 -26.9
I. Household size
1-person 1,500 1,600 1,600 1,800 2,100 2,400 2,600 2,600 -800 -23.0
2-person 2,800 2,800 3,200 3,300 3,500 3,600 3,900 4,100 -2,100 -33.8
3-person 3,000 3,000 3,100 3,300 3,400 3,700 4,300 4,700 -2,000 -30.4
4-person 3,000 3,000 3,400 3,500 3,600 3,700 4,500 5,000 -1,600 -24.3
5-person 2,700 2,900 3,000 3,400 3,700 3,800 4,600 4,500 -2,200 -33.1
6-person+ 3,000 2,900 3,200 3,500 3,800 3,900 4,700 4,700 -2,300 -33.0
II. Social characteristics
CSSA households 1,600 1,600 1,800 2,000 2,500 2,500 2,800 2,800 -4,200 -60.0
Elderly households 2,100 2,200 2,400 2,600 2,700 3,000 3,200 3,300 -1,400 -30.3
Single-parent households 2,400 2,500 2,700 2,900 3,300 3,200 3,700 3,700 -4,600 -55.4
New-arrival households 2,700 2,900 3,000 3,400 3,400 3,500 3,900 4,100 -2,300 -36.2
Households with children 2,800 2,900 3,100 3,300 3,400 3,600 4,100 4,500 -2,500 -35.3
Youth households 2,100 2,600 2,900 2,600 2,800 3,000 4,500 4,000 -500 -12.0
III. Economic characteristics
Economically active households 2,600 2,500 2,600 2,800 2,800 2,900 3,300 3,600 -1,100 -23.6
Working households 2,200 2,200 2,300 2,500 2,600 2,600 3,000 3,200 -1,100 -26.0
Unemployed households 4,300 4,400 4,600 4,900 5,200 5,400 5,900 6,500 -1,600 -19.7
Economically inactive households 2,700 2,800 3,000 3,300 3,600 3,800 4,200 4,300 -1,700 -28.3
IV. Housing characteristics
Public rental housing 1,900 2,000 2,100 2,300 2,400 2,500 2,800 2,900 -2,400 -45.4
Tenants in private housing 2,300 2,300 2,400 3,000 3,100 3,300 3,500 4,100 -1,700 -29.9
Owner-occupiers 3,400 3,300 3,600 3,900 4,000 4,300 4,800 4,800 -900 -15.1
- with mortgages or loans 3,000 3,000 3,300 3,700 3,800 4,300 5,100 4,900 -400 -7.2
- without mortgages and loans 3,400 3,400 3,700 3,900 4,100 4,300 4,700 4,800 -900 -15.9
V. Age of household head
Household head aged between 18 and 64 2,800 2,700 3,000 3,200 3,400 3,600 4,000 4,300 -1,500 -26.3
Household head aged 65 and above 2,400 2,500 2,700 2,900 3,000 3,300 3,600 3,700 -1,500 -28.2
VI. District Council districts
Central and Western 3,500 3,600 4,100 4,100 4,400 4,500 4,600 5,200 -600 -10.1
Wan Chai 3,900 4,000 4,100 4,400 4,500 4,200 5,100 5,400 -400 -7.2
Eastern 3,000 3,000 3,200 3,500 3,700 4,000 4,200 4,700 -900 -15.9
Southern 2,700 2,500 3,300 3,300 3,200 3,600 4,200 4,100 -800 -16.4
Yau Tsim Mong 3,100 2,900 3,200 3,400 3,500 3,700 4,300 4,500 -900 -16.9
Sham Shui Po 2,500 2,500 2,600 2,900 3,200 3,400 3,400 3,800 -1,700 -31.6
Kowloon City 3,000 3,200 3,300 3,500 3,800 3,800 4,200 4,300 -1,200 -22.5
Wong Tai Sin 2,300 2,100 2,500 2,600 2,800 3,000 3,300 3,500 -1,800 -34.1
Kwun Tong 2,200 2,200 2,300 2,700 2,700 2,800 3,400 3,500 -1,900 -35.5
Kwai Tsing 2,200 2,300 2,400 2,700 2,900 3,000 3,500 3,400 -2,000 -37.1
Tsuen Wan 2,700 2,800 2,900 3,400 3,300 3,900 4,200 4,400 -1,100 -20.1
Tuen Mun 2,400 2,500 2,800 2,800 3,000 3,200 3,500 3,700 -1,700 -31.0
Yuen Long 2,600 2,600 2,900 2,900 3,200 3,200 3,700 3,900 -1,800 -31.2
North 2,600 2,800 2,800 2,800 3,000 3,700 4,000 3,800 -2,000 -33.8
Tai Po 2,900 2,600 3,100 3,400 3,400 3,600 4,200 4,100 -1,700 -28.7
Sha Tin 2,600 2,600 2,800 3,100 3,400 3,300 3,800 4,000 -1,400 -26.4
Sai Kung 2,600 2,700 3,000 3,000 3,300 3,700 4,000 4,100 -1,400 -25.0
Islands 2,700 2,500 3,000 3,100 3,400 3,500 4,200 4,500 -1,300 -22.2
After policy intervention
(recurrent cash)
2016HK$
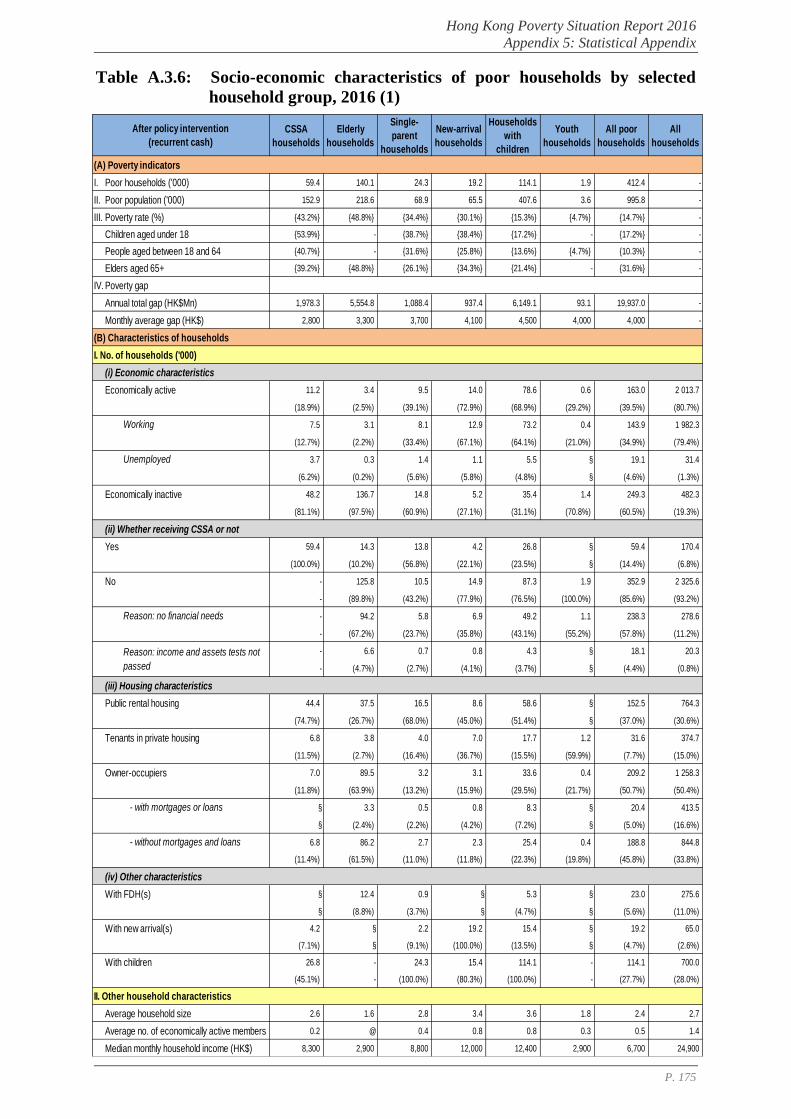
Hong Kong Poverty Situation Report 2016
Appendix 5: Statistical Appendix
P. 175
Table A.3.6: Socio-economic characteristics of poor households by selected
household group, 2016 (1)
CSSA
households
Elderly
households
Single-
parent
households
New-arrival
households
Households
with
children
Youth
households
All poor
households
All
households
(A) Poverty indicators
I. Poor households ('000) 59.4 140.1 24.3 19.2 114.1 1.9 412.4 -
II. Poor population ('000) 152.9 218.6 68.9 65.5 407.6 3.6 995.8 -
III. Poverty rate (%) {43.2%} {48.8%} {34.4%} {30.1%} {15.3%} {4.7%} {14.7%} -
Children aged under 18 {53.9%} - {38.7%} {38.4%} {17.2%} - {17.2%} -
People aged between 18 and 64 {40.7%} - {31.6%} {25.8%} {13.6%} {4.7%} {10.3%} -
Elders aged 65+ {39.2%} {48.8%} {26.1%} {34.3%} {21.4%} - {31.6%} -
IV. Poverty gap
Annual total gap (HK$Mn) 1,978.3 5,554.8 1,088.4 937.4 6,149.1 93.1 19,937.0 -
Monthly average gap (HK$) 2,800 3,300 3,700 4,100 4,500 4,000 4,000 -
(B) Characteristics of households
I. No. of households ('000)
(i) Economic characteristics
Economically active 11.2 3.4 9.5 14.0 78.6 0.6 163.0 2 013.7
(18.9%) (2.5%) (39.1%) (72.9%) (68.9%) (29.2%) (39.5%) (80.7%)
Working 7.5 3.1 8.1 12.9 73.2 0.4 143.9 1 982.3
(12.7%) (2.2%) (33.4%) (67.1%) (64.1%) (21.0%) (34.9%) (79.4%)
Unemployed 3.7 0.3 1.4 1.1 5.5 § 19.1 31.4
(6.2%) (0.2%) (5.6%) (5.8%) (4.8%) § (4.6%) (1.3%)
Economically inactive 48.2 136.7 14.8 5.2 35.4 1.4 249.3 482.3
(81.1%) (97.5%) (60.9%) (27.1%) (31.1%) (70.8%) (60.5%) (19.3%)
(ii) Whether receiving CSSA or not
Yes 59.4 14.3 13.8 4.2 26.8 § 59.4 170.4
(100.0%) (10.2%) (56.8%) (22.1%) (23.5%) § (14.4%) (6.8%)
No - 125.8 10.5 14.9 87.3 1.9 352.9 2 325.6
- (89.8%) (43.2%) (77.9%) (76.5%) (100.0%) (85.6%) (93.2%)
Reason: no financial needs - 94.2 5.8 6.9 49.2 1.1 238.3 278.6
- (67.2%) (23.7%) (35.8%) (43.1%) (55.2%) (57.8%) (11.2%)
- 6.6 0.7 0.8 4.3 § 18.1 20.3
- (4.7%) (2.7%) (4.1%) (3.7%) § (4.4%) (0.8%)
(iii) Housing characteristics
Public rental housing 44.4 37.5 16.5 8.6 58.6 § 152.5 764.3
(74.7%) (26.7%) (68.0%) (45.0%) (51.4%) § (37.0%) (30.6%)
Tenants in private housing 6.8 3.8 4.0 7.0 17.7 1.2 31.6 374.7
(11.5%) (2.7%) (16.4%) (36.7%) (15.5%) (59.9%) (7.7%) (15.0%)
Owner-occupiers 7.0 89.5 3.2 3.1 33.6 0.4 209.2 1 258.3
(11.8%) (63.9%) (13.2%) (15.9%) (29.5%) (21.7%) (50.7%) (50.4%)
- with mortgages or loans § 3.3 0.5 0.8 8.3 § 20.4 413.5
§ (2.4%) (2.2%) (4.2%) (7.2%) § (5.0%) (16.6%)
- without mortgages and loans 6.8 86.2 2.7 2.3 25.4 0.4 188.8 844.8
(11.4%) (61.5%) (11.0%) (11.8%) (22.3%) (19.8%) (45.8%) (33.8%)
(iv) Other characteristics
With FDH(s) § 12.4 0.9 § 5.3 § 23.0 275.6
§ (8.8%) (3.7%) § (4.7%) § (5.6%) (11.0%)
With new arrival(s) 4.2 § 2.2 19.2 15.4 § 19.2 65.0
(7.1%) § (9.1%) (100.0%) (13.5%) § (4.7%) (2.6%)
With children 26.8 - 24.3 15.4 114.1 - 114.1 700.0
(45.1%) - (100.0%) (80.3%) (100.0%) - (27.7%) (28.0%)
II. Other household characteristics
Average household size 2.6 1.6 2.8 3.4 3.6 1.8 2.4 2.7
Average no. of economically active members 0.2 @ 0.4 0.8 0.8 0.3 0.5 1.4
Median monthly household income (HK$) 8,300 2,900 8,800 12,000 12,400 2,900 6,700 24,900
After policy intervention
(recurrent cash)
Reason: income and assets tests not
passed
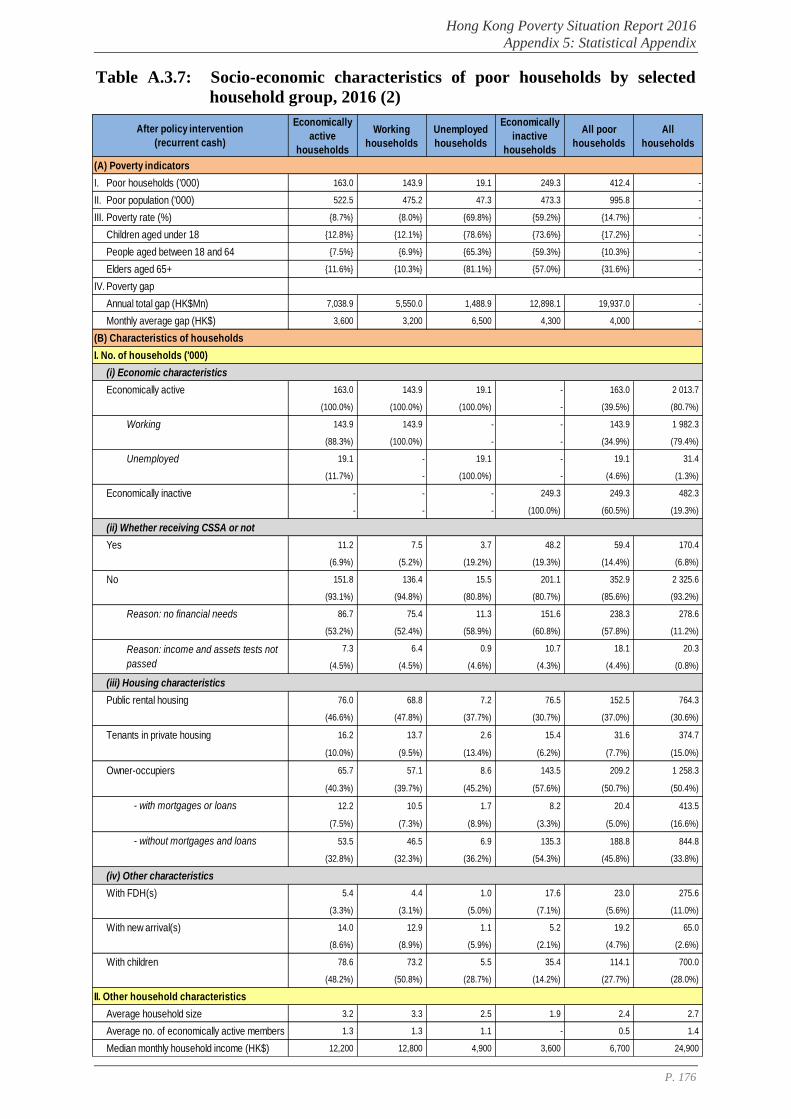
Hong Kong Poverty Situation Report 2016
Appendix 5: Statistical Appendix
P. 176
Table A.3.7: Socio-economic characteristics of poor households by selected
household group, 2016 (2)
Economically
active
households
Working
households
Unemployed
households
Economically
inactive
households
All poor
households
All
households
(A) Poverty indicators
I. Poor households ('000) 163.0 143.9 19.1 249.3 412.4 -
II. Poor population ('000) 522.5 475.2 47.3 473.3 995.8 -
III. Poverty rate (%) {8.7%} {8.0%} {69.8%} {59.2%} {14.7%} -
Children aged under 18 {12.8%} {12.1%} {78.6%} {73.6%} {17.2%} -
People aged between 18 and 64 {7.5%} {6.9%} {65.3%} {59.3%} {10.3%} -
Elders aged 65+ {11.6%} {10.3%} {81.1%} {57.0%} {31.6%} -
IV. Poverty gap
Annual total gap (HK$Mn) 7,038.9 5,550.0 1,488.9 12,898.1 19,937.0 -
Monthly average gap (HK$) 3,600 3,200 6,500 4,300 4,000 -
(B) Characteristics of households
I. No. of households ('000)
(i) Economic characteristics
Economically active 163.0 143.9 19.1 - 163.0 2 013.7
(100.0%) (100.0%) (100.0%) - (39.5%) (80.7%)
Working 143.9 143.9 - - 143.9 1 982.3
(88.3%) (100.0%) - - (34.9%) (79.4%)
Unemployed 19.1 - 19.1 - 19.1 31.4
(11.7%) - (100.0%) - (4.6%) (1.3%)
Economically inactive - - - 249.3 249.3 482.3
- - - (100.0%) (60.5%) (19.3%)
(ii) Whether receiving CSSA or not
Yes 11.2 7.5 3.7 48.2 59.4 170.4
(6.9%) (5.2%) (19.2%) (19.3%) (14.4%) (6.8%)
No 151.8 136.4 15.5 201.1 352.9 2 325.6
(93.1%) (94.8%) (80.8%) (80.7%) (85.6%) (93.2%)
Reason: no financial needs 86.7 75.4 11.3 151.6 238.3 278.6
(53.2%) (52.4%) (58.9%) (60.8%) (57.8%) (11.2%)
7.3 6.4 0.9 10.7 18.1 20.3
(4.5%) (4.5%) (4.6%) (4.3%) (4.4%) (0.8%)
(iii) Housing characteristics
Public rental housing 76.0 68.8 7.2 76.5 152.5 764.3
(46.6%) (47.8%) (37.7%) (30.7%) (37.0%) (30.6%)
Tenants in private housing 16.2 13.7 2.6 15.4 31.6 374.7
(10.0%) (9.5%) (13.4%) (6.2%) (7.7%) (15.0%)
Owner-occupiers 65.7 57.1 8.6 143.5 209.2 1 258.3
(40.3%) (39.7%) (45.2%) (57.6%) (50.7%) (50.4%)
- with mortgages or loans 12.2 10.5 1.7 8.2 20.4 413.5
(7.5%) (7.3%) (8.9%) (3.3%) (5.0%) (16.6%)
- without mortgages and loans 53.5 46.5 6.9 135.3 188.8 844.8
(32.8%) (32.3%) (36.2%) (54.3%) (45.8%) (33.8%)
(iv) Other characteristics
With FDH(s) 5.4 4.4 1.0 17.6 23.0 275.6
(3.3%) (3.1%) (5.0%) (7.1%) (5.6%) (11.0%)
With new arrival(s) 14.0 12.9 1.1 5.2 19.2 65.0
(8.6%) (8.9%) (5.9%) (2.1%) (4.7%) (2.6%)
With children 78.6 73.2 5.5 35.4 114.1 700.0
(48.2%) (50.8%) (28.7%) (14.2%) (27.7%) (28.0%)
II. Other household characteristics
Average household size 3.2 3.3 2.5 1.9 2.4 2.7
Average no. of economically active members 1.3 1.3 1.1 - 0.5 1.4
Median monthly household income (HK$) 12,200 12,800 4,900 3,600 6,700 24,900
After policy intervention
(recurrent cash)
Reason: income and assets tests not
passed
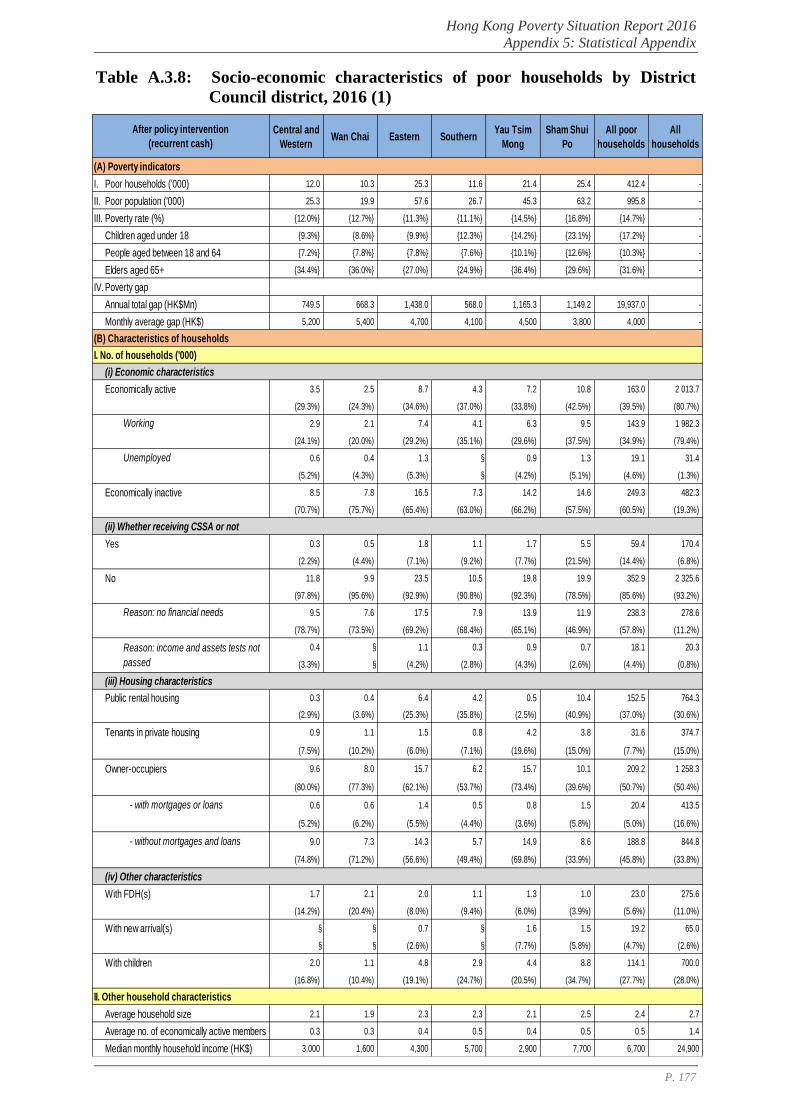
Hong Kong Poverty Situation Report 2016
Appendix 5: Statistical Appendix
P. 177
Table A.3.8: Socio-economic characteristics of poor households by District
Council district, 2016 (1)
Central and
WesternWan Chai Eastern Southern
Yau Tsim
Mong
Sham Shui
Po
All poor
households
All
households
(A) Poverty indicators
I. Poor households ('000) 12.0 10.3 25.3 11.6 21.4 25.4 412.4 -
II. Poor population ('000) 25.3 19.9 57.6 26.7 45.3 63.2 995.8 -
III. Poverty rate (%) {12.0%} {12.7%} {11.3%} {11.1%} {14.5%} {16.8%} {14.7%} -
Children aged under 18 {9.3%} {8.6%} {9.9%} {12.3%} {14.2%} {23.1%} {17.2%} -
People aged between 18 and 64 {7.2%} {7.8%} {7.8%} {7.6%} {10.1%} {12.6%} {10.3%} -
Elders aged 65+ {34.4%} {36.0%} {27.0%} {24.9%} {36.4%} {29.6%} {31.6%} -
IV. Poverty gap
Annual total gap (HK$Mn) 749.5 668.3 1,438.0 568.0 1,165.3 1,149.2 19,937.0 -
Monthly average gap (HK$) 5,200 5,400 4,700 4,100 4,500 3,800 4,000 -
(B) Characteristics of households
I. No. of households ('000)
(i) Economic characteristics
Economically active 3.5 2.5 8.7 4.3 7.2 10.8 163.0 2 013.7
(29.3%) (24.3%) (34.6%) (37.0%) (33.8%) (42.5%) (39.5%) (80.7%)
Working 2.9 2.1 7.4 4.1 6.3 9.5 143.9 1 982.3
(24.1%) (20.0%) (29.2%) (35.1%) (29.6%) (37.5%) (34.9%) (79.4%)
Unemployed 0.6 0.4 1.3 § 0.9 1.3 19.1 31.4
(5.2%) (4.3%) (5.3%) § (4.2%) (5.1%) (4.6%) (1.3%)
Economically inactive 8.5 7.8 16.5 7.3 14.2 14.6 249.3 482.3
(70.7%) (75.7%) (65.4%) (63.0%) (66.2%) (57.5%) (60.5%) (19.3%)
(ii) Whether receiving CSSA or not
Yes 0.3 0.5 1.8 1.1 1.7 5.5 59.4 170.4
(2.2%) (4.4%) (7.1%) (9.2%) (7.7%) (21.5%) (14.4%) (6.8%)
No 11.8 9.9 23.5 10.5 19.8 19.9 352.9 2 325.6
(97.8%) (95.6%) (92.9%) (90.8%) (92.3%) (78.5%) (85.6%) (93.2%)
Reason: no financial needs 9.5 7.6 17.5 7.9 13.9 11.9 238.3 278.6
(78.7%) (73.5%) (69.2%) (68.4%) (65.1%) (46.9%) (57.8%) (11.2%)
0.4 § 1.1 0.3 0.9 0.7 18.1 20.3
(3.3%) § (4.2%) (2.8%) (4.3%) (2.6%) (4.4%) (0.8%)
(iii) Housing characteristics
Public rental housing 0.3 0.4 6.4 4.2 0.5 10.4 152.5 764.3
(2.9%) (3.6%) (25.3%) (35.8%) (2.5%) (40.9%) (37.0%) (30.6%)
Tenants in private housing 0.9 1.1 1.5 0.8 4.2 3.8 31.6 374.7
(7.5%) (10.2%) (6.0%) (7.1%) (19.6%) (15.0%) (7.7%) (15.0%)
Owner-occupiers 9.6 8.0 15.7 6.2 15.7 10.1 209.2 1 258.3
(80.0%) (77.3%) (62.1%) (53.7%) (73.4%) (39.6%) (50.7%) (50.4%)
- with mortgages or loans 0.6 0.6 1.4 0.5 0.8 1.5 20.4 413.5
(5.2%) (6.2%) (5.5%) (4.4%) (3.6%) (5.8%) (5.0%) (16.6%)
- without mortgages and loans 9.0 7.3 14.3 5.7 14.9 8.6 188.8 844.8
(74.8%) (71.2%) (56.6%) (49.4%) (69.8%) (33.9%) (45.8%) (33.8%)
(iv) Other characteristics
With FDH(s) 1.7 2.1 2.0 1.1 1.3 1.0 23.0 275.6
(14.2%) (20.4%) (8.0%) (9.4%) (6.0%) (3.9%) (5.6%) (11.0%)
With new arrival(s) § § 0.7 § 1.6 1.5 19.2 65.0
§ § (2.6%) § (7.7%) (5.8%) (4.7%) (2.6%)
With children 2.0 1.1 4.8 2.9 4.4 8.8 114.1 700.0
(16.8%) (10.4%) (19.1%) (24.7%) (20.5%) (34.7%) (27.7%) (28.0%)
II. Other household characteristics
Average household size 2.1 1.9 2.3 2.3 2.1 2.5 2.4 2.7
Average no. of economically active members 0.3 0.3 0.4 0.5 0.4 0.5 0.5 1.4
Median monthly household income (HK$) 3,000 1,600 4,300 5,700 2,900 7,700 6,700 24,900
After policy intervention
(recurrent cash)
Reason: income and assets tests not
passed
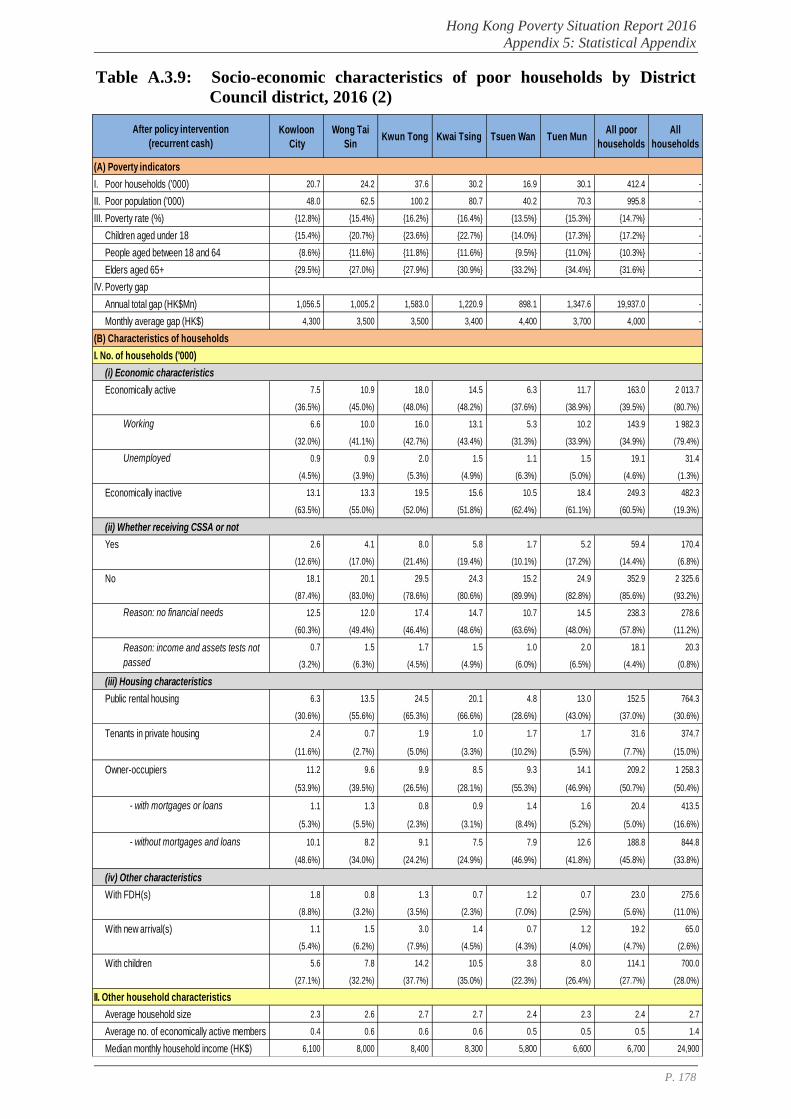
Hong Kong Poverty Situation Report 2016
Appendix 5: Statistical Appendix
P. 178
Table A.3.9: Socio-economic characteristics of poor households by District
Council district, 2016 (2)
Kowloon
City
Wong Tai
SinKwun Tong Kwai Tsing Tsuen Wan Tuen Mun
All poor
households
All
households
(A) Poverty indicators
I. Poor households ('000) 20.7 24.2 37.6 30.2 16.9 30.1 412.4 -
II. Poor population ('000) 48.0 62.5 100.2 80.7 40.2 70.3 995.8 -
III. Poverty rate (%) {12.8%} {15.4%} {16.2%} {16.4%} {13.5%} {15.3%} {14.7%} -
Children aged under 18 {15.4%} {20.7%} {23.6%} {22.7%} {14.0%} {17.3%} {17.2%} -
People aged between 18 and 64 {8.6%} {11.6%} {11.8%} {11.6%} {9.5%} {11.0%} {10.3%} -
Elders aged 65+ {29.5%} {27.0%} {27.9%} {30.9%} {33.2%} {34.4%} {31.6%} -
IV. Poverty gap
Annual total gap (HK$Mn) 1,056.5 1,005.2 1,583.0 1,220.9 898.1 1,347.6 19,937.0 -
Monthly average gap (HK$) 4,300 3,500 3,500 3,400 4,400 3,700 4,000 -
(B) Characteristics of households
I. No. of households ('000)
(i) Economic characteristics
Economically active 7.5 10.9 18.0 14.5 6.3 11.7 163.0 2 013.7
(36.5%) (45.0%) (48.0%) (48.2%) (37.6%) (38.9%) (39.5%) (80.7%)
Working 6.6 10.0 16.0 13.1 5.3 10.2 143.9 1 982.3
(32.0%) (41.1%) (42.7%) (43.4%) (31.3%) (33.9%) (34.9%) (79.4%)
Unemployed 0.9 0.9 2.0 1.5 1.1 1.5 19.1 31.4
(4.5%) (3.9%) (5.3%) (4.9%) (6.3%) (5.0%) (4.6%) (1.3%)
Economically inactive 13.1 13.3 19.5 15.6 10.5 18.4 249.3 482.3
(63.5%) (55.0%) (52.0%) (51.8%) (62.4%) (61.1%) (60.5%) (19.3%)
(ii) Whether receiving CSSA or not
Yes 2.6 4.1 8.0 5.8 1.7 5.2 59.4 170.4
(12.6%) (17.0%) (21.4%) (19.4%) (10.1%) (17.2%) (14.4%) (6.8%)
No 18.1 20.1 29.5 24.3 15.2 24.9 352.9 2 325.6
(87.4%) (83.0%) (78.6%) (80.6%) (89.9%) (82.8%) (85.6%) (93.2%)
Reason: no financial needs 12.5 12.0 17.4 14.7 10.7 14.5 238.3 278.6
(60.3%) (49.4%) (46.4%) (48.6%) (63.6%) (48.0%) (57.8%) (11.2%)
0.7 1.5 1.7 1.5 1.0 2.0 18.1 20.3
(3.2%) (6.3%) (4.5%) (4.9%) (6.0%) (6.5%) (4.4%) (0.8%)
(iii) Housing characteristics
Public rental housing 6.3 13.5 24.5 20.1 4.8 13.0 152.5 764.3
(30.6%) (55.6%) (65.3%) (66.6%) (28.6%) (43.0%) (37.0%) (30.6%)
Tenants in private housing 2.4 0.7 1.9 1.0 1.7 1.7 31.6 374.7
(11.6%) (2.7%) (5.0%) (3.3%) (10.2%) (5.5%) (7.7%) (15.0%)
Owner-occupiers 11.2 9.6 9.9 8.5 9.3 14.1 209.2 1 258.3
(53.9%) (39.5%) (26.5%) (28.1%) (55.3%) (46.9%) (50.7%) (50.4%)
- with mortgages or loans 1.1 1.3 0.8 0.9 1.4 1.6 20.4 413.5
(5.3%) (5.5%) (2.3%) (3.1%) (8.4%) (5.2%) (5.0%) (16.6%)
- without mortgages and loans 10.1 8.2 9.1 7.5 7.9 12.6 188.8 844.8
(48.6%) (34.0%) (24.2%) (24.9%) (46.9%) (41.8%) (45.8%) (33.8%)
(iv) Other characteristics
With FDH(s) 1.8 0.8 1.3 0.7 1.2 0.7 23.0 275.6
(8.8%) (3.2%) (3.5%) (2.3%) (7.0%) (2.5%) (5.6%) (11.0%)
With new arrival(s) 1.1 1.5 3.0 1.4 0.7 1.2 19.2 65.0
(5.4%) (6.2%) (7.9%) (4.5%) (4.3%) (4.0%) (4.7%) (2.6%)
With children 5.6 7.8 14.2 10.5 3.8 8.0 114.1 700.0
(27.1%) (32.2%) (37.7%) (35.0%) (22.3%) (26.4%) (27.7%) (28.0%)
II. Other household characteristics
Average household size 2.3 2.6 2.7 2.7 2.4 2.3 2.4 2.7
Average no. of economically active members 0.4 0.6 0.6 0.6 0.5 0.5 0.5 1.4
Median monthly household income (HK$) 6,100 8,000 8,400 8,300 5,800 6,600 6,700 24,900
After policy intervention
(recurrent cash)
Reason: income and assets tests not
passed
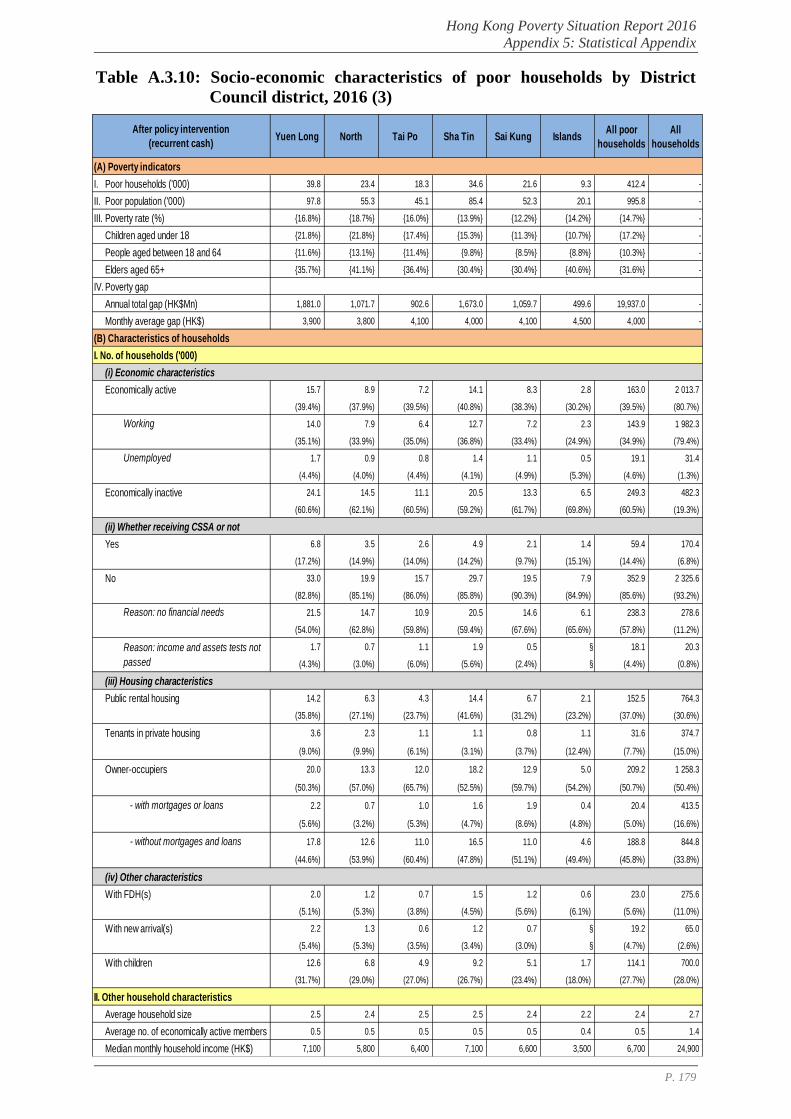
Hong Kong Poverty Situation Report 2016
Appendix 5: Statistical Appendix
P. 179
Table A.3.10: Socio-economic characteristics of poor households by District
Council district, 2016 (3)
Yuen Long North Tai Po Sha Tin Sai Kung IslandsAll poor
households
All
households
(A) Poverty indicators
I. Poor households ('000) 39.8 23.4 18.3 34.6 21.6 9.3 412.4 -
II. Poor population ('000) 97.8 55.3 45.1 85.4 52.3 20.1 995.8 -
III. Poverty rate (%) {16.8%} {18.7%} {16.0%} {13.9%} {12.2%} {14.2%} {14.7%} -
Children aged under 18 {21.8%} {21.8%} {17.4%} {15.3%} {11.3%} {10.7%} {17.2%} -
People aged between 18 and 64 {11.6%} {13.1%} {11.4%} {9.8%} {8.5%} {8.8%} {10.3%} -
Elders aged 65+ {35.7%} {41.1%} {36.4%} {30.4%} {30.4%} {40.6%} {31.6%} -
IV. Poverty gap
Annual total gap (HK$Mn) 1,881.0 1,071.7 902.6 1,673.0 1,059.7 499.6 19,937.0 -
Monthly average gap (HK$) 3,900 3,800 4,100 4,000 4,100 4,500 4,000 -
(B) Characteristics of households
I. No. of households ('000)
(i) Economic characteristics
Economically active 15.7 8.9 7.2 14.1 8.3 2.8 163.0 2 013.7
(39.4%) (37.9%) (39.5%) (40.8%) (38.3%) (30.2%) (39.5%) (80.7%)
Working 14.0 7.9 6.4 12.7 7.2 2.3 143.9 1 982.3
(35.1%) (33.9%) (35.0%) (36.8%) (33.4%) (24.9%) (34.9%) (79.4%)
Unemployed 1.7 0.9 0.8 1.4 1.1 0.5 19.1 31.4
(4.4%) (4.0%) (4.4%) (4.1%) (4.9%) (5.3%) (4.6%) (1.3%)
Economically inactive 24.1 14.5 11.1 20.5 13.3 6.5 249.3 482.3
(60.6%) (62.1%) (60.5%) (59.2%) (61.7%) (69.8%) (60.5%) (19.3%)
(ii) Whether receiving CSSA or not
Yes 6.8 3.5 2.6 4.9 2.1 1.4 59.4 170.4
(17.2%) (14.9%) (14.0%) (14.2%) (9.7%) (15.1%) (14.4%) (6.8%)
No 33.0 19.9 15.7 29.7 19.5 7.9 352.9 2 325.6
(82.8%) (85.1%) (86.0%) (85.8%) (90.3%) (84.9%) (85.6%) (93.2%)
Reason: no financial needs 21.5 14.7 10.9 20.5 14.6 6.1 238.3 278.6
(54.0%) (62.8%) (59.8%) (59.4%) (67.6%) (65.6%) (57.8%) (11.2%)
1.7 0.7 1.1 1.9 0.5 § 18.1 20.3
(4.3%) (3.0%) (6.0%) (5.6%) (2.4%) § (4.4%) (0.8%)
(iii) Housing characteristics
Public rental housing 14.2 6.3 4.3 14.4 6.7 2.1 152.5 764.3
(35.8%) (27.1%) (23.7%) (41.6%) (31.2%) (23.2%) (37.0%) (30.6%)
Tenants in private housing 3.6 2.3 1.1 1.1 0.8 1.1 31.6 374.7
(9.0%) (9.9%) (6.1%) (3.1%) (3.7%) (12.4%) (7.7%) (15.0%)
Owner-occupiers 20.0 13.3 12.0 18.2 12.9 5.0 209.2 1 258.3
(50.3%) (57.0%) (65.7%) (52.5%) (59.7%) (54.2%) (50.7%) (50.4%)
- with mortgages or loans 2.2 0.7 1.0 1.6 1.9 0.4 20.4 413.5
(5.6%) (3.2%) (5.3%) (4.7%) (8.6%) (4.8%) (5.0%) (16.6%)
- without mortgages and loans 17.8 12.6 11.0 16.5 11.0 4.6 188.8 844.8
(44.6%) (53.9%) (60.4%) (47.8%) (51.1%) (49.4%) (45.8%) (33.8%)
(iv) Other characteristics
With FDH(s) 2.0 1.2 0.7 1.5 1.2 0.6 23.0 275.6
(5.1%) (5.3%) (3.8%) (4.5%) (5.6%) (6.1%) (5.6%) (11.0%)
With new arrival(s) 2.2 1.3 0.6 1.2 0.7 § 19.2 65.0
(5.4%) (5.3%) (3.5%) (3.4%) (3.0%) § (4.7%) (2.6%)
With children 12.6 6.8 4.9 9.2 5.1 1.7 114.1 700.0
(31.7%) (29.0%) (27.0%) (26.7%) (23.4%) (18.0%) (27.7%) (28.0%)
II. Other household characteristics
Average household size 2.5 2.4 2.5 2.5 2.4 2.2 2.4 2.7
Average no. of economically active members 0.5 0.5 0.5 0.5 0.5 0.4 0.5 1.4
Median monthly household income (HK$) 7,100 5,800 6,400 7,100 6,600 3,500 6,700 24,900
After policy intervention
(recurrent cash)
Reason: income and assets tests not
passed
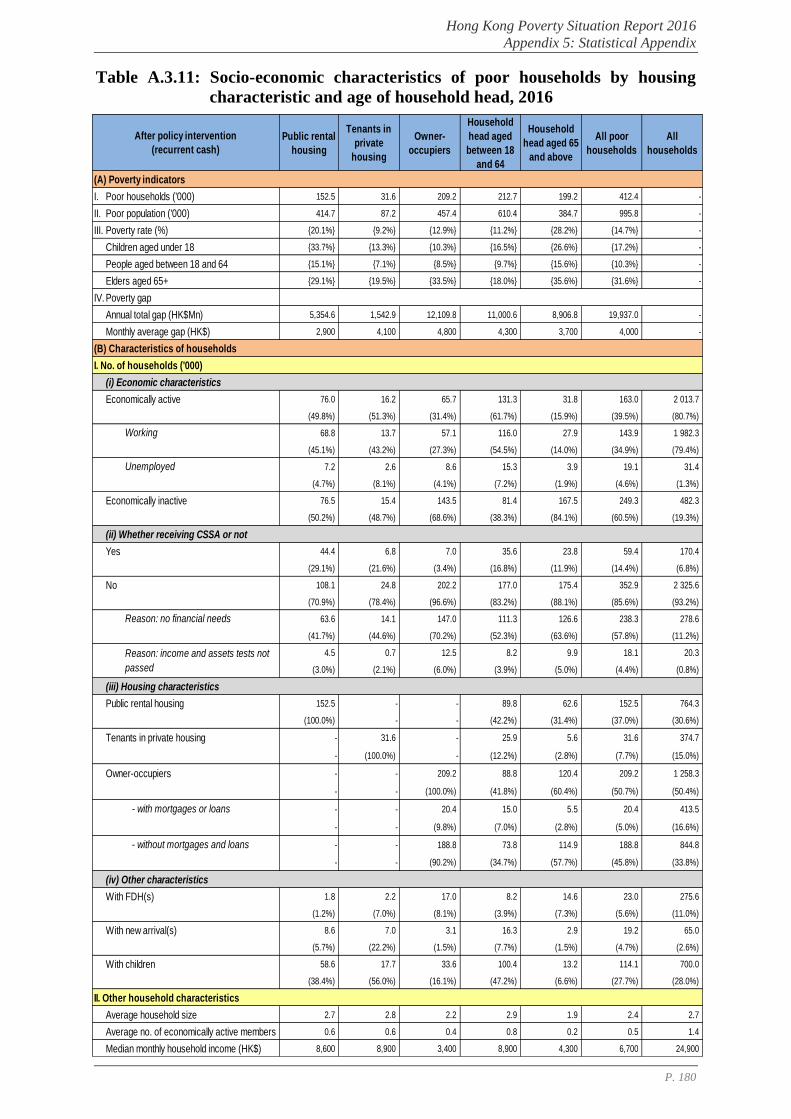
Hong Kong Poverty Situation Report 2016
Appendix 5: Statistical Appendix
P. 180
Table A.3.11: Socio-economic characteristics of poor households by housing
characteristic and age of household head, 2016
Public rental
housing
Tenants in
private
housing
Owner-
occupiers
Household
head aged
between 18
and 64
Household
head aged 65
and above
All poor
households
All
households
(A) Poverty indicators
I. Poor households ('000) 152.5 31.6 209.2 212.7 199.2 412.4 -
II. Poor population ('000) 414.7 87.2 457.4 610.4 384.7 995.8 -
III. Poverty rate (%) {20.1%} {9.2%} {12.9%} {11.2%} {28.2%} {14.7%} -
Children aged under 18 {33.7%} {13.3%} {10.3%} {16.5%} {26.6%} {17.2%} -
People aged between 18 and 64 {15.1%} {7.1%} {8.5%} {9.7%} {15.6%} {10.3%} -
Elders aged 65+ {29.1%} {19.5%} {33.5%} {18.0%} {35.6%} {31.6%} -
IV. Poverty gap
Annual total gap (HK$Mn) 5,354.6 1,542.9 12,109.8 11,000.6 8,906.8 19,937.0 -
Monthly average gap (HK$) 2,900 4,100 4,800 4,300 3,700 4,000 -
(B) Characteristics of households
I. No. of households ('000)
(i) Economic characteristics
Economically active 76.0 16.2 65.7 131.3 31.8 163.0 2 013.7
(49.8%) (51.3%) (31.4%) (61.7%) (15.9%) (39.5%) (80.7%)
Working 68.8 13.7 57.1 116.0 27.9 143.9 1 982.3
(45.1%) (43.2%) (27.3%) (54.5%) (14.0%) (34.9%) (79.4%)
Unemployed 7.2 2.6 8.6 15.3 3.9 19.1 31.4
(4.7%) (8.1%) (4.1%) (7.2%) (1.9%) (4.6%) (1.3%)
Economically inactive 76.5 15.4 143.5 81.4 167.5 249.3 482.3
(50.2%) (48.7%) (68.6%) (38.3%) (84.1%) (60.5%) (19.3%)
(ii) Whether receiving CSSA or not
Yes 44.4 6.8 7.0 35.6 23.8 59.4 170.4
(29.1%) (21.6%) (3.4%) (16.8%) (11.9%) (14.4%) (6.8%)
No 108.1 24.8 202.2 177.0 175.4 352.9 2 325.6
(70.9%) (78.4%) (96.6%) (83.2%) (88.1%) (85.6%) (93.2%)
Reason: no financial needs 63.6 14.1 147.0 111.3 126.6 238.3 278.6
(41.7%) (44.6%) (70.2%) (52.3%) (63.6%) (57.8%) (11.2%)
4.5 0.7 12.5 8.2 9.9 18.1 20.3
(3.0%) (2.1%) (6.0%) (3.9%) (5.0%) (4.4%) (0.8%)
(iii) Housing characteristics
Public rental housing 152.5 - - 89.8 62.6 152.5 764.3
(100.0%) - - (42.2%) (31.4%) (37.0%) (30.6%)
Tenants in private housing - 31.6 - 25.9 5.6 31.6 374.7
- (100.0%) - (12.2%) (2.8%) (7.7%) (15.0%)
Owner-occupiers - - 209.2 88.8 120.4 209.2 1 258.3
- - (100.0%) (41.8%) (60.4%) (50.7%) (50.4%)
- with mortgages or loans - - 20.4 15.0 5.5 20.4 413.5
- - (9.8%) (7.0%) (2.8%) (5.0%) (16.6%)
- without mortgages and loans - - 188.8 73.8 114.9 188.8 844.8
- - (90.2%) (34.7%) (57.7%) (45.8%) (33.8%)
(iv) Other characteristics
With FDH(s) 1.8 2.2 17.0 8.2 14.6 23.0 275.6
(1.2%) (7.0%) (8.1%) (3.9%) (7.3%) (5.6%) (11.0%)
With new arrival(s) 8.6 7.0 3.1 16.3 2.9 19.2 65.0
(5.7%) (22.2%) (1.5%) (7.7%) (1.5%) (4.7%) (2.6%)
With children 58.6 17.7 33.6 100.4 13.2 114.1 700.0
(38.4%) (56.0%) (16.1%) (47.2%) (6.6%) (27.7%) (28.0%)
II. Other household characteristics
Average household size 2.7 2.8 2.2 2.9 1.9 2.4 2.7
Average no. of economically active members 0.6 0.6 0.4 0.8 0.2 0.5 1.4
Median monthly household income (HK$) 8,600 8,900 3,400 8,900 4,300 6,700 24,900
After policy intervention
(recurrent cash)
Reason: income and assets tests not
passed
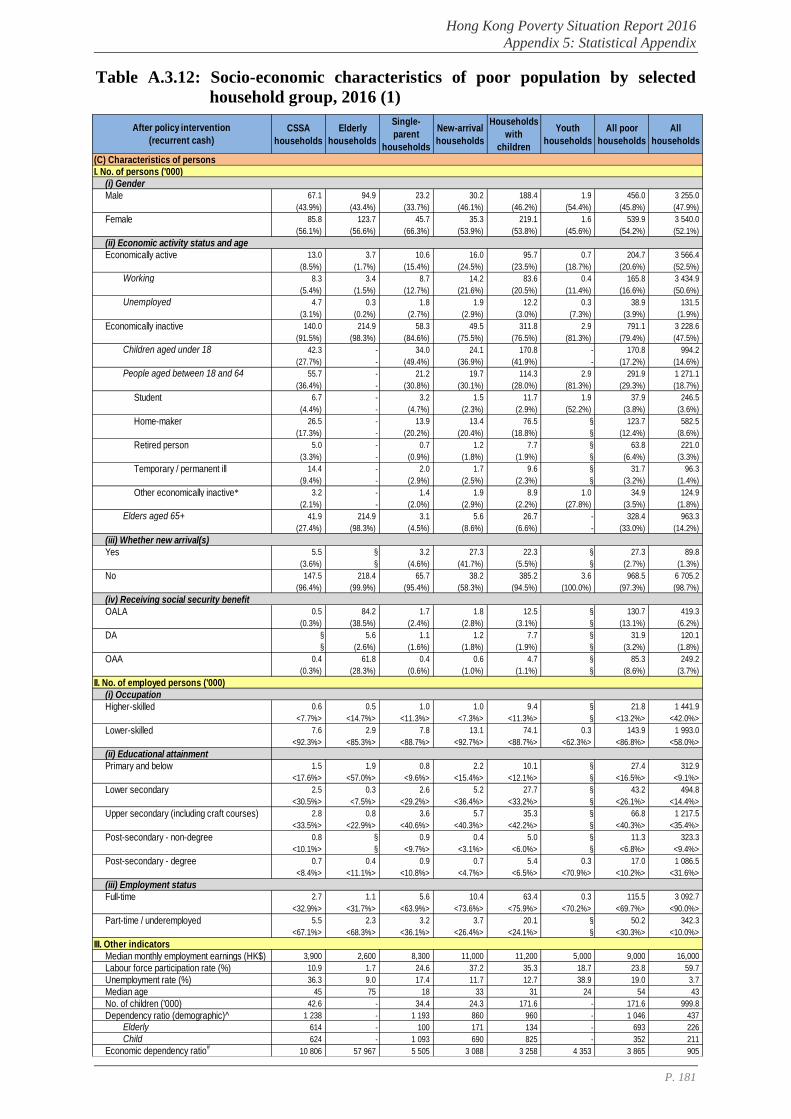
Hong Kong Poverty Situation Report 2016
Appendix 5: Statistical Appendix
P. 181
Table A.3.12: Socio-economic characteristics of poor population by selected
household group, 2016 (1)
CSSA
households
Elderly
households
Single-
parent
households
New-arrival
households
Households
with
children
Youth
households
All poor
households
All
households
(C) Characteristics of persons
I. No. of persons ('000)
(i) Gender
Male 67.1 94.9 23.2 30.2 188.4 1.9 456.0 3 255.0
(43.9%) (43.4%) (33.7%) (46.1%) (46.2%) (54.4%) (45.8%) (47.9%)
Female 85.8 123.7 45.7 35.3 219.1 1.6 539.9 3 540.0
(56.1%) (56.6%) (66.3%) (53.9%) (53.8%) (45.6%) (54.2%) (52.1%)
(ii) Economic activity status and age
Economically active 13.0 3.7 10.6 16.0 95.7 0.7 204.7 3 566.4
(8.5%) (1.7%) (15.4%) (24.5%) (23.5%) (18.7%) (20.6%) (52.5%)
Working 8.3 3.4 8.7 14.2 83.6 0.4 165.8 3 434.9
(5.4%) (1.5%) (12.7%) (21.6%) (20.5%) (11.4%) (16.6%) (50.6%)
Unemployed 4.7 0.3 1.8 1.9 12.2 0.3 38.9 131.5
(3.1%) (0.2%) (2.7%) (2.9%) (3.0%) (7.3%) (3.9%) (1.9%)
Economically inactive 140.0 214.9 58.3 49.5 311.8 2.9 791.1 3 228.6
(91.5%) (98.3%) (84.6%) (75.5%) (76.5%) (81.3%) (79.4%) (47.5%)
Children aged under 18 42.3 - 34.0 24.1 170.8 - 170.8 994.2
(27.7%) - (49.4%) (36.9%) (41.9%) - (17.2%) (14.6%)
People aged between 18 and 64 55.7 - 21.2 19.7 114.3 2.9 291.9 1 271.1
(36.4%) - (30.8%) (30.1%) (28.0%) (81.3%) (29.3%) (18.7%)
Student 6.7 - 3.2 1.5 11.7 1.9 37.9 246.5
(4.4%) - (4.7%) (2.3%) (2.9%) (52.2%) (3.8%) (3.6%)
Home-maker 26.5 - 13.9 13.4 76.5 § 123.7 582.5
(17.3%) - (20.2%) (20.4%) (18.8%) § (12.4%) (8.6%)
Retired person 5.0 - 0.7 1.2 7.7 § 63.8 221.0
(3.3%) - (0.9%) (1.8%) (1.9%) § (6.4%) (3.3%)
Temporary / permanent ill 14.4 - 2.0 1.7 9.6 § 31.7 96.3
(9.4%) - (2.9%) (2.5%) (2.3%) § (3.2%) (1.4%)
Other economically inactive* 3.2 - 1.4 1.9 8.9 1.0 34.9 124.9
(2.1%) - (2.0%) (2.9%) (2.2%) (27.8%) (3.5%) (1.8%)
Elders aged 65+ 41.9 214.9 3.1 5.6 26.7 - 328.4 963.3
(27.4%) (98.3%) (4.5%) (8.6%) (6.6%) - (33.0%) (14.2%)
(iii) Whether new arrival(s)
Yes 5.5 § 3.2 27.3 22.3 § 27.3 89.8
(3.6%) § (4.6%) (41.7%) (5.5%) § (2.7%) (1.3%)
No 147.5 218.4 65.7 38.2 385.2 3.6 968.5 6 705.2
(96.4%) (99.9%) (95.4%) (58.3%) (94.5%) (100.0%) (97.3%) (98.7%)
(iv) Receiving social security benefit
OALA 0.5 84.2 1.7 1.8 12.5 § 130.7 419.3
(0.3%) (38.5%) (2.4%) (2.8%) (3.1%) § (13.1%) (6.2%)
DA § 5.6 1.1 1.2 7.7 § 31.9 120.1
§ (2.6%) (1.6%) (1.8%) (1.9%) § (3.2%) (1.8%)
OAA 0.4 61.8 0.4 0.6 4.7 § 85.3 249.2
(0.3%) (28.3%) (0.6%) (1.0%) (1.1%) § (8.6%) (3.7%)
II. No. of employed persons ('000)
(i) Occupation
Higher-skilled 0.6 0.5 1.0 1.0 9.4 § 21.8 1 441.9
<7.7%> <14.7%> <11.3%> <7.3%> <11.3%> § <13.2%> <42.0%>
Lower-skilled 7.6 2.9 7.8 13.1 74.1 0.3 143.9 1 993.0
<92.3%> <85.3%> <88.7%> <92.7%> <88.7%> <62.3%> <86.8%> <58.0%>
(ii) Educational attainment
Primary and below 1.5 1.9 0.8 2.2 10.1 § 27.4 312.9
<17.6%> <57.0%> <9.6%> <15.4%> <12.1%> § <16.5%> <9.1%>
Lower secondary 2.5 0.3 2.6 5.2 27.7 § 43.2 494.8
<30.5%> <7.5%> <29.2%> <36.4%> <33.2%> § <26.1%> <14.4%>
Upper secondary (including craft courses) 2.8 0.8 3.6 5.7 35.3 § 66.8 1 217.5
<33.5%> <22.9%> <40.6%> <40.3%> <42.2%> § <40.3%> <35.4%>
Post-secondary - non-degree 0.8 § 0.9 0.4 5.0 § 11.3 323.3
<10.1%> § <9.7%> <3.1%> <6.0%> § <6.8%> <9.4%>
Post-secondary - degree 0.7 0.4 0.9 0.7 5.4 0.3 17.0 1 086.5
<8.4%> <11.1%> <10.8%> <4.7%> <6.5%> <70.9%> <10.2%> <31.6%>
(iii) Employment status
Full-time 2.7 1.1 5.6 10.4 63.4 0.3 115.5 3 092.7
<32.9%> <31.7%> <63.9%> <73.6%> <75.9%> <70.2%> <69.7%> <90.0%>
Part-time / underemployed 5.5 2.3 3.2 3.7 20.1 § 50.2 342.3
<67.1%> <68.3%> <36.1%> <26.4%> <24.1%> § <30.3%> <10.0%>
III. Other indicators
Median monthly employment earnings (HK$) 3,900 2,600 8,300 11,000 11,200 5,000 9,000 16,000
Labour force participation rate (%) 10.9 1.7 24.6 37.2 35.3 18.7 23.8 59.7
Unemployment rate (%) 36.3 9.0 17.4 11.7 12.7 38.9 19.0 3.7
Median age 45 75 18 33 31 24 54 43
No. of children ('000) 42.6 - 34.4 24.3 171.6 - 171.6 999.8
Dependency ratio (demographic)^ 1 238 - 1 193 860 960 - 1 046 437
Elderly 614 - 100 171 134 - 693 226
Child 624 - 1 093 690 825 - 352 211
Economic dependency ratio#
10 806 57 967 5 505 3 088 3 258 4 353 3 865 905
After policy intervention
(recurrent cash)
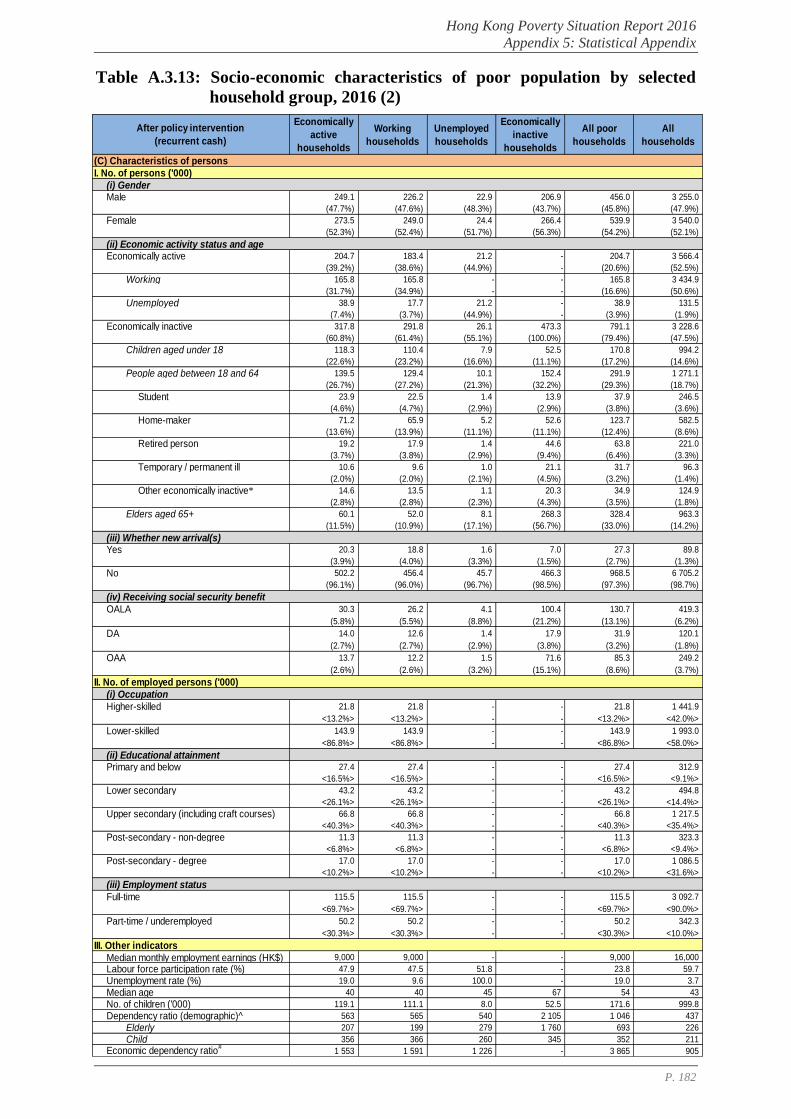
Hong Kong Poverty Situation Report 2016
Appendix 5: Statistical Appendix
P. 182
Table A.3.13: Socio-economic characteristics of poor population by selected
household group, 2016 (2)
Economically
active
households
Working
households
Unemployed
households
Economically
inactive
households
All poor
households
All
households
(C) Characteristics of persons
I. No. of persons ('000)
(i) GenderMale 249.1 226.2 22.9 206.9 456.0 3 255.0
(47.7%) (47.6%) (48.3%) (43.7%) (45.8%) (47.9%)
Female 273.5 249.0 24.4 266.4 539.9 3 540.0
(52.3%) (52.4%) (51.7%) (56.3%) (54.2%) (52.1%)
(ii) Economic activity status and ageEconomically active 204.7 183.4 21.2 - 204.7 3 566.4
(39.2%) (38.6%) (44.9%) - (20.6%) (52.5%)
Working 165.8 165.8 - - 165.8 3 434.9
(31.7%) (34.9%) - - (16.6%) (50.6%)
Unemployed 38.9 17.7 21.2 - 38.9 131.5
(7.4%) (3.7%) (44.9%) - (3.9%) (1.9%)
Economically inactive 317.8 291.8 26.1 473.3 791.1 3 228.6
(60.8%) (61.4%) (55.1%) (100.0%) (79.4%) (47.5%)
Children aged under 18 118.3 110.4 7.9 52.5 170.8 994.2
(22.6%) (23.2%) (16.6%) (11.1%) (17.2%) (14.6%)
People aged between 18 and 64 139.5 129.4 10.1 152.4 291.9 1 271.1
(26.7%) (27.2%) (21.3%) (32.2%) (29.3%) (18.7%)
Student 23.9 22.5 1.4 13.9 37.9 246.5
(4.6%) (4.7%) (2.9%) (2.9%) (3.8%) (3.6%)
Home-maker 71.2 65.9 5.2 52.6 123.7 582.5
(13.6%) (13.9%) (11.1%) (11.1%) (12.4%) (8.6%)
Retired person 19.2 17.9 1.4 44.6 63.8 221.0
(3.7%) (3.8%) (2.9%) (9.4%) (6.4%) (3.3%)
Temporary / permanent ill 10.6 9.6 1.0 21.1 31.7 96.3
(2.0%) (2.0%) (2.1%) (4.5%) (3.2%) (1.4%)
Other economically inactive* 14.6 13.5 1.1 20.3 34.9 124.9
(2.8%) (2.8%) (2.3%) (4.3%) (3.5%) (1.8%)
Elders aged 65+ 60.1 52.0 8.1 268.3 328.4 963.3
(11.5%) (10.9%) (17.1%) (56.7%) (33.0%) (14.2%)
(iii) Whether new arrival(s)Yes 20.3 18.8 1.6 7.0 27.3 89.8
(3.9%) (4.0%) (3.3%) (1.5%) (2.7%) (1.3%)
No 502.2 456.4 45.7 466.3 968.5 6 705.2
(96.1%) (96.0%) (96.7%) (98.5%) (97.3%) (98.7%)
(iv) Receiving social security benefit
OALA 30.3 26.2 4.1 100.4 130.7 419.3
(5.8%) (5.5%) (8.8%) (21.2%) (13.1%) (6.2%)
DA 14.0 12.6 1.4 17.9 31.9 120.1
(2.7%) (2.7%) (2.9%) (3.8%) (3.2%) (1.8%)
OAA 13.7 12.2 1.5 71.6 85.3 249.2
(2.6%) (2.6%) (3.2%) (15.1%) (8.6%) (3.7%)
II. No. of employed persons ('000)
(i) Occupation
Higher-skilled 21.8 21.8 - - 21.8 1 441.9
<13.2%> <13.2%> - - <13.2%> <42.0%>
Lower-skilled 143.9 143.9 - - 143.9 1 993.0
<86.8%> <86.8%> - - <86.8%> <58.0%>
(ii) Educational attainmentPrimary and below 27.4 27.4 - - 27.4 312.9
<16.5%> <16.5%> - - <16.5%> <9.1%>
Lower secondary 43.2 43.2 - - 43.2 494.8
<26.1%> <26.1%> - - <26.1%> <14.4%>
Upper secondary (including craft courses) 66.8 66.8 - - 66.8 1 217.5
<40.3%> <40.3%> - - <40.3%> <35.4%>
Post-secondary - non-degree 11.3 11.3 - - 11.3 323.3
<6.8%> <6.8%> - - <6.8%> <9.4%>
Post-secondary - degree 17.0 17.0 - - 17.0 1 086.5
<10.2%> <10.2%> - - <10.2%> <31.6%>
(iii) Employment status
Full-time 115.5 115.5 - - 115.5 3 092.7
<69.7%> <69.7%> - - <69.7%> <90.0%>
Part-time / underemployed 50.2 50.2 - - 50.2 342.3
<30.3%> <30.3%> - - <30.3%> <10.0%>
III. Other indicators
Median monthly employment earnings (HK$) 9,000 9,000 - - 9,000 16,000
Labour force participation rate (%) 47.9 47.5 51.8 - 23.8 59.7
Unemployment rate (%) 19.0 9.6 100.0 - 19.0 3.7
Median age 40 40 45 67 54 43
No. of children ('000) 119.1 111.1 8.0 52.5 171.6 999.8
Dependency ratio (demographic)^ 563 565 540 2 105 1 046 437
Elderly 207 199 279 1 760 693 226
Child 356 366 260 345 352 211
Economic dependency ratio#
1 553 1 591 1 226 - 3 865 905
After policy intervention
(recurrent cash)

Hong Kong Poverty Situation Report 2016
Appendix 5: Statistical Appendix
P. 183
Table A.3.14: Socio-economic characteristics of poor population by District
Council district, 2016 (1)
Central and
WesternWan Chai Eastern Southern
Yau Tsim
Mong
Sham Shui
Po
All poor
households
All
households
(C) Characteristics of persons
I. No. of persons ('000)
(i) Gender
Male 11.7 8.8 27.0 12.0 20.8 29.8 456.0 3 255.0
(46.1%) (44.4%) (46.9%) (44.9%) (46.0%) (47.1%) (45.8%) (47.9%)
Female 13.6 11.1 30.6 14.7 24.5 33.4 539.9 3 540.0
(53.9%) (55.6%) (53.1%) (55.1%) (54.0%) (52.9%) (54.2%) (52.1%)
(ii) Economic activity status and age
Economically active 4.1 3.0 10.7 5.7 9.2 13.6 204.7 3 566.4
(16.4%) (15.2%) (18.7%) (21.4%) (20.2%) (21.5%) (20.6%) (52.5%)
Working 3.2 2.4 8.5 4.8 7.4 11.1 165.8 3 434.9
(12.7%) (12.2%) (14.7%) (17.9%) (16.2%) (17.6%) (16.6%) (50.6%)
Unemployed 0.9 0.6 2.3 0.9 1.8 2.5 38.9 131.5
(3.6%) (3.0%) (3.9%) (3.5%) (4.0%) (3.9%) (3.9%) (1.9%)
Economically inactive 21.1 16.9 46.8 21.0 36.2 49.7 791.1 3 228.6
(83.6%) (84.8%) (81.3%) (78.6%) (79.8%) (78.5%) (79.4%) (47.5%)
Children aged under 18 2.7 1.9 7.2 4.4 6.3 13.0 170.8 994.2
(10.7%) (9.3%) (12.5%) (16.4%) (13.9%) (20.6%) (17.2%) (14.6%)
People aged between 18 and 64 6.8 5.8 17.2 7.3 13.8 20.1 291.9 1 271.1
(26.8%) (28.9%) (29.9%) (27.3%) (30.5%) (31.8%) (29.3%) (18.7%)
Student 0.8 0.5 2.1 0.7 2.6 2.9 37.9 246.5
(3.3%) (2.4%) (3.6%) (2.6%) (5.8%) (4.5%) (3.8%) (3.6%)
Home-maker 2.4 1.3 5.9 2.9 5.8 8.2 123.7 582.5
(9.5%) (6.6%) (10.3%) (10.9%) (12.7%) (12.9%) (12.4%) (8.6%)
Retired person 2.4 2.7 5.4 2.3 2.5 3.9 63.8 221.0
(9.4%) (13.4%) (9.3%) (8.4%) (5.5%) (6.1%) (6.4%) (3.3%)
Temporary / permanent ill 0.4 0.3 1.5 0.7 0.5 2.1 31.7 96.3
(1.5%) (1.5%) (2.6%) (2.6%) (1.2%) (3.4%) (3.2%) (1.4%)
Other economically inactive* 0.8 1.0 2.3 0.7 2.4 3.1 34.9 124.9
(3.2%) (5.1%) (4.1%) (2.8%) (5.4%) (4.9%) (3.5%) (1.8%)
Elders aged 65+ 11.7 9.3 22.4 9.3 16.0 16.5 328.4 963.3
(46.2%) (46.6%) (38.9%) (34.9%) (35.4%) (26.1%) (33.0%) (14.2%)
(iii) Whether new arrival(s)
Yes § 0.4 0.9 0.3 2.4 2.7 27.3 89.8
§ (1.9%) (1.6%) (1.3%) (5.3%) (4.3%) (2.7%) (1.3%)
No 25.1 19.5 56.7 26.4 42.9 60.5 968.5 6 705.2
(99.5%) (98.1%) (98.4%) (98.7%) (94.7%) (95.7%) (97.3%) (98.7%)
(iv) Receiving social security benefit
OALA 2.5 1.4 8.9 3.2 4.2 7.2 130.7 419.3
(9.9%) (7.1%) (15.4%) (11.9%) (9.2%) (11.4%) (13.1%) (6.2%)
DA 1.1 0.7 2.6 0.9 1.7 1.7 31.9 120.1
(4.2%) (3.4%) (4.5%) (3.5%) (3.7%) (2.6%) (3.2%) (1.8%)
OAA 5.5 4.7 6.6 3.0 6.5 3.6 85.3 249.2
(21.6%) (23.5%) (11.4%) (11.3%) (14.3%) (5.8%) (8.6%) (3.7%)
II. No. of employed persons ('000)
(i) Occupation
Higher-skilled 0.5 0.7 1.6 0.5 1.5 1.3 21.8 1 441.9
<16.7%> <28.1%> <19.3%> <10.7%> <19.9%> <11.9%> <13.2%> <42.0%>
Lower-skilled 2.7 1.7 6.8 4.3 5.9 9.8 143.9 1 993.0
<83.3%> <71.9%> <80.7%> <89.3%> <80.1%> <88.1%> <86.8%> <58.0%>
(ii) Educational attainment
Primary and below 0.4 0.3 1.1 1.1 1.4 2.1 27.4 312.9
<10.9%> <13.6%> <12.5%> <22.5%> <18.6%> <18.7%> <16.5%> <9.1%>
Lower secondary 0.4 0.4 2.0 1.2 1.7 2.9 43.2 494.8
<11.5%> <15.4%> <23.5%> <24.2%> <23.0%> <25.9%> <26.1%> <14.4%>
Upper secondary (including craft courses) 1.6 1.0 3.5 1.8 2.9 4.7 66.8 1 217.5
<50.7%> <40.6%> <41.7%> <37.0%> <39.3%> <42.0%> <40.3%> <35.4%>
Post-secondary - non-degree § § 0.4 0.4 0.3 0.7 11.3 323.3
§ § <4.5%> <7.5%> <4.3%> <6.6%> <6.8%> <9.4%>
Post-secondary - degree 0.7 0.6 1.5 0.4 1.1 0.8 17.0 1 086.5
<22.6%> <24.0%> <17.8%> <8.9%> <14.8%> <6.8%> <10.2%> <31.6%>
(iii) Employment status
Full-time 2.2 1.5 5.9 3.3 4.5 7.7 115.5 3 092.7
<68.0%> <60.0%> <69.4%> <69.8%> <61.3%> <68.9%> <69.7%> <90.0%>
Part-time / underemployed 1.0 1.0 2.6 1.4 2.9 3.5 50.2 342.3
<32.0%> <40.0%> <30.6%> <30.2%> <38.7%> <31.1%> <30.3%> <10.0%>
III. Other indicators
Median monthly employment earnings (HK$) 9,000 8,000 10,000 8,500 7,500 8,800 9,000 16,000
Labour force participation rate (%) 17.6 16.1 20.7 24.7 22.9 25.9 23.8 59.7
Unemployment rate (%) 22.2 19.5 21.1 16.3 19.6 18.3 19.0 3.7
Median age 63 64 59 57 55 48 54 43
No. of children ('000) 2.7 1.9 7.2 4.4 6.3 13.0 171.6 999.8
Dependency ratio (demographic)^ 1 386 1 351 1 096 1 107 1 009 914 1 046 437
Elderly 1 131 1 132 832 758 731 520 693 226
Child 254 219 264 348 278 394 352 211
Economic dependency ratio#
5 112 5 581 4 355 3 668 3 952 3 652 3 865 905
After policy intervention
(recurrent cash)
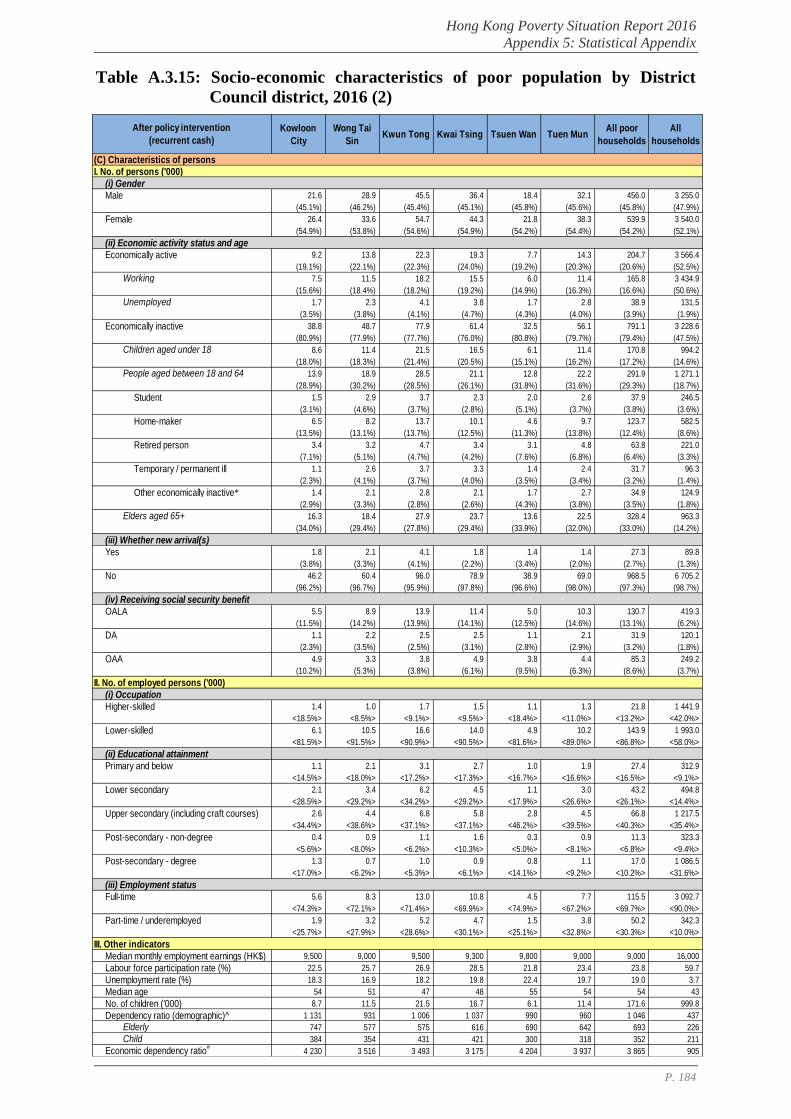
Hong Kong Poverty Situation Report 2016
Appendix 5: Statistical Appendix
P. 184
Table A.3.15: Socio-economic characteristics of poor population by District
Council district, 2016 (2)
Kowloon
City
Wong Tai
SinKwun Tong Kwai Tsing Tsuen Wan Tuen Mun
All poor
households
All
households
(C) Characteristics of persons
I. No. of persons ('000)
(i) Gender
Male 21.6 28.9 45.5 36.4 18.4 32.1 456.0 3 255.0
(45.1%) (46.2%) (45.4%) (45.1%) (45.8%) (45.6%) (45.8%) (47.9%)
Female 26.4 33.6 54.7 44.3 21.8 38.3 539.9 3 540.0
(54.9%) (53.8%) (54.6%) (54.9%) (54.2%) (54.4%) (54.2%) (52.1%)
(ii) Economic activity status and age
Economically active 9.2 13.8 22.3 19.3 7.7 14.3 204.7 3 566.4
(19.1%) (22.1%) (22.3%) (24.0%) (19.2%) (20.3%) (20.6%) (52.5%)
Working 7.5 11.5 18.2 15.5 6.0 11.4 165.8 3 434.9
(15.6%) (18.4%) (18.2%) (19.2%) (14.9%) (16.3%) (16.6%) (50.6%)
Unemployed 1.7 2.3 4.1 3.8 1.7 2.8 38.9 131.5
(3.5%) (3.8%) (4.1%) (4.7%) (4.3%) (4.0%) (3.9%) (1.9%)
Economically inactive 38.8 48.7 77.9 61.4 32.5 56.1 791.1 3 228.6
(80.9%) (77.9%) (77.7%) (76.0%) (80.8%) (79.7%) (79.4%) (47.5%)
Children aged under 18 8.6 11.4 21.5 16.5 6.1 11.4 170.8 994.2
(18.0%) (18.3%) (21.4%) (20.5%) (15.1%) (16.2%) (17.2%) (14.6%)
People aged between 18 and 64 13.9 18.9 28.5 21.1 12.8 22.2 291.9 1 271.1
(28.9%) (30.2%) (28.5%) (26.1%) (31.8%) (31.6%) (29.3%) (18.7%)
Student 1.5 2.9 3.7 2.3 2.0 2.6 37.9 246.5
(3.1%) (4.6%) (3.7%) (2.8%) (5.1%) (3.7%) (3.8%) (3.6%)
Home-maker 6.5 8.2 13.7 10.1 4.6 9.7 123.7 582.5
(13.5%) (13.1%) (13.7%) (12.5%) (11.3%) (13.8%) (12.4%) (8.6%)
Retired person 3.4 3.2 4.7 3.4 3.1 4.8 63.8 221.0
(7.1%) (5.1%) (4.7%) (4.2%) (7.6%) (6.8%) (6.4%) (3.3%)
Temporary / permanent ill 1.1 2.6 3.7 3.3 1.4 2.4 31.7 96.3
(2.3%) (4.1%) (3.7%) (4.0%) (3.5%) (3.4%) (3.2%) (1.4%)
Other economically inactive* 1.4 2.1 2.8 2.1 1.7 2.7 34.9 124.9
(2.9%) (3.3%) (2.8%) (2.6%) (4.3%) (3.8%) (3.5%) (1.8%)
Elders aged 65+ 16.3 18.4 27.9 23.7 13.6 22.5 328.4 963.3
(34.0%) (29.4%) (27.8%) (29.4%) (33.9%) (32.0%) (33.0%) (14.2%)
(iii) Whether new arrival(s)
Yes 1.8 2.1 4.1 1.8 1.4 1.4 27.3 89.8
(3.8%) (3.3%) (4.1%) (2.2%) (3.4%) (2.0%) (2.7%) (1.3%)
No 46.2 60.4 96.0 78.9 38.9 69.0 968.5 6 705.2
(96.2%) (96.7%) (95.9%) (97.8%) (96.6%) (98.0%) (97.3%) (98.7%)
(iv) Receiving social security benefit
OALA 5.5 8.9 13.9 11.4 5.0 10.3 130.7 419.3
(11.5%) (14.2%) (13.9%) (14.1%) (12.5%) (14.6%) (13.1%) (6.2%)
DA 1.1 2.2 2.5 2.5 1.1 2.1 31.9 120.1
(2.3%) (3.5%) (2.5%) (3.1%) (2.8%) (2.9%) (3.2%) (1.8%)
OAA 4.9 3.3 3.8 4.9 3.8 4.4 85.3 249.2
(10.2%) (5.3%) (3.8%) (6.1%) (9.5%) (6.3%) (8.6%) (3.7%)
II. No. of employed persons ('000)
(i) Occupation
Higher-skilled 1.4 1.0 1.7 1.5 1.1 1.3 21.8 1 441.9
<18.5%> <8.5%> <9.1%> <9.5%> <18.4%> <11.0%> <13.2%> <42.0%>
Lower-skilled 6.1 10.5 16.6 14.0 4.9 10.2 143.9 1 993.0
<81.5%> <91.5%> <90.9%> <90.5%> <81.6%> <89.0%> <86.8%> <58.0%>
(ii) Educational attainment
Primary and below 1.1 2.1 3.1 2.7 1.0 1.9 27.4 312.9
<14.5%> <18.0%> <17.2%> <17.3%> <16.7%> <16.6%> <16.5%> <9.1%>
Lower secondary 2.1 3.4 6.2 4.5 1.1 3.0 43.2 494.8
<28.5%> <29.2%> <34.2%> <29.2%> <17.9%> <26.6%> <26.1%> <14.4%>
Upper secondary (including craft courses) 2.6 4.4 6.8 5.8 2.8 4.5 66.8 1 217.5
<34.4%> <38.6%> <37.1%> <37.1%> <46.2%> <39.5%> <40.3%> <35.4%>
Post-secondary - non-degree 0.4 0.9 1.1 1.6 0.3 0.9 11.3 323.3
<5.6%> <8.0%> <6.2%> <10.3%> <5.0%> <8.1%> <6.8%> <9.4%>
Post-secondary - degree 1.3 0.7 1.0 0.9 0.8 1.1 17.0 1 086.5
<17.0%> <6.2%> <5.3%> <6.1%> <14.1%> <9.2%> <10.2%> <31.6%>
(iii) Employment status
Full-time 5.6 8.3 13.0 10.8 4.5 7.7 115.5 3 092.7
<74.3%> <72.1%> <71.4%> <69.9%> <74.9%> <67.2%> <69.7%> <90.0%>
Part-time / underemployed 1.9 3.2 5.2 4.7 1.5 3.8 50.2 342.3
<25.7%> <27.9%> <28.6%> <30.1%> <25.1%> <32.8%> <30.3%> <10.0%>
III. Other indicators
Median monthly employment earnings (HK$) 9,500 9,000 9,500 9,300 9,800 9,000 9,000 16,000
Labour force participation rate (%) 22.5 25.7 26.9 28.5 21.8 23.4 23.8 59.7
Unemployment rate (%) 18.3 16.9 18.2 19.8 22.4 19.7 19.0 3.7
Median age 54 51 47 48 55 54 54 43
No. of children ('000) 8.7 11.5 21.5 16.7 6.1 11.4 171.6 999.8
Dependency ratio (demographic)^ 1 131 931 1 006 1 037 990 960 1 046 437
Elderly 747 577 575 616 690 642 693 226
Child 384 354 431 421 300 318 352 211
Economic dependency ratio#
4 230 3 516 3 493 3 175 4 204 3 937 3 865 905
After policy intervention
(recurrent cash)
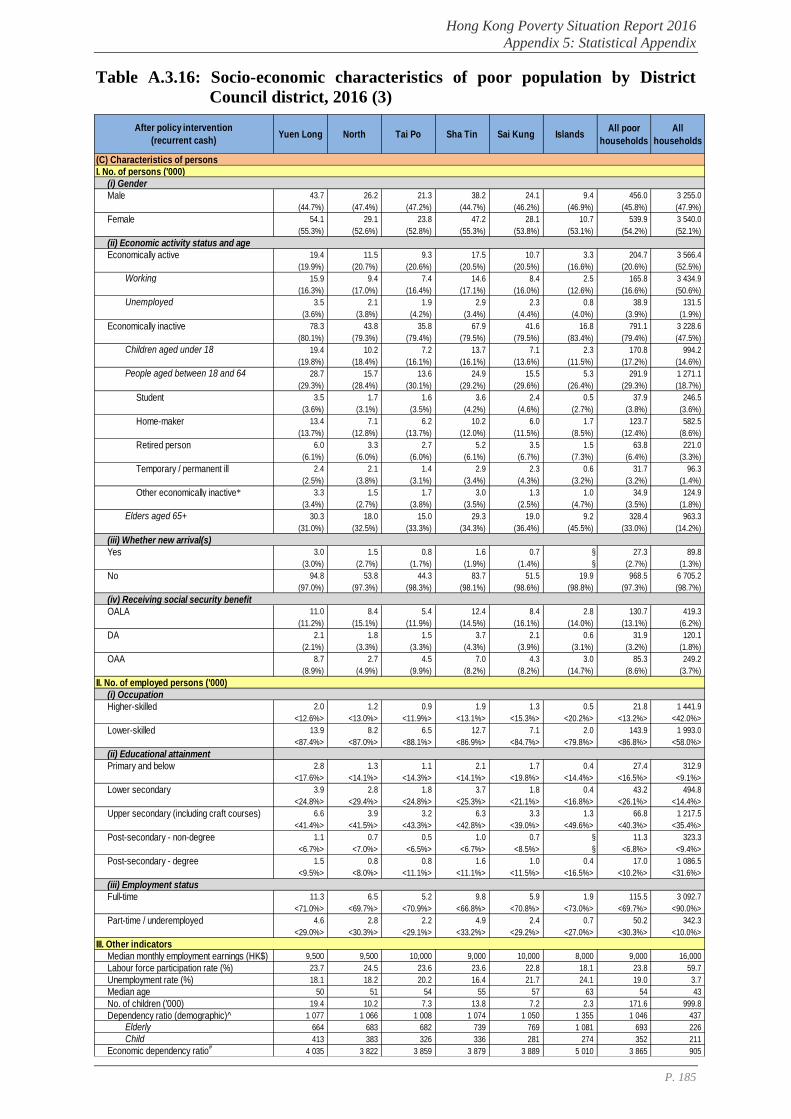
Hong Kong Poverty Situation Report 2016
Appendix 5: Statistical Appendix
P. 185
Table A.3.16: Socio-economic characteristics of poor population by District
Council district, 2016 (3)
Yuen Long North Tai Po Sha Tin Sai Kung IslandsAll poor
households
All
households
(C) Characteristics of persons
I. No. of persons ('000)
(i) Gender
Male 43.7 26.2 21.3 38.2 24.1 9.4 456.0 3 255.0
(44.7%) (47.4%) (47.2%) (44.7%) (46.2%) (46.9%) (45.8%) (47.9%)
Female 54.1 29.1 23.8 47.2 28.1 10.7 539.9 3 540.0
(55.3%) (52.6%) (52.8%) (55.3%) (53.8%) (53.1%) (54.2%) (52.1%)
(ii) Economic activity status and age
Economically active 19.4 11.5 9.3 17.5 10.7 3.3 204.7 3 566.4
(19.9%) (20.7%) (20.6%) (20.5%) (20.5%) (16.6%) (20.6%) (52.5%)
Working 15.9 9.4 7.4 14.6 8.4 2.5 165.8 3 434.9
(16.3%) (17.0%) (16.4%) (17.1%) (16.0%) (12.6%) (16.6%) (50.6%)
Unemployed 3.5 2.1 1.9 2.9 2.3 0.8 38.9 131.5
(3.6%) (3.8%) (4.2%) (3.4%) (4.4%) (4.0%) (3.9%) (1.9%)
Economically inactive 78.3 43.8 35.8 67.9 41.6 16.8 791.1 3 228.6
(80.1%) (79.3%) (79.4%) (79.5%) (79.5%) (83.4%) (79.4%) (47.5%)
Children aged under 18 19.4 10.2 7.2 13.7 7.1 2.3 170.8 994.2
(19.8%) (18.4%) (16.1%) (16.1%) (13.6%) (11.5%) (17.2%) (14.6%)
People aged between 18 and 64 28.7 15.7 13.6 24.9 15.5 5.3 291.9 1 271.1
(29.3%) (28.4%) (30.1%) (29.2%) (29.6%) (26.4%) (29.3%) (18.7%)
Student 3.5 1.7 1.6 3.6 2.4 0.5 37.9 246.5
(3.6%) (3.1%) (3.5%) (4.2%) (4.6%) (2.7%) (3.8%) (3.6%)
Home-maker 13.4 7.1 6.2 10.2 6.0 1.7 123.7 582.5
(13.7%) (12.8%) (13.7%) (12.0%) (11.5%) (8.5%) (12.4%) (8.6%)
Retired person 6.0 3.3 2.7 5.2 3.5 1.5 63.8 221.0
(6.1%) (6.0%) (6.0%) (6.1%) (6.7%) (7.3%) (6.4%) (3.3%)
Temporary / permanent ill 2.4 2.1 1.4 2.9 2.3 0.6 31.7 96.3
(2.5%) (3.8%) (3.1%) (3.4%) (4.3%) (3.2%) (3.2%) (1.4%)
Other economically inactive* 3.3 1.5 1.7 3.0 1.3 1.0 34.9 124.9
(3.4%) (2.7%) (3.8%) (3.5%) (2.5%) (4.7%) (3.5%) (1.8%)
Elders aged 65+ 30.3 18.0 15.0 29.3 19.0 9.2 328.4 963.3
(31.0%) (32.5%) (33.3%) (34.3%) (36.4%) (45.5%) (33.0%) (14.2%)
(iii) Whether new arrival(s)
Yes 3.0 1.5 0.8 1.6 0.7 § 27.3 89.8
(3.0%) (2.7%) (1.7%) (1.9%) (1.4%) § (2.7%) (1.3%)
No 94.8 53.8 44.3 83.7 51.5 19.9 968.5 6 705.2
(97.0%) (97.3%) (98.3%) (98.1%) (98.6%) (98.8%) (97.3%) (98.7%)
(iv) Receiving social security benefit
OALA 11.0 8.4 5.4 12.4 8.4 2.8 130.7 419.3
(11.2%) (15.1%) (11.9%) (14.5%) (16.1%) (14.0%) (13.1%) (6.2%)
DA 2.1 1.8 1.5 3.7 2.1 0.6 31.9 120.1
(2.1%) (3.3%) (3.3%) (4.3%) (3.9%) (3.1%) (3.2%) (1.8%)
OAA 8.7 2.7 4.5 7.0 4.3 3.0 85.3 249.2
(8.9%) (4.9%) (9.9%) (8.2%) (8.2%) (14.7%) (8.6%) (3.7%)
II. No. of employed persons ('000)
(i) Occupation
Higher-skilled 2.0 1.2 0.9 1.9 1.3 0.5 21.8 1 441.9
<12.6%> <13.0%> <11.9%> <13.1%> <15.3%> <20.2%> <13.2%> <42.0%>
Lower-skilled 13.9 8.2 6.5 12.7 7.1 2.0 143.9 1 993.0
<87.4%> <87.0%> <88.1%> <86.9%> <84.7%> <79.8%> <86.8%> <58.0%>
(ii) Educational attainment
Primary and below 2.8 1.3 1.1 2.1 1.7 0.4 27.4 312.9
<17.6%> <14.1%> <14.3%> <14.1%> <19.8%> <14.4%> <16.5%> <9.1%>
Lower secondary 3.9 2.8 1.8 3.7 1.8 0.4 43.2 494.8
<24.8%> <29.4%> <24.8%> <25.3%> <21.1%> <16.8%> <26.1%> <14.4%>
Upper secondary (including craft courses) 6.6 3.9 3.2 6.3 3.3 1.3 66.8 1 217.5
<41.4%> <41.5%> <43.3%> <42.8%> <39.0%> <49.6%> <40.3%> <35.4%>
Post-secondary - non-degree 1.1 0.7 0.5 1.0 0.7 § 11.3 323.3
<6.7%> <7.0%> <6.5%> <6.7%> <8.5%> § <6.8%> <9.4%>
Post-secondary - degree 1.5 0.8 0.8 1.6 1.0 0.4 17.0 1 086.5
<9.5%> <8.0%> <11.1%> <11.1%> <11.5%> <16.5%> <10.2%> <31.6%>
(iii) Employment status
Full-time 11.3 6.5 5.2 9.8 5.9 1.9 115.5 3 092.7
<71.0%> <69.7%> <70.9%> <66.8%> <70.8%> <73.0%> <69.7%> <90.0%>
Part-time / underemployed 4.6 2.8 2.2 4.9 2.4 0.7 50.2 342.3
<29.0%> <30.3%> <29.1%> <33.2%> <29.2%> <27.0%> <30.3%> <10.0%>
III. Other indicators
Median monthly employment earnings (HK$) 9,500 9,500 10,000 9,000 10,000 8,000 9,000 16,000
Labour force participation rate (%) 23.7 24.5 23.6 23.6 22.8 18.1 23.8 59.7
Unemployment rate (%) 18.1 18.2 20.2 16.4 21.7 24.1 19.0 3.7
Median age 50 51 54 55 57 63 54 43
No. of children ('000) 19.4 10.2 7.3 13.8 7.2 2.3 171.6 999.8
Dependency ratio (demographic)^ 1 077 1 066 1 008 1 074 1 050 1 355 1 046 437
Elderly 664 683 682 739 769 1 081 693 226
Child 413 383 326 336 281 274 352 211
Economic dependency ratio#
4 035 3 822 3 859 3 879 3 889 5 010 3 865 905
After policy intervention
(recurrent cash)
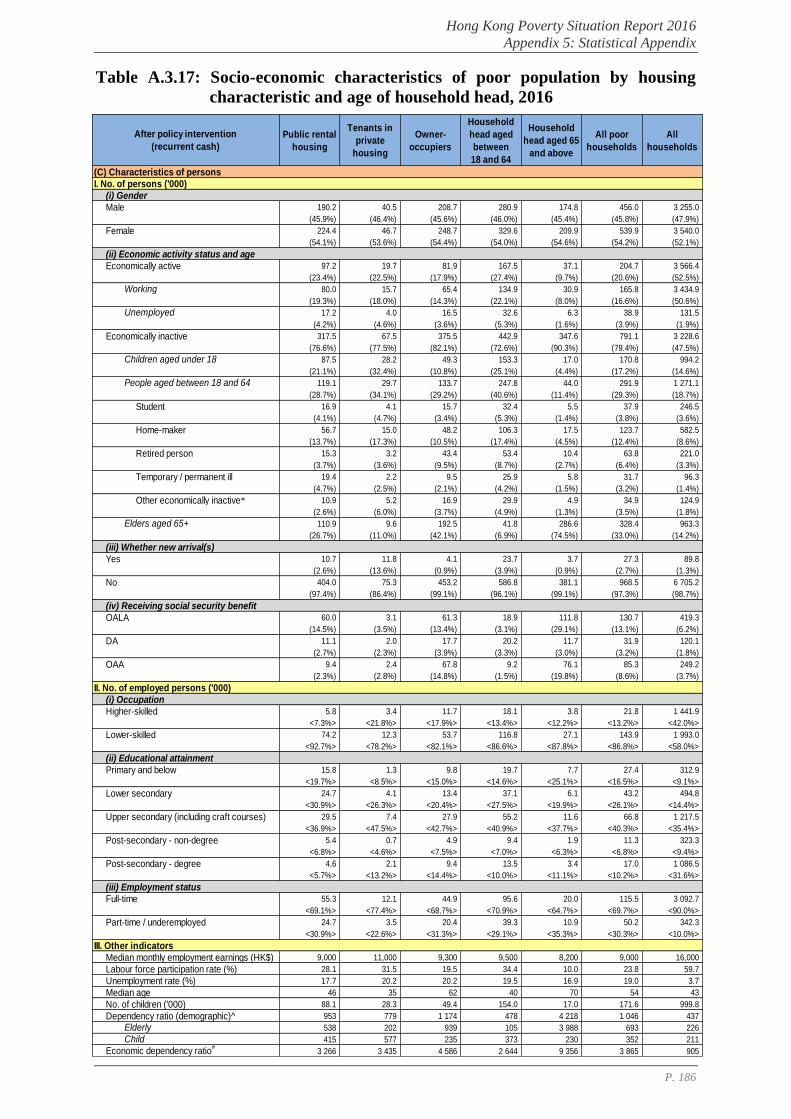
Hong Kong Poverty Situation Report 2016
Appendix 5: Statistical Appendix
P. 186
Table A.3.17: Socio-economic characteristics of poor population by housing
characteristic and age of household head, 2016
Public rental
housing
Tenants in
private
housing
Owner-
occupiers
Household
head aged
between
18 and 64
Household
head aged 65
and above
All poor
households
All
households
(C) Characteristics of persons
I. No. of persons ('000)
(i) Gender
Male 190.2 40.5 208.7 280.9 174.8 456.0 3 255.0
(45.9%) (46.4%) (45.6%) (46.0%) (45.4%) (45.8%) (47.9%)
Female 224.4 46.7 248.7 329.6 209.9 539.9 3 540.0
(54.1%) (53.6%) (54.4%) (54.0%) (54.6%) (54.2%) (52.1%)
(ii) Economic activity status and age
Economically active 97.2 19.7 81.9 167.5 37.1 204.7 3 566.4
(23.4%) (22.5%) (17.9%) (27.4%) (9.7%) (20.6%) (52.5%)
Working 80.0 15.7 65.4 134.9 30.9 165.8 3 434.9
(19.3%) (18.0%) (14.3%) (22.1%) (8.0%) (16.6%) (50.6%)
Unemployed 17.2 4.0 16.5 32.6 6.3 38.9 131.5
(4.2%) (4.6%) (3.6%) (5.3%) (1.6%) (3.9%) (1.9%)
Economically inactive 317.5 67.5 375.5 442.9 347.6 791.1 3 228.6
(76.6%) (77.5%) (82.1%) (72.6%) (90.3%) (79.4%) (47.5%)
Children aged under 18 87.5 28.2 49.3 153.3 17.0 170.8 994.2
(21.1%) (32.4%) (10.8%) (25.1%) (4.4%) (17.2%) (14.6%)
People aged between 18 and 64 119.1 29.7 133.7 247.8 44.0 291.9 1 271.1
(28.7%) (34.1%) (29.2%) (40.6%) (11.4%) (29.3%) (18.7%)
Student 16.9 4.1 15.7 32.4 5.5 37.9 246.5
(4.1%) (4.7%) (3.4%) (5.3%) (1.4%) (3.8%) (3.6%)
Home-maker 56.7 15.0 48.2 106.3 17.5 123.7 582.5
(13.7%) (17.3%) (10.5%) (17.4%) (4.5%) (12.4%) (8.6%)
Retired person 15.3 3.2 43.4 53.4 10.4 63.8 221.0
(3.7%) (3.6%) (9.5%) (8.7%) (2.7%) (6.4%) (3.3%)
Temporary / permanent ill 19.4 2.2 9.5 25.9 5.8 31.7 96.3
(4.7%) (2.5%) (2.1%) (4.2%) (1.5%) (3.2%) (1.4%)
Other economically inactive* 10.9 5.2 16.9 29.9 4.9 34.9 124.9
(2.6%) (6.0%) (3.7%) (4.9%) (1.3%) (3.5%) (1.8%)
Elders aged 65+ 110.9 9.6 192.5 41.8 286.6 328.4 963.3
(26.7%) (11.0%) (42.1%) (6.9%) (74.5%) (33.0%) (14.2%)
(iii) Whether new arrival(s)
Yes 10.7 11.8 4.1 23.7 3.7 27.3 89.8
(2.6%) (13.6%) (0.9%) (3.9%) (0.9%) (2.7%) (1.3%)
No 404.0 75.3 453.2 586.8 381.1 968.5 6 705.2
(97.4%) (86.4%) (99.1%) (96.1%) (99.1%) (97.3%) (98.7%)
(iv) Receiving social security benefit
OALA 60.0 3.1 61.3 18.9 111.8 130.7 419.3
(14.5%) (3.5%) (13.4%) (3.1%) (29.1%) (13.1%) (6.2%)
DA 11.1 2.0 17.7 20.2 11.7 31.9 120.1
(2.7%) (2.3%) (3.9%) (3.3%) (3.0%) (3.2%) (1.8%)
OAA 9.4 2.4 67.8 9.2 76.1 85.3 249.2
(2.3%) (2.8%) (14.8%) (1.5%) (19.8%) (8.6%) (3.7%)
II. No. of employed persons ('000)
(i) Occupation
Higher-skilled 5.8 3.4 11.7 18.1 3.8 21.8 1 441.9
<7.3%> <21.8%> <17.9%> <13.4%> <12.2%> <13.2%> <42.0%>
Lower-skilled 74.2 12.3 53.7 116.8 27.1 143.9 1 993.0
<92.7%> <78.2%> <82.1%> <86.6%> <87.8%> <86.8%> <58.0%>
(ii) Educational attainment
Primary and below 15.8 1.3 9.8 19.7 7.7 27.4 312.9
<19.7%> <8.5%> <15.0%> <14.6%> <25.1%> <16.5%> <9.1%>
Lower secondary 24.7 4.1 13.4 37.1 6.1 43.2 494.8
<30.9%> <26.3%> <20.4%> <27.5%> <19.9%> <26.1%> <14.4%>
Upper secondary (including craft courses) 29.5 7.4 27.9 55.2 11.6 66.8 1 217.5
<36.9%> <47.5%> <42.7%> <40.9%> <37.7%> <40.3%> <35.4%>
Post-secondary - non-degree 5.4 0.7 4.9 9.4 1.9 11.3 323.3
<6.8%> <4.6%> <7.5%> <7.0%> <6.3%> <6.8%> <9.4%>
Post-secondary - degree 4.6 2.1 9.4 13.5 3.4 17.0 1 086.5
<5.7%> <13.2%> <14.4%> <10.0%> <11.1%> <10.2%> <31.6%>
(iii) Employment status
Full-time 55.3 12.1 44.9 95.6 20.0 115.5 3 092.7
<69.1%> <77.4%> <68.7%> <70.9%> <64.7%> <69.7%> <90.0%>
Part-time / underemployed 24.7 3.5 20.4 39.3 10.9 50.2 342.3
<30.9%> <22.6%> <31.3%> <29.1%> <35.3%> <30.3%> <10.0%>
III. Other indicators
Median monthly employment earnings (HK$) 9,000 11,000 9,300 9,500 8,200 9,000 16,000
Labour force participation rate (%) 28.1 31.5 19.5 34.4 10.0 23.8 59.7
Unemployment rate (%) 17.7 20.2 20.2 19.5 16.9 19.0 3.7
Median age 46 35 62 40 70 54 43
No. of children ('000) 88.1 28.3 49.4 154.0 17.0 171.6 999.8
Dependency ratio (demographic)^ 953 779 1 174 478 4 218 1 046 437
Elderly 538 202 939 105 3 988 693 226
Child 415 577 235 373 230 352 211
Economic dependency ratio#
3 266 3 435 4 586 2 644 9 356 3 865 905
After policy intervention
(recurrent cash)
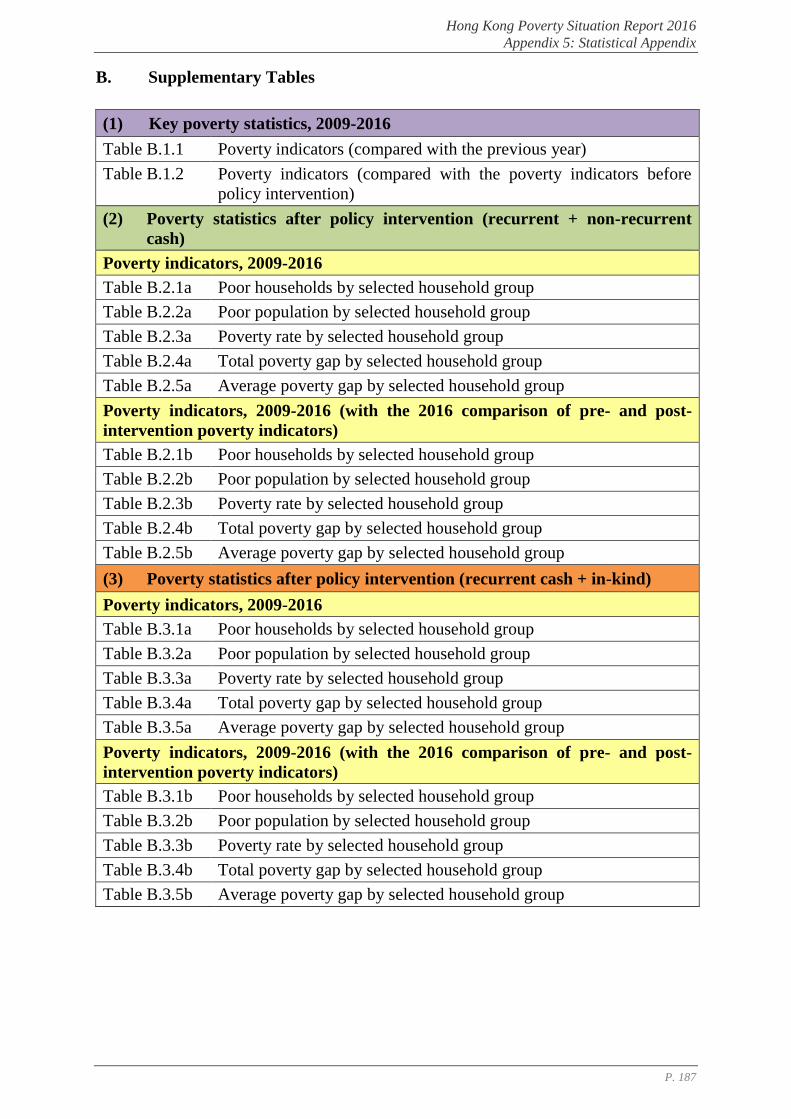
Hong Kong Poverty Situation Report 2016
Appendix 5: Statistical Appendix
P. 187
B. Supplementary Tables
(1) Key poverty statistics, 2009-2016
Table B.1.1 Poverty indicators (compared with the previous year)
Table B.1.2 Poverty indicators (compared with the poverty indicators before
policy intervention)
(2) Poverty statistics after policy intervention (recurrent + non-recurrent
cash)
Poverty indicators, 2009-2016
Table B.2.1a Poor households by selected household group
Table B.2.2a Poor population by selected household group
Table B.2.3a Poverty rate by selected household group
Table B.2.4a Total poverty gap by selected household group
Table B.2.5a Average poverty gap by selected household group
Poverty indicators, 2009-2016 (with the 2016 comparison of pre- and post-
intervention poverty indicators)
Table B.2.1b Poor households by selected household group
Table B.2.2b Poor population by selected household group
Table B.2.3b Poverty rate by selected household group
Table B.2.4b Total poverty gap by selected household group
Table B.2.5b Average poverty gap by selected household group
(3) Poverty statistics after policy intervention (recurrent cash + in-kind)
Poverty indicators, 2009-2016
Table B.3.1a Poor households by selected household group
Table B.3.2a Poor population by selected household group
Table B.3.3a Poverty rate by selected household group
Table B.3.4a Total poverty gap by selected household group
Table B.3.5a Average poverty gap by selected household group
Poverty indicators, 2009-2016 (with the 2016 comparison of pre- and post-
intervention poverty indicators)
Table B.3.1b Poor households by selected household group
Table B.3.2b Poor population by selected household group
Table B.3.3b Poverty rate by selected household group
Table B.3.4b Total poverty gap by selected household group
Table B.3.5b Average poverty gap by selected household group
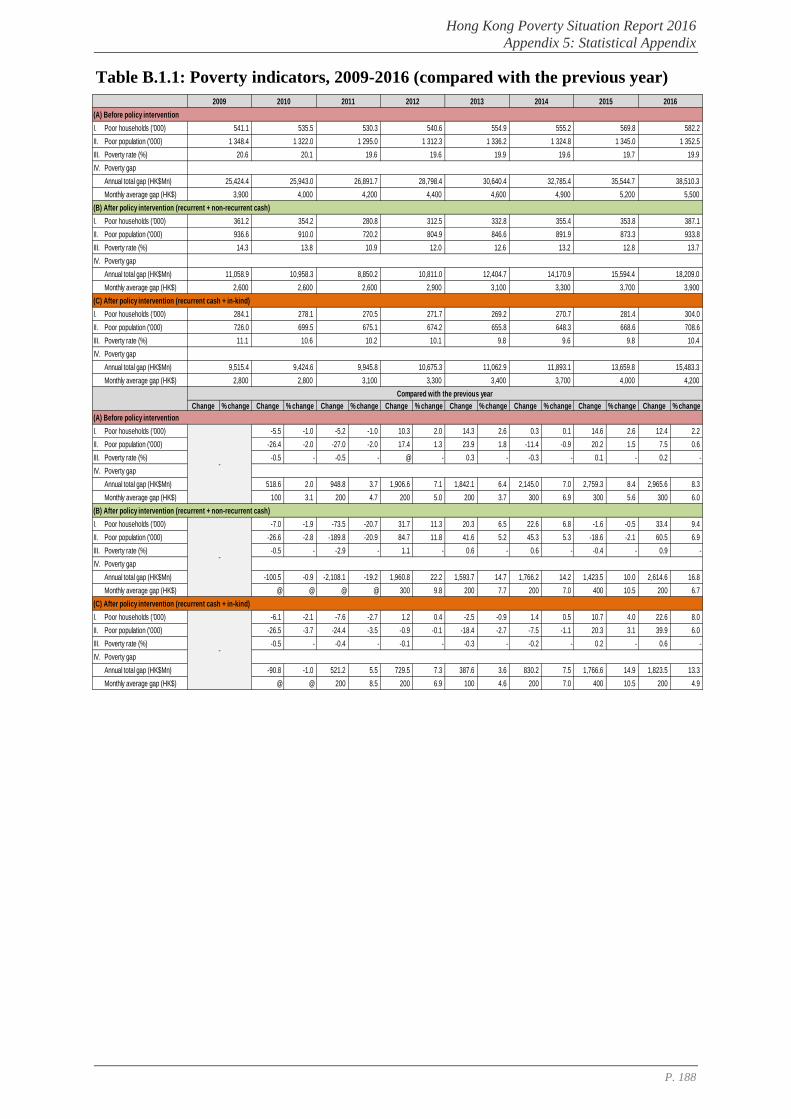
Hong Kong Poverty Situation Report 2016
Appendix 5: Statistical Appendix
P. 188
Table B.1.1: Poverty indicators, 2009-2016 (compared with the previous year)
(A) Before policy intervention
I. Poor households ('000) 541.1 535.5 530.3 540.6 554.9 555.2 569.8 582.2
II. Poor population ('000) 1 348.4 1 322.0 1 295.0 1 312.3 1 336.2 1 324.8 1 345.0 1 352.5
III. Poverty rate (%) 20.6 20.1 19.6 19.6 19.9 19.6 19.7 19.9
IV. Poverty gap
Annual total gap (HK$Mn) 25,424.4 25,943.0 26,891.7 28,798.4 30,640.4 32,785.4 35,544.7 38,510.3
Monthly average gap (HK$) 3,900 4,000 4,200 4,400 4,600 4,900 5,200 5,500
(B) After policy intervention (recurrent + non-recurrent cash)
I. Poor households ('000) 361.2 354.2 280.8 312.5 332.8 355.4 353.8 387.1
II. Poor population ('000) 936.6 910.0 720.2 804.9 846.6 891.9 873.3 933.8
III. Poverty rate (%) 14.3 13.8 10.9 12.0 12.6 13.2 12.8 13.7
IV. Poverty gap
Annual total gap (HK$Mn) 11,058.9 10,958.3 8,850.2 10,811.0 12,404.7 14,170.9 15,594.4 18,209.0
Monthly average gap (HK$) 2,600 2,600 2,600 2,900 3,100 3,300 3,700 3,900
(C) After policy intervention (recurrent cash + in-kind)
I. Poor households ('000) 284.1 278.1 270.5 271.7 269.2 270.7 281.4 304.0
II. Poor population ('000) 726.0 699.5 675.1 674.2 655.8 648.3 668.6 708.6
III. Poverty rate (%) 11.1 10.6 10.2 10.1 9.8 9.6 9.8 10.4
IV. Poverty gap
Annual total gap (HK$Mn) 9,515.4 9,424.6 9,945.8 10,675.3 11,062.9 11,893.1 13,659.8 15,483.3
Monthly average gap (HK$) 2,800 2,800 3,100 3,300 3,400 3,700 4,000 4,200
Change % change Change % change Change % change Change % change Change % change Change % change Change % change Change % change
(A) Before policy intervention
I. Poor households ('000) -5.5 -1.0 -5.2 -1.0 10.3 2.0 14.3 2.6 0.3 0.1 14.6 2.6 12.4 2.2
II. Poor population ('000) -26.4 -2.0 -27.0 -2.0 17.4 1.3 23.9 1.8 -11.4 -0.9 20.2 1.5 7.5 0.6
III. Poverty rate (%) -0.5 - -0.5 - @ - 0.3 - -0.3 - 0.1 - 0.2 -
IV. Poverty gap
Annual total gap (HK$Mn) 518.6 2.0 948.8 3.7 1,906.6 7.1 1,842.1 6.4 2,145.0 7.0 2,759.3 8.4 2,965.6 8.3
Monthly average gap (HK$) 100 3.1 200 4.7 200 5.0 200 3.7 300 6.9 300 5.6 300 6.0
(B) After policy intervention (recurrent + non-recurrent cash)
I. Poor households ('000) -7.0 -1.9 -73.5 -20.7 31.7 11.3 20.3 6.5 22.6 6.8 -1.6 -0.5 33.4 9.4
II. Poor population ('000) -26.6 -2.8 -189.8 -20.9 84.7 11.8 41.6 5.2 45.3 5.3 -18.6 -2.1 60.5 6.9
III. Poverty rate (%) -0.5 - -2.9 - 1.1 - 0.6 - 0.6 - -0.4 - 0.9 -
IV. Poverty gap
Annual total gap (HK$Mn) -100.5 -0.9 -2,108.1 -19.2 1,960.8 22.2 1,593.7 14.7 1,766.2 14.2 1,423.5 10.0 2,614.6 16.8
Monthly average gap (HK$) @ @ @ @ 300 9.8 200 7.7 200 7.0 400 10.5 200 6.7
(C) After policy intervention (recurrent cash + in-kind)
I. Poor households ('000) -6.1 -2.1 -7.6 -2.7 1.2 0.4 -2.5 -0.9 1.4 0.5 10.7 4.0 22.6 8.0
II. Poor population ('000) -26.5 -3.7 -24.4 -3.5 -0.9 -0.1 -18.4 -2.7 -7.5 -1.1 20.3 3.1 39.9 6.0
III. Poverty rate (%) -0.5 - -0.4 - -0.1 - -0.3 - -0.2 - 0.2 - 0.6 -
IV. Poverty gap
Annual total gap (HK$Mn) -90.8 -1.0 521.2 5.5 729.5 7.3 387.6 3.6 830.2 7.5 1,766.6 14.9 1,823.5 13.3
Monthly average gap (HK$) @ @ 200 8.5 200 6.9 100 4.6 200 7.0 400 10.5 200 4.9
2016
Compared with the previous year
2012
-
2011 20142013 2015
-
-
2009 2010
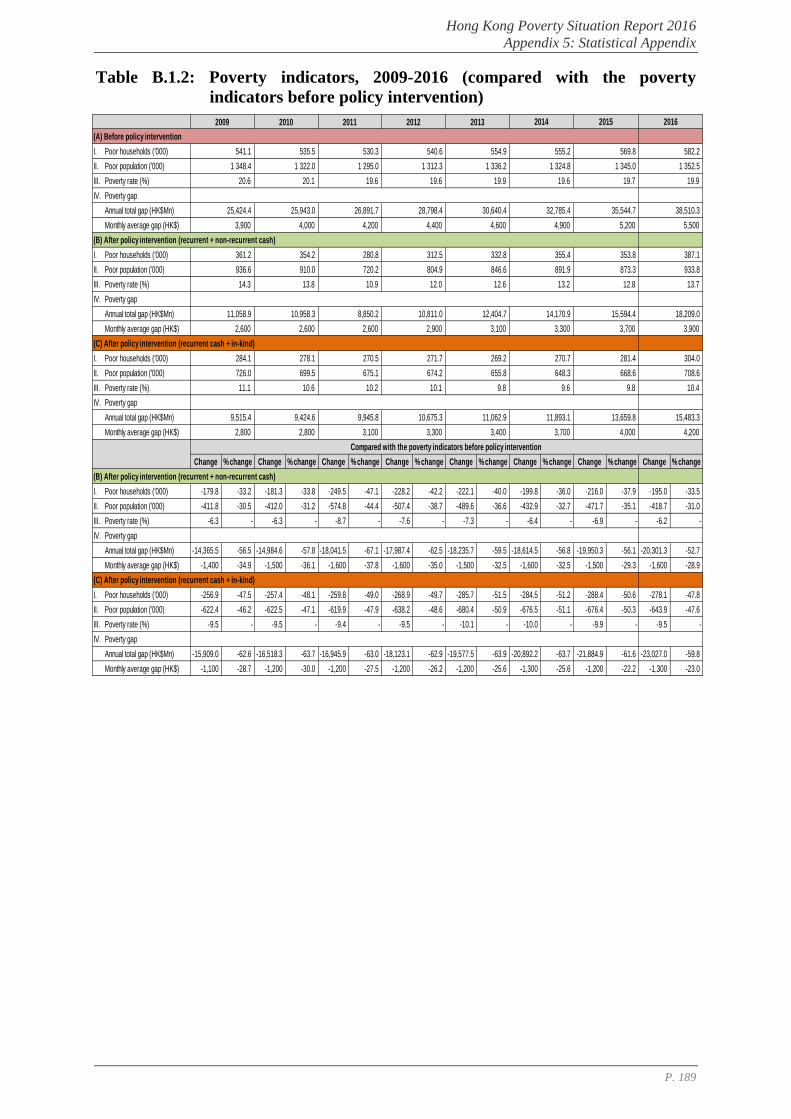
Hong Kong Poverty Situation Report 2016
Appendix 5: Statistical Appendix
P. 189
Table B.1.2: Poverty indicators, 2009-2016 (compared with the poverty
indicators before policy intervention)
2009 2010 2011 2012 2013
(A) Before policy intervention
I. Poor households ('000) 541.1 535.5 530.3 540.6 554.9 555.2 569.8 582.2
II. Poor population ('000) 1 324.8 1 345.0 1 352.5
III. Poverty rate (%) 20.6 20.1 19.6 19.6 19.9 19.6 19.7 19.9
IV. Poverty gap
Annual total gap (HK$Mn) 32,785.4 35,544.7 38,510.3
Monthly average gap (HK$) 3,900 4,000 4,200 4,400 4,600 4,900 5,200 5,500
(B) After policy intervention (recurrent + non-recurrent cash)
I. Poor households ('000) 361.2 354.2 280.8 312.5 332.8 355.4 353.8 387.1
II. Poor population ('000) 936.6 910.0 720.2 804.9 846.6 891.9 873.3 933.8
III. Poverty rate (%) 14.3 13.8 10.9 12.0 12.6 13.2 12.8 13.7
IV. Poverty gap
Annual total gap (HK$Mn) 14,170.9 15,594.4 18,209.0
Monthly average gap (HK$) 2,600 2,600 2,600 2,900 3,100 3,300 3,700 3,900
(C) After policy intervention (recurrent cash + in-kind)
I. Poor households ('000) 284.1 278.1 270.5 271.7 269.2 270.7 281.4 304.0
II. Poor population ('000) 726.0 699.5 675.1 674.2 655.8 648.3 668.6 708.6
III. Poverty rate (%) 11.1 10.6 10.2 10.1 9.8 9.6 9.8 10.4
IV. Poverty gap
Annual total gap (HK$Mn) 11,893.1 13,659.8 15,483.3
Monthly average gap (HK$) 2,800 2,800 3,100 3,300 3,400 3,700 4,000 4,200
Change % change Change % change Change % change Change % change Change % change Change % change Change % change Change % change
(B) After policy intervention (recurrent + non-recurrent cash)
I. Poor households ('000) -179.8 -33.2 -181.3 -33.8 -249.5 -47.1 -228.2 -42.2 -222.1 -40.0 -199.8 -36.0 -216.0 -37.9 -195.0 -33.5
II. Poor population ('000) -411.8 -30.5 -412.0 -31.2 -574.8 -44.4 -507.4 -38.7 -489.6 -36.6 -432.9 -32.7 -471.7 -35.1 -418.7 -31.0
III. Poverty rate (%) -6.3 - -6.3 - -8.7 - -7.6 - -7.3 - -6.4 - -6.9 - -6.2 -
IV. Poverty gap
Annual total gap (HK$Mn) -14,365.5 -56.5 -14,984.6 -57.8 -18,041.5 -67.1 -17,987.4 -62.5 -18,235.7 -59.5 -18,614.5 -56.8 -19,950.3 -56.1 -20,301.3 -52.7
Monthly average gap (HK$) -1,400 -34.9 -1,500 -36.1 -1,600 -37.8 -1,600 -35.0 -1,500 -32.5 -1,600 -32.5 -1,500 -29.3 -1,600 -28.9
(C) After policy intervention (recurrent cash + in-kind)
I. Poor households ('000) -256.9 -47.5 -257.4 -48.1 -259.8 -49.0 -268.9 -49.7 -285.7 -51.5 -284.5 -51.2 -288.4 -50.6 -278.1 -47.8
II. Poor population ('000) -622.4 -46.2 -622.5 -47.1 -619.9 -47.9 -638.2 -48.6 -680.4 -50.9 -676.5 -51.1 -676.4 -50.3 -643.9 -47.6
III. Poverty rate (%) -9.5 - -9.5 - -9.4 - -9.5 - -10.1 - -10.0 - -9.9 - -9.5 -
IV. Poverty gap
Annual total gap (HK$Mn) -15,909.0 -62.6 -16,518.3 -63.7 -16,945.9 -63.0 -18,123.1 -62.9 -19,577.5 -63.9 -20,892.2 -63.7 -21,884.9 -61.6 -23,027.0 -59.8
Monthly average gap (HK$) -1,100 -28.7 -1,200 -30.0 -1,200 -27.5 -1,200 -26.2 -1,200 -25.6 -1,300 -25.6 -1,200 -22.2 -1,300 -23.0
20152014
26,891.7 28,798.4
1 312.3 1 295.0 1 322.0 1 348.4
2016
Compared with the poverty indicators before policy intervention
30,640.4
1 336.2
10,675.3
11,058.9
11,062.9
12,404.710,811.010,958.3
9,515.4 9,424.6
8,850.2
9,945.8
25,424.4 25,943.0
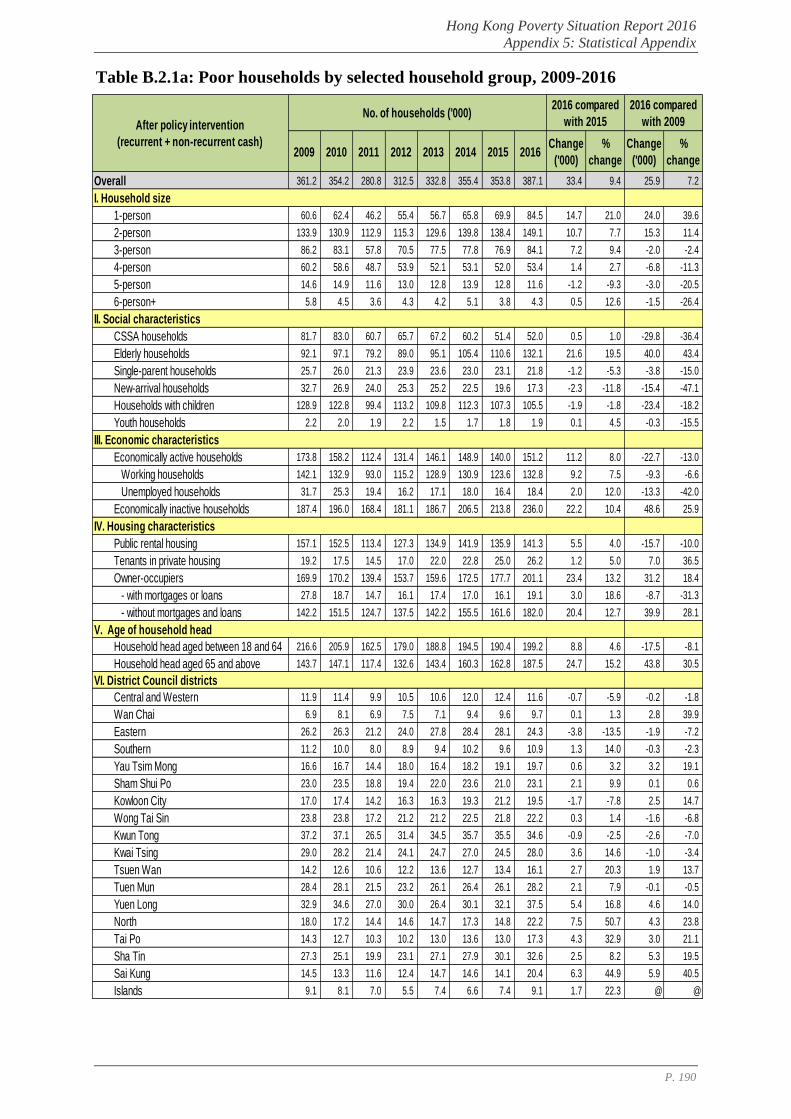
Hong Kong Poverty Situation Report 2016
Appendix 5: Statistical Appendix
P. 190
Table B.2.1a: Poor households by selected household group, 2009-2016
2009 2010 2011 2012 2013 2014 2015 2016Change
('000)
%
change
Change
('000)
%
change
Overall 361.2 354.2 280.8 312.5 332.8 355.4 353.8 387.1 33.4 9.4 25.9 7.2
I. Household size
1-person 60.6 62.4 46.2 55.4 56.7 65.8 69.9 84.5 14.7 21.0 24.0 39.6
2-person 133.9 130.9 112.9 115.3 129.6 139.8 138.4 149.1 10.7 7.7 15.3 11.4
3-person 86.2 83.1 57.8 70.5 77.5 77.8 76.9 84.1 7.2 9.4 -2.0 -2.4
4-person 60.2 58.6 48.7 53.9 52.1 53.1 52.0 53.4 1.4 2.7 -6.8 -11.3
5-person 14.6 14.9 11.6 13.0 12.8 13.9 12.8 11.6 -1.2 -9.3 -3.0 -20.5
6-person+ 5.8 4.5 3.6 4.3 4.2 5.1 3.8 4.3 0.5 12.6 -1.5 -26.4
II. Social characteristics
CSSA households 81.7 83.0 60.7 65.7 67.2 60.2 51.4 52.0 0.5 1.0 -29.8 -36.4
Elderly households 92.1 97.1 79.2 89.0 95.1 105.4 110.6 132.1 21.6 19.5 40.0 43.4
Single-parent households 25.7 26.0 21.3 23.9 23.6 23.0 23.1 21.8 -1.2 -5.3 -3.8 -15.0
New-arrival households 32.7 26.9 24.0 25.3 25.2 22.5 19.6 17.3 -2.3 -11.8 -15.4 -47.1
Households with children 128.9 122.8 99.4 113.2 109.8 112.3 107.3 105.5 -1.9 -1.8 -23.4 -18.2
Youth households 2.2 2.0 1.9 2.2 1.5 1.7 1.8 1.9 0.1 4.5 -0.3 -15.5
III. Economic characteristics
Economically active households 173.8 158.2 112.4 131.4 146.1 148.9 140.0 151.2 11.2 8.0 -22.7 -13.0
Working households 142.1 132.9 93.0 115.2 128.9 130.9 123.6 132.8 9.2 7.5 -9.3 -6.6
Unemployed households 31.7 25.3 19.4 16.2 17.1 18.0 16.4 18.4 2.0 12.0 -13.3 -42.0
Economically inactive households 187.4 196.0 168.4 181.1 186.7 206.5 213.8 236.0 22.2 10.4 48.6 25.9
IV. Housing characteristics
Public rental housing 157.1 152.5 113.4 127.3 134.9 141.9 135.9 141.3 5.5 4.0 -15.7 -10.0
Tenants in private housing 19.2 17.5 14.5 17.0 22.0 22.8 25.0 26.2 1.2 5.0 7.0 36.5
Owner-occupiers 169.9 170.2 139.4 153.7 159.6 172.5 177.7 201.1 23.4 13.2 31.2 18.4
- with mortgages or loans 27.8 18.7 14.7 16.1 17.4 17.0 16.1 19.1 3.0 18.6 -8.7 -31.3
- without mortgages and loans 142.2 151.5 124.7 137.5 142.2 155.5 161.6 182.0 20.4 12.7 39.9 28.1
V. Age of household head
Household head aged between 18 and 64 216.6 205.9 162.5 179.0 188.8 194.5 190.4 199.2 8.8 4.6 -17.5 -8.1
Household head aged 65 and above 143.7 147.1 117.4 132.6 143.4 160.3 162.8 187.5 24.7 15.2 43.8 30.5
VI. District Council districts
Central and Western 11.9 11.4 9.9 10.5 10.6 12.0 12.4 11.6 -0.7 -5.9 -0.2 -1.8
Wan Chai 6.9 8.1 6.9 7.5 7.1 9.4 9.6 9.7 0.1 1.3 2.8 39.9
Eastern 26.2 26.3 21.2 24.0 27.8 28.4 28.1 24.3 -3.8 -13.5 -1.9 -7.2
Southern 11.2 10.0 8.0 8.9 9.4 10.2 9.6 10.9 1.3 14.0 -0.3 -2.3
Yau Tsim Mong 16.6 16.7 14.4 18.0 16.4 18.2 19.1 19.7 0.6 3.2 3.2 19.1
Sham Shui Po 23.0 23.5 18.8 19.4 22.0 23.6 21.0 23.1 2.1 9.9 0.1 0.6
Kowloon City 17.0 17.4 14.2 16.3 16.3 19.3 21.2 19.5 -1.7 -7.8 2.5 14.7
Wong Tai Sin 23.8 23.8 17.2 21.2 21.2 22.5 21.8 22.2 0.3 1.4 -1.6 -6.8
Kwun Tong 37.2 37.1 26.5 31.4 34.5 35.7 35.5 34.6 -0.9 -2.5 -2.6 -7.0
Kwai Tsing 29.0 28.2 21.4 24.1 24.7 27.0 24.5 28.0 3.6 14.6 -1.0 -3.4
Tsuen Wan 14.2 12.6 10.6 12.2 13.6 12.7 13.4 16.1 2.7 20.3 1.9 13.7
Tuen Mun 28.4 28.1 21.5 23.2 26.1 26.4 26.1 28.2 2.1 7.9 -0.1 -0.5
Yuen Long 32.9 34.6 27.0 30.0 26.4 30.1 32.1 37.5 5.4 16.8 4.6 14.0
North 18.0 17.2 14.4 14.6 14.7 17.3 14.8 22.2 7.5 50.7 4.3 23.8
Tai Po 14.3 12.7 10.3 10.2 13.0 13.6 13.0 17.3 4.3 32.9 3.0 21.1
Sha Tin 27.3 25.1 19.9 23.1 27.1 27.9 30.1 32.6 2.5 8.2 5.3 19.5
Sai Kung 14.5 13.3 11.6 12.4 14.7 14.6 14.1 20.4 6.3 44.9 5.9 40.5
Islands 9.1 8.1 7.0 5.5 7.4 6.6 7.4 9.1 1.7 22.3 @ @
2016 compared
with 2015After policy intervention
(recurrent + non-recurrent cash)
2016 compared
with 2009No. of households ('000)
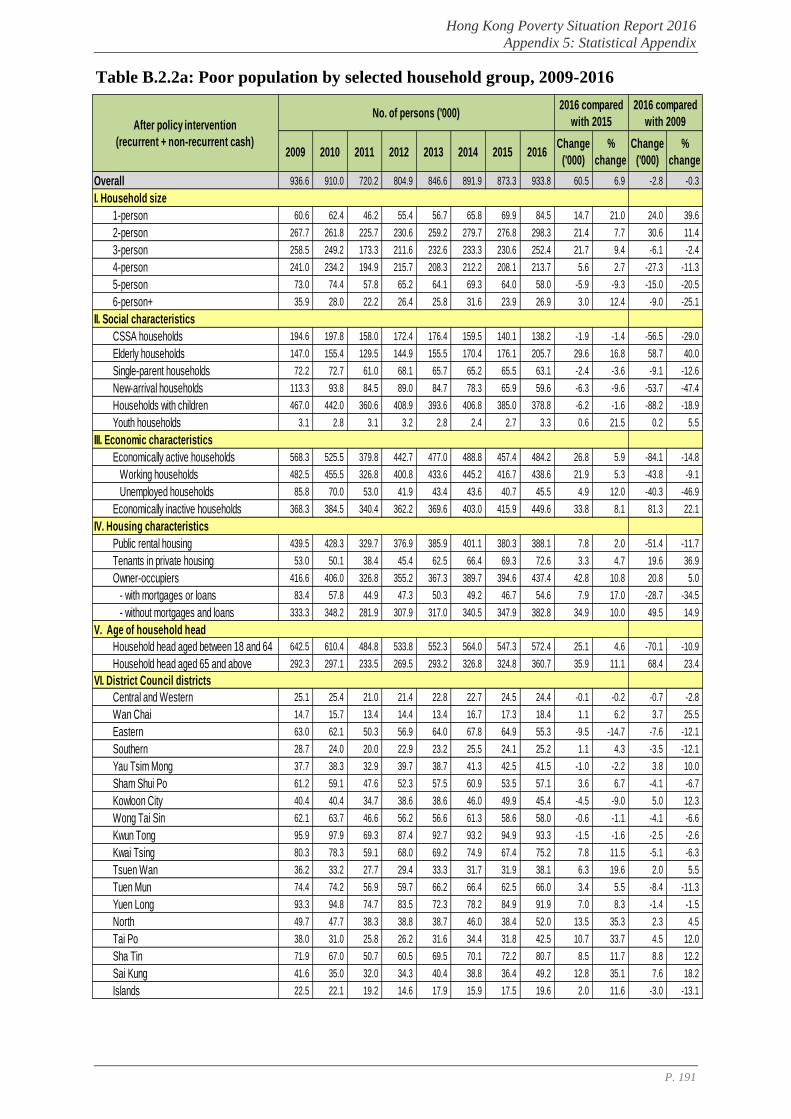
Hong Kong Poverty Situation Report 2016
Appendix 5: Statistical Appendix
P. 191
Table B.2.2a: Poor population by selected household group, 2009-2016
2009 2010 2011 2012 2013 2014 2015 2016Change
('000)
%
change
Change
('000)
%
change
Overall 936.6 910.0 720.2 804.9 846.6 891.9 873.3 933.8 60.5 6.9 -2.8 -0.3
I. Household size
1-person 60.6 62.4 46.2 55.4 56.7 65.8 69.9 84.5 14.7 21.0 24.0 39.6
2-person 267.7 261.8 225.7 230.6 259.2 279.7 276.8 298.3 21.4 7.7 30.6 11.4
3-person 258.5 249.2 173.3 211.6 232.6 233.3 230.6 252.4 21.7 9.4 -6.1 -2.4
4-person 241.0 234.2 194.9 215.7 208.3 212.2 208.1 213.7 5.6 2.7 -27.3 -11.3
5-person 73.0 74.4 57.8 65.2 64.1 69.3 64.0 58.0 -5.9 -9.3 -15.0 -20.5
6-person+ 35.9 28.0 22.2 26.4 25.8 31.6 23.9 26.9 3.0 12.4 -9.0 -25.1
II. Social characteristics
CSSA households 194.6 197.8 158.0 172.4 176.4 159.5 140.1 138.2 -1.9 -1.4 -56.5 -29.0
Elderly households 147.0 155.4 129.5 144.9 155.5 170.4 176.1 205.7 29.6 16.8 58.7 40.0
Single-parent households 72.2 72.7 61.0 68.1 65.7 65.2 65.5 63.1 -2.4 -3.6 -9.1 -12.6
New-arrival households 113.3 93.8 84.5 89.0 84.7 78.3 65.9 59.6 -6.3 -9.6 -53.7 -47.4
Households with children 467.0 442.0 360.6 408.9 393.6 406.8 385.0 378.8 -6.2 -1.6 -88.2 -18.9
Youth households 3.1 2.8 3.1 3.2 2.8 2.4 2.7 3.3 0.6 21.5 0.2 5.5
III. Economic characteristics
Economically active households 568.3 525.5 379.8 442.7 477.0 488.8 457.4 484.2 26.8 5.9 -84.1 -14.8
Working households 482.5 455.5 326.8 400.8 433.6 445.2 416.7 438.6 21.9 5.3 -43.8 -9.1
Unemployed households 85.8 70.0 53.0 41.9 43.4 43.6 40.7 45.5 4.9 12.0 -40.3 -46.9
Economically inactive households 368.3 384.5 340.4 362.2 369.6 403.0 415.9 449.6 33.8 8.1 81.3 22.1
IV. Housing characteristics
Public rental housing 439.5 428.3 329.7 376.9 385.9 401.1 380.3 388.1 7.8 2.0 -51.4 -11.7
Tenants in private housing 53.0 50.1 38.4 45.4 62.5 66.4 69.3 72.6 3.3 4.7 19.6 36.9
Owner-occupiers 416.6 406.0 326.8 355.2 367.3 389.7 394.6 437.4 42.8 10.8 20.8 5.0
- with mortgages or loans 83.4 57.8 44.9 47.3 50.3 49.2 46.7 54.6 7.9 17.0 -28.7 -34.5
- without mortgages and loans 333.3 348.2 281.9 307.9 317.0 340.5 347.9 382.8 34.9 10.0 49.5 14.9
V. Age of household head
Household head aged between 18 and 64 642.5 610.4 484.8 533.8 552.3 564.0 547.3 572.4 25.1 4.6 -70.1 -10.9
Household head aged 65 and above 292.3 297.1 233.5 269.5 293.2 326.8 324.8 360.7 35.9 11.1 68.4 23.4
VI. District Council districts
Central and Western 25.1 25.4 21.0 21.4 22.8 22.7 24.5 24.4 -0.1 -0.2 -0.7 -2.8
Wan Chai 14.7 15.7 13.4 14.4 13.4 16.7 17.3 18.4 1.1 6.2 3.7 25.5
Eastern 63.0 62.1 50.3 56.9 64.0 67.8 64.9 55.3 -9.5 -14.7 -7.6 -12.1
Southern 28.7 24.0 20.0 22.9 23.2 25.5 24.1 25.2 1.1 4.3 -3.5 -12.1
Yau Tsim Mong 37.7 38.3 32.9 39.7 38.7 41.3 42.5 41.5 -1.0 -2.2 3.8 10.0
Sham Shui Po 61.2 59.1 47.6 52.3 57.5 60.9 53.5 57.1 3.6 6.7 -4.1 -6.7
Kowloon City 40.4 40.4 34.7 38.6 38.6 46.0 49.9 45.4 -4.5 -9.0 5.0 12.3
Wong Tai Sin 62.1 63.7 46.6 56.2 56.6 61.3 58.6 58.0 -0.6 -1.1 -4.1 -6.6
Kwun Tong 95.9 97.9 69.3 87.4 92.7 93.2 94.9 93.3 -1.5 -1.6 -2.5 -2.6
Kwai Tsing 80.3 78.3 59.1 68.0 69.2 74.9 67.4 75.2 7.8 11.5 -5.1 -6.3
Tsuen Wan 36.2 33.2 27.7 29.4 33.3 31.7 31.9 38.1 6.3 19.6 2.0 5.5
Tuen Mun 74.4 74.2 56.9 59.7 66.2 66.4 62.5 66.0 3.4 5.5 -8.4 -11.3
Yuen Long 93.3 94.8 74.7 83.5 72.3 78.2 84.9 91.9 7.0 8.3 -1.4 -1.5
North 49.7 47.7 38.3 38.8 38.7 46.0 38.4 52.0 13.5 35.3 2.3 4.5
Tai Po 38.0 31.0 25.8 26.2 31.6 34.4 31.8 42.5 10.7 33.7 4.5 12.0
Sha Tin 71.9 67.0 50.7 60.5 69.5 70.1 72.2 80.7 8.5 11.7 8.8 12.2
Sai Kung 41.6 35.0 32.0 34.3 40.4 38.8 36.4 49.2 12.8 35.1 7.6 18.2
Islands 22.5 22.1 19.2 14.6 17.9 15.9 17.5 19.6 2.0 11.6 -3.0 -13.1
2016 compared
with 2015After policy intervention
(recurrent + non-recurrent cash)
2016 compared
with 2009No. of persons ('000)
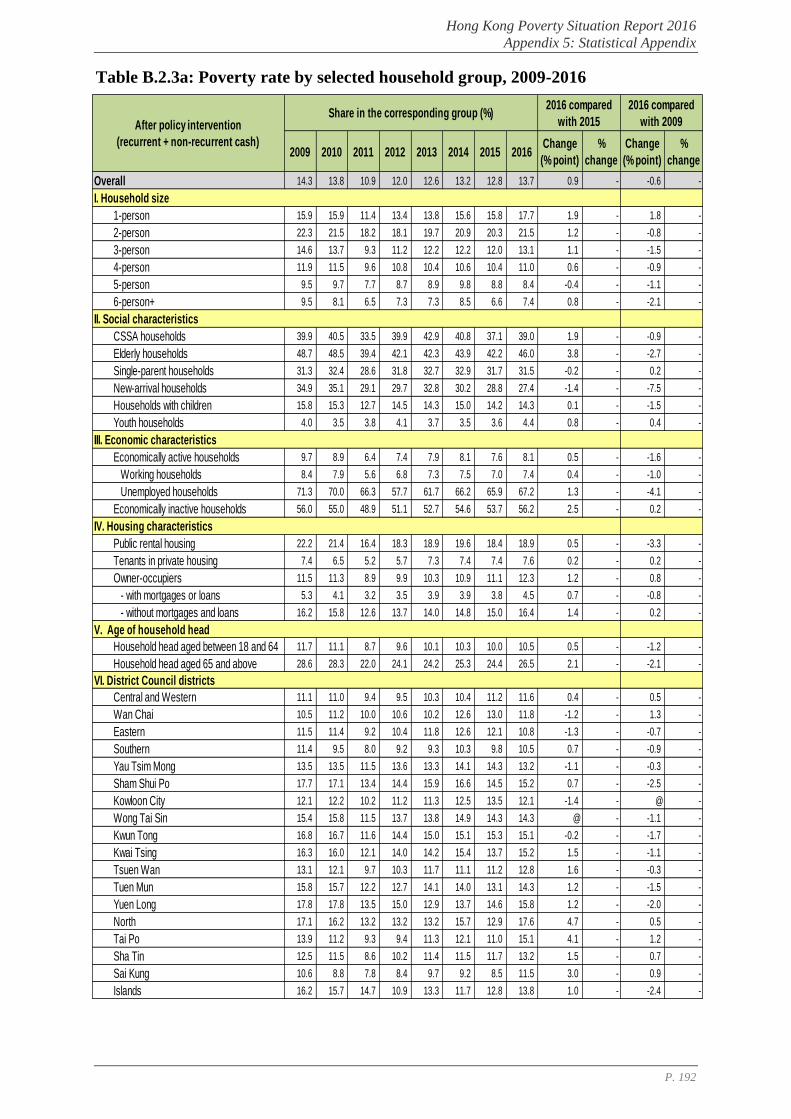
Hong Kong Poverty Situation Report 2016
Appendix 5: Statistical Appendix
P. 192
Table B.2.3a: Poverty rate by selected household group, 2009-2016
2009 2010 2011 2012 2013 2014 2015 2016Change
(% point)
%
change
Change
(% point)
%
change
Overall 14.3 13.8 10.9 12.0 12.6 13.2 12.8 13.7 0.9 - -0.6 -
I. Household size
1-person 15.9 15.9 11.4 13.4 13.8 15.6 15.8 17.7 1.9 - 1.8 -
2-person 22.3 21.5 18.2 18.1 19.7 20.9 20.3 21.5 1.2 - -0.8 -
3-person 14.6 13.7 9.3 11.2 12.2 12.2 12.0 13.1 1.1 - -1.5 -
4-person 11.9 11.5 9.6 10.8 10.4 10.6 10.4 11.0 0.6 - -0.9 -
5-person 9.5 9.7 7.7 8.7 8.9 9.8 8.8 8.4 -0.4 - -1.1 -
6-person+ 9.5 8.1 6.5 7.3 7.3 8.5 6.6 7.4 0.8 - -2.1 -
II. Social characteristics
CSSA households 39.9 40.5 33.5 39.9 42.9 40.8 37.1 39.0 1.9 - -0.9 -
Elderly households 48.7 48.5 39.4 42.1 42.3 43.9 42.2 46.0 3.8 - -2.7 -
Single-parent households 31.3 32.4 28.6 31.8 32.7 32.9 31.7 31.5 -0.2 - 0.2 -
New-arrival households 34.9 35.1 29.1 29.7 32.8 30.2 28.8 27.4 -1.4 - -7.5 -
Households with children 15.8 15.3 12.7 14.5 14.3 15.0 14.2 14.3 0.1 - -1.5 -
Youth households 4.0 3.5 3.8 4.1 3.7 3.5 3.6 4.4 0.8 - 0.4 -
III. Economic characteristics
Economically active households 9.7 8.9 6.4 7.4 7.9 8.1 7.6 8.1 0.5 - -1.6 -
Working households 8.4 7.9 5.6 6.8 7.3 7.5 7.0 7.4 0.4 - -1.0 -
Unemployed households 71.3 70.0 66.3 57.7 61.7 66.2 65.9 67.2 1.3 - -4.1 -
Economically inactive households 56.0 55.0 48.9 51.1 52.7 54.6 53.7 56.2 2.5 - 0.2 -
IV. Housing characteristics
Public rental housing 22.2 21.4 16.4 18.3 18.9 19.6 18.4 18.9 0.5 - -3.3 -
Tenants in private housing 7.4 6.5 5.2 5.7 7.3 7.4 7.4 7.6 0.2 - 0.2 -
Owner-occupiers 11.5 11.3 8.9 9.9 10.3 10.9 11.1 12.3 1.2 - 0.8 -
- with mortgages or loans 5.3 4.1 3.2 3.5 3.9 3.9 3.8 4.5 0.7 - -0.8 -
- without mortgages and loans 16.2 15.8 12.6 13.7 14.0 14.8 15.0 16.4 1.4 - 0.2 -
V. Age of household head
Household head aged between 18 and 64 11.7 11.1 8.7 9.6 10.1 10.3 10.0 10.5 0.5 - -1.2 -
Household head aged 65 and above 28.6 28.3 22.0 24.1 24.2 25.3 24.4 26.5 2.1 - -2.1 -
VI. District Council districts
Central and Western 11.1 11.0 9.4 9.5 10.3 10.4 11.2 11.6 0.4 - 0.5 -
Wan Chai 10.5 11.2 10.0 10.6 10.2 12.6 13.0 11.8 -1.2 - 1.3 -
Eastern 11.5 11.4 9.2 10.4 11.8 12.6 12.1 10.8 -1.3 - -0.7 -
Southern 11.4 9.5 8.0 9.2 9.3 10.3 9.8 10.5 0.7 - -0.9 -
Yau Tsim Mong 13.5 13.5 11.5 13.6 13.3 14.1 14.3 13.2 -1.1 - -0.3 -
Sham Shui Po 17.7 17.1 13.4 14.4 15.9 16.6 14.5 15.2 0.7 - -2.5 -
Kowloon City 12.1 12.2 10.2 11.2 11.3 12.5 13.5 12.1 -1.4 - @ -
Wong Tai Sin 15.4 15.8 11.5 13.7 13.8 14.9 14.3 14.3 @ - -1.1 -
Kwun Tong 16.8 16.7 11.6 14.4 15.0 15.1 15.3 15.1 -0.2 - -1.7 -
Kwai Tsing 16.3 16.0 12.1 14.0 14.2 15.4 13.7 15.2 1.5 - -1.1 -
Tsuen Wan 13.1 12.1 9.7 10.3 11.7 11.1 11.2 12.8 1.6 - -0.3 -
Tuen Mun 15.8 15.7 12.2 12.7 14.1 14.0 13.1 14.3 1.2 - -1.5 -
Yuen Long 17.8 17.8 13.5 15.0 12.9 13.7 14.6 15.8 1.2 - -2.0 -
North 17.1 16.2 13.2 13.2 13.2 15.7 12.9 17.6 4.7 - 0.5 -
Tai Po 13.9 11.2 9.3 9.4 11.3 12.1 11.0 15.1 4.1 - 1.2 -
Sha Tin 12.5 11.5 8.6 10.2 11.4 11.5 11.7 13.2 1.5 - 0.7 -
Sai Kung 10.6 8.8 7.8 8.4 9.7 9.2 8.5 11.5 3.0 - 0.9 -
Islands 16.2 15.7 14.7 10.9 13.3 11.7 12.8 13.8 1.0 - -2.4 -
2016 compared
with 2015After policy intervention
(recurrent + non-recurrent cash)
2016 compared
with 2009Share in the corresponding group (%)
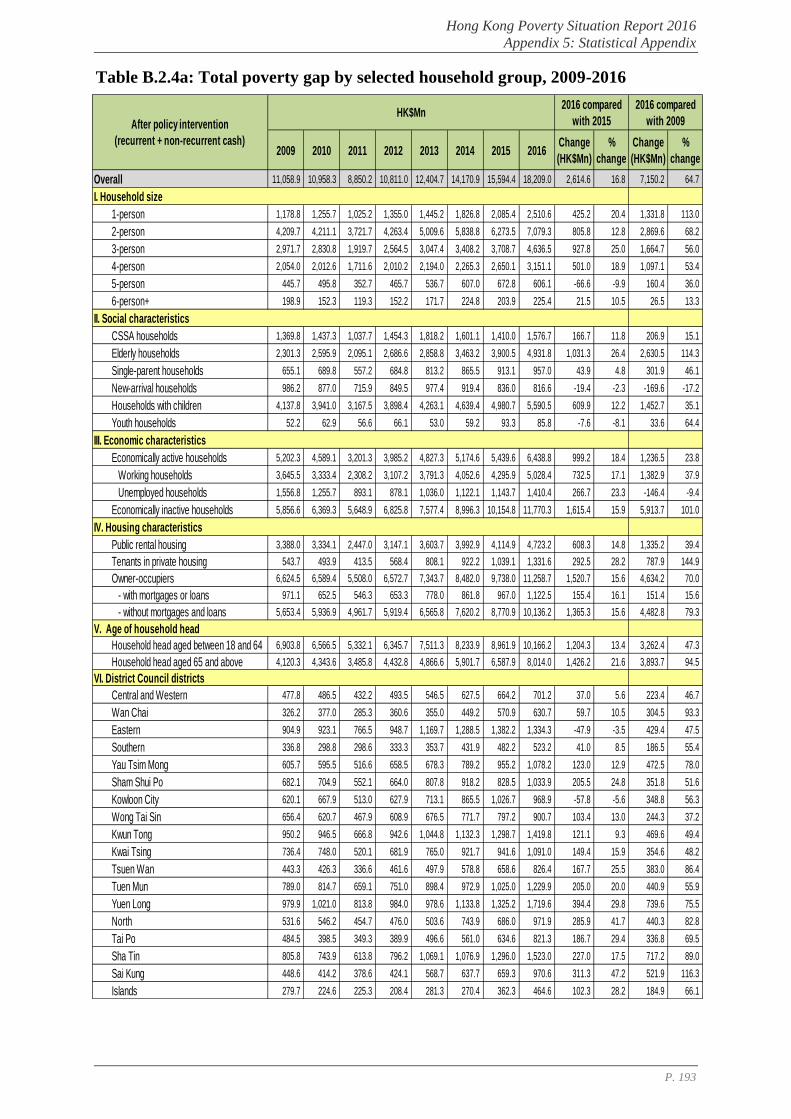
Hong Kong Poverty Situation Report 2016
Appendix 5: Statistical Appendix
P. 193
Table B.2.4a: Total poverty gap by selected household group, 2009-2016
2009 2010 2011 2012 2013 2014 2015 2016Change
(HK$Mn)
%
change
Change
(HK$Mn)
%
change
Overall 11,058.9 10,958.3 8,850.2 10,811.0 12,404.7 14,170.9 15,594.4 18,209.0 2,614.6 16.8 7,150.2 64.7
I. Household size
1-person 1,178.8 1,255.7 1,025.2 1,355.0 1,445.2 1,826.8 2,085.4 2,510.6 425.2 20.4 1,331.8 113.0
2-person 4,209.7 4,211.1 3,721.7 4,263.4 5,009.6 5,838.8 6,273.5 7,079.3 805.8 12.8 2,869.6 68.2
3-person 2,971.7 2,830.8 1,919.7 2,564.5 3,047.4 3,408.2 3,708.7 4,636.5 927.8 25.0 1,664.7 56.0
4-person 2,054.0 2,012.6 1,711.6 2,010.2 2,194.0 2,265.3 2,650.1 3,151.1 501.0 18.9 1,097.1 53.4
5-person 445.7 495.8 352.7 465.7 536.7 607.0 672.8 606.1 -66.6 -9.9 160.4 36.0
6-person+ 198.9 152.3 119.3 152.2 171.7 224.8 203.9 225.4 21.5 10.5 26.5 13.3
II. Social characteristics
CSSA households 1,369.8 1,437.3 1,037.7 1,454.3 1,818.2 1,601.1 1,410.0 1,576.7 166.7 11.8 206.9 15.1
Elderly households 2,301.3 2,595.9 2,095.1 2,686.6 2,858.8 3,463.2 3,900.5 4,931.8 1,031.3 26.4 2,630.5 114.3
Single-parent households 655.1 689.8 557.2 684.8 813.2 865.5 913.1 957.0 43.9 4.8 301.9 46.1
New-arrival households 986.2 877.0 715.9 849.5 977.4 919.4 836.0 816.6 -19.4 -2.3 -169.6 -17.2
Households with children 4,137.8 3,941.0 3,167.5 3,898.4 4,263.1 4,639.4 4,980.7 5,590.5 609.9 12.2 1,452.7 35.1
Youth households 52.2 62.9 56.6 66.1 53.0 59.2 93.3 85.8 -7.6 -8.1 33.6 64.4
III. Economic characteristics
Economically active households 5,202.3 4,589.1 3,201.3 3,985.2 4,827.3 5,174.6 5,439.6 6,438.8 999.2 18.4 1,236.5 23.8
Working households 3,645.5 3,333.4 2,308.2 3,107.2 3,791.3 4,052.6 4,295.9 5,028.4 732.5 17.1 1,382.9 37.9
Unemployed households 1,556.8 1,255.7 893.1 878.1 1,036.0 1,122.1 1,143.7 1,410.4 266.7 23.3 -146.4 -9.4
Economically inactive households 5,856.6 6,369.3 5,648.9 6,825.8 7,577.4 8,996.3 10,154.8 11,770.3 1,615.4 15.9 5,913.7 101.0
IV. Housing characteristics
Public rental housing 3,388.0 3,334.1 2,447.0 3,147.1 3,603.7 3,992.9 4,114.9 4,723.2 608.3 14.8 1,335.2 39.4
Tenants in private housing 543.7 493.9 413.5 568.4 808.1 922.2 1,039.1 1,331.6 292.5 28.2 787.9 144.9
Owner-occupiers 6,624.5 6,589.4 5,508.0 6,572.7 7,343.7 8,482.0 9,738.0 11,258.7 1,520.7 15.6 4,634.2 70.0
- with mortgages or loans 971.1 652.5 546.3 653.3 778.0 861.8 967.0 1,122.5 155.4 16.1 151.4 15.6
- without mortgages and loans 5,653.4 5,936.9 4,961.7 5,919.4 6,565.8 7,620.2 8,770.9 10,136.2 1,365.3 15.6 4,482.8 79.3
V. Age of household head
Household head aged between 18 and 64 6,903.8 6,566.5 5,332.1 6,345.7 7,511.3 8,233.9 8,961.9 10,166.2 1,204.3 13.4 3,262.4 47.3
Household head aged 65 and above 4,120.3 4,343.6 3,485.8 4,432.8 4,866.6 5,901.7 6,587.9 8,014.0 1,426.2 21.6 3,893.7 94.5
VI. District Council districts
Central and Western 477.8 486.5 432.2 493.5 546.5 627.5 664.2 701.2 37.0 5.6 223.4 46.7
Wan Chai 326.2 377.0 285.3 360.6 355.0 449.2 570.9 630.7 59.7 10.5 304.5 93.3
Eastern 904.9 923.1 766.5 948.7 1,169.7 1,288.5 1,382.2 1,334.3 -47.9 -3.5 429.4 47.5
Southern 336.8 298.8 298.6 333.3 353.7 431.9 482.2 523.2 41.0 8.5 186.5 55.4
Yau Tsim Mong 605.7 595.5 516.6 658.5 678.3 789.2 955.2 1,078.2 123.0 12.9 472.5 78.0
Sham Shui Po 682.1 704.9 552.1 664.0 807.8 918.2 828.5 1,033.9 205.5 24.8 351.8 51.6
Kowloon City 620.1 667.9 513.0 627.9 713.1 865.5 1,026.7 968.9 -57.8 -5.6 348.8 56.3
Wong Tai Sin 656.4 620.7 467.9 608.9 676.5 771.7 797.2 900.7 103.4 13.0 244.3 37.2
Kwun Tong 950.2 946.5 666.8 942.6 1,044.8 1,132.3 1,298.7 1,419.8 121.1 9.3 469.6 49.4
Kwai Tsing 736.4 748.0 520.1 681.9 765.0 921.7 941.6 1,091.0 149.4 15.9 354.6 48.2
Tsuen Wan 443.3 426.3 336.6 461.6 497.9 578.8 658.6 826.4 167.7 25.5 383.0 86.4
Tuen Mun 789.0 814.7 659.1 751.0 898.4 972.9 1,025.0 1,229.9 205.0 20.0 440.9 55.9
Yuen Long 979.9 1,021.0 813.8 984.0 978.6 1,133.8 1,325.2 1,719.6 394.4 29.8 739.6 75.5
North 531.6 546.2 454.7 476.0 503.6 743.9 686.0 971.9 285.9 41.7 440.3 82.8
Tai Po 484.5 398.5 349.3 389.9 496.6 561.0 634.6 821.3 186.7 29.4 336.8 69.5
Sha Tin 805.8 743.9 613.8 796.2 1,069.1 1,076.9 1,296.0 1,523.0 227.0 17.5 717.2 89.0
Sai Kung 448.6 414.2 378.6 424.1 568.7 637.7 659.3 970.6 311.3 47.2 521.9 116.3
Islands 279.7 224.6 225.3 208.4 281.3 270.4 362.3 464.6 102.3 28.2 184.9 66.1
2016 compared
with 2015After policy intervention
(recurrent + non-recurrent cash)
2016 compared
with 2009HK$Mn
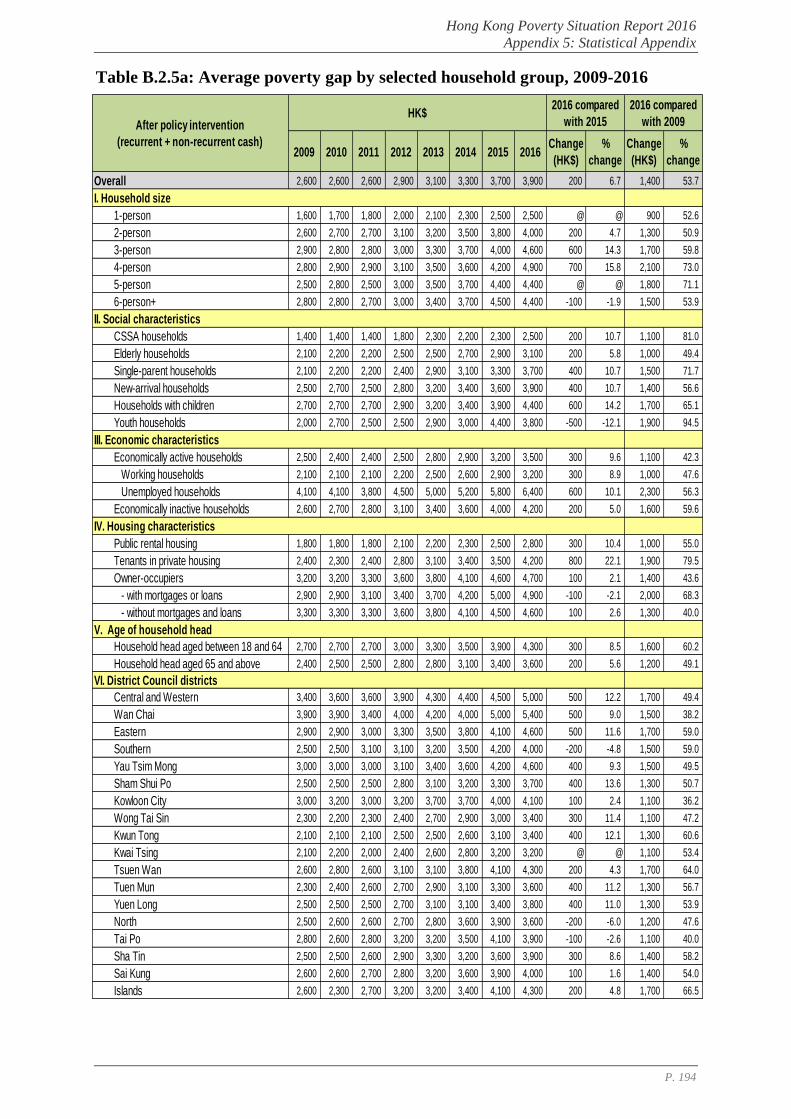
Hong Kong Poverty Situation Report 2016
Appendix 5: Statistical Appendix
P. 194
Table B.2.5a: Average poverty gap by selected household group, 2009-2016
2009 2010 2011 2012 2013 2014 2015 2016Change
(HK$)
%
change
Change
(HK$)
%
change
Overall 2,600 2,600 2,600 2,900 3,100 3,300 3,700 3,900 200 6.7 1,400 53.7
I. Household size
1-person 1,600 1,700 1,800 2,000 2,100 2,300 2,500 2,500 @ @ 900 52.6
2-person 2,600 2,700 2,700 3,100 3,200 3,500 3,800 4,000 200 4.7 1,300 50.9
3-person 2,900 2,800 2,800 3,000 3,300 3,700 4,000 4,600 600 14.3 1,700 59.8
4-person 2,800 2,900 2,900 3,100 3,500 3,600 4,200 4,900 700 15.8 2,100 73.0
5-person 2,500 2,800 2,500 3,000 3,500 3,700 4,400 4,400 @ @ 1,800 71.1
6-person+ 2,800 2,800 2,700 3,000 3,400 3,700 4,500 4,400 -100 -1.9 1,500 53.9
II. Social characteristics
CSSA households 1,400 1,400 1,400 1,800 2,300 2,200 2,300 2,500 200 10.7 1,100 81.0
Elderly households 2,100 2,200 2,200 2,500 2,500 2,700 2,900 3,100 200 5.8 1,000 49.4
Single-parent households 2,100 2,200 2,200 2,400 2,900 3,100 3,300 3,700 400 10.7 1,500 71.7
New-arrival households 2,500 2,700 2,500 2,800 3,200 3,400 3,600 3,900 400 10.7 1,400 56.6
Households with children 2,700 2,700 2,700 2,900 3,200 3,400 3,900 4,400 600 14.2 1,700 65.1
Youth households 2,000 2,700 2,500 2,500 2,900 3,000 4,400 3,800 -500 -12.1 1,900 94.5
III. Economic characteristics
Economically active households 2,500 2,400 2,400 2,500 2,800 2,900 3,200 3,500 300 9.6 1,100 42.3
Working households 2,100 2,100 2,100 2,200 2,500 2,600 2,900 3,200 300 8.9 1,000 47.6
Unemployed households 4,100 4,100 3,800 4,500 5,000 5,200 5,800 6,400 600 10.1 2,300 56.3
Economically inactive households 2,600 2,700 2,800 3,100 3,400 3,600 4,000 4,200 200 5.0 1,600 59.6
IV. Housing characteristics
Public rental housing 1,800 1,800 1,800 2,100 2,200 2,300 2,500 2,800 300 10.4 1,000 55.0
Tenants in private housing 2,400 2,300 2,400 2,800 3,100 3,400 3,500 4,200 800 22.1 1,900 79.5
Owner-occupiers 3,200 3,200 3,300 3,600 3,800 4,100 4,600 4,700 100 2.1 1,400 43.6
- with mortgages or loans 2,900 2,900 3,100 3,400 3,700 4,200 5,000 4,900 -100 -2.1 2,000 68.3
- without mortgages and loans 3,300 3,300 3,300 3,600 3,800 4,100 4,500 4,600 100 2.6 1,300 40.0
V. Age of household head
Household head aged between 18 and 64 2,700 2,700 2,700 3,000 3,300 3,500 3,900 4,300 300 8.5 1,600 60.2
Household head aged 65 and above 2,400 2,500 2,500 2,800 2,800 3,100 3,400 3,600 200 5.6 1,200 49.1
VI. District Council districts
Central and Western 3,400 3,600 3,600 3,900 4,300 4,400 4,500 5,000 500 12.2 1,700 49.4
Wan Chai 3,900 3,900 3,400 4,000 4,200 4,000 5,000 5,400 500 9.0 1,500 38.2
Eastern 2,900 2,900 3,000 3,300 3,500 3,800 4,100 4,600 500 11.6 1,700 59.0
Southern 2,500 2,500 3,100 3,100 3,200 3,500 4,200 4,000 -200 -4.8 1,500 59.0
Yau Tsim Mong 3,000 3,000 3,000 3,100 3,400 3,600 4,200 4,600 400 9.3 1,500 49.5
Sham Shui Po 2,500 2,500 2,500 2,800 3,100 3,200 3,300 3,700 400 13.6 1,300 50.7
Kowloon City 3,000 3,200 3,000 3,200 3,700 3,700 4,000 4,100 100 2.4 1,100 36.2
Wong Tai Sin 2,300 2,200 2,300 2,400 2,700 2,900 3,000 3,400 300 11.4 1,100 47.2
Kwun Tong 2,100 2,100 2,100 2,500 2,500 2,600 3,100 3,400 400 12.1 1,300 60.6
Kwai Tsing 2,100 2,200 2,000 2,400 2,600 2,800 3,200 3,200 @ @ 1,100 53.4
Tsuen Wan 2,600 2,800 2,600 3,100 3,100 3,800 4,100 4,300 200 4.3 1,700 64.0
Tuen Mun 2,300 2,400 2,600 2,700 2,900 3,100 3,300 3,600 400 11.2 1,300 56.7
Yuen Long 2,500 2,500 2,500 2,700 3,100 3,100 3,400 3,800 400 11.0 1,300 53.9
North 2,500 2,600 2,600 2,700 2,800 3,600 3,900 3,600 -200 -6.0 1,200 47.6
Tai Po 2,800 2,600 2,800 3,200 3,200 3,500 4,100 3,900 -100 -2.6 1,100 40.0
Sha Tin 2,500 2,500 2,600 2,900 3,300 3,200 3,600 3,900 300 8.6 1,400 58.2
Sai Kung 2,600 2,600 2,700 2,800 3,200 3,600 3,900 4,000 100 1.6 1,400 54.0
Islands 2,600 2,300 2,700 3,200 3,200 3,400 4,100 4,300 200 4.8 1,700 66.5
2016 compared
with 2015After policy intervention
(recurrent + non-recurrent cash)
2016 compared
with 2009HK$
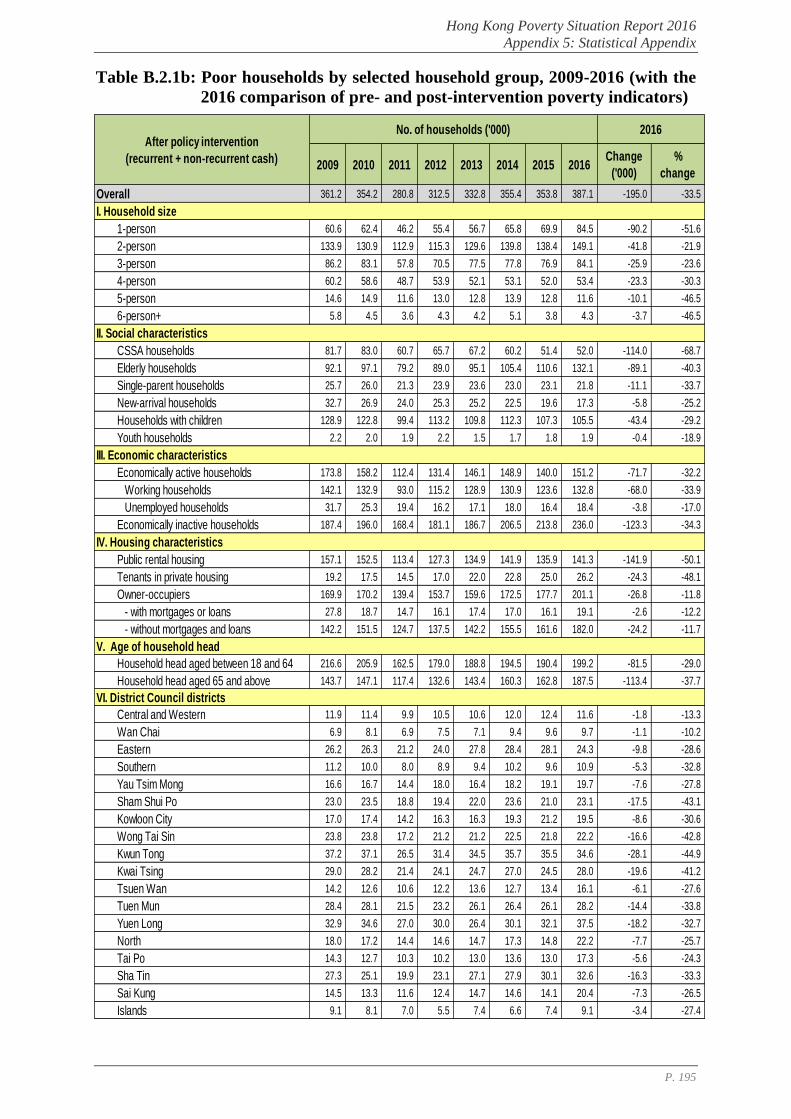
Hong Kong Poverty Situation Report 2016
Appendix 5: Statistical Appendix
P. 195
Table B.2.1b: Poor households by selected household group, 2009-2016 (with the
2016 comparison of pre- and post-intervention poverty indicators)
2009 2010 2011 2012 2013 2014 2015 2016Change
('000)
%
change
Overall 361.2 354.2 280.8 312.5 332.8 355.4 353.8 387.1 -195.0 -33.5
I. Household size
1-person 60.6 62.4 46.2 55.4 56.7 65.8 69.9 84.5 -90.2 -51.6
2-person 133.9 130.9 112.9 115.3 129.6 139.8 138.4 149.1 -41.8 -21.9
3-person 86.2 83.1 57.8 70.5 77.5 77.8 76.9 84.1 -25.9 -23.6
4-person 60.2 58.6 48.7 53.9 52.1 53.1 52.0 53.4 -23.3 -30.3
5-person 14.6 14.9 11.6 13.0 12.8 13.9 12.8 11.6 -10.1 -46.5
6-person+ 5.8 4.5 3.6 4.3 4.2 5.1 3.8 4.3 -3.7 -46.5
II. Social characteristics
CSSA households 81.7 83.0 60.7 65.7 67.2 60.2 51.4 52.0 -114.0 -68.7
Elderly households 92.1 97.1 79.2 89.0 95.1 105.4 110.6 132.1 -89.1 -40.3
Single-parent households 25.7 26.0 21.3 23.9 23.6 23.0 23.1 21.8 -11.1 -33.7
New-arrival households 32.7 26.9 24.0 25.3 25.2 22.5 19.6 17.3 -5.8 -25.2
Households with children 128.9 122.8 99.4 113.2 109.8 112.3 107.3 105.5 -43.4 -29.2
Youth households 2.2 2.0 1.9 2.2 1.5 1.7 1.8 1.9 -0.4 -18.9
III. Economic characteristics
Economically active households 173.8 158.2 112.4 131.4 146.1 148.9 140.0 151.2 -71.7 -32.2
Working households 142.1 132.9 93.0 115.2 128.9 130.9 123.6 132.8 -68.0 -33.9
Unemployed households 31.7 25.3 19.4 16.2 17.1 18.0 16.4 18.4 -3.8 -17.0
Economically inactive households 187.4 196.0 168.4 181.1 186.7 206.5 213.8 236.0 -123.3 -34.3
IV. Housing characteristics
Public rental housing 157.1 152.5 113.4 127.3 134.9 141.9 135.9 141.3 -141.9 -50.1
Tenants in private housing 19.2 17.5 14.5 17.0 22.0 22.8 25.0 26.2 -24.3 -48.1
Owner-occupiers 169.9 170.2 139.4 153.7 159.6 172.5 177.7 201.1 -26.8 -11.8
- with mortgages or loans 27.8 18.7 14.7 16.1 17.4 17.0 16.1 19.1 -2.6 -12.2
- without mortgages and loans 142.2 151.5 124.7 137.5 142.2 155.5 161.6 182.0 -24.2 -11.7
V. Age of household head
Household head aged between 18 and 64 216.6 205.9 162.5 179.0 188.8 194.5 190.4 199.2 -81.5 -29.0
Household head aged 65 and above 143.7 147.1 117.4 132.6 143.4 160.3 162.8 187.5 -113.4 -37.7
VI. District Council districts
Central and Western 11.9 11.4 9.9 10.5 10.6 12.0 12.4 11.6 -1.8 -13.3
Wan Chai 6.9 8.1 6.9 7.5 7.1 9.4 9.6 9.7 -1.1 -10.2
Eastern 26.2 26.3 21.2 24.0 27.8 28.4 28.1 24.3 -9.8 -28.6
Southern 11.2 10.0 8.0 8.9 9.4 10.2 9.6 10.9 -5.3 -32.8
Yau Tsim Mong 16.6 16.7 14.4 18.0 16.4 18.2 19.1 19.7 -7.6 -27.8
Sham Shui Po 23.0 23.5 18.8 19.4 22.0 23.6 21.0 23.1 -17.5 -43.1
Kowloon City 17.0 17.4 14.2 16.3 16.3 19.3 21.2 19.5 -8.6 -30.6
Wong Tai Sin 23.8 23.8 17.2 21.2 21.2 22.5 21.8 22.2 -16.6 -42.8
Kwun Tong 37.2 37.1 26.5 31.4 34.5 35.7 35.5 34.6 -28.1 -44.9
Kwai Tsing 29.0 28.2 21.4 24.1 24.7 27.0 24.5 28.0 -19.6 -41.2
Tsuen Wan 14.2 12.6 10.6 12.2 13.6 12.7 13.4 16.1 -6.1 -27.6
Tuen Mun 28.4 28.1 21.5 23.2 26.1 26.4 26.1 28.2 -14.4 -33.8
Yuen Long 32.9 34.6 27.0 30.0 26.4 30.1 32.1 37.5 -18.2 -32.7
North 18.0 17.2 14.4 14.6 14.7 17.3 14.8 22.2 -7.7 -25.7
Tai Po 14.3 12.7 10.3 10.2 13.0 13.6 13.0 17.3 -5.6 -24.3
Sha Tin 27.3 25.1 19.9 23.1 27.1 27.9 30.1 32.6 -16.3 -33.3
Sai Kung 14.5 13.3 11.6 12.4 14.7 14.6 14.1 20.4 -7.3 -26.5
Islands 9.1 8.1 7.0 5.5 7.4 6.6 7.4 9.1 -3.4 -27.4
2016After policy intervention
(recurrent + non-recurrent cash)
No. of households ('000)
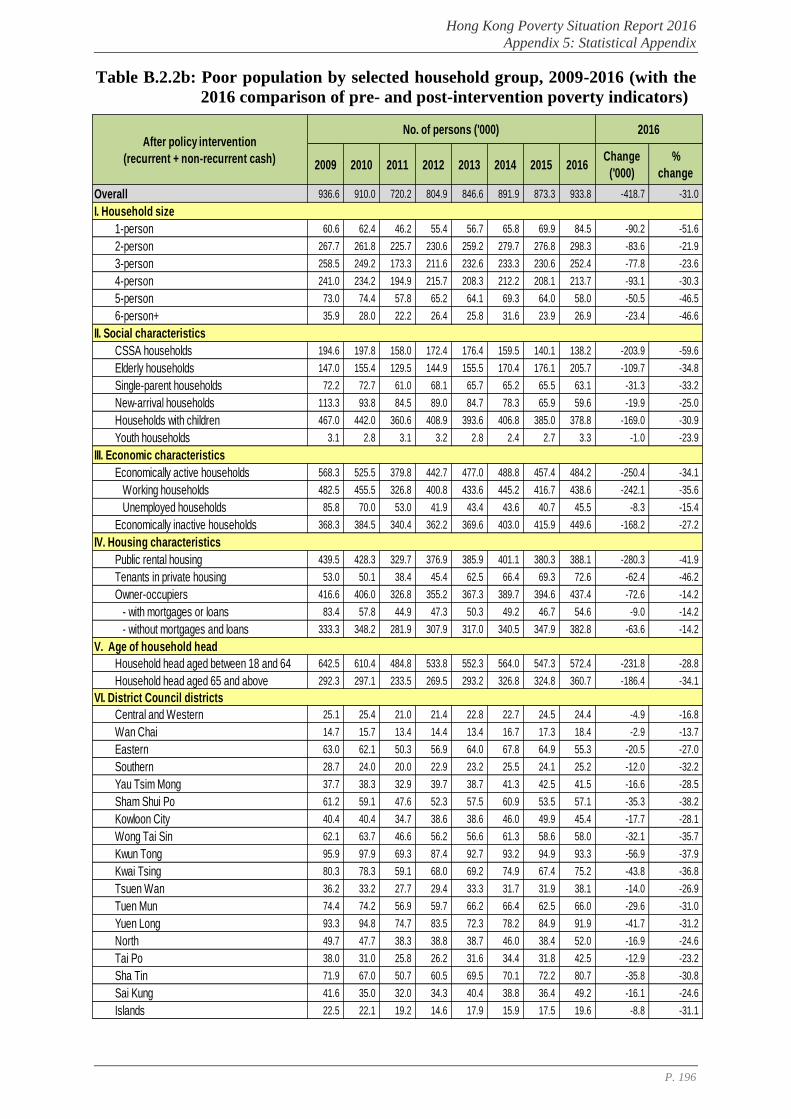
Hong Kong Poverty Situation Report 2016
Appendix 5: Statistical Appendix
P. 196
Table B.2.2b: Poor population by selected household group, 2009-2016 (with the
2016 comparison of pre- and post-intervention poverty indicators)
2009 2010 2011 2012 2013 2014 2015 2016Change
('000)
%
change
Overall 936.6 910.0 720.2 804.9 846.6 891.9 873.3 933.8 -418.7 -31.0
I. Household size
1-person 60.6 62.4 46.2 55.4 56.7 65.8 69.9 84.5 -90.2 -51.6
2-person 267.7 261.8 225.7 230.6 259.2 279.7 276.8 298.3 -83.6 -21.9
3-person 258.5 249.2 173.3 211.6 232.6 233.3 230.6 252.4 -77.8 -23.6
4-person 241.0 234.2 194.9 215.7 208.3 212.2 208.1 213.7 -93.1 -30.3
5-person 73.0 74.4 57.8 65.2 64.1 69.3 64.0 58.0 -50.5 -46.5
6-person+ 35.9 28.0 22.2 26.4 25.8 31.6 23.9 26.9 -23.4 -46.6
II. Social characteristics
CSSA households 194.6 197.8 158.0 172.4 176.4 159.5 140.1 138.2 -203.9 -59.6
Elderly households 147.0 155.4 129.5 144.9 155.5 170.4 176.1 205.7 -109.7 -34.8
Single-parent households 72.2 72.7 61.0 68.1 65.7 65.2 65.5 63.1 -31.3 -33.2
New-arrival households 113.3 93.8 84.5 89.0 84.7 78.3 65.9 59.6 -19.9 -25.0
Households with children 467.0 442.0 360.6 408.9 393.6 406.8 385.0 378.8 -169.0 -30.9
Youth households 3.1 2.8 3.1 3.2 2.8 2.4 2.7 3.3 -1.0 -23.9
III. Economic characteristics
Economically active households 568.3 525.5 379.8 442.7 477.0 488.8 457.4 484.2 -250.4 -34.1
Working households 482.5 455.5 326.8 400.8 433.6 445.2 416.7 438.6 -242.1 -35.6
Unemployed households 85.8 70.0 53.0 41.9 43.4 43.6 40.7 45.5 -8.3 -15.4
Economically inactive households 368.3 384.5 340.4 362.2 369.6 403.0 415.9 449.6 -168.2 -27.2
IV. Housing characteristics
Public rental housing 439.5 428.3 329.7 376.9 385.9 401.1 380.3 388.1 -280.3 -41.9
Tenants in private housing 53.0 50.1 38.4 45.4 62.5 66.4 69.3 72.6 -62.4 -46.2
Owner-occupiers 416.6 406.0 326.8 355.2 367.3 389.7 394.6 437.4 -72.6 -14.2
- with mortgages or loans 83.4 57.8 44.9 47.3 50.3 49.2 46.7 54.6 -9.0 -14.2
- without mortgages and loans 333.3 348.2 281.9 307.9 317.0 340.5 347.9 382.8 -63.6 -14.2
V. Age of household head
Household head aged between 18 and 64 642.5 610.4 484.8 533.8 552.3 564.0 547.3 572.4 -231.8 -28.8
Household head aged 65 and above 292.3 297.1 233.5 269.5 293.2 326.8 324.8 360.7 -186.4 -34.1
VI. District Council districts
Central and Western 25.1 25.4 21.0 21.4 22.8 22.7 24.5 24.4 -4.9 -16.8
Wan Chai 14.7 15.7 13.4 14.4 13.4 16.7 17.3 18.4 -2.9 -13.7
Eastern 63.0 62.1 50.3 56.9 64.0 67.8 64.9 55.3 -20.5 -27.0
Southern 28.7 24.0 20.0 22.9 23.2 25.5 24.1 25.2 -12.0 -32.2
Yau Tsim Mong 37.7 38.3 32.9 39.7 38.7 41.3 42.5 41.5 -16.6 -28.5
Sham Shui Po 61.2 59.1 47.6 52.3 57.5 60.9 53.5 57.1 -35.3 -38.2
Kowloon City 40.4 40.4 34.7 38.6 38.6 46.0 49.9 45.4 -17.7 -28.1
Wong Tai Sin 62.1 63.7 46.6 56.2 56.6 61.3 58.6 58.0 -32.1 -35.7
Kwun Tong 95.9 97.9 69.3 87.4 92.7 93.2 94.9 93.3 -56.9 -37.9
Kwai Tsing 80.3 78.3 59.1 68.0 69.2 74.9 67.4 75.2 -43.8 -36.8
Tsuen Wan 36.2 33.2 27.7 29.4 33.3 31.7 31.9 38.1 -14.0 -26.9
Tuen Mun 74.4 74.2 56.9 59.7 66.2 66.4 62.5 66.0 -29.6 -31.0
Yuen Long 93.3 94.8 74.7 83.5 72.3 78.2 84.9 91.9 -41.7 -31.2
North 49.7 47.7 38.3 38.8 38.7 46.0 38.4 52.0 -16.9 -24.6
Tai Po 38.0 31.0 25.8 26.2 31.6 34.4 31.8 42.5 -12.9 -23.2
Sha Tin 71.9 67.0 50.7 60.5 69.5 70.1 72.2 80.7 -35.8 -30.8
Sai Kung 41.6 35.0 32.0 34.3 40.4 38.8 36.4 49.2 -16.1 -24.6
Islands 22.5 22.1 19.2 14.6 17.9 15.9 17.5 19.6 -8.8 -31.1
2016After policy intervention
(recurrent + non-recurrent cash)
No. of persons ('000)
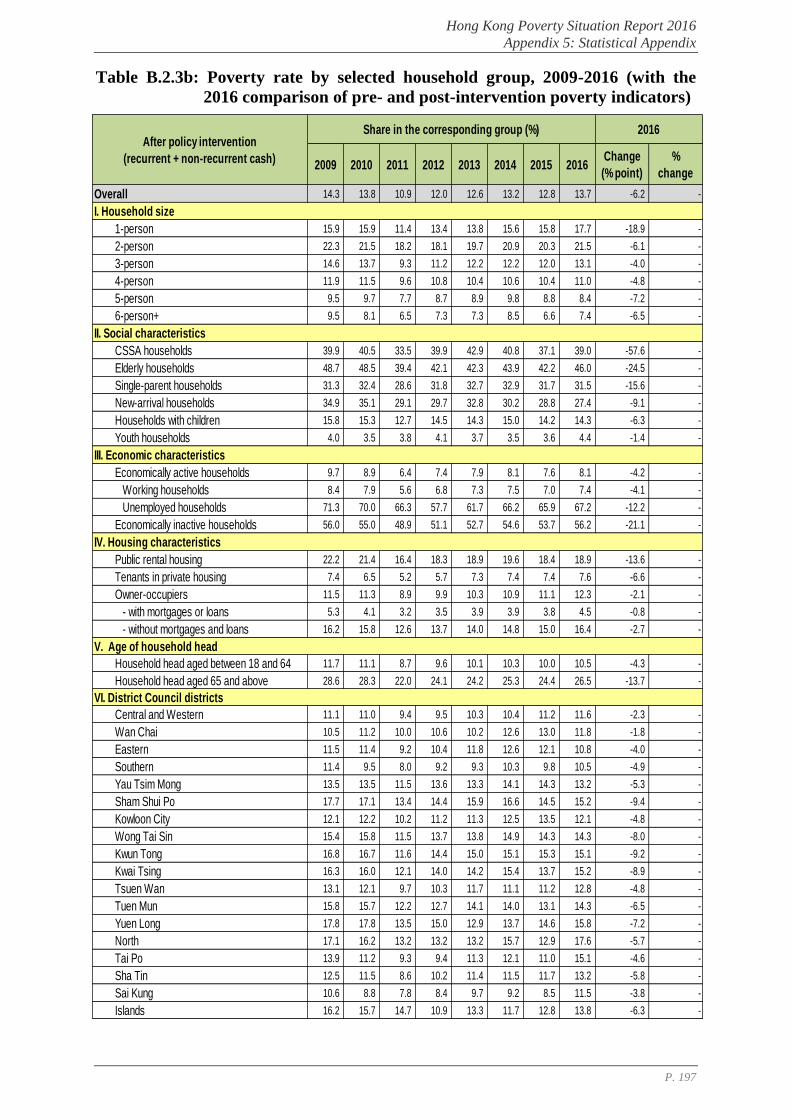
Hong Kong Poverty Situation Report 2016
Appendix 5: Statistical Appendix
P. 197
Table B.2.3b: Poverty rate by selected household group, 2009-2016 (with the
2016 comparison of pre- and post-intervention poverty indicators)
2009 2010 2011 2012 2013 2014 2015 2016Change
(% point)
%
change
Overall 14.3 13.8 10.9 12.0 12.6 13.2 12.8 13.7 -6.2 -
I. Household size
1-person 15.9 15.9 11.4 13.4 13.8 15.6 15.8 17.7 -18.9 -
2-person 22.3 21.5 18.2 18.1 19.7 20.9 20.3 21.5 -6.1 -
3-person 14.6 13.7 9.3 11.2 12.2 12.2 12.0 13.1 -4.0 -
4-person 11.9 11.5 9.6 10.8 10.4 10.6 10.4 11.0 -4.8 -
5-person 9.5 9.7 7.7 8.7 8.9 9.8 8.8 8.4 -7.2 -
6-person+ 9.5 8.1 6.5 7.3 7.3 8.5 6.6 7.4 -6.5 -
II. Social characteristics
CSSA households 39.9 40.5 33.5 39.9 42.9 40.8 37.1 39.0 -57.6 -
Elderly households 48.7 48.5 39.4 42.1 42.3 43.9 42.2 46.0 -24.5 -
Single-parent households 31.3 32.4 28.6 31.8 32.7 32.9 31.7 31.5 -15.6 -
New-arrival households 34.9 35.1 29.1 29.7 32.8 30.2 28.8 27.4 -9.1 -
Households with children 15.8 15.3 12.7 14.5 14.3 15.0 14.2 14.3 -6.3 -
Youth households 4.0 3.5 3.8 4.1 3.7 3.5 3.6 4.4 -1.4 -
III. Economic characteristics
Economically active households 9.7 8.9 6.4 7.4 7.9 8.1 7.6 8.1 -4.2 -
Working households 8.4 7.9 5.6 6.8 7.3 7.5 7.0 7.4 -4.1 -
Unemployed households 71.3 70.0 66.3 57.7 61.7 66.2 65.9 67.2 -12.2 -
Economically inactive households 56.0 55.0 48.9 51.1 52.7 54.6 53.7 56.2 -21.1 -
IV. Housing characteristics
Public rental housing 22.2 21.4 16.4 18.3 18.9 19.6 18.4 18.9 -13.6 -
Tenants in private housing 7.4 6.5 5.2 5.7 7.3 7.4 7.4 7.6 -6.6 -
Owner-occupiers 11.5 11.3 8.9 9.9 10.3 10.9 11.1 12.3 -2.1 -
- with mortgages or loans 5.3 4.1 3.2 3.5 3.9 3.9 3.8 4.5 -0.8 -
- without mortgages and loans 16.2 15.8 12.6 13.7 14.0 14.8 15.0 16.4 -2.7 -
V. Age of household head
Household head aged between 18 and 64 11.7 11.1 8.7 9.6 10.1 10.3 10.0 10.5 -4.3 -
Household head aged 65 and above 28.6 28.3 22.0 24.1 24.2 25.3 24.4 26.5 -13.7 -
VI. District Council districts
Central and Western 11.1 11.0 9.4 9.5 10.3 10.4 11.2 11.6 -2.3 -
Wan Chai 10.5 11.2 10.0 10.6 10.2 12.6 13.0 11.8 -1.8 -
Eastern 11.5 11.4 9.2 10.4 11.8 12.6 12.1 10.8 -4.0 -
Southern 11.4 9.5 8.0 9.2 9.3 10.3 9.8 10.5 -4.9 -
Yau Tsim Mong 13.5 13.5 11.5 13.6 13.3 14.1 14.3 13.2 -5.3 -
Sham Shui Po 17.7 17.1 13.4 14.4 15.9 16.6 14.5 15.2 -9.4 -
Kowloon City 12.1 12.2 10.2 11.2 11.3 12.5 13.5 12.1 -4.8 -
Wong Tai Sin 15.4 15.8 11.5 13.7 13.8 14.9 14.3 14.3 -8.0 -
Kwun Tong 16.8 16.7 11.6 14.4 15.0 15.1 15.3 15.1 -9.2 -
Kwai Tsing 16.3 16.0 12.1 14.0 14.2 15.4 13.7 15.2 -8.9 -
Tsuen Wan 13.1 12.1 9.7 10.3 11.7 11.1 11.2 12.8 -4.8 -
Tuen Mun 15.8 15.7 12.2 12.7 14.1 14.0 13.1 14.3 -6.5 -
Yuen Long 17.8 17.8 13.5 15.0 12.9 13.7 14.6 15.8 -7.2 -
North 17.1 16.2 13.2 13.2 13.2 15.7 12.9 17.6 -5.7 -
Tai Po 13.9 11.2 9.3 9.4 11.3 12.1 11.0 15.1 -4.6 -
Sha Tin 12.5 11.5 8.6 10.2 11.4 11.5 11.7 13.2 -5.8 -
Sai Kung 10.6 8.8 7.8 8.4 9.7 9.2 8.5 11.5 -3.8 -
Islands 16.2 15.7 14.7 10.9 13.3 11.7 12.8 13.8 -6.3 -
2016After policy intervention
(recurrent + non-recurrent cash)
Share in the corresponding group (%)
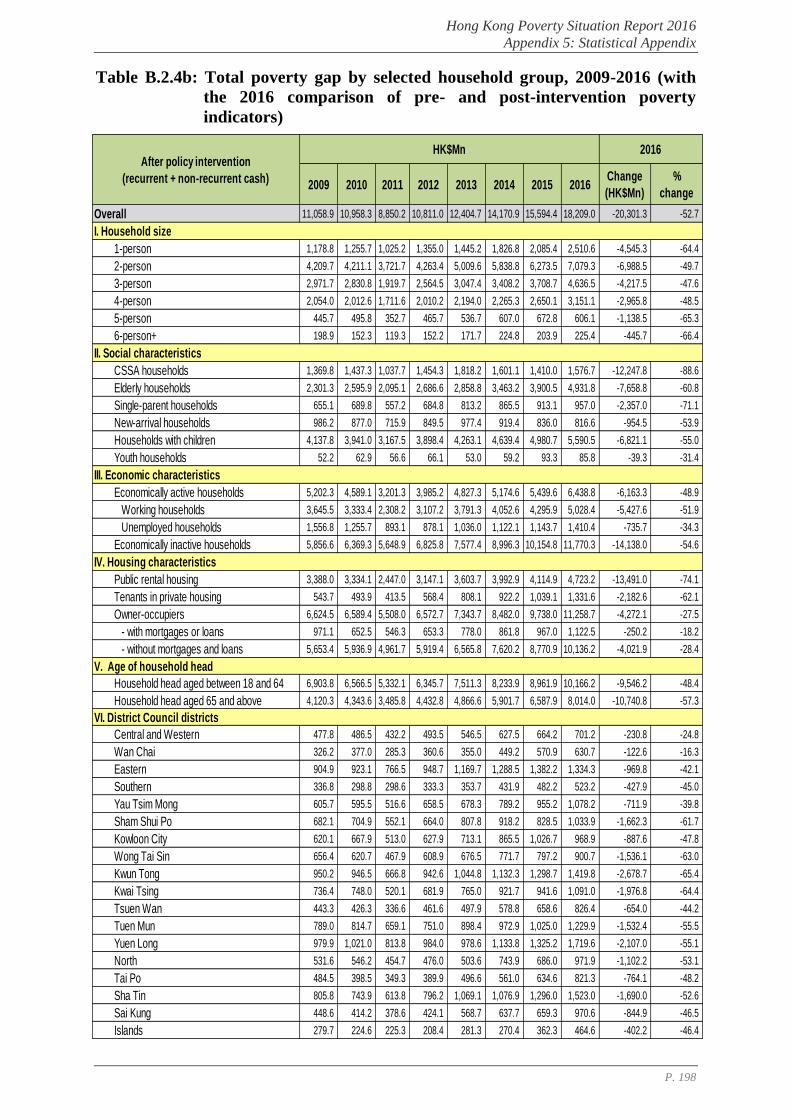
Hong Kong Poverty Situation Report 2016
Appendix 5: Statistical Appendix
P. 198
Table B.2.4b: Total poverty gap by selected household group, 2009-2016 (with
the 2016 comparison of pre- and post-intervention poverty
indicators)
2009 2010 2011 2012 2013 2014 2015 2016Change
(HK$Mn)
%
change
Overall 11,058.9 10,958.3 8,850.2 10,811.0 12,404.7 14,170.9 15,594.4 18,209.0 -20,301.3 -52.7
I. Household size
1-person 1,178.8 1,255.7 1,025.2 1,355.0 1,445.2 1,826.8 2,085.4 2,510.6 -4,545.3 -64.4
2-person 4,209.7 4,211.1 3,721.7 4,263.4 5,009.6 5,838.8 6,273.5 7,079.3 -6,988.5 -49.7
3-person 2,971.7 2,830.8 1,919.7 2,564.5 3,047.4 3,408.2 3,708.7 4,636.5 -4,217.5 -47.6
4-person 2,054.0 2,012.6 1,711.6 2,010.2 2,194.0 2,265.3 2,650.1 3,151.1 -2,965.8 -48.5
5-person 445.7 495.8 352.7 465.7 536.7 607.0 672.8 606.1 -1,138.5 -65.3
6-person+ 198.9 152.3 119.3 152.2 171.7 224.8 203.9 225.4 -445.7 -66.4
II. Social characteristics
CSSA households 1,369.8 1,437.3 1,037.7 1,454.3 1,818.2 1,601.1 1,410.0 1,576.7 -12,247.8 -88.6
Elderly households 2,301.3 2,595.9 2,095.1 2,686.6 2,858.8 3,463.2 3,900.5 4,931.8 -7,658.8 -60.8
Single-parent households 655.1 689.8 557.2 684.8 813.2 865.5 913.1 957.0 -2,357.0 -71.1
New-arrival households 986.2 877.0 715.9 849.5 977.4 919.4 836.0 816.6 -954.5 -53.9
Households with children 4,137.8 3,941.0 3,167.5 3,898.4 4,263.1 4,639.4 4,980.7 5,590.5 -6,821.1 -55.0
Youth households 52.2 62.9 56.6 66.1 53.0 59.2 93.3 85.8 -39.3 -31.4
III. Economic characteristics
Economically active households 5,202.3 4,589.1 3,201.3 3,985.2 4,827.3 5,174.6 5,439.6 6,438.8 -6,163.3 -48.9
Working households 3,645.5 3,333.4 2,308.2 3,107.2 3,791.3 4,052.6 4,295.9 5,028.4 -5,427.6 -51.9
Unemployed households 1,556.8 1,255.7 893.1 878.1 1,036.0 1,122.1 1,143.7 1,410.4 -735.7 -34.3
Economically inactive households 5,856.6 6,369.3 5,648.9 6,825.8 7,577.4 8,996.3 10,154.8 11,770.3 -14,138.0 -54.6
IV. Housing characteristics
Public rental housing 3,388.0 3,334.1 2,447.0 3,147.1 3,603.7 3,992.9 4,114.9 4,723.2 -13,491.0 -74.1
Tenants in private housing 543.7 493.9 413.5 568.4 808.1 922.2 1,039.1 1,331.6 -2,182.6 -62.1
Owner-occupiers 6,624.5 6,589.4 5,508.0 6,572.7 7,343.7 8,482.0 9,738.0 11,258.7 -4,272.1 -27.5
- with mortgages or loans 971.1 652.5 546.3 653.3 778.0 861.8 967.0 1,122.5 -250.2 -18.2
- without mortgages and loans 5,653.4 5,936.9 4,961.7 5,919.4 6,565.8 7,620.2 8,770.9 10,136.2 -4,021.9 -28.4
V. Age of household head
Household head aged between 18 and 64 6,903.8 6,566.5 5,332.1 6,345.7 7,511.3 8,233.9 8,961.9 10,166.2 -9,546.2 -48.4
Household head aged 65 and above 4,120.3 4,343.6 3,485.8 4,432.8 4,866.6 5,901.7 6,587.9 8,014.0 -10,740.8 -57.3
VI. District Council districts
Central and Western 477.8 486.5 432.2 493.5 546.5 627.5 664.2 701.2 -230.8 -24.8
Wan Chai 326.2 377.0 285.3 360.6 355.0 449.2 570.9 630.7 -122.6 -16.3
Eastern 904.9 923.1 766.5 948.7 1,169.7 1,288.5 1,382.2 1,334.3 -969.8 -42.1
Southern 336.8 298.8 298.6 333.3 353.7 431.9 482.2 523.2 -427.9 -45.0
Yau Tsim Mong 605.7 595.5 516.6 658.5 678.3 789.2 955.2 1,078.2 -711.9 -39.8
Sham Shui Po 682.1 704.9 552.1 664.0 807.8 918.2 828.5 1,033.9 -1,662.3 -61.7
Kowloon City 620.1 667.9 513.0 627.9 713.1 865.5 1,026.7 968.9 -887.6 -47.8
Wong Tai Sin 656.4 620.7 467.9 608.9 676.5 771.7 797.2 900.7 -1,536.1 -63.0
Kwun Tong 950.2 946.5 666.8 942.6 1,044.8 1,132.3 1,298.7 1,419.8 -2,678.7 -65.4
Kwai Tsing 736.4 748.0 520.1 681.9 765.0 921.7 941.6 1,091.0 -1,976.8 -64.4
Tsuen Wan 443.3 426.3 336.6 461.6 497.9 578.8 658.6 826.4 -654.0 -44.2
Tuen Mun 789.0 814.7 659.1 751.0 898.4 972.9 1,025.0 1,229.9 -1,532.4 -55.5
Yuen Long 979.9 1,021.0 813.8 984.0 978.6 1,133.8 1,325.2 1,719.6 -2,107.0 -55.1
North 531.6 546.2 454.7 476.0 503.6 743.9 686.0 971.9 -1,102.2 -53.1
Tai Po 484.5 398.5 349.3 389.9 496.6 561.0 634.6 821.3 -764.1 -48.2
Sha Tin 805.8 743.9 613.8 796.2 1,069.1 1,076.9 1,296.0 1,523.0 -1,690.0 -52.6
Sai Kung 448.6 414.2 378.6 424.1 568.7 637.7 659.3 970.6 -844.9 -46.5
Islands 279.7 224.6 225.3 208.4 281.3 270.4 362.3 464.6 -402.2 -46.4
2016After policy intervention
(recurrent + non-recurrent cash)
HK$Mn
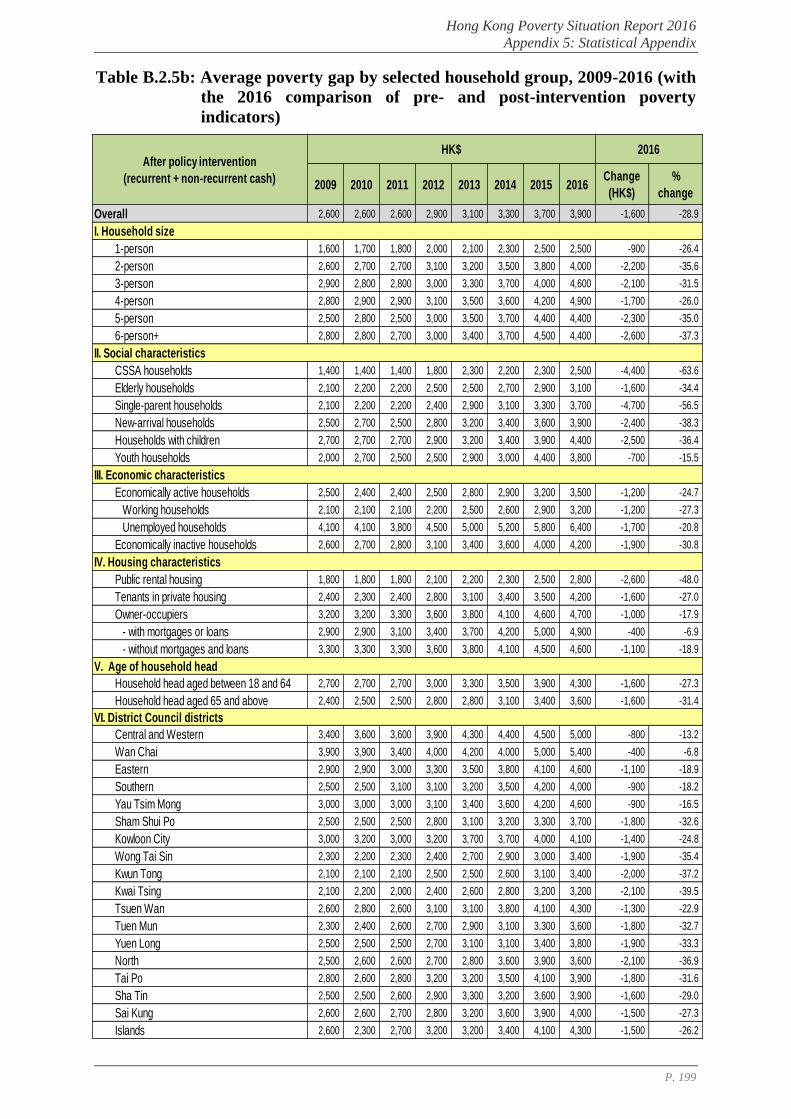
Hong Kong Poverty Situation Report 2016
Appendix 5: Statistical Appendix
P. 199
Table B.2.5b: Average poverty gap by selected household group, 2009-2016 (with
the 2016 comparison of pre- and post-intervention poverty
indicators)
2009 2010 2011 2012 2013 2014 2015 2016Change
(HK$)
%
change
Overall 2,600 2,600 2,600 2,900 3,100 3,300 3,700 3,900 -1,600 -28.9
I. Household size
1-person 1,600 1,700 1,800 2,000 2,100 2,300 2,500 2,500 -900 -26.4
2-person 2,600 2,700 2,700 3,100 3,200 3,500 3,800 4,000 -2,200 -35.6
3-person 2,900 2,800 2,800 3,000 3,300 3,700 4,000 4,600 -2,100 -31.5
4-person 2,800 2,900 2,900 3,100 3,500 3,600 4,200 4,900 -1,700 -26.0
5-person 2,500 2,800 2,500 3,000 3,500 3,700 4,400 4,400 -2,300 -35.0
6-person+ 2,800 2,800 2,700 3,000 3,400 3,700 4,500 4,400 -2,600 -37.3
II. Social characteristics
CSSA households 1,400 1,400 1,400 1,800 2,300 2,200 2,300 2,500 -4,400 -63.6
Elderly households 2,100 2,200 2,200 2,500 2,500 2,700 2,900 3,100 -1,600 -34.4
Single-parent households 2,100 2,200 2,200 2,400 2,900 3,100 3,300 3,700 -4,700 -56.5
New-arrival households 2,500 2,700 2,500 2,800 3,200 3,400 3,600 3,900 -2,400 -38.3
Households with children 2,700 2,700 2,700 2,900 3,200 3,400 3,900 4,400 -2,500 -36.4
Youth households 2,000 2,700 2,500 2,500 2,900 3,000 4,400 3,800 -700 -15.5
III. Economic characteristics
Economically active households 2,500 2,400 2,400 2,500 2,800 2,900 3,200 3,500 -1,200 -24.7
Working households 2,100 2,100 2,100 2,200 2,500 2,600 2,900 3,200 -1,200 -27.3
Unemployed households 4,100 4,100 3,800 4,500 5,000 5,200 5,800 6,400 -1,700 -20.8
Economically inactive households 2,600 2,700 2,800 3,100 3,400 3,600 4,000 4,200 -1,900 -30.8
IV. Housing characteristics
Public rental housing 1,800 1,800 1,800 2,100 2,200 2,300 2,500 2,800 -2,600 -48.0
Tenants in private housing 2,400 2,300 2,400 2,800 3,100 3,400 3,500 4,200 -1,600 -27.0
Owner-occupiers 3,200 3,200 3,300 3,600 3,800 4,100 4,600 4,700 -1,000 -17.9
- with mortgages or loans 2,900 2,900 3,100 3,400 3,700 4,200 5,000 4,900 -400 -6.9
- without mortgages and loans 3,300 3,300 3,300 3,600 3,800 4,100 4,500 4,600 -1,100 -18.9
V. Age of household head
Household head aged between 18 and 64 2,700 2,700 2,700 3,000 3,300 3,500 3,900 4,300 -1,600 -27.3
Household head aged 65 and above 2,400 2,500 2,500 2,800 2,800 3,100 3,400 3,600 -1,600 -31.4
VI. District Council districts
Central and Western 3,400 3,600 3,600 3,900 4,300 4,400 4,500 5,000 -800 -13.2
Wan Chai 3,900 3,900 3,400 4,000 4,200 4,000 5,000 5,400 -400 -6.8
Eastern 2,900 2,900 3,000 3,300 3,500 3,800 4,100 4,600 -1,100 -18.9
Southern 2,500 2,500 3,100 3,100 3,200 3,500 4,200 4,000 -900 -18.2
Yau Tsim Mong 3,000 3,000 3,000 3,100 3,400 3,600 4,200 4,600 -900 -16.5
Sham Shui Po 2,500 2,500 2,500 2,800 3,100 3,200 3,300 3,700 -1,800 -32.6
Kowloon City 3,000 3,200 3,000 3,200 3,700 3,700 4,000 4,100 -1,400 -24.8
Wong Tai Sin 2,300 2,200 2,300 2,400 2,700 2,900 3,000 3,400 -1,900 -35.4
Kwun Tong 2,100 2,100 2,100 2,500 2,500 2,600 3,100 3,400 -2,000 -37.2
Kwai Tsing 2,100 2,200 2,000 2,400 2,600 2,800 3,200 3,200 -2,100 -39.5
Tsuen Wan 2,600 2,800 2,600 3,100 3,100 3,800 4,100 4,300 -1,300 -22.9
Tuen Mun 2,300 2,400 2,600 2,700 2,900 3,100 3,300 3,600 -1,800 -32.7
Yuen Long 2,500 2,500 2,500 2,700 3,100 3,100 3,400 3,800 -1,900 -33.3
North 2,500 2,600 2,600 2,700 2,800 3,600 3,900 3,600 -2,100 -36.9
Tai Po 2,800 2,600 2,800 3,200 3,200 3,500 4,100 3,900 -1,800 -31.6
Sha Tin 2,500 2,500 2,600 2,900 3,300 3,200 3,600 3,900 -1,600 -29.0
Sai Kung 2,600 2,600 2,700 2,800 3,200 3,600 3,900 4,000 -1,500 -27.3
Islands 2,600 2,300 2,700 3,200 3,200 3,400 4,100 4,300 -1,500 -26.2
2016After policy intervention
(recurrent + non-recurrent cash)
HK$
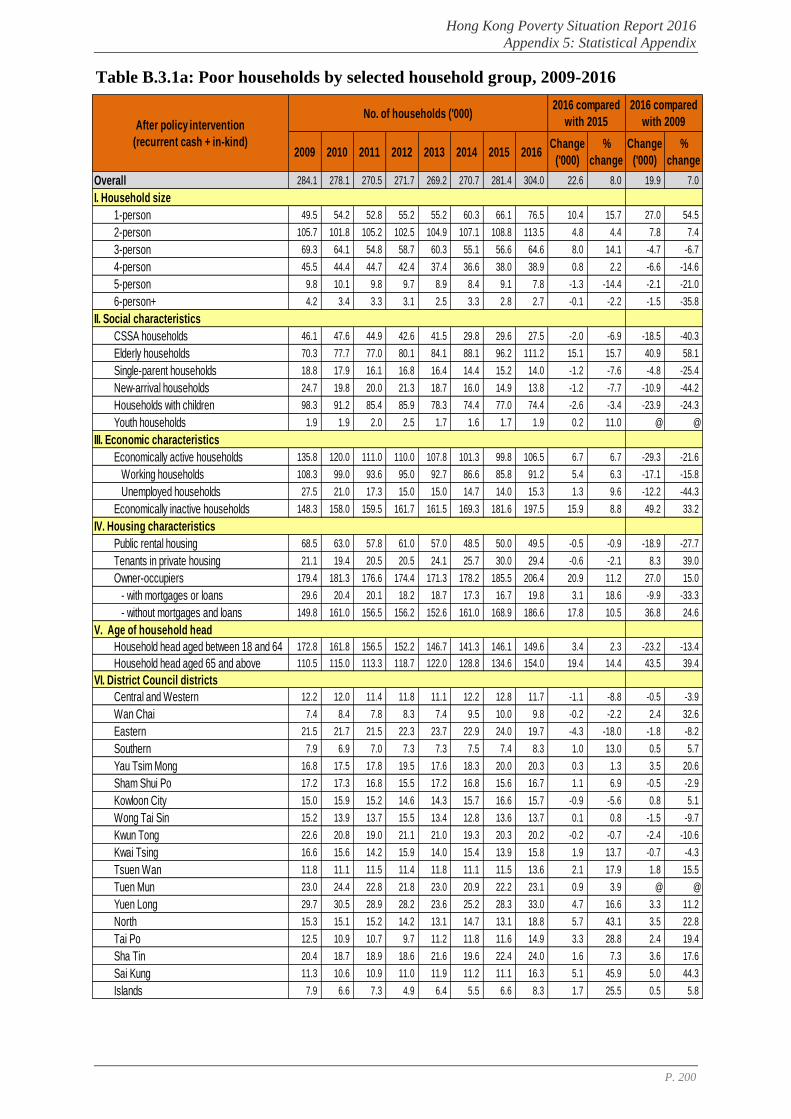
Hong Kong Poverty Situation Report 2016
Appendix 5: Statistical Appendix
P. 200
Table B.3.1a: Poor households by selected household group, 2009-2016
2009 2010 2011 2012 2013 2014 2015 2016Change
('000)
%
change
Change
('000)
%
change
Overall 284.1 278.1 270.5 271.7 269.2 270.7 281.4 304.0 22.6 8.0 19.9 7.0
I. Household size
1-person 49.5 54.2 52.8 55.2 55.2 60.3 66.1 76.5 10.4 15.7 27.0 54.5
2-person 105.7 101.8 105.2 102.5 104.9 107.1 108.8 113.5 4.8 4.4 7.8 7.4
3-person 69.3 64.1 54.8 58.7 60.3 55.1 56.6 64.6 8.0 14.1 -4.7 -6.7
4-person 45.5 44.4 44.7 42.4 37.4 36.6 38.0 38.9 0.8 2.2 -6.6 -14.6
5-person 9.8 10.1 9.8 9.7 8.9 8.4 9.1 7.8 -1.3 -14.4 -2.1 -21.0
6-person+ 4.2 3.4 3.3 3.1 2.5 3.3 2.8 2.7 -0.1 -2.2 -1.5 -35.8
II. Social characteristics
CSSA households 46.1 47.6 44.9 42.6 41.5 29.8 29.6 27.5 -2.0 -6.9 -18.5 -40.3
Elderly households 70.3 77.7 77.0 80.1 84.1 88.1 96.2 111.2 15.1 15.7 40.9 58.1
Single-parent households 18.8 17.9 16.1 16.8 16.4 14.4 15.2 14.0 -1.2 -7.6 -4.8 -25.4
New-arrival households 24.7 19.8 20.0 21.3 18.7 16.0 14.9 13.8 -1.2 -7.7 -10.9 -44.2
Households with children 98.3 91.2 85.4 85.9 78.3 74.4 77.0 74.4 -2.6 -3.4 -23.9 -24.3
Youth households 1.9 1.9 2.0 2.5 1.7 1.6 1.7 1.9 0.2 11.0 @ @
III. Economic characteristics
Economically active households 135.8 120.0 111.0 110.0 107.8 101.3 99.8 106.5 6.7 6.7 -29.3 -21.6
Working households 108.3 99.0 93.6 95.0 92.7 86.6 85.8 91.2 5.4 6.3 -17.1 -15.8
Unemployed households 27.5 21.0 17.3 15.0 15.0 14.7 14.0 15.3 1.3 9.6 -12.2 -44.3
Economically inactive households 148.3 158.0 159.5 161.7 161.5 169.3 181.6 197.5 15.9 8.8 49.2 33.2
IV. Housing characteristics
Public rental housing 68.5 63.0 57.8 61.0 57.0 48.5 50.0 49.5 -0.5 -0.9 -18.9 -27.7
Tenants in private housing 21.1 19.4 20.5 20.5 24.1 25.7 30.0 29.4 -0.6 -2.1 8.3 39.0
Owner-occupiers 179.4 181.3 176.6 174.4 171.3 178.2 185.5 206.4 20.9 11.2 27.0 15.0
- with mortgages or loans 29.6 20.4 20.1 18.2 18.7 17.3 16.7 19.8 3.1 18.6 -9.9 -33.3
- without mortgages and loans 149.8 161.0 156.5 156.2 152.6 161.0 168.9 186.6 17.8 10.5 36.8 24.6
V. Age of household head
Household head aged between 18 and 64 172.8 161.8 156.5 152.2 146.7 141.3 146.1 149.6 3.4 2.3 -23.2 -13.4
Household head aged 65 and above 110.5 115.0 113.3 118.7 122.0 128.8 134.6 154.0 19.4 14.4 43.5 39.4
VI. District Council districts
Central and Western 12.2 12.0 11.4 11.8 11.1 12.2 12.8 11.7 -1.1 -8.8 -0.5 -3.9
Wan Chai 7.4 8.4 7.8 8.3 7.4 9.5 10.0 9.8 -0.2 -2.2 2.4 32.6
Eastern 21.5 21.7 21.5 22.3 23.7 22.9 24.0 19.7 -4.3 -18.0 -1.8 -8.2
Southern 7.9 6.9 7.0 7.3 7.3 7.5 7.4 8.3 1.0 13.0 0.5 5.7
Yau Tsim Mong 16.8 17.5 17.8 19.5 17.6 18.3 20.0 20.3 0.3 1.3 3.5 20.6
Sham Shui Po 17.2 17.3 16.8 15.5 17.2 16.8 15.6 16.7 1.1 6.9 -0.5 -2.9
Kowloon City 15.0 15.9 15.2 14.6 14.3 15.7 16.6 15.7 -0.9 -5.6 0.8 5.1
Wong Tai Sin 15.2 13.9 13.7 15.5 13.4 12.8 13.6 13.7 0.1 0.8 -1.5 -9.7
Kwun Tong 22.6 20.8 19.0 21.1 21.0 19.3 20.3 20.2 -0.2 -0.7 -2.4 -10.6
Kwai Tsing 16.6 15.6 14.2 15.9 14.0 15.4 13.9 15.8 1.9 13.7 -0.7 -4.3
Tsuen Wan 11.8 11.1 11.5 11.4 11.8 11.1 11.5 13.6 2.1 17.9 1.8 15.5
Tuen Mun 23.0 24.4 22.8 21.8 23.0 20.9 22.2 23.1 0.9 3.9 @ @
Yuen Long 29.7 30.5 28.9 28.2 23.6 25.2 28.3 33.0 4.7 16.6 3.3 11.2
North 15.3 15.1 15.2 14.2 13.1 14.7 13.1 18.8 5.7 43.1 3.5 22.8
Tai Po 12.5 10.9 10.7 9.7 11.2 11.8 11.6 14.9 3.3 28.8 2.4 19.4
Sha Tin 20.4 18.7 18.9 18.6 21.6 19.6 22.4 24.0 1.6 7.3 3.6 17.6
Sai Kung 11.3 10.6 10.9 11.0 11.9 11.2 11.1 16.3 5.1 45.9 5.0 44.3
Islands 7.9 6.6 7.3 4.9 6.4 5.5 6.6 8.3 1.7 25.5 0.5 5.8
After policy intervention
(recurrent cash + in-kind)
2016 compared
with 2015
2016 compared
with 2009No. of households ('000)

Hong Kong Poverty Situation Report 2016
Appendix 5: Statistical Appendix
P. 201
Table B.3.2a: Poor population by selected household group, 2009-2016
2009 2010 2011 2012 2013 2014 2015 2016Change
('000)
%
change
Change
('000)
%
change
Overall 726.0 699.5 675.1 674.2 655.8 648.3 668.6 708.6 39.9 6.0 -17.4 -2.4
I. Household size
1-person 49.5 54.2 52.8 55.2 55.2 60.3 66.1 76.5 10.4 15.7 27.0 54.5
2-person 211.4 203.6 210.4 205.0 209.7 214.1 217.6 227.1 9.5 4.4 15.6 7.4
3-person 208.0 192.4 164.3 176.2 181.0 165.3 169.9 193.9 24.0 14.1 -14.0 -6.8
4-person 182.1 177.7 178.7 169.7 149.6 146.3 152.2 155.5 3.4 2.2 -26.6 -14.6
5-person 49.2 50.6 49.0 48.7 44.4 41.8 45.4 38.9 -6.5 -14.4 -10.3 -21.0
6-person+ 25.8 20.9 19.9 19.4 15.8 20.5 17.5 16.7 -0.8 -4.7 -9.1 -35.4
II. Social characteristics
CSSA households 110.9 114.8 107.4 110.5 109.9 83.7 82.8 76.7 -6.1 -7.4 -34.2 -30.9
Elderly households 112.1 122.9 122.7 128.2 134.2 139.8 149.9 170.0 20.0 13.4 57.9 51.6
Single-parent households 52.5 50.4 45.6 48.0 46.7 41.9 44.2 42.4 -1.9 -4.2 -10.2 -19.4
New-arrival households 85.1 68.5 68.9 74.0 62.8 55.0 49.4 46.7 -2.7 -5.5 -38.4 -45.1
Households with children 351.8 326.1 309.9 308.3 278.7 269.0 278.2 266.2 -11.9 -4.3 -85.6 -24.3
Youth households 2.7 2.8 3.2 3.6 3.0 2.4 2.7 3.6 0.9 34.2 0.9 34.1
III. Economic characteristics
Economically active households 435.4 392.8 366.9 359.8 342.7 324.6 322.1 336.6 14.5 4.5 -98.8 -22.7
Working households 362.4 335.4 321.0 321.4 305.0 288.6 287.4 297.7 10.3 3.6 -64.7 -17.9
Unemployed households 73.0 57.4 45.9 38.4 37.7 36.0 34.8 38.9 4.2 12.0 -34.1 -46.7
Economically inactive households 290.6 306.7 308.2 314.4 313.1 323.7 346.5 371.9 25.5 7.4 81.4 28.0
IV. Housing characteristics
Public rental housing 200.1 185.2 170.3 185.1 164.4 139.5 145.1 144.4 -0.8 -0.5 -55.8 -27.9
Tenants in private housing 57.8 54.5 53.0 53.6 67.3 73.3 82.4 80.6 -1.9 -2.2 22.8 39.4
Owner-occupiers 440.4 433.3 422.6 405.4 392.4 401.1 411.2 448.1 36.9 9.0 7.7 1.7
- with mortgages or loans 88.9 62.8 62.0 53.7 53.9 49.2 48.5 56.2 7.7 15.9 -32.7 -36.8
- without mortgages and loans 351.5 370.5 360.6 351.7 338.5 351.8 362.7 391.9 29.2 8.0 40.4 11.5
V. Age of household head
Household head aged between 18 and 64 500.9 469.7 451.5 435.7 413.1 392.2 408.3 417.7 9.5 2.3 -83.2 -16.6
Household head aged 65 and above 223.4 227.4 222.1 237.1 241.8 255.0 259.0 290.1 31.1 12.0 66.7 29.9
VI. District Council districts
Central and Western 25.9 26.5 24.2 24.4 23.4 23.0 24.9 24.4 -0.5 -1.9 -1.4 -5.5
Wan Chai 15.4 16.3 15.5 16.2 13.8 16.9 18.0 18.6 0.6 3.1 3.2 20.7
Eastern 49.2 49.5 50.1 51.6 51.2 52.1 53.1 42.4 -10.7 -20.1 -6.7 -13.7
Southern 19.7 16.5 16.4 18.2 17.4 17.7 18.5 18.6 0.1 0.5 -1.1 -5.4
Yau Tsim Mong 38.4 39.2 40.1 42.2 41.2 41.1 43.9 42.1 -1.8 -4.1 3.7 9.6
Sham Shui Po 45.2 41.6 40.4 41.0 43.0 41.9 37.2 40.1 3.0 8.0 -5.1 -11.3
Kowloon City 35.6 36.5 36.5 33.3 33.0 35.8 37.9 35.8 -2.1 -5.5 0.2 0.6
Wong Tai Sin 39.6 37.0 36.5 39.2 33.7 32.9 35.9 35.1 -0.8 -2.3 -4.5 -11.4
Kwun Tong 57.3 54.1 47.2 55.7 53.4 47.2 53.2 52.4 -0.8 -1.4 -4.9 -8.6
Kwai Tsing 45.2 43.3 37.2 43.3 37.7 41.5 37.1 41.5 4.5 12.1 -3.7 -8.2
Tsuen Wan 29.4 29.0 29.3 27.2 28.3 27.6 27.0 32.0 5.0 18.6 2.6 9.0
Tuen Mun 62.4 65.2 61.4 55.7 57.4 51.6 53.3 54.1 0.8 1.5 -8.3 -13.3
Yuen Long 84.0 82.8 78.9 76.5 63.7 63.3 73.0 79.1 6.1 8.4 -4.9 -5.9
North 42.0 41.5 39.3 37.1 33.8 38.5 33.6 43.3 9.7 28.8 1.3 3.2
Tai Po 33.0 27.4 26.5 24.7 26.7 29.7 27.7 35.8 8.2 29.5 2.9 8.7
Sha Tin 53.1 49.3 47.7 47.3 53.3 47.2 52.3 57.8 5.5 10.5 4.7 8.8
Sai Kung 32.1 26.9 28.9 28.7 30.0 28.3 27.9 37.9 10.0 35.7 5.8 18.1
Islands 18.5 16.8 19.1 11.8 14.6 12.2 14.1 17.3 3.2 22.6 -1.1 -6.2
After policy intervention
(recurrent cash + in-kind)
2016 compared
with 2015
2016 compared
with 2009No. of persons ('000)
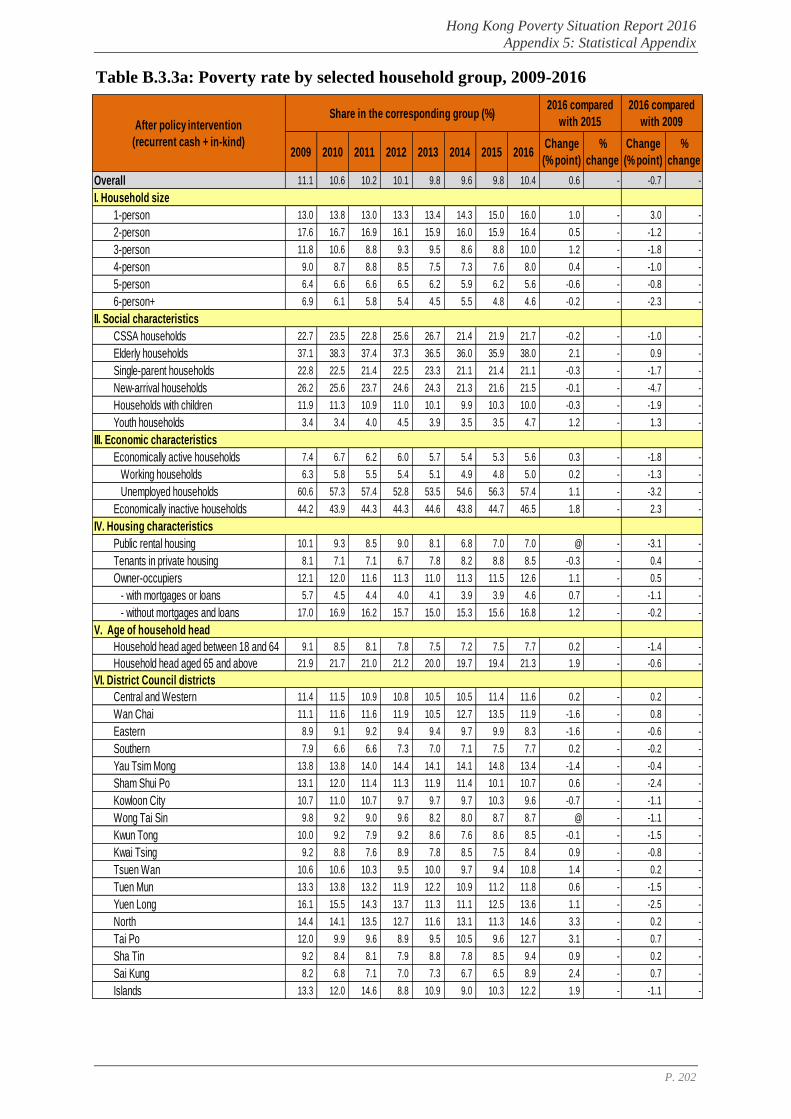
Hong Kong Poverty Situation Report 2016
Appendix 5: Statistical Appendix
P. 202
Table B.3.3a: Poverty rate by selected household group, 2009-2016
2009 2010 2011 2012 2013 2014 2015 2016Change
(% point)
%
change
Change
(% point)
%
change
Overall 11.1 10.6 10.2 10.1 9.8 9.6 9.8 10.4 0.6 - -0.7 -
I. Household size
1-person 13.0 13.8 13.0 13.3 13.4 14.3 15.0 16.0 1.0 - 3.0 -
2-person 17.6 16.7 16.9 16.1 15.9 16.0 15.9 16.4 0.5 - -1.2 -
3-person 11.8 10.6 8.8 9.3 9.5 8.6 8.8 10.0 1.2 - -1.8 -
4-person 9.0 8.7 8.8 8.5 7.5 7.3 7.6 8.0 0.4 - -1.0 -
5-person 6.4 6.6 6.6 6.5 6.2 5.9 6.2 5.6 -0.6 - -0.8 -
6-person+ 6.9 6.1 5.8 5.4 4.5 5.5 4.8 4.6 -0.2 - -2.3 -
II. Social characteristics
CSSA households 22.7 23.5 22.8 25.6 26.7 21.4 21.9 21.7 -0.2 - -1.0 -
Elderly households 37.1 38.3 37.4 37.3 36.5 36.0 35.9 38.0 2.1 - 0.9 -
Single-parent households 22.8 22.5 21.4 22.5 23.3 21.1 21.4 21.1 -0.3 - -1.7 -
New-arrival households 26.2 25.6 23.7 24.6 24.3 21.3 21.6 21.5 -0.1 - -4.7 -
Households with children 11.9 11.3 10.9 11.0 10.1 9.9 10.3 10.0 -0.3 - -1.9 -
Youth households 3.4 3.4 4.0 4.5 3.9 3.5 3.5 4.7 1.2 - 1.3 -
III. Economic characteristics
Economically active households 7.4 6.7 6.2 6.0 5.7 5.4 5.3 5.6 0.3 - -1.8 -
Working households 6.3 5.8 5.5 5.4 5.1 4.9 4.8 5.0 0.2 - -1.3 -
Unemployed households 60.6 57.3 57.4 52.8 53.5 54.6 56.3 57.4 1.1 - -3.2 -
Economically inactive households 44.2 43.9 44.3 44.3 44.6 43.8 44.7 46.5 1.8 - 2.3 -
IV. Housing characteristics
Public rental housing 10.1 9.3 8.5 9.0 8.1 6.8 7.0 7.0 @ - -3.1 -
Tenants in private housing 8.1 7.1 7.1 6.7 7.8 8.2 8.8 8.5 -0.3 - 0.4 -
Owner-occupiers 12.1 12.0 11.6 11.3 11.0 11.3 11.5 12.6 1.1 - 0.5 -
- with mortgages or loans 5.7 4.5 4.4 4.0 4.1 3.9 3.9 4.6 0.7 - -1.1 -
- without mortgages and loans 17.0 16.9 16.2 15.7 15.0 15.3 15.6 16.8 1.2 - -0.2 -
V. Age of household head
Household head aged between 18 and 64 9.1 8.5 8.1 7.8 7.5 7.2 7.5 7.7 0.2 - -1.4 -
Household head aged 65 and above 21.9 21.7 21.0 21.2 20.0 19.7 19.4 21.3 1.9 - -0.6 -
VI. District Council districts
Central and Western 11.4 11.5 10.9 10.8 10.5 10.5 11.4 11.6 0.2 - 0.2 -
Wan Chai 11.1 11.6 11.6 11.9 10.5 12.7 13.5 11.9 -1.6 - 0.8 -
Eastern 8.9 9.1 9.2 9.4 9.4 9.7 9.9 8.3 -1.6 - -0.6 -
Southern 7.9 6.6 6.6 7.3 7.0 7.1 7.5 7.7 0.2 - -0.2 -
Yau Tsim Mong 13.8 13.8 14.0 14.4 14.1 14.1 14.8 13.4 -1.4 - -0.4 -
Sham Shui Po 13.1 12.0 11.4 11.3 11.9 11.4 10.1 10.7 0.6 - -2.4 -
Kowloon City 10.7 11.0 10.7 9.7 9.7 9.7 10.3 9.6 -0.7 - -1.1 -
Wong Tai Sin 9.8 9.2 9.0 9.6 8.2 8.0 8.7 8.7 @ - -1.1 -
Kwun Tong 10.0 9.2 7.9 9.2 8.6 7.6 8.6 8.5 -0.1 - -1.5 -
Kwai Tsing 9.2 8.8 7.6 8.9 7.8 8.5 7.5 8.4 0.9 - -0.8 -
Tsuen Wan 10.6 10.6 10.3 9.5 10.0 9.7 9.4 10.8 1.4 - 0.2 -
Tuen Mun 13.3 13.8 13.2 11.9 12.2 10.9 11.2 11.8 0.6 - -1.5 -
Yuen Long 16.1 15.5 14.3 13.7 11.3 11.1 12.5 13.6 1.1 - -2.5 -
North 14.4 14.1 13.5 12.7 11.6 13.1 11.3 14.6 3.3 - 0.2 -
Tai Po 12.0 9.9 9.6 8.9 9.5 10.5 9.6 12.7 3.1 - 0.7 -
Sha Tin 9.2 8.4 8.1 7.9 8.8 7.8 8.5 9.4 0.9 - 0.2 -
Sai Kung 8.2 6.8 7.1 7.0 7.3 6.7 6.5 8.9 2.4 - 0.7 -
Islands 13.3 12.0 14.6 8.8 10.9 9.0 10.3 12.2 1.9 - -1.1 -
After policy intervention
(recurrent cash + in-kind)
2016 compared
with 2015
2016 compared
with 2009Share in the corresponding group (%)
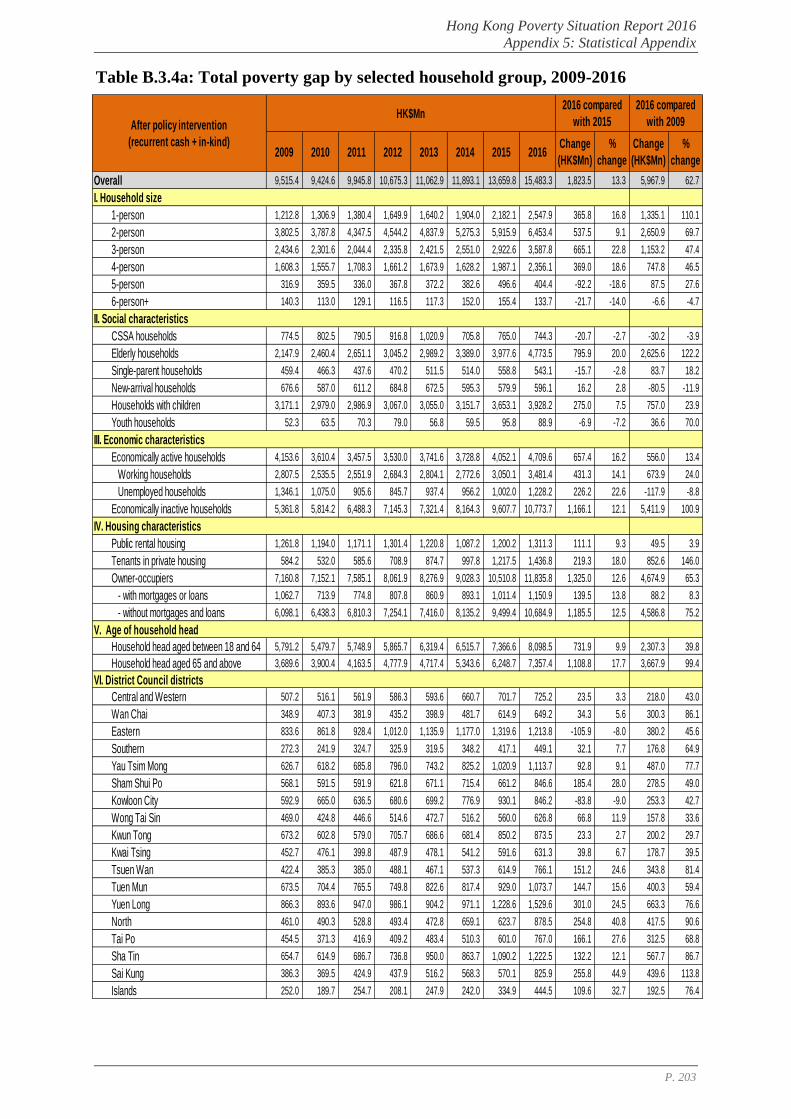
Hong Kong Poverty Situation Report 2016
Appendix 5: Statistical Appendix
P. 203
Table B.3.4a: Total poverty gap by selected household group, 2009-2016
2009 2010 2011 2012 2013 2014 2015 2016Change
(HK$Mn)
%
change
Change
(HK$Mn)
%
change
Overall 9,515.4 9,424.6 9,945.8 10,675.3 11,062.9 11,893.1 13,659.8 15,483.3 1,823.5 13.3 5,967.9 62.7
I. Household size
1-person 1,212.8 1,306.9 1,380.4 1,649.9 1,640.2 1,904.0 2,182.1 2,547.9 365.8 16.8 1,335.1 110.1
2-person 3,802.5 3,787.8 4,347.5 4,544.2 4,837.9 5,275.3 5,915.9 6,453.4 537.5 9.1 2,650.9 69.7
3-person 2,434.6 2,301.6 2,044.4 2,335.8 2,421.5 2,551.0 2,922.6 3,587.8 665.1 22.8 1,153.2 47.4
4-person 1,608.3 1,555.7 1,708.3 1,661.2 1,673.9 1,628.2 1,987.1 2,356.1 369.0 18.6 747.8 46.5
5-person 316.9 359.5 336.0 367.8 372.2 382.6 496.6 404.4 -92.2 -18.6 87.5 27.6
6-person+ 140.3 113.0 129.1 116.5 117.3 152.0 155.4 133.7 -21.7 -14.0 -6.6 -4.7
II. Social characteristics
CSSA households 774.5 802.5 790.5 916.8 1,020.9 705.8 765.0 744.3 -20.7 -2.7 -30.2 -3.9
Elderly households 2,147.9 2,460.4 2,651.1 3,045.2 2,989.2 3,389.0 3,977.6 4,773.5 795.9 20.0 2,625.6 122.2
Single-parent households 459.4 466.3 437.6 470.2 511.5 514.0 558.8 543.1 -15.7 -2.8 83.7 18.2
New-arrival households 676.6 587.0 611.2 684.8 672.5 595.3 579.9 596.1 16.2 2.8 -80.5 -11.9
Households with children 3,171.1 2,979.0 2,986.9 3,067.0 3,055.0 3,151.7 3,653.1 3,928.2 275.0 7.5 757.0 23.9
Youth households 52.3 63.5 70.3 79.0 56.8 59.5 95.8 88.9 -6.9 -7.2 36.6 70.0
III. Economic characteristics
Economically active households 4,153.6 3,610.4 3,457.5 3,530.0 3,741.6 3,728.8 4,052.1 4,709.6 657.4 16.2 556.0 13.4
Working households 2,807.5 2,535.5 2,551.9 2,684.3 2,804.1 2,772.6 3,050.1 3,481.4 431.3 14.1 673.9 24.0
Unemployed households 1,346.1 1,075.0 905.6 845.7 937.4 956.2 1,002.0 1,228.2 226.2 22.6 -117.9 -8.8
Economically inactive households 5,361.8 5,814.2 6,488.3 7,145.3 7,321.4 8,164.3 9,607.7 10,773.7 1,166.1 12.1 5,411.9 100.9
IV. Housing characteristics
Public rental housing 1,261.8 1,194.0 1,171.1 1,301.4 1,220.8 1,087.2 1,200.2 1,311.3 111.1 9.3 49.5 3.9
Tenants in private housing 584.2 532.0 585.6 708.9 874.7 997.8 1,217.5 1,436.8 219.3 18.0 852.6 146.0
Owner-occupiers 7,160.8 7,152.1 7,585.1 8,061.9 8,276.9 9,028.3 10,510.8 11,835.8 1,325.0 12.6 4,674.9 65.3
- with mortgages or loans 1,062.7 713.9 774.8 807.8 860.9 893.1 1,011.4 1,150.9 139.5 13.8 88.2 8.3
- without mortgages and loans 6,098.1 6,438.3 6,810.3 7,254.1 7,416.0 8,135.2 9,499.4 10,684.9 1,185.5 12.5 4,586.8 75.2
V. Age of household head
Household head aged between 18 and 64 5,791.2 5,479.7 5,748.9 5,865.7 6,319.4 6,515.7 7,366.6 8,098.5 731.9 9.9 2,307.3 39.8
Household head aged 65 and above 3,689.6 3,900.4 4,163.5 4,777.9 4,717.4 5,343.6 6,248.7 7,357.4 1,108.8 17.7 3,667.9 99.4
VI. District Council districts
Central and Western 507.2 516.1 561.9 586.3 593.6 660.7 701.7 725.2 23.5 3.3 218.0 43.0
Wan Chai 348.9 407.3 381.9 435.2 398.9 481.7 614.9 649.2 34.3 5.6 300.3 86.1
Eastern 833.6 861.8 928.4 1,012.0 1,135.9 1,177.0 1,319.6 1,213.8 -105.9 -8.0 380.2 45.6
Southern 272.3 241.9 324.7 325.9 319.5 348.2 417.1 449.1 32.1 7.7 176.8 64.9
Yau Tsim Mong 626.7 618.2 685.8 796.0 743.2 825.2 1,020.9 1,113.7 92.8 9.1 487.0 77.7
Sham Shui Po 568.1 591.5 591.9 621.8 671.1 715.4 661.2 846.6 185.4 28.0 278.5 49.0
Kowloon City 592.9 665.0 636.5 680.6 699.2 776.9 930.1 846.2 -83.8 -9.0 253.3 42.7
Wong Tai Sin 469.0 424.8 446.6 514.6 472.7 516.2 560.0 626.8 66.8 11.9 157.8 33.6
Kwun Tong 673.2 602.8 579.0 705.7 686.6 681.4 850.2 873.5 23.3 2.7 200.2 29.7
Kwai Tsing 452.7 476.1 399.8 487.9 478.1 541.2 591.6 631.3 39.8 6.7 178.7 39.5
Tsuen Wan 422.4 385.3 385.0 488.1 467.1 537.3 614.9 766.1 151.2 24.6 343.8 81.4
Tuen Mun 673.5 704.4 765.5 749.8 822.6 817.4 929.0 1,073.7 144.7 15.6 400.3 59.4
Yuen Long 866.3 893.6 947.0 986.1 904.2 971.1 1,228.6 1,529.6 301.0 24.5 663.3 76.6
North 461.0 490.3 528.8 493.4 472.8 659.1 623.7 878.5 254.8 40.8 417.5 90.6
Tai Po 454.5 371.3 416.9 409.2 483.4 510.3 601.0 767.0 166.1 27.6 312.5 68.8
Sha Tin 654.7 614.9 686.7 736.8 950.0 863.7 1,090.2 1,222.5 132.2 12.1 567.7 86.7
Sai Kung 386.3 369.5 424.9 437.9 516.2 568.3 570.1 825.9 255.8 44.9 439.6 113.8
Islands 252.0 189.7 254.7 208.1 247.9 242.0 334.9 444.5 109.6 32.7 192.5 76.4
After policy intervention
(recurrent cash + in-kind)
2016 compared
with 2015
2016 compared
with 2009HK$Mn
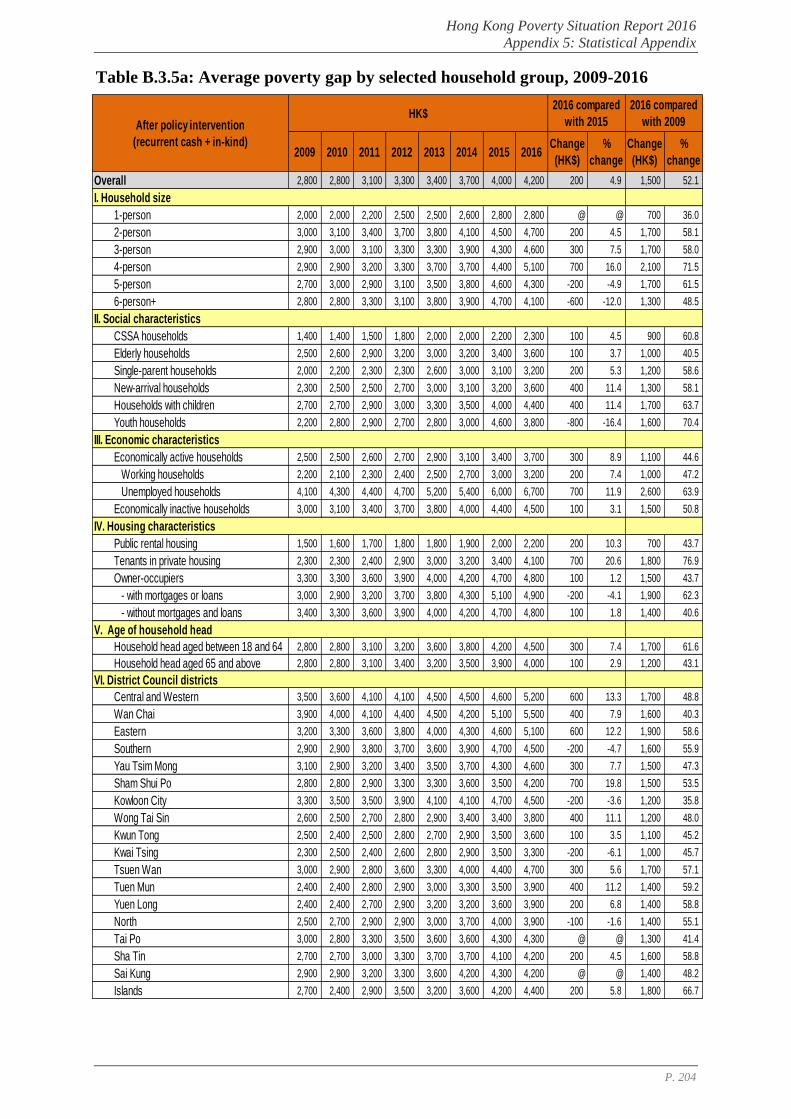
Hong Kong Poverty Situation Report 2016
Appendix 5: Statistical Appendix
P. 204
Table B.3.5a: Average poverty gap by selected household group, 2009-2016
2009 2010 2011 2012 2013 2014 2015 2016Change
(HK$)
%
change
Change
(HK$)
%
change
Overall 2,800 2,800 3,100 3,300 3,400 3,700 4,000 4,200 200 4.9 1,500 52.1
I. Household size
1-person 2,000 2,000 2,200 2,500 2,500 2,600 2,800 2,800 @ @ 700 36.0
2-person 3,000 3,100 3,400 3,700 3,800 4,100 4,500 4,700 200 4.5 1,700 58.1
3-person 2,900 3,000 3,100 3,300 3,300 3,900 4,300 4,600 300 7.5 1,700 58.0
4-person 2,900 2,900 3,200 3,300 3,700 3,700 4,400 5,100 700 16.0 2,100 71.5
5-person 2,700 3,000 2,900 3,100 3,500 3,800 4,600 4,300 -200 -4.9 1,700 61.5
6-person+ 2,800 2,800 3,300 3,100 3,800 3,900 4,700 4,100 -600 -12.0 1,300 48.5
II. Social characteristics
CSSA households 1,400 1,400 1,500 1,800 2,000 2,000 2,200 2,300 100 4.5 900 60.8
Elderly households 2,500 2,600 2,900 3,200 3,000 3,200 3,400 3,600 100 3.7 1,000 40.5
Single-parent households 2,000 2,200 2,300 2,300 2,600 3,000 3,100 3,200 200 5.3 1,200 58.6
New-arrival households 2,300 2,500 2,500 2,700 3,000 3,100 3,200 3,600 400 11.4 1,300 58.1
Households with children 2,700 2,700 2,900 3,000 3,300 3,500 4,000 4,400 400 11.4 1,700 63.7
Youth households 2,200 2,800 2,900 2,700 2,800 3,000 4,600 3,800 -800 -16.4 1,600 70.4
III. Economic characteristics
Economically active households 2,500 2,500 2,600 2,700 2,900 3,100 3,400 3,700 300 8.9 1,100 44.6
Working households 2,200 2,100 2,300 2,400 2,500 2,700 3,000 3,200 200 7.4 1,000 47.2
Unemployed households 4,100 4,300 4,400 4,700 5,200 5,400 6,000 6,700 700 11.9 2,600 63.9
Economically inactive households 3,000 3,100 3,400 3,700 3,800 4,000 4,400 4,500 100 3.1 1,500 50.8
IV. Housing characteristics
Public rental housing 1,500 1,600 1,700 1,800 1,800 1,900 2,000 2,200 200 10.3 700 43.7
Tenants in private housing 2,300 2,300 2,400 2,900 3,000 3,200 3,400 4,100 700 20.6 1,800 76.9
Owner-occupiers 3,300 3,300 3,600 3,900 4,000 4,200 4,700 4,800 100 1.2 1,500 43.7
- with mortgages or loans 3,000 2,900 3,200 3,700 3,800 4,300 5,100 4,900 -200 -4.1 1,900 62.3
- without mortgages and loans 3,400 3,300 3,600 3,900 4,000 4,200 4,700 4,800 100 1.8 1,400 40.6
V. Age of household head
Household head aged between 18 and 64 2,800 2,800 3,100 3,200 3,600 3,800 4,200 4,500 300 7.4 1,700 61.6
Household head aged 65 and above 2,800 2,800 3,100 3,400 3,200 3,500 3,900 4,000 100 2.9 1,200 43.1
VI. District Council districts
Central and Western 3,500 3,600 4,100 4,100 4,500 4,500 4,600 5,200 600 13.3 1,700 48.8
Wan Chai 3,900 4,000 4,100 4,400 4,500 4,200 5,100 5,500 400 7.9 1,600 40.3
Eastern 3,200 3,300 3,600 3,800 4,000 4,300 4,600 5,100 600 12.2 1,900 58.6
Southern 2,900 2,900 3,800 3,700 3,600 3,900 4,700 4,500 -200 -4.7 1,600 55.9
Yau Tsim Mong 3,100 2,900 3,200 3,400 3,500 3,700 4,300 4,600 300 7.7 1,500 47.3
Sham Shui Po 2,800 2,800 2,900 3,300 3,300 3,600 3,500 4,200 700 19.8 1,500 53.5
Kowloon City 3,300 3,500 3,500 3,900 4,100 4,100 4,700 4,500 -200 -3.6 1,200 35.8
Wong Tai Sin 2,600 2,500 2,700 2,800 2,900 3,400 3,400 3,800 400 11.1 1,200 48.0
Kwun Tong 2,500 2,400 2,500 2,800 2,700 2,900 3,500 3,600 100 3.5 1,100 45.2
Kwai Tsing 2,300 2,500 2,400 2,600 2,800 2,900 3,500 3,300 -200 -6.1 1,000 45.7
Tsuen Wan 3,000 2,900 2,800 3,600 3,300 4,000 4,400 4,700 300 5.6 1,700 57.1
Tuen Mun 2,400 2,400 2,800 2,900 3,000 3,300 3,500 3,900 400 11.2 1,400 59.2
Yuen Long 2,400 2,400 2,700 2,900 3,200 3,200 3,600 3,900 200 6.8 1,400 58.8
North 2,500 2,700 2,900 2,900 3,000 3,700 4,000 3,900 -100 -1.6 1,400 55.1
Tai Po 3,000 2,800 3,300 3,500 3,600 3,600 4,300 4,300 @ @ 1,300 41.4
Sha Tin 2,700 2,700 3,000 3,300 3,700 3,700 4,100 4,200 200 4.5 1,600 58.8
Sai Kung 2,900 2,900 3,200 3,300 3,600 4,200 4,300 4,200 @ @ 1,400 48.2
Islands 2,700 2,400 2,900 3,500 3,200 3,600 4,200 4,400 200 5.8 1,800 66.7
After policy intervention
(recurrent cash + in-kind)
2016 compared
with 2015
2016 compared
with 2009HK$

Hong Kong Poverty Situation Report 2016
Appendix 5: Statistical Appendix
P. 205
Table B.3.1b: Poor households by selected household group, 2009-2016 (with the
2016 comparison of pre- and post-intervention poverty indicators)
2009 2010 2011 2012 2013 2014 2015 2016Change
('000)
%
change
Overall 284.1 278.1 270.5 271.7 269.2 270.7 281.4 304.0 -278.1 -47.8
I. Household size
1-person 49.5 54.2 52.8 55.2 55.2 60.3 66.1 76.5 -98.2 -56.2
2-person 105.7 101.8 105.2 102.5 104.9 107.1 108.8 113.5 -77.4 -40.5
3-person 69.3 64.1 54.8 58.7 60.3 55.1 56.6 64.6 -45.4 -41.3
4-person 45.5 44.4 44.7 42.4 37.4 36.6 38.0 38.9 -37.8 -49.3
5-person 9.8 10.1 9.8 9.7 8.9 8.4 9.1 7.8 -13.9 -64.2
6-person+ 4.2 3.4 3.3 3.1 2.5 3.3 2.8 2.7 -5.3 -66.2
II. Social characteristics
CSSA households 46.1 47.6 44.9 42.6 41.5 29.8 29.6 27.5 -138.4 -83.4
Elderly households 70.3 77.7 77.0 80.1 84.1 88.1 96.2 111.2 -110.0 -49.7
Single-parent households 18.8 17.9 16.1 16.8 16.4 14.4 15.2 14.0 -18.9 -57.4
New-arrival households 24.7 19.8 20.0 21.3 18.7 16.0 14.9 13.8 -9.4 -40.5
Households with children 98.3 91.2 85.4 85.9 78.3 74.4 77.0 74.4 -74.5 -50.1
Youth households 1.9 1.9 2.0 2.5 1.7 1.6 1.7 1.9 -0.4 -15.4
III. Economic characteristics
Economically active households 135.8 120.0 111.0 110.0 107.8 101.3 99.8 106.5 -116.4 -52.2
Working households 108.3 99.0 93.6 95.0 92.7 86.6 85.8 91.2 -109.6 -54.6
Unemployed households 27.5 21.0 17.3 15.0 15.0 14.7 14.0 15.3 -6.8 -30.8
Economically inactive households 148.3 158.0 159.5 161.7 161.5 169.3 181.6 197.5 -161.7 -45.0
IV. Housing characteristics
Public rental housing 68.5 63.0 57.8 61.0 57.0 48.5 50.0 49.5 -233.7 -82.5
Tenants in private housing 21.1 19.4 20.5 20.5 24.1 25.7 30.0 29.4 -21.2 -41.8
Owner-occupiers 179.4 181.3 176.6 174.4 171.3 178.2 185.5 206.4 -21.5 -9.4
- with mortgages or loans 29.6 20.4 20.1 18.2 18.7 17.3 16.7 19.8 -1.9 -8.9
- without mortgages and loans 149.8 161.0 156.5 156.2 152.6 161.0 168.9 186.6 -19.6 -9.5
V. Age of household head
Household head aged between 18 and 64 172.8 161.8 156.5 152.2 146.7 141.3 146.1 149.6 -131.1 -46.7
Household head aged 65 and above 110.5 115.0 113.3 118.7 122.0 128.8 134.6 154.0 -146.9 -48.8
VI. District Council districts
Central and Western 12.2 12.0 11.4 11.8 11.1 12.2 12.8 11.7 -1.7 -12.8
Wan Chai 7.4 8.4 7.8 8.3 7.4 9.5 10.0 9.8 -1.0 -9.0
Eastern 21.5 21.7 21.5 22.3 23.7 22.9 24.0 19.7 -14.4 -42.1
Southern 7.9 6.9 7.0 7.3 7.3 7.5 7.4 8.3 -7.9 -48.7
Yau Tsim Mong 16.8 17.5 17.8 19.5 17.6 18.3 20.0 20.3 -7.1 -25.9
Sham Shui Po 17.2 17.3 16.8 15.5 17.2 16.8 15.6 16.7 -24.0 -58.9
Kowloon City 15.0 15.9 15.2 14.6 14.3 15.7 16.6 15.7 -12.5 -44.2
Wong Tai Sin 15.2 13.9 13.7 15.5 13.4 12.8 13.6 13.7 -25.0 -64.5
Kwun Tong 22.6 20.8 19.0 21.1 21.0 19.3 20.3 20.2 -42.5 -67.8
Kwai Tsing 16.6 15.6 14.2 15.9 14.0 15.4 13.9 15.8 -31.8 -66.7
Tsuen Wan 11.8 11.1 11.5 11.4 11.8 11.1 11.5 13.6 -8.6 -38.8
Tuen Mun 23.0 24.4 22.8 21.8 23.0 20.9 22.2 23.1 -19.6 -45.9
Yuen Long 29.7 30.5 28.9 28.2 23.6 25.2 28.3 33.0 -22.6 -40.6
North 15.3 15.1 15.2 14.2 13.1 14.7 13.1 18.8 -11.2 -37.2
Tai Po 12.5 10.9 10.7 9.7 11.2 11.8 11.6 14.9 -8.0 -35.0
Sha Tin 20.4 18.7 18.9 18.6 21.6 19.6 22.4 24.0 -24.8 -50.8
Sai Kung 11.3 10.6 10.9 11.0 11.9 11.2 11.1 16.3 -11.5 -41.4
Islands 7.9 6.6 7.3 4.9 6.4 5.5 6.6 8.3 -4.2 -33.4
2016After policy intervention
(recurrent cash + in-kind)
No. of households ('000)
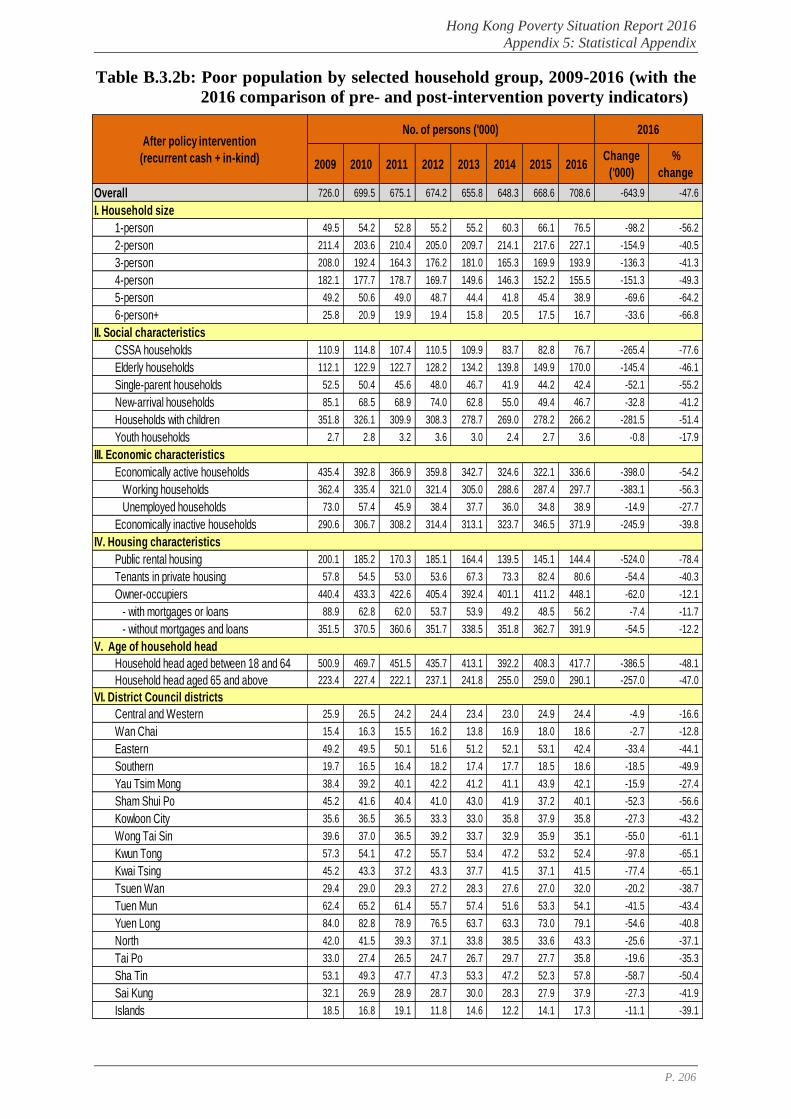
Hong Kong Poverty Situation Report 2016
Appendix 5: Statistical Appendix
P. 206
Table B.3.2b: Poor population by selected household group, 2009-2016 (with the
2016 comparison of pre- and post-intervention poverty indicators)
2009 2010 2011 2012 2013 2014 2015 2016Change
('000)
%
change
Overall 726.0 699.5 675.1 674.2 655.8 648.3 668.6 708.6 -643.9 -47.6
I. Household size
1-person 49.5 54.2 52.8 55.2 55.2 60.3 66.1 76.5 -98.2 -56.2
2-person 211.4 203.6 210.4 205.0 209.7 214.1 217.6 227.1 -154.9 -40.5
3-person 208.0 192.4 164.3 176.2 181.0 165.3 169.9 193.9 -136.3 -41.3
4-person 182.1 177.7 178.7 169.7 149.6 146.3 152.2 155.5 -151.3 -49.3
5-person 49.2 50.6 49.0 48.7 44.4 41.8 45.4 38.9 -69.6 -64.2
6-person+ 25.8 20.9 19.9 19.4 15.8 20.5 17.5 16.7 -33.6 -66.8
II. Social characteristics
CSSA households 110.9 114.8 107.4 110.5 109.9 83.7 82.8 76.7 -265.4 -77.6
Elderly households 112.1 122.9 122.7 128.2 134.2 139.8 149.9 170.0 -145.4 -46.1
Single-parent households 52.5 50.4 45.6 48.0 46.7 41.9 44.2 42.4 -52.1 -55.2
New-arrival households 85.1 68.5 68.9 74.0 62.8 55.0 49.4 46.7 -32.8 -41.2
Households with children 351.8 326.1 309.9 308.3 278.7 269.0 278.2 266.2 -281.5 -51.4
Youth households 2.7 2.8 3.2 3.6 3.0 2.4 2.7 3.6 -0.8 -17.9
III. Economic characteristics
Economically active households 435.4 392.8 366.9 359.8 342.7 324.6 322.1 336.6 -398.0 -54.2
Working households 362.4 335.4 321.0 321.4 305.0 288.6 287.4 297.7 -383.1 -56.3
Unemployed households 73.0 57.4 45.9 38.4 37.7 36.0 34.8 38.9 -14.9 -27.7
Economically inactive households 290.6 306.7 308.2 314.4 313.1 323.7 346.5 371.9 -245.9 -39.8
IV. Housing characteristics
Public rental housing 200.1 185.2 170.3 185.1 164.4 139.5 145.1 144.4 -524.0 -78.4
Tenants in private housing 57.8 54.5 53.0 53.6 67.3 73.3 82.4 80.6 -54.4 -40.3
Owner-occupiers 440.4 433.3 422.6 405.4 392.4 401.1 411.2 448.1 -62.0 -12.1
- with mortgages or loans 88.9 62.8 62.0 53.7 53.9 49.2 48.5 56.2 -7.4 -11.7
- without mortgages and loans 351.5 370.5 360.6 351.7 338.5 351.8 362.7 391.9 -54.5 -12.2
V. Age of household head
Household head aged between 18 and 64 500.9 469.7 451.5 435.7 413.1 392.2 408.3 417.7 -386.5 -48.1
Household head aged 65 and above 223.4 227.4 222.1 237.1 241.8 255.0 259.0 290.1 -257.0 -47.0
VI. District Council districts
Central and Western 25.9 26.5 24.2 24.4 23.4 23.0 24.9 24.4 -4.9 -16.6
Wan Chai 15.4 16.3 15.5 16.2 13.8 16.9 18.0 18.6 -2.7 -12.8
Eastern 49.2 49.5 50.1 51.6 51.2 52.1 53.1 42.4 -33.4 -44.1
Southern 19.7 16.5 16.4 18.2 17.4 17.7 18.5 18.6 -18.5 -49.9
Yau Tsim Mong 38.4 39.2 40.1 42.2 41.2 41.1 43.9 42.1 -15.9 -27.4
Sham Shui Po 45.2 41.6 40.4 41.0 43.0 41.9 37.2 40.1 -52.3 -56.6
Kowloon City 35.6 36.5 36.5 33.3 33.0 35.8 37.9 35.8 -27.3 -43.2
Wong Tai Sin 39.6 37.0 36.5 39.2 33.7 32.9 35.9 35.1 -55.0 -61.1
Kwun Tong 57.3 54.1 47.2 55.7 53.4 47.2 53.2 52.4 -97.8 -65.1
Kwai Tsing 45.2 43.3 37.2 43.3 37.7 41.5 37.1 41.5 -77.4 -65.1
Tsuen Wan 29.4 29.0 29.3 27.2 28.3 27.6 27.0 32.0 -20.2 -38.7
Tuen Mun 62.4 65.2 61.4 55.7 57.4 51.6 53.3 54.1 -41.5 -43.4
Yuen Long 84.0 82.8 78.9 76.5 63.7 63.3 73.0 79.1 -54.6 -40.8
North 42.0 41.5 39.3 37.1 33.8 38.5 33.6 43.3 -25.6 -37.1
Tai Po 33.0 27.4 26.5 24.7 26.7 29.7 27.7 35.8 -19.6 -35.3
Sha Tin 53.1 49.3 47.7 47.3 53.3 47.2 52.3 57.8 -58.7 -50.4
Sai Kung 32.1 26.9 28.9 28.7 30.0 28.3 27.9 37.9 -27.3 -41.9
Islands 18.5 16.8 19.1 11.8 14.6 12.2 14.1 17.3 -11.1 -39.1
After policy intervention
(recurrent cash + in-kind)
2016No. of persons ('000)
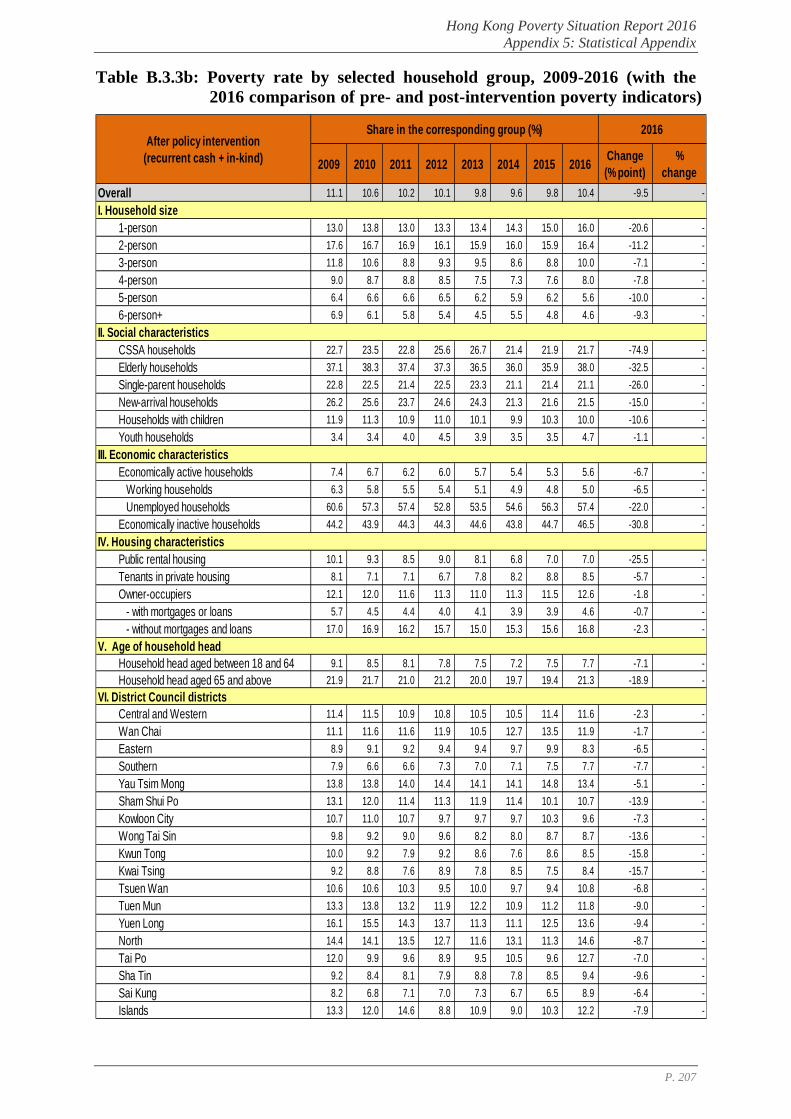
Hong Kong Poverty Situation Report 2016
Appendix 5: Statistical Appendix
P. 207
Table B.3.3b: Poverty rate by selected household group, 2009-2016 (with the
2016 comparison of pre- and post-intervention poverty indicators)
2009 2010 2011 2012 2013 2014 2015 2016Change
(% point)
%
change
Overall 11.1 10.6 10.2 10.1 9.8 9.6 9.8 10.4 -9.5 -
I. Household size
1-person 13.0 13.8 13.0 13.3 13.4 14.3 15.0 16.0 -20.6 -
2-person 17.6 16.7 16.9 16.1 15.9 16.0 15.9 16.4 -11.2 -
3-person 11.8 10.6 8.8 9.3 9.5 8.6 8.8 10.0 -7.1 -
4-person 9.0 8.7 8.8 8.5 7.5 7.3 7.6 8.0 -7.8 -
5-person 6.4 6.6 6.6 6.5 6.2 5.9 6.2 5.6 -10.0 -
6-person+ 6.9 6.1 5.8 5.4 4.5 5.5 4.8 4.6 -9.3 -
II. Social characteristics
CSSA households 22.7 23.5 22.8 25.6 26.7 21.4 21.9 21.7 -74.9 -
Elderly households 37.1 38.3 37.4 37.3 36.5 36.0 35.9 38.0 -32.5 -
Single-parent households 22.8 22.5 21.4 22.5 23.3 21.1 21.4 21.1 -26.0 -
New-arrival households 26.2 25.6 23.7 24.6 24.3 21.3 21.6 21.5 -15.0 -
Households with children 11.9 11.3 10.9 11.0 10.1 9.9 10.3 10.0 -10.6 -
Youth households 3.4 3.4 4.0 4.5 3.9 3.5 3.5 4.7 -1.1 -
III. Economic characteristics
Economically active households 7.4 6.7 6.2 6.0 5.7 5.4 5.3 5.6 -6.7 -
Working households 6.3 5.8 5.5 5.4 5.1 4.9 4.8 5.0 -6.5 -
Unemployed households 60.6 57.3 57.4 52.8 53.5 54.6 56.3 57.4 -22.0 -
Economically inactive households 44.2 43.9 44.3 44.3 44.6 43.8 44.7 46.5 -30.8 -
IV. Housing characteristics
Public rental housing 10.1 9.3 8.5 9.0 8.1 6.8 7.0 7.0 -25.5 -
Tenants in private housing 8.1 7.1 7.1 6.7 7.8 8.2 8.8 8.5 -5.7 -
Owner-occupiers 12.1 12.0 11.6 11.3 11.0 11.3 11.5 12.6 -1.8 -
- with mortgages or loans 5.7 4.5 4.4 4.0 4.1 3.9 3.9 4.6 -0.7 -
- without mortgages and loans 17.0 16.9 16.2 15.7 15.0 15.3 15.6 16.8 -2.3 -
V. Age of household head
Household head aged between 18 and 64 9.1 8.5 8.1 7.8 7.5 7.2 7.5 7.7 -7.1 -
Household head aged 65 and above 21.9 21.7 21.0 21.2 20.0 19.7 19.4 21.3 -18.9 -
VI. District Council districts
Central and Western 11.4 11.5 10.9 10.8 10.5 10.5 11.4 11.6 -2.3 -
Wan Chai 11.1 11.6 11.6 11.9 10.5 12.7 13.5 11.9 -1.7 -
Eastern 8.9 9.1 9.2 9.4 9.4 9.7 9.9 8.3 -6.5 -
Southern 7.9 6.6 6.6 7.3 7.0 7.1 7.5 7.7 -7.7 -
Yau Tsim Mong 13.8 13.8 14.0 14.4 14.1 14.1 14.8 13.4 -5.1 -
Sham Shui Po 13.1 12.0 11.4 11.3 11.9 11.4 10.1 10.7 -13.9 -
Kowloon City 10.7 11.0 10.7 9.7 9.7 9.7 10.3 9.6 -7.3 -
Wong Tai Sin 9.8 9.2 9.0 9.6 8.2 8.0 8.7 8.7 -13.6 -
Kwun Tong 10.0 9.2 7.9 9.2 8.6 7.6 8.6 8.5 -15.8 -
Kwai Tsing 9.2 8.8 7.6 8.9 7.8 8.5 7.5 8.4 -15.7 -
Tsuen Wan 10.6 10.6 10.3 9.5 10.0 9.7 9.4 10.8 -6.8 -
Tuen Mun 13.3 13.8 13.2 11.9 12.2 10.9 11.2 11.8 -9.0 -
Yuen Long 16.1 15.5 14.3 13.7 11.3 11.1 12.5 13.6 -9.4 -
North 14.4 14.1 13.5 12.7 11.6 13.1 11.3 14.6 -8.7 -
Tai Po 12.0 9.9 9.6 8.9 9.5 10.5 9.6 12.7 -7.0 -
Sha Tin 9.2 8.4 8.1 7.9 8.8 7.8 8.5 9.4 -9.6 -
Sai Kung 8.2 6.8 7.1 7.0 7.3 6.7 6.5 8.9 -6.4 -
Islands 13.3 12.0 14.6 8.8 10.9 9.0 10.3 12.2 -7.9 -
After policy intervention
(recurrent cash + in-kind)
2016Share in the corresponding group (%)
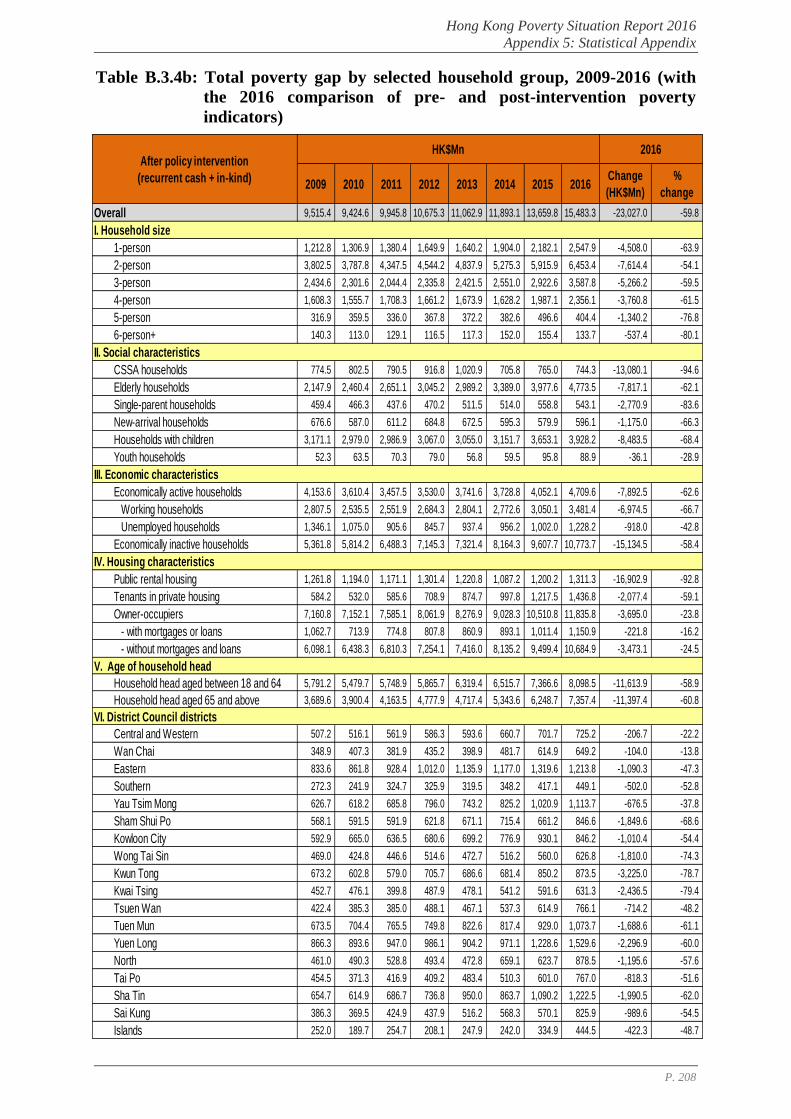
Hong Kong Poverty Situation Report 2016
Appendix 5: Statistical Appendix
P. 208
Table B.3.4b: Total poverty gap by selected household group, 2009-2016 (with
the 2016 comparison of pre- and post-intervention poverty
indicators)
2009 2010 2011 2012 2013 2014 2015 2016Change
(HK$Mn)
%
change
Overall 9,515.4 9,424.6 9,945.8 10,675.3 11,062.9 11,893.1 13,659.8 15,483.3 -23,027.0 -59.8
I. Household size
1-person 1,212.8 1,306.9 1,380.4 1,649.9 1,640.2 1,904.0 2,182.1 2,547.9 -4,508.0 -63.9
2-person 3,802.5 3,787.8 4,347.5 4,544.2 4,837.9 5,275.3 5,915.9 6,453.4 -7,614.4 -54.1
3-person 2,434.6 2,301.6 2,044.4 2,335.8 2,421.5 2,551.0 2,922.6 3,587.8 -5,266.2 -59.5
4-person 1,608.3 1,555.7 1,708.3 1,661.2 1,673.9 1,628.2 1,987.1 2,356.1 -3,760.8 -61.5
5-person 316.9 359.5 336.0 367.8 372.2 382.6 496.6 404.4 -1,340.2 -76.8
6-person+ 140.3 113.0 129.1 116.5 117.3 152.0 155.4 133.7 -537.4 -80.1
II. Social characteristics
CSSA households 774.5 802.5 790.5 916.8 1,020.9 705.8 765.0 744.3 -13,080.1 -94.6
Elderly households 2,147.9 2,460.4 2,651.1 3,045.2 2,989.2 3,389.0 3,977.6 4,773.5 -7,817.1 -62.1
Single-parent households 459.4 466.3 437.6 470.2 511.5 514.0 558.8 543.1 -2,770.9 -83.6
New-arrival households 676.6 587.0 611.2 684.8 672.5 595.3 579.9 596.1 -1,175.0 -66.3
Households with children 3,171.1 2,979.0 2,986.9 3,067.0 3,055.0 3,151.7 3,653.1 3,928.2 -8,483.5 -68.4
Youth households 52.3 63.5 70.3 79.0 56.8 59.5 95.8 88.9 -36.1 -28.9
III. Economic characteristics
Economically active households 4,153.6 3,610.4 3,457.5 3,530.0 3,741.6 3,728.8 4,052.1 4,709.6 -7,892.5 -62.6
Working households 2,807.5 2,535.5 2,551.9 2,684.3 2,804.1 2,772.6 3,050.1 3,481.4 -6,974.5 -66.7
Unemployed households 1,346.1 1,075.0 905.6 845.7 937.4 956.2 1,002.0 1,228.2 -918.0 -42.8
Economically inactive households 5,361.8 5,814.2 6,488.3 7,145.3 7,321.4 8,164.3 9,607.7 10,773.7 -15,134.5 -58.4
IV. Housing characteristics
Public rental housing 1,261.8 1,194.0 1,171.1 1,301.4 1,220.8 1,087.2 1,200.2 1,311.3 -16,902.9 -92.8
Tenants in private housing 584.2 532.0 585.6 708.9 874.7 997.8 1,217.5 1,436.8 -2,077.4 -59.1
Owner-occupiers 7,160.8 7,152.1 7,585.1 8,061.9 8,276.9 9,028.3 10,510.8 11,835.8 -3,695.0 -23.8
- with mortgages or loans 1,062.7 713.9 774.8 807.8 860.9 893.1 1,011.4 1,150.9 -221.8 -16.2
- without mortgages and loans 6,098.1 6,438.3 6,810.3 7,254.1 7,416.0 8,135.2 9,499.4 10,684.9 -3,473.1 -24.5
V. Age of household head
Household head aged between 18 and 64 5,791.2 5,479.7 5,748.9 5,865.7 6,319.4 6,515.7 7,366.6 8,098.5 -11,613.9 -58.9
Household head aged 65 and above 3,689.6 3,900.4 4,163.5 4,777.9 4,717.4 5,343.6 6,248.7 7,357.4 -11,397.4 -60.8
VI. District Council districts
Central and Western 507.2 516.1 561.9 586.3 593.6 660.7 701.7 725.2 -206.7 -22.2
Wan Chai 348.9 407.3 381.9 435.2 398.9 481.7 614.9 649.2 -104.0 -13.8
Eastern 833.6 861.8 928.4 1,012.0 1,135.9 1,177.0 1,319.6 1,213.8 -1,090.3 -47.3
Southern 272.3 241.9 324.7 325.9 319.5 348.2 417.1 449.1 -502.0 -52.8
Yau Tsim Mong 626.7 618.2 685.8 796.0 743.2 825.2 1,020.9 1,113.7 -676.5 -37.8
Sham Shui Po 568.1 591.5 591.9 621.8 671.1 715.4 661.2 846.6 -1,849.6 -68.6
Kowloon City 592.9 665.0 636.5 680.6 699.2 776.9 930.1 846.2 -1,010.4 -54.4
Wong Tai Sin 469.0 424.8 446.6 514.6 472.7 516.2 560.0 626.8 -1,810.0 -74.3
Kwun Tong 673.2 602.8 579.0 705.7 686.6 681.4 850.2 873.5 -3,225.0 -78.7
Kwai Tsing 452.7 476.1 399.8 487.9 478.1 541.2 591.6 631.3 -2,436.5 -79.4
Tsuen Wan 422.4 385.3 385.0 488.1 467.1 537.3 614.9 766.1 -714.2 -48.2
Tuen Mun 673.5 704.4 765.5 749.8 822.6 817.4 929.0 1,073.7 -1,688.6 -61.1
Yuen Long 866.3 893.6 947.0 986.1 904.2 971.1 1,228.6 1,529.6 -2,296.9 -60.0
North 461.0 490.3 528.8 493.4 472.8 659.1 623.7 878.5 -1,195.6 -57.6
Tai Po 454.5 371.3 416.9 409.2 483.4 510.3 601.0 767.0 -818.3 -51.6
Sha Tin 654.7 614.9 686.7 736.8 950.0 863.7 1,090.2 1,222.5 -1,990.5 -62.0
Sai Kung 386.3 369.5 424.9 437.9 516.2 568.3 570.1 825.9 -989.6 -54.5
Islands 252.0 189.7 254.7 208.1 247.9 242.0 334.9 444.5 -422.3 -48.7
2016After policy intervention
(recurrent cash + in-kind)
HK$Mn
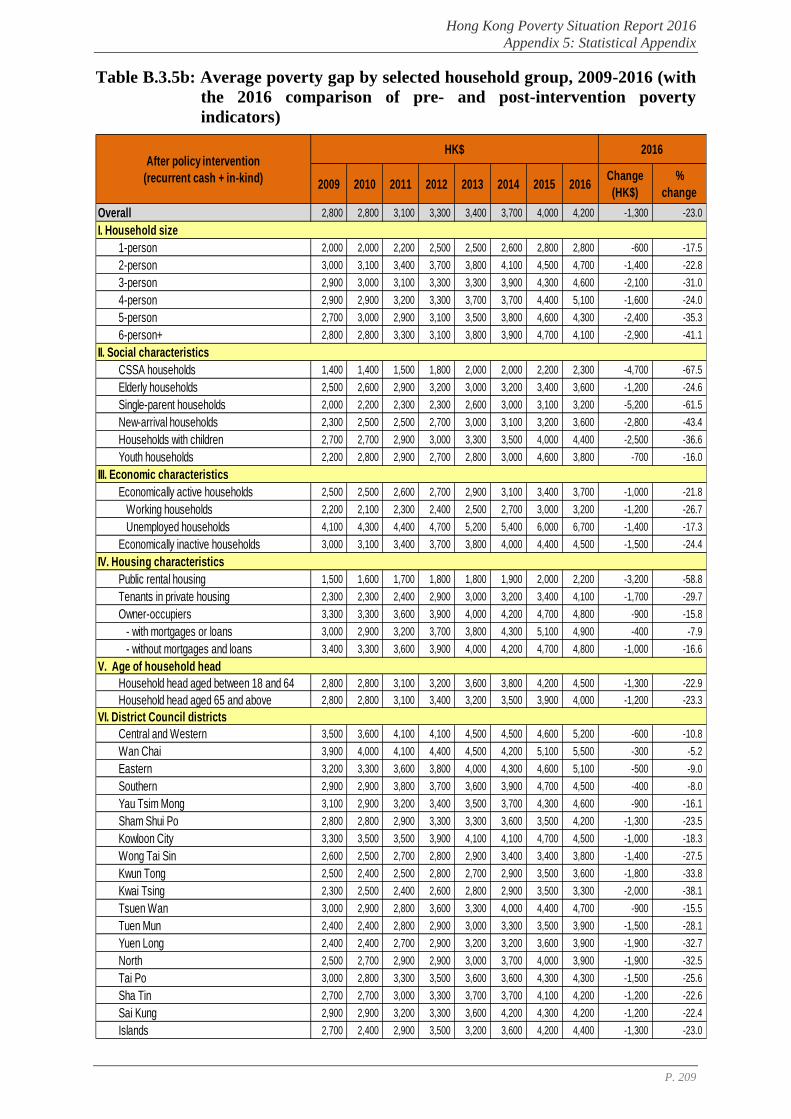
Hong Kong Poverty Situation Report 2016
Appendix 5: Statistical Appendix
P. 209
Table B.3.5b: Average poverty gap by selected household group, 2009-2016 (with
the 2016 comparison of pre- and post-intervention poverty
indicators)
2009 2010 2011 2012 2013 2014 2015 2016Change
(HK$)
%
change
Overall 2,800 2,800 3,100 3,300 3,400 3,700 4,000 4,200 -1,300 -23.0
I. Household size
1-person 2,000 2,000 2,200 2,500 2,500 2,600 2,800 2,800 -600 -17.5
2-person 3,000 3,100 3,400 3,700 3,800 4,100 4,500 4,700 -1,400 -22.8
3-person 2,900 3,000 3,100 3,300 3,300 3,900 4,300 4,600 -2,100 -31.0
4-person 2,900 2,900 3,200 3,300 3,700 3,700 4,400 5,100 -1,600 -24.0
5-person 2,700 3,000 2,900 3,100 3,500 3,800 4,600 4,300 -2,400 -35.3
6-person+ 2,800 2,800 3,300 3,100 3,800 3,900 4,700 4,100 -2,900 -41.1
II. Social characteristics
CSSA households 1,400 1,400 1,500 1,800 2,000 2,000 2,200 2,300 -4,700 -67.5
Elderly households 2,500 2,600 2,900 3,200 3,000 3,200 3,400 3,600 -1,200 -24.6
Single-parent households 2,000 2,200 2,300 2,300 2,600 3,000 3,100 3,200 -5,200 -61.5
New-arrival households 2,300 2,500 2,500 2,700 3,000 3,100 3,200 3,600 -2,800 -43.4
Households with children 2,700 2,700 2,900 3,000 3,300 3,500 4,000 4,400 -2,500 -36.6
Youth households 2,200 2,800 2,900 2,700 2,800 3,000 4,600 3,800 -700 -16.0
III. Economic characteristics
Economically active households 2,500 2,500 2,600 2,700 2,900 3,100 3,400 3,700 -1,000 -21.8
Working households 2,200 2,100 2,300 2,400 2,500 2,700 3,000 3,200 -1,200 -26.7
Unemployed households 4,100 4,300 4,400 4,700 5,200 5,400 6,000 6,700 -1,400 -17.3
Economically inactive households 3,000 3,100 3,400 3,700 3,800 4,000 4,400 4,500 -1,500 -24.4
IV. Housing characteristics
Public rental housing 1,500 1,600 1,700 1,800 1,800 1,900 2,000 2,200 -3,200 -58.8
Tenants in private housing 2,300 2,300 2,400 2,900 3,000 3,200 3,400 4,100 -1,700 -29.7
Owner-occupiers 3,300 3,300 3,600 3,900 4,000 4,200 4,700 4,800 -900 -15.8
- with mortgages or loans 3,000 2,900 3,200 3,700 3,800 4,300 5,100 4,900 -400 -7.9
- without mortgages and loans 3,400 3,300 3,600 3,900 4,000 4,200 4,700 4,800 -1,000 -16.6
V. Age of household head
Household head aged between 18 and 64 2,800 2,800 3,100 3,200 3,600 3,800 4,200 4,500 -1,300 -22.9
Household head aged 65 and above 2,800 2,800 3,100 3,400 3,200 3,500 3,900 4,000 -1,200 -23.3
VI. District Council districts
Central and Western 3,500 3,600 4,100 4,100 4,500 4,500 4,600 5,200 -600 -10.8
Wan Chai 3,900 4,000 4,100 4,400 4,500 4,200 5,100 5,500 -300 -5.2
Eastern 3,200 3,300 3,600 3,800 4,000 4,300 4,600 5,100 -500 -9.0
Southern 2,900 2,900 3,800 3,700 3,600 3,900 4,700 4,500 -400 -8.0
Yau Tsim Mong 3,100 2,900 3,200 3,400 3,500 3,700 4,300 4,600 -900 -16.1
Sham Shui Po 2,800 2,800 2,900 3,300 3,300 3,600 3,500 4,200 -1,300 -23.5
Kowloon City 3,300 3,500 3,500 3,900 4,100 4,100 4,700 4,500 -1,000 -18.3
Wong Tai Sin 2,600 2,500 2,700 2,800 2,900 3,400 3,400 3,800 -1,400 -27.5
Kwun Tong 2,500 2,400 2,500 2,800 2,700 2,900 3,500 3,600 -1,800 -33.8
Kwai Tsing 2,300 2,500 2,400 2,600 2,800 2,900 3,500 3,300 -2,000 -38.1
Tsuen Wan 3,000 2,900 2,800 3,600 3,300 4,000 4,400 4,700 -900 -15.5
Tuen Mun 2,400 2,400 2,800 2,900 3,000 3,300 3,500 3,900 -1,500 -28.1
Yuen Long 2,400 2,400 2,700 2,900 3,200 3,200 3,600 3,900 -1,900 -32.7
North 2,500 2,700 2,900 2,900 3,000 3,700 4,000 3,900 -1,900 -32.5
Tai Po 3,000 2,800 3,300 3,500 3,600 3,600 4,300 4,300 -1,500 -25.6
Sha Tin 2,700 2,700 3,000 3,300 3,700 3,700 4,100 4,200 -1,200 -22.6
Sai Kung 2,900 2,900 3,200 3,300 3,600 4,200 4,300 4,200 -1,200 -22.4
Islands 2,700 2,400 2,900 3,500 3,200 3,600 4,200 4,400 -1,300 -23.0
2016After policy intervention
(recurrent cash + in-kind)
HK$
Hong Kong Poverty Situation Report 2016
Glossary
P. 210
Glossary (listed in alphabetical order)
Term Definition
Domestic households Refer to a group of persons who live together and make
common provision for essentials for living. These
persons need not be related. If a person makes provision
for essentials for living without sharing with other
persons, he / she is also regarded as a household. In this
case, it is a 1-person household.
CSSA households Refer to domestic households that receive
Comprehensive Social Security Assistance.
Elderly households Refer to domestic households with all members aged 65
and above.
Single-parent
households
Refer to domestic households with at least one widowed,
divorced, separated or never married member living with
child(ren) aged below 18.
New-arrival
households
Refer to domestic households with at least one member
who is One-way Permit Holder and has resided in Hong
Kong for less than seven years.
Households with
children
Refer to domestic households with at least one member
aged below 18.
Youth households Refer to domestic households with all members aged 18
to 29.
Economically active
households
Refer to domestic households with at least one member
who is economically active, excluding foreign domestic
helpers.
Economically inactive
households
Refer to domestic households with all members being
economically inactive.
Unemployed
households
Refer to domestic households with all economically
active members being unemployed.
Working households Refer to domestic households with at least one employed
member, excluding foreign domestic helpers.
Households in public
rental housing
Refer to domestic households residing in public rental
housing.
Hong Kong Poverty Situation Report 2016
Glossary
P. 211
Private tenant
households
Refer to domestic households renting and residing in
private permanent housing71
or temporary housing.
Owner-occupier
households
Refer to domestic households which own the subsidised
sale flat72
, private permanent housing, or temporary
housing that they occupy.
Households in other
types of housing
Include domestic households which reside in rent-free or
employer-provided accommodation.
Households with head
aged 18-64
Domestic households with household head aged 18 to
64.
Households with head
aged 65 and above
Domestic households with household head aged 65 and
above.
Demographic dependency
ratio
Refers to the number of persons aged below 18 (youth
and child dependency ratio) and aged 65 and above
(elderly dependency ratio) per 1 000 persons aged 18 to
64.
Economic dependency
ratio
Refers to the number of economically inactive persons
per 1 000 economically active persons.
Economic activity status Households / population can be classified into two main
groups: economically active and economically inactive.
Household income The total income earned by all member(s) of the
household in the month before enumeration. Household
income in this Report can be divided into the following
four types:
(i) Pre-intervention;
(ii) Post-intervention (recurrent cash);
(iii) Post-intervention (recurrent cash + non-recurrent
cash); and
(iv) Post-intervention (recurrent cash + in-kind).
Pre-intervention This income type only includes household members’
employment earnings, investment income, and non-
71 Private permanent housing includes private housing blocks, flats built under the Urban Improvement
Scheme of the Hong Kong Housing Society, villas / bungalows / modern village houses, simple stone
structures and quarters in non-residential buildings. As from the first quarter of 2002, subsidised sale flats
that can be traded in the open market are also put under this category.
72 Subsidised sale flats include flats built under the Home Ownership Scheme, Middle Income Housing
Scheme, Private Sector Participation Scheme, Buy or Rent Option Scheme and Mortgage Subsidy Scheme,
and flats sold under the Tenants Purchase Scheme of HA. Flats built under the Flat for Sale Scheme and
Sandwich Class Housing Scheme of the Hong Kong Housing Society are also included. As from the first
quarter of 2002, subsidised sale flats that can be traded in the open market are excluded.
Hong Kong Poverty Situation Report 2016
Glossary
P. 212
social-transfer cash income. In other words, the income
is pre-tax income with all cash benefits excluded.
Post-intervention
(recurrent cash)
Refers to the household income after tax, including all
recurrent cash benefits received.
Post-intervention
(recurrent +
non-recurrent cash)
Refers to the household income after tax, including both
recurrent and non-recurrent cash benefits (including one-
off measures) received.
Post-intervention
(recurrent cash + in-
kind)
Refers to the household income after tax, including
recurrent cash benefits and in-kind benefits monetised as
part of income received.
Policy intervention
measures
According to the discussion of CoP, policy intervention
measures can broadly be classified into four types:
(i) Taxation;
(ii) Recurrent-cash benefits;
(iii) Non-recurrent cash benefits; and
(iv) In-kind benefits.
Taxation Includes salaries tax and property tax, as well as rates
and government rents paid by households.
Recurrent cash benefits Refer to cash-based benefits / cash-equivalent
supplements recurrently provided by the Government to
individual households, such as social security benefits
and education allowances in cash.
Non-recurrent cash
benefits
Refer to non-recurrent cash benefits provided by the
Government, including one-off measures. Cash
measures provided by the Community Care Fund are
also included.
In-kind benefits Refer to in-kind benefits provided with means tests. The
provision of public rental housing by the Government is
the major in-kind benefit.
Hong Kong Poverty Situation Report 2016
Glossary
P. 213
Persons Refer to those persons residing in domestic households
(excluding foreign domestic helpers) in the Report.
Economically active
persons
Synonymous with the labour force, comprise the
employed persons and the unemployed persons.
Economically inactive
persons
Include all persons who have not had a job and have not
been at work during the seven days before enumeration,
excluding persons who have been on leave / holiday
during the 7-day period and persons who are
unemployed. Persons such as home-makers, retired
persons and all those below the age of 15 are thus
included.
Employed persons For a person aged 15 or over to be classified as
employed, that person should:
(i) be engaged in performing work for pay or profit
during the seven days before enumeration; or
(ii) have formal job attachment (i.e. that the person
has continued receipt of wage or salary; or has an
assurance or an agreed date of return to job or
business; or is in receipt of compensation without
obligation to accept another job).
Full-time workers Refer to employed persons who work 35 hours and over
during the seven days before enumeration, or those who
work less than 35 hours due to leave during the 7-day
period.
Part-time workers Refer to employed persons who work less than 35 hours
during the seven days before enumeration, excluding
those who work less than 35 hours due to leave during
the 7-day period and those underemployed.
Underemployed
persons
The criteria for an employed person to be classified as
underemployed are: involuntarily working less than
35 hours during the seven days before enumeration and
either
(i) has been available for additional work during the
seven days before enumeration; or
(ii) has sought additional work during the 30 days
before enumeration.
Working short hours is considered involuntary if it is
due to slack work, material shortage, mechanical
Hong Kong Poverty Situation Report 2016
Glossary
P. 214
breakdown or inability to find a full-time job. Following
this definition, employed persons taking no-pay leave
due to slack work during the seven days before
enumeration are also classified as underemployed if they
work less than 35 hours or are on leave even for the
whole period during the 7-day period.
Unemployed persons For a person aged 15 or over to be classified as
unemployed, that person should:
(i) not have had a job and should not have performed
any work for pay or profit during the seven days
before enumeration; and
(ii) have been available for work during the seven
days before enumeration; and
(iii) have sought work during the 30 days before
enumeration.
However, if a person aged 15 or over fulfils conditions
(i) and (ii) above but has not sought work during the 30
days before enumeration because he / she believes that
work is not available, he / she is still classified as
unemployed and is regarded as a “discouraged worker”.
Notwithstanding the above, the following types of
persons are also classified as unemployed:
(i) persons without a job and who have sought work,
but have not been available for work because of
temporary sickness; and
(ii) persons without a job and who have been
available for work, but have not sought work
because they:
have made arrangements to take up a new job
or to start business on a subsequent date; or
are expecting to return to their original jobs
(e.g. casual workers are usually called back to
work when service is needed).
Household head A household head is acknowledged by other family
members. Generally speaking, the household head
should be responsible for making major decisions for the
household.
Unemployment rate Refers to the proportion of unemployed persons in the
labour force.
Hong Kong Poverty Situation Report 2016
Glossary
P. 215
Median For an ordered data set which is arranged in ascending
order (i.e. from the smallest value to the largest value),
the median is the value that ranks in the middle of all
data in the set. If the total number of data is an odd
number, the median is the middle value of the ordered
data set. If the total number of data is an even number,
the median is the average of the two middle values of
the ordered data set.
Percentiles Percentiles are the 99 values that divide an ordered data
set into 100 equal parts (in terms of the number of
observations). In brief, the pth
percentile is the value
which delineates the lowest p% of all the data, where p
can be any integer value from 1 to 99.
Poverty indicators Quantitative measurements of poverty.
Poverty incidence Refers to the number of poor households and the
corresponding number of persons living therein (i.e. the
poor population), with monthly household income less
than the poverty line corresponding to the household
size.
Poverty rate The ratio of the poor population to the total population
living in domestic households.
Poverty gap Poverty gap of a poor household refers to the difference
between a household’s income and the poverty
threshold. The total poverty gap is the sum of all such
differences over all poor households. The total poverty
gap divided by the number of poor households is the
average poverty gap.
Poverty line A threshold to define poor households and their
population. In this Report, 50% of the median monthly
household income before policy intervention by
household size is adopted as the poverty line.
Hong Kong Poverty Situation Report 2016
Abbreviations
P. 216
Abbreviations (listed in alphabetical order)
CoP Commission on Poverty
CCF Community Care Fund
C&SD Census and Statistics Department
CSSA Comprehensive Social Security Assistance
DA Disability Allowance
EMs
EU (The)
Ethnic minorities
The European Union
FDH Foreign Domestic Helper
GHS General Household Survey
GSH Green Form Subsidised Home Ownership Pilot Scheme
HA Hong Kong Housing Authority
HKCSS Hong Kong Council of Social Service
HOALA Higher Old Age Living Allowance
LFPR Labour force participation rate
LIFA Low-income Working Family Allowance
OAA Old Age Allowance
OALA Old Age Living Allowance
OECD Organisation for Economic Co-operation and Development
Oxfam Oxfam Hong Kong
PRH Public rental housing
SF Samaritan Fund
SMW
SSA
Statutory Minimum Wage
Social Security Allowance
WITS Work Incentive Transport Subsidy
Hong Kong Poverty Situation Report 2016
References
P. 217
References
1. Adamson, P. (2012). Measuring child poverty: New league tables of child
poverty in the world's rich countries (Innocenti Report Card 10).
Florence, Italy: UNICEF Innocenti Research Centre. Retrieved from
https://www.unicef-irc.org/publications/pdf/rc10_eng.pdf
2. Bellù, L. G., & Liberati, P. (2005). Impacts of policies on poverty.
Absolute poverty lines. Food and Agriculture Organization of the United
Nations. Retrieved from
http://www.fao.org/docs/up/easypol/316/abslt_pov_lines_005en.pdf
3. Blackwood, D. L., & Lynch, R. G. (1994). The measurement of
inequality and poverty: A policy-maker’s guide to the literature. World
Development, 22(4), 567-578.
4. Buhmann, B., Rainwater, L., Schmaus, G., & Smeeding, T. M. (1988).
Equivalence scales, well-being, inequality, and poverty: Sensitivity
estimates across ten countries using the Luxembourg Income Study (LIS)
database. Review of Income and Wealth, 34(2), 115-142.
5. Census and Statistics Department, the Government of the Hong Kong
Special Administrative Region (2015, October). Hong Kong Domestic
Household Projections up to 2049. Retrieved from
http://www.statistics.gov.hk/pub/B71510FC2015XXXXB0100.pdf
6. Census and Statistics Department, the Government of the Hong Kong
Special Administrative Region (2017, June). 2016 Population By-census
– Thematic Report: Household Income Distribution in Hong Kong.
Retrieved from
http://www.statistics.gov.hk/pub/B11200962016XXXXB0100.pdf
7. Census and Statistics Department, the Government of the Hong Kong
Special Administrative Region (2017, September). Hong Kong
Population Projections 2017-2066. Retrieved from
http://www.statistics.gov.hk/pub/B1120015072017XXXXB0100.pdf
8. Citro, C. F., & Michael, R. T. (Eds.). (1995). Measuring poverty: A new
approach. National Research Council. Retrieved from
https://www.census.gov/library/publications/1995/demo/citro-01.html
9. Danziger, S., van der Gaag, J., Taussig, M. K., & Smolensky, E. (1984).
The direct measurement of welfare levels: How much does it cost to
make ends meet? Review of Economics and Statistics, 66(3), 500-505.
10. Duclos, J. Y., & Araar, A. (2006). Poverty and equity: measurement,
policy and estimation with DAD. New York: Springer. Retrieved from
https://www.idrc.ca/en/book/poverty-and-equity-measurement-policy-
and-estimation-dad?PublicationID=324
Hong Kong Poverty Situation Report 2016
References
P. 218
11. Eurostat. (2014, February 6). Glossary: At-risk-of-poverty rate. Retrieved
from http://ec.europa.eu/eurostat/statistics-explained/index.php/
Glossary:At-risk-of-poverty_rate
12. Eurostat. (n.d.). Income and living conditions (ilc). Reference Metadata in
Euro SDMX Metadata Structure (ESMS). Retrieved from
http://ec.europa.eu/eurostat/cache/metadata/EN/ilc_esms.htm
13. Förster, M., & d’Ercole, M. M. (2009). The OECD approach to
measuring income distribution and poverty: Strengths, limits and
statistical issues. Paper presented at the Joint Organisation for Economic
Co-operation and Development (OECD) / University of Maryland
International Conference on measuring poverty, income inequality, and
social exclusion: Lessons from Europe. Retrieved from
http://umdcipe.org/conferences/oecdumd/conf_papers/Papers/The%20OE
CD%20Approach%20to%20Measuring%20Income%20Distribution%20a
nd%20Poverty.pdf
14. Gupta, P. D. (1978). A general method of decomposing a difference
between two rates into several components. Demography, 15(1), 99-112.
15. Haughton, J., & Khandker, S. R. (2009). Handbook on poverty and
inequality. Washington, DC: The World Bank. Retrieved from
http://web.worldbank.org/WBSITE/EXTERNAL/TOPICS/EXTPOVERT
Y/EXTPA/0,,contentMDK:22405907~pagePK:148956~piPK:216618~the
SitePK:430367,00.html
16. Information Services Department, the Government of the Hong Kong
Special Administrative Region (2016, April 25). Commission on Poverty
Convenes 18th
Meeting in Its Second Term[Press Release〕. Retrieved
from http://www.info.gov.hk/gia/general/201604/25/P201604250909.htm
17. Kamanou, G., Morduch, J., Isidero, D. P., Gibson, J., Ivo, H., & Ward, M.
(2005). Handbook on poverty statistics: Concepts, methods and policy
use. The United Nations Statistics Division. Retrieved from
http://unstats.un.org/unsd/methods/poverty/pdf/UN_Book%20FINAL%2
030%20Dec%2005.pdf
18. Organisation for Economic Co-operation and Development. (2008).
Growing unequal? Income distribution and poverty in OECD countries.
19. Organisation for Economic Co-operation and Development. (2013).
OECD framework for statistics on the distribution of household income,
consumption and wealth. http://dx.doi.org/10.1787/9789264194830-en
20. Organisation for Economic Co-operation and Development. (n.d.). What
are equivalence scales? Retrieved from
http://www.oecd.org/eco/growth/OECD-Note-EquivalenceScales.pdf
21. Oxfam (2012, May). Feasibility Study of Low-income Working Family
Subsidy. Retrieved from
http://www.oxfam.org.hk/content/98/content_12978en.pdf
Hong Kong Poverty Situation Report 2016
References
P. 219
22. Panel on Welfare Services, Legislative Council of the Hong Kong Special
Administrative Region (2009, November 9). Definition of Poverty. LC
Paper No. CB(2)179/09-10(07). Retrieved from
http://www.legco.gov.hk/yr09-10/english/panels/ws/papers/ws1109cb2-
179-7-e.pdf
23. Panel on Welfare Services, Legislative Council of the Hong Kong Special
Administrative Region (2016, January 25). 2016 Policy Address Policy
Initiatives of the Labour and Welfare Bureau. LC Paper No.
CB(2)624/15-16(01). Retrieved from http://www.legco.gov.hk/yr15-
16/english/panels/ws/papers/ws20160125cb2-624-1-e.pdf
24. Panel on Welfare Services, Legislative Council of the Hong Kong Special
Administrative Region (2017, January 26). 2017 Policy Address Policy
Initiatives of the Labour and Welfare Bureau. LC Paper No.
CB(2)666/16-17(01). Retrieved from http://www.legco.gov.hk/yr16-
17/english/panels/ws/papers/ws20170126cb2-666-1-e.pdf
25. Panel on Welfare Services, Legislative Council of the Hong Kong Special
Administrative Region (2017, October 24). 2017 Policy Address Policy
Initiatives of the Labour and Welfare Bureau. LC Paper No. CB(2)35/17-
18(01). Retrieved from http://www.legco.gov.hk/yr17-
18/english/panels/ws/papers/ws20171024cb2-35-1-e.pdf
26. Pittini, A., Ghekière, L., Dijol, J. & Kiss. L. (2015). The State of Housing
in the EU. European Federation of Public, Cooperative and Social
Housing. Retrieved from http://www.housingeurope.eu/resource-468/the-
state-of-housing-in-the-eu-2015
27. Rio Group. (2006). Compendium of best practices in poverty
measurement. Rio de Janeiro. Retrieved from http://www.eclac.org/
publicaciones/xml/3/26593/rio_group_compendium.pdf
28. The 2012-13 Budget (2012, February 1). The Government of the Hong
Kong Special Administrative Region. Retrieved from
https://www.budget.gov.hk/2012/eng/pdf/e_budgetspeech2012-13.pdf
29. The 2013-14 Budget (2013, February 27). The Government of the Hong
Kong Special Administrative Region. Retrieved from
https://www.budget.gov.hk/2013/eng/pdf/e_budgetspeech2013-14.pdf
30. The 2014-15 Budget (2014, February 26). The Government of the Hong
Kong Special Administrative Region. Retrieved from
https://www.budget.gov.hk/2014/eng/pdf/e_budgetspeech2014-15.pdf
31. The 2015-16 Budget (2015, February 25). The Government of the Hong
Kong Special Administrative Region. Retrieved from
http://www.budget.gov.hk/2015/eng/pdf/e_budgetspeech2015-16.pdf
32. The 2016-17 Budget (2016, February 24). The Government of the Hong
Kong Special Administrative Region. Retrieved from
http://www.budget.gov.hk/2016/eng/pdf/e_budgetspeech2016-17.pdf
Hong Kong Poverty Situation Report 2016
References
P. 220
33. The 2017-18 Budget (2017, February 22). The Government of the Hong
Kong Special Administrative Region. Retrieved from
https://www.budget.gov.hk/2017/eng/pdf/e_budgetspeech2017-18.pdf
34. The 2014 Policy Address (2014, January 15). The Government of the
Hong Kong Special Administrative Region. Retrieved from
http://www.policyaddress.gov.hk/2014/eng/pdf/PA2014.pdf
35. The 2015 Policy Address (2015, January 14). The Government of the
Hong Kong Special Administrative Region. Retrieved from
http://www.policyaddress.gov.hk/2015/eng/pdf/PA2015.pdf
36. The 2016 Policy Address (2016, January 13). The Government of the
Hong Kong Special Administrative Region. Retrieved from
http://www.policyaddress.gov.hk/2016/eng/pdf/PA2016.pdf
37. The 2017 Policy Address (2017, January 18). The Government of the
Hong Kong Special Administrative Region. Retrieved from
https://www.policyaddress.gov.hk/jan2017/eng/pdf/PA2017.pdf
38. The Chief Executive’s 2017 Policy Address (2017, October 11). The
Government of the Hong Kong Special Administrative Region. Retrieved
from https://www.policyaddress.gov.hk/2017/eng/pdf/PA2017.pdf
39. The Government of the Hong Kong Special Administrative Region
(2013, September). Hong Kong Poverty Situation 2012. Retrieved from
http://www.povertyrelief.gov.hk/pdf/2012_Poverty_Situation_Eng.pdf
40. The Government of the Hong Kong Special Administrative Region
(2014, November). Hong Kong Poverty Situation 2013. Retrieved from
http://www.povertyrelief.gov.hk/eng/pdf/poverty_report13_rev2.pdf
41. The Government of the Hong Kong Special Administrative Region
(2014, December). Hong Kong Poverty Report on Disability 2013.
Retrieved from
https://www.povertyrelief.gov.hk/eng/pdf/Hong_Kong_Poverty_Situation
_Report_on_Disability_2013(E).pdf
42. The Government of the Hong Kong Special Administrative Region
(2015, October). Hong Kong Poverty Situation 2014. Retrieved from
http://www.povertyrelief.gov.hk/pdf/poverty_report_2014_e.pdf
43. The Government of the Hong Kong Special Administrative Region
(2015, December). Hong Kong Poverty Situation Report on Ethnic
Minorities 2014. Retrieved from
http://www.povertyrelief.gov.hk/eng/pdf/2014_EM_Report_Eng.pdf
44. The Government of the Hong Kong Special Administrative Region
(2016, May). 2015 Study on Earnings Mobility: Information Paper.
Retrieved from
http://www.povertyrelief.gov.hk/pdf/Information%20Paper%20-
%20Bilingual%20-%20Main%20Text%20(25.5.2016).pdf
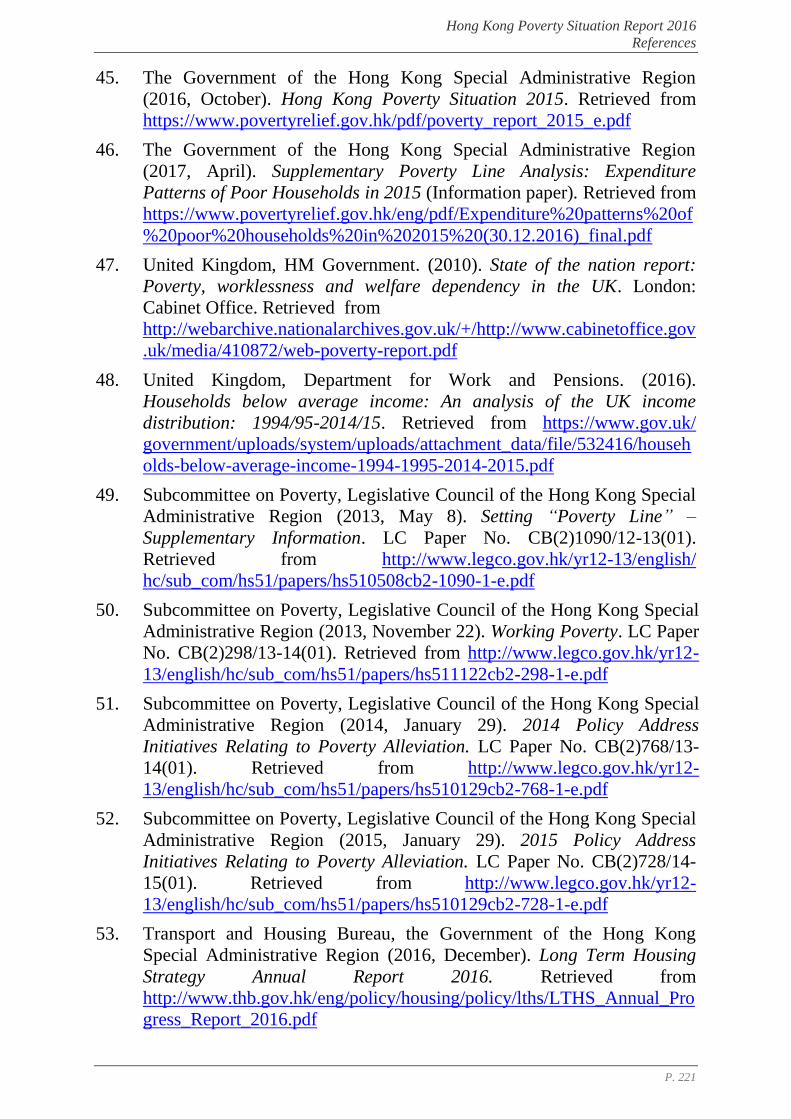
Hong Kong Poverty Situation Report 2016
References
P. 221
45. The Government of the Hong Kong Special Administrative Region
(2016, October). Hong Kong Poverty Situation 2015. Retrieved from
https://www.povertyrelief.gov.hk/pdf/poverty_report_2015_e.pdf
46. The Government of the Hong Kong Special Administrative Region
(2017, April). Supplementary Poverty Line Analysis: Expenditure
Patterns of Poor Households in 2015 (Information paper). Retrieved from
https://www.povertyrelief.gov.hk/eng/pdf/Expenditure%20patterns%20of
%20poor%20households%20in%202015%20(30.12.2016)_final.pdf
47. United Kingdom, HM Government. (2010). State of the nation report:
Poverty, worklessness and welfare dependency in the UK. London:
Cabinet Office. Retrieved from
http://webarchive.nationalarchives.gov.uk/+/http://www.cabinetoffice.gov
.uk/media/410872/web-poverty-report.pdf
48. United Kingdom, Department for Work and Pensions. (2016).
Households below average income: An analysis of the UK income
distribution: 1994/95-2014/15. Retrieved from https://www.gov.uk/
government/uploads/system/uploads/attachment_data/file/532416/househ
olds-below-average-income-1994-1995-2014-2015.pdf
49. Subcommittee on Poverty, Legislative Council of the Hong Kong Special
Administrative Region (2013, May 8). Setting “Poverty Line” –
Supplementary Information. LC Paper No. CB(2)1090/12-13(01).
Retrieved from http://www.legco.gov.hk/yr12-13/english/
hc/sub_com/hs51/papers/hs510508cb2-1090-1-e.pdf
50. Subcommittee on Poverty, Legislative Council of the Hong Kong Special
Administrative Region (2013, November 22). Working Poverty. LC Paper
No. CB(2)298/13-14(01). Retrieved from http://www.legco.gov.hk/yr12-
13/english/hc/sub_com/hs51/papers/hs511122cb2-298-1-e.pdf
51. Subcommittee on Poverty, Legislative Council of the Hong Kong Special
Administrative Region (2014, January 29). 2014 Policy Address
Initiatives Relating to Poverty Alleviation. LC Paper No. CB(2)768/13-
14(01). Retrieved from http://www.legco.gov.hk/yr12-
13/english/hc/sub_com/hs51/papers/hs510129cb2-768-1-e.pdf
52. Subcommittee on Poverty, Legislative Council of the Hong Kong Special
Administrative Region (2015, January 29). 2015 Policy Address
Initiatives Relating to Poverty Alleviation. LC Paper No. CB(2)728/14-
15(01). Retrieved from http://www.legco.gov.hk/yr12-
13/english/hc/sub_com/hs51/papers/hs510129cb2-728-1-e.pdf
53. Transport and Housing Bureau, the Government of the Hong Kong
Special Administrative Region (2016, December). Long Term Housing
Strategy Annual Report 2016. Retrieved from
http://www.thb.gov.hk/eng/policy/housing/policy/lths/LTHS_Annual_Pro
gress_Report_2016.pdf
Hong Kong Poverty Situation Report 2016
References
P. 222
54. Wong Hung (2005, February). Definition and Measurement of Poverty:
Overseas and Local Experience (Chinese version only). LC Paper No.
CB(2)915/04-05(04). Retrieved from http://www.legco.gov.hk/yr04-
05/chinese/hc/sub_com/hs51/papers/hs510223cb2-915-04-c.pdf
55. Wong Yue-chim (2015, October 28). Demystifying Hong Kong’s Poverty
Rate. Hong Kong Economic Journal (Chinese version). English version
retrieved from http://wangyujian.hku.hk/?p=6347&lang=en
56. World Bank. (2005). Introduction to poverty analysis. Retrieved from
http://siteresources.worldbank.org/PGLP/Resources/PovertyManual.pdf
57. World Bank. (n.d.). Choosing and estimating a poverty line. Retrieved
from http://web.worldbank.org/WBSITE/EXTERNAL/TOPICS/
EXTPOVERTY/EXTPA/0,,contentMDK:20242879~menuPK:435055~pa
gePK:148956~piPK:216618~theSitePK:430367~isCURL:Y~isCURL:Y,
00.html
58. Yip, P. S. F., Wong, J. H. K., Li, B. Y. G., Zhang, Y., Kwok, C. L., &
Chen, M. N. (2016). Assessing the impact of population dynamics on
poverty measures: A decomposition analysis. Social Indicators Research.
DOI: http://dx.doi.org/10.1007/s11205-016-1434-y