Presentation to the Hong Kong Institute for Monetary Research Hong Kong, 19 November 2001

HONG KONG INSTITUTE FOR MONETARY RESEARCH
META-ANALYSIS OF CHINESE BUSINESS CYCLE
CORRELATION
Jarko Fidrmuc and Iikka Korhonen
HKIMR Working Paper No.06/2015
March 2015

Hong Kong Institute for Monetary Research
香港金融研究中心
(a company incorporated with limited liability)
All rights reserved.
Reproduction for educational and non-commercial purposes is permitted provided that the source is acknowledged.

Meta-Analysis of Chinese Business Cycle Correlation*
Jarko Fidrmuc**
Zeppelin University Friedrichshafen
and
Iikka Korhonen#
Bank of Finland Institute for Economies in Transition
Hong Kong Institute for Monetary Research
March 2015
Abstract
We summarize previous research on China’s business cycle correlation with other countries with the
help of meta-analysis techniques. We survey 71 related papers along with all the characteristics of the
estimations as well as those of the authors. We confirm that especially Pacific Rim countries have
relatively high business cycle correlation with China. However, it appears that many characteristics of
the studies and authors do influence the reported degree of business cycle synchronization. For
instance, Chinese-language papers report higher correlation coefficients. Despite of this, we do not
detect a robust publication bias in the papers.
Keywords: Business Cycle Synchronization, Meta-Analysis, China.
JEL Classifications: E32, F44
* We wish to thank Weijie Chen and Nanjun Li for collecting and coding the data used in the analysis. We also thank
participants of seminar at the Hong Kong Institute for Monetary Research, University of Jyväskylä and Bank of Finland for useful comments. The latter author wishes to thank Hong Kong Institute for Monetary Research, where he worked on this project.
** Email: [email protected] # Email: [email protected] The views expressed in this paper are those of the authors, and do not necessarily reflect those of the Hong Kong Institute for Monetary Research, its Council of Advisers, or the Board of Directors.

1
Hong Kong Institute for Monetary Research Working Paper No.06/2015
1. Introduction and Motivation
It is almost a truism that China’s economic significance has greatly increased during the recent
decades. This has unsurprisingly generated additional interest in business cycle movements in China
and in the synchronization of the cycles with other countries. In this paper we use meta-analysis
techniques in summarizing research on China’s business cycle correlation with other countries. Meta-
analysis enables one to summarize the findings of previous literature in a systematic way.
We contribute to the literature in several ways. First, we are able to systematically analyze the
consensus view of different countries’ correlation with the Chinese business cycle. Second, we can
discern whether some observable factors related to the authors, methodologies utilized, variables
used etc. affect the reported results.
We surveyed 71 individual papers dealing with China’s business cycle synchronization. All in all,
these papers contained 1894 individual correlation coefficient estimates for China’s business cycle
with other countries’ cycles, as all the papers contained more than one correlation estimate. For many
Asian countries (e.g. Japan, Korea, Malaysia, Philippines, Singapore, Hong Kong) we have nearly
200 observations, while the US and Taiwan are each represented by some 130 observations. For
European countries we have only a small number of observations.
First, we find that correlation coefficients are relatively high and statistically significant for many
countries. This is true both for Asian and non-Asian countries as well as for China’s immediate
neighbors and ASEAN countries. The result confirms China’s eminent position within global and
regional production networks. Furthermore, it is possible that China’s domestic demand is already so
large that it supports exports from many different countries in the region.
Secondly, we find that many attributes related to the publication, authors, methods and variables used,
etc. have a definite effect on the reported correlation coefficients. Based on our preferred estimation
specification, we e.g. observe that the more recent papers are more likely to report higher correlation
coefficients, and that papers that do not have China as a specific focus are more likely to report lower
correlation coefficients.
While it is likely that China’s growing economic size and importance in global supply chains will
increase its business cycle synchronization over the coming years, our results also warn against
relying too much on any single estimate of synchronization. As we are able to show, correlation
coefficients reported in any single study can be influenced by a set of factors.
The paper is structured as follows. In the next section we discuss meta-analysis as a methodology for
summarizing research results. The third section describes our sample, i.e. papers published on the
topic. The fourth section examines possible publication bias in our sample. The fifth section provides

2
Hong Kong Institute for Monetary Research Working Paper No.06/2015
a statistical analysis of the literature on Chinese business cycle correlation, and the sixth section
concludes.
2. Meta-Analysis
Meta-analysis enables one to statistically summarize and aggregate research results on a given topic.
It can be characterized as a systematic literature survey in which all the papers published on a given
topic are given at least some weight in deriving a ‘consensus’ or ‘aggregate’ view on that topic. It is
also a means of assessing how characteristics of the authors, variable specifications, data samples
etc. affect the reported results.
Stanley (2001) identified different stages in carrying out meta-regressions. First, all the relevant
studies are collected in a non-discriminatory manner in order to prevent any distortions from
publication selection. Second, the resulting sample is specified in terms of dependent and
independent variables. Our independent variable is the correlation coefficient between an economic
indicator’s cyclical movements in China and in another country. Some of the independent variables
are dummy variables representing theoretical background, data dimension, author affiliations,
construction of variables, and publication format. After the tracking down and coding of relevant
factors from the research papers is completed, a researcher can present e.g. statistics on the
variables and run the actual meta-regressions.
While meta-analysis has a long history e.g. in medicine and engineering, its use in economics is
relatively new. In principle, all empirical studies that reports estimates of some economic phenomena
or variable can be summarized with the help of meta-analysis. For example, and related to the issue
at hand, Fidrmuc and Korhonen (2006) conducted meta-analysis on papers assessing the business
cycle correlation of the new EU countries with the euro area. They found that the degree of correlation
differs substantially between the countries, but also that e.g. researchers’ affiliations clearly affect the
reported correlation coefficients. For example, when researchers were affiliated with one of the central
banks of the new EU countries, their reported correlation coefficients were lower on average. In a
related study, Rose (2008) conducted meta-analysis on papers assessing the link between business
cycle correlation and trade. His assessment of the literature is that increased trade links lead to higher
business cycle correlation.
As noted, any empirical estimates can be summarized this way, including money demand (e.g. Knell
and Stix, 2005), the link between financial liberalization and growth (Bumann et al., 2012), alcohol’s
price and income elasticities (Nelson, 2013), misalignment of the renminbi (Korhonen and Ritola,
2011) and so on.

3
Hong Kong Institute for Monetary Research Working Paper No.06/2015
3. Literature on China’s Business Cycle Synchronization
As mentioned earlier, recent years have witnessed the publication of several papers related to
China’s business cycle synchronization with other countries. In this section we first discuss some
broad trends in this strand of literature and then present out dataset, i.e. the 74 related papers that we
have surveyed.
3.1 Recent Papers
One can divide papers that assess papers dealing with China’s business cycle synchronization in
many ways. For example, there are several papers dealing with a large selection of countries and
their pair-wise business cycle correlation in the Asia-Pacific region. On the other hand, some papers
focus more specifically on China’s business cycle synchronization with other countries (and do not
consider those countries’ synchronization with each other). In a paper that is aimed more broadly at
business cycle synchronization in the Asia-Pacific region, Kim et al. (2011) calculate average
correlation coefficients for many groupings of countries, and find, for example, that the cyclical
component of GDP in the East Asian emerging countries (excluding China) had an average
correlation of 0.62 with the G7 countries before the financial crisis, but they also report individual
countries’ correlation coefficients with China. Gong and Kim (2013) calculate all the pair-wise
correlations for output movements among 13 countries in the Asia-Pacific region, and then explain
these correlations in terms of both bilateral trade and financial linkages between countries. They find
that stronger links are associated with higher observed business cycle synchronization. On the other
hand, Wang (2011) looks at business cycle synchronization from the Chinese perspective, and
calculates several measures of GDP growth correlation of China with Taiwan.
3.2 Meta Dataset and Meta Statistics
We started our project by collecting papers on China’s business cycle correlation from a variety of
economics paper depositories. Sources and key words used in the search are depicted in greater
detail in Appendix A. Our sample consists of 31 papers in English and 40 in Chinese, published
between 2000 and 2013. A full listing of the studies can be found in Appendix B.
We decided to include also papers not yet published in journals, to get a more complete picture of the
literature. Tables 1 and 2 give some descriptive statistics for our sample. It should be noted that a
paper will usually have correlation coefficients for many different countries vis-à-vis China, but often
also many correlation coefficients per country, calculated for different indicators and sometimes based
on different methodologies; hence the total number of observations is several times the number of
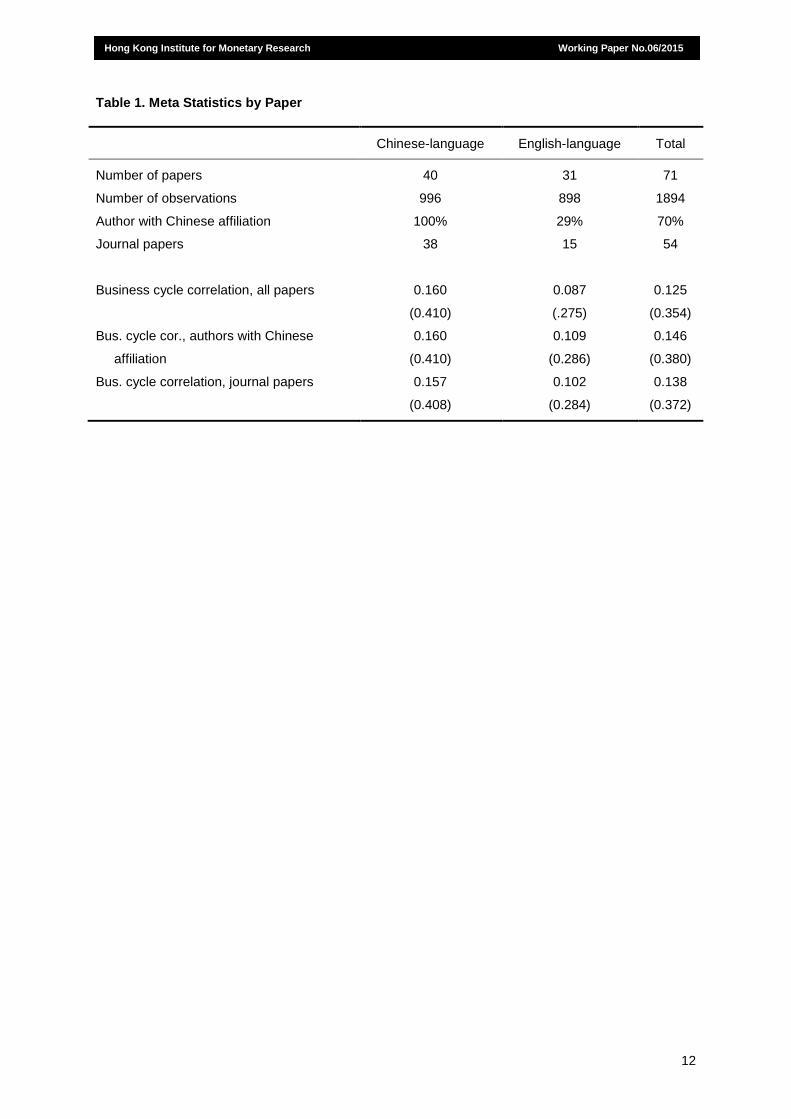
papers. We also observe that the total number of observations is very different across countries. For
China’s larger Asian neighbors as well as the US, each each country is represented by 140 to 200
observations; there are much fewer observations for each of the smaller ASEAN countries. Perhaps

4
Hong Kong Institute for Monetary Research Working Paper No.06/2015
somewhat surprising is the very small number of observations for European countries as well as
Australia and New Zealand.
Figure 1, in turn, depicts the evolution in the number of papers published on China’s business cycle
synchronization over time. It should be noted that we take into account only the most recent version of
a given paper, i.e. if it has been published in a journal, earlier working paper versions are ignored in
our analysis. We can observe that by 2004 and 2005 there were several papers appearing annually
on the topic, and by 2009-2012 the number was again much higher. As our cut-off date for collecting
data was mid-2013, the smaller number for 2013 should not be interpreted as a sudden drop in
interest on the topic.
4. Funnel Plots and Publication Bias
4.1 Funnel Plots
The meta statistics have already revealed some differences among analyses of business cycle
synchronization with China; those published in Chinese versus English, those by authors having
versus not having Chinese affiliation. The analysis of economic policy issues is likely to be subject to
general expectations. This may lead to an unintended publication bias if authors, reviewers and
publishers follow their preferences for statistically strong, significant and theoretically expected results.
Moreover, general expectations for results as well as corresponding publication biases may differ as
between different countries or regions.
Publication bias is a term often used also for other types of selection bias that lead to estimates that
are asymmetrically distributed around a hypothetical effect. It can be visually detected by the so called
a funnel plot, which is a scatter diagram displaying a quality indicator (e.g. inverse standard errors
pointing to the precision of the estimates) against the estimated effect. If publication bias is
insignificant, the funnel plot should look like an inverted funnel and the estimates should vary
symmetrically around the true effect. The estimates that are close to the true effect should be
characterized by the highest quality indicator (precision). Similarly, the worse estimates should be
located in the lower part of the chart. In contrast, if publication selection leads to an
overrepresentation of significant results in the sample, the funnel plot becomes asymmetric and
excessively wide. Thus, the funnel plots are an intuitive but subjective tool for detecting publication
bias. Moreover, asymmetries can also arise due to different factors (e.g. omitted variables, estimation
techniques), and they may be wrongly attributed to the publication bias (Stanley, 2005).
Bearing in mind these limitations, we examine the funnel plots for the reported degree of international
business cycle synchronization, which are displayed in Figure 2. The precision (y-axis) is usually
defined as the inverse standard error. For correlation coefficients, standard errors are not available,
but they can be proxied by the inverse number of observations. Therefore, we use the number of
observations to measure the quality of publications. Moreover, the underlying degree of business

5
Hong Kong Institute for Monetary Research Working Paper No.06/2015
cycle synchronization can differ by country. Therefore, we present funnel plots by country or relatively
small region, if only a few observations are available.
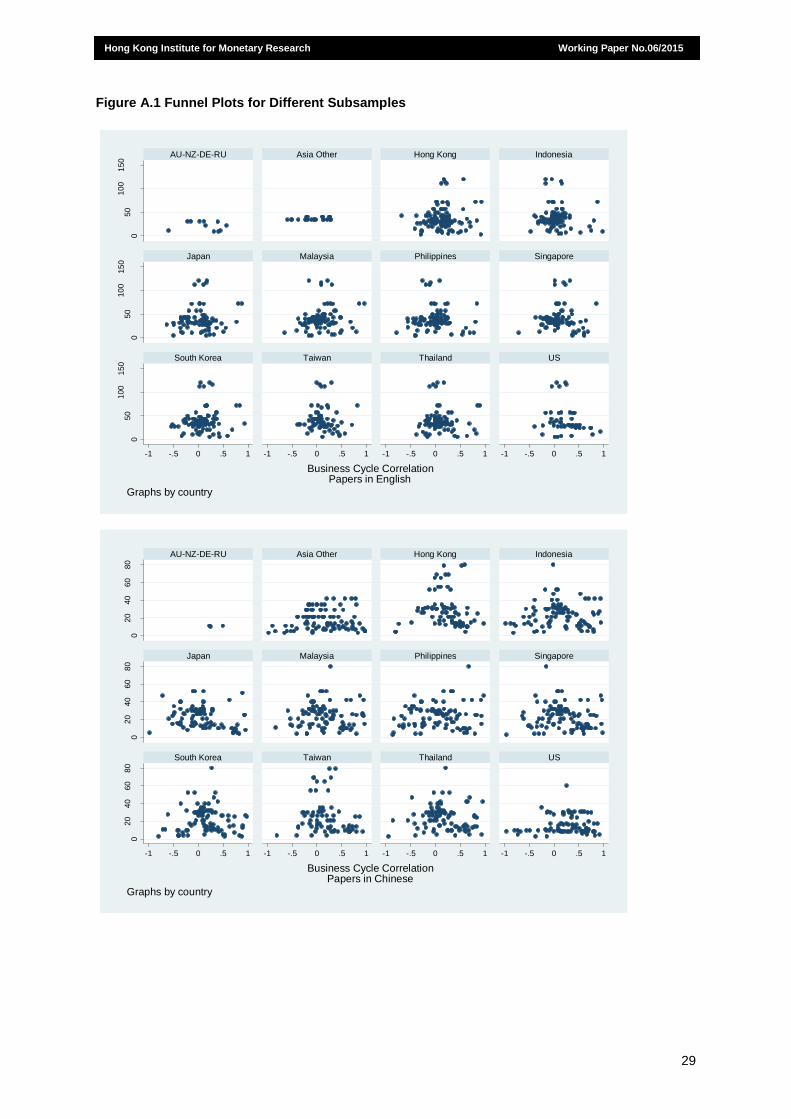
Actually, Figure 2 reveals some fairly important asymmetries, especially for papers which were
published in Chinese (see Figure A.1 in the appendix). Less asymmetries can be found for papers
published by authors of whom at least one had a Chinese affiliation. However, the English-language
papers also generate some atypically shaped funnel plots. The most important such asymmetries
appear to relate to Hong Kong and other countries in Southeastern Asia.
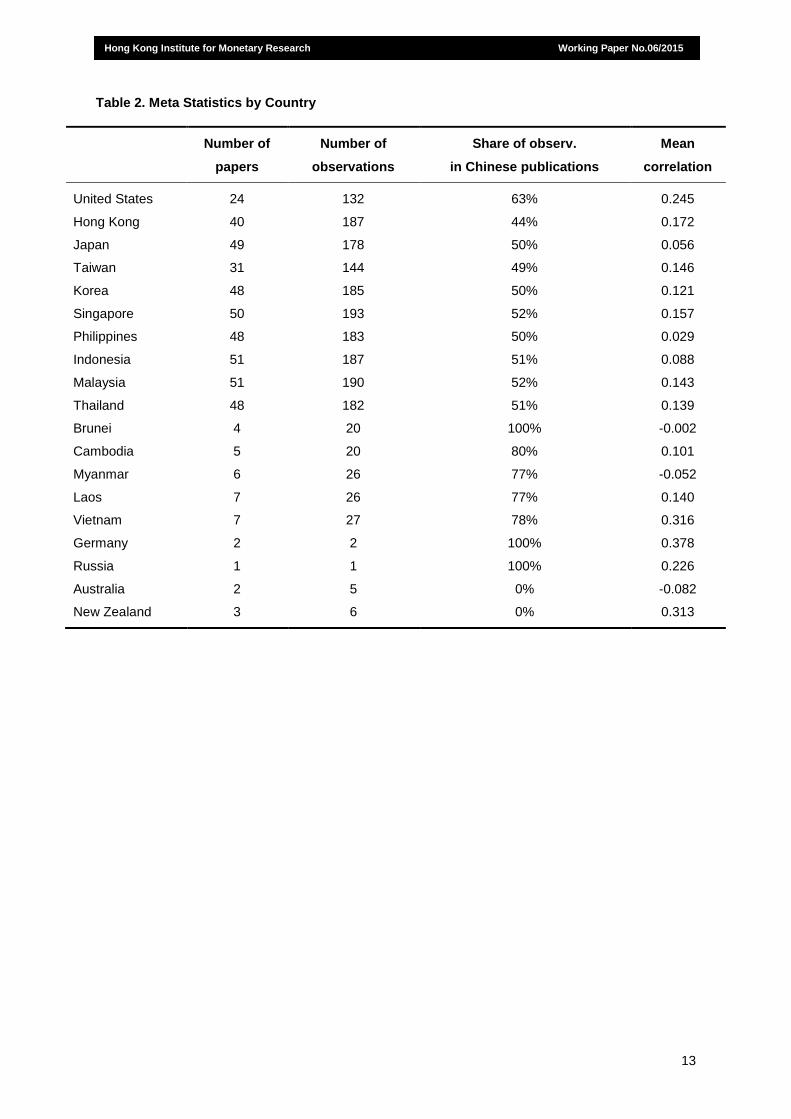
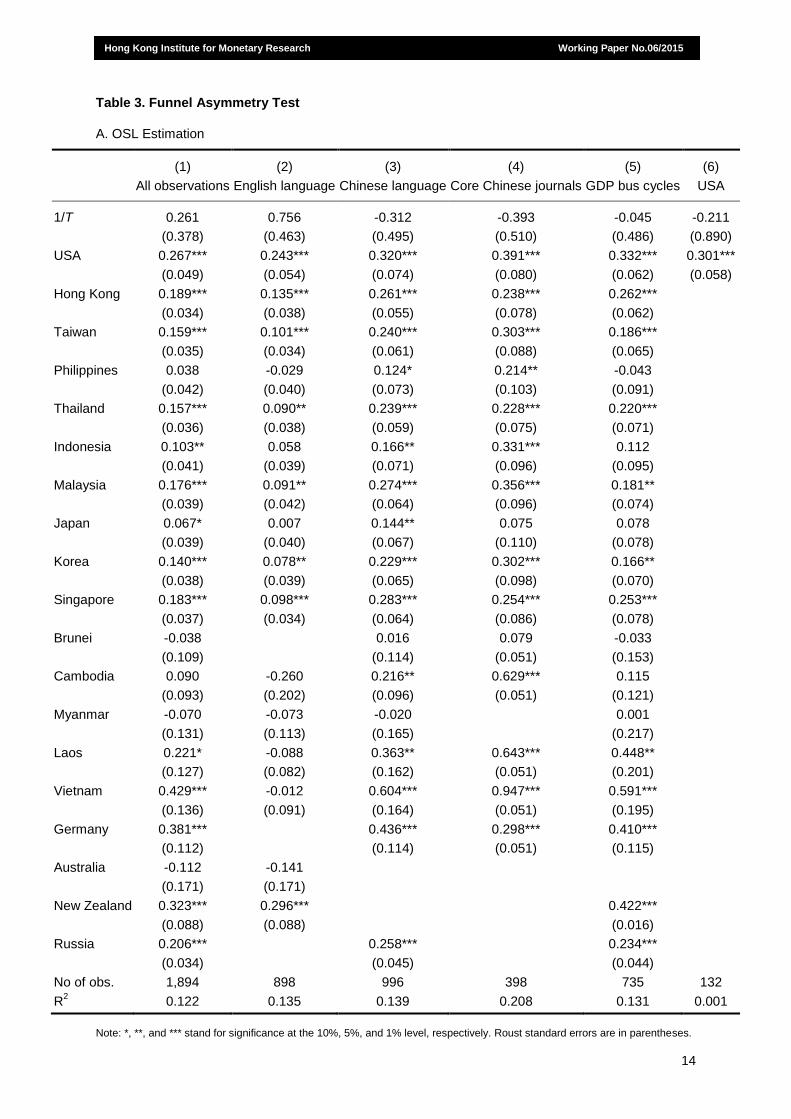
4.2 Funnel Asymmetry Test
However, a visual examination of the funnel plots is often not conclusive for detecting asymmetry. To
test the symmetry more formally, we employ the funnel asymmetry test (FAT), which is based on the
simple meta-regression of available effects and corresponding standard errors (Card and Krueger,
1995; Ashenfelter, Harmon and Oosterbeek, 1999):
(
) ̃
(1)
where the reported correlation coefficients ρij have been transformed by Fisher transformation.1 The
quality of the individual reported correlation coefficients is again proxied by the inverse number of
observations, T. The country effect, ̃, is the reported estimate of the country-specific underlying
degree of business cycle synchronization, that is the so-called “true” effect, while 1/T gives the so-
called publication bias. If the estimates are distributed symmetrically around the true effect, ̃, then
the coefficient should not significantly differ from zero. If, however, there is a tendency to report
certain parameter values or significant results, would be significant and the publication bias would
be proportional to 1/T. Thus, the publication selection can be detected through the relationship
between reported effects and the analyzed number of observations in the individual studies.
Following Egger, Smith, Scheider and Minder (1997), we test null hypothesis = 0 using the standard
and weighted versions of the FAT test. Rejection of the null confirms the presence of publication bias
(presence of asymmetry). For estimation we use a fixed-effects model with robust standard errors.
While the funnel plots reveal some asymmetries, Table 3 shows that all test specifications, except for
the weighted regressions, fail to reject the null of no publication bias. The same result is obtained if
we include only correlations based on GDP or only correlations with the US. Thus, no publication bias
1 This is done to ensure that there are no problems arising from the fact that correlation coefficient is bounded between -1
and 1. Transformed coefficients are not bounded, and the raw correlation coefficients and transformed coefficients are nearly identical if the absolute value of the correlation coefficient is less than 0.5. In a robustness check we also repeat the estimation with the simple correlation coefficients. Results are very similar, so none of our results depend on our use of the Fisher transformation.

6
Hong Kong Institute for Monetary Research Working Paper No.06/2015
is robustly revealed for the previous literature on business cycles in China and the selected countries.
This should lend more credibility to the individual country correlations estimated in the next section.
5. Meta-Regressions and Results
5.1 Baseline Meta-Regression
In this section we employ meta-regressions to assess the degree of China’s business-cycle
synchronization with other countries. In these regressions we are able to control many objective
factors as well as characteristics related to the individual studies and their authors. Most of the
variables are included in the form of binary dummies. We can separate these control variables into
four groups.
1) Variables related to each publication: In this group we include publication year, whether the
paper was published in a Chinese non-core journal, whether in a journal, whether the focus is
solely on China’s business-cycle correlation with other countries, number of other-than-China
countries included in the analysis, and number of years covered by the paper’s data sample.
2) Variables related to authors: In this group we include dummies for at least one of the authors
having affiliation in China as well as with a central bank.
3) Variables related to empirical methodology: In this group we include dummies for simple
correlations in time series models, Blanchard-Quah decomposition, and different filters such
as Hodrick-Prescott.
4) Variables related to the indicator of business-cycle synchronization: In this group we include
dummies for GDP, industrial production, supply and demand shocks, and inflation.
The majority of explanatory variables are dummy variables, taking the value one if the specified
criterion is fulfilled and zero otherwise. All other variables (e.g., publication year, number of
observations, and number of analyzed countries) are demeaned.
Our empirical strategy is as follows. We estimate the following equation, where the reported
correlation coefficients ρij have again been transformed via Fisher transformation,
(
) ̃ ∑
(2)

7
Hong Kong Institute for Monetary Research Working Paper No.06/2015
Country dummy ̃ gives the average correlation coefficient for country i, controlling for analyzed K
factors (e.g. publication year, variable, methodology, sample size, frequency, author affiliation, journal
or not) in publication j. These dummies can be taken as the underlying level of synchronization of the
Chinese business cycle with the other economies.
In practice we perform OLS analysis in several steps. We always included the country-fixed effects,
but at first added control variables only one group at a time. We report our regression results in Table
4, where the first four columns show results for including control variables related to publication,
authors, methodology and variables, respectively. We only report statistically significant coefficients.
After this, the fifth column displays our preferred specification, where we include all the control
variables that we were significant in the four previous specifications.
Our model selection strategy is based on the general-to-specific approach. First, we include all
variables related to the papers. We see that the number of available years (obsydm) and the year of
publication (ydm),2 as well as publication not focused on China (noncn), have significant and negative
effects on the reported degree of business-cycle synchronization. The remaining characteristics have
no significant impact. In particular, publication in journals has no clear effect, but publications in
Chinese core journals (jcn) has a robust positive effect on the results. Potentially the most interesting
finding is that the reported level of business-cycle synchronization reveals a time trend. The
publications tend to report correlation levels that are higher each succeeding year, by about 2
percentage points, or by 0.1 after a decade.
In the second step, we include the explanatory variables describing authors’ characteristics.
Publications in Chinese language (cnlang) are found to report higher degrees of business-cycle
correlation, Similarly, Chinese journals (jcn) tend to publish results reporting higher degrees of
business-cycle synchronization. In turn, no such effect is found for Chinese authors in general.
Authors affiliated with the central bank reported somewhat smaller correlations of business cycles,
albeit this effect does not seem to be robust. Somewhat surprisingly, journals (except for core
Chinese journals) have no significant effects on reported levels of correlation. Master thesis (but not
PhD thesis) may have a positive but not sufficiently robust influence.
Next, we include characteristics describing the methods of analysis. We see that time series models
(tser) are positively and robustly related to the reported results. Finally, we include characteristics
describing the definition of analyzed variables. This shows that inflation and demand shocks (note
that demand shocks are estimated via decomposition of GDP growth and inflation) have robust
negative impacts on the degree of business-cycle synchronization.
In the last step, we include only those variables which were significant at least at the 10% level in the
individual analysis. We drop one by one the least significant variable. Thus we proceed to the final
2 Number of available years seems to be a better explanatory variable than the number of observations. Similarly, the year
of publication has more informative power than the last year of analyzed data.

8
Hong Kong Institute for Monetary Research Working Paper No.06/2015
specification, showing that the degree of business-cycle synchronization is determined mainly by the
characteristics related to the methods and variable definition, number of years, and non-Chinese
focus of the publication. Chinese journals are confirmed to have a positive bias on published
correlation levels. This variable is more robust than Chinese-language publications3 or publications of
authors with at last one Chinese affiliation.
Finally, we present country-fixed effects in the second part of Table 4. Most interestingly, there are
surprisingly small differences between the individual country effects, which are positive and significant
for all countries with the exception of Brunei and Myanmar. According to the preferred specification,
the highest level of business-cycle synchronization is found for Vietnam and New Zealand; however,
only a few studies (7 and 3 papers, respectively) are available for these countries. Not surprisingly, a
comparable level of correlation is reported especially for Hong Kong, Singapore, Taiwan, but also for
the USA. Thus, the findings for meta regression reject the popular decoupling hypothesis (see Kose
et al., 2012).
5.2 Robustness Checks
Tables 5 to 7 show results for our robustness checks. First, we use weighted regression, using the
number of observations in the underlying studies as weights. The idea here is that studies with more
observations are perhaps somewhat more reliable, ceteris paribus. Second, we use median
regression as an alternative estimation methodology. This means that instead of minimizing the sum
of squared residuals as in OLS, median regression minimizes the sum of absolute residuals. This
reduces the effect of large outliers on the estimated coefficients. Third, robust regression uses Cook’s
distance measure to underweight the largest outliers. And fourth, we include random effects for
individual studies to account for the possible remaining cross-sectional dependence between
observations in the same study.
We see that the explanatory variables remain similar to those in our preferred specification. Most
importantly, the dummy for publications in the core Chinese journals (jcn) is no longer significant in
models designed to deal with outliers, that is, in the median regression, robust regression, and the
regression with studies’ random effects. This implies that the positive bias found for publications in the
core Chinese journals is mainly because of a few outlier studies.
Country-fixed effects change only slightly from the previous preferred specification, which is also
reported in the first column (Table 5). In fact, the correlation for country-fixed effects is over 0.9.
In the next sensitivity exercise, we use only results based on GDP correlations. Correspondingly, a
dummy for inflation cannot be used in this specification. Moreover, no data are available for Australia.
Year of publication is again the most important determinant of the reported level of business-cycle
3 Note that our data set includes one English-language publication in a core Chinese journal.

9
Hong Kong Institute for Monetary Research Working Paper No.06/2015
correlation, but its impact is smaller.
Finally, we include only the level of business-cycle synchronization with the US. Although this country
dominates the literature, the number of observations becomes relatively small (132 reported
correlation coefficients). As before, the time trend in the literature is the most important determinant of
business-cycle synchronization. Moreover, its coefficient is even larger than in the previous analysis
(up to 4 percentage points per year).
5.3 Discussion of Results
We mention two interesting finding from our analysis. First, the previous literature devoted much
attention to the so-called decoupling hypothesis. While this hypothesis has been widely accepted in
the literature, we show that the available body of evidence actually rejects this hypothesis, at least for
China. In particular, we can see that China’s business-cycle correlations with other countries have
increased over the years. On average, each year the reported correlation increases by about 1.5-3
percentage points, possibly even more if the US is considered.
Second, we find a significant publication differences between Chinese and other publications.
However, we show that this bias can be attributed more readily to the Chinese media (originating
mainly from the core Chinese journals) than to Chinese authors. In particular, there seems to be no
publication bias in English language publications of authors having affiliations in China. Moreover, the
differences seem to be mainly due to a few studies (outliers).
6. Conclusions
We have reviewed recent literature on China’s business-cycle synchronization with other countries
with the help of meta-analysis techniques. We make several contributions. First, we compare English
and Chinese language literature and display some differences between these literature streams.
Second, we observe that, on average, China’s business-cycle synchronization with its neighbors in
the Asia-Pacific region is relatively high, whatever the variable used. Moreover, business-cycle
synchronization with the US is also high, speaking against the so-called decoupling hypothesis. For
example, in comparison with estimates for business-cycle correlation between the euro area and the
new EU countries (Fidrmuc and Korhonen, 2006), Asian business-cycle synchronization seems
relatively high for many countries On the other hand, the scarcity of observations for European
countries is somewhat surprising.
Third, we were able to ascertain that many factors related to the studies and their authors have a
clear effect on the reported correlation coefficients. For example, studies that do not have a specific
China-focus report consistently lower correlation coefficients. Also using inflation data results in lower
correlation coefficients.

10
Hong Kong Institute for Monetary Research Working Paper No.06/2015
To conclude, our results also warn against accepting results from any single study without some
caution, as many factors can influence the reported correlation coefficient. Nevertheless, it is clear
that China’s business-cycle correlations with other countries – especially those in Asia and the US –
are already relatively high and are increasing.

11
Hong Kong Institute for Monetary Research Working Paper No.06/2015
References
Bumann, S., N. Hermes and R. Lensink (2012), “Financial Liberalization and Economic Growth: A
Meta-Analysis,” Technical Report, London: EPPI-Centre, Social Science Research Unit,
Institute of Education, University of London.
Fidrmuc, J. and I. Korhonen (2006), “Meta-Analysis of the Business Cycle Correlation between the
Euro Area and the CEECs,” Journal of Comparative Economics, 34: 518-37.
Kim, S., J-W. Lee and C.-Y. Park (2011), “Emerging Asia: Decoupling or Recoupling,” The World
Economy, 34: 23-53.
Knell, M. and H. Stix (2005), “The Income Elasticity of Money Demand: A Meta Analysis of Empirical
Results,” Journal of Economic Surveys, 19: 513-33.
Korhonen, I. and M. Ritola (2011), “Renminbi Misaligned - Results from Meta-Regressions,” in Y.W.
Cheung and G. Ma, eds., Asia and China in the Global Economy, Singapore: World Scientific.
Kose, M. A., C. Otrok and E. Prasad (2012), “Global Business Cycles: Convergence or Decoupling?”
International Economic Review, 53(2): 511–38. doi:10.1111/j.1468-2354.2012.00690.x.
Nelson, J. P. (2013), “Meta-Analysis of Alcohol Price and Income Elasticities - with Corrections for
Publication Bias,” Health Economics Review, 3(17).
http://www.healteconomicsreview.com/content/3/1/17.
Rose, A. K. (2008), “Is EMU becoming an Optimum Currency Area? The Evidence on Trade and
Business Cycle Synchronization,” mimeo.
Stanley, T. D. (2001), “Wheat from Chaff: Meta-Analysis as Quantitative Literature Review,” Journal of
Economic Perspectives, 15: 131-50.
Stanley, T. D. (2005), “Beyond Publication Bias,” Journal of Economic Surveys, 19: 309-45.
Wang, H. (2011), “Study on the Co-movement of Business Cycles of Both Sides across the Taiwan
Strait,” (海峡两岸经济周期协动性的现状与趋势), International Economics and Trade Research,
27: 33-9.
12
Hong Kong Institute for Monetary Research Working Paper No.06/2015
Table 1. Meta Statistics by Paper
Chinese-language English-language Total
Number of papers 40 31 71
Number of observations 996 898 1894
Author with Chinese affiliation 100% 29% 70%
Journal papers 38 15 54
Business cycle correlation, all papers 0.160 0.087 0.125
(0.410) (.275) (0.354)
Bus. cycle cor., authors with Chinese 0.160 0.109 0.146
affiliation (0.410) (0.286) (0.380)
Bus. cycle correlation, journal papers 0.157 0.102 0.138
(0.408) (0.284) (0.372)
13
Hong Kong Institute for Monetary Research Working Paper No.06/2015
Table 2. Meta Statistics by Country
Number of
papers
Number of
observations
Share of observ.
in Chinese publications
Mean
correlation
United States 24 132 63% 0.245
Hong Kong 40 187 44% 0.172
Japan 49 178 50% 0.056
Taiwan 31 144 49% 0.146
Korea 48 185 50% 0.121
Singapore 50 193 52% 0.157
Philippines 48 183 50% 0.029
Indonesia 51 187 51% 0.088
Malaysia 51 190 52% 0.143
Thailand 48 182 51% 0.139
Brunei 4 20 100% -0.002
Cambodia 5 20 80% 0.101
Myanmar 6 26 77% -0.052
Laos 7 26 77% 0.140
Vietnam 7 27 78% 0.316
Germany 2 2 100% 0.378
Russia 1 1 100% 0.226
Australia 2 5 0% -0.082
New Zealand 3 6 0% 0.313
14
Hong Kong Institute for Monetary Research Working Paper No.06/2015
Table 3. Funnel Asymmetry Test
A. OSL Estimation
(1) (2) (3) (4) (5) (6)
All observations English language Chinese language Core Chinese journals GDP bus cycles USA
1/T 0.261 0.756 -0.312 -0.393 -0.045 -0.211
(0.378) (0.463) (0.495) (0.510) (0.486) (0.890)
USA 0.267*** 0.243*** 0.320*** 0.391*** 0.332*** 0.301***
(0.049) (0.054) (0.074) (0.080) (0.062) (0.058)
Hong Kong 0.189*** 0.135*** 0.261*** 0.238*** 0.262***
(0.034) (0.038) (0.055) (0.078) (0.062)
Taiwan 0.159*** 0.101*** 0.240*** 0.303*** 0.186***
(0.035) (0.034) (0.061) (0.088) (0.065)
Philippines 0.038 -0.029 0.124* 0.214** -0.043
(0.042) (0.040) (0.073) (0.103) (0.091)
Thailand 0.157*** 0.090** 0.239*** 0.228*** 0.220***
(0.036) (0.038) (0.059) (0.075) (0.071)
Indonesia 0.103** 0.058 0.166** 0.331*** 0.112
(0.041) (0.039) (0.071) (0.096) (0.095)
Malaysia 0.176*** 0.091** 0.274*** 0.356*** 0.181**
(0.039) (0.042) (0.064) (0.096) (0.074)
Japan 0.067* 0.007 0.144** 0.075 0.078
(0.039) (0.040) (0.067) (0.110) (0.078)
Korea 0.140*** 0.078** 0.229*** 0.302*** 0.166**
(0.038) (0.039) (0.065) (0.098) (0.070)
Singapore 0.183*** 0.098*** 0.283*** 0.254*** 0.253***
(0.037) (0.034) (0.064) (0.086) (0.078)
Brunei -0.038 0.016 0.079 -0.033
(0.109) (0.114) (0.051) (0.153)
Cambodia 0.090 -0.260 0.216** 0.629*** 0.115
(0.093) (0.202) (0.096) (0.051) (0.121)
Myanmar -0.070 -0.073 -0.020 0.001
(0.131) (0.113) (0.165) (0.217)
Laos 0.221* -0.088 0.363** 0.643*** 0.448**
(0.127) (0.082) (0.162) (0.051) (0.201)
Vietnam 0.429*** -0.012 0.604*** 0.947*** 0.591***
(0.136) (0.091) (0.164) (0.051) (0.195)
Germany 0.381*** 0.436*** 0.298*** 0.410***
(0.112) (0.114) (0.051) (0.115)
Australia -0.112 -0.141
(0.171) (0.171)
New Zealand 0.323*** 0.296*** 0.422***
(0.088) (0.088) (0.016)
Russia 0.206*** 0.258*** 0.234***
(0.034) (0.045) (0.044)
No of obs. 1,894 898 996 398 735 132
R2 0.122 0.135 0.139 0.208 0.131 0.001
Note: *, **, and *** stand for significance at the 10%, 5%, and 1% level, respectively. Roust standard errors are in parentheses.

15
Hong Kong Institute for Monetary Research Working Paper No.06/2015
Table 3. Continued
B. Weighted Least Squares
(7) (8) (9) (10) (11) (12)
All observations
English language
Chinese language
Core Chinese journals
GDP bus cycles
USA
1/T 0.659** -0.292 0.327 1.760*** 0.767** 1.038
(0.321) (0.526) (0.438) (0.525) (0.388) (0.854)
USA 0.226*** 0.221*** 0.288*** 0.224*** 0.245*** 0.211***
(0.033) (0.040) (0.057) (0.069) (0.040) (0.042)
Hong Kong 0.180*** 0.196*** 0.208*** 0.169*** 0.230***
(0.033) (0.049) (0.042) (0.064) (0.049)
Taiwan 0.119*** 0.129*** 0.154*** 0.125** 0.137***
(0.028) (0.037) (0.043) (0.061) (0.039)
Philippines 0.037 0.005 0.144* 0.072 -0.072
(0.040) (0.040) (0.084) (0.098) (0.094)
Thailand 0.134*** 0.130*** 0.192*** 0.064 0.121**
(0.036) (0.048) (0.058) (0.056) (0.049)
Indonesia 0.081** 0.069* 0.153** 0.125* 0.033
(0.034) (0.038) (0.064) (0.073) (0.055)
Malaysia 0.171*** 0.164*** 0.233*** 0.220*** 0.113*
(0.041) (0.054) (0.064) (0.072) (0.061)
Japan 0.041 0.070 0.049 -0.041 -0.007
(0.038) (0.047) (0.065) (0.086) (0.068)
Korea 0.137*** 0.142*** 0.188*** 0.197** 0.131***
(0.033) (0.042) (0.054) (0.078) (0.045)
Singapore 0.146*** 0.129*** 0.225*** 0.104* 0.163**
(0.034) (0.035) (0.070) (0.062) (0.067)
Brunei -0.033 -0.015 -0.136*** -0.062
(0.081) (0.083) (0.052) (0.108)
Cambodia 0.008 -0.230 0.138* 0.414*** 0.047
(0.092) (0.202) (0.079) (0.052) (0.082)
Myanmar -0.036 -0.031 -0.004 0.050
(0.076) (0.112) (0.102) (0.116)
Laos 0.087 -0.057 0.209* 0.428*** 0.285**
(0.085) (0.080) (0.119) (0.052) (0.141)
Vietnam 0.335*** 0.018 0.557*** 0.732*** 0.604***
(0.111) (0.092) (0.133) (0.052) (0.158)
Germany 0.350*** 0.382*** 0.083 0.340***
(0.111) (0.114) (0.052) (0.114)
Australia -0.147 -0.102
(0.106) (0.109)
New Zealand 0.269*** 0.311*** 0.395***
(0.097) (0.102) (0.013)
Russia 0.170*** 0.200*** 0.160***
(0.029) (0.040) (0.035)
No of obs. 1,894 898 996 398 735 132
R2 0.134 0.140 0.154 0.196 0.162 0.010
Note: *, **, and *** stand for significance at the 10%, 5%, and 1% level, respectively. Roust standard errors are in parentheses.

16
Hong Kong Institute for Monetary Research Working Paper No.06/2015
Table 4. Meta Regression, Model Selection
(1) (2) (3) (4) (5)
publication author method variable preferred
obsydm -0.002**
(0.001)
nocntrdm -0.008
(0.007)
ydm 0.025*** 0.022***
(0.003) (0.003)
phd 0.017
(0.099)
thesis 0.130*
(0.070)
journal 0.045
(0.038)
jcn 0.054* 0.085***
(0.027) (0.029)
wp -0.025
(0.045)
noncn -0.081* -0.132***
(0.039) (0.037)
west 0.011
(0.017)
Chinese 0.024
(0.022)
cnlang 0.092***
(0.014)
univ -0.052
(0.033)
cbank -0.125**
(0.046)
quarterly -0.006
(0.020)
cor 0.064
(0.038)
tser 0.219** 0.186***
(0.087) (0.063)
bandq 0.066
(0.058)
filter 0.095
(0.071)
gdp -0.005
(0.029)
indprod 0.097
(0.072)
demand -0.067**
(0.031)
supply -0.008
(0.028)
infl -0.274*** -0.170***
(0.049) (0.047)

17
Hong Kong Institute for Monetary Research Working Paper No.06/2015
Table 4. Continued (Country Effects)
(1) (2) (3) (4) (5)
publication author method variable preferred
USA 0.196*** 0.263*** 0.208*** 0.290*** 0.285***
(0.055) (0.036) (0.049) (0.019) (0.019)
Hong Kong 0.240*** 0.204*** 0.136** 0.231*** 0.308***
(0.043) (0.036) (0.050) (0.021) (0.027)
Taiwan 0.192*** 0.167*** 0.106* 0.196*** 0.251***
(0.043) (0.036) (0.051) (0.021) (0.025)
Philippines 0.086** 0.046 -0.018 0.077*** 0.144***
(0.037) (0.036) (0.050) (0.021) (0.032)
Thailand 0.202*** 0.163*** 0.101* 0.196*** 0.261***
(0.037) (0.036) (0.049) (0.021) (0.031)
Indonesia 0.148*** 0.110*** 0.048 0.142*** 0.207***
(0.037) (0.036) (0.049) (0.021) (0.031)
Malaysia 0.223*** 0.181*** 0.119** 0.214*** 0.280***
(0.036) (0.036) (0.049) (0.021) (0.031)
Japan 0.112*** 0.075** 0.010 0.107*** 0.172***
(0.037) (0.035) (0.048) (0.021) (0.029)
Korea 0.184*** 0.149*** 0.086* 0.181*** 0.247***
(0.037) (0.036) (0.049) (0.021) (0.030)
Singapore 0.230*** 0.189*** 0.128** 0.223*** 0.287***
(0.036) (0.036) (0.049) (0.021) (0.030)
Brunei -0.037 -0.077* -0.082* -0.007 0.021
(0.032) (0.038) (0.044) (0.026) (0.025)
Cambodia 0.120*** 0.066* 0.038 0.125*** 0.184***
(0.029) (0.036) (0.044) (0.022) (0.032)
Myanmar -0.040 -0.088** -0.118** -0.032 0.021
(0.029) (0.037) (0.044) (0.023) (0.028)
Laos 0.248*** 0.203*** 0.173*** 0.259*** 0.307***
(0.030) (0.037) (0.044) (0.023) (0.028)
Vietnam 0.451*** 0.411*** 0.382*** 0.467*** 0.511***
(0.030) (0.037) (0.043) (0.023) (0.027)
Germany 0.366*** 0.342*** 0.249*** 0.411*** 0.344***
(0.038) (0.038) (0.073) (0.029) (0.033)
Australia 0.056 -0.008 -0.161*** -0.081*** 0.079**
(0.033) (0.042) (0.045) (0.012) (0.036)
New Zealand 0.481*** 0.419*** 0.272*** 0.350*** 0.510***
(0.032) (0.039) (0.044) (0.013) (0.036)
Russia 0.189*** 0.166*** 0.011 0.235*** 0.117**
(0.040) (0.038) (0.087) (0.029) (0.051)
No of observations 1,894 1,894 1,894 1,894 1,894
R2 0.174 0.134 0.125 0.132 0.174
Note: *, **, and *** stand for significance at the 10%, 5%, and 1% level, respectively. Roust standard errors are in parentheses.

18
Hong Kong Institute for Monetary Research Working Paper No.06/2015
Table 5. Robustness Analysis – Methods
(1) (2) (3) (4) (5) (6) CFE WLS REML MR RR SRE
ydm 0.022*** 0.022*** 0.022*** 0.016*** 0.017*** 0.026*** (0.003) (0.004) (0.004) (0.003) (0.003) (0.006) jcn 0.085*** 0.015 0.084*** 0.027 0.018 0.039 (0.029) (0.024) (0.027) (0.022) (0.020) (0.055) noncn -0.132*** -0.189*** -0.141*** -0.123*** -0.155*** -0.154*** (0.037) (0.037) (0.027) (0.026) (0.021) (0.052) tser 0.186*** 0.232** 0.191*** 0.102 0.090* -0.039 (0.063) (0.101) (0.068) (0.074) (0.050) (0.067) infl -0.170*** -0.153*** -0.169*** -0.117*** -0.143*** -0.190*** (0.047) (0.053) (0.063) (0.033) (0.047) (0.027) USA 0.285*** 0.348*** 0.292*** 0.096 0.104 0.162*** (0.019) (0.025) (0.043) (0.197) (0.347) (0.045) Hong Kong 0.308*** 0.353*** 0.313*** 0.067 0.061 0.202*** (0.027) (0.027) (0.039) (0.193) (0.346) (0.027) Taiwan 0.251*** 0.277*** 0.258*** -0.000 -0.000 0.145*** (0.025) (0.024) (0.042) (0.196) (0.347) (0.031) Philippines 0.144*** 0.219*** 0.154*** -0.052 -0.094 0.025 (0.032) (0.033) (0.041) (0.196) (0.346) (0.039) Thailand 0.261*** 0.315*** 0.271*** -0.005 0.004 0.140*** (0.031) (0.033) (0.041) (0.194) (0.346) (0.023) Indonesia 0.207*** 0.260*** 0.215*** -0.040 -0.045 0.090** (0.031) (0.033) (0.041) (0.193) (0.346) (0.044) Malaysia 0.280*** 0.349*** 0.287*** -0.001 -0.004 0.163*** (0.031) (0.033) (0.040) (0.194) (0.346) (0.023) Japan 0.172*** 0.221*** 0.177*** -0.028 -0.093 0.054* (0.029) (0.032) (0.040) (0.194) (0.346) (0.030) Korea 0.247*** 0.323*** 0.256*** 0.003 -0.008 0.144*** (0.030) (0.033) (0.041) (0.194) (0.346) (0.028) Singapore 0.287*** 0.325*** 0.296*** 0.014 0.041 0.171*** (0.030) (0.032) (0.040) (0.194) (0.346) (0.026) Brunei 0.021 0.108*** 0.016 -0.148 -0.141 -0.021 (0.025) (0.030) (0.105) (0.207) (0.354) (0.058) Cambodia 0.184*** 0.184*** 0.193* 0.008 0.025 0.130** (0.032) (0.034) (0.105) (0.225) (0.354) (0.064) Myanmar 0.021 0.143*** 0.048 -0.160 -0.185 -0.016 (0.028) (0.032) (0.093) (0.215) (0.352) (0.081) Laos 0.307*** 0.265*** 0.312*** -0.049 -0.067 0.258* (0.028) (0.032) (0.093) (0.224) (0.352) (0.154) Vietnam 0.511*** 0.510*** 0.522*** 0.221 0.262 0.467*** (0.027) (0.032) (0.091) (0.273) (0.352) (0.115) Germany 0.344*** 0.387*** 0.346 0.324* 0.187 0.267*** (0.033) (0.060) (0.327) (0.194) (0.420) (0.044) Australia 0.079** 0.111*** 0.085 -0.215 -0.147 -0.050** (0.036) (0.035) (0.204) (0.279) (0.378) (0.020) New Zealand 0.510*** 0.523*** 0.516*** 0.284 0.277 0.384*** (0.036) (0.035) (0.186) (0.226) (0.373) (0.072) Russia 0.117** 0.128 0.122 (0.051) (0.108) (0.463) Constant 0.208 0.248 0.160*** (0.194) (0.346) (0.045) No of observations 1,894 1,894 1,894 1,894 1,894 1,894 R
2 0.174 0.205 - 0.046
a 0.128 0.076
b
Note: CFE – country fixed effects panel regression. REML – Residual Maximum Likelihood. MR – median regression, RR - Cook's Distance Robust Regression, SRE – study random effects regression. a – Pseudo R
2, b – overall R
2.

19
Hong Kong Institute for Monetary Research Working Paper No.06/2015
Table 6. Robustness Analysis – GDP Business Cycle
(1) (2) (3) (4) (5) (6) CFE WLS REML MR RR SRE
ydm 0.030*** 0.023*** 0.029*** 0.029*** 0.030*** 0.035*** (0.006) (0.005) (0.008) (0.007) (0.006) (0.006) jcn 0.129** 0.069 0.129** 0.019 0.028 0.036 (0.051) (0.052) (0.051) (0.046) (0.041) (0.072) noncn -0.050 -0.134*** -0.058 -0.151*** -0.149*** -0.091 (0.050) (0.040) (0.048) (0.043) (0.038) (0.062) tser 0.213* 0.263** 0.216 0.290 0.263 0.157*** (0.119) (0.118) (0.208) (0.184) (0.167) (0.056) USA 0.284*** 0.333*** 0.291*** 0.324* 0.318 0.262*** (0.064) (0.050) (0.071) (0.188) (0.481) (0.056) Hong Kong 0.295*** 0.362*** 0.299*** 0.338* 0.342 0.317*** (0.070) (0.055) (0.076) (0.189) (0.482) (0.037) Taiwan 0.196*** 0.255*** 0.207** 0.239 0.256 0.233*** (0.068) (0.049) (0.090) (0.196) (0.484) (0.045) Philippines -0.068 0.034 -0.059 -0.061 -0.066 -0.045 (0.095) (0.092) (0.083) (0.193) (0.483) (0.081) Thailand 0.191** 0.225*** 0.203** 0.224 0.267 0.210*** (0.085) (0.061) (0.082) (0.190) (0.482) (0.042) Indonesia 0.088 0.139** 0.096 0.132 0.143 0.111 (0.097) (0.066) (0.082) (0.193) (0.483) (0.113) Malaysia 0.161** 0.218*** 0.168** 0.174 0.169 0.184*** (0.077) (0.068) (0.080) (0.190) (0.482) (0.042) Japan 0.059 0.093 0.061 0.099 0.081 0.048 (0.087) (0.073) (0.076) (0.190) (0.482) (0.060) Korea 0.136* 0.234*** 0.143* 0.248 0.160 0.158*** (0.073) (0.054) (0.076) (0.189) (0.481) (0.046) Singapore 0.236*** 0.272*** 0.247*** 0.251 0.260 0.258*** (0.090) (0.072) (0.078) (0.189) (0.482) (0.035) Brunei -0.071 0.039 -0.082 0.040 0.028 0.037 (0.155) (0.100) (0.154) (0.225) (0.494) (0.067) Cambodia 0.101 0.162** 0.110 0.158 0.164 0.194*** (0.116) (0.076) (0.172) (0.234) (0.498) (0.039) Myanmar -0.018 0.158 0.014 0.071 0.024 0.088 (0.232) (0.105) (0.148) (0.223) (0.493) (0.084) Laos 0.416** 0.390*** 0.427*** 0.327 0.250 0.508*** (0.201) (0.122) (0.148) (0.223) (0.493) (0.171) Vietnam 0.556*** 0.705*** 0.576*** 0.741*** 0.766 0.652*** (0.202) (0.152) (0.144) (0.220) (0.492) (0.163) Germany 0.269*** 0.317*** 0.272 0.324*** 0.309 0.303*** (0.078) (0.080) (0.410) (0.094) (0.558) (0.019) New Zealand 0.509*** 0.584*** 0.516 0.597*** 0.573 0.511*** (0.050) (0.041) (0.554) (0.183) (0.658) (0.026) Russia -0.014 0.039 -0.007 (0.124) (0.122) (0.596) Constant 0.013 0.035 0.069 (0.184) (0.480) (0.048) No of observations 735 735 735 735 735 735 R
2 0.160 0.194 - 0.081
a 0.158 0.070
b
Note: CFE – country fixed effects panel regression. REML – Residual Maximum Likelihood. MR – median regression, RR - Cook's Distance Robust Regression, SRE – study random effects regression. a – Pseudo R
2, b – overall R
2.

20
Hong Kong Institute for Monetary Research Working Paper No.06/2015
Table 7. Robustness Analysis – Business Cycle Synchronization with the US
(1) (2) (3) (4) (5) (6)
OLS WLS REML MR RR SRE
ydm 0.035** 0.020* 0.035* 0.042* 0.045*** 0.038**
(0.017) (0.011) (0.018) (0.022) (0.016) (0.017)
jcn 0.203 0.025 0.203* 0.032 0.050 0.209
(0.132) (0.103) (0.110) (0.134) (0.097) (0.147)
noncn 0.207 -0.027 0.205* 0.115 0.060 0.216
(0.128) (0.097) (0.113) (0.138) (0.099) (0.146)
tser -0.307** -0.263** -0.313 -0.190 -0.289 -0.310**
(0.123) (0.119) (0.297) (0.295) (0.254) (0.152)
Constant 0.093 0.247*** 0.094 0.166 0.219*** 0.077
(0.116) (0.090) (0.095) (0.116) (0.083) (0.128)
Observations 132 132 132 132 132 132
R-squared 0.056 0.032 - 0.031a 0.071 0.056
b
Note: OLS – ordinary least squares. REML – Residual Maximum Likelihood. MR – median regression, RR - Cook's Distance Robust Regression, SRE – study random effects regression. a – Pseudo R
2, b – overall R
2.

21
Hong Kong Institute for Monetary Research Working Paper No.06/2015
Figure 1. Number of Publications by Year
Figure 2. Funnel Plots by Country
Note: AU-NZ-DE-RU – Australia, New Zealand, Germany, and Russia. Other Asia - Brunei, Laos, Vietnam, Myanmar, and Cambodia.
0
1
2
3
4
5
6
7
8
9
10
11
2000 2001 2002 2003 2004 2005 2006 2007 2008 2009 2010 2011 2012 2013
Workingpaper
Journal
05
01
00
15
0
05
01
00
15
0
05
01
00
15
0
-1 -.5 0 .5 1 -1 -.5 0 .5 1 -1 -.5 0 .5 1 -1 -.5 0 .5 1
AU-NZ-DE-RU Asia Other Hong Kong Indonesia
Japan Malaysia Philippines Singapore
South Korea Taiwan Thailand US
no
of o
bs
Business Cycle CorrelationAll Observations
Graphs by country

22
Hong Kong Institute for Monetary Research Working Paper No.06/2015
Appendix A. How the Data were Collected
The Chinese-language papers were collected from 中国知网4 (CNKI, www.cnki.net), which is the
largest publication database online in China. Other databases such as 万 方 数 据
(www.wanfangdata.com.cn) and 维普 (www.cqvip.com) were also searched, with results that were
similar and no additional papers were found.
Chinese-language papers were further divided into those published in a ‘Chinese core journal’ and
others. A list of the official ‘Chinese core journals’ is published by Peking University Library every four
years.5 Each publication was examined to see whether it belongs to that time’s core list. For instance,
a paper published in 2007, will be checked against the core journal list published in 2004.
The key-word searches were the following:
东亚 经济周期 协动 中国
East Asia Business cycle Synchronisation China
货币联盟 经济一体化 东盟 同步性
Monetary Union Economic integration ASEAN Co-movement
English-language papers were searched in Google Scholar, IDEAS and ScienceDirect. Key words
included: business cycle, correlation, Asian monetary union, SVAR, China, sychronisation, co-
movement, and different variations of those.
4 中国知网 literally means China Knowledge Net.
5 The list compilation is based on impact factors and other criteria.

23
Hong Kong Institute for Monetary Research Working Paper No.06/2015
Appendix B. Surveyed Studies (Ordered First by Language and then by Publication Year)
Papers in Chinese
Xue, J. (薛敬孝), Zhang, B. (张兵), (2001), 论东亚地区经济周期的同期性与非同期性 . Nankai
Economic Research (南开经济研究), Vol 4.
Tan, Q. (谭庆华), (2002), 对东亚货币一体化的再考察:一个基于经济冲击相关性的实证研究. World
Economic Forum (世界经济文汇), Vol 6.
Li, X. (李心丹), Liu, Y. (刘瑛), Liu, T. (刘铁军), (2003), 中国内地和香港能否构成最优货币区研究——来
自实证结果的分析. Fudan Journal (复旦学报), Vol 5.
Wan, Z. (万志宏), (2003), 从宏观经济对称性看东亚地区汇率合作的基础. Nankai Economic Research
(南开经济研究), Vol 3 No. 15.
Li, X. (李晓洁), (2004), 亚洲货币联盟可行性研究——东亚实际产出波动的冲击分析. Journal of Finance
and Economics (财经研究), Vol 30 No. 16.
Ren, Z. (任志祥), Song, Y. (宋玉华), (2004), 中外产业内贸易与经济周期协动性的关系研究. Statistical
Research (统计研究), Vol 5.
Du, Q. (杜群阳), Song, Y. (宋玉华), (2005), 东亚经济周期与次区域经济周期存在性检验. International
Trade Issues (国际贸易问题), Vol 8.
He, W. (何问陶), Huang, Y. (黄莹), (2005), 人民币与港澳货币一体化的可行性分析. China Opening
Herald (开放导报), Vol 3.
Li, X. (李晓), Ding, Y. (丁一兵), (2006), 经济冲击对称性与区域经济合作:东亚与其他区域的比较研究.
Jilin University Journal Social Sciences Edition (吉林大学社会科学学报), Vol 146 No. 14.
Sun, T. (孙天琦), Zhang, J. (张军), (2006), 东亚国家(地区)经济周期比较分析(1965-2004). Xi’an
Finance (西安金融), Vol 5.
Zhang, B. (张兵), (2006), 中美经济周期的同步性及其传导机制分析. World Economy Study (世界经济
研究), Vol 10.

24
Hong Kong Institute for Monetary Research Working Paper No.06/2015
Cheng, C. (程传海), (2007), 东亚经济周期协动的研究. Asian Economy (亚太经济), Vol 3.
Cui, X. (崔晓燕), Wang, S. (王少平), (2007), 东亚最适度通货区的经济可行性研究——一个经济冲击对
称性的视角. Financial Research (金融研究), Vol 1.
Cui, X. (崔晓燕), Yang, Y. (杨玉波), Wang, S. (王少平), (2007), 东亚货币一体化的再考察:
一个多变量的结构 VAR 方法. Journal of Zhongnan University of Economics and Law (中南财经政法大
学学报), 1003- 5230 (2007) 01-0051- 08.
Yu, X. (喻旭兰), (2007), 经济周期同步性与东亚金融合作的可行性研究. Economy Study (经济研究),
Vol 10.
Yu, X. (喻旭兰), (2008), 中国与东盟国家经济周期同步性的实证分析. Journal of Guangzhou University
(广州大学学报), Vol 7 No. 2.
Huang, M. (黄梅波 ), Xiong, A. (熊爱宗 ), (2009), 东亚经济冲击对称性分析与东亚货币合作 .
International Trade Issues (国际贸易问题), Vol 9.
Li, X. (李星), (2009), 美国经济周期对中国经济周期的影响研究. Hunan University.
Li, X. (李星), (2009), 中美两国经济周期同步性研究 . The Theory and Practice of Finance and
Economics (财经理论与实践), Vol 30 No. 159.
Peng, S. (彭斯达), Chen, J. (陈继勇), (2009), 中美经济周期的协动性研究: 基于多宏观经济指标的综合
考察. World Economy (世界经济), Vol 2.
Shi, Z. (石柱鲜), Huang, H. (黄红梅), Deng, C. (邓创), (2009), 贸易对中日韩经济周期协同性的影响研
究. Northeast Asian Forum (东北亚论坛), Vol 18 No. 4.
Wu, W. (吴宛珊), (2009), 中国与东亚经济周期的协动性和传导机制研究.
Cai, H. (蔡宏波), (2010), 区域货币合作的经济基础: 东亚和欧洲国家的比较. World Economy Study (世
界经济研究), No 7.
Fang, J. (方建春), Du, Q. (杜群阳), (2010), 中国与东亚经济周期的协动性研究. Northern Economy (宏
观经济), Vol 7.

25
Hong Kong Institute for Monetary Research Working Paper No.06/2015
Sun, Y. (孙阳), (2010), 贸易模式、贸易密度与经济周期协动性.
Zhang, L. (张蕾), (2010), 基于经济冲击对称性分析的中国—东盟货币合作新思考. Shanghai Finance
(上海金融), Vol 3.
Du, Q. (杜群阳), Zhu, J. (朱剑光), (2011). 产业内贸易对东亚经济周期协动性影响的实证研究 .
International Trading Issues (国际贸易问题), Vol 12.
Gao, M. (高美玲), (2011), 非线性锁模的经济周期同步性及传导机制问题研究. Seeker (求索), Vol 12.
Shen, J. (沈骥), Cao, X. (曹星), (2011), 中美两国经济周期协动性分析. Economy and Management (经
济与管理), Vol 25 No. 12.
Wang, X. (王星懿), (2011), 中外经济周期波动特征及其协动关系的比较研究. HU Foreign Economic
Relations & Trade (黑龙江对外经贸), Vol 11.
Xu, Y. (徐妍), (2011), 中、日、美经济周期同步性初探. Financial Forum (金融论坛), PBOC, Xining.
Yang, X. (杨湘波), Tu, S. (涂守才), Yuan, L. (袁乐平), (2011), 大陆与台湾经济周期的同步性实证研究.
Commercial Research (商业研究), Vol 412.
Zhang, Y. (张昱), Tian, X. (田兴), (2011), 深化中国——东盟区域金融合作的可行性条件经济周期同步
性研究. Research on Economics and Management (经济与管理研究), (2012)01-0069-08.
An, H. (安辉), Zhao, Q. (赵清), (2012), 基于经济冲击对称性的东亚货币合作研究. Forecasting (预测),
Vol 31 No. 3.
Cai, X. (蔡彤娟), Sun, J. (孙瑾), (2012), 中国-东盟货币合作的经济基础——基于经济冲击对称性的
VAR分析. Asia Pacific Economy (亚太经济), Vol 6.
Shi, J. (石建勋), Zhong, J. (钟建飞), Li, H. (李海英), (2012), 外部供需冲击视角下的东亚货币合作可行
性研究. Journal of Finance and Economics (财经研究), Vol 38 No. 3.
Wang, Y. (王悦), (2012), 东亚新兴经济体经济周期特征分析. Asia Pacific Economy (亚太经济), Vol 5.
Yang, Y. (杨音), (2012), 中日印经济协动性及其影响因素研究. China Securities and Future (中国证券
期货), Vol 10.

26
Hong Kong Institute for Monetary Research Working Paper No.06/2015
Zhang, S. (张素芹), (2012), 亚洲货币合作的经济基础——基于冲击来源的分析. Modern Management
Science (现代管理科学), Vol 7.
Shi, J. (石建勋), Guan, Q. (官沁), Li, H. (李海英), (2013), 人民币成为“两岸四地”主导货币的实证研究.
Research on Financial and Economic Issues (财经问题研究), Vol 1.
Papers in English
Madden, G., Savage, A., (2000), Assessing the Economic Preconditions for a Yen Bloc. Australian
Economic Papers, Vol. 39, issue 1, pp. 25-32.
Choe, J., (2001), An impact of economic integration through trade: on business cycles for 10 East
Asian countries. Journal of Asian Economics, Vol. 12, pp. 569-586.
Ling, H., (2001), Optimum Currency Areas in East Asia: A Structural VAR Approach. ASEAN
Economic Bulletin, Vol. 18:2, pp. 206-217.
Zhang, Z., Sato, K., McAleer, M., (2001), Is East Asia An Optimum Currency Area? Working paper,
National University of Singapore, Singapore.
Ng, T., (2002), Should the Southeast Asian Countries Form a Currency Union? The Developing
Economics, Vol XL:2, pp. 113-134.
Sung, Y., (2004), An optimum currency area in East Asia: feasibility, coordination, and leadership role.
Journal of Asian Economics, Vol. 15, pp. 153-169.
Zhang, Z., Sato, K., McAleer, M., (2004), Is a monetary union feasible for East Asia? Applied
Economics, Vol. 36, pp. 1031-1043.
Sato, K., Zhang, Z., McAleer, M., (2005), Towards an East Asian Monetary Union: An Econometrics
Analysis of Shocks. Working paper, School of Accounting, Finance and Economics & FIMARC,
Edith Cowan University, Joondalup.
Zhang, J., Lan, Y., (2005), Is East Asia suitable for a Monetary Union? Working Papers Centre for
European Studies Fudan University.
Zhang, Z., Sato, K., (2005), Wither Currency Union in Greater China? Working paper, School of
Accounting, Finance and Economics & FIMARC, Edith Cowan University, Joondalup.

27
Hong Kong Institute for Monetary Research Working Paper No.06/2015
Ahn, C., Kim, H., Chang, D., (2006), Is East Asia Fit for an Optimum Currency Area? An Assessment
of the Economic Feasibility of a Higher Degree of Monetary Cooperation in East Asia. The
Developing Economies, Vol. XLIV:3, pp. 288-305.
Genberg, H., Liu, L., Jin, X., (2006), Hong Kong’s business cycle synchronisation with Mainland China
and the US. Hong Kong Monetary Authority Quarterly Bulletin, Sep 2006.
Huang, Y., Guo, F., (2006), Is currency union a feasible option in East Asia? A multivariate structural
VAR approach. Research in International Business and Finance, Vol. 20, pp. 77-94.
Kumakura, M., (2006), Trade and business cycle co-movements in Asia-Pacific. Journal of Asian
Economics, Vol. 17, pp. 622-645.
Lew, Y., Ku, A.T.L., (2006), Are Countries of Association of Southeast Asia Nations (ASEAN)
Candidates of Optimum Currency Area for Optimum Currency Area for Monetary Union? A
Structural VAR Approach. Review of Applied Economics, Vol. 2, No. 2, pp. 217-228.
Rana, P., (2006), Economic Integration in East Asia: Trends, Prospects, and a Possible Roadmap.
Working Paper Series on Regional Economic Integration, No. 2, Asian Development Bank.
Tang, H., (2006), An Asian Monetary Union? CAMA Working Paper Series, Centre for Applied
Macroeconomic Analysis, the Australian National University, April 2006.
Xu, X., (2006), A currency union for Hong Kong and Mainland China? Journal of International Money
and Finance, Vol. 25, pp. 894-911.
He, D., Cheung, L., Chang, J., (2007), Sense and Nonsense on Asia’s Export Dependency and the
Decoupling Thesis. Working paper, Hong Kong Monetary Authority.
Rüffer, R., Sánchez, M., Shen, J., (2007), Emerging Asia’s Growth and integration: How Autonomous
are Business Cycles? Working paper No. 715, European Central Bank, Frankfurt am Main.
Bacha, O.I., (2008), A common currency area for ASEAN? Issues and feasibility. Applied Economics,
Vol. 40, pp. 515-529.
Khai, V., (2009), Re-examining Symmetry of Shocks for East Asia: Results Using a VAR with Sign
Restrictions. Discussion paper, Institute of Economic Research, Hitotsubashi University, Tokyo.
Moneta, F., Rüffer, R., (2009), Business Cycle Synchronisation in East Asia. Journal of Asian
Economics, Vol. 20, pp. 1-12.

28
Hong Kong Institute for Monetary Research Working Paper No.06/2015
Sato, K., Zhang, Z., McAleer, M., (2009), Identifying Shocks in Regionally Integrated East Asian
Economies with Structural VAR and Block Exogeneity. Mathematics and Computers in
Simulation, Vol. 81, issue 7, pp. 1353-1364.
Genberg, H., Siklos, P., (2010), Revisiting the shocking aspects of Asian monetary unification. Journal
of Asian Economics, Vol. 21, pp. 445-455.
Kim, S., Lee, J., Park, C., (2011), Emerging Asia: Decoupling or Recoupling. Conference on
International Linkages. Tokyo.
Takeuchi, F., (2011), The role of production fragmentation in international business cycle
synchronization in East Asia. Journal of Asian Economics, Vol. 22, pp. 441-459.
He, D., Liao, W., (2012), Asian Business Cycle Synchronization. Pacific Economic Review, Vol.
17, pp. 106-135.
Kim, S., Lee, J., (2012), Real and Financial Integration in East Asia. Review of International
Economics, Vol. 20, pp. 332-349.
Lee, H., Koh, G., (2012), The prospects of a monetary union in East Asia. Economic Modelling, Vol.
29, pp. 96-102.
Fidrmuc, J., Korhonen, I., Batorova, I., (2013), China in the World Economy: Dynamic Correlation
Analysis of Business Cycles. CESifo Economic Studies, Vol. 59:2, pp. 392-411.
29
Hong Kong Institute for Monetary Research Working Paper No.06/2015
Figure A.1 Funnel Plots for Different Subsamples
05
01
00
15
0
05
01
00
15
0
05
01
00
15
0
-1 -.5 0 .5 1 -1 -.5 0 .5 1 -1 -.5 0 .5 1 -1 -.5 0 .5 1
AU-NZ-DE-RU Asia Other Hong Kong Indonesia
Japan Malaysia Philippines Singapore
South Korea Taiwan Thailand US
no
of o
bs
Business Cycle CorrelationPapers in English
Graphs by country
02
04
06
08
00
20
40
60
80
02
04
06
08
0
-1 -.5 0 .5 1 -1 -.5 0 .5 1 -1 -.5 0 .5 1 -1 -.5 0 .5 1
AU-NZ-DE-RU Asia Other Hong Kong Indonesia
Japan Malaysia Philippines Singapore
South Korea Taiwan Thailand US
no
of o
bs
Business Cycle CorrelationPapers in Chinese
Graphs by country

30
Hong Kong Institute for Monetary Research Working Paper No.06/2015
Note: AU-NZ-DE-RU – Australia, New Zealand, Germany, and Russia. Other Asia - Brunei, Laos, Vietnam, Myanmar, and Cambodia.
05
01
00
05
01
00
05
01
00
-1 -.5 0 .5 1 -1 -.5 0 .5 1 -1 -.5 0 .5 1 -1 -.5 0 .5 1
AU-NZ-DE-RU Asia Other Hong Kong Indonesia
Japan Malaysia Philippines Singapore
South Korea Taiwan Thailand US
no
of o
bs
Business Cycle CorrelationCore Chinese Journals
Graphs by country
05
01
00
15
0
05
01
00
15
0
05
01
00
15
0
-1 -.5 0 .5 1 -1 -.5 0 .5 1 -1 -.5 0 .5 1 -1 -.5 0 .5 1
AU-NZ-DE-RU Asia Other Hong Kong Indonesia
Japan Malaysia Philippines Singapore
South Korea Taiwan Thailand US
no
of o
bs
Business Cycle CorrelationAuthors with a Chinese Affiliation
Graphs by country