Hong Kong, 24 February 2014 - TCL Com · Smartphones & tablets will be the growth driver 8 ....
28
2013 TCL COMMUNICATION TECHNOLOGY HOLDINGS LIMITED (02618.HK) 2013 Annual Results Presentation Hong Kong, 24 February 2014
Transcript of Hong Kong, 24 February 2014 - TCL Com · Smartphones & tablets will be the growth driver 8 ....

2013
TCL COMMUNICATION TECHNOLOGY HOLDINGS LIMITED (02618.HK) 2013 Annual Results Presentation Hong Kong, 24 February 2014

AGENDA
BUSINESS REVIEW & OUTLOOK
FINANCIAL HIGHLIGHTS
Q & A
2

BUSINESS REVIEW & OUTLOOK
3

•Sales volume: 55.2 million units, up 30% YoY (including 17.6 million smartphone units, up 169% YoY)
•Revenue: HK$ 19.4 billion, up 61% YoY
•Full Year Net Profit: HK$ 316 million
•Q4 Net Profit: HK$ 302 million (Record high)
•Basic EPS/(LPS): Increased to 27.50 HK cents from -18.49 HK cents YoY
•Proposed Final Dividend: 10 HK cents
2013 ANNUAL RESULTS
2013 OVERVIEW
•Ranked the 5th global handset manufacturer and was No. 1 among Chinese handset players in Q4 (Source: Gartner)
•Delivered breakthrough in smartphone transition. Smartphone sales accounted for one-third of total sales by volume ratifying the successful transition from feature phones to smartphones
•Product mix continued to improve. Newly launched advanced smartphones were well received in markets. Achieving economy of scale in smartphone sales volume drove up margins since Q2
•Smooth relocation of world-class global manufacturing facility in Q3 with maximum annual capacity of 100-120 millions units for paving the future growth
BUSINESS OVERVIEW
4

INDUSTRY RANKING NO. 5 GLOBAL HANDSET MANUFACTURER, NO. 1 CHINESE PLAYER
RANK COMPANY Q4 2013 SHIPMENTS (M UNITS)
Q4 2013 MARKET SHARE (%)
QoQ GROWTH RATE (%)
YoY GROWTH RATE (%)
1 Samsung 119.2 24.3 +1.8 +11.5
2 Nokia 63.6 13.0 +0.8 -25.3
3 Apple 50.2 10.2 +65.6 +15.6
4 LG 18.4 3.7 +1.8 +22.6
5 TCL-ALCATEL 17.6 3.6 +32.0 +58.3
6 Huawei 17.3 3.5 +27.7 +26.7
7 ZTE 16.3 3.3 +19.1 +1.0
8 Lenovo 13.6 2.8 +4.2 +63.2
9 Sony 10.4 2.1 +6.4 +30.6
10 Coolpad 8.4 1.7 -4.4 +36.2
Others 155.3 31.8 +0.2 -1.8
TOTAL 490.3 100.0 +7.6 +3.9
TOP-10 CELL PHONE BRANDS IN Q4 OF 2013 (Source: Gartner) (RANKING BY UNIT SHIPMENTS IN MILLIONS)
5
•Gartner: TCL Communication has strong relationship with carriers, especially in LATAM; it also had success in EMEA with its launch of new products.

INDUSTRY RANKING NO.10 GLOBAL SMARTPHONE MANUFACTURER
TOP-10 SMARTPHONE BRANDS IN Q4 OF 2013 (Source: Gartner) (RANKING BY UNIT SHIPMENTS IN MILLIONS)
6
RANK COMPANY
Q4 2013 Q4 2013 QoQ YoY
SHIPMENTS MARKET SHARE GROWTH RATE GROWTH RATE
(M UNITS) (%) (%) (%)
1 Samsung 83.3 29.5 +3.7 +29.2
2 Apple 50.2 17.8 +65.6 +15.6
3 Huawei 16.1 5.7 +37.6 +85.3
4 Lenovo 12.9 4.6 +0.1 +63.1
5 LG 12.8 4.5 +6.4 +59.5
6 ZTE 11.2 4.0 +21.9 +34.3
7 Sony 10.3 3.6 +8.6 +45.0
8 Coolpad 8.4 3.0 -1.0 +43.4
9 Nokia 8.2 2.9 -3.9 +15.6
10 TCL-ALCATEL 7.4 2.6 +58.9 +253.8
Others 61.5 21.8 -1.7 +37.7
TOTAL 282.3 100.0 +12.8 +35.9

AMERICAS 51% EMEA
35%
APAC 10%
CHINA 4%
APAC 6%
CHINA 9%
AMERICAS 41%
EMEA 44%
FEATURE PHONES & OTHER PRODUCTS SMARTPHONES & OTHER SMART DEVICES
GEOGRAPHICAL REVENUE BREAKDOWN
7

REGIONAL BUSINESS REVIEW
EUROPE, MIDDLE EAST
AMERICAS
4.5 7.8
0.0
2.0
4.0
6.0
8.0
2012 2013
+73%
5.1 8.7
0.0
2.0
4.0
6.0
8.0
10.0
2012 2013
Revenue (HK$ Billion)
+71%
Revenue (HK$ Billion)
•Shipments: 20.5 million units, up 35% YoY
•Revenue: HK$7.8 billion, up 73% YoY
•Ranked No. 4 in Eastern European region in terms of Q4 sales volume
•Most significant growth countries (YoY sales volume growth %): Russia (+122%); United Kingdom (+55%)
•2014 business plan: Expand the sales network to Nordic countries and launch more LTE smartphones
•Shipments: 26.1 million units, up 37% YoY
•Revenue: HK$8.7 billion, up 71% YoY
• Introduced ALCATEL ONETOUCH FIRE with Firefox OS
•Ranked No.1 in Central America, Pacific Islands and Caribbean; No. 2 in Mexico; No.3 in LATAM, No. 5 in North America in terms of Q4 sales volume
•Most significant growth countries (YoY sales volume growth %): Mexico (+103%); USA (+78%)
•2014 business plan: Consolidate position with the newly set up sales channels. Smartphones & tablets will be the growth driver
8

REGIONAL BUSINESS REVIEW
ASIA PACIFIC
•Shipments: 3.8 million units, up 50% YoY
•Revenue: HK$1.5 billion, up 81% YoY
•Most significant growth countries (YoY sales volume growth %): Malaysia (Newly entered market) ; India (+138%)
•Ranked No.2 in Malaysia, No. 1 supplier of major operators in the Philippines
•2014 business plan: Widen sales channels in open markets and strengthen existing sales points
CHINA •Shipments: 4.8 million units, down 16% YoY
•Revenue: HK$1.4 billion, down 11% YoY
•Enhanced sales channels through with greater cooperation with operators in major provinces, including Jiangsu, Inner Mongolia, Hebei, Sichuan, Chongqing and Shanxi
•Strategically partnered with the largest B2C e-commerce company in China, 360 Buy, to promote flagship product, TCL S950
•TCL HERO N3 won the Best Innovative Product Award of 2013 from China Communications Industry Association
•2014 business plan: Strengthen sales points with operators and distributors
0.8 1.5
0.0
0.5
1.0
1.5
2.0
2012 2013
+81%
1.6 1.4
0.0
0.5
1.0
1.5
2.0
2012 2013
Revenue (HK$ Billion)
-11%
Revenue (HK$ Billion)
9

- STRATEGY
Advanced Smartphone
Cloud terminals / Smart Connectivity Devices
LTE/Tablet Entry-level Smartphone
EDGE Phone Advanced Feature Phone
Entry-level Feature Phone
10
- 650MHz-1.5GHz Dual-core CPU Android 4.0 - 4.1 Windows
- Quad-core CPU 6.45mm Thickness Android 4.2 Firefox Cloud applications Multi-screen Wifi display on TV LTE
- - Tablets
Octa-core CPU Metal casing Wearable devices Android 4.4 4K video
- 500MHz-600MHz Android 2.1 - 2.3 3G
EDGE Qwerty keypad Multi-touch display Entry-level
Multi-touch Panel Technology
GPRS, Ultra-low cost Qwerty key pad
2007-08
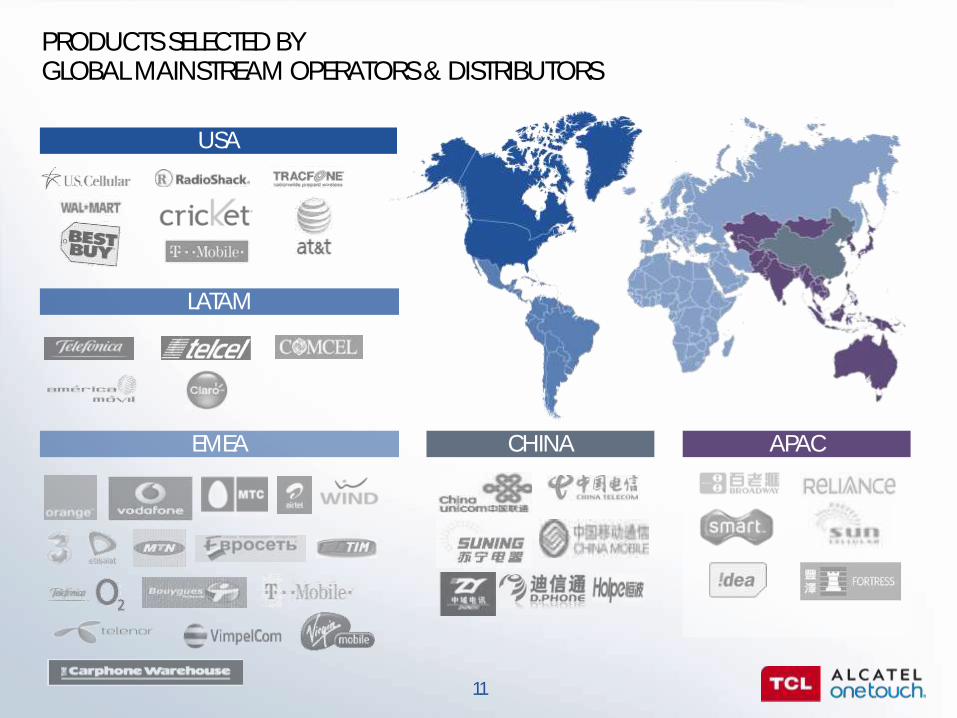
LATAM
USA
PRODUCTS SELECTED BY GLOBAL MAINSTREAM OPERATORS & DISTRIBUTORS
EMEA CHINA APAC
11

NEW PRODUCTS
Color: Champagne Gold / Slate Quad Core 1.2 GHz CPU
Mpxl rear Camera Ultra Thin Body: 7.5mm Wireless Connection to TV with Wifi Display Aluminum Metal Frame Translucent upper and lower edges with LED lighting
Real Octa-Core 2 GHz CPU Full HD Display
8.1mm slim Narrow bezel
13 Mpxl rear camera, 2 Mpxl Full HD front camera Smart Wristband
2500mAh battery
12

Quad Core 1.2 GHz CPU display
Full lamination 8 Mpxl rear camera LTE Cat4. NFC 2150mAh battery 7.45mm thickness
NEW PRODUCTS
Quad Core 1.5 GHz CPU with Dual SIM Mpxl Camera
Heavy Duty Battery: 3400 mAh Wireless Connection to TV with Wifi Display
Bluetooth Enabled Phone Slim Capacitive Stylus and LED Magic Flip
13
Quad Core 1.2 GHz CPU 4.5 display Full lamination
8 Mpxl rear camera LTE Cat4. NFC
2000mAh battery 8.5mm thickness

NEW PRODUCTS
Quad Core 1.3 GHz CPU
Super thin: 7.9mm Super light 325 g TV Mirror: Two Connectivity Modes:
14
Dual Core 1.3 GHz CPU 1024X600 TFT Display
Super thin: 8.9mm Super light : 285 g
Narrow Border Dedicated accessories
Two Connectivity Mode:

•Located in Huizhou, China
•30 SMT lines, 29 assembly lines, 46 customization/packing lines
•Annual Capacity: 100-120 Mu
•World-class SMT production lines and supporting facilities
•Efficient global logistics experiences
•Strict tests by key telecommunication global operators
• ISO 9001, ISO 14001 and TL9000 qualified
•Testing and R&D manufacturing capability for platforms: MTK & QUALCOMM
WORLD CLASS STANDARD PRODUCTION FACILITY
NEW GLOBAL PRODUCTION FACILITY
15

BRAND BUILDING & AWARDS IN EMEA & AMERICAS
ONETOUCH IDOL X+ awarded one of Digital Trends Best Smartphone Finalist in CES
ALCATEL ONETOUCH IDOL X received GOOD DESIGN award from the Chicago Athenaeum
CES 2014, USA
16
International Incubation Programme: Le Project, France

BRAND BUILDING IN APAC & CHINA
17
Concert Title Sponsorship, Hong Kong
IDOL X+ Product Launch, China
Product Promotion, Malaysia
Outdoor Billboard, Hong Kong
MTR Advertisement, Hong Kong
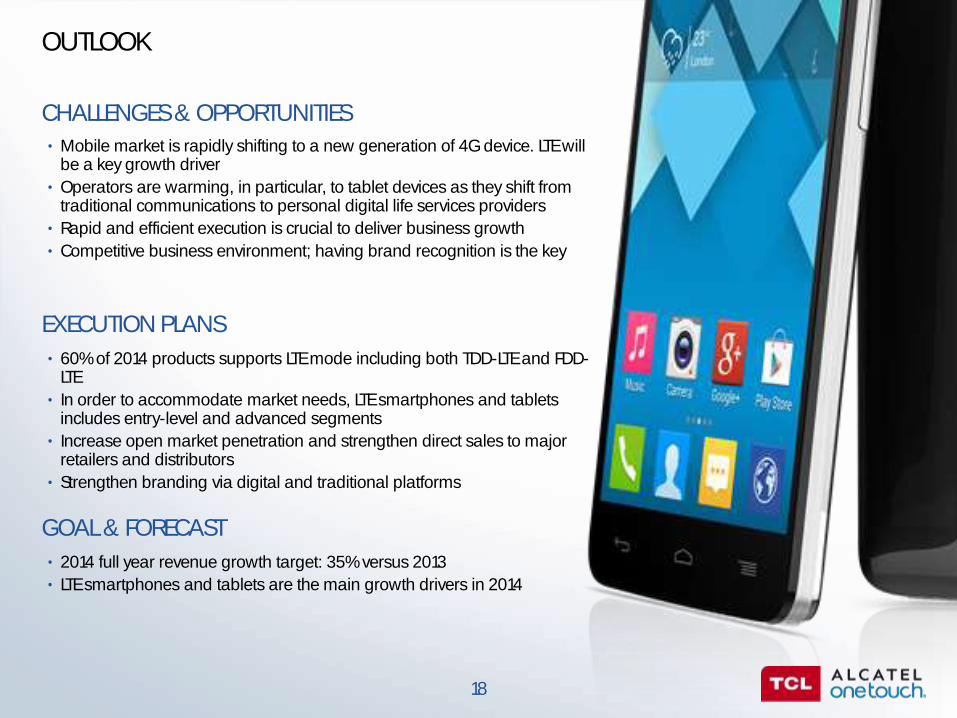
GOAL & FORECAST
EXECUTION PLANS
CHALLENGES & OPPORTUNITIES
OUTLOOK
•2014 full year revenue growth target: 35% versus 2013
•LTE smartphones and tablets are the main growth drivers in 2014
•60% of 2014 products supports LTE mode including both TDD-LTE and FDD-LTE
• In order to accommodate market needs, LTE smartphones and tablets includes entry-level and advanced segments
• Increase open market penetration and strengthen direct sales to major retailers and distributors
•Strengthen branding via digital and traditional platforms
•Mobile market is rapidly shifting to a new generation of 4G device. LTE will be a key growth driver
•Operators are warming, in particular, to tablet devices as they shift from traditional communications to personal digital life services providers
•Rapid and efficient execution is crucial to deliver business growth
•Competitive business environment; having brand recognition is the key
18

FINANCIAL HIGHLIGHTS
19

Q4 2013 Q4 2012 YOY (%) 2013 2012 YOY (%)
Sales Volume
19,174 13,439 +43% 55,201 42,608 +30%
Total ASP (US$) 50.2 37.1 +35% 45.0 36.2 +24%
Revenue 7,501 3,885 +93% 19,362 12,031 +61%
Gross Profit % 19.6% 15.6% +4.0% 19.0% 17.4% +1.6%
Net Profit/(Loss) 302 (229) N/A 316 (220) N/A
Net Profit/(Loss)% 4.0% (5.9%) N/A 1.6% (1.8%) N/A
20
FINANCIAL HIGHLIGHTS
Revenue & Net Profit/(Loss) (HK$ Million)
Revenue (HK$ Million)
2012 2013
19,362
12,031
+61%

0.1 0.0 0.1 0.4 0.6 0.6 1.1 1.6 1.9 1.2
2.5 3.4 5.2 3.0 2.1 2.4 2.4 2.6 1.5
1.9 1.5 2.0 1.2
1.5
2.1
2.3
1.5
2.0 2.2
3.1
2.1
2.5 2.8
3.2
2.1
3.0 3.1
3.9
2.4
4.0
5.5
7.5
0.0
1.0
2.0
3.0
4.0
5.0
6.0
7.0
8.0
Q12010
Q22010
Q32010
Q42010
Q1 2011
Q22011
Q32011
Q42011
Q12012
Q22012
Q32012
Q42012
Q12013
Q22013
Q32013
Q42013
Smartphone & Other Smart Devices Feature Phone & Other Products
Revenue HK$ Billion
21
SUSTAINABLE REVENUE GROWTH QUARTERLY REVENUE OF HANDSETS & OTHER PRODUCTS

31.3
29.6
33.4
31.2
34.6 35.6
37.1 37.1 37.0
41.8
45.4
50.2
0.3% 1.3% 4.4%
5.5%
9.5%
13.5%
18.8% 17.4% 17.1%
26.7%
33.7%
40.0%
0.0%
10.0%
20.0%
30.0%
40.0%
50.0%
25
30
35
40
45
50
55
Q1 2011
Q22011
Q32011
Q42011
Q12012
Q22012
Q32012
Q42012
Q12013
Q22013
Q32013
Q42013
ASP Sales Proportion of Smartphone & Other Smart Devices
22
BETTER SALES PRODUCT MIX & UPWARD ASP TREND SMARTPHONE SALES VOLUME PROPORTION & ASP GROWTH
ASP (USD) Sales Proportion of Smartphone & Other Smart Device (%)

GROSS MARGIN TREND GROSS MARGIN
23
14.4%
17.0%17.9%
21.8%22.4%
21.9%
17.4%16.4%
18.4%19.6% 19.6%
0.0%
5.0%
10.0%
15.0%
20.0%
25.0%
2006 2007 2008 2009 2010 2011 2012 Q12013
Q22013
Q32013
Q42013
Product Competitiveness
Economies of Scale
Pricing and Currency Strategy
Brand Value and Customer Relationship
Continuous Cost Down Effort

FINANCIAL POSITION HIGHLIGHTS STATEMENT OF FINANCIAL POSITION
(HK$ Million) 31 December 2013 31 December 2012 Change (%)
Non-current assets 2,556 2,109 +21%
Current assets
-Inventories 2,649 1,263 +110%
-Trade & factored receivables 6,036 3,275 +84%
-Other current assets 1,341 1,483 -10%
-Pledged deposits 1,698 4,221 -60%
-Cash and cash equivalents 142 970 -85%
Total current assets 11,866 11,212 +6%
Current liabilities
-Interest-bearing bank and other borrowings (2,690) (6,159) -56%
-Other current liabilities (4,656) (2,018) +131%
-Trade and notes payables (3,875) (2,429) +60%
Total current liabilities (11,221) (10,606) +6%
Net current assets 645 606 +6%
Total assets less current liabilities 3,201 2,715 +18%
Non-current liabilities (288) (392) -26%
Net assets 2,913 2,323 +25%
24

KEY FINANCIAL RATIOS
* Calculated -bearing borrowings over total assets, excluding RMB foreign exchange program ** Excluding RMB foreign exchange program *** Excluding factored trade receivables **** Only inventories in factory
25
31 December 2013 31 December 2012
Gearing Ratio * 17% 26%
Current Ratio ** 1.06 1.07
Trade Receivables Turnover Days 63 68
Inventories Turnover Days *** 39 38
NAV per share HK$ 2.55 HK$ 2.06
Basic Earnings/(Loss) Per Share 27.50 HK cents -18.49 HK cents
Interim Dividend Per Share - 3.00 HK cents
Final Dividend Per Share 10.00 HK cents -
Full Year Dividend Per Share 10.00 HK cents 3.00 HK cents
Dividend Payout Ratio 36% N/A

Q & A
26

27
THANK YOU

DISCLAIMER
The information contained herein should not be utilized for any
legal purposes in regards to any investment decision
or results. In particular, this document does not constitute any
recommendation or invitation for subscribing for or sale and
purchase of any securities of TCL Communication Technology
Holdings Limited ( The Company hereby expressly
disclaims any liability for any loss or damage resulting from or in
connection with any reliance by any investor on the information
contained herein.
A number of forward-looking statements may be made during this
presentation. Forward-looking statements are any statements that
are not historical facts. These forward-looking statements are
based on the current expectations of the Company and there can
be no assurance that such expectations will prove to be correct.
Because forward-looking statements involve risks and
uncertainties, the actual results could differ materially
from these statements.
28