
HONDESTraJCriVE TESTING USING TW … CR 71-4/1 n E HONDESTraJCriVE TESTING USING TW ACÜÜSTIHFTKA,...
30
AMMRC CR 71-4/1 n E HONDESTraJCriVE TESTING USING TW ACÜÜSTIHFTKA, IMAGIi^G SYSTH1 January t97"l Robert Aprahamian Gerold L. Jacoby Pravin G. Bhuta Applied Mechanics Laboratory TRW SYSTEMS GROUP One Space Park Redondo Beach, California Sbl'lI-MWAL REPORT - CMRACF iM^r/OC-QKB P b c D This is document has been approved for public release and sale; its distribution is unlimited. Prepared for ARMY MATERIALS AND MECHANICS RESEARCH CENTER Watertown, Massachusetts 02172 Wi-pmdi . .T h NATIONAL TECHNICAL INFORMATION SERVICE Spnncfiold v^ JJiü 3(
-
Upload
trinhquynh -
Category
Documents
-
view
216 -
download
2
Transcript of HONDESTraJCriVE TESTING USING TW … CR 71-4/1 n E HONDESTraJCriVE TESTING USING TW ACÜÜSTIHFTKA,...
AMMRC CR 71-4/1
n
E
HONDESTraJCriVE TESTING USING TW ACÜÜSTIHFTKA, IMAGIi^G SYSTH1
January t97"l
Robert Aprahamian Gerold L. Jacoby Pravin G. Bhuta
Applied Mechanics Laboratory TRW SYSTEMS GROUP One Space Park Redondo Beach, California
Sbl'lI-MWAL REPORT - CMRACF iM^r/OC-QKB
P b c
D
This is document has been approved for public release and sale; its distribution is unlimited.
Prepared for
ARMY MATERIALS AND MECHANICS RESEARCH CENTER Watertown, Massachusetts 02172
Wi-pmdi . .T h
NATIONAL TECHNICAL INFORMATION SERVICE
Spnncfiold v^ JJiü 3(

Unclassified S«cvmty CUMlfte«tlon
KEV mono*
Ultrasonic Frequencies Acoustics Nondestructive Tests Images
noLC
Unclassified Security Classification

Unclassified Sjcurij^Utwfjcjjio^
DOCUMENT CONTROL DATA . R 4 D fS»cuf<ty clmniltcmuon el till: baly ol abHtmct mnd intlamhtg muflmtld» mual W_«nl«r»rf i»>g^Ww_ow^jl2^oWj££lg»«IH«JL
I oni'iiN* TIMS ACTIVITY fComorat« auffcar) TRW INC. TRW Systems Group One Space Park »WCT^ifly^i Oalifegnia
M. NCPONT tKCUNITV CL*«*IPICATION
»». 0NOU#
NONDESTRUCTIVE TESTING USING TRW ACOUSTO-OPTICAL IMAGING SYSTEM
« octcMi^Tivc NOTCt (Typ* ol r»pon and Inclutiv d»f)
Seml-Annual Report ^n Tung 1Q7n m qn iw«mK«y iQ7n a AU TMOKiti fFiüi UM, üIMM Inlllml, Hif namn;
Robert Aprahamlan Jerold L. Jacoby Pravln G. Bhuta
• ni^OKT OAT«
January 12, 1971 M. CONTHACT ON OKAMT NO.
DAAG46-70-0-0103 ft. »HOJCCT MO.
•• ARPA Order No. 1245
»a. TOTAL NO. or NASKt
AMMRC CR 71-4/1
M. OTMCN NKVOMT NO(«l Mnv «Ma i«part>
71/4341/9
•Mat imMara Mat •Mi' ka aaalfiarf
10. OltTKiauTIOM tTATKMKNT
This document has been approved for public release and sale; Its distribution Is unlimited.
II «OPPLCMKNTAnv NOTKt
Sponsored by Advanced Research Projects Agency
II. •»OMMNINa MILITANV ACTIVITY
Army Materials and Mechanics Research Center, Watertown, Massachusetts 02172
II AMTWACT
The technique of Acousto-Optical Imaging (A0I) enables one to "see", on a real-time basis, within optically opaque materials and to detect Internal or surface flaws and/or other Irregularities which might be present. The process uses an ultrasonic beam to probe the object under study. As It Interacts with the object, the ultrasonic beam acquires an acoustical "picture" of the object. The acoustic waves then Interact with a monochromatic light beam (as from a laser). Optical sidebands are produced by the Bragg diffraction of light. The cumulative result of this process Is that these sidebands produce a visual Image of the Interior of the object. This paper discusses the results of an experimental study to evaluate the applicability of acousto-optical Imaging to nondestructive testing. In addition to the determination of the system resolution, the effects of specimen thickness, geometry, composition and surface roughness are under Investigation. A new technique which utilizes the sound reflected from the specimen to obtain an acousto-optical image was also developed. Preliminary results utilising this technique to detect surface flaws on a specimen are encouraging./ >
An fete 4 ,4 TO ■«•i.A<«a oe aoat« •«»•. • wßmß • NOV ••! ■# / «3 eoaeiiTc re« AMMV uaa.
JAN «4, «MICM IS Unclassified
"**"* ' Iwurity ClaaaincaiiMi

*
AMMRC CR 71-4/1
NONDESTRUCTIVE TESTING USING TRW ACOUSTO-OPTICAL IMAGING SYSTEM
Robert Aprahamian Jerold L. Jacoby Pravin G. Bhuta
Applied Mechanics Laboratory TRW SYSTEMS GROL'P One Space Park Redondo Beach, California
Semi-Annual Report - Contract DAAG46-70-C-0103
AMCMS Code 5910.21.66009
_ D D C jjJCGEHLQEIn]
m «■ »" (i
lEIEETnTTSüi) U
This document hat been appro>/ed for public release and tale; its dittribution is unlimited.
Sponsored by
Advanced Research Projects Agency
Prepared for
ARMY MATERIALS AND MECHANICS RESEARCH CENTER Watertown, Massachusetts 02172
■■ ■■ ■■-■■.■ ■ ■ - .■•■■ ■ ■ ... .--. ■:■ .......

mmm&mm.mm ■
ABMY MATERIALS AND MECHANICS RESEARCH CENTER
NONDESTRUCTIVE TESTING USING
TRW ACOUSTO-OPTICAL IMAGING SYSTEM
ABSTRACT
The technique of Acousto-Optical Imaging (AOI) enables one to "see", on a real-time basis, within optically opaque materials and to detect internal or surface flaws and/or other irregularities which might be present. The process uses an ultrasonic beam to probe the object under study. As it interacts with the object, the ultrasonic beam acquires an acoustical "picture" of the object. The acoustic waves then interact with a monochromatic light beam (as from a laser). Optical sidebands are produced by the Bragg diffraction of light. The cumulative result of this process is that these sidebands produce a visual image of ihe interior of the object. This paper discusses the results of an experimental study to evaluate the applicability of acousto-optical imaging to nondestructive testing. In addition to the determination of the system resolution, the effects of specimen thickness, geometry, composition and surface roughness are under investigation. A new technique which utilizes the sound reflected from the specimen to obtain an acousto-optical image was also developed. Preliminary results utilizing this technique to detect surface flaws on a specimen are encouraging.
11
. . •:-.'. :,:.J ■ .
'"^mmäkmaMä

i^v
FOREWORD
This report was prepared by the Applied Mechanics Laboratory of TRW Systems Group, Redondo Beach, California under Army Materials and Mechanics Research Center (AMMRC) Contract Number DAAG46-70-C-0103 (ARPA Order Number 1245). Mr. 0. R. Gericke served as the technical monitor for AMMRC. Program Manager at TRW Systems was Mr. R. Aprahamian. Technical Support was contributed by Mr. J. L. Jacoby, Dr. P. G. Bhuta and Mr. C. V. Murrow.
iii

CONTENTS
Page
ABSTRACT 11
FOREWORD 111
INTRODUCTION 1
SYSTEM EVALUATION 2
TEST SPECIMENS 4
RESOLUTION MEASUREMENTS 5
REFLECTED SOUND IMAGING 16
CONCLUSIONS 22
REFERENCES 23
Iv
s

^Wmsmmmmmmm^^
o INTRODUCTION
The technique of Acousto-Optical Imaging (ACI) enables one to "see", on a real-time basis, within optically opaque materials and to detect internal or surface flaws and/or other irregularities which might be present. The process uses an ultrasonic beam to probe the object under study. As it interacts with the object, the ultrasonic beam acquires an acoustical "picture" of the object. The acoustic waves then interact with a mono- chromatic light beam (as from a laser). Optical sidebands are produced by the Bragg diffraction of light. The cumulative result of this process is that these sidebands produce a visual image of the interior of the object.
It is the objective of the present study to determine the general applicability of the TBW Acousto-Optical Imaging system to nondestructive testing. This includes experimental study of the capabilities and physical limitations of the Bragg Refraction method which forms the underlying principle of the system. In addition, the ability of the AOI device to image using reflective sound is being investigated. During the first six months of this study, progress has been made in the following areas:
o System Evaluation I
+i Those factors which Influence the performance of the system I have been Identified. Attempts are being made to vary
parameters so as to optimize the system.
o Test Specimens
Test specimens to measure the system resolution have been fabricated. A new technique for making flawed specimens is under development. This Involves casting the "flaw" into a resin material.
o Resolution Measurements
Images of a series of closely spaced drill holes were photographed. The frequencies were varied from 4 to 40 MHz. The resolution was defined as the ability to distinguish the individual holes. The results are in good agreement with the theoretical predictions for the resolution.
o Reflective Sound Imaging
Initial tests were begun to obtain an acousto-optical image using the sound reflected from the object. Pulsed light and sound sources were synchronized to "range-gate" the object. In addition, a closed-circuit television system was used to display the images. Images were obtained of a surface flaw on ^a sample of borsic aluminum.

SYSTEM EVALUATION S~'
The first stage of the program has been used to evaluate the present Acousto-Optical Imaging system.1 A thorough understanding of the operating characteristics and the relationship between the actual and theoretical performance Is prerequisite to further development. It Is also necessary to Identify those factors which catv be used to measure the system per- formance. TWc such parameters are sensitivity and resolution which are a measure of the ability of the system to detect a flaw In a specimen.
Four factors Influence the sensitivity of the system: the Intensity of the light source (laser), I ; the Interaction distance between the
2 light and sound, £; the efficiency of the coupling medium , M *; and the
Intensity of the sound In the volume of the llght-souud Interaction, P . 2
These factors are related In the system according to Equation 1:
- I sin2 (I.AäJMT" (1) O V W 8
In order to produce a usable Image, a sufficient amount of light roust be diffracted Into the first sideband. The minimum Intensity, I, (Eq. 1) which can be observed visually as a real-time Image Is^ |?
—6 2 I . - 2.2 x 10 watts/cm mln
The quartz crystals used with this system produce a colllmated acoustic wave. The maximum Interaction distance, £, Is the width of the acoustic column. The efficiency of the coupling medium is given by the figure of merit, M . As Is seen In Table I, the figure of merit may
vary over a large range of values, however, It happens that water Is a very good coupling medium. The sound Intensity Is determined by the output of the sound source (transducer) and the energy loss before the sound reaches the interaction area.
*u 2 2.2 *Mw - n p /v p
n ■ refractive index of the coupling medium
p - elastooptic coefficient
v ■ sound velocity
p - density
L
■'»?' V:«.,-*i

0 TABLE I*
Comparison of the Efficiency of the Coupling Medium for Various Materials
Material
Water
Dense Flint Glass
Extra-Dense Flint Glass
Fused Quartz (S102) Polystyrene
KBS-5
Lithium Nlobate (LINbO )
Lithium Flourlde (L1F)
Rutile (T102)
Sapphire (Al^)
M w
1.0
0.06
0.12
0.006
0.8
1.6
0.012
0.001
0.001
0.001
The resolution of an Acousto-Optical Imaging system Is ultimately limited by diffraction effects In both the acoustic and optical waves. Factors Influencing the resolution Include the arrangement of the optical system, the arrangement of the object In the acoustic medium relative to the Interaction volume, the size and shape of the Interaction volume and the acoustic wavelength.
All of the above factors for determining the sensitivity and resolution of the system can be divided Into two groups. The first of these two groups influence the design of the A0I system. When these factors are optimized and built into the system, we expect that they will remain relatively constant. These factors would Include the intensity of the light source, the maximum power available to drive the transducer, the coupling medium (water), and the size and shape of the light-sound Interaction volume. This last item can be altered by providing the ability to change optical components, however, by proper design this need could be minimized.
The second group of system variables relate not to the construction of the system, but hex: It is to be used to perform a particular function. For example, the sensitivity is. In part, determined by the sound intensity at the interaction volume. The attenuation of the sound in the water medium is therefore a major factor in determining the sensitivity. (The
»
, ^^»^•■^ ;.■-■■■,;

characteristic attenuation distance of a 11 Megahertz acoustic wave in water at 20oC is 6 in.) The sound intensity decreases with the distance
i \ and the square of the frequency (I » I e ). Thus, it would appear
that greater sensitivity can be obtained by placing the transducer close to the light-sound interaction volume (if object geometry permits) and by using lower frequency sound. The resolution of an acoustic system is dependent on the acoustic wavelength. The resolution can be increased by using sound having a shorter wavelength, i.e., higher frequency. But this violates our sensitivity condition. Clearly, to optimize the system performance, a tradeoff between these two requirements must occur. This can be accomplished by taking into account the attenuation for a particular situation and the resolution required.
TEST SPECIMENS i
In order to properlv evaluate the capabilities and limitations of an imaging system, it is necessary to have a set of standaxds such that the data can be expressed in quantitative form. Tests using naturally occurlng flaws in materials are valid only to the extent thct the character of the flaw can be verified by alternate methods. This approach, however, is subject to the limitations of the other systems. In some cases, it may be difficult to find flawed specimens exhibiting the desired character- istics. A more positive approach to this problem is to fabricate control specimens which have the desired specifications.
TVo specimens were designed for use in determining the resolution of the A01 system. The specimens are flat aluminum plates (0.125" thick) with a series of holes drilled into them from one side. Figure 1. The hole diameters are 0.110", 0.055", 0.028" and 0.0135". One specimen has one hole of each size while the other has four holes of each size. The separation between chese holes is equal to the hole diameter. Tolerances on these specimens were held to + 0.001".
Machining artificial flaws and defects, such as the drilled holes in Figure 1, is a very precise technique. However, certain size and geometrical limitations are encountered. Future tasks of tMs study require that vary small defects be used to determine the minimum flaw size which can be detected. It Is also desired to Investigate the three-dimensional character of flaws. A new technique for fabricating test specimens containing precisely known flaws is being investigated. Lengths of thin wire and small three-dimensional objects will be cast into resin blocks. Tests are presently being made to find a resin, or similar material, which is sufficiently transparent to high frequency ultrasound. The objects cast Into the resin will scatter sound in the same way as a flaw. This techniqte will allow the "flaws" to be precisely measured before the casting is made. In addition, many of these materials
( \
O

9
mm
^
mm ft mm
1
V I
\
Figure 1: Calibrated Test Specimens. Hole diameters (in inches) are
indicated below each set of holes.
are optically transparent. This would allow the "flaw" to be examined and measured after it is cast.
RESOLUTION MEASUREMENTS
f
The actual evaluation and reporting of the resolution creates somewhat of a problem. For real-time measurement, the operator must make a subjective evaluation of the image. Resolving a clear well-focused Image of a flaw is more difficult than simply detecting its existence. For the purpose of this study, we have arbitrarily defined the resolution as being the smallest set of drill holes in our calibration specimens, where the images of the individual holes remain distinguishable. This specimen, shown in Figure 1, consists of four sets of four holes. The spacing between the holes in each set is equal to the hole diameter.
^gy^SsSMÄ»»»-«"-""*-

While the outstanding feature of the A01 system Is that it produces real-time Images, It Is also necessary that a good photographic record be obtained. This Is the only way In which test results can be reported and compared. Difficulties In photographing Images are often encountered
when laser light Is used (as In holography). This Is a consequence of the granular nature of laser light. It Is often found that a good, real- time Image will not produce a good photograph. In other cases, the photograph Is better. A variety of different photographic techniques have been applied to the recording of AOI Images. These have included
a number of different optical arrangements, cameras, films and development processes. One of the more successful techniques and by far the easiest and fastest Involves the use of Polaroid film. The screen which Is normally used to display the real image ic replaced by the film packet. The packet is opened in the darkened room and the laser shuttered to provide the proper exposure. The film is exposed directly by the AOI image. No "camera" or other focusing optics are needed. The Images presented in this section were recorded by this method on Polaroid Type 52 and Type 55 P/N films (type 55 P/N provides both a positive print and a negative).
Two x-cut quartz transducers, measuring about 1-1/4" square, were used for these tests. Their fundamental frequencies were 4 MHz and 8 MHz. These transducers can be operated at their fundamental frequencies and at their odd harmonics. Thus, the 4 MHz transducer was used at 4, 12, 20 and 28 MHz and the 8 MHz transducer was used at 8, 24 and 40 MHz. Images of the four sets of holes at each of these frequencies were obtained and are presented in Figures 2 through 5. Each figure shows a different set of holes Imaged at the available frequencies. (Note that the smallest holes. Figure 5, could not be resolved at the lower frequencies and so these pictures were omitted.)
The ability to resolve the Images is limited by two effects, (1) the resolution of the light-sound interaction and (11) the diffraction of the sound due to the small drilled holes in the specimen. From Reference 5, the theoretical resolution limit, d, for the light-sound Inter- action is given by '
(2nM)X (2)
O
o
n - index of refraction of water
4» « light cone divergence angle (.093 radians for our tests)
A - acoustic wavelength in water
In this equation, d is defined as the minimum resolvable linear ultrasonic dimension in the plane orthogonal to the line axis of the light beam,
C

z 4 MHz crystal transducer
a. 4 MHz
c. 12 MHz
d. 20 MHz
f. 28 MHz
8 MHz crystal transducer
b. 8 MHz
e. 24 MHz
g. 40 MHz
Figure 2. Acousto-Optical Images at Various Frequencies of Four 0.110" Diameter Holes
■■■■■■■- '■'-■■■.■.-«i^c^aö^ji^iji

4 MHz crystal transducer
a- 4 MHz
c 12 MHz
d. 20 MHz
f• 28 MHz
8 MHz crystal transducer
b. 8MHz
e' 24 MHz
8- 40 MHz
Figure 3.
^r^^T^s^1,,^/^1 ous Fr~ c

'MMIMMMIM«
0
s
4 MHz crystal transducer
a. 4 MHz
c. 12 MHz
d. 20 MHz
f. 28 MHz
8 MHz crystal transducer
b. 8 MHz
e. 24 MHz
g. 40 MHz
Figure 4. Acousto-Optical Images at Various Frequencies of Four 0.028" Diameter Holes
Ik1- ^^^||pjHi^ii»,js«.*w;«iiT*ii?i~

A MHz crystal transducer
a. 12 MHz
b. 20 MHz
d. 28 MHz
8 MHz crystal transducer
c. 24 MHz
e. 40 MHz
O
o
Figure 5. Acousto-Optical Images at Various Frequencies of Four 0.0135" Diameter Holes
C
10

0
a
(i.e., d Is the theoretical resolution along the vertical axis of the Images In Figures 2-5.) Recalling that we have equated the ability to resolve an Image with the ability to distinguish the Individual drill holes, Equation 2 can be evaluated with the aid of Figures 2-5. For example, for a frequency of 4 MHz, the theoretical resolution limit, d. Is 0.1310". The largest hole diameters are 0.110". As this is smaller than d, one would not expect to be able to resolve a clear image of any of the holes at this frequency. This lack cf resolution is evident in the Figures. At 12 MHz, the theoretical resolution is 0.0437". As expected, the 0.110" diameter holes are clearly resolved. The images of the 0.055" and the 0.028" diameter holes show diffraction effects. It is difficult to distinguish the hole boundaries and it appears that five or more holes are present. (This is discussed in greater detail below.) The 0.0135" diameter holes are not resolved at this frequency.
The resolution limit, d, (from Equation 2) is plotted vs. acoustic frequency in Figure 6. The resolution of the images in Figures 2 through 5 were rated by several individuals within the laboratory. The position where each image falls on the graph in Figure 6 has been noted by its rating: (G = Good; F = Fair, P * Poor). Equation 2 predicts that we will be able to resolve the drill holes in those Images which fall abov? the line in Figure 6. For the images below the line, it is expected that the drill holes would be indistinguishable. It can be seen from Figures 2-5 that our results are in general agreement with these predictions.
In several of the Images, in particular, those which fall near the line in Figure 6, it is difficult to determine the boundaries of the holes. In some of the pictures, it appears that more than four holes are present. These effects are due to the diffraction of the sound in the specimen. Diffraction effects are not important as long as A /a << 1 s (where X is the acoustic wavelength in the specimen and a is the hole s diameter). For these experiments, X is on the same order as a and thus
s the diffraction of sound by the drilled holes is a significant factor in the resolution of the system.
To determine the effects of acoustic scattering, we will compare the size of one set of holes as determined from the acousto-optical image with the actual specimen. For this purpose, we choose to consider the 0.055" diameter holes Imaged with 24 MHz sound, as shown in Figure 3e. To arrive at the size of the holes from the acousto-optical image, one must consider the magnification inherent in the acousto-optical imaging process. The magnification factor is obtained by measuring the distance between the center lines of the two outer holes and comparing it with the actual distance between the holes as measured from the specimen, see Figure 7. The magnification factor is given by the ratio of the image size to the actual specimen size and is found to be
Image Size 0.53 ± 0.02" i <: n i Specimen Size ' 0.330" + 0.001" = J--0 ± u-i
11
^j)*»*»».»»"«-"---—- ---.,,.-,., .,., j;.,;W^fe

'■• '■•;•:
1 '^ H vO «» vO <M a> m 1 — 0 m vO ^ IN <M r-t •-) 1 ^ö i-4 o o o O o o 1
• o o o o o o o 1
i ^^ 1 N hs «* 00 «s o •« 00
0 1 r-4 es es «M . • 1 i *"*
u id
o
O «H O O « O O fci fr,
aii O fc fr.
i. ■(ZHW)^
(UT)Y
12
o o
o
- -0.110
00 CM CM
O CM
CM 00
s
s o
o vO o
- -0.055 C
o -* o
..0.028
- -0.0135
4 1- ■H -» Ch 00 CM «» CM CM es «» fv. <» 8 O
O s § § f-t o
f-l
8 • <U T)
*J « 4)
r-i tf\ I
0) CM es &ö Ö -H
H «9 »w B ü^
|S O «M U O cd
. SS, 4J 1-4
^ s-s » o. «d
4J 0)
B « *«-" •H cd o
g|§ « O. a 3 O. S
t-i <d o* O
4) 0)
4J w
0)
3,
o
w*s**^^ii(!^aswj«Ha»aäft*ia _J

D
(a)
J"jr055" .330"
]ZIl055"
(b)
Figure 7: Con^arison of AOI Image with actual specimen dimension for .055" diameter holes imaged at 24 MHz (a) Acousto-optical Image (b) Schematic of actual specimen
9 The error band, + 0.02", assigned to the acousto-optical image measurement is obtained from the optical resolution limit, d, discussed previously (Equation 2). The tolerance + .001" is the tolerance held by the machinist In fabricating the specimen. Having this magnification factor, the hole diameter measured from Figure 7a can be determined to be
AOI hole size 0.11" + 0.02" 1.6 + 0.1 .069" + .017"
where again the error band + 0.02 is attributed to the optical resolution limit given by Equation 2. The actual size of the hole falls within the range of this figure.
To determine the magnitude of the diffraction effects, we will n^ixt consider the case of Fresnel diffraction of plane acoustic wavts by a single narrow opaque strip of Infinite length as depicted in Figure 8. It can be shown (Ref. 6) that the intensity distribution describing this situation is given by
i(xo) -1 i + c(c1) - c(c2) 2 + s(51) - sa2) 2
+ 2 C(h) - CU2)1 (3)
13
äiJ*«!*»*"***«"

1
Transducer
"b
Plane of light- sound Interaction^
Plane Acoustic Waves
/
.1/ Opaque Strip
-^-
t
Figure 8: Schematic representation of plane sound waves being diffracted by an Infinitely long (out of page) opaque strip of width a. A typical Intensity function Is shown plotted opposite the strip.
O
O
where C(0 and S(() denote the Fresnel Integrals defined by
C(e) - /* cos ^|-
•4 dt
S(€) - / sin ^ dt
"0
•J sm^ (4)
and
12 "V? (zi"x°) L
14

M^MRMMMnniM«
O The Intensity distribution, I(x ), given by Equation 3 was solved
numerically by a computer for our experimental configuration, viz
X - 0.007" 8
a - 0.055"
z - 1.0"
I(x ), as plotted by the computer, is shown in Figure 9.
x on this plot is x o r o
+ 0.250".
The range of
The width of the central minimum
measured between points B on the diagram is 0.096" + .005". This is larger than the measured width of the hole image (0.069" + .017"). It is expected that this discrepancy is due to the use of single opaque strip model rather than a four opaque strip model which would more accurately describe the actual specimen. During the next reporting period, this model will be run on the computer.
O
Figure 9: Computer generated intensity distribution for the diffraction of 24 MHz plane acoustic waves by an opaque strip of width 0.055". The range of x is + 0.250". The acoustic wavelength in the specimen is 0.007". The width of the central minimum measured between points B is 0.096" + .005". The width of the central minimum at one-half of this intensity is 0.076" + .005".
-;
15
o In summary, Che following measurements were made of Che .055"
diameter hole Imaged at 24 MHz
Method of Measurement Measured nole Diameter
Actutd Specimen Size 0.055" + .001"
Measurement from AOI Image 0.069" + .017"
Calculation of Single Opaque Strip Diffraction Pattern 0.096 + .005"
REFLECTED SOUND IMAGING
Previous work with Che acöuoto-optical Imaging (AOI) system used transmitted sound waves to probe the material being Inspected, I.e., Che acoustic waves were pasred through the specimen. In this configuration. Illustrated In Figure 10, the crystal transducer (used to generate the acoustic energy) is placed on one side of the specimen and emits a plane acoustic wave which Interacts wich Che specimen. ThaC part of Che wave which is transmitted through the specimen is distorted so that it carries with it an acoustic image of the interior of the specimen. Light is then Bragg diffracted from Che acoustic wave. A real-Clme image of Che interior :i^ of the specimen is thus projected onto .a viewing screen.
In many cases, access Co both sides of a specimen is noC possible and therefore Che ability to inspect parts from one side is desirable. This can be done by placing the transducer and the light-sound interaction volume on the same side of the specimen and using the sound which is reflected from the specimen to form an image. Experiments were performed in an effort Co demonstrate this technique. Initially, Che feasiblllCy of using ieflecced sound to detect surface cracks was investigated. In conjunction with the use of reflected sound, two other new techniques were employed. They were the use of pulsed light and sound sources and the use of a closed-circuit television system to intensify and enlarge the image.
A continuous wave (cw) sound source can be used for reflected sound Imaging if the proper experimental geometry is employed. An example of a possible experimental arrangement is shown in Figure 11a. For these tests, however, a preferred arrangement is with the sound wave Incident normally with the specimen. The experimental arrangement used is very simple, however, the sound must travel twice through ihe light-sound interaction volume. (See Figure lib.) This arrangement produces two images if continuous light and sound sources are used. As the sound travels from the transducer to the specimen, through Che interaction volume, an image of Che transducer is formed. In the second step, Che
16

0
i
§ •H 4J O 0»
I >
s
O
t
•rl CO
(d a) o J3
•H 4J W O..S
ir o O Tl (fl 0)
£1 §i
•H M 4J 4J (0 Ü «0 00
•H -O
g o r.
cd 0)
S eo oi •H C S H in ><-i a) oo u
P
3>
17
i„-^ÖS*»*«.«««^-—

o
Transducer,
Light-Sound Interaction VcJ.inne
Specimen
(a)
O
Trans ducer%
•Light-Sound Interaction Volume
Specimen
(b)
Figure 11: Two possible experimental configuraticns for reflective sound imaging
18
O

««mtmrmmm^.
reflected sound travels again through the Interaction volume producing a second Image. This problem can be overcome by turning off the light during step 1 and turning off the sound source during step 2, i.e. , using properly phased pulsed light and sound sources. A pulsed oscillator was used to provide sound pulses of 25 psec duration at a rate of 60 pps. The laser was a TRW Instruments pulsed argon laser (5145A and 4880A) producing pulses of 40 psec duration at a rate of 60 pps. While the duty cycle is very low for this mode of operation, the higher peak, powers obtained from both the light and sound sources combine to produce an average image Intensity only slightly less than in the cw mode when a 15 mw laser is used. Pulsing the sound source also prevents the occurrence of standing waves in the tank.
It was necessary to Initiate the light pulse after the sound so that both the light and sound would arrive at the interaction volume simul- taneously. Hie oscillator provided a delayed trigger signal which was used to trigger the laser. This delay is continuously variable from 2 usec to 2 msec. Referring to Figure 12, a delay of t = A/v, where v represents the velocity of sound, would allow the sound coming directly from the
0 L. Region I _X_ Region II _«L_ Region III
Transducer / Light x . Sound \ I Interaction ! I Volume i
H
Specimen
Figure 12: Experimental configuration for reflective sound imaging using pulsed light and sound sources.
i^
19

transducer to be Imaged. At this setting, a specimen situated In region I could be Inspected by the transmission method. By adjusting the laser /~\ delay to t - (A + 2B)/v, an Image would be formed by the sound being ^-^ reflected from a specimen In region III. (The delay due to the speed of light Is negligible.)
The first tests with this system were made using the transmission mode of operation so that the Image quality could be compared with that obtained using continuous wave light and sound sources. It was found that a double, or "ghost" Image was obtained because of the two principal wavelengths of llghtapresent. The problem could be eliminated by filtering out all but the 5145A component of the light. While the proper filter was not available In the laboratory, a filter was obtained which provided a usable Image. The pulsed Images appeared to have better contrast ratios than Chose obtained with toe cw mode. This Is possibly due to the higher sound
Intensities which created a more efficient diffraction pattern. This also aided In Imaging thicker materials In which the sound Is attenuated. The only disadvantage encountered was the low overall Intensity of the Image. This problem was overcome by the use of a closed circuit television system. The real acousto-optical Image was projected directly onto the face of the vldlcon tube of a television camera. The Image was then viewed on a 21" diagonal television monitor. This not only produced a brighter Image but the larger size enabled greater detail to be seen. Figure 13 shows the experimental setup with the closed circuit television system.
O
Figure 13: Experimental setup showing closed circuit television system
L 20
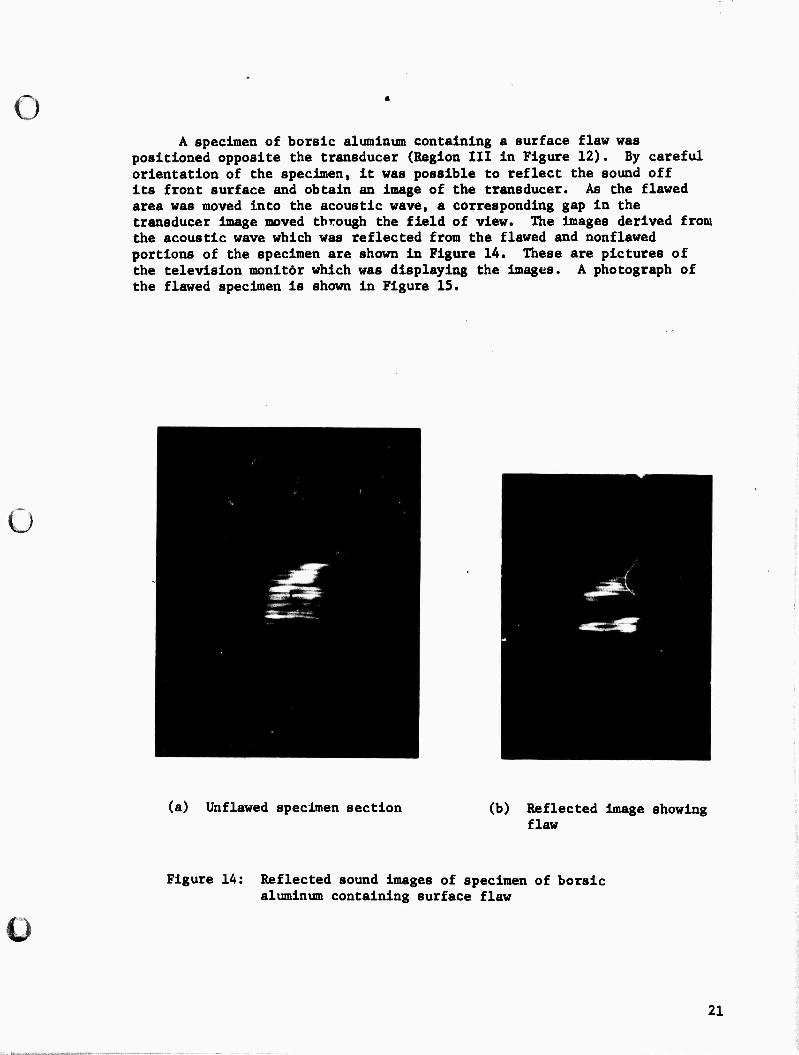
o A specimen of borsic aluminum containing a surface flaw was
positioned opposite the transducer (Region III In Figure 12). By careful orientation of the specimen, It was possible to reflect the sound off Its front surface and obtain an Image of the transducer. As the flawed area was moved Into the acoustic wave, a corresponding gap In the transducer Image moved through the field of view. The Images derived from the acoustic wave which was reflected from the flawed and nonflawed portions of the specimen are shown In Figure 14. These are pictures of the television monitor which was displaying the Images. A photograph of the flawed specimen Is shown In Figure 15.
O
(a) Unflawed specimen section (b) Reflected image showing flaw
Figure 14: Reflected sound images of specimen of borsic aluminum containing surface flaw
Ü
21
■"^■^wmmm&m

Figure 15: Flawed section of borsic aluminum specimen
Further tests will Investigate the applicability of these techniques to the Imaging of Internal flaws In the specimen. It Is necessary to eliminate the acoustic wave which Is reflected from the front surface of the specimen from that which carries the signal from Inside the specimen. This requires that the acoustic pulse length (AL ■ vAt) be smaller than twice the flaw depth. Much shorter acoustic and light pulse durations are required than used for the tests discussed above. To meet these requirements, TRW Is presently constructing a new pulsed xenon laser using company capital funds. This laser will provide pulse durations as short as one microsecond. The peak power will be about 100 watts with a nominal repetition rate of 100 pps. The pulsed oscillator already has the capability of short pulse durations. It 1» expected that the new laser will be operational within the next two months. It is also worthwhile tc note that proper timing and phasing of the light and sound waves will allow for the use of range gating techniques to determine the depth of the flaw in the specimen.
CONCLUSIONS
Test specimens were fabricated for measuring the resolution of the acousto-optical imaging system. These consisted of sets of four closely
22
O

'•* spaced holes of varying diameters. The resolution was defined as the ability to distinguish the Individual holes. These holes were imaged using acoustic frequencies ranging from 4 to 40 MHz. The ability to resolve the holes agreed well with the theoretical predictions. As expected, the resolution is proportional to the acoustic frequency. Equation 2 also predicts that the resolution is proportional to the cone convergence angle (i.e., that a larger angle will lower the minimum resolvable distance). Different cone angles will be tried during the next phase of this study.
A system was designed to investigate the use of reflective sound for acousto-optical Imaging. Pulsed light and soind sources were used in synchronization so that the object could be "range-gated." Images were obtained in both the transmission and reflection mode by adjusting the relative phasing of the light and sound sources. The image iitensities were low due to the low duty cycle of the pulsing. This was overcome by the use of a closed-circuit television system to both amplify and enlarge the visual image. Images of a surface flaw on a specimen of borsic aluminum were obtained with the reflection technique. The applicability of these methods to the Imaging of internal flaws will be the subject of further tests. A pulsed xenon laser to be used for this study is currently being fabricated using TRW capital funds.
B Further efforts will include an Investigation of the effects of
specimen geometry and surface roughness on the quality of the acousto- optical image. It will be determined whether the three-dimensional character of the flau can be determined. Finally, an analysis will be performed to design an acoustic microscope based upon the acousto-optical Imaging technique.
REFERENCES
1. R. Aprahamian and P. G. Bhuta, "NDT by Acousto-Optical Imaging," to be published in Material Evaluation, May, 1971.
2. R. Adler, "Interaction Between Light and Sound," IEEE Spectrum, pp. 42-54, May 1967. ^ ^
3. S. H. Bartley, "The Psychophysiology of Vision," pp 945-948, Handbook of Experimental Psychology, edited by S. S. Stevens, John Wiley & Sons, Inc., New York, 1951.
4. N. E. Dorsey, Properties of Ordinary Water-Substance, Reinhold Pub., 1940, pg 197.
5. C. S. Tsal and H. V. Hance, "Experimental Investigation of the Resolution Capability ol Microwave Ultrasonic-Beam Visualization Techniques Using Bragg Diffraction of a Laser Beam," J. Acoust. Soc. Amer. 48, 1110-1118 (1970). ~
6. J. W. Goodman, Introduction to Fourier Optics, McGraw-Hill, San Francisco, 1968, pp. 70-72.
23
■■■■■ ■ : ««,:J