Beautiful Warrior: The Legend of the Nun's Kung Fu (by Emily Arnold McCully)
Homocysteine (Hcy)
A Strong Risk Factor for Cardiovascular Disease
A guide to Homocysteine, correlation to human disease, and various
testing methods
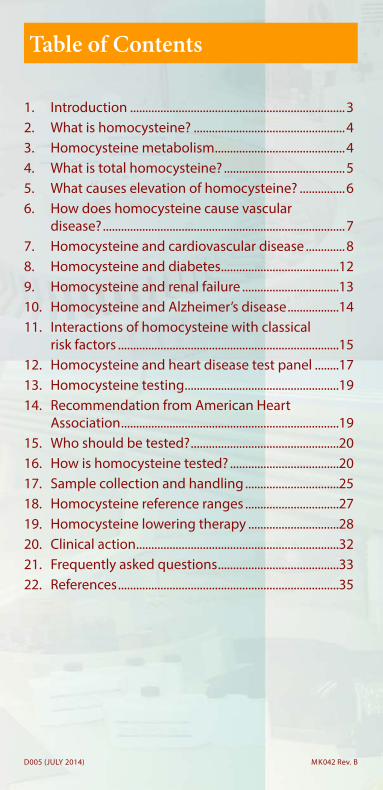
1. Introduction .......................................................................32. What is homocysteine? ..................................................43. Homocysteine metabolism ...........................................44. What is total homocysteine? ........................................55. What causes elevation of homocysteine? ...............66. How does homocysteine cause vascular disease? ................................................................................77. Homocysteine and cardiovascular disease .............88. Homocysteine and diabetes .......................................129. Homocysteine and renal failure ................................1310. Homocysteine and Alzheimer’s disease .................1411. Interactions of homocysteine with classical risk factors .........................................................................1512. Homocysteine and heart disease test panel ........1713. Homocysteine testing ...................................................1914. Recommendation from American Heart Association ........................................................................1915. Who should be tested? .................................................2016. How is homocysteine tested? ....................................2017. Sample collection and handling ...............................2518. Homocysteine reference ranges ...............................2719. Homocysteine lowering therapy ..............................2820. Clinical action ...................................................................3221. Frequently asked questions ........................................3322. References .........................................................................35
Table of Contents
D005 (JULY 2014) MK042 Rev. B

Homocysteine (Hcy), a sulphur- containing amino acid, was first isol ted from a urinary bladder stone in 1933 by Vincent du Vigneaud who later received the Nobel Prize in chemistry in 1955.
In 1969, Dr. Kilmer McCully, a Harvard pathologist, published a paper in
the American Journal of Pathology, describing vascular pathology in patients suffering from homocystinuria, suggest-ing for the first time th t elevated Hcy was a likely cause of premature vascular disease. Dr. McCully encountered two children with a genetic disorder called homocystinuria. In patients with this dis-
order, Hcy is present in the blood in excess amounts and excreted in the urine. Strikingly, these children, one of them a boy only 2 months old, had an advanced stage of arteriosclerosis that closely resembled that seen in older adults with advanced cardiovascular disease. These young patients also had extremely high levels of Hcy in their blood and urine and no lipid deposits in their vascular plaques. Autopsy tissue from an 8 year old homocystinuria child who died of a stroke looked exactly like those of elderly men with arteriosclerosis. These observations led Dr. McCully to hypothesize that these conditions could be the direct result of exposure to an elevated level of Hcy in the circulating blood. However, this hypothesis was not accepted by the medical community until the late 1980s when similar observations were confi med by European doctors.
By the 1990s, an explosion of studies examining this hypothesis has brought Hcy and its role as a risk factor for cardiovascular disease into a whole new light. Today, it is widely accepted that an elevated level of Hcy (>15 µmol/L) is an independent risk factor for
Introduction
Vincent du Vigneaud
Kilmer McCully
3

cardiovascular disease. Recent studies have also demon-strated a strong correlation between elevated Hcy levels and diseases such as diabetes, Alzheimer’s, osteoporosis, and renal failure. More and more research data is begin-ning to merge into a consensus that Hcy is an important indicator for overall health status. Professor Per-Magne Ueland, a leading scientist in Hcy research from the University of Bergen/Haukeland Hospital, Norway, states:
“Hcy is in fact a health measure. There is an extraor-dinary connection between the quantity of Hcy and the patient’s general state of health. The Hcy value is an indicator for both health and non-health factors such as exercise, smoking, coffee drinking, cholesterol, vitamins, etc.”
What is Hcy?Hcy is a sulphur-containing amino acid with a
molecular weight of 135.2 Dalton. Hcy is not contained in the protein or DNA, but is a metabolic intermediary derived from the essential sulphur containing amino acid, methionine.
HOOC-CH-CH2-CH2-S-H Hcy molecule |
NH2
Hcy Metabolism
Figure 14
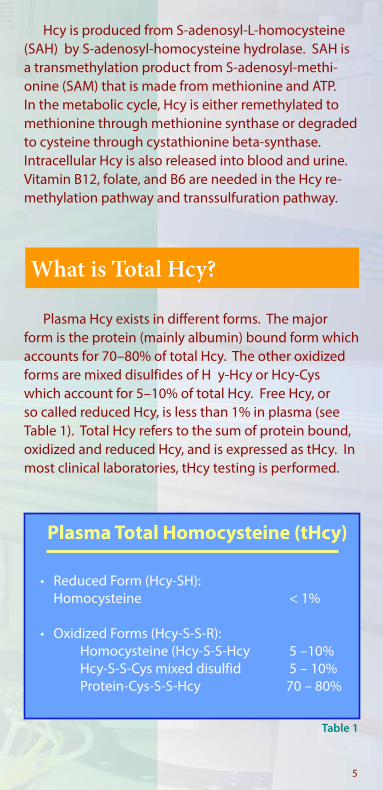
Hcy is produced from S-adenosyl-L-homocysteine (SAH) by S-adenosyl-homocysteine hydrolase. SAH is a transmethylation product from S-adenosyl-methi-onine (SAM) that is made from methionine and ATP. In the metabolic cycle, Hcy is either remethylated to methionine through methionine synthase or degraded to cysteine through cystathionine beta-synthase. Intracellular Hcy is also released into blood and urine. Vitamin B12, folate, and B6 are needed in the Hcy re-methylation pathway and transsulfuration pathway.
What is Total Hcy?
Plasma Total Homocysteine (tHcy)
• Reduced Form (Hcy-SH): Homocysteine < 1%
• Oxidized Forms (Hcy-S-S-R): Homocysteine (Hcy-S-S-Hcy 5 –10% Hcy-S-S-Cys mixed disulfid 5 – 10% Protein-Cys-S-S-Hcy 70 – 80%
Plasma Hcy exists in different forms. The major form is the protein (mainly albumin) bound form which accounts for 70–80% of total Hcy. The other oxidized forms are mixed disulfides of H y-Hcy or Hcy-Cys which account for 5–10% of total Hcy. Free Hcy, or so called reduced Hcy, is less than 1% in plasma (see Table 1). Total Hcy refers to the sum of protein bound, oxidized and reduced Hcy, and is expressed as tHcy. In most clinical laboratories, tHcy testing is performed.
5
Table 1
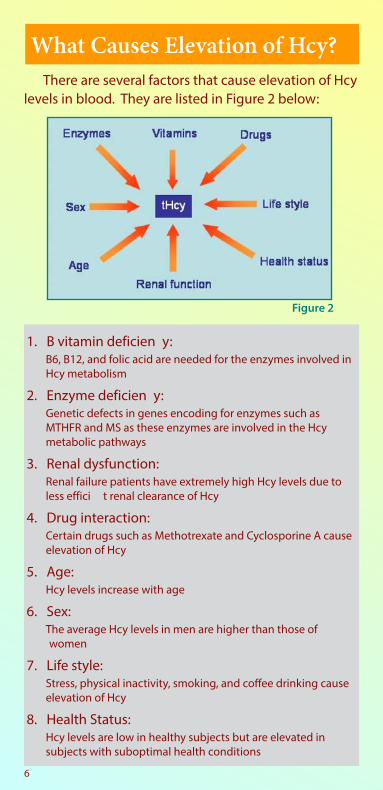
There are several factors that cause elevation of Hcy levels in blood. They are listed in Figure 2 below:
What Causes Elevation of Hcy?
Figure 2
1. B vitamin deficien y: B6, B12, and folic acid are needed for the enzymes involved in Hcy metabolism
2. Enzyme deficien y:Genetic defects in genes encoding for enzymes such as MTHFR and MS as these enzymes are involved in the Hcy metabolic pathways
3. Renal dysfunction:Renal failure patients have extremely high Hcy levels due to less effici t renal clearance of Hcy
4. Drug interaction:Certain drugs such as Methotrexate and Cyclosporine A cause elevation of Hcy
5. Age: Hcy levels increase with age
6. Sex:The average Hcy levels in men are higher than those of
women
7. Life style:Stress, physical inactivity, smoking, and coffee drinking cause elevation of Hcy
8. Health Status:Hcy levels are low in healthy subjects but are elevated in subjects with suboptimal health conditions
6
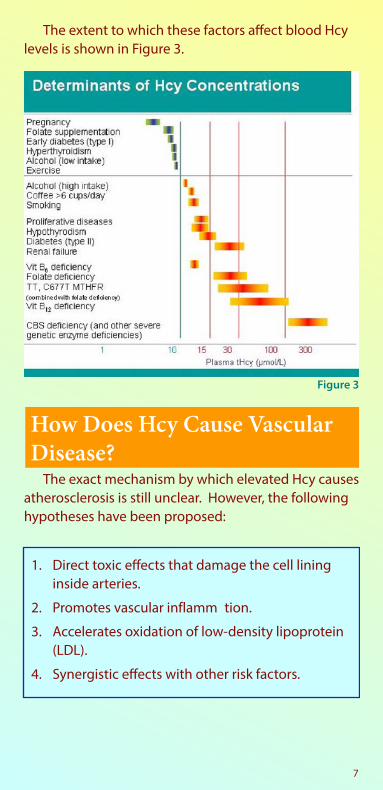
The extent to which these factors affect blood Hcy levels is shown in Figure 3.
Figure 3
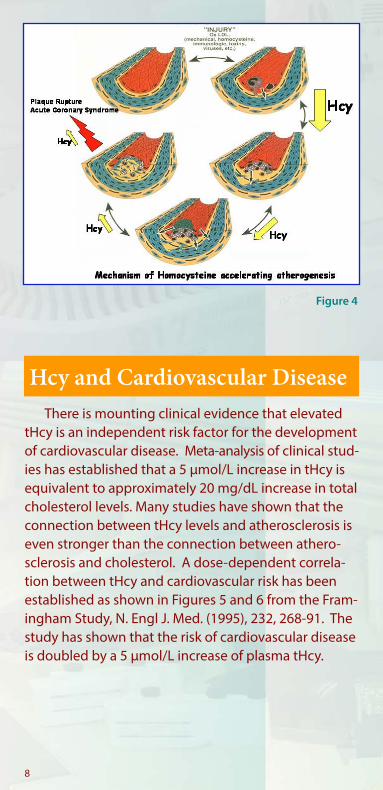
The exact mechanism by which elevated Hcy causes atherosclerosis is still unclear. However, the following hypotheses have been proposed:
How Does Hcy Cause Vascular Disease?
1. Direct toxic effects that damage the cell lining inside arteries.
2. Promotes vascular inflamm tion.
3. Accelerates oxidation of low-density lipoprotein (LDL).
4. Synergistic effects with other risk factors.
7
There is mounting clinical evidence that elevated tHcy is an independent risk factor for the development of cardiovascular disease. Meta-analysis of clinical stud-ies has established that a 5 µmol/L increase in tHcy is equivalent to approximately 20 mg/dL increase in total cholesterol levels. Many studies have shown that the connection between tHcy levels and atherosclerosis is even stronger than the connection between athero-sclerosis and cholesterol. A dose-dependent correla-tion between tHcy and cardiovascular risk has been established as shown in Figures 5 and 6 from the Fram-ingham Study, N. Engl J. Med. (1995), 232, 268-91. The study has shown that the risk of cardiovascular disease is doubled by a 5 µmol/L increase of plasma tHcy.
Hcy and Cardiovascular Disease
Figure 4
8
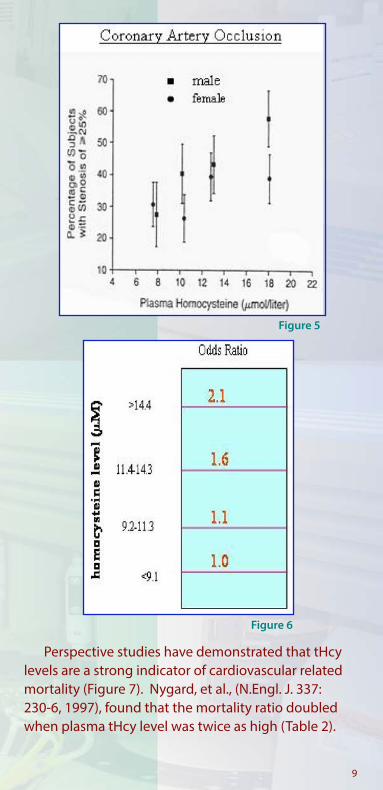
Figure 5
Figure 6
Perspective studies have demonstrated that tHcy levels are a strong indicator of cardiovascular related mortality (Figure 7). Nygard, et al., (N.Engl. J. 337: 230-6, 1997), found that the mortality ratio doubled when plasma tHcy level was twice as high (Table 2).
9

Figure 7
Homocysteine Levels and Mortality
Hcy level (µM) Mortality Ratio
9.0-14.9 1.915.0-19.9 2.8>20.0 4.5
(ρ = .02)
Nygard, O. et al., (1997) N. Engl. J. Med. 337: 230-6
Boushey, et al., performed a meta-analysis of 27 clinical studies, and summarized the odds ratio between elevated tHcy and development of vascular disease (Table 3).
Meta-analysis of 27 Clinical Studies
Disease Category Sex OR (95% Cl)Coronary artery dis.(17 studies)
M F
1.6 (1.4-1.7) 1.8 (1.4-2.3)
Cerebrovasc. dis. (11 studies)
M/F 1.9 (1.6-2.3)
Peripheral vasc. dis. (3 studies)
M/F 6.8 (2.9-15.8)
10
Table 2
Table 3
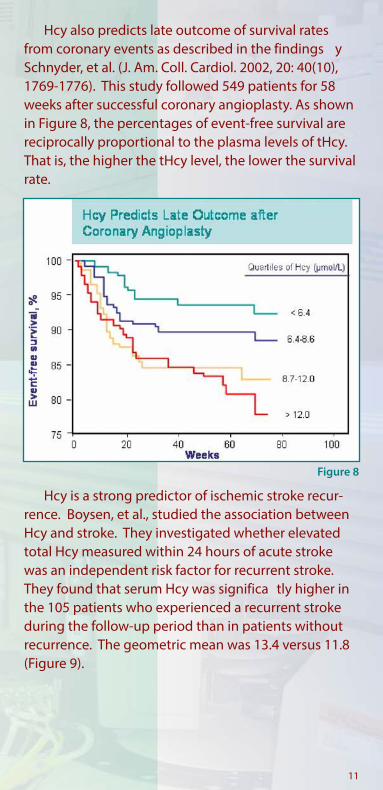
Hcy also predicts late outcome of survival rates from coronary events as described in the findings y Schnyder, et al. (J. Am. Coll. Cardiol. 2002, 20: 40(10), 1769-1776). This study followed 549 patients for 58 weeks after successful coronary angioplasty. As shown in Figure 8, the percentages of event-free survival are reciprocally proportional to the plasma levels of tHcy. That is, the higher the tHcy level, the lower the survival rate.
Hcy is a strong predictor of ischemic stroke recur-rence. Boysen, et al., studied the association between Hcy and stroke. They investigated whether elevated total Hcy measured within 24 hours of acute stroke was an independent risk factor for recurrent stroke. They found that serum Hcy was significa tly higher in the 105 patients who experienced a recurrent stroke during the follow-up period than in patients without recurrence. The geometric mean was 13.4 versus 11.8 (Figure 9).
Figure 8
11

Figure 9
Hcy concentrations are a higher risk factor for death in type 2 diabetes patients (non-insulin dependent diabetes) as compared to non-diabetic patients. Ueland, et al., showed that the combined effects of elevated tHcy levels increased the risk of total mortality in 587 diabetes mellitus patients who had been diagnostically confi med for coronary artery disease. As shown in Figure 10, the investigators concluded that the combination of elevat-ed Hcy and diabetes exponentially increased the risk of mortality in diabetic patients.
Hcy and Diabetes
Hcy and Diabetes, Promotion of CVD Risk
Figure 1012

Hoogeveen, et al., demonstrated that among type 2 diabetic subjects with tHcy levels >14 µmol/L, the estimated survival time was significa tly shorter than type 2 diabetic subjects with tHcy concentrations <14.0 µmol/L (Figure 11).
The elevation of tHcy levels in diabetic patients is believed to be related to the degree of diabetic nephropathy, especially in type 2 diabetes patients who often have metabolic problems and unhealthy lifestyles that may contribute to elevated tHcy concen-trations when compared with non-diabetic subjects.
tHcy levels are highly elevated in renal failure patients. Impaired renal excretion and/or tubular metabolism of Hcy, and extra renal factors, like secondary vitamin deficiencies ( .g., in connection with hemodialysis), genetic causes, and altered Hcy metabolism are among the reasons.
Hcy and Renal Failure
Figure 11
13
The search for modifiable isk factors for Alzheimer’s disease has been intensive. Three risk factors previously identified or the disease are age, family history, and the presence of a specific genetic t ait termed APOE epsilon 4. Recently, Dr. Sudha Seshadri at Boston University reported that elevated Hcy is a risk factor for the development of Alzheimer’s disease (N. Eng. J. Med, 346: Feb. 14, 2002). In the study, the investigators, using data from the Framingham Heart Study, found that 30% of people showing the highest tHcy levels had twice the risk of developing Alzheimer’s disease as people with average levels, although even mild elevations appeared to add some
Hcy and Alzheimer’s Disease
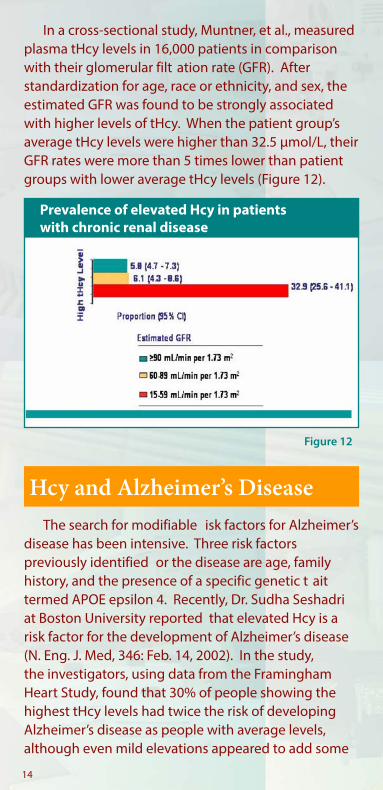
In a cross-sectional study, Muntner, et al., measured plasma tHcy levels in 16,000 patients in comparison with their glomerular filt ation rate (GFR). After standardization for age, race or ethnicity, and sex, the estimated GFR was found to be strongly associated with higher levels of tHcy. When the patient group’s average tHcy levels were higher than 32.5 µmol/L, their GFR rates were more than 5 times lower than patient groups with lower average tHcy levels (Figure 12).
Figure 12
14
Prevalence of elevated Hcy in patients with chronic renal disease
risk. The study concluded that elevated tHcy accounts for about 15% of the population’s risk in developing Alzheimer’s disease. This implies that if tHcy were entirely removed from the equation, 15% of cases may be preventable. Moreover, it was concluded a 40% increase in developing Alzheimer’s disease was associ-ated with each 5 µmol/L rise in tHcy levels.
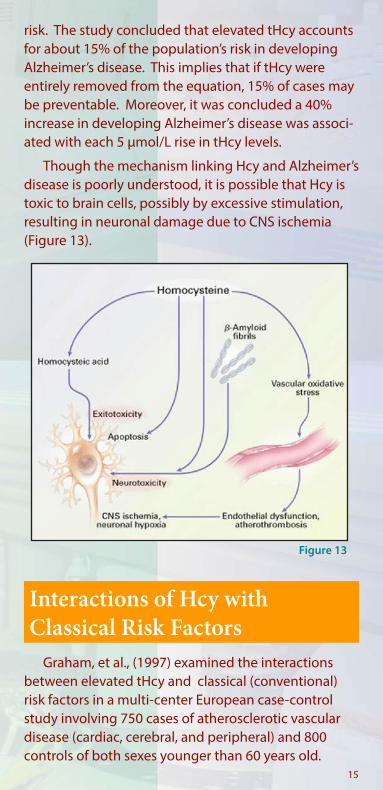
Though the mechanism linking Hcy and Alzheimer’s disease is poorly understood, it is possible that Hcy is toxic to brain cells, possibly by excessive stimulation, resulting in neuronal damage due to CNS ischemia (Figure 13).
Figure 13
Graham, et al., (1997) examined the interactions between elevated tHcy and classical (conventional) risk factors in a multi-center European case-control study involving 750 cases of atherosclerotic vascular disease (cardiac, cerebral, and peripheral) and 800 controls of both sexes younger than 60 years old.
Interactions of Hcy with Classical Risk Factors
15
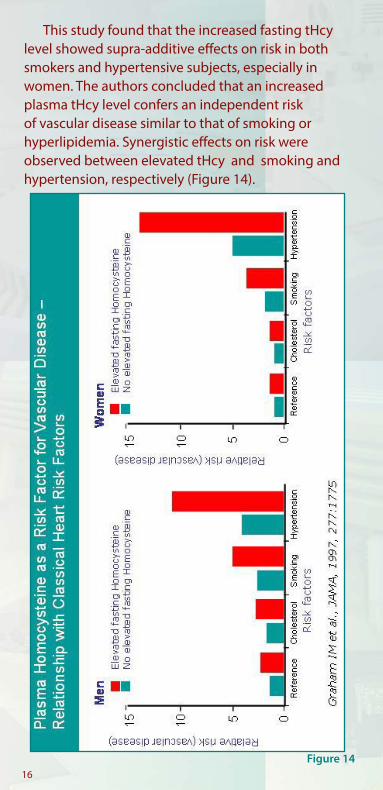
This study found that the increased fasting tHcy level showed supra-additive effects on risk in both smokers and hypertensive subjects, especially in women. The authors concluded that an increased plasma tHcy level confers an independent risk of vascular disease similar to that of smoking or hyperlipidemia. Synergistic effects on risk were observed between elevated tHcy and smoking and hypertension, respectively (Figure 14).
Figure 1416
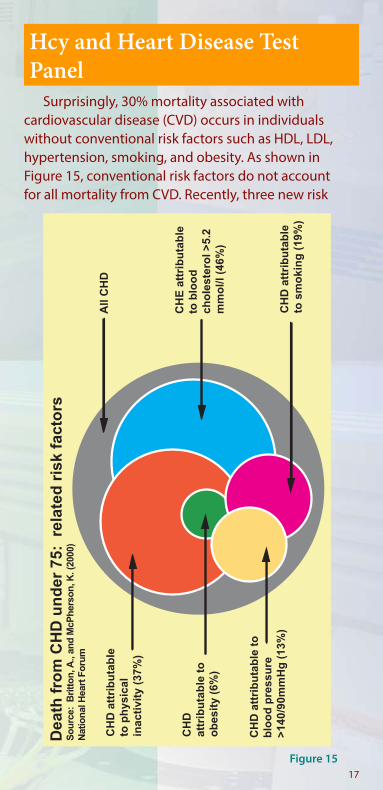
Surprisingly, 30% mortality associated with cardiovascular disease (CVD) occurs in individuals without conventional risk factors such as HDL, LDL, hypertension, smoking, and obesity. As shown in Figure 15, conventional risk factors do not account for all mortality from CVD. Recently, three new risk
Hcy and Heart Disease Test Panel
Figure 1517
CH
D a
ttri
bu
tab
leto
ph
ysic
alin
acti
vity
(37
%)
CH
D
attr
ibu
tab
le t
oo
bes
ity
(6%
)
CH
D a
ttri
bu
tab
le t
ob
loo
d p
ress
ure
>14
0/90
mm
Hg
(13
%)
All
CH
D
CH
E a
ttri
bu
tab
leto
blo
od
cho
lest
ero
l >5.
2m
mo
l/l (
46%
)
CH
D a
ttri
bu
tab
leto
sm
oki
ng
(19
%)
Dea
th f
rom
CH
D u
nd
er 7
5: r
elat
ed r
isk
fact
ors
So
urc
e: B
ritt
on
, A.,
and
McP
her
son
, K. (
2000
)N
atio
nal
Hea
rt F
oru
m
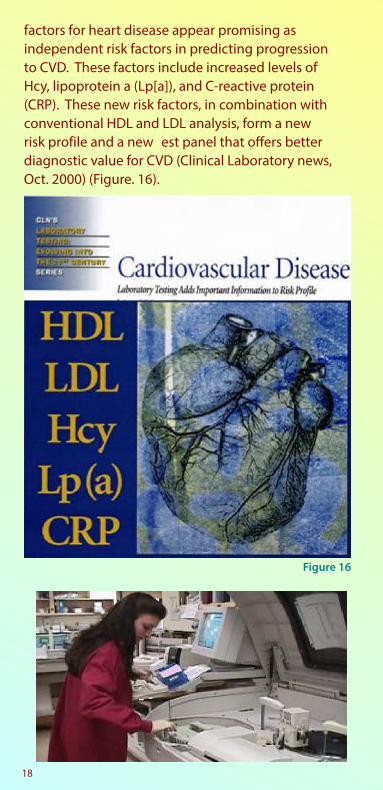
factors for heart disease appear promising as independent risk factors in predicting progression to CVD. These factors include increased levels of Hcy, lipoprotein a (Lp[a]), and C-reactive protein (CRP). These new risk factors, in combination with conventional HDL and LDL analysis, form a new risk profile and a new est panel that offers better diagnostic value for CVD (Clinical Laboratory news, Oct. 2000) (Figure. 16).
Figure 16
18

There are three main indications for determining tHcy:1. to diagnose homocystinuria2. to identify individuals with or at risk of develop-
ing B12 and folate deficien y, and3. to assess tHcy as a risk factor for cardiovascular
disease and other diseases
Presently, Hcy screening in an unselected popula-tion is not recommended. However, there is a growing consensus that Hcy measurement in high-risk patients and their siblings is recommended. Furthermore, Hcy tests are recommended to assess the total risk profileof patients with manifest cardiovascular disease.
In connection with cardiovascular disease, the Nutrition Committee of the American Heart Associa-tion issued a statement in 1999 regarding Hcy testing. It states as follows:
Recommendation from the American Heart Association
Hcy Testing
“a reasonable approach is to determine levels of fast-ing homocysteine in “high-risk patients”, i.e., in those with strong family history for premature atheroscle-rosis or with arterial occlusive diseases, particularly in the absence of other risk factors, as well as in mem-bers of their families.Other conditions that may be associated with high homocysteine are advanced age, hypothyroidism, impaired kidney function, systemic lupus erythema-tosus, and certain medications, e.g., nicotinic acid, nitrous oxide exposure, theophylline, methotrexate, and L-dopa.”
19

Elevated Hcy is not only an independent risk factor for cardiovascular disease, but it also interacts syner-gistically with classical risk factors such as smoking, hypertension, diabetes and hyperlipidemia. Therefore, the identific tion of hyperhomocysteinemic patients with a high risk of vascular disease is of particular importance.
Patients having the disease indications listed in Table 4 are recommended to have their tHcy levels tested.
Who Should Be Tested?
Patient serum or plasma samples are used in tHcy testing. In the test, serum or plasma is first t eated with a reducing agent that converts all Hcy species into the reduced form which is measured either directly or after derivatization. Currently, there are three main tHcy test methods available to the clinical laboratories. They include:
1. Chromatographic method2. Immunoassay method3. Enzyme cycling method
How Is Hcy Tested?
20
Proposed Patient Groups and Hcy Testing Recommendations
Recommended Not Recommended
Asymptomatic subjects XPatients with manifest CVD X
Strong family history of premature CVD XAsymptomatic, high risk patients:
• Smoking X• Hypertension X• Dyslipidemia X• Diabetic Disease X
• Renal Insufficie y X• Alzheimer’s Disease X• Pregnancy complications X
Table 4

The Chromatographic method or HPLC method-based tHcy test was developed in the early 1980s, and is mainly used in research laboratories.
The Immunoassay-based tHcy test was developed in the mid 1990s, and has been automated for special immunoassay instruments.
The latest technology in tHcy testing is the enzyme cycling-based method that has been developed in the last few years. The enzyme cycling method can be used on any automated clinical chemistry analyzer, and is quickly becoming the preferred method for clinical laboratories.
How do these methods work?
1. Chromatographic Method:
The Chromatographic assay usually uses an HPLC or amino acid analyzer and an ion exchange column to separate derivatized Hcy molecules based on retention times. The quantific tion is achieved by comparing the Hcy peak area with the peak area of an Hcy stan-dard that is eluted at the same retention time. Each HPLC test takes 10-30 min after sample pre-treatment (another 30-60 min). HPLC testing can only be run sequentially, and is not suited for testing large num-bers of samples. It often requires a skilled staff and is alabor-intensive, low-throughput test method. A typical chromatography is shown in the Figure 17.
21
Hcy
HPLCFigure 17
time (minutes)
0 5 10 15 20 25
det
ecto
rre
spo
nse
2. Immunoassay Method:
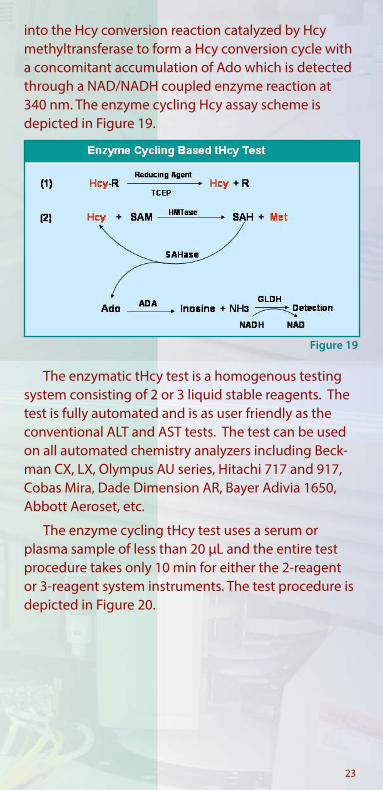
The immunoassay developed by Axis-Shield is based on the specific binding of an a tibody towards the homocysteine enzyme conversion product, SAH. It is a competition assay for binding between SAH from the serum sample and from a tracer that is tagged with a fluo escent chromophore. The detection is based on the changes in fluo escent polarization of the tracer after binding to the antibody (Figure 18). The quantific tion is achieved through construction of a standard curve with multiple known concentrations of Hcy calibrators.
3. Enzyme Cycling Method:
The enzyme cycling-based tHcy test is the latest method where the enzyme cycling technique is used to amplify the detection signal which improves the assay sensitivity. In the assay, protein bound Hcy or oxidized Hcy are first educed to free Hcy. Next, free Hcy is converted to methionine by the enzyme Hcy methyltransferase using SAM as the methyl donor or co-substrate. The transmethylation reaction converts the co-substrate SAM to SAH (co-substrate conver-sion product) which is then immediately hydrolzyed into Hcy and Adenosine (Ado) by an enzyme SAH hydrolase. The Hcy thus generated from SAM enters
Figure 18
22
into the Hcy conversion reaction catalyzed by Hcy methyltransferase to form a Hcy conversion cycle with a concomitant accumulation of Ado which is detected through a NAD/NADH coupled enzyme reaction at 340 nm. The enzyme cycling Hcy assay scheme is depicted in Figure 19.
The enzymatic tHcy test is a homogenous testing system consisting of 2 or 3 liquid stable reagents. The test is fully automated and is as user friendly as the conventional ALT and AST tests. The test can be used on all automated chemistry analyzers including Beck-man CX, LX, Olympus AU series, Hitachi 717 and 917, Cobas Mira, Dade Dimension AR, Bayer Adivia 1650, Abbott Aeroset, etc.
The enzyme cycling tHcy test uses a serum or plasma sample of less than 20 µL and the entire test procedure takes only 10 min for either the 2-reagent or 3-reagent system instruments. The test procedure is depicted in Figure 20.
Figure 19
23

Figure 20
What are the advantages and disadvantages of these tHcy test methods?
There are significa t differences among these tHcy testing methods including precision, speed, and cost. Figure 21 depicts these differences.
The HPLC method gives better precision over the immunoassay method, but requires manual sample pre-treatment steps, and therefore is more labor- intensive. This method is not widely used in major clinical laboratories.
Figure 2124
Test procedure for 2 reagent system

The Immunoassay method, although automated, requires special instruments that can handle more than 4 reagents per test and a special detection system such as fluo escent polarization (FP). Since the assay involves 4 or more reagents, and multiple steps, it is more expensive, and takes 30-45 min per test. The precision of the immunoassay is often lower than that of HPLC or enzymatic assays.
The enzyme cycling test uses less reagents and is faster on a per-test basis, and therefore is less expensive. It does not require sample pre-treatment and special instruments and can be used on any major automated clinical chemistry analyzers. It is the preferred method, especially for those laboratories routinely testing large numbers of samples.
Food intake and diurnal and seasonal variations: A small meal will not influen e tHcy concentrations in healthy people, whereas intake of a large, protein-rich meal may increase the plasma tHcy concentration by 10-15% after 6-8 hours. This may explain the diurnal variation, with tHcy concentrations being lowest in the first pa t of the day and highest in the evening. Plasma tHcy is most likely not subject to seasonal variation. For accurate tHcy testing, there is no need for fasting before blood collection, however, a light meal or low protein food intake is recommended.
Serum or plasma preparation: After blood collec- tion, but prior to removal of the blood cells, there is a time and temperature-dependent increase in tHcy. This is because the synthesis of Hcy is still taking place inside the red blood cells and Hcy is continuously released into the serum or plasma. At room temper-ature, the increase in tHcy is about 1 µmol/L per hour, but is not dependent on the initial tHcy concentration. Hence, this corresponds to an ~10% increase per hour
Sample Collection and Handling
25

at room temperature in a typical sample with 10 µmol/L tHcy. Therefore, it is very important to centrifuge blood samples immediately after collection to separate the plasma and the blood cells. If immediate centrifugation of anticoagulated whole blood is not possible, the artificial inc ease of tHcy can be reduced by keeping the blood on ice and separating the plasma from the cells within 1 hour.
For plasma preparation, heparin or EDTA are the recommended anticoagulants. For serum prepara-tion, SST tubes (gel serum tubes) are recommended to separate cells and serum by centrifugation within 30 min. The tHcy concentration remains stable for at least 48 hours at room temperature without removal of serum from the tubes since the gel cloth prevents the diffusion of H y from packed cells into the serum phase. Thus, the use of SST tubes for tHcy determina-tion is preferred as it simplifies the blood ollection procedure.
Use of Hcy stabilizers has been suggested, but is not recommended since some of the stabilizers may not be compatible with tHcy testing methods. For example, SAH hydrolase inhibitor 3-deazaadenosine can not be used as a Hcy stabilizer when either the immunoassay or enzyme cycling assay are used for tHcy testing. This is because both of these methods use SAH hydrolase in their assays.
Stability of tHcy in stored plasma/serum: After removal of the blood cells, tHcy in plasma or serum is stable. No changes are observed for at least 4 days at room temperature, for several weeks at 4°C, or for several years at -20°C.
Freeze-thaw cycles are usually well tolerated, however, after freezing, it is often observed that heterogeneity of the sample matrix is a common problem. Given this, thorough mixing of the samples is required after thawing.
26

Reference ranges, normally defined as the entral 95% confiden e interval of tHcy in a presumed healthy population will vary with age, gender and ethnicity of the specific popul tion studied. Therefore, the refer-ence range should be determined by each laboratory to conform to the characteristics of the population being tested.
Furthermore, lower and upper reference ranges should be established in countries with mandatory food folic acid fortific tion, like in the U.S. and Canada. In these countries, vitamin supplementation has re-sulted in a considerable reduction of tHcy values in the general population.
The values listed in the table below were presented by Vilaseca, et al. (Clin Chem 43:690, 1998) and; Faure-Delanef, et al. (Am J Hum Genet 60:1001, 1997). In most of the U.S. clinical laboratories, the cut-off alue for adults (<65 years old) is 15 µmol/L. However, in the European countries, a plasma tHcy concentration of 12 µmol/L has been used as the upper limit of the “normal” range (see Table 5).
Age tHcy, µmol/LNewborns 3-6Adolescents 5-8Adults (15-65 years old): Male Female
6-15 3-12
Elderly (>65 years old) 15-20Centenarians 25-27
Generally, newborns and pregnant women have the lowest normal ranges (3-6 µmol/L), whereas the elderly (>65 years old) have the highest normal range (15-20 µmol/L).
Hcy Reference Ranges
27
Table 5
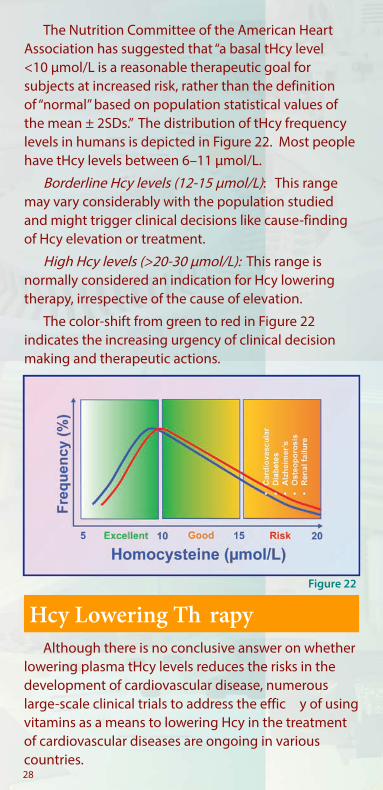
The Nutrition Committee of the American Heart Association has suggested that “a basal tHcy level <10 µmol/L is a reasonable therapeutic goal for subjects at increased risk, rather than the definitionof “normal” based on population statistical values of the mean ± 2SDs.” The distribution of tHcy frequency levels in humans is depicted in Figure 22. Most people have tHcy levels between 6–11 µmol/L.
Borderline Hcy levels (12-15 µmol/L): This range may vary considerably with the population studied and might trigger clinical decisions like cause-findingof Hcy elevation or treatment.
High Hcy levels (>20-30 µmol/L): This range is normally considered an indication for Hcy lowering therapy, irrespective of the cause of elevation.
The color-shift from green to red in Figure 22 indicates the increasing urgency of clinical decision making and therapeutic actions.
Although there is no conclusive answer on whether lowering plasma tHcy levels reduces the risks in the development of cardiovascular disease, numerous large-scale clinical trials to address the effic y of using vitamins as a means to lowering Hcy in the treatment of cardiovascular diseases are ongoing in various countries.
Hcy Lowering Th rapy
28
Figure 22

Raymond Meleady and Ian Graham, two leading scientists in Hcy research, recommend that:
“While awaiting the outcome of these trials, there may already be suffici t evidence to prescribe homo-cysteine-lowering therapy in subjects deemed to be at high risk of cardiovascular disease.”
It has been well established that vitamins B12 and folate are effective in lowering plasma levels of tHcy. Ward, M., et al., (QJM, 1997, 90: 519-24) conducted a Hcy lowering study on 30 healthy male volunteers using low doses of folic acid for various periods of time (6-14 weeks) as shown in Figure 23. The tHcy lowering effic y is dependent on the initial levels of tHcy. People with high levels of initial tHcy will have a higher percentage of tHcy reduction than the reduction of those with lower initial levels of tHcy. The tHcy level will eventually return to the initial level when vitamin treatment is terminated.
Similar results have been observed in a study by Ubbink et al. On average, a daily intake of 0.65 mg of folic acid showed similar Hcy lowering effects as compared to a combination of folic acid (0.65 mg), vitamin B6 (10 mg) and vitamin B12 (0.4 mg). Average reductions were 42 and 50%, respectively as shown in Figure 24.
Figure 23
29
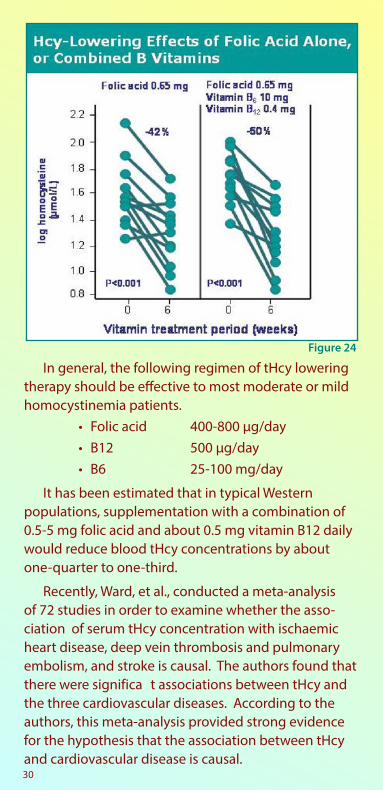
Figure 24
In general, the following regimen of tHcy lowering therapy should be effective to most moderate or mild homocystinemia patients.
• Folic acid 400-800 µg/day• B12 500 µg/day• B6 25-100 mg/day
It has been estimated that in typical Western populations, supplementation with a combination of 0.5-5 mg folic acid and about 0.5 mg vitamin B12 daily would reduce blood tHcy concentrations by about one-quarter to one-third.
Recently, Ward, et al., conducted a meta-analysis of 72 studies in order to examine whether the asso-ciation of serum tHcy concentration with ischaemic heart disease, deep vein thrombosis and pulmonary embolism, and stroke is causal. The authors found that there were significa t associations between tHcy and the three cardiovascular diseases. According to the authors, this meta-analysis provided strong evidence for the hypothesis that the association between tHcy and cardiovascular disease is causal.30
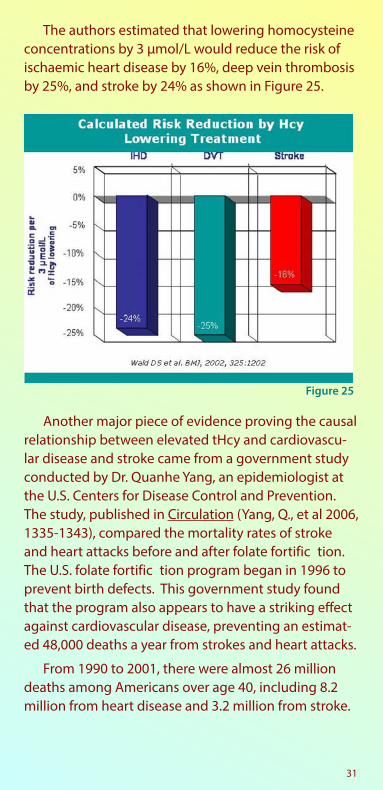
The authors estimated that lowering homocysteine concentrations by 3 µmol/L would reduce the risk of ischaemic heart disease by 16%, deep vein thrombosis by 25%, and stroke by 24% as shown in Figure 25.
Another major piece of evidence proving the causal relationship between elevated tHcy and cardiovascu-lar disease and stroke came from a government study conducted by Dr. Quanhe Yang, an epidemiologist at the U.S. Centers for Disease Control and Prevention. The study, published in Circulation (Yang, Q., et al 2006, 1335-1343), compared the mortality rates of stroke and heart attacks before and after folate fortific tion. The U.S. folate fortific tion program began in 1996 to prevent birth defects. This government study found that the program also appears to have a striking effect against cardiovascular disease, preventing an estimat-ed 48,000 deaths a year from strokes and heart attacks.
From 1990 to 2001, there were almost 26 million deaths among Americans over age 40, including 8.2 million from heart disease and 3.2 million from stroke.
Figure 25
31

After commencement of the folate fortific tion program, stroke mortality declined drastically. Prior to 1997, stroke mortality was declining about 1 percent per year. This decline has accelerated to almost 5 per-cent annually since. The decline was especially steep among black men, falling 7 percent a year after com-mencement of the program.
In all, the researchers estimate that folate fortific -tion led to 31,000 fewer deaths from stroke and 17,000 from heart disease each year from 1998 to 2001.
Clinical Action
The proposed clinical action is to check tHcy levels and to adhere to physician’s advice for tHcy lowering treatment if the tHcy level is >15 µmol/L. tHcy levels can be lowered by various Hcy-lowering agents includ-ing B vitamins, betaine, and N-acetylcysteine. Lifestyle changes can also help to lower levels of tHcy (Danker et al. Aging Clin. Exp. Res. 2004, 16: 437-442). It is recommended that each patient consult with their in-dividual physician for specific tH y-lowering treatment.
2. Lowering tHcy
1. Testing tHcy
3. Staying HealthyFigure 26
32
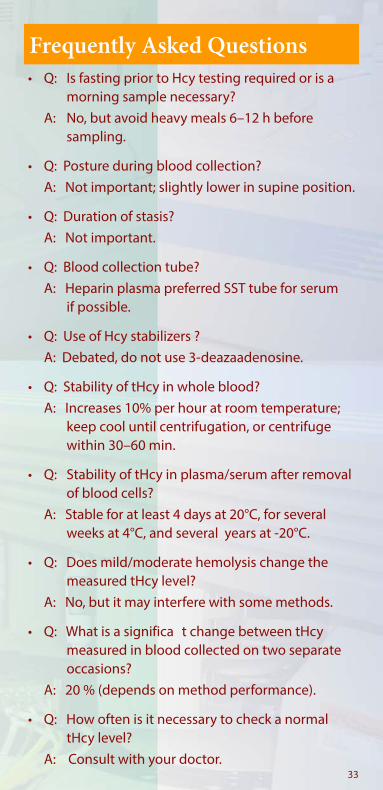
Frequently Asked Questions• Q: Is fasting prior to Hcy testing required or is a
morning sample necessary? A: No, but avoid heavy meals 6–12 h before
sampling.
• Q: Posture during blood collection? A: Not important; slightly lower in supine position.
• Q: Duration of stasis? A: Not important.
• Q: Blood collection tube? A: Heparin plasma preferred SST tube for serum
if possible.
• Q: Use of Hcy stabilizers ? A: Debated, do not use 3-deazaadenosine.
• Q: Stability of tHcy in whole blood? A: Increases 10% per hour at room temperature;
keep cool until centrifugation, or centrifuge within 30–60 min.
• Q: Stability of tHcy in plasma/serum after removal of blood cells?
A: Stable for at least 4 days at 20°C, for several weeks at 4°C, and several years at -20°C.
• Q: Does mild/moderate hemolysis change the measured tHcy level?
A: No, but it may interfere with some methods.
• Q: What is a significa t change between tHcy measured in blood collected on two separate occasions?
A: 20 % (depends on method performance).
• Q: How often is it necessary to check a normal tHcy level?
A: Consult with your doctor.33

• Q: When is repeat testing necessary to check vitamin response?
A: 14 days and 3 months after the start of treat-ment, then every 1–3 years.
• Q: How are borderline tHcy levels treated? A: Asymptomatic subjects: new test in 6–12
months; give advice on lifestyle changes.
• Q: Are there international tHcy calibrators? A: No, currently, no universally certified tH y
standard is available.
• Q: Can tHcy measured in two different laboratories be compared?
A: Only if the same calibrators are used.
• Q: What analytic range is required for a tHcy test method?
A: The method should cover the 0.5th-95th percentiles in the general population (~3-40 µmol/L).
* Q: Is the tHcy test interfered with by plasma cystathionine?
A: Yes, some enzymatic methods are interfered with by endogenous cystathionine.
* Q: How critical is cystathionine interference to patient tHcy levels?
A: It is critical since millions of renal failure patients have significa tly elevated plasma cystathionine levels, and method interfered by cystathionine will falsely report significa tly higher (20-300%) tHcy levels.
• Q: What if the tHcy level is beyond the analytic range?
A: Dilute the serum sample with water.
34

References1. Carmel, R., Jacobsen, D.W. , Homocysteine in health
and disease, Cambridge University Press, 20012. Snow C.F., Laboratory diagnosis of vitamin B12 and
folate deficien y: a guide for the primary care physi-cian. Arch Intern Med 1999;159:1289–98
3. Refsum, H., et al., Homocysteine and cardiovascular disease. Ann Rev Med 1998;49:31–62
4. Schnyder, G., et al., Decreased rate of coronary restenosis after lowering of plasma homocysteine levels. N Engl J Med 2001;345:1593–1600
5. Seshadri, S., et al., Plasma homocysteine as a risk factor for dementia and Alzheimer’s disease. N Engl J Med 2002;346:476–83
6. Jacques, P.F., et al., Determinants of plasma total homocysteine concentration in the Framingham Offspring cohort. Am J Clin Nutr 2001;73:613–21
7. Nygård, O., et al., Plasma homocysteine levels and mortality in patients with coronary artery disease. N Engl J Med 1997;337:230–6
8. Refsum, H. ,Total Homocysteine, guidelines for determination in clinical laboratories, Clinical Laboratory News, May 2002
9. Refsum, H., et al., Facts and Recommendations about Total Homocysteine Determinations: An Expert Opinion. Clin. Chem. 50: 3-32, 2004
10. Vemeulen, E.G.J., et al., Effect of homocysteine-lowering treatment with folic acid plus vitamin B6 on progression of subclinical atherosclerosis: a randomised, placebo-controlled trial. The Lancet 355: 517-522, 2000
Contact: Diazyme Laboratories 12889 Gregg Court Poway, CA 92064 Tel: 858-455-4768 Fax: 858-455-3701
35
DIAZYME

ww
w.diazym
e.com
DIAZYME