Hominid mandibular corpus shape variation and its utility ... corpora are well represented in the...
16
J. Anat. (2008) 213, pp670–685 doi: 10.1111/j.1469-7580.2008.00989.x © 2008 The Authors Journal compilation © 2008 Anatomical Society of Great Britain and Ireland Blackwell Publishing Ltd Hominid mandibular corpus shape variation and its utility for recognizing species diversity within fossil Homo Michael R. Lague, 1 * Nicole J. Collard, 2 * Brian G. Richmond 3 and Bernard A. Wood 3 1 Natural Sciences & Mathematics, The Richard Stockton College of New Jersey, Pomona, NJ, USA 2 Sources Archaeological and Heritage Research Inc., Vancouver, British Columbia, Canada 3 Department of Anthropology, The George Washington University, Washington, DC, USA Abstract Mandibular corpora are well represented in the hominin fossil record, yet few studies have rigorously assessed the utility of mandibular corpus morphology for species recognition, particularly with respect to the linear dimensions that are most commonly available. In this study, we explored the extent to which commonly preserved mandibular corpus morphology can be used to: (i) discriminate among extant hominid taxa and (ii) support species designations among fossil specimens assigned to the genus Homo. In the first part of the study, discriminant analysis was used to test for significant differences in mandibular corpus shape at different taxonomic levels (genus, species and subspecies) among extant hominid taxa (i.e. Homo, Pan, Gorilla, Pongo). In the second part of the study, we examined shape variation among fossil mandibles assigned to Homo (including H. habilis sensu stricto, H. rudolfensis, early African H. erectus/H. ergaster, late African H. erectus, Asian H. erectus, H. heidelbergensis, H. neanderthalensis and H. sapiens). A novel randomization procedure designed for small samples (and using group ‘distinctness values’) was used to determine whether shape variation among the fossils is consistent with conventional taxonomy (or alternatively, whether a priori taxonomic groupings are completely random with respect to mandibular morphology). The randomization of ‘distinctness values’ was also used on the extant samples to assess the ability of the test to recognize known taxa. The discriminant analysis results demonstrated that, even for a relatively modest set of traditional mandibular corpus measurements, we can detect significant differences among extant hominids at the genus and species levels, and, in some cases, also at the subspecies level. Although the randomization of ‘distinctness values’ test is more conservative than discriminant analysis (based on comparisons with extant speci- mens), we were able to detect at least four distinct groups among the fossil specimens (i.e. H. sapiens, H. heidelbergensis, Asian H. erectus and a combined ‘African Homo’ group consisting of H. habilis sensu stricto, H. rudolfensis, early African H. erectus/H. ergaster and late African H. erectus). These four groups appear to be distinct at a level similar to, or greater than, that of modern hominid species. In addition, the mandibular corpora of H. neanderthalensis could be distinguished from those of ‘African Homo’, although not from those of H. sapiens, H. heidelbergensis, or the Asian H. erectus group. The results suggest that the features most commonly preserved on the hominin mandibular corpus have some taxonomic utility, although they are unlikely to be useful in generating a reliable alpha taxonomy for early African members of the genus Homo. Key words discriminant analysis; distinctness values; hominin; Homo; mandible; randomization; taxonomy. Introduction The hominin fossil record contains a relatively large number of mandibular specimens. For example, out of 126 hominin cranial fossils from Koobi Fora examined by Wood (1991), the largest single subset (making up 40% of the total) comprises well-preserved mandibles or recogniz- able fragments of the mandibular corpus. As a result of this biased preservation, mandibular data have played an important role in the definition of a number of hominin fossil species. Almost 50% of the hominin species identi- fied to date have a mandibular specimen as their holotype [e.g. Australopithecus anamensis, Leakey et al. 1995; A. afarensis, Johanson et al. 1978; A. bahrelghazali, Brunet et al. 1996; Paranthropus aethiopicus, Arambourg & Coppens, 1968, Chamberlain & Wood, 1985; P. crassidens (now P. robustus, Broom, 1938), Broom, 1949; Homo ergaster, Groves & Mazák, 1975; H. heidelbergensis, Schoetensack, 1908; H. antecessor, Bermúdez de Castro et al. 1997]. Correspondence Michael R. Lague, Natural Sciences & Mathematics, The Richard Stockton College of New Jersey, Pomona, NJ 08240-0195, USA. E: [email protected] *These authors contributed equally to this work. Accepted for publication 28 August 2008
Transcript of Hominid mandibular corpus shape variation and its utility ... corpora are well represented in the...
J. Anat.
(2008)
213
, pp670–685 doi: 10.1111/j.1469-7580.2008.00989.x
© 2008 The AuthorsJournal compilation © 2008 Anatomical Society of Great Britain and Ireland
Blackwell Publishing Ltd
Hominid mandibular corpus shape variation and its utility
for recognizing species diversity within fossil
Homo
Michael R. Lague,
1
* Nicole J. Collard,
2
* Brian G. Richmond
3
and Bernard A. Wood
3
1
Natural Sciences & Mathematics, The Richard Stockton College of New Jersey, Pomona, NJ, USA
2
Sources Archaeological and Heritage Research Inc., Vancouver, British Columbia, Canada
3
Department of Anthropology, The George Washington University, Washington, DC, USA
Abstract
Mandibular corpora are well represented in the hominin fossil record, yet few studies have rigorously assessed theutility of mandibular corpus morphology for species recognition, particularly with respect to the linear dimensionsthat are most commonly available. In this study, we explored the extent to which commonly preserved mandibularcorpus morphology can be used to: (i) discriminate among extant hominid taxa and (ii) support species designationsamong fossil specimens assigned to the genus
Homo
. In the first part of the study, discriminant analysis was usedto test for significant differences in mandibular corpus shape at different taxonomic levels (genus, species and
subspecies) among extant hominid taxa (i.e.
Homo
,
Pan
,
Gorilla
,
Pongo
). In the second part of the study, we examinedshape variation among fossil mandibles assigned to
Homo
(including
H. habilis sensu stricto
,
H. rudolfensis
, earlyAfrican
H. erectus
/
H. ergaster
, late African
H. erectus
, Asian
H. erectus
,
H. heidelbergensis
,
H. neanderthalensis
and
H. sapiens
). A novel randomization procedure designed for small samples (and using group ‘distinctness values’)was used to determine whether shape variation among the fossils is consistent with conventional taxonomy (or
alternatively, whether
a priori
taxonomic groupings are completely random with respect to mandibular morphology).The randomization of ‘distinctness values’ was also used on the extant samples to assess the ability of the test torecognize known taxa. The discriminant analysis results demonstrated that, even for a relatively modest set oftraditional mandibular corpus measurements, we can detect significant differences among extant hominids at
the genus and species levels, and, in some cases, also at the subspecies level. Although the randomization of‘distinctness values’ test is more conservative than discriminant analysis (based on comparisons with extant speci-
mens), we were able to detect at least four distinct groups among the fossil specimens (i.e.
H. sapiens
,
H. heidelbergensis
,
Asian
H. erectus
and a combined ‘African
Homo
’ group consisting of
H. habilis sensu stricto
,
H. rudolfensis
, early
African
H. erectus
/
H. ergaster
and late African
H. erectus
). These four groups appear to be distinct at a level similarto, or greater than, that of modern hominid species. In addition, the mandibular corpora of
H. neanderthalensis
couldbe distinguished from those of ‘African
Homo
’, although not from those of
H. sapiens
,
H. heidelbergensis
, or theAsian
H. erectus
group. The results suggest that the features most commonly preserved on the hominin mandibular
corpus have some taxonomic utility, although they are unlikely to be useful in generating a reliable alpha taxonomyfor early African members of the genus
Homo
.
Key words
discriminant analysis; distinctness values; hominin;
Homo
; mandible; randomization; taxonomy.
Introduction
The hominin fossil record contains a relatively largenumber of mandibular specimens. For example, out of 126hominin cranial fossils from Koobi Fora examined byWood (1991), the largest single subset (making up 40% of
the total) comprises well-preserved mandibles or recogniz-able fragments of the mandibular corpus. As a result ofthis biased preservation, mandibular data have played animportant role in the definition of a number of homininfossil species. Almost 50% of the hominin species identi-fied to date have a mandibular specimen as their holotype[e.g.
Australopithecus anamensis
, Leakey et al. 1995;
A.afarensis
, Johanson et al. 1978;
A. bahrelghazali
, Brunetet al. 1996;
Paranthropus aethiopicus
, Arambourg &
Coppens, 1968, Chamberlain & Wood, 1985;
P. crassidens
(now
P. robustus
, Broom, 1938), Broom, 1949;
Homo ergaster
,Groves & Mazák, 1975;
H. heidelbergensis
, Schoetensack,1908;
H. antecessor
, Bermúdez de Castro et al. 1997].
Correspondence
Michael R. Lague, Natural Sciences & Mathematics, The Richard Stockton College of New Jersey, Pomona, NJ 08240-0195, USA. E: [email protected]
*These authors contributed equally to this work.
Accepted for publication
28 August 2008

Hominid mandibular corpus variation, M. R. Lague et al.
© 2008 The Authors Journal compilation © 2008 Anatomical Society of Great Britain and Ireland
671
Accordingly, it is important to verify the ability of mandi-bular morphology to identify taxonomic affiliations, parti-cularly those aspects of morphology most frequentlypreserved on fossil specimens.
Discussion regarding the utility of hominid mandibularmorphology for delineating species and reconstructing theirrelationships has continued from the early 1900s to thepresent. Early studies focused on modern human mandibularmorphology with a view to gaining an understandingof inter- and intrapopulation variation, including sexualdimorphism (e.g. Harrower, 1928; Martin, 1936; Morantet al. 1936; Cleaver, 1937; Hrdli
C
ka 1940a,b). As computa-tional power increased, researchers applied multivariatestatistics and other new methodologies, such as geometricmorphometrics, to describe and quantify mandibularvariation in modern human populations (Humphrey et al.1999; Oettlé et al. 2005; Nicholson & Havarti, 2006; Schmitt-buhl et al. 2007) and fossil hominin species (Chamberlain& Wood, 1985; Wood & Lieberman, 2001; Rak et al. 2002;Kaifu et al. 2005; Nicholson & Havarti, 2006). Other recentstudies have used multivariate mandibular data to evaluatea fossil specimen’s taxonomic identity, test hypotheses ofspecies integrity, or reconstruct phylogenetic relationships(Bromage et al. 1995; Rosas, 1995; Lam et al. 1996; Rosas &Bermúdez de Castro, 1998; Stefan & Trinkaus, 1998a,b; Rosas& Bermúdez de Castro, 1999; Schwartz & Tattersall, 2000;Silverman et al. 2000, 2001; Quam et al. 2001; Rosas, 2001;Rak et al. 2002; Rosas & Bastir, 2004; Rightmire et al. 2006;Skinner et al. 2006). A number of studies examining greatape mandibular morphology have also been published(Aitchison, 1963, 1965; Kinzey, 1970; Wood, 1985; Daeg-ling & Jungers, 2000; Taylor, 2002, 2003; Taylor & Groves2003; Taylor, 2005, 2006a,b,c; Schmittbuhl et al. 2007).
Several of the above studies have analysed the ability ofmandibular morphology to accurately predict groupmembership of known specimens from extant groups (e.g.Humphrey et al. 1999; Silverman et al. 2000; Taylor & Groves2003; Schmittbuhl et al. 2007) but only rarely do those studiessubsequently use those validated measures to assessspecies diversity in the fossil record. One reason for this is thatthe measurements used on the extant specimens (e.g.measures of the mandibular ramus) are often not readilyavailable from the fossil specimens due to poor preservation.
In this study, we assessed the taxonomic utility of man-dibular morphology by focusing on the traditional linearmeasurements that are most widely available in thehominin fossil record, namely those of the mandibularcorpus. More specifically, we explored the extent to whichmandibular corpus morphology can be used to: (i) discrimin-ate among extant hominid taxa and (ii) support speciesdesignations (largely based on non-mandibular evidence)among fossil specimens assigned to the genus
Homo
.In the first part of this study, we used discriminant analysis
(DA) to test the hypothesis that size-adjusted linearmeasurements of the mandibular corpus can be used to
sort extant hominid taxa. We cannot test the taxonomicvalue of mandibular variables using the fossil record, as wehave no independent means of determining the taxonomyof the specimens concerned. We can, however, investigatethe taxonomic utility of mandibular corpus variables inextant hominoid taxa closely related to the hominin clade(e.g. Taylor & Groves, 2003; Wildman, et al. 2003). We areaware of the arguments suggesting that, with respect tofossil hominins, genetic propinquity is not the only criterionto use for selecting appropriate extant analogues (e.g.Aiello et al. 2000; Jolly, 2001; Plavcan, 2002). Nonetheless,we believe that it is unlikely that reliable taxonomic deci-sions about the mandibular corpora of fossil hominin taxacan be made if mandibular corpus morphology is nottaxonomically informative in closely related extant taxa.
In the second part of this study, we employed a novelprobabilistic approach to assess within- and between-group variation of mandibles assigned to several species of
Homo,
including
H. habilis sensu stricto
,
H. rudolfensis
,early African
H. erectus
/
H. ergaster
, late African
H. erectus
,Asian
H. erectus
,
H. heidelbergensis
,
H. neanderthalensis
and
H. sapiens
. More specifically, we used randomizationof ‘distinctness values’ (RDV) to examine whether shapevariation in mandibular morphology is consistent withconventional taxonomy. Following the argument ofTattersall (1986, p. 166) that ‘what is important in distin-guishing among species is
between-species
variation’, weexamined the cohesion of mandibular morphology withina proposed taxonomic group relative to between-groupvariation. It is worth noting that our purpose was not tooverturn conventional species designations but rather toassess the extent to which shape variation of the mandi-bular corpus can be used as a reliable taxonomic indicatorwithin the hominin clade.
Materials and methods
The extant hominid sample comprises 457 adult individuals (bothmale and female specimens) representing four genera:
Gorilla
,
Homo
,
Pan
and
Pongo
(Table 1). All of the comparative specimensare adult, based on the presence of wear facets on M
3
. Measure-ments were taken on mandibles with the teeth present or withpristine alveoli; mandibles with substantial alveolar bone resorp-tion [e.g. cases where more than half of the tooth root(s) isexposed] were excluded from the study (cf. Vinter et al. 1996).
The 34 fossil hominin mandibles included in the study are allconventionally included in the genus
Homo
(Weidenreich, 1936;Day & Leakey, 1973; Wood, 1991; Wood & Richmond, 2000; Rosas,2001). Based on previous studies, we have divided the fossils intonine taxonomic groups (see Table 2). We recognize that not allresearchers will agree on the extent of diversity represented bythese specimens (e.g. Wood, 1985, Stringer, 1986; Bilsborough &Wood, 1988; Lieberman et al. 1988; Rightmire, 1990; Miller, 1991;Tobias, 1991; Wood, 1991; Bräuer & Mbua, 1992; Wood, 1992;Bräuer, 1994; Wolpoff et al. 1994; Wood, 1994; Kramer et al. 1995;Grine et al. 1996; Wolpoff, 1996; Rightmire, 1998; Wood & Collard,1999; Miller, 2000). Nonetheless, as our goal was to test group

Hominid mandibular corpus variation, M. R. Lague et al.
© 2008 The AuthorsJournal compilation © 2008 Anatomical Society of Great Britain and Ireland
672
integrity (based on mandibular corpus morphology), we beganour analyses by ‘splitting’ our fossil groups and subsequently‘lumping’ those for which no mandibular corpus morphologicaljustification for separation could be found (i.e. one cannot assesswhether groups are distinct if they are not initially considered asseparate groups). For example, although specimens from bothAfrica and Asia have been assigned to
H. erectus
, we thought itprudent to maintain the geographic integrity of the samples andinitially consider them as separate groups. We also began with aseparate Middle Pleistocene ‘late African
H. erectus
’ group
consisting of two specimens whose taxonomic allocation is con-sidered unresolved by some authors (e.g. Rosas, 2001). Finally,we began by considering the Asian
H. erectus
specimens as twoseparate groups (Sangiran and Zhoukoudian), as these samplesdiffer both geographically and temporally.
Linear dimensions (Table 3) were chosen to capture morpholog-ical information from that part of the mandible (i.e. the corpus)that is most often preserved in the early hominin fossil record.Measurements were taken with digital calipers using the measure-ment definitions given in Wood (1991). In order to maximize
Extant taxon N Males Females
Total Gorilla: 146 79 67Gorilla gorilla beringei 23 13 10Gorilla gorilla gorilla 54 32 22Gorilla gorilla graueri 69 34 35
Total Homo: 91 – –Homo sapiens (Terry Collection, NMNH) 52 26 26Homo sapiens (Tel Aviv University) 39 – –
Total Pan: 164 77 87Pan paniscus 42 17 25Pan troglodytes schweinfurthi 67 30 37Pan troglodytes troglodytes 55 30 25
Total Pongo: 56 29 27Pongo pygmaeus abelii 12 6 6Pongo pygmaeus pygmaeus 44 23 21
All measurements made by N.J.C. NMNH = National Museum of Natural History.
Table 1 List and composition of extant taxa
Table 2 List and composition of fossil taxa
Fossil taxon Code N Measured by
Homo sapiens sapi 11 N.J.C.*Combe Capelle, Choukoutien/PA 101, Choukoutien/PA 104, Choukoutien/PA 109, Eyasi I, FishHoek I, Minatogawa I, Predmosti, Qafzeh 9, Skhul IV, Tabun IIHomo neanderthalensis nean 8 N.J.C.†Amud, de la Naulette, Kebara H 2, Krapina E, Krapina H, Shanidar I, Spy I, Tabun IHomo heidelbergensis heid 2 N.J.C.*Arago II, MauerAsian Homo erectus (Zhoukoudian) zhou 2 N.J.C.*Ckn. G1.6, Ckn. H1.12Asian Homo erectus (Sangiran) sang 2 B.A.W.‡Sangiran 1, Sangiran 9Late African Homo erectus lahe 2 B.A.W.‡KNM-BK 8518, OH 22Early African Homo erectus/H. ergaster erga 2 B.A.W.‡KNM-ER 730, KNM-ER 992Homo habilis habi 2 B.A.W.‡OH 13, OH 37Homo rudolfensis rudo 3 B.A.W.‡KNM-ER 1482, KNM-ER 1483, KNM-ER 1802
*Measured from casts (Smithsonian Institution, National Museum of Natural History).†Amud and Kebara measured from original fossils (Tel Aviv University), remainder measured from casts (Smithsonian Institution, National Museum of Natural History).‡Data taken from Wood (1991).
Hominid mandibular corpus variation, M. R. Lague et al.
© 2008 The Authors Journal compilation © 2008 Anatomical Society of Great Britain and Ireland
673
the fossil hominin sample size, only eight variables were selectedfrom a larger data set of 19 corpus variables. Interobserver(B.A.W. and N.J.C.) and intraobserver (N.J.C.) measurement errorswere < 3% in all cases. Measurements were taken on the originalfossils where possible (see Table 2). The values of Weidenreich(1936) for the originals of Ckn. G1.6 and Ckn. H1.12 were not usedbecause Weidenreich employed different landmarks than thoseemployed in this study.
Assessment of extant taxa: DA
Discriminant function analysis (Klecka, 1980; Rencher, 1995) wasapplied to the extant specimens to assess whether metrical datafrom the mandibular corpus can be used to discriminate amongextant hominid genera, species, and subspecies. Size-adjusted, or‘shape’, values were generated by dividing each variable (of agiven specimen) by that specimen’s geometric mean (cf. Darroch& Mosimann, 1985; Jungers et al. 1995). Taxa included in thegenus level analysis were Gorilla, Homo, Pan, and Pongo. Thespecies level analysis was confined to Pan, and involved onlyP. paniscus and P. troglodytes. The subspecies level analyses exam-ined three sets of subspecies, including three subspecies of Gorilla(G. gorilla beringei, G. gorilla graueri and G. gorilla gorilla), twosubspecies of Pan (P. troglodytes schweinfurthi and P. troglodytestroglodytes) and two subspecies of Pongo (P. pygmaeus pygmaeusand P. pygmaeus abelii). We have opted for a conventional taxonomyin the absence of a firm consensus about an alternative (for Gorillasee Groves 1967, 1970, 1989, Albrecht et al. 2003; Thalmann et al.2007; for Pongo see Groves, 1971; Courtenay et al. 1988; Muiret al. 1998, 2000; Zhang et al. 2001). The DAs were performedusing Statistica (Statsoft, Inc.,Tulsa, OK, USA) as well as an algorithmwritten by M.R.L. for MATLAB software (R2006a, version 7.2.0.232;The Mathworks, Inc., Natick, MA, USA).
Discriminant analysis is computationally equivalent to MANOVA
and, for each analysis, we tested the null hypothesis that there isno difference among groups. We also used ‘structure coefficients’(i.e. the product-moment correlation between a given variableand a given canonical function) to identify those variables that aremost closely associated with group discrimination along a givencanonical function. Variables with larger structure coefficients(i.e. ! | 0.40 | by convention; also see Schneider, 2006) are considered
the most meaningful for group separation. We also used posteriorprobabilities to assess whether individuals could be correctlyassigned to a given taxon.
For purposes of significance testing, additional tests were runin which data were ranked following the rank transformationapproach of Conover & Iman (1981). This non-parametric approachrelaxes the assumption of normality without significant loss ofpower. As the results based on ranked vs unranked data do notdiffer, we present only the latter results here.
Assessment of fossil taxa: randomization analysis (RDV test)
The small sizes of the fossil hominin samples preclude the use ofDA for exploring group differences, as significance testing requiresmore cases within each group than the total number of variables.As an alternative, we employed an RDV test adapted from Sokal& Rohlf (1995). This is a non-parametric probabilistic approachthat assesses whether the a priori fossil groups are random withrespect to mandibular morphology. The RDV test assesses thecohesiveness of a group of individuals by calculating a ‘distinctnessvalue’ (DV) defined by Sokal & Rohlf (1995, p. 806) as ‘... a measureof homogeneity or cohesion of the members of a group relativeto their similarity with other groups’. The DV for a given group iscalculated as the average correlation within the group (i.e. aver-age of all pairwise within-group correlation coefficients) minusthe average correlation between groups (i.e. average of all possiblecorrelation coefficients between members and non-members).Hence, high positive DVs indicate that the chosen specimens forma distinct group (relative to the other specimens) in which membersare more similar in shape to each other than they are to non-members.(Note that the use of correlation coefficients implicitly adjusts forscale, although it does not control for size-related shape variation.)Negative values indicate that members of the chosen group aregenerally more similar in shape to outside members than they areto one another.
In the procedure described by Sokal & Rohlf (1995), randomiza-tion is used to determine whether the DV for a given group canbe considered significantly high. We required something differ-ent, which was to establish whether there is any morphologicaljustification for a particular group configuration (e.g. 34 fossil
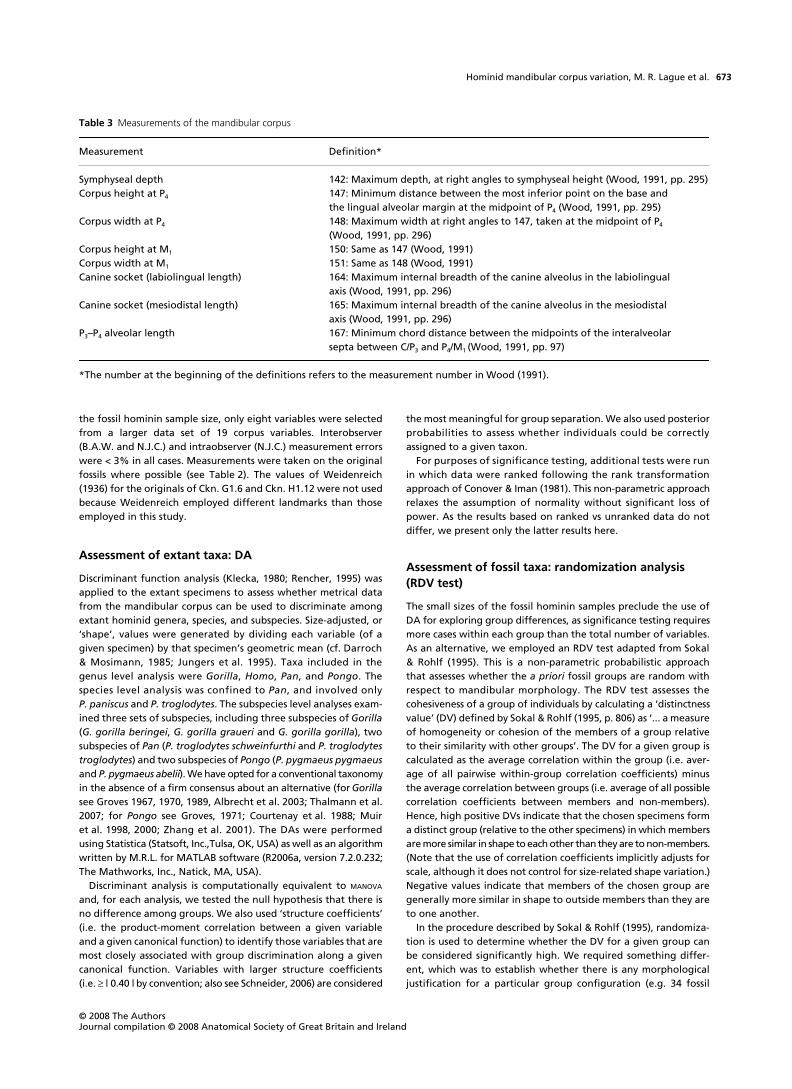
Table 3 Measurements of the mandibular corpus
Measurement Definition*
Symphyseal depth 142: Maximum depth, at right angles to symphyseal height (Wood, 1991, pp. 295)Corpus height at P4 147: Minimum distance between the most inferior point on the base and
the lingual alveolar margin at the midpoint of P4 (Wood, 1991, pp. 295)Corpus width at P4 148: Maximum width at right angles to 147, taken at the midpoint of P4
(Wood, 1991, pp. 296)Corpus height at M1 150: Same as 147 (Wood, 1991)Corpus width at M1 151: Same as 148 (Wood, 1991)Canine socket (labiolingual length) 164: Maximum internal breadth of the canine alveolus in the labiolingual
axis (Wood, 1991, pp. 296)Canine socket (mesiodistal length) 165: Maximum internal breadth of the canine alveolus in the mesiodistal
axis (Wood, 1991, pp. 296)P3–P4 alveolar length 167: Minimum chord distance between the midpoints of the interalveolar
septa between C/P3 and P4/M1 (Wood, 1991, pp. 97)
*The number at the beginning of the definitions refers to the measurement number in Wood (1991).
Hominid mandibular corpus variation, M. R. Lague et al.
© 2008 The AuthorsJournal compilation © 2008 Anatomical Society of Great Britain and Ireland
674
Homo specimens divided into nine taxa), i.e. based on the mor-phometric information that we have captured, do the speciesdesignations represent the ‘best’ way to sort n specimens into Ngroups or are these a priori groups random with respect to thecaptured morphology? Hence, rather than test the ‘distinctness’of one group at a time, the algorithm was modified to considerthe average distinctness of multiple groups. The average DV issimply the average of the N DVs of the N groups (e.g. average ofnine distinctness values of nine groups of fossil Homo). Themore ‘distinct’ each particular group is, the greater the value ofthe average DV. Therefore, a high positive DV indicates that theparticular group configuration under consideration is largelysupported by the mandibular corpus morphology captured by oureight linear measurements. In contrast, group configurations withnegative values indicate that, on average, between-group cor-relations are higher than within-group correlations and thereforethe particular group configuration is not supported by mandibularcorpus morphology.
The null hypothesis of the RDV test is that the average DV (ofthe given group configuration) is not significantly higher thanexpected by chance alone. The observed average DV is comparedwith a distribution of average DVs obtained via a randomizationprocedure. For each iteration, the sample is split into a randomnumber of groups (N ! 2), whereby each group has at least twomembers (the minimum necessary to calculate a within-groupcorrelation coefficient). The average DV is calculated from thisrandom group configuration and the procedure is repeated for upto 10 000 iterations. In those cases where the number of possiblenovel combinations was less than 10 000 (e.g. there are only 2079ways to combine eight specimens into multiple groups of two ormore), exact randomization was used.
We began by assessing a group configuration in which 34 fossilhominin specimens were divided into the nine groups indicated inTable 2, i.e. we tested whether the average DV based on thisa priori taxonomic grouping is significantly higher than one wouldexpect for a random taxonomic allocation in which the 34 speci-mens are divided into a random number of groups (N ! 2) of randomsample size (n ! 2). We subsequently used the RDV procedure onsmaller subsets of the fossil data (e.g. all pairwise comparisonsas well as tests suggested either by previous taxonomic hypo-theses or by the RDV results themselves). We used principalcomponents analysis (PCA) of group means to visually depict themorphological affinities among the different fossil taxa being tested.The RDV tests and PCA were performed using algorithms writtenby M.R.L. for MATLAB software (R2006a, version 7.2.0.232; TheMathworks, Inc.).
It is known that correlation coefficients (r) are distributed in anasymmetrical fashion. To assess the potential effect of such asym-metry on our results, we also ran all of the fossil RDV testsdescribed below using Fisher’s z-transformation of r (see Sokal& Rohlf, 1995). Although the use of z instead of r changed theresulting P-values somewhat, without exception, all of the resultswere the same in terms of whether or not statistical significance(P < 0.05) was observed. Only the results based on untransformedcorrelation coefficients are presented below.
Validation of the RDV test
In order to validate the method, and compare the results withthose obtained using more traditional DA, we applied the RDVtest to a number of extant group configurations. Two sets of RDVtests were run using the same extant data: (i) one set of tests using
complete samples and (ii) another set of tests using small samples(three to four specimens for each group). The latter set of testswas designed to assess the efficacy of the RDV test on sample sizessimilar to those of the fossil taxa. A small number of individualswas randomly chosen from each extant group. Only these ran-domly chosen individuals were used to calculate the average DVand the randomized distribution. This procedure was repeated1000 times (using different randomly chosen individuals eachtime), resulting in a total of 1000 RDV tests for a given groupconfiguration. We then computed the percentage of significantresults (P " 0.05) out of these 1000 RDV tests to assess the probabilityof rejecting the null hypothesis when using small samples. To con-serve computing time, we used a maximum of 1000 (rather than10 000) iterations per RDV test.
Sexual dimorphism
Previous studies have demonstrated that sexual dimorphism is animportant component of intraspecific mandibular corpus sizeand shape variation among hominoids (Wood, 1976; Smith, 1983;Chamberlain & Wood, 1985; Kimbel & White, 1988; Wood et al. 1991;Humphrey et al. 1999; Plavcan, 2002; Taylor, 2006c). Nonetheless,we did not conduct separate analyses of male and female extantspecimens, particularly given that the goal of this study was toexamine the extent to which mandibular corpus shape is distinctamong taxa, including those with substantial sexual dimorphism.As our focus was on mandibular shape, it is of interest to note thosegroups known to be characterized by significant mandibular shapedimorphism (especially as related to the mandibular corpus), assuch taxa may have an impact on our results. In a recent study ofhominoid mandibles by Taylor (2006c), Pongo and Gorilla werefound to exhibit significant shape dimorphism, although only oneof the significant shape dimensions (i.e. corpus width relative tocorpus depth at M1) used by Taylor is considered in the presentstudy. As our ability to recognize taxa (species and subspecies) ispartly predicated on the extent of shape dimorphism present in anygiven taxon, it is conceivable that substantial shape dimorphismcould compromise our ability to define taxonomic boundaries.Nevertheless, even given significant mandibular corpus shapedimorphism, our analyses will recognize distinct taxa as long asany sex-related shape variation does not exceed taxonomic varia-tion (such that males and females of a given taxon are more similarin shape to one another than to members of other taxa).
Results
Extant hominids: DAs
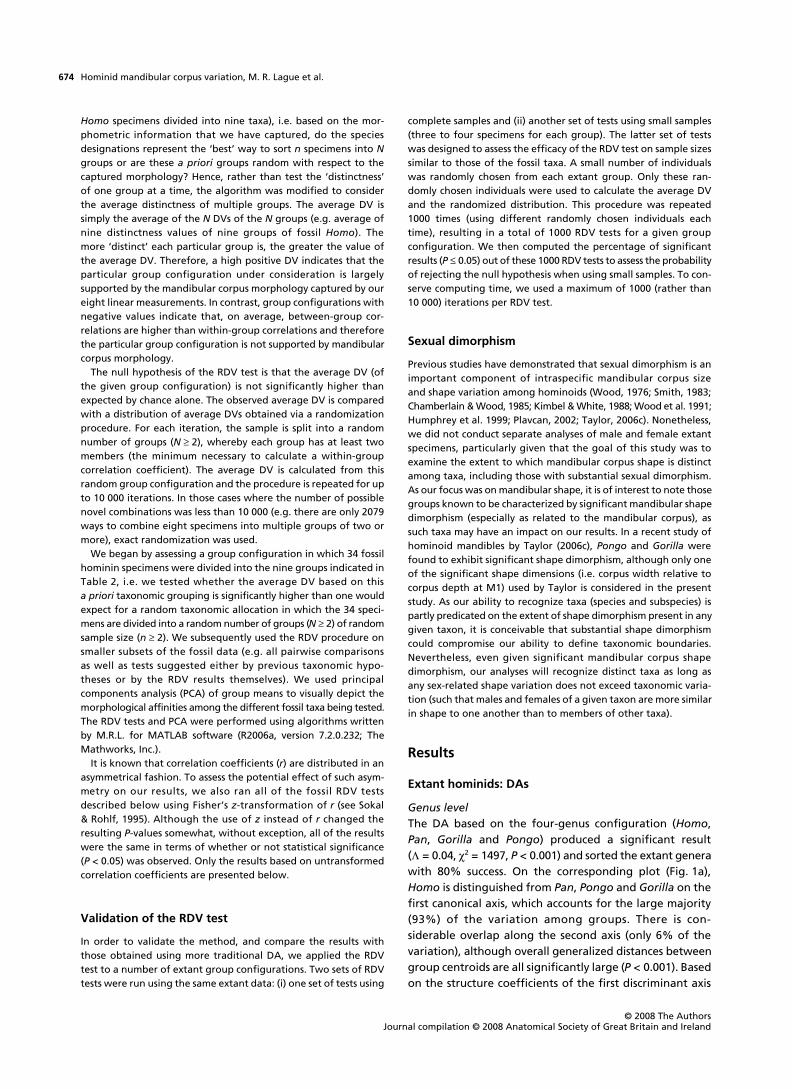
Genus levelThe DA based on the four-genus configuration (Homo,Pan, Gorilla and Pongo) produced a significant result(# = 0.04, $2 = 1497, P < 0.001) and sorted the extant generawith 80% success. On the corresponding plot (Fig. 1a),Homo is distinguished from Pan, Pongo and Gorilla on thefirst canonical axis, which accounts for the large majority(93%) of the variation among groups. There is con-siderable overlap along the second axis (only 6% of thevariation), although overall generalized distances betweengroup centroids are all significantly large (P < 0.001). Basedon the structure coefficients of the first discriminant axis
Hominid mandibular corpus variation, M. R. Lague et al.
© 2008 The Authors Journal compilation © 2008 Anatomical Society of Great Britain and Ireland
675
(Table 4), mandibular corpus height is relatively larger inextant modern humans (than in non-human hominids)at both P4 and M1, whereas the symphyseal depth of themodern human mandibles is relatively smaller.
As most of the shape variation among extant genera isaccounted for by differences between modern humansand non-human hominids, we ran an additional analysis inwhich Homo was excluded. Even without the influence of
Fig. 1 Canonical variates plots based on size-adjusted data for (a) four extant hominid genera and (b) the same taxa with the exclusion of Homo. Genera are indicated as follows: H, Homo; P, Pan; G, Gorilla; O, Pongo.
Table 4 Structure coefficients for genus-level analysis*
Variables
All four genera Homo excluded
Axis 1 Axis 2 Axis 1 Axis 2
Symphyseal depth –0.519 0.395 0.362 0.498Height at P4 0.556 0.121 0.170 –0.477Width at P4 0.186 –0.047 –0.060 0.578Height at M1 0.534 0.183 0.238 –0.299Width at M1 0.346 0.078 0.087 0.316Canine socket (labiolingual) –0.100 –0.198 –0.187 –0.354Canine socket (mesiodistal) –0.268 –0.748 –0.729 –0.235P3–P4 alveolar length –0.105 0.499 0.505 0.076
Percentage of explained variation 93.1 6.3 85.4 14.6
*Values > | 0.400 | are shown in bold to highlight the most important discriminating variables.
Hominid mandibular corpus variation, M. R. Lague et al.
© 2008 The AuthorsJournal compilation © 2008 Anatomical Society of Great Britain and Ireland
676
Homo (and despite considerable overlap), the overall resultis significant (# = 0.43, $2 = 305, P < 0.001) and distancesbetween group centroids are found to be significantlylarge (P < 0.001). Specimens were allocated to the correctgenus with 74% success. Most of the variation betweengroups (ca 85%) is accounted for by the first axis, which issimilar to the second axis of the previous analysis (whichincluded Homo) in that Pan is somewhat separated fromthe other two genera (Fig. 1b); as expected, the mostinfluential variables associated with these axes are thesame (see Table 4).
Species levelThe two species of Pan were found to differ significantly(T2 = 1.389, F = 26.9, P < 0.001) and 91% of the individualswere allocated correctly. Based on structure coefficients(Table 5), P. troglodytes has a relatively smaller P3–P4 alveolarlength and a relatively taller symphysis than P. paniscus.
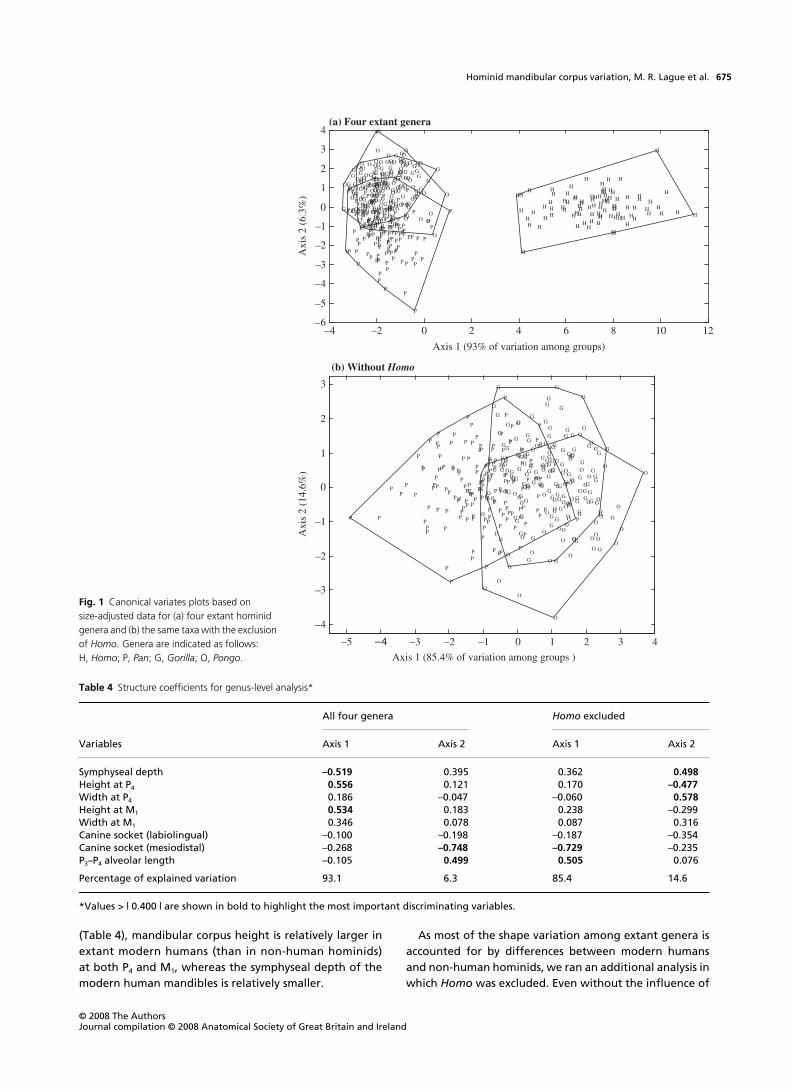
Subspecies levelTests of the three Gorilla subspecies produced a significantresult (# = 0.48, $2 = 102, P < 0.001), with all pairwise inter-centroid distances being significantly large (P < 0.001).Specimens were allocated to the correct subspecies with 76%success. The corresponding canonical variates plot is presentedin Fig. 2; structure coefficients are provided in Table 6.
The two subspecies of P. troglodytes were also found todiffer significantly (T2 = 0.75, F = 10.68, P < 0.001). Theextent of successful allocation to the correct taxon was80%. Based on structure coefficients (Table 5), discrimina-tion between Pan subspecies appears to be based largelyon the shape of the canine socket, which has a relativelylarger labiolingual dimension in P. t. troglodytes.
In contrast to the above analyses, no significant differ-ence was found between the two subspecies of Pongo(T2 = 0.33, F = 0.95, P > 0.05), although specimens were
allocated with a success rate of 80%. Structure coefficientsare listed in Table 5.
RDV
ValidationThe DAs indicate that significant differences in mandibu-lar corpus morphology exist among extant taxa even atthe subspecific level (with the exception of Pongo). Hence,it is reasonable to consider whether mandibular corpusmorphology is of value for distinguishing fossil hominintaxa. As noted above, before proceeding with RDV testson the fossil specimens, we applied the RDV test to a
Variables
Species Subspecies
Pan Pan Pongo
Symphyseal depth 0.408 0.163 0.135Height at P4 0.066 –0.112 0.586Width at P4 –0.184 0.083 0.058Height at M1 –0.158 –0.194 0.250Width at M1 0.053 –0.045 –0.380Canine socket (labiolingual) 0.149 0.425 –0.296Canine socket (mesiodistal) 0.034 –0.335 –0.171P3–P4 alveolar length –0.567 –0.047 0.056
Group centroids† Group 1 0.69 –0.952 0.295Group 2 –2.00 0.782 –1.081
*Values > | 0.400 | are shown in bold to highlight the most important discriminating variables.†‘Group 1’ designated as follows: P. troglodytes for Pan (species), P. t. troglodytes for Pan (subspecies), and P. p. pygmaeus for Pongo.
Table 5 Structure coefficients for species-level and two subspecies-level analyses*
Fig. 2 Canonical variates plot based on size-adjusted data for the three gorilla subspecies. Group centroids are indicated with black dots. Subspecies are indicated as follows: g, G. g. gorilla; b, G. g. beringei; i, G. g. graueri.
Hominid mandibular corpus variation, M. R. Lague et al.
© 2008 The Authors Journal compilation © 2008 Anatomical Society of Great Britain and Ireland
677
number of extant group configurations based on com-plete data sets, as well as on small random samples.
The RDV results based on complete samples indicatethat, in comparison to DA, the RDV test is more conservative(Table 7). None of the three RDV tests based on subspeciesindicate a significant difference among groups. In contrast,none of the 1000 randomized DVs for the two species ofPan is higher than the observed value, indicating thatthese two species are significantly distinct with respectto mandibular corpus morphology. The same result isobtained for a four-group configuration of extant non-human hominids in which all of the subspecies arecombined into their respective species (i.e. Gorilla, P.troglodytes, P. paniscus and Pongo).
For the RDV tests using small random samples (n = 3),one is extremely unlikely to reject the null hypothesis forany of the hominid subspecies; based on 1000 tests foreach set of subspecies, the probability of doing so equals< 0.001 (0.1%) in all three cases. The small sample test forthe two species of Pan yields a higher percentage ofrejected null hypotheses (21%), as does the test for thefour-group configuration of non-human hominids noted
above (21%). Nonetheless, it is clear that the chances ofrejecting a ‘false’ (based on full data) null hypothesis is notparticularly large when utilizing small samples. Increasinggroup sample sizes to four individuals each increases thepercentage of significant results (to 29% in both cases),albeit not substantially.
The results of the above tests based on extant datademonstrate that the RDV test is more conservative thanDA, even with large samples. At small sample sizes (such asthose characterizing the fossils), there is a good chancethat the null hypothesis will be falsely accepted unlessthe groups under consideration are particularly ‘distinct’.Hence, with respect to the small fossil samples examinedbelow, rejection of the null hypothesis for a given RDV testcan be accepted as strong evidence that the groupsinvolved are morphologically distinct at a level that isequal to or greater than that of modern hominid species.
Fossil HomoThe average DV for the complete nine-group configura-tion of fossils (DV = 0.0182) is found to be significantlyhigh based on sampled randomization; only 11 of the10 000 random group configurations produced an averageDV higher than that observed for the nine a priori groups(i.e. P = 0.0011). Hence, there is some morphologicalsupport from the mandibular corpus for the way in whichspecimens have been assigned to fossil Homo taxa.
The above result does not necessarily indicate that allnine groups are significantly distinct from one another butit does suggest that further analysis is worthwhile. We pro-ceeded by considering three logical pairwise comparisonsinvolving groups that have been (or are) considered to beconspecific: (i) the two sets of H. erectus specimens fromAsia (Sangiran vs Zhoukoudian), (ii) early African H. erec-tus/ergaster vs late African H. erectus and (iii) H. habilis vsH. rudolfensis. The sample sizes of all six of the aforemen-tioned groups are very small (n = 2 or 3); hence, these com-parisons do not lend themselves to the randomization test
Table 6 Structure coefficients for subspecies-level analysis of Gorilla*
Variables Axis 1 Axis 2
Symphyseal depth –0.034 –0.456Height at P4 0.409 –0.064Width at P4 –0.353 0.204Height at M1 0.352 0.331Width at M1 –0.408 –0.023Canine socket (labiolingual) –0.245 –0.056Canine socket (mesiodistal) 0.177 0.092P3–P4 alveolar length 0.323 0.043
Percentage of explained variation 66.6 33.4
*Values > | 0.400 | are shown in bold to highlight the most important discriminating variables.
Table 7 Results of randomization of ‘distinctness values’ (RDV) tests using extant taxa
Groups tested N of groups
Complete sample sizes Small samples
Total n Average DV‡ P value* n per group Total n Iterations per RDV test % sig. result
Pongo subspecies 2 56 –0.0005 N/A† 3 6 70 0.022Pan subspecies 2 122 0.0017 0.236 3 6 70 0.062Gorilla subspecies 3 146 0.0010 0.259 3 9 1000 0.070Pan species 2 164 0.0104 0 3 6 70 20.5
– – – – 4 8 1000 28.9Gorilla, P. pan., P. trog., Pongo
4 366 0.0064 0 3 12 1000 21.4
– – – – 4 16 1000 28.8
*Based on 1000 iterations.†Not applicable. No RDV test necessary for negative average distinctness value.‡DV = distinctness values.
Hominid mandibular corpus variation, M. R. Lague et al.
© 2008 The AuthorsJournal compilation © 2008 Anatomical Society of Great Britain and Ireland
678
(as there are only three possible ways to combine fourspecimens). Nonetheless, an assessment of the ‘distinctness’of each group can be made by simply considering theaverage DV (i.e. is it positive or negative?) and the patternof correlations. With respect to the latter, we can justifymaintaining a distinction between two groups if both (orall three) members of each group are more highly corre-lated with another group member than they are to mem-bers of the alternative group.
The average DV for the comparison between H. habilis andH. rudolfensis is negative (DV = –0.0028). Hence, no justifica-tion can be made for maintaining a distinction between thesetwo groups based on our data; in the remainder of this work,these two taxa are referred to collectively as ‘early Homo’.
Although the average DVs for the other two compari-sons are positive, their respective correlation patterns arenot supportive of a morphological distinction between thetwo groups in question (Table 8). In the case of the twoAsian H. erectus groups (DV = 0.0024), both Sangiran speci-mens are more highly correlated with one of the Zhou-koudian specimens than they are to one another. Hence, inthe analyses below, they are considered as a single ‘Asian
H. erectus’ group. With respect to the two African H. erec-tus groups (DV = 0.0042), only one of the four specimens(KNM-ER 730) is most highly correlated with the specimenbelonging to the same group (KNM-ER 992). As such, thetwo African H. erectus groups were considered as a singlegroup (‘African H. erectus’) in subsequent analyses.
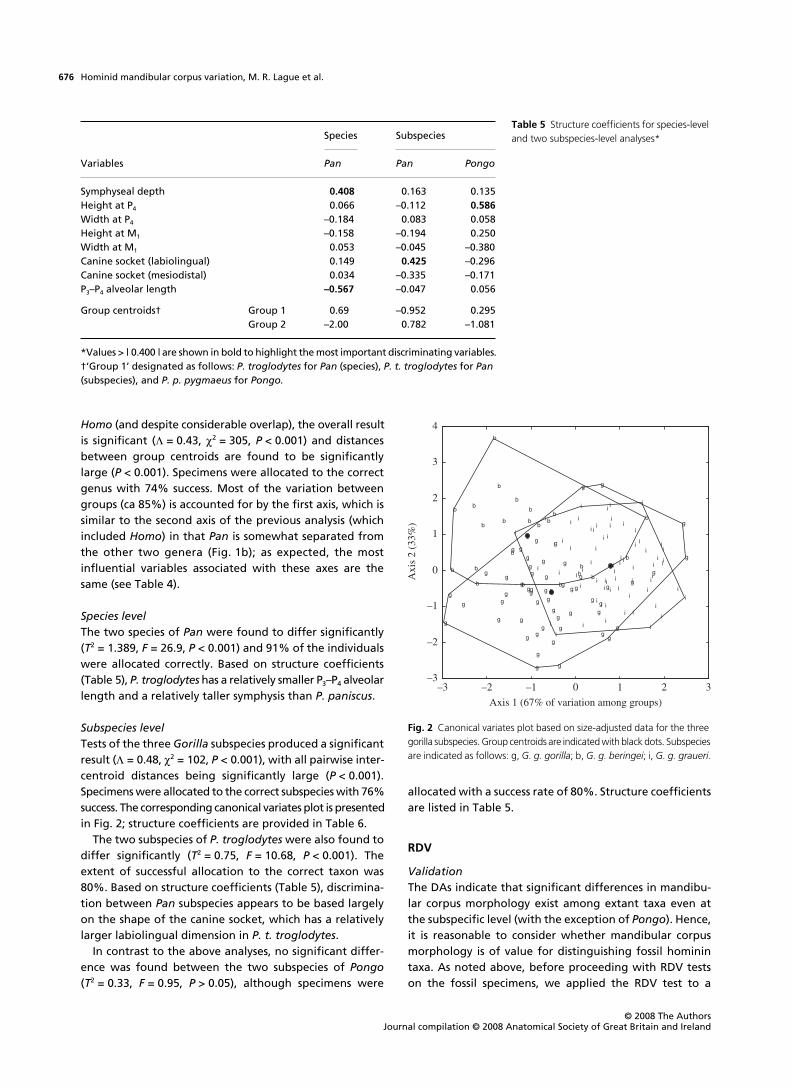
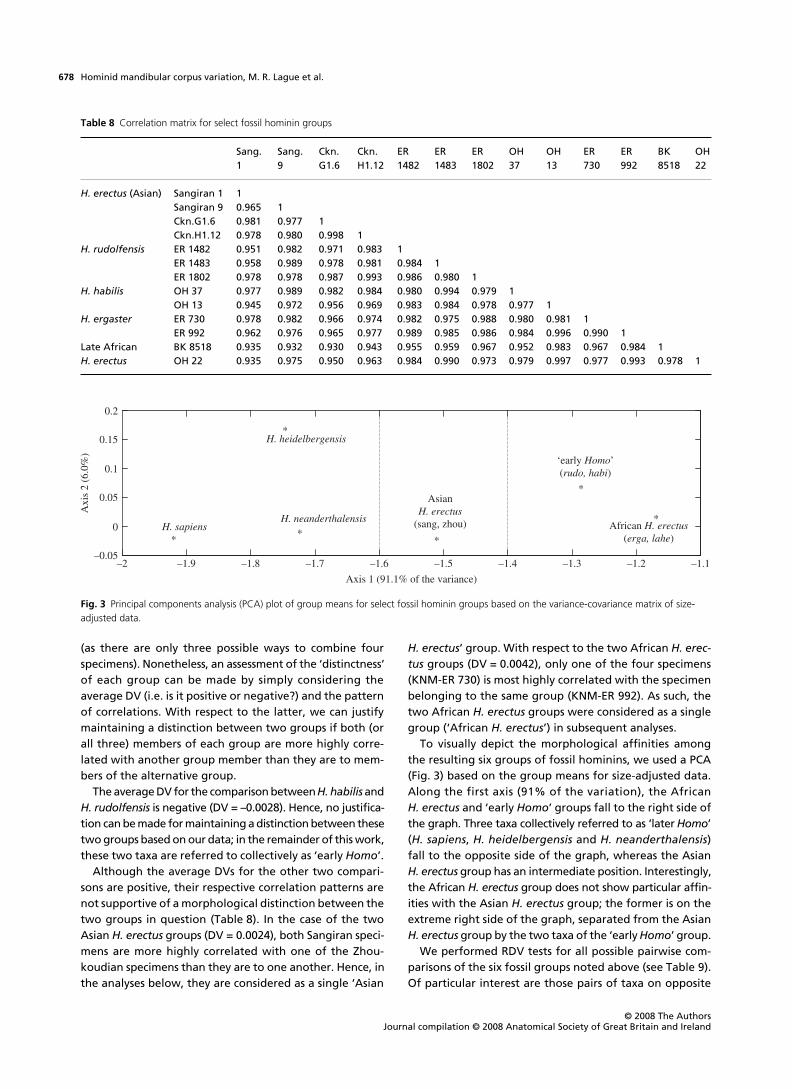
To visually depict the morphological affinities amongthe resulting six groups of fossil hominins, we used a PCA(Fig. 3) based on the group means for size-adjusted data.Along the first axis (91% of the variation), the AfricanH. erectus and ‘early Homo’ groups fall to the right side ofthe graph. Three taxa collectively referred to as ‘later Homo’(H. sapiens, H. heidelbergensis and H. neanderthalensis)fall to the opposite side of the graph, whereas the AsianH. erectus group has an intermediate position. Interestingly,the African H. erectus group does not show particular affin-ities with the Asian H. erectus group; the former is on theextreme right side of the graph, separated from the AsianH. erectus group by the two taxa of the ‘early Homo’ group.
We performed RDV tests for all possible pairwise com-parisons of the six fossil groups noted above (see Table 9).Of particular interest are those pairs of taxa on opposite
Table 8 Correlation matrix for select fossil hominin groups
Sang. 1
Sang. 9
Ckn. G1.6
Ckn. H1.12
ER 1482
ER 1483
ER 1802
OH 37
OH 13
ER 730
ER 992
BK 8518
OH 22
H. erectus (Asian) Sangiran 1 1Sangiran 9 0.965 1Ckn.G1.6 0.981 0.977 1Ckn.H1.12 0.978 0.980 0.998 1
H. rudolfensis ER 1482 0.951 0.982 0.971 0.983 1ER 1483 0.958 0.989 0.978 0.981 0.984 1ER 1802 0.978 0.978 0.987 0.993 0.986 0.980 1
H. habilis OH 37 0.977 0.989 0.982 0.984 0.980 0.994 0.979 1OH 13 0.945 0.972 0.956 0.969 0.983 0.984 0.978 0.977 1
H. ergaster ER 730 0.978 0.982 0.966 0.974 0.982 0.975 0.988 0.980 0.981 1ER 992 0.962 0.976 0.965 0.977 0.989 0.985 0.986 0.984 0.996 0.990 1
Late African H. erectus
BK 8518 0.935 0.932 0.930 0.943 0.955 0.959 0.967 0.952 0.983 0.967 0.984 1OH 22 0.935 0.975 0.950 0.963 0.984 0.990 0.973 0.979 0.997 0.977 0.993 0.978 1
Fig. 3 Principal components analysis (PCA) plot of group means for select fossil hominin groups based on the variance-covariance matrix of size-adjusted data.

Hominid mandibular corpus variation, M. R. Lague et al.
© 2008 The Authors Journal compilation © 2008 Anatomical Society of Great Britain and Ireland
679
sides of the PCA plot (i.e. those that should be most‘distinct’ from one another and are most likely to yieldsignificant RDV results). Based on pairwise testing, allthree of the ‘later Homo’ taxa (nean, sapi, heid) aresignificantly distinct from both of the groups on theopposite side of the plot (i.e. ‘early Homo’ and AfricanH. erectus). The intermediate position of Asian H. erectus(as suggested by the PCA) is also reflected in the randomiza-tion results; with respect to pairwise comparisons, AsianH. erectus is not distinct from two of the three ‘later Homo’groups (i.e. H. neanderthalensis and H. heidelbergensis)or from ‘early Homo’. If we impose a more inclusive two-group configuration of ‘later Homo’ (hsap, nean, heid)vs ‘African Homo’ (rudo, habi, erga, lahe) while excludingthe intermediate ‘Asian H. erectus’ individuals, theresulting average DV (0.035) is significantly high (P = 0).Hence, the RDV results complement the visual PCA resultsand suggest that the fossil specimens can be split into atleast two distinct morphological groups (i.e. ‘later Homo’and ‘African Homo’), within which further testing canbe done.
Among the ‘African Homo’ group (right side of the PCAplot), the ‘early Homo’ group (habi and rudo) is not foundto be distinct (DV = 0.0028, P = 0.202) from the AfricanH. erectus group (erga and lahe). Hence, on the basis oftraditional linear measurements of the mandibular corpus,the two groups should be treated as a single group (i.e.‘African Homo’).
Similarly, the three ‘later Homo’ taxa (left side of thePCA plot) also do not produce a significantly high averageDV (DV = 0.0031, P = 0.117) when compared in a three-group configuration (Table 10). The low average DV forthis configuration, however, appears to be due mainly to
the influence of H. neanderthalensis, which, unlike theother two species of ‘later Homo’, has a negative DV.Indeed, pairwise comparisons (Table 9) indicate thatalthough H. neanderthalensis is not significantly distinctfrom either H. sapiens or H. heidelbergensis, the lattertwo species are significantly different from one another(P = 0.033). Based on our eight dimensions, shape varia-tion of the H. neanderthalensis mandibular corpus appearsto overlap that of H. sapiens, H. heidelbergensis and AsianH. erectus.
As noted above, the PCA (and pairwise RDV tests) sug-gests that Asian H. erectus is morphologically intermediatebetween the ‘later Homo’and ‘African Homo’ groups. Com-parison of the ‘African Homo’ and Asian H. erectus groups(in a two-group configuration) yields a significantly highaverage DV (P = 0.005; Table 10). In contrast, when AsianH. erectus is compared with the combined ‘later Homo’group (in a different two-group configuration), theaverage DV is non-significant (P = 0.184). However, whenthe Neanderthals are removed from the ‘later Homo’group (for reasons described above), the average DV ishigher and significant (P = 0.049) in a similar two-grouptest. In addition, the average DV of a three-group confi-guration consisting of H. sapiens, H. heidelbergensis andAsian H. erectus (but not H. neanderthalensis) is also sig-nificantly high (P = 0.027). The pairwise RDV test betweenAsian H. erectus and H. sapiens indicates that these twogroups are also significantly distinct. Although the samecannot be said for the pairwise test between Asian H.erectus and H. heidelbergensis, the associated averageDV does have a very low probability of being randomlysampled (P = 0.086; Table 9). Hence, among the ‘laterHomo’ species, although H. neanderthalensis is not distinct
Table 9 Randomization of ‘distinctness values’ (RDV) results for pairwise comparisons*
N Number of iterations Average DV‡ P value
nean sapi 19 10 000 0.0011 0.3329 nsheid 10 10 000 0.0025 0.2854 ns[zhou, sang] 12 N/A† –0.0011 N/A† ns[rudo, habi] 13 10 000 0.0174 0.0054 **[erga, lahe] 12 10 000 0.0392 0.0005 ***
sapi heid 13 10 000 0.0047 0.0334 *[zhou, sang] 15 10 000 0.0053 0.0449 *[rudo, habi] 16 10 000 0.0310 0.0001 ***[erga, lahe] 15 10 000 0.0600 0.0003 ***
heid [zhou, sang] 6 70 0.0045 0.0857 ns[rudo, habi] 7 266 0.0189 0 ***[erga, lahe] 6 70 0.0461 0 ***
[zhou, sang] [rudo, habi] 9 10 000 0.0061 0.0750 ns[erga, lahe] 8 2 079 0.0216 0.0029 **
[rudo, habi] [erga, lahe] 9 10 000 0.00283 0.2019 ns
*Taxa included within brackets were analysed as a single group: [zhou, sang] = ‘Asian H. erectus’, [rudo, habi] = ‘early Homo’, [erga, lahe] = ‘African H. erectus’.†Not applicable. No test necessary for negative average distinctness value.‡DV = distinctness value.
Hominid mandibular corpus variation, M. R. Lague et al.
© 2008 The AuthorsJournal compilation © 2008 Anatomical Society of Great Britain and Ireland
680
from either H. heidelbergensis or H. sapiens, the lattertwo species are distinct from one another, as well as fromAsian H. erectus.
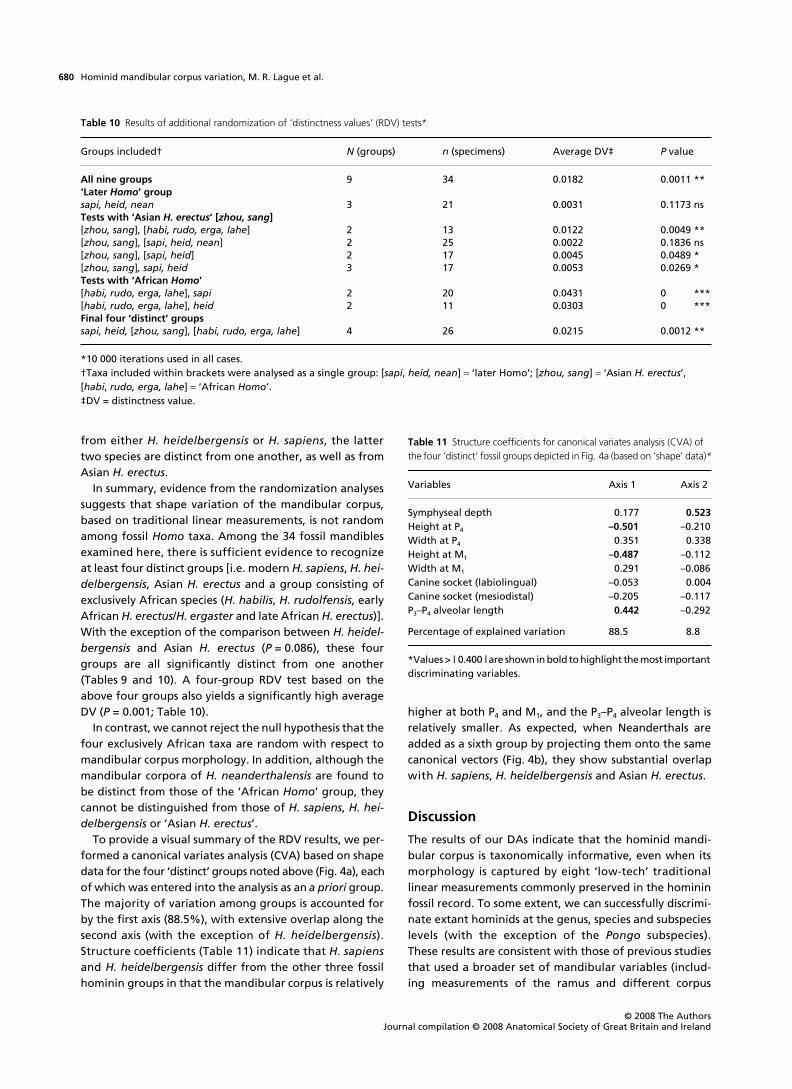
In summary, evidence from the randomization analysessuggests that shape variation of the mandibular corpus,based on traditional linear measurements, is not randomamong fossil Homo taxa. Among the 34 fossil mandiblesexamined here, there is sufficient evidence to recognizeat least four distinct groups [i.e. modern H. sapiens, H. hei-delbergensis, Asian H. erectus and a group consisting ofexclusively African species (H. habilis, H. rudolfensis, earlyAfrican H. erectus/H. ergaster and late African H. erectus)].With the exception of the comparison between H. heidel-bergensis and Asian H. erectus (P = 0.086), these fourgroups are all significantly distinct from one another(Tables 9 and 10). A four-group RDV test based on theabove four groups also yields a significantly high averageDV (P = 0.001; Table 10).
In contrast, we cannot reject the null hypothesis that thefour exclusively African taxa are random with respect tomandibular corpus morphology. In addition, although themandibular corpora of H. neanderthalensis are found tobe distinct from those of the ‘African Homo’ group, theycannot be distinguished from those of H. sapiens, H. hei-delbergensis or ‘Asian H. erectus’.
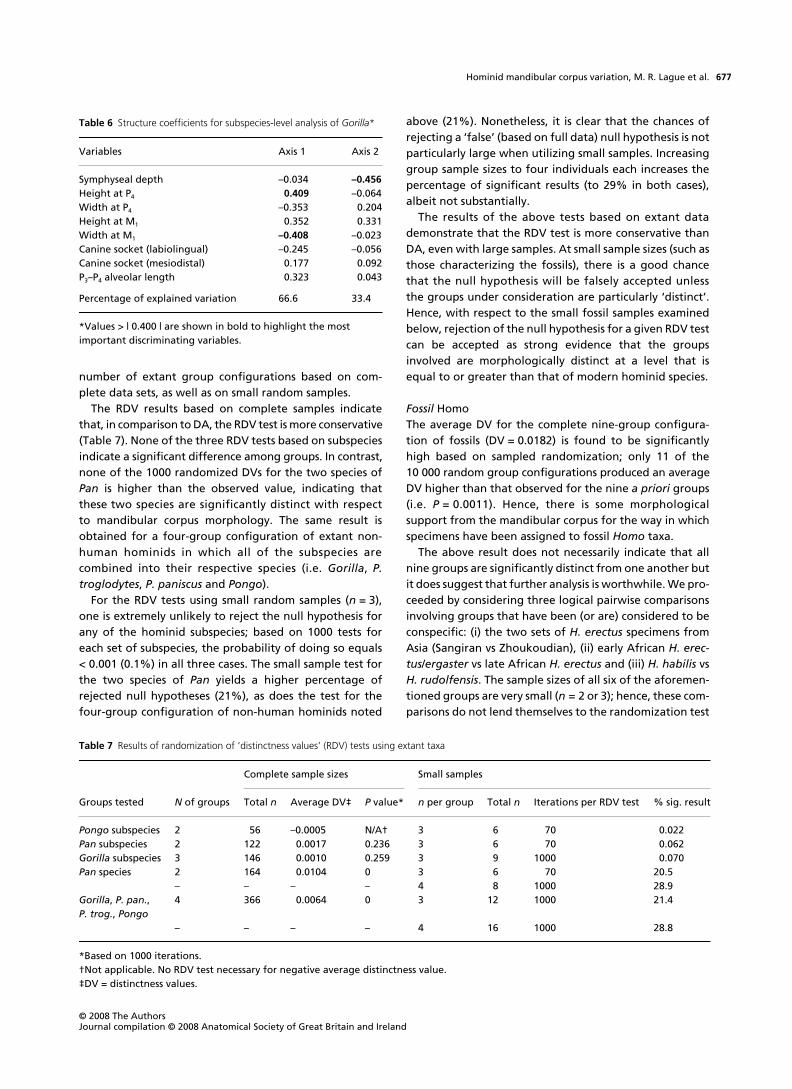
To provide a visual summary of the RDV results, we per-formed a canonical variates analysis (CVA) based on shapedata for the four ‘distinct’ groups noted above (Fig. 4a), eachof which was entered into the analysis as an a priori group.The majority of variation among groups is accounted forby the first axis (88.5%), with extensive overlap along thesecond axis (with the exception of H. heidelbergensis).Structure coefficients (Table 11) indicate that H. sapiensand H. heidelbergensis differ from the other three fossilhominin groups in that the mandibular corpus is relatively
higher at both P4 and M1, and the P3–P4 alveolar length isrelatively smaller. As expected, when Neanderthals areadded as a sixth group by projecting them onto the samecanonical vectors (Fig. 4b), they show substantial overlapwith H. sapiens, H. heidelbergensis and Asian H. erectus.
Discussion
The results of our DAs indicate that the hominid mandi-bular corpus is taxonomically informative, even when itsmorphology is captured by eight ‘low-tech’ traditionallinear measurements commonly preserved in the homininfossil record. To some extent, we can successfully discrimi-nate extant hominids at the genus, species and subspecieslevels (with the exception of the Pongo subspecies).These results are consistent with those of previous studiesthat used a broader set of mandibular variables (includ-ing measurements of the ramus and different corpus
Table 10 Results of additional randomization of ‘distinctness values’ (RDV) tests*
Groups included† N (groups) n (specimens) Average DV‡ P value
All nine groups 9 34 0.0182 0.0011 **‘Later Homo’ groupsapi, heid, nean 3 21 0.0031 0.1173 nsTests with ‘Asian H. erectus’ [zhou, sang][zhou, sang], [habi, rudo, erga, lahe] 2 13 0.0122 0.0049 **[zhou, sang], [sapi, heid, nean] 2 25 0.0022 0.1836 ns[zhou, sang], [sapi, heid] 2 17 0.0045 0.0489 *[zhou, sang], sapi, heid 3 17 0.0053 0.0269 *Tests with ‘African Homo’[habi, rudo, erga, lahe], sapi 2 20 0.0431 0 ***[habi, rudo, erga, lahe], heid 2 11 0.0303 0 ***Final four ‘distinct’ groupssapi, heid, [zhou, sang], [habi, rudo, erga, lahe] 4 26 0.0215 0.0012 **
*10 000 iterations used in all cases.†Taxa included within brackets were analysed as a single group: [sapi, heid, nean] = ‘later Homo’; [zhou, sang] = ‘Asian H. erectus’, [habi, rudo, erga, lahe] = ‘African Homo’.‡DV = distinctness value.
Table 11 Structure coefficients for canonical variates analysis (CVA) of the four ‘distinct’ fossil groups depicted in Fig. 4a (based on ‘shape’ data)*
Variables Axis 1 Axis 2
Symphyseal depth 0.177 0.523Height at P4 –0.501 –0.210Width at P4 0.351 0.338Height at M1 –0.487 –0.112Width at M1 0.291 –0.086Canine socket (labiolingual) –0.053 0.004Canine socket (mesiodistal) –0.205 –0.117P3–P4 alveolar length 0.442 –0.292
Percentage of explained variation 88.5 8.8
*Values > | 0.400 | are shown in bold to highlight the most important discriminating variables.

Hominid mandibular corpus variation, M. R. Lague et al.
© 2008 The Authors Journal compilation © 2008 Anatomical Society of Great Britain and Ireland
681
measurements; Humphrey et al. 1999; Taylor & Groves, 2003).As noted in the Introduction, it is theoretically possible thatmandibular corpus shape dimorphism may be substantialenough to obfuscate the detection of distinct taxa,
especially at the subspecific level. Nonetheless, despitereports of significant mandibular shape dimorphism inGorilla (Taylor, 2006c), we are able to distinguish amongthree gorilla subspecies with moderate success (using DA
Fig. 4 Canonical variates plot based on size-adjusted mandibular data for four ‘distinct’ groups of fossil hominins, presented alone (a) and with Neanderthals projected onto the same canonical vectors (b). The fossil specimens were configured into four groups based on the results of randomization of ‘distinctness values’ (RDV) tests, which also indicate that Neanderthal mandibular morphology is not significantly distinct from that of H. sapiens, H. erectus or H. heidelbergensis. The ‘African Homo’ group consists of specimens assigned to H. habilis, H. rudolfensis and early African H. erectus/H. ergaster.

Hominid mandibular corpus variation, M. R. Lague et al.
© 2008 The AuthorsJournal compilation © 2008 Anatomical Society of Great Britain and Ireland
682
but not RDV). Our inability to differentiate between theorangutan subspecies may be partly related to the rela-tively small sample sizes for P. p. abelli or perhaps tosignificant mandibular shape dimorphism (Taylor, 2006c),although an analysis of sexual dimorphism in Pongo isbeyond the scope of this study.
Analyses based on the extant data demonstrate that ourRDV test is more conservative than DA, even at similarsample sizes. For example, although the complete-sampleRDV results mirror the DA results in recognizing morpho-logical differences among hominids at the generic andspecies levels, RDV does not return statistically significantresults for analyses at the subspecific level. In addition, atsmall sample sizes (three to four individuals per group), itis likely that the null hypothesis of RDV will be falselyaccepted unless the groups under consideration are parti-cularly ‘distinct’ (e.g. only 29% of 1000 RDV tests indicateda significant distinction among the four hominin generawhen sample size was set to four). As such, with respect toour fossil samples, we believe that any significant resultsobtained from the RDV analyses provide strong evidencefor morphological distinction among groups, probably ata level similar to (or greater than) that of extant conge-neric hominid species (e.g. P. troglodytes and P. paniscus).
Evidence from RDV of hominin fossil samples suggeststhat the mandibular corpus does have limited taxonomicutility. Among the 34 fossil Homo mandibles examinedhere (potentially divisible into nine groups), we can recog-nize at least four unambiguously distinct groups: (i) modernH. sapiens; (ii) H. heidelbergensis; (iii) Asian H. erectusand (iv) ‘African Homo’. The latter combined group (iv)consists of four predominately African species (H. habilis,H. rudolfensis, early African H. erectus/H. ergaster and lateAfrican H. erectus) and we cannot reject the null hypo-thesis that these ‘African Homo’ taxa are random withrespect to mandibular corpus morphology (hence, theircollection into a single group). In addition, although themandibular corpora of H. neanderthalensis are found tobe distinct from those of the ‘African Homo’ group, theycannot be distinguished from those of H. sapiens, H. hei-delbergensis or ‘Asian H. erectus’.
We note that our results are contingent upon the smallnumber of corpus linear dimensions that we chose to measure;alternative variables may have produced significant resultsin those cases where the null hypothesis was accepted. Forexample, it is well established that modern humans differfrom other hominins in the presence of a mental eminenceand, although we did not measure this feature, it shouldserve to distinguish H. sapiens from the other specimens.In addition, although it has been argued that H. neander-thalensis can be defined by a suite of mandibular characters(see Rosas, 2001), our limited set of variables did not includemost of the characters commonly cited as distinctive.
Of all of the fossil species in our sample, H. erectus sensulato samples the longest time period and has the widest
geographic distribution. Specimens range in time from asearly as 1.7 mya (KNM-ER 730; Feibel et al. 1989) to as lateas ~200 kya (Zhoukoudian specimens G1.6 and H1.12;Antón, 2003). Not only does this fossil group span a timedepth of over 1.5 million years, it also has an extensivegeographic distribution ranging from Africa to China andIndonesia. Various researchers have examined the integ-rity of H. erectus sensu lato with the understanding thatthe extreme time depth and geographic distributionsampled by the taxon may introduce variation that is too greatfor a single hominin species (Groves & Mazák, 1975; Tyler,1991; Bräuer & Mbua, 1992; Bräuer, 1994; Rightmire, 1998;Antón, 2002; Kidder & Durband 2004). Our own resultssuggest that mandibular corpus morphology does notallow us to discriminate between Chinese and IndonesianH. erectus specimens, nor are we able to recognize anydiagnostic differences between early and late AfricanH. erectus. In contrast, the division between Africanand Asian H. erectus specimens is supported by ouranalyses.
Another issue in fossil Homo taxonomy that has longbeen of interest concerns the scope of the hypodigm ofH. habilis. Arguments have been made both for (e.g.Alexeev, 1986; Wood, 1991) and against (e.g. Howell,1978; Tobias, 1985) the division of the H. habilis sensu latohypodigm. Based on our limited eight-variable data set, themorphology of the mandibular corpus does not provideany additional evidence for splitting the H. habilis hypo-digm. However, some of the mandibular morphology thatis said to differ between H. habilis and H. rudolfensis(e.g. the size of the alveolar planum; Lieberman et al. 1996)is not captured by our analysis and much of the argumentfor splitting the H. habilis hypodigm is based on dental andother non-mandibular cranial data.
We deliberately limited the scope of this study to simpletraditional linear measurements that can be taken by anyresearcher on the part of the mandible (i.e. the corpus)that is best represented in the hominin fossil record. Wealso deliberately focused on fossil taxa within a single genusand did not compare the mandibles of more distantlyrelated taxa such as H. ergaster and P. boisei (which differmarkedly in size and shape), nor did we investigatemandibular corpus variation more widely within and amongfossil hominoid taxa. Despite constraining the study inthese ways, it is clear that these commonly available datado carry a taxonomic signal and we anticipate that sucha signal will have at least some taxonomic utility withinand among fossil hominoid taxa. Although linear measure-ments of the mandibular corpus do not distinguishamong all fossil Homo taxa (particularly not among earlyAfrican specimens), they do distinguish among several ofthem. These results imply that, to a limited extent, it ispossible to test hypotheses concerning hominin alphataxonomy using the mandibular corpus, particularly whennew discoveries increase the fossil sample sizes.
Hominid mandibular corpus variation, M. R. Lague et al.
© 2008 The Authors Journal compilation © 2008 Anatomical Society of Great Britain and Ireland
683
Acknowledgements
We would like to thank Linda Gordon, David Hunt and Rick Potts(National Museum of Natural History, Smithsonian Institution) forproviding access to fossil casts and primate skeletal remains. Weare grateful to Bruce Latimer and Lymen Jellema (ClevelandMuseum of Natural History) and Wim Van Neer (Royal Museumof Central Africa, Tervuren, Belgium) for access to the primatecollections in their care. Thanks to Yoel Rak for allowing access tothe fossil specimens and archaeological human skeletal remainsstored at Tel Aviv University, Israel, and for his comments on a previousversion of this manuscript. Thanks also to Mark Collard, RobbinChatan, Susan Antón, Dan Lieberman, and several anonymousreviewers for their comments. This research was funded in part bythe Louis B. Cotlow Research Fund, The Henry Luce Foundation,the University of Illinois at Urbana-Champaign and Lee Silverman.
References
Aiello LC, Collard M, Thackeray JF, Wood BA (2000) Assessing exactrandomization-based methods for determining the taxonomicsignificance of variability in the human fossil record. S Afr J Sci96, 179–183.
Aitchison J (1963) Comparison of chimpanzee skulls, jaws andteeth with those of modern hominids. Aust Dent J 8, 477–482.
Aitchison J (1965) Contrasts in the mandibles and mandibularteeth of the chimpanzee, orang-utan and gorilla. Dent Mag OralTop 81, 105–108.
Albrecht GH, Gelvin BR, Miller JMA (2003) The hierarchy ofintraspecific craniometric variation in gorillas: a population-thinking approach with implications for fossil species recogni-tion studies. In Gorilla Biology: A Multidisciplinary Perspective(eds Taylor AB, Goldsmith ML), pp. 62–103. Cambridge, UK:Cambridge University Press.
Alexeev VP (1986) The Origin of the Human Race. Moscow:Progress Publishers.
Antón S (2003) Natural history of Homo erectus. Yrbk PhysAnthropol 46, 126–170.
Antón SC (2002) Evolutionary significance of cranial variation inAsian Homo erectus. Am J Phys Anthropol 118, 301–323.
Arambourg C, Coppens Y (1968) Découverte d’un australo-pithécien nouveau dans les gisements de l’Omo (Éthiopie). S AfrJ Sci 64, 58–59.
Bermúdez de Castro JM, Arsuaga JL, Carbonell E, Rosas A,Martínez I, Mosquera M (1997) A hominid from the lower Pleis-tocene of Atapuerca, Spain: possible ancestor to Neandertalsand modern humans. Science 276, 1392–1395.
Bilsborough A, Wood BA (1988) Cranial morphometry of earlyhominids: facial region. Am J Phys Anthropol 76, 61–86.
Bräuer G (1994) How different are Asian and African Homo erec-tus? Cour Forsch-inst Senckenberg 171, 301–318.
Bräuer G, Mbua E (1992) Homo erectus features used in cladisticsand their variability in Asian and African hominids. J Hum Evol22, 79–108.
Bromage TG, Schrenk F, Zonneveld FW (1995) Paleoanthropologyof the Malawi Rift: an early hominid mandible from the ChiwondoBeds, northern Malawi. J Hum Evol 28, 71–108.
Broom R (1938) The Pleistocene anthropoid apes of South Africa.Nature 142, 377–379.
Broom R (1949) Another new type of fossil ape-man (Paranthropuscrassidens). Nature 163, 57.
Brunet M, Beauvilain A, Coppens Y, Heintz E, Moutaye AHE,Pilbeam D (1996) Australopithecus bahrelghazali, une nouvelleespèce d’Hominidé ancien de la région de Koro Toro (Tchad).CR Acad Sci IIa 322, 907–913.
Chamberlain AT, Wood BA (1985) A reappraisal of variation inhominid mandibular corpus dimensions. Am J Phys Anthropol66, 399–405.
Cleaver FH (1937) A contribution to the biometric study of thehuman mandible. Biometrika 29, 80–112.
Conover W, Iman R (1981) Rank transformations as a bridgebetween parametric and nonparametric statistics. Am Stat 35,124–133.
Courtenay J, Groves C, Andrews P (1988) Inter- or intra-islandvariation? An assessment of the differences between Borneanand Sumatran Orang-utans. In Orang-utan Biology (ed. SchwartzJH), pp. 19–29. New York: Oxford University Press.
Daegling DJ, Jungers WL (2000) Elliptical Fourier analysis of sym-physeal shape in great ape mandibles. J Hum Evol 39, 107–122.
Darroch JN, Mosimann JE (1985) Canonical and principal compo-nents of shape. Biometrika 72, 241–252.
Day MH, Leakey REF (1973) New evidence for the genus Homofrom East Rudolf, Kenya. Am J Phys Anthropol 39, 341–354.
Feibel CS, Brown FH, McDougall I (1989) Stratigraphic context offossil hominids from the Omo Group Deposits, northern TurkanaBasin, Kenya and Ethiopia. Am J Phys Anthropol 78, 595–622.
Grine FE, Jungers WL, Schultz J (1996) Phenetic affinities amongearly Homo crania from East and South Africa. J Hum Evol 30,189–225.
Groves CP (1967) Ecology and taxonomy of the Gorilla. Nature213, 890–893.
Groves CP (1970) Population systematics of the Gorilla. J Zool 161,287–300.
Groves CP (1971) Pongo pygmaeus. Mamm Species 4, 1–6.Groves CP (1989) A Theory of Human and Primate Evolution.
Oxford: Clarendon Press.Groves CP, Mazák V (1975) An approach to the taxonomy of the
Hominidae: gracile Villafranchian hominids of Africa. CasopisMineral Geol 20, 225–247.
Harrower G (1928) A biometric study of one hundred and tenAsiatic mandibles. Biometrika 20B, 279–293.
Howell FC (1978) Hominidae. In Evolution of African Mammals(eds Maglio VJ, Cooke HBS), pp. 154–248. Cambridge, MA: HarvardUniversity Press.
Hrdli!ka A (1940a) Lower jaw. Am J Phys Anthropol 27, 281–308.Hrdli!ka A (1940b) Lower jaw. Further studies. Am J Phys Anthropol
27, 383–467.Humphrey LT, Dean MC, Stringer CB (1999) Morphological varia-
tion in great ape and modern human mandibles. J Anat 195,491–513.
Johanson DC, White TD, Coppens Y (1978) A new species of thegenus Australopithecus (Primates: Hominidae) from the Plioceneof eastern Africa. Kirtlandia 28, 1–14.
Jolly CJ (2001) A proper study for Mankind: analogies from thePapionin monkeys and their implications for human evolution.Yrbk Phys Anthropol 44, 177–204.
Jungers W, Falsetti A, Wall C (1995) Shape, relative size, and size-adjustments in morphometrics. Yrbk Phys Anthropol 38, 137–161.
Kaifu Y, Baba H, Aziz F, Indriati E, Schrenk F, Jacob T (2005)Taxonomic affinities and evolutionary history of the EarlyPleistocene hominids of Java: dentognathic evidence. Am J PhysAnthropol 128, 709–726.
Kidder JH, Durband AC (2004) Evaluation of the metric diversitywithin Homo erectus. J Hum Evol 46, 299–315.

Hominid mandibular corpus variation, M. R. Lague et al.
© 2008 The AuthorsJournal compilation © 2008 Anatomical Society of Great Britain and Ireland
684
Kimbel W, White T (1988) Variation, sexual dimorphism and thetaxonomy of Australopithecus. In Evolutionary History of the‘Robust’ Australopithecines (ed. Grine F), pp. 175–192. NewYork: Aldine de Gruyter.
Kinzey WG (1970) Basic rectangle of the mandible. Nature 228,289–290.
Klecka WR (1980) Discriminant Analysis. Quantitative Applicationsin the Social Sciences Series, No. 19. Thousand Oaks, CA: SagePublications.
Kramer A, Donnelly SM, Kidder JH, Ousley SD, Olah SM (1995)Craniometric variation in large-bodied hominids: testing the single-species hypothesis for Homo habilis. J Hum Evol 29, 443–462.
Lam YM, Pearson OM, Smith CM (1996) Chin morphology andsexual dimorphism in the fossil hominid mandible sample fromKlasies River Mouth. Am J Phys Anthropol 100, 545–557.
Leakey MG, Feibel CS, McDougall I, Walker AC (1995) Newfour-million-year-old hominid species from Kanapoi and AlliaBay, Kenya. Nature 376, 565–571.
Lieberman DE, Pilbeam DR, Wood BA (1988) A probabilisticapproach to the problem of sexual dimorphism in Homo habilis:a comparison of KNM-ER 1470 and KNM-ER 1813. J Hum Evol 17,503–511.
Lieberman DE, Wood BA, Pilbeam DR (1996) Homoplasy and earlyHomo: an analysis of the evolutionary relationships of H. habilissensu stricto and H. rudolfensis. J Hum Evol 30, 97–120.
Martin ES (1936) A study of an Egyptian series of mandibles withspecial reference to mathematical methods of sexing. Biometrika28, 149–178.
Miller JMA (1991) Does brain size variability provide evidence ofmultiple species in Homo habilis? Am J Phys Anthropol 84, 385–398.
Miller JMA (2000) Craniofacial variation in Homo habilis: ananalysis of the evidence for multiple species. Am J Phys Anthropol112, 103–128.
Morant GM, Collett M, Adyanthaya NK (1936) A biometric studyof the human mandible. Biometrika 28, 84–122.
Muir CC, Galdikas BMF, Beckenbach AT (1998) Is there sufficientevidence to elevate the orangutan of Borneo and Sumatra toseparate species. J Mol Evol 46, 378–381.
Muir CC, Galdikas BMF, Beckenbach AT (2000) mtDNA sequencediversity of orangutans from the islands of Borneo and Sumatra.J Mol Evol 51, 471–480.
Nicholson E, Havarti K (2006) Quantitative analysis of human man-dibular shape using three-dimensional geometric morphometrics.Am J Phys Anthropol 131, 368–383.
Oettlé AC, Pretorius E, Steyn M (2005) Geometric morphometricanalysis of mandibular ramus flexure. Am J Phys Anthropol 128,623–629.
Plavcan JM (2002) Taxonomic variation in the patterns of cranio-facial dimorphism in primates. J Hum Evol 42, 579–608.
Quam RM, Arsuaga J-L, Bermúdez de Castro J-M (2001) Humanremains from Valdegoba Cave (Huérmeces, Burgos, Spain). J HumEvol 41, 385–435.
Rak Y, Ginzburg A, Geffen E (2002) Does Homo neanderthalensisplay a role in modern human ancestry? The mandibular evidence.Am J Phys Anthropol 119, 199–204.
Rencher AC (1995) Methods of Multivariate Analysis. New York:John Wiley & Sons.
Rightmire GP (1990) The Evolution of Homo erectus: ComparativeAnatomical Studies of an Extinct Human Species. Cambridge,U.K.: Cambridge University Press.
Rightmire GP (1998) Evidence from facial morphology for similarityof Asian and African representatives of Homo erectus. Am J PhysAnthropol 106, 61–85.
Rightmire GP, Lordkipanidze D, Vekua A (2006) Anatomical descrip-tions, comparative studies and evolutionary significance of thehominin skulls from Dmanisi, Republic of Georgia. J Hum Evol50, 115–141.
Rosas A (1995) Seventeen new mandibular specimens from theAtapuerca/Ibeas Middle Pleistocene Hominids Sample (1985–1992). J Hum Evol 28, 533–559.
Rosas A (2001) Occurrence of Neanderthal features in mandiblesfrom the Atapuerca-SH site. Am J Phys Anthropol 114, 74–91.
Rosas A, Bastir M (2004) Geometric morphometric analysis of allo-metric variation in the mandibular morphology of the hominidsof Atapuerca, Sima de los Huesos Site. Anat Rec A 278A, 551–560.
Rosas A, Bermúdez de Castro JM (1998) On the taxonomic affini-ties of the Dmanisi mandible (Georgia). Am J Phys Anthropol107, 145–162.
Rosas A, Bermúdez de Castro JM (1999) The ATD6–5 mandibularspecimen from Gran Dolina (Atapuerca, Spain). Morphologicalstudy and phylogenetic implications. J Hum Evol 37, 567–590.
Schmittbuhl M, Rieger J, Le Minor J-M, Schaaf A, Guy F (2007)Variations of the mandibular shape in extant hominoids: generic,specific, and subspecific quantification using elliptical Fourieranalysis in lateral view. Am J Phys Anthropol 132, 119–131.
Schneider M (2006) Examination of Structure Coefficient Interpre-tation in Descriptive Discriminant Analysis: the Three-Group Case.Abstract from the 2006 Joint Statistical Meetings (AmericanStatistical Association), p. 406.
Schoetensack O (1908) Der Unterkierfer des Homo heidelber-gensis aus den Sanden von Mauer bei Heidelberg. Leipzig: W.Engelmann.
Schwartz JH, Tattersall I (2000) The human chin revisited: what isit and who has it? J Hum Evol 38, 367–409.
Silverman N, Richmond B, Wood B (2000) Does the hominid man-dibular corpus have any taxonomic utility? Am J Phys Anthropol30, 281.
Silverman N, Richmond B, Wood B (2001) The taxonomic integrityof Paranthropus boisei sensu stricto. Am J Phys Anthropol 115,167–178.
Skinner MM, Gordon AD, Collard NJ (2006) Mandibular size andshape variation in the hominins at Dmanisi, Republic of Georgia.J Hum Evol 51, 36–49.
Smith RJ (1983) The mandibular corpus of female primates: taxo-nomic, dietary, and allometric correlates of interspecific varia-tions in size and shape. Am J Phys Anthropol 61, 315–330.
Sokal RR, Rohlf FJ (1995) Biometry, 3rd edn. New York: W.H.Freeman Co.
Stefan VH, Trinkaus E (1998a) La Quina 9 and Neandertal mandi-bular variability. Bull Mém Soc Anthropol Paris 10, 293–324.
Stefan VH, Trinkaus E (1998b) Discrete trait and dental morpho-metric affinities of the Tabun 2 mandible. J Hum Evol 34, 443–468.
Stringer CB (1986) The credibility of Homo habilis. In Major Topicsin Primate and Human Evolution (eds Wood BA, Martin LB,Andrews P), pp. 266–294. New York: Alan R. Liss.
Tattersall I (1986) Species recognition in human paleontology.J Hum Evol 15, 165–175.
Taylor AB (2002) Masticatory form and function in the African apes.Am J Phys Anthropol 117, 133–156.
Taylor AB (2003) Ontogeny and function of the masticatorycomplex in Gorilla: Functional, evolutionary, and taxonomicimplications. In Gorilla Biology: A Multidisciplinary Perspective(eds Taylor AB, Goldsmith ML), pp. 132–189. Cambridge, U.K.:Cambridge University Press.

Hominid mandibular corpus variation, M. R. Lague et al.
© 2008 The Authors Journal compilation © 2008 Anatomical Society of Great Britain and Ireland
685
Taylor AB (2005) A comparative analysis of temporomandibularjoint morphology in the African apes. J Hum Evol 48, 555–574.
Taylor AB (2006a) Diet and mandibular morphology in the Africanapes. Int J Primatol 27, 181–201.
Taylor AB (2006b) Feeding behavior, diet, and the functionalconsequences of jaw form in orangutans, with implications forthe evolution of Pongo. J Hum Evol 50, 377–393.
Taylor AB (2006c) Size and shape dimorphism in great ape mandiblesand implications for fossil species recognition. Am J Phys Anthropol129, 82–98.
Taylor AB, Groves CP (2003) Patterns of mandibular variation inPan and Gorilla and implications for African ape taxonomy.J Hum Evol 44, 529–561.
Thalmann O, Fischer A, Lankester F, Paabo S, Vigilant L (2007) Thecomplex evolutionary history of gorillas: insights from genomicdata. Mol Biol Evol 24, 146–158.
Tobias PV (1985) Single characters and the total morphologicalpattern redefined: the sorting effected by a selection ofmorphological features of the early hominids. In Ancestors:The Hard Evidence (ed. Delson E), pp. 94–101. New York:Alan R. Liss.
Tobias PV (1991) Olduvai Gorge. Vol. 4: The Skulls, Endocasts andTeeth of Homo habilis. Cambridge, U.K.: Cambridge UniversityPress.
Tyler DE (1991) A taxonomy of Javan hominid mandibles. HumEvol 6(56), 401–420.
Vinter I, Krmpotic-Nemanic J, Ivankovic D, Jal6ovec D (1996) Theinfluence of the dentition on the shape of the mandible. CollAntropol Zagreb 20(2), 555–560.
Weidenreich F (1936) The mandibles of Sinanthropus pekinensis: acomparative study. Palaeont Sin Ser D 7, 1–162.
Wildman D, Uddin M, Liu G, Grossman LI, Goodman M (2003)Implications of natural selection in shaping 99.4% nonsynonymousDNA identity between humans and chimpanzees: enlarginggenus Homo. Proc Natl Acad Sci 100, 7181–7188.
Wolpoff MH (1996) Human Evolution. New York: McGraw-Hill.Wolpoff MH, Thorne A, Jelinek J, Zhang Y (1994) The case for
sinking Homo erectus: 100 years of Pithecanthropus is enough!Cour Forsch-inst Senckenberg 171, 341–361.
Wood BA (1976) The nature and basis of sexual dimorphism in theprimate skeleton. J Zool Lond 180, 15–34.
Wood BA (1985) Early Homo in Kenya, and its systematic relation-ships. In Ancestors: The Hard Evidence (ed. Delson E), pp. 206–214. New York: Alan R. Liss.
Wood BA (1991) Koobi Fora Research Project, Vol. 4: HominidCranial Remains. Oxford: Clarendon Press.
Wood BA (1992) Early hominid species and speciation. J Hum Evol22, 351–365.
Wood BA (1994) Taxonomy and evolutionary relationships ofHomo erectus. Cour Forsch-inst Senckenberg 171, 159–165.
Wood BA, Collard M (1999) The human genus. Science 284, 65–71.Wood BA, Lieberman DE (2001) Craniodental variation in Paran-
thropus boisei: a developmental and functional perspective.Am J Phys Anthropol 116, 13–25.
Wood BA, Richmond BG (2000) Human evolution: taxonomy andpaleobiology. J Anat 197, 19–60.
Wood BA, Li Y, Willoughby C (1991) Intraspecific variation andsexual dimorphism in cranial and dental variables among higherprimates, and their bearing on the hominid fossil record. J Anat174, 185–205.
Zhang Y, Ryder OA, Zhang Y (2001) Genetic divergence of orangutansubspecies (Pongo pygmaeus). J Mol Evol 52, 516–526.