Homeschool in the United States: 2012 - National … · Homeschooling in the United States: 2012...
52
Homeschooling in the United States: 2012 NCES 2016-096.REV U.S. DEPARTMENT OF EDUCATION
Transcript of Homeschool in the United States: 2012 - National … · Homeschooling in the United States: 2012...

Homeschooling in the United States: 2012
NCES 2016-096.REVU.S. DEPARTMENT OF EDUCATION


Homeschooling in the United States: 2012
APRIL 2017
Jeremy Redford Danielle Battle Stacey Bielick American Institutes for Research
Sarah Grady Project Officer National Center for Education Statistics
NCES 2016-096.REV
U.S. DEPARTMENT OF EDUCATION

Department of EducationBetsy DeVosSecretary
Institute of Education Sciences Thomas Brock Commissioner, National Center for Education Research Delegated the Duties of IES Director
National Center for Education Statistics Peggy G. CarrActing Commissioner
The National Center for Education Statistics (NCES) is the primary federal entity for collecting, analyzing, and reporting data related to education in the United States and other nations. It fulfills a congressional mandate to collect, collate, analyze, and report full and complete statistics on the condition of education in the United States; conduct and publish reports and specialized analyses of the meaning and significance of such statistics; assist state and local education agencies in improving their statistical systems; and review and report on education activities in foreign countries.
NCES activities are designed to address high-priority education data needs; provide consistent, reliable, complete, and accurate indicators of education status and trends; and report timely, useful, and high-quality data to the U.S. Department of Education, the Congress, the states, other education policymakers, practitioners, data users, and the general public. Unless specifically noted, all information contained herein is in the public domain.
We strive to make our products available in a variety of formats and in language that is appropriate to a variety of audiences. You, as our customer, are the best judge of our success in communicating information effectively. If you have any comments or suggestions about this or any other NCES product or report, we would like to hear from you. Please direct your comments to
NCES, IES, U.S. Department of Education Potomac Center Plaza 550 12th Street SW Washington, DC 20202
April 2017
The NCES Home Page address is http://nces.ed.gov. The NCES Web Publications and Products address is http://nces.ed.gov/pubsearch. This publication is only available online. To download, view, and print the report as a PDF file, go to the NCES Publications and Products address shown above.
This report was prepared for the National Center for Education Statistics under Contract No. ED-IES-12-D-0002 with American Institutes for Research. Mention of trade names, commercial products, or organizations does not imply endorsement by the U.S. Government.
Suggested Citation Redford, J., Battle, D., and Bielick, S. (2017). Homeschooling in the United States: 2012 (NCES 2016-096.REV). National Center for Education Statistics, Institute of Education Sciences, U.S. Department of Education. Washington, DC.
For ordering information on this report, write to
ED Pubs, U.S. Department of EducationP.O. Box 22207 Alexandria, VA 22304
or call toll free 1-877-4-ED-Pubs or order online at http://www.edpubs.gov.
Content Contact Sarah Grady (202) [email protected]

i
Executive Summary
Since 1999, the National Household Education Surveys Program (NHES), conducted by the U.S. Department of Education’s National Center for Education Statistics (NCES) in the Institute of Education Sciences, has collected nationally representative data that can be used to estimate the number of homeschooled students in the United States. This report provides estimates of the number, percentage, and characteristics of homeschooled students in the United States in 2012 and provides historical context by showing overall estimates of homeschooling in the United States since 1999. It also provides homeschooled students’ learning context by examining reasons for homeschooling, sources of curriculum, parent preparation for homeschooling, students’ online course-taking, and math and science subject areas taught to homeschooled students during home instruction.
Estimates of homeschooling in 2012 are based on data from the Parent and Family Involvement in Education Survey (PFI) of the 2012 NHES. NHES data are designed to measure phenomena that cannot be easily measured by contacting institutions such as schools but are efficiently measured by contacting people at their homes. The target population for the PFI survey is students in the 50 United States and the District of Columbia, age 20 or younger, who are enrolled in kindergarten through grade 12 or are homeschooled for equivalent grades. The NHES:2012 included two surveys related to parent and family involvement in education: the PFI-Enrolled survey and the PFI-Homeschool survey. The PFI-Enrolled survey asks questions about various aspects of parent involvement in education of students enrolled in a public or private school, such as help with homework, family activities, and parent involvement at school. For homeschooled students, the PFI-Homeschool survey asks questions related to the students’ homeschooling experiences and the reasons for homeschooling. The 2012 survey was administered from January through August of 2012, by mail. Questionnaires were completed by the parents of 17,563 students, including 397 homeschooled students reported in the PFI-Homeschool questionnaire.
In this Statistical Analysis Report, students are considered to be homeschooled if their parents reported them as being schooled at home instead of at a public or private school for at least part of their education and if their part-time enrollment in public or private school did not exceed 25 hours a week. Students who were schooled at home primarily because of a temporary illness are also excluded, resulting in an analytic sample of 347 students. In 2012, the estimate of the total number of homeschoolers includes these 347 students and a weight-adjusted number based on 303 students whose parents completed the PFI-Enrolled questionnaire and marked that the students were schooled at home instead of at school for some classes or subjects (see technical notes for details). When weighted to include homeschoolers reported on both the PFI-Homeschool and PFI-Enrolled questionnaires, data represent the experiences of approximately 1,773,000 homeschooled students ages 5 through 17 with a grade equivalent of kindergarten through grade 12 in the United States, which is NCES’s most accurate estimate of the true number of students who were homeschooled in 2012. The unadjusted number of homeschooled students is 1,082,000.

EXECUTIVE SUMMARY ii
Estimates in this report are produced from cross-tabulations of the data, and t-tests are performed to test for differences between estimates. All differences cited in the text of this report are statistically significant at the p < .05 level. No corrections were made for multiple comparisons. As a result, an increase in Type I error is possible. Type I error is the observation of a statistical difference when, in fact, there is none. Readers are cautioned not to make causal inferences about the data presented here. Some of the major findings are presented below.
National Totals • The percentage of students ages 5–17 with a grade equivalent of kindergarten through grade 12 who
are homeschooled—the homeschooling rate—has increased over time. The homeschooling rate increased from 1.7 percent in 1999 to 3.4 percent in 2012 (table 1).
• In 2012, there were an estimated 1.8 million homeschooled students in the United States, which is an increase from 850,000 in 1999, when estimates were first reported (figure 1).
Characteristics of Homeschooled Students • Most homeschooled students were White (83 percent) and nonpoor (89 percent), lived in cities or
suburban areas and rural areas. Homeschooled students spanned all grade equivalents (table 2).
The Learning Context of Homeschooled Students • Nine in 10 homeschooled students’ parents reported that concern about schools’ environments was
an important reason for their decision to homeschool (table 3). • Websites, homeschooling catalogs, public libraries, and bookstores were the more frequently cited
sources of curriculum for homeschooled students in 2012. Curricula from public and private schools were among the least cited (figure 2).
• About a quarter of homeschooled students had parents who took a course to prepare for their child’s home instruction (figure 3).
• About a third of middle school-level homeschooled students (35 percent) and a third of high school-level (34 percent) homeschooled students took online courses (figure 4).
• Most high-school level homeschooled students had home instruction that included basic algebra (88 percent), earth sciences or geology and biology (69 percent each) (figures 5 and 6).

iii
Contents
PAGE
Executive Summary .................................................................................................................................................. i
Contents ................................................................................................................................................................... iii
List of Tables, Figures, and Exhibits ................................................................................................................... iv
Introduction .............................................................................................................................................................. 1
Data and Measures .................................................................................................................................................. 2
Findings Part I—National Totals ........................................................................................................................ 5
Findings Part II—Characteristics of Homeschooled Students ....................................................................... 8
Findings Part III—The Learning Context of Homeschooled Students ......................................................11
Appendix A—Standard Error Tables ............................................................................................................. A-1
Appendix B—Technical Notes ........................................................................................................................ B-1
Appendix C—Implementing the Homeschool Estimates Adjustment .................................................... C-1

iv
List of Tables, Figures, and Exhibits
TABLE PAGE
1 Homeschooling rate for students, ages 5 through 17 with a grade equivalent of kindergarten through grade 12: 1999, 2003, 2007, and 2012 .......................................... 7
2 Percentage distribution of homeschooled students ages 5 through 17 with a grade equivalent of kindergarten through grade 12 and homechooling rate, by selected characteristics: 2012 .............................................................................................. 10
3 Percentage of school-age children who were homeschooled, ages 5 through 17 with a grade equivalent of kindergarten through grade 12, by reasons parents gave as important and most important for homeschooling: 2012 ............................... 12
A-1 Standard errors for figure 1: Estimated number and 95 percent confidence interval for number of homeschooled students, ages 5 through 17 with a grade equivalent of kindergarten through grade 12: 1999, 2003, 2007, and 2012 .............. A-1
A-2 Standard errors for table 1: Homeschooling rate for students, ages 5 through 17 with a grade equivalent of kindergarten through grade 12: 1999, 2003, 2007, and 2012 ...................................................................................................................................... A-1
A-3 Standard errors for table 2: Percentage distribution of homeschooled students ages 5 through 17 with a grade equivalent of kindergarten through grade 12 and homeschooling rate, by selected characteristics: 2012 ................................................. A-2
A-4 Standard errors for table 3: Percentage of school-age children who were homeschooled, ages 5 through 17 with a grade equivalent of kindergarten through grade 12, by reasons parents gave as important and most important for homeschooling: 2012 ......................................................................................................... A-3
A-5 Standard errors for figure 2: Percentage of homeschooled students, ages 5 through 17 with a grade equivalent of kindergarten through grade 12, by parent-reported sources of curriculum and books: 2012 ......................................................... A-3

LIST OF TABLES, FIGURES, AND EXHIBITS v
A-6 Standard errors for figure 3: Percentage of homeschooled students, ages 5 through 17 with a grade equivalent of kindergarten through grade 12, whose parents reported attending a course to prepare for the child’s home instruction, by the method of attending the course: 2012 ................................................................ A-4
A-7 Standard errors for figure 4: Percentage of homeschooled students, ages 5 through 17 with a grade equivalent of kindergarten through grade 12, who had enrolled in an online course, by grade-level equivalent and the providers of the online instruction: 2012 .................................................................................................... A-4
A-8 Standard errors for figure 5: Percentage of homeschooled students with a grade level equivalent of 9-12 who have been taught specific math subjects during the time being homeschooled: 2012 ...................................................................................... A-5
A-9 Standard errors for figure 6: Percentage of homeschooled students with a grade level equivalent of 9-12 who have been taught specific science subjects during the time being homeschooled: 2012 ............................................................................... A-5
A-10 Standard errors for table B-1: Estimated percentage of students age 5 through17 with a grade equivalent of kindergarten through grade 12 who were homeschooled with and without 2012 adjustments: 2007 and 2012 ......................... A-5
A-11 Standard errors for table B-2: Percentage of homeschooled students, ages 5 through 17 with a grade equivalent of kindergarten through grade 12, by school enrollment status: 1999, 2003, 2007, and 2012 ............................................................. A-5
A-12 Standard errors for table B-3: Percentage distribution of homeschooled students considered part-time homeschoolers on the PFI- Enrolled and PFI-Homeschool questionnaires, ages 5 through 17 with a grade equivalent of kindergarten through grade 12, by selected characteristics: 2012 .............................. A-6
B-1 Estimated percentage of students, ages 5 through 17 with a grade equivalent of kindergarten through grade 12 who were homeschooled with and without 2012 adjustments: 2007 and 2012……………………….....................................................B-4
B-2 Percentage of homeschooled students, ages 5 through 17 with a grade equivalent of kindergarten through grade 12, by school enrollment status: 1999, 2003, 2007, and 2012…………………………………………………………………...B-5
B-3 Percentage distribution of homeschooled students considered part-time homeschoolers on the PFI-Enrolled and PFI-Homeschool questionnaires, ages 5 through 17 with a grade level equivalent of kindergarten through grade 12, by selected characteristics ………………………………………………….........…...B-6

LIST OF TABLES, FIGURES, AND EXHIBITS vi
FIGURE PAGE
1 Estimated number and 95 percent confidence interval for number of homeschooled students, ages 5 through 17 with a grade equivalent of kindergarten through grade 12: 1999, 2003, 2007, and 2012 ........................................ 6
2 Percentage of homeschooled students, ages 5 through 17 with a grade equivalent of kindergarten through grade 12, by parent-reported sources of curriculum and books: 2012 ............................................................................................... 13
3 Percentage of homeschooled students, ages 5 through 17 with a grade equivalent of kindergarten through grade 12, whose parents reported attending a course to prepare for the child’s home instruction, by method of attending the course: 2012 .................................................................................................. 14
4 Percentage of homeschooled students, ages 5 through 17 with a grade equivalent of kindergarten through grade 12, who had enrolled in an online course by grade equivalent and the providers of the online instruction: 2012 .......... 15
5 Percentage of homeschooled students with a grade level equivalent of 9-12 who had been taught specific math subjects during home instruction: 2012 ....................................................................................................... 17
6 Percentage of homeschooled students with a grade level equivalent of 9-12 who had been taught specific science subjects during home instruction: 2012 ....................................................................................................... 18
EXHIBIT PAGE
B-1 Poverty definition in Parent and Family Involvement in Education (PFI) analyses, by household size: 2012 .................................................................................................... B-10
C-1 Adjusting final child level weight to estimate 2012 weighted homeschooling count and rate ..................................................................................................................... C-1
C-2 Creating replicate weights for estimating 2012 homeschooling rate standard errors .................................................................................................................................... C-1

1
Introduction
Since 1999, the National Household Education Surveys Program (NHES), conducted by the U.S. Department of Education’s National Center for Education Statistics (NCES) in the Institute of Education Sciences, has collected nationally representative data that can be used to estimate the number of homeschooled students in the United States. This report uses data from the Parent and Family Involvement in Education survey (PFI) from the National Household Education Surveys Program (NHES), a sample survey of students enrolled or homeschooled for a grade equivalent of kindergarten to grade 12, to report on the number and percentage of homeschooled students. NHES is sponsored by the National Center for Education Statistics (NCES) within the Institute of Education Sciences (IES) of the U.S. Department of Education and has been conducted roughly every 2–3 years since 1991.
The report spotlights 2012 data on the number, percentage, and characteristics of homeschoolers. It provides historical context by showing overall estimates of homeschooling in the United States since 1999. It also provides homeschooled students’ learning context by examining reasons for homeschooling, sources of curriculum, parent preparation for homeschooling, students’ online course-taking and math and science subject areas taught to homeschooled students during home instruction. Previous data and reports about homeschooling using the NHES are available at http://nces.ed.gov/nhes/.
Readers should use caution when examining homeschool rates over time because of a change in the design of the NHES from a telephone survey to a mail survey. The technical notes detail the change in methodology for collecting information about homeschooled students from prior NHES administrations.
NHES estimates are based on samples. The sample estimates may differ somewhat from the values that would be obtained from the universe of respondents. As a sample survey, NHES data are weighted to produce the population estimates provided in the tables. The standard errors for each estimate (provided in appendix A) are based on the amount of variation in the responses and the size of the sample or subgroup for which the estimate is computed. Differences cited in this report are statistically significant at the p < .05 level. No corrections were made for multiple comparisons; as a result, an increase in Type I error is possible. Type I error is the observation of a statistical difference when, in fact, there is none. Readers are cautioned not to make causal inferences from the data presented here. For more information on the methodology used in this report, see the technical notes.

2
Data and Measures
Estimates in this report are based on data from the Parent and Family Involvement in Education Survey (PFI) of the 2012 NHES. NHES data are designed to measure phenomena that cannot be easily measured by contacting institutions such as schools, and are better measured through contacting people at their homes. The NHES:2012 was a residential, address-based sample survey covering the 50 states and the District of Columbia and was administered on behalf of the National Center for Education Statistics by the United States Census Bureau from January through August 2012, by mail.
The target population for the PFI survey is students, age 20 or younger, who are enrolled in kindergarten through grade 12 or are homeschooled for equivalent grades. The unit of analysis is students; however, all reported measures are based on information provided by parents or other knowledgeable adults in the sampled student’s household.
The NHES:2012 included two surveys related to parent and family involvement in education: the PFI-Enrolled survey and the PFI-Homeschool survey. The PFI-Enrolled survey asks questions about various aspects of parent involvement in education of students enrolled in a public or private school, such as help with homework, family activities, and parent involvement at school. For homeschooled students, the PFI-Homeschool survey asks questions related to the students’ homeschooling experiences and the reasons for homeschooling. Both surveys collect demographic information.
Questionnaires were completed by the parents of 17,563 students, including 397 homeschooled students reported in the PFI-Homeschool questionnaire, and 303 homeschooled students reported in the PFI-Enrolled questionnaire. In this report, students are considered to be homeschooled if their parents reported them as being schooled at home instead of at a public or private school for at least part of their education and if their part-time enrollment in public or private school did not exceed 25 hours a week. Students who were schooled at home primarily because of a temporary illness are not included as homeschoolers, resulting in an analytic sample of 347 students from the PFI-Homeschool survey.
Depending on the section of the report, a different analytic sample was used. Part I uses data from the PFI-Enrolled survey and the PFI-Homeschool survey because understanding trends in homeschooling estimates over time requires that students reported as homeschooled on either NHES paper questionnaire be counted. Part II provides two sets of estimates: one set of demographic estimates that use responses from both survey instruments and one set of estimates that use responses from only the PFI-Homeschool survey; readers may look at demographic estimates that are comparable with Part I (adjusted estimates) and also demographic estimates that are comparable with Part III of the report (unadjusted estimates). Part III uses only responses to the PFI-Homeschool survey because of the unavailability of data about homeschooling experiences for students whose parents completed the PFI-Enrolled questionnaire.
Because homeschooled students comprise a relatively small proportion of the U.S. population and are not listed on any national-level administrative lists, NHES collects data from homeschooling families by starting with contacts to a random sample of addresses, most of which are not homeschooling households. The small
FINDINGS 3
number of homeschooling households identified through this process generates estimates with limited precision. Readers are cautioned to consider the range of possible true values for homeschooling estimates provided in this report, using the standard errors reported in appendix A. Furthermore, for the first time, NHES:2012 collected homeschooling data using paper and pencil instruments rather than telephone interviews, leading to measurement differences between 2012 and previous NHES administrations. Further detail about analytic decisions is provided in the description below about each section of the report.
Part I: National Totals Part I of this report uses an adjusted estimate for the total number and rate of students who were homeschooled in the United States in 2012. The adjusted estimate uses a statistical adjustment to include 303 students who were reported on the PFI-Enrolled survey as homeschooled in the analytic sample used for generating homeschooling estimates, as well as the 347 homeschooled students who were reported on the PFI-Homeschool survey. The adjusted estimate is NCES’s most accurate estimate of the true number and percentage of students who were homeschooled in 2012. A change in the NHES design between 2007 and 2012 (described in the technical notes) resulted in measurement error which NCES believes led to an undercount of the total number of homeschooled students. In all years of the NHES data collection where data on homeschoolers has been collected for kindergarten to grade 12 and for both part-time and full-time homeschoolers, the number and percentage of homeschoolers has increased between collections. Additionally, we conducted analysis to look at the change in the number of homeschooled students between 2007 and 2012 in eight states where information on the number of homeschooled students was available for that time period; there was an increase in 6 of these states and a decrease in 2 states. Therefore, the estimate of homeschooled students appears too low and requires adjustment. Though the statistical adjustment is limited by the absence of key information about the students reported as homeschooled on the PFI-Enrolled survey (e.g., number of hours these students attend school and reasons for homeschooling), the adjustment is useful for understanding trends in homeschooling estimates, given the design of the NHES:2012 survey relative to previous NHES administrations.
The adjustment treats PFI-Enrolled students reported to be homeschooled as part-time homeschoolers and not full-time homeschoolers. There are three reasons for this: First, the survey question asks if the child is homeschooled “for some classes or subjects.” Second, respondents were given two opportunities to report children as homeschooled before receiving the PFI-Enrolled questionnaire. The household screener asks an adult household respondent to report if the child is homeschooled for all or some classes and the PFI-Enrolled questionnaire asks the responding adult to call the helpline if the child is homeschooled instead of attending school. Third, NCES conducted qualitative research (see technical notes) which showed that some parents of enrolled children misunderstood the term “homeschooled” and reported enrolled children as homeschooled; for example, parents who use time at home to facilitate lessons with their child or undertake some other informal, out-of-school instruction.
Part II: Characteristics of Homeschooled Students Part II of this report presents both adjusted and unadjusted estimates for readers, but uses only unadjusted estimates in the analysis of demographic characteristics of homeschooled students. Unadjusted estimates utilize data only from the 347 students reported as homeschooled on the PFI-

FINDINGS 4
Homeschool survey in the analytic sample used for generating homeschooling estimates. NCES recommends that analysts use unadjusted estimates to analyze demographic characteristics of homeschoolers. We do not recommend that analysts use adjusted data from the PFI-Enrolled questionnaire to analyze demographic characteristics of homeschoolers, particularly when homeschooled students are the denominator, because some characteristics of respondents to the PFI-Enrolled questionnaire who marked that they were homeschooled are statistically significantly different from part-time homeschoolers on the PFI-Homeschool questionnaire (see table B-3 in the technical notes), which indicates the PFI-Enrolled estimates of demographic characteristics of homeschooled students may contain bias. Bias is problematic for subgroup analysis of homeschooled students because homeschoolers make up a very small proportion of the U.S. population; the NHES:2012 sample, and any potential bias, will be magnified when the subgroup sample sizes are small.
Part III: The Learning Context of Homeschooled Students Part III of this report uses unadjusted estimates. Data about the homeschooled students learning context were collected on the PFI-Homeschool survey only and are not available for homeschooled students who were reported on the PFI-Enrolled survey.
Additional details about the data, and specific measures used, are provided in the technical notes.

5
Findings Part I—National Totals
Part I presents trend data on the total number and percentage of homeschooled students in the United States since 1999 using adjusted estimates for 2012. The adjusted estimate uses a statistical adjustment to include 303 students who were reported on the PFI-Enrolled survey as homeschooled in the analytic sample used for generating homeschooling estimates, as well as the 347 homeschooled students who were reported on the PFI-Homeschool survey, and is NCES’s most accurate estimate of the true number and percentage of students who were homeschooled in 2012. Unadjusted estimates that do not include students reported on the PFI-Enrolled survey as homeschooled are also presented for readers’ reference, but are not used in the analysis. Adjusted and unadjusted estimates are explained further in the Data and Measures section and in the technical notes.
The homeschooling rate has increased over time.
The number of homeschooled students increased from 850,000 students in 1999 to 1,773,0001 students in 2012. There were significant increases in homeschooling between 1999 and 2003 and between 2003 and 2007. The increase between 2007 and 2012 was not statistically significant. Figure 1 shows the estimated number of homeschooled students ages 5 through 17 with a grade equivalent of kindergarten through grade 12 in 1999, 2003, 2007, and 2012. Year comparisons were made using the statistically adjusted 2012 number.
Although 1,773,000 students is the best estimate of the number of homeschoolers from the NHES:2012, a similar sample survey might produce a different estimate. The margin of error presented in this report defines a range of values around an estimate within which 95 percent of the estimates from all possible similar sample surveys are expected to fall. It is presented along with each estimate to show the range of possible values for the estimate. The margin of error for the number of students who were homeschooled in spring 2012 is +/– 230,000, which means that the range of the estimate is from 1,543,000 to 2,003,000 (figure 1).
Table 1 shows the homeschooling rate between 1999 and 2012. The homeschooling rate is an estimate of the percentage of school-aged students in the population who are being homeschooled. The increase in the homeschooling rate parallels the increase in the number of homeschooled students over the 13 year period, rising from 1.7 percent in 1999 to 3.4 percent in 2012. However, the homeschooling rate did not show a measurable change between 2007 and 2012. Year comparisons were made using the statistically adjusted 2012 rate, which is explained in the Data and Measures section of the report and in the technical notes.
1 The unadjusted total is approximately 1,082,000 students. For more information about the adjusted and unadjusted estimates, see the technical notes.

FINDINGS 6
Figure 1. Estimated number and 95 percent confidence interval for number of homeschooled students, ages 5 through 17 with a grade equivalent of kindergarten through grade 12: 1999, 2003, 2007, and 2012
1,252,000
1,082,000
912,000
NOTE: Excludes students who were enrolled in public or private school more than 25 hours per week and students who were homeschooled primarily because of temporary illness. The numbers in bold are the estimated number of homeschooled students in the United States. The numbers above and below the bold numbers are the upper and lower boundaries of the 95 percent confidence interval around the estimates. Prior to 2012, NHES data were collected by an interviewer over the telephone. The NHES:2012 utilized an Address Based Sampling frame and mail self-administered data collection instruments. Changes in estimates reported between 2012 and prior reporting years could be the result of changes in the population or in the data collection approach. Estimates from 2012 include a statistically adjusted estimate (1,773,000 students) and an unadjusted estimate (1,082,000 students). For more information about the adjusted estimate, see the technical notes. SOURCE: U.S. Department of Education, National Center for Education Statistics, Parent Survey of the National Household Education Surveys Program (NHES), 1999; Parent and Family Involvement in Education Survey of the NHES, 2003, 2007, and 2012.

FINDINGS 7
Table 1. Homeschooling rate for students, ages 5 through 17 with a grade equivalent of kindergarten through grade 12: 1999, 2003, 2007, and 2012
Year Characteristic 1999 2003 2007 2012 (statistically adjusted)
Homeschooling rate1 1.7 2.2 2.9 3.4
2012 (unadjusted) 2.1
1 The homeschooling rate is the number of students that are homeschooled divided by the total number of enrolled and homeschooled students. NOTE: Homeschooled students are school-age children who receive instruction at home instead of at a public or private school either all or most of the time. Excludes students who were enrolled in public or private school more than 25 hours per week and students who were homeschooled primarily because of temporary illness. Prior to 2012, NHES data were collected by an interviewer over the telephone. The NHES:2012 utilized an Address Based Sampling frame and mail self-administered data collection instruments. Changes in estimates reported between 2012 and prior reporting years could be the result of changes in the population or in the data collection approach. Detail may not sum to totals because of rounding. For more information about the adjusted rate, see technical notes. SOURCE: U.S. Department of Education, National Center for Education Statistics, Parent Survey of the National Household Education Surveys Program (NHES), 1999; Parent and Family Involvement in Education Survey of the NHES, 2003, 2007, and 2012.

8
Findings Part II—Characteristics of Homeschooled Students
Part II presents demographic characteristics of homeschooled students using unadjusted estimates for 2012. Unadjusted estimates of the percentage distribution are based on the 347 homeschooled students reported on the PFI-Homeschool survey. Unadjusted estimates of the homeschooling rate include the homeschooled students reported on the PFI-Homeschool survey in the analytic sample used for calculating the numerator of the percentage and all other students in the denominator. NCES recommends using the unadjusted estimates because the subgroup samples sizes for homeschooled students’ demographic characteristics are small, and may be distorted by any potential bias in the adjusted estimates. Adjusted estimates that include the PFI-Enrolled students as homeschooled are also presented for readers’ reference, but are not used in the analysis. Adjusted and unadjusted estimates are explained further in the Data and Measures section and in the technical notes.
Most homeschooled students were White and nonpoor and lived in cities, suburban, or rural areas.
Table 2 shows some characteristics of homeschooled students in 2012 and the homeschooling rate among all students with those characteristics. Comparisons are made using the unadjusted estimates because of potential bias in adjusted estimates based on small samples sizes, as described in the data and measures section and in the technical notes. However, both estimates are provided for interested readers.
Looking first at who were homeschooled students and where did they live, table 2 shows they tended to live in rural (41 percent) or suburban areas (28 percent), and cities (21 percent) compared to towns (10 percent). A larger percentage of homeschooled students were White2 (83 percent) compared to all other racial/ethnic groups and a larger percentage were middle school (grades 6–8) or high school (grades 9-12) level students compared to early elementary level (K–2). There was no significant difference by sex.
Homeschooled students had parents whose education level ranged from a high school degree (23 percent) to a graduate degree (18 percent) and the percentage distribution was not significantly different among the education-level categories, except that a higher percentage of homeschooled students had parents with vocational degrees or some college education than had a graduate degree. The percentage of homeschooled students whose parents had less than a high school education was low (2 percent).
NCES collects household income data using categories that provide approximate income levels for the household. These income categories, along with household size, were used to calculate a poverty threshold
2 For ease of presentation, White, non-Hispanic, Black, non-Hispanic, Asian and Pacific Islander, non-Hispanic, and Other, non-Hispanic students are referred to in the text as White, Black, Asian, and Other students, respectively.

FINDINGS 9
for homeschooled students. Students were considered poor if they were living in a household with an income below the poverty threshold. About 1 in 10 homeschooled students were considered poor.
Table 2 also shows the homeschooling rate as a percentage of all students (homeschooled and enrolled). Comparisons are made using the unadjusted estimates. These estimates reveal for whom and in what locales homeschooling is most prevalent. Students in rural areas were homeschooled at the highest rate (3.6 percent) compared to students in suburban areas (1.6 percent) and in cities (1.5 percent); the rate comparison to students who live in towns is not significantly different. The homeschool rate for White students (3.3 percent) was higher than the rate for Black students (0.7 percent), Hispanic students (0.6 percent), and Asian students (0.6 percent). Homeschooling rates also varied by grade equivalent; students at the middle and high school level (2.6 and 2.5 percent) had higher homeschooling rates than students at the K–2 level (1.4 percent). The homeschool rate was lowest among students whose parents had less than a high school education (0.4 percent) compared to students whose parents graduated high school or were educated beyond high school (2.2 to 2.5 percent). There was no significant difference in the homeschooling rate by sex.

FINDINGS 10
Table 2. Percentage distribution of homeschooled students ages 5 through 17 with a grade equivalent of kindergarten through grade 12 and homeschooling rate, by selected characteristics: 2012
Statistically Adjusted Unadjusted
Characteristic Percentage
distribution Homeschooling
rate Percentage
distribution Homeschooling
rate Locale of student’s household1
City 28 3.3 21 1.5 Suburban 34 3.1 28 1.6 Town 7 2.6 10 2.3 Rural 31 4.5 41 3.6 Student’s sex Male 49 3.3 46 1.9 Female 51 3.6 54 2.3 Student’s race/ethnicity White, non-Hispanic 68 4.5 83 3.3 Black, non-Hispanic 8 2.0 5 ! 0.7 ! Hispanic 15 2.3 7 0.6 Asian or Pacific Islander, non-Hispanic 4 2.6 2 ! 0.6 ! Other, non-Hispanic2 5 3.2 4 1.7 Student’s grade equivalent
Kindergarten–2nd grade 24 3.1 18 1.4 3rd–5th grade 23 3.3 22 1.9 6th–8th grade 24 3.5 29 2.6 9th–12th grade 29 3.8 32 2.5
Parents’ highest education level Less than high school 12 3.4 2 ! 0.4 ! High school graduate or equivalent 20 3.4 23 2.3 Vocational/technical or some college 30 3.4 32 2.2 Bachelor’s degree 24 3.7 26 2.4 Graduate or professional school 14 3.3 18 2.5 Poverty status3
Poor 20 3.5 11 1.2 Nonpoor 80 3.4 89 2.3
! Interpret data with caution; coefficient of variation is between 30 and 50 percent.1 Locale of student’s household classifies the residential ZIP code into a set of four major locale categories: city, suburban,town, rural.2 “Other, non-Hispanic” includes children who were multiracial and not of Hispanic ethnicity, or who were American Indianor Alaska Native, or who were not Hispanic, White, Black, Asian, or Pacific Islander. The different groups mentioned hereare not shown separately because the sample sizes do not support stable estimates.3 Students are considered poor if they were living in households with incomes below the poverty threshold. Income iscollected in categories in the survey, rather than as an exact amount, and therefore the poverty measures used in this reportare approximations of poverty.NOTE: Homeschooled students are school-age children who receive instruction at home instead of at a public or privateschool either all or most of the time. Excludes students who were enrolled in public or private school more than 25 hours perweek and students who were homeschooled primarily because of temporary illness. Detail may not sum to totals because ofrounding. For more information about the adjusted rate, see technical notes.SOURCE: U.S. Department of Education, National Center for Education Statistics, Parent and Family Involvement inEducation Survey of the National Household Education Surveys Program (NHES), 2012.

11
Findings Part III—The Learning Context of Homeschooled Students
Part III describes homeschooled students’ learning context, including: reasons for homeschooling, sources of curriculum, parent preparation for homeschooling, students’ online course-taking, and math and science subject areas taught to homeschooled students during home instruction. Part III uses unadjusted estimates based on data from the 347 homeschooled students who were reported on the PFI-Homeschool survey. Data about the homeschooled students learning context were collected on the PFI-Homeschool survey only and are not available for homeschooled students who were reported on the PFI-Enrolled survey. Adjusted and unadjusted estimates are explained further in the Data and Measures section and in the technical notes.
Nine in 10 homeschooled students’ parents reported that concern about schools’ environments was an important reason for their decision to homeschool.
The PFI-Homeschool survey asked parents about their reasons for homeschooling. A list of reasons was displayed on the survey and respondents were allowed to select one or more reasons from the list. In 2012, the most commonly selected reason was a concern with other schools’ environments, which includes factors such as “safety, drugs, or negative peer pressure” at schools (91 percent). Other commonly reported reasons included, “a desire to provide moral instruction,” “a dissatisfaction with academic instruction at other schools,” and “a desire to provide religious instruction” (77 percent, 74 percent, and 64 percent, respectively). Table 3 shows the list of reasons and the number and percentage of students whose parents indicated each one was important in their decision to homeschool.
A follow-up question asked respondents to select the reason they considered the most important out of the reasons they had indicated were important. The number and percentage distributions of the “most important” reasons are shown in table 3. Concern about other schools’ environments, desire to provide religious instruction, and dissatisfaction with academic standards were cited most frequently as most important.

FINDINGS 12
Table 3. Percentage of school-age children who were homeschooled, ages 5 through 17 with a grade equivalent of kindergarten through grade 12, by reasons parents gave as important and most important for homeschooling: 2012
Reason Important1
PercentMost Important
PercentA desire to provide religious instruction 64 17 A desire to provide moral instruction 77 5 A concern about the environment of other schools, such as
safety, drugs, or negative peer pressure 91 25 A dissatisfaction with the academic instruction at other
schools 74 19 A desire to provide a nontraditional approach to child’s
education 44 5 ! Child has other special needs 16 ‡ Child has a physical or mental health problem 15 5 Other reasons2 37 21
‡ Reporting standards not met. The coefficient of variation for this estimate is 50 percent or greater. ! Interpret data with caution; coefficient of variation is between 30 and 50 percent. 1 Respondents were instructed to mark all that apply for the “Important” item but could only choose one as “Most important.” 2 Parents homeschool their children for many reasons that are often unique to their family situation. “Other reasons” parents gave for homeschooling include family time, finances, travel, and distance. NOTE: Homeschooled students are school-age children who receive instruction at home instead of at a public or private school either all or most of the time. Excludes students who were enrolled in public or private school more than 25 hours per week and students who were homeschooled primarily because of temporary illness. SOURCE: U.S. Department of Education, National Center for Education Statistics, Parent and Family Involvement in Education Survey of the National Household Education Surveys Program (NHES), 2012.

FINDINGS 13
Websites, homeschooling catalogs, public libraries, and bookstores were the more frequently cited sources of curriculum for homeschooled students in 2012. Curricula from public and private schools were among the least cited.
Parents used a variety of curriculum sources to aid them in teaching their children at home. Curricula from public and private schools were not commonly cited. The more common sources were non-retail websites (77 percent); homeschooling catalogs, publishers, or individual specialists (77 percent); a public library (70 percent); retail bookstores or other stores (69 percent); and education publishers (53 percent). Figure 2 shows the percentage of homeschooled students whose parents reported using various resources for books and curriculum in 2012.
Figure 2. Percentage of homeschooled students, ages 5 through 17 with a grade equivalent of kindergarten through grade 12, by parent-reported sources of curriculum and books: 2012
7077
69
5345
38
1017 13
77
0102030405060708090
100
Public library Homeschoolingcatalog,
publisher, orindividualspecialist
Retailbookstore orother store
Educationpublisher notaffiliated with
homeschooling
Homeschoolingorganization
Church,synagogue, orother religiousorganization
Other sources Local or publicschool district
Private school Websites,excludingretailers
Percent
Sources of curriculum and books1
1 Respondents were instructed to mark yes or no for each item. “Other sources” of curriculum and books included other homeschooling parents, a tutor, art school, textbooks, state and federal site, and “too many to list.” NOTE: Homeschooled students are school-age children who receive instruction at home instead of at a public or private school either all or most of the time. Excludes students who were enrolled in public or private school more than 25 hours per week and students who were homeschooled primarily because of temporary illness. SOURCE: U.S. Department of Education, National Center for Education Statistics, Parent and Family Involvement in Education Survey of the National Household Education Surveys Program (NHES), 2012.

FINDINGS 14
About a quarter of homeschooled students had parents who took a course to prepare for their child’s home instruction.
Figure 3 displays the percentage of homeschooled students whose parents reported taking any courses, either online or in person, to prepare for their child’s home instruction. Parents of one-quarter of homeschooled students took such a course; 11 percent were in person only course(s), 10 percent were online only course(s), and 4 percent were both online and in person course(s).
Figure 3. Percentage of homeschooled students, ages 5 through 17 with a grade equivalent of kindergarten through grade 12, whose parents reported attending a course to prepare for the child’s home instruction, by method of attending the course: 2012
11
104
75
0
10
20
30
40
50
60
70
80
90
100
Took a course
Percent
Did not take a course
Online and in person
Online only
In person only
Method of attending course
NOTE: Homeschooled students are school-age children who receive instruction at home instead of at a public or private school either all or most of the time. Excludes students who were enrolled in public or private school more than 25 hours per week and students who were homeschooled primarily because of temporary illness. SOURCE: U.S. Department of Education, National Center for Education Statistics, Parent and Family Involvement in Education Survey of the National Household Education Surveys Program (NHES), 2012.
FINDINGS 15
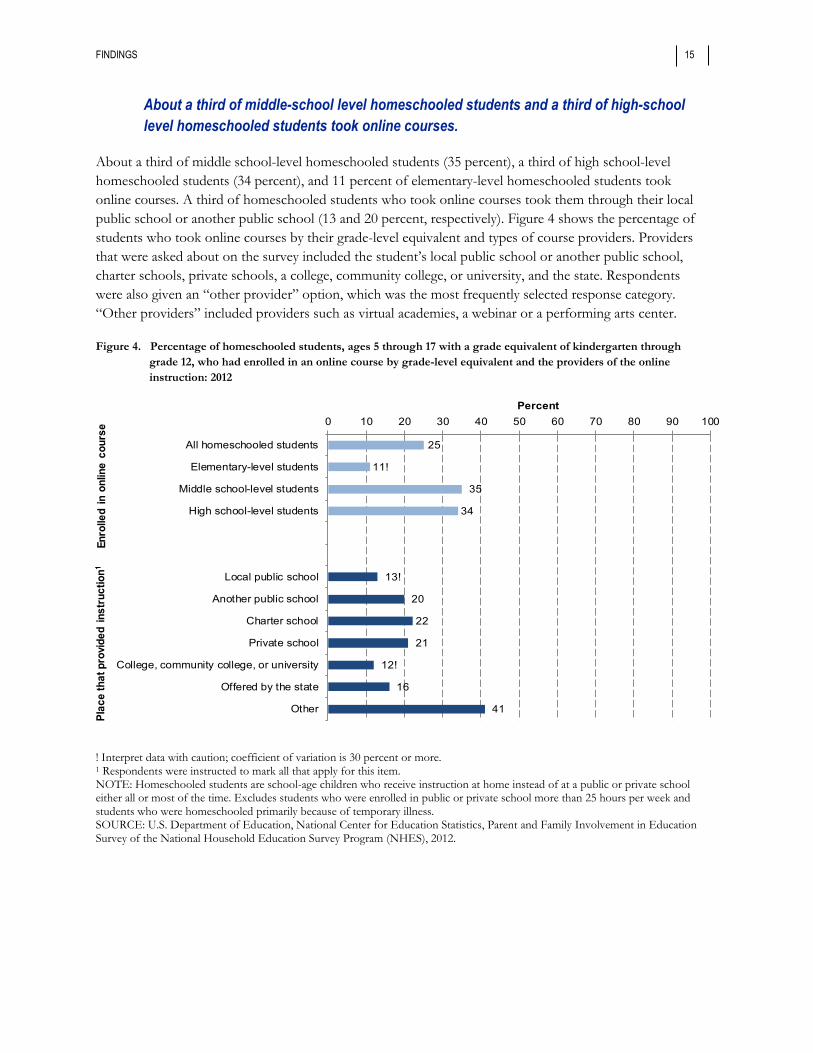
About a third of middle-school level homeschooled students and a third of high-school level homeschooled students took online courses.
About a third of middle school-level homeschooled students (35 percent), a third of high school-level homeschooled students (34 percent), and 11 percent of elementary-level homeschooled students took online courses. A third of homeschooled students who took online courses took them through their local public school or another public school (13 and 20 percent, respectively). Figure 4 shows the percentage of students who took online courses by their grade-level equivalent and types of course providers. Providers that were asked about on the survey included the student’s local public school or another public school, charter schools, private schools, a college, community college, or university, and the state. Respondents were also given an “other provider” option, which was the most frequently selected response category. “Other providers” included providers such as virtual academies, a webinar or a performing arts center.
Figure 4. Percentage of homeschooled students, ages 5 through 17 with a grade equivalent of kindergarten through grade 12, who had enrolled in an online course by grade-level equivalent and the providers of the online instruction: 2012
25
11!
35
34
13!
20
22
21
12!
16
41
0 10 20 30 40 50 60 70 80 90 100
All homeschooled students
Elementary-level students
Middle school-level students
High school-level students
Local public school
Another public school
Charter school
Private school
College, community college, or university
Offered by the state
Other
Percent
Enro
lled
in o
nlin
e co
urse
Plac
e th
at p
rovi
ded
inst
ruct
ion1
! Interpret data with caution; coefficient of variation is 30 percent or more.1 Respondents were instructed to mark all that apply for this item.NOTE: Homeschooled students are school-age children who receive instruction at home instead of at a public or private schooleither all or most of the time. Excludes students who were enrolled in public or private school more than 25 hours per week andstudents who were homeschooled primarily because of temporary illness.SOURCE: U.S. Department of Education, National Center for Education Statistics, Parent and Family Involvement in EducationSurvey of the National Household Education Survey Program (NHES), 2012.

FINDINGS 16
Most high-school level homeschooled students had home instruction that included basic algebra, earth sciences or geology and biology.
Most high-school level homeschooled students had home instruction that included basic algebra (88 percent), about half had home instruction in geometry (54 percent), and about a third had home instruction in advanced algebra. Other advanced math subjects, calculus and probability, were not often reported to have been included in home instruction; this suggests that most homeschooled students had either not yet been taught these subjects or these subjects were not taught at home. For example, it is possible that younger students, later-on, may be taught these at home or homeschooled students may enroll in a public or private school to take classes in advanced math or science subjects. Figure 5 shows the math-related estimates. Figure 6 shows the science-related estimates.
Among science subjects, about 7 in 10 high-school level homeschooled students had earth sciences or geology and biology included in their home instruction (69 percent each); about half had home instruction in scientific inquiry (47 percent), and about a third had home instruction in chemistry or physics (34 percent) and computer science (32 percent).3
3 Math and science subjects were the only subjects analyzed because these are core subjects for high school-age students and key predictors of later academic achievement.

FINDINGS 17
Figure 5. Percentage of homeschooled students with a grade level equivalent of 9-12 who had been taught specific math subjects during home instruction: 2012
88
35
54
10 !14
0
10
20
30
40
50
60
70
80
90
100
Basic algebra Advanced algebra Geometry Calculus Probability
Percent
Math subjects
! Interpret data with caution; coefficient of variation is between 30 and 50 percent. NOTE: Homeschooled students are school-age children who receive instruction at home instead of at a public or private school either all or most of the time. Excludes students who were enrolled in public or private school more than 25 hours per week and students who were homeschooled primarily because of temporary illness. SOURCE: U.S. Department of Education, National Center for Education Statistics, Parent and Family Involvement in Education Survey of the National Household Education Surveys Program (NHES), 2012.

FINDINGS 18
Figure 6. Percentage of homeschooled students with a grade level equivalent of 9-12 who had been taught specific science subjects during home instruction: 2012
47
69 69
34 32
0
10
20
30
40
50
60
70
80
90
100
Scientific inquiry orexperiments
Earth sciences orgeology
Biology Chemistry orphysics
Computer science
Percent
Science subjects
NOTE: Homeschooled students are school-age children who receive instruction at home instead of at a public or private school either all or most of the time. Excludes students who were enrolled in public or private school more than 25 hours per week and students who were homeschooled primarily because of temporary illness. SOURCE: U.S. Department of Education, National Center for Education Statistics, Parent and Family Involvement in Education Survey of the National Household Education Surveys Program (NHES), 2012.

A-1
Appendix A—Standard Error Tables
Table A-1. Standard errors for Figure 1. Estimated number and 95 percent confidence interval for number of homeschooled students, ages 5 through 17 with a grade equivalent of kindergarten through grade 12: 1999, 2003, 2007, and 2012
Year Characteristic 1999 2003 2007 2012 (statistically adjusted)
Homeschooling students 71.1 92.3 118.0 115.7
2012 (unadjusted) 85.3
SOURCE: U.S. Department of Education, National Center for Education Statistics, Parent Survey of the National Household Education Surveys Program (NHES), 1999; Parent and Family Involvement in Education Survey of the NHES, 2003, 2007, and 2012.
Table A-2. Standard errors for Table 1. Homeschooling rate for students, ages 5 through 17 with a grade equivalent of kindergarten through grade 12: 1999, 2003, 2007, and 2012
Year Characteristic 1999 2003 2007 2012 (statistically adjusted)
Homeschooling rate 0.14 0.18 0.23 0.23
2012 (unadjusted) 0.17
SOURCE: U.S. Department of Education, National Center for Education Statistics, Parent Survey of the National Household Education Surveys Program (NHES), 1999; Parent and Family Involvement in Education Survey of the NHES, 2003, 2007, and 2012.

APPENDIX A—STANDARD ERROR TABLES A-2
Table A-3. Standard errors for table 2: Percentage distribution of homeschooled students ages 5 through 17 with a grade equivalent of kindergarten through grade 12 and homeschooling rate, by selected characteristics: 2012
Statistically Adjusted Unadjusted
Characteristic Percentage
distribution Homeschooling
rate Percentage
distribution Homeschooling
rate Locale of student’s household
City 2.9 0.40 2.7 0.18 Suburban 3.0 0.34 3.8 0.22 Town 1.7 0.63 2.7 0.63 Rural 3.3 0.55 4.4 0.52 Student’s sex Male 2.9 0.28 3.4 0.18 Female 2.9 0.32 3.4 0.25 Student’s race/ethnicity White, non-Hispanic 3.0 0.35 2.6 0.30 Black, non-Hispanic 2.0 0.52 1.4 0.22 Hispanic 2.2 0.35 1.7 0.15 Asian or Pacific Islander, non-Hispanic 1.2 0.77 0.9 0.35 Other, non-Hispanic 1.0 0.61 1.2 0.47 Student’s grade equivalent
Kindergarten–2nd grade 2.9 0.47 3.4 0.31 3rd–5th grade 2.7 0.45 3.3 0.34 6th–8th grade 2.7 0.41 3.8 0.37 9th–12th grade 2.5 0.39 3.6 0.31
Parents’ highest education level Less than high school 2.6 0.85 0.8 0.15 High school graduate or equivalent 2.7 0.57 4.0 0.51 Vocational/technical or some college 2.3 0.29 3.0 0.25 Bachelor’s degree 2.6 0.43 3.6 0.36 Graduate or professional school 1.6 0.36 2.4 0.35 Poverty status
Poor 2.6 0.54 2.0 0.22 Nonpoor 2.6 0.24 2.0 0.20
SOURCE: U.S. Department of Education, National Center for Education Statistics, Parent and Family Involvement in Education Survey of the National Household Education Surveys Program (NHES), 2012.

APPENDIX A—STANDARD ERROR TABLES A-3
Table A-4. Standard errors for table 3: Percentage of school-age children who were homeschooled, ages 5 through 17 with a grade equivalent of kindergarten through grade 12, by reasons parents gave as important and most important for homeschooling: 2012
Reason Important
Percent Most Important
Percent A desire to provide religious instruction 3.9 3.2 A desire to provide moral instruction 3.2 1.2 A concern about the environment of other schools, such as safety, drugs, or negative peer pressure 2.3 3.1 A dissatisfaction with the academic instruction at other schools 3.3 3.4 A desire to provide a nontraditional approach to child’s education 3.5 1.6 Child has other special needs 2.8 † Child has a physical or mental health problem 2.5 1.3 Other reasons 3.6 3.4 † Not applicable. SOURCE: U.S. Department of Education, National Center for Education Statistics, Parent and Family Involvement in Education Survey of the National Household Education Surveys Program (NHES), 2012.
Table A-5. Standard errors for figure 2: Percentage of homeschooled students, ages 5 through 17 with a grade equivalent of kindergarten through grade 12, by parent-reported sources of curriculum and books: 2012
Sources of curriculum and books
Public library 3.8 Homeschooling catalog, publisher, or individual specialist 2.8 Retail bookstore or other store 3.7 Education publisher not affiliated with homeschooling 3.5 Homeschooling organization 4.0 Church, synagogue, or other religious organization 3.7 Other sources 2.6 Local or public school district 2.8 Private school 2.8 Websites, excluding retailers 2.7
SOURCE: U.S. Department of Education, National Center for Education Statistics, Parent and Family Involvement in Education Survey of the National Household Education Surveys Program (NHES), 2012.

APPENDIX A—STANDARD ERROR TABLES A-4
Table A-6. Standard errors for figure 3: Percentage of homeschooled students, ages 5 through 17 with a grade equivalent of kindergarten through grade 12, whose parents reported attending a course to prepare for the child’s home instruction, by the method of attending the course: 2012
Course
Did not take a course 3.7 Took a course 3.7
In-person only course 3.1 Online only course 2.6 Online and in-person course 1.2
SOURCE: U.S. Department of Education, National Center for Education Statistics, Parent and Family Involvement in Education Survey of the National Household Education Surveys Program (NHES), 2012.
Table A-7. Standard errors for figure 4: Percentage of homeschooled students, ages 5 through 17 with a grade equivalent of kindergarten through grade 12 who had enrolled in an online course by grade-level equivalent and the providers of the online instruction: 2012
Online coursetaking All homeschooled students 2.8 Elementary-level students 3.6 Middle school-level students 6.6 High school-level students 5.6
Provider of the instruction Local public school 3.9 Another public school 5.8 Charter school 6.2 Private school 5.1 College, community college, or university 3.9 Offered by the state 4.4 Other 6.4
SOURCE: U.S. Department of Education, National Center for Education Statistics, Parent and Family Involvement in Education Survey of the National Household Education Surveys Program (NHES), 2012.

APPENDIX A—STANDARD ERROR TABLES A-5
Table A-8. Standard errors for figure 5: Percentage of homeschooled students with a grade level equivalent of 9–12 who had been taught specific math subjects during home instruction: 2012
Subject
Math subjects Basic algebra 3.2 Advanced algebra 5.6 Geometry 7.3 Calculus 3.4 Probability 3.2
SOURCE: U.S. Department of Education, National Center for Education Statistics, Parent and Family Involvement in Education Survey of the National Household Education Surveys Program (NHES), 2012.
Table A-9. Standard errors for figure 6: Percentage of homeschooled students with a grade level equivalent of 9–12 who had been taught specific science subjects during home instruction: 2012
Subject
Science subjects Scientific inquiry or experiments 7.1 Earth sciences or geology 6.2 Biology 4.9 Chemistry or physics 5.5 Computer science 5.5
SOURCE: U.S. Department of Education, National Center for Education Statistics, Parent and Family Involvement in Education Survey of the National Household Education Surveys Program (NHES), 2012.
Table A-10. Standard errors for table B-1: Estimated percentage of students (homeschool rate), ages 5 through 17 with a grade equivalent of kindergarten through grade 12 who were homeschooled with and without 2012 adjustments: 2007 and 2012
2007 2012 unadjusted 2012 statistically adjusted 0.219 0.166 0.227
SOURCE: U.S. Department of Education, National Center for Education Statistics, Parent and Family Involvement in Education Survey of the NHES, 2007 and 2012.
Table A-11. Standard errors for table B-2: Percentage of homeschooled students, ages 5 through 17 with a grade equivalent of kindergarten through grade 12, by school enrollment status: 1999, 2003, 2007, and 2012
Year
School enrollment status 1999 2003 2007 2012
adjusted 2012
unadjusted Total † † † † † Homeschooled only 2.94 3.56 2.47 1.84 2.82 Enrolled in school part time 2.94 3.56 2.47 1.84 2.82 Enrolled in school for less than 9 hours a week 2.81 3.25 2.36 1.51 2.39 Enrolled in school for 9 to 25 hours a week 1.50 1.85 1.44 0.95 1.50 † Not applicable. SOURCE: U.S. Department of Education, National Center for Education Statistics, Parent Survey of the National Household Education Surveys Program (NHES), 1999; Parent and Family Involvement in Education Survey of the NHES, 2003, 2007, and 2012.

APPENDIX A—STANDARD ERROR TABLES A-6
Table A-12. Standard errors for table B-3: Percentage distribution of homeschooled students on the PFI-Enrolled and PFI-Homeschool questionnaires, by selected characteristics: 2012
All homeschooled
students
Full-time homeschooled
students on the PFI–
Homeschool
Part-time homeschooled
students on the PFI–Homeschool
Homeschooled students on the
PFI–Enrolled Characteristic Percent Percent Percent Percent Total † † † †
Locale of student’s household City 2.9 3.0 5.3 4.7 Suburban 3.0 3.8 8.2 4.3 Town 1.7 3.1 5.3 0.7 Rural 3.3 4.6 7.1 3.0
Student’s sex Male 2.9 4.1 7.3 4.4 Female 2.9 4.1 7.3 4.4
Student’s race/ethnicity White, non-Hispanic 3.0 2.4 7.7 5.1 Black, non-Hispanic 2.0 1.3 4.8 4.5 Hispanic 2.2 1.5 6.5 4.4 Asian or Pacific Islander, non-
Hispanic 1.2 1.1 # 2.9 Other, non-Hispanic 1.0 1.1 4.4 1.7
Student’s grade equivalent K–2nd grade 2.9 4.3 3.9 5.5 3rd–5th grade 2.7 3.9 5.4 4.4 6th–8th grade 2.7 4.3 8.2 2.5 9th–12th grade 2.5 3.9 9.0 3.4
Parents’ highest education level
Less than high school 2.6 0.9 2.8 5.4 High school graduate or
equivalent 2.7 5.0 6.9 3.7 Vocational/technical or some
college 2.3 3.5 7.1 3.9 Bachelor’s degree 2.6 3.9 8.3 4.0 Graduate or professional
school 1.6 3.1 5.5 1.5 See notes at end of table.

APPENDIX A—STANDARD ERROR TABLES A-7
Table A-12. Standard errors for table B-3: Percentage distribution of homeschooled students on the PFI-Enrolled and PFI-Homeschool questionnaires, by selected characteristics: 2012–Continued
All homeschooled
students
Full-time homeschooled
students on the PFI–Homeschool
Part-time homeschooled
students on the PFI–Homeschool
Homeschooled students on the
PFI–Enrolled Characteristic Percent Percent Percent Percent Poverty status Poor 2.6 2.1 5.5 5.1 Nonpoor 2.6 2.1 5.5 5.1
Parent participation in the workforce Two parents/guardians-
both in the labor force 3.0 4.0 7.9 4.7 Two parents/guardians-one
in the labor force 3.3 4.6 8.2 3.1 One parent/guardian-in the
labor force 2.4 1.9 4.2 5.3 No parent/guardian
participation in the labor force 1.7 2.9 2.0 2.7
Number of parents in the household
Two parents (biological, adoptive, step, or foster) 3.2 3.8 4.9 5.4
One parent (biological, adoptive, step, or foster) 2.7 3.6 4.0 5.1
Nonparental guardians 1.8 1.4 2.3 4.3
Number of children in the household under 18
One child 1.9 2.8 7.0 3.4 Two children 2.4 3.1 6.4 4.2 Three or more children 2.7 3.6 8.1 5.4
† Not applicable. # Rounds to zero SOURCE: U.S. Department of Education, National Center for Education Statistics, Parent and Family Involvement in Education Survey of the National Household Education Surveys Program (NHES), 2012.

B-1
Appendix B—Technical Notes
The National Household Education Surveys Program (NHES) is a set of surveys sponsored by the U.S. Department of Education’s National Center for Education Statistics (NCES). This Statistical Analysis Report presents homeschooling data released from the Parent and Family Involvement in Education (PFI) Survey of the 2012 NHES. Earlier administrations of the NHES—in 1999, 2003, and 2007—also provide homeschooling data.
This section provides a brief description of the study methodology for NHES:2012. For more extensive information on the study methodology and data collection procedures, readers are advised to consult the NHES:2012 Data File User’s Manual.1
The NHES:2012 included three topical surveys: the PFI-Enrolled survey (PFI−Enrolled), the PFI-Homeschool survey (PFI−Homeschool), and the Early Childhood Program Participation (ECPP) survey. To limit respondent burden, within-household sampling was used to control the number of persons sampled for topical questionnaires in each household. Eligible children were selected for the ECPP, the PFI−Enrolled, or the PFI−Homeschool survey; no household received more than one survey. The PFI sample is nationally representative of all noninstitutionalized students in the 50 states and the District of Columbia from kindergarten through grade 12 who were enrolled in school or children ages 5 through 18 who were homeschooled for these grades.2
The NHES:2012 is a residential, address-based sample covering the 50 states and the District of Columbia and was conducted by the United States Census Bureau from January through August 2012. Previously, NHES administrations used various forms of list-assisted random digit dial (RDD) sampling of landline telephones. However, owing to declining response rates for all telephone surveys and the increase in households that only or mostly use a cell phone instead of a landline phone, the data collection method was changed to a mail survey. Due to this mode change, readers should use caution when comparing estimates to prior NHES administrations.
The NHES:2012 used a two-stage probability sample that was selected using an address-based sampling frame. The initial sample of addresses was drawn from a file of residential addresses maintained by a vendor, Marketing Systems Group (MSG), based on the United States Postal Service (USPS) Computerized Delivery Sequence File (CDSF). An initial sample of 208,000 addresses was chosen, of which 159,994 were designated for the 2012 NHES collection. The first sampling stage included selection of residential addresses, and
1 McPhee, C., Bielick, S., Masterton, M., Flores, L., Parmer, R., Amchin, S., Stern, S., and McGowan, H. (2015). National Household Education Surveys Program of 2012: Data File User’s Manual (NCES 2015-030). National Center for Education Statistics, Institute of Education Sciences, U.S. Department of Education. Washington, DC. 2 Homeschool calculations for 2012 estimates follow approaches used in earlier homeschool reports by including children ages 5 through 17 in a grade equivalent to at least kindergarten and not higher than grade 12, and excluding students who were enrolled in public or private school more than 25 hours per week and students who were homeschooled primarily because of temporary illness. Following the procedure used in past NHES administrations, four-year-olds reported as homeschooled were sampled for the ECPP survey.

APPENDIX B—TECHNICAL NOTES B-2
mailing of a household roster (a screener) to obtain basic information about household members needed for child sampling. To increase the number of Black and Hispanic children in the sample, Black and Hispanic households were sampled at a higher rate than other households by identifying Census tracts with higher percentages of these residents. The first-stage sample allocation was defined by the following strata:
1. 20 percent of the sample to Census tracts with 25 percent or more Black persons 2. 15 percent of the sample to Census tracts with 40 percent or more persons of Hispanic origin 3. 65 percent of the sample to all other Census tracts
The sample was selected from the three strata sequentially, using systematic sampling. The first-stage sample allocation also sampled addresses that were PO Boxes that were not flagged as the “only way to get mail” (OWGM) at a lower rate than all other address types. One in every 3 addresses flagged as OWGM PO Boxes was selected, compared to one in every 1.22 addresses for all other address types.
The second sampling stage selected an eligible child for either the ECPP survey or the PFI survey from information provided on the household screener. Differential within-household sampling rates were used to ensure a sufficient sample size for the ECPP survey, wherein approximately 70 percent of households with both an ECPP-eligible and PFI-eligible child were sent an ECPP survey at the second stage. If only ECPP-eligible children were reported in the household, the household received an ECPP survey, just as PFI surveys were sent to households with only PFI-eligible children. When multiple eligible children for the assigned topical were reported on the screener, a random number was used to sample from among the eligible children. After the sample of eligible children was selected, the data were collected using printed questionnaires. The questionnaire was mailed to each sampled respondent, who was a parent or guardian in the household with knowledge of the sampled child.
The respondent was asked questions about school choice, homeschooling, school characteristics, student experiences, teacher feedback on school performance and behavior, family involvement in the school, school practices to involve and support families, satisfaction with different aspects of the school, family involvement in schoolwork, and family involvement in activities with students. The respondent was also asked basic demographic questions about the child, as well as questions about the child’s health and disability status, parent/guardian characteristics, and household characteristics. The PFI survey for parents of children enrolled in public or private schools was comprised of a total of 113 questions, though respondents were prompted to skip nonapplicable questions. The PFI survey for parents of homeschooled children was comprised of 91 questions. Both questionnaires may be downloaded from http://nces.ed.gov/nhes/questionnaires.asp. Multiple follow-up attempts were made to obtain responses from parents who did not respond to the first questionnaire mailed to them. The survey questionnaires were available in both English and Spanish. The total number of completed PFI questionnaires in 2012 was 17,563, representing a population of 53.5 million students in kindergarten through grade 12 when weighted to reflect national totals.
Defining and Estimating the Number of Homeschooled Students Homeschooled students are ages 5 through 17, with a grade equivalent of at least kindergarten and not higher than grade 12, and who receive instruction at home instead of at a public or private school either all or most of the time. Students who met these criteria were sampled for the PFI-Homeschool collection and their household was sent the PFI-Homeschool questionnaire. Further, for this report, the definition of homeschooling excludes students who were enrolled in public or private school more than 25 hours per week

APPENDIX B—TECHNICAL NOTES B-3
and students who were homeschooled only because of temporary illness leaving an analytic sample of 347 cases. Because of error or errors in the 2012 screener, estimates of the number of homeschooled students based on the PFI-Homeschool survey alone may be too low. A change in the NHES design between 2007 and 2012 resulted in measurement error leading to an undercount of the total number of homeschooled students based on the PFI-Homeschool questionnaire alone. The adjusted estimates in this report reflect PFI-Enrolled respondents who indicated that the sampled child was homeschooled for some classes or subjects (303 children), plus a statistical adjustment to the sample weights for those children that accounts for the error and makes the 2012 totals more comparable to previous years.
We believe that errors in the 2012 design resulted in some homeschooled students’ parents indicating on the NHES:2012 screener that the homeschooled child was in public or private school rather than homeschooled. First, because of the complexity involved in verifying the homeschooling status of children in the household, there were fewer questions confirming homeschooling status on the mail screener instruments than there had been in telephone screener instruments from past NHES administrations. Second, the self-administered mail survey did not benefit from having an interviewer to help mediate respondent questions. Thus, the screening operation for eligibility for the PFI-Homeschool questionnaire in 2012 was less effective than it had been in previous administrations. Third, it is possible that students who were listed as enrolled in school on the screener were being homeschooled for some classes or subjects by the time the topical survey was mailed. Fourth, there is some evidence from cognitive research on the Spanish translation of the NHES surveys that the term “homeschooling,” in various translations tested, is not well understood by Spanish-speaking parents, which could contribute to measurement error.3 Finally, it is also possible that the screener respondent and the topical respondent were different people and may have reported differently for the children in the household.
Because of this probable undercount of homeschooled students based on the PFI-Homeschool survey alone, the total number of homeschoolers for 2012 (figure 1) includes an adjusted proportion of students whose parents completed the PFI-Enrolled questionnaire and marked on that questionnaire that the student was schooled at home instead of at school for some classes or subjects.4 These students are also considered homeschoolers in the calculation of the 2012 homeschool rate in tables 1 and 2. The homeschool rate for each year was calculated using the number of homeschooled students divided by the total number of enrolled and homeschooled students. A special weight adjustment was created to account for homeschoolers reported on the PFI-Enrolled questionnaire.5
To verify homeschooling status on the PFI-Enrolled questionnaire, parents were asked whether the sampled student was homeschooled for some classes. However, the survey did not include follow-up questions about how many hours the child was in school or whether the child had a temporary illness, which would have allowed us to determine which of these students meets our definition of a homeschooler for this report.6 To account for this omission, the analytic weight for homeschooled students reported on the PFI-Enrolled questionnaire was adjusted by the proportion of students reported on the PFI-Homeschool questionnaire to be attending “public or private school for some classes or subjects” for 25 hours or less and who were
3 Sandoval Girón, A. B. (2014, May). School concepts for Spanish speaker respondents: improving concept validity in surveys through cognitive interviews. Presented at the American Association of Public Opinion Research (AAPOR) Annual Conference, Anaheim, CA. 4 Estimates of total homeschoolers in figure 1 are rounded to the nearest thousand. Data users interested in replicating the unrounded number of total homeschoolers in 2012 should match the number 1,772,987. 5 The SAS programming code to create the weight adjustment is shown in Appendix B. 6 All homeschoolers on the PFI-Enrolled were considered to be part-time homeschoolers.

APPENDIX B—TECHNICAL NOTES B-4
homeschooled for reasons other than because of a temporary illness. This resulted in a weighting adjustment of .78.
The adjustment treats PFI-Enrolled students reported to be homeschooled as part-time homeschoolers and not full-time homeschoolers for three reasons: First, the survey question asks if the child is homeschooled “for some classes or subjects” (emphasis added). Second, respondents were given two opportunities to report children as homeschooled before receiving the PFI-Enrolled Survey. The household screener asks an adult household respondent to report if the child is homeschooled for all or some classes and the PFI-Enrolled Survey asks the responding adult to call the helpline if the child is homeschooled instead of attending school. Third, NCES conducted qualitative research (see Sandoval Girón, as referenced in footnote 3) which showed that some parents of enrolled children misunderstood the term “homeschooled” and reported enrolled children as homeschooled; for example, parents who use time at home to facilitate lessons with their child or undertake some other informal, out-of-school instruction.
Unadjusted data collected from the NHES 2012 PFI-Homeschool survey indicate that about 2.09 percent of school-aged children were homeschooled in 2012 (table B-1). When compared to 2007, the 2012 homeschooling rate represents a statistically significant decrease in the homeschooling rate, from 2.91 percent to 2.09 percent. The statistical adjustment leads to an estimate of 3.45 percent, which is not statistically significantly different from the 2007 rate.
Table B-1. Estimated percentage of students (homeschool rate), ages 5 through 17 with a grade equivalent of kindergarten through grade 12 who were homeschooled with and without 2012 adjustments: 2007 and 2012
2007 2012 unadjusted 2012 statistically adjusted 2.91 2.09 3.45
NOTE: Homeschooled students are school-age children who receive instruction at home instead of at a public or private school either all or most of the time. Excludes students who were enrolled in public or private school more than 25 hours per week and students who were homeschooled primarily because of temporary illness. SOURCE: U.S. Department of Education, National Center for Education Statistics, Parent and Family Involvement in Education Survey of the NHES, 2007 and 2012.
Determining the Characteristics of Homeschooled Students Possible differences between homeschooled students whose parents completed the enrolled questionnaire and students whose parents completed the homeschool questionnaire were investigated. Comparisons were made between part-time homeschoolers on the PFI-Enrolled and PFI-Homeschool because it was thought that the part-time PFI-Enrolled homeschoolers would be more similar to the part-time PFI-Homeschool students than the full-time homeschool students. Table B-2 shows the percentage of homeschoolers who were homeschooled full-time versus part-time in 1999 and 2012 using both adjusted and unadjusted estimates. The percentage of students who were only homeschooled increased from 82 percent in 1999 to 89 percent (adjusted) or had no increase (82 percent unadjusted). The percentage who were homeschooled part-time decreased in tandem from 18 percent in 1999 to 11 percent in 2012 (adjusted) or had no decrease (18 percent unadjusted). The rate trend showed no measurable change until the 2007 to 2012 period, using adjusted 2012 estimates only. This finding further suggests that the statistical adjustment used for 2012 homeschooling estimates should not be applied to estimating characteristics of homeschoolers.

APPENDIX B—TECHNICAL NOTES B-5
Table B-2. Percentage of homeschooled students, ages 5 through 17 with a grade equivalent of kindergarten through grade 12, by school enrollment status: 1999, 2003, 2007, and 2012
Year
School enrollment status 1999 2003 2007 2012
adjusted 2012
unadjusted Total 100 100 100 100 100 Homeschooled only 82 82 84 89 82 Enrolled in school part-time 18 18 16 11 18 Enrolled in school for less than 9 hours a week 13 12 11 8 12 Enrolled in school for 9 to 25 hours a week 5 6 5 3 6
NOTE: Homeschooled students are school-age children who receive instruction at home instead of at a public or private school either all or most of the time. Excludes students who were enrolled in public or private school more than 25 hours per week and students who were homeschooled primarily because of temporary illness. Detail may not sum to totals because of rounding. Prior to 2012 NHES data were collected by an interviewer over the telephone. The NHES:2012 utilized an Address Based Sampling frame and mail self-administered data collection instruments. Changes in estimates reported could be the result of changes in the population or in the data collection approach. SOURCE: U.S. Department of Education, National Center for Education Statistics, Parent Survey of the National Household Education Surveys Program (NHES), 1999; Parent and Family Involvement in Education Survey of the NHES, 2003, 2007, 2012.
The results from analyses comparing homeschoolers reported in the PFI-Enrolled questionnaire to the part-time homeschoolers reported in the PFI-Homeschool questionnaire revealed some additional differences. In table B-3, a higher percentage of students reported as homeschooled on the PFI-Enrolled questionnaire lived in a city (39 percent) compared with part-time homeschoolers in the PFI-Homeschool questionnaire (25 percent).
In addition, a lower percentage of students reported as part-time homeschooled on the PFI-Enrolled questionnaire were White (45 percent) compared with part-time homeschoolers in the PFI-Homeschool questionnaire (65 percent). There were also differences by the child’s grade. A higher percentage of students reported as part-time homeschooled on the PFI-Enrolled questionnaire were in kindergarten through grade 2 (33 percent) compared with part-time homeschoolers in the PFI-Homeschool questionnaire (7 percent) and a lower percentage of students reported as part-time homeschooled in the PFI-Enrolled questionnaire were in grades 6 through 8 compared with part-time homeschoolers in the PFI-Homeschool questionnaire (15 percent vs. 37 percent, respectively). A higher percentage of students reported as part-time homeschooled on the PFI-Enrolled questionnaire had parents with less than a high school education and lived in poverty than did those in the PFI-Homeschool questionnaire (26 percent vs. 4 percent and 33 percent vs. 13 percent, respectively). A lower percentage of students reported as part-time homeschooled on the PFI-Enrolled questionnaire were not poor compared with their peers in the PFI-Homeschool questionnaire (67 percent vs. 87 percent, respectively). A lower percentage of students reported as homeschooled on the PFI-Enrolled questionnaire had two parents or guardians with one in the labor force compared with homeschoolers in the PFI-Homeschool questionnaire (19 percent vs. 46 percent, respectively). Finally, a lower percentage of students reported as homeschooled on the PFI-Enrolled questionnaire had two parents or guardians compared with homeschoolers in the PFI-Homeschool questionnaire (62 percent vs. 83 percent, respectively).

APPENDIX B—TECHNICAL NOTES B-6
Table B-3. Percentage distribution of homeschooled students on the PFI-Enrolled and PFI-Homeschool questionnaires, by selected characteristics: 2012
All homeschooled
students
Full-time homeschooled
students on the PFI–
Homeschool
Part-time homeschooled
students on the PFI–
Homeschool
Homeschooled students on the
PFI–Enrolled Characteristic Percent Percent Percent Percent Total 100 100 100 100
Locale of student’s household City 28 20 25 39 Suburban 34 25 40 43 Town 7 10 10 ! 2 ! Rural 31 44 25 16
Student’s sex Male 49 48 38 54 Female 51 52 62 46
Student’s race/ethnicity White, non-Hispanic 68 87 65 45 Black, non-Hispanic 8 3 ! 10 ! 13 Hispanic 15 5 ! 15 ! 28 Asian or Pacific Islander, non-Hispanic 4 2 ! # 8 !
5 3 ! 11 ! 6
Student’s grade equivalent K–2nd grade 24 20 7 ! 33 3rd–5th grade 23 22 19 26 6th–8th grade 24 28 37 15 9th–12th grade 29 30 37 25
Parent’s highest level of education Less than high school 12 2 ! 4 ! 26 High school graduate or equivalent 20 22 24 16 Vocational/technical or some
college 30 30 37 27 Bachelor’s degree 24 27 20 ! 22
Graduate or professional school 14 18 16 ! 9 See notes at end of table.
Other, non-Hispanic

APPENDIX B—TECHNICAL NOTES B-7
Table B-3. Percentage distribution of homeschooled students on the PFI-Enrolled and PFI-Homeschool questionnaires, by selected characteristics: 2012—Continued
All homeschooled
students
Full-time homeschooled
students on the PFI–
Homeschool
Part-time homeschooled
students on the PFI–
Homeschool
Homeschooled students on the
PFI–Enrolled Characteristic Percent Percent Percent Percent Poverty status2 Poor 20 11 13 ! 33 Nonpoor 80 89 87 67
Parent participation in the workforce3 Two parents/guardians-both in the
labor force 35 25 44 45 Two parents/guardians-one in the
labor force 43 60 46 19 One parent/guardian-in the labor
force 14 7 7 ! 26 No parent/guardian participation in
the labor force 8 7 ! 3 ! 10
Number of parents in the household Two parents (biological, adoptive, step,
or foster) 76 86 83 62 One parent (biological, adoptive, step,
or foster) 19 11 ! 12 ! 32 Nonparental guardians 4 ! 3 ! 5 ! 6 !
Number of children in the household under 18
One child 24 23 28 24 Two children 28 23 29 32 Three or more children 49 54 43 43
# Rounds to zero. ! Interpret data with caution; coefficient of variation is between 30 and 50 percent.*Denotes a measurable difference. See statistical tests section for additional details.1 “Other, non-Hispanic” includes children who were multiracial and not of Hispanic ethnicity, or who were American Indian or AlaskaNative, or who were not Hispanic, White, Black, Asian, or Pacific Islander. The different groups mentioned here are not shown separatelybecause the sample sizes do not support stable estimates.2 Students are considered poor if living in households with incomes below the poverty threshold, which is a dollar amount determined bythe federal government to meet the household’s needs, given its size and composition. Income is collected in categories in the survey,rather than as an exact amount, and therefore the poverty measures used in this report are approximations of poverty.3 Participation in the workforce includes full-time employment, part-time employment, and looking for work. For this categorization, two-parent households could include one parent figure and a second guardian such as a grandparent.NOTE: Detail may not sum to totals because of rounding. Homeschooled students are school-age children who receive instruction athome instead of at a public or private school either all or most of the time. Excludes students who were enrolled in public or privateschool more than 25 hours per week and students who were homeschooled primarily because of temporary illness.SOURCE: U.S. Department of Education, National Center for Education Statistics, Parent and Family Involvement in Education Surveyof the National Household Education Surveys Program (NHES), 2012.

APPENDIX B—TECHNICAL NOTES B-8
In sum, these comparisons suggested that the statistical adjustment used to estimate the total number of homeschoolers in 2012 may bias estimates of the characteristics of homeschoolers. For this reason, only the unadjusted data were used in analyses of student and family characteristics in this report. NCES also removed tables related to homeschooling from a previously released report (NCES 2013-028)7 and is no longer using the statistical adjustment on estimates of sub-populations of homeschoolers.
Variables Used in This Report The variables used in this report were obtained from the NHES:2012 Parent and Family Involvement in Education (PFI) file or derived from the variables in that file. In the descriptions below, variables that were taken from the NHES:2012 file are shown in capital letters.
Percentage distribution and rate of homeschooled students Homeschooled students are ages 5 through 17 (AGE2011), are in a grade equivalent of at least kindergarten and not higher than grade 12 (if the parent received the PFI-Homeschool survey these variables derived grade equivalence: GRADEEQA, GRADEEQB or if the parent received the PFI-Enrolled survey these variables derived grade equivalence: GRADEAT, GRADEBT), and receive instruction at home instead of at a public or private school either all or most of the time (if the parent received the PFI-Homeschool survey (PATH) or if the parent received the PFI-Enrolled survey and marked “Yes” for the following question “Is this child being schooled at home instead of at school for some classes or subjects?” (HOMESCHLX)). Homeschooled students exclude students who were enrolled in public or private school more than 25 hours per week (HSSCHR) and students who were homeschooled only because of temporary illness (HSILLX). The homeschooling rate was calculated using the number of homeschool students, divided by the total number of enrolled and homeschooled students.
Locale of student’s household
ZIPLOCL is a household location variable that classifies the ZIP code into a set of community types. This variable was derived using the respondent’s ZIP code and Census data.
The values for ZIPLOCL follow: 1 = City - Large 2 = City - Midsize 3 = City - Small 4 = Suburb - Large 5 = Suburb - Midsize 6 = Suburb - Small 7 = Town - Fringe 8 = Town - Distant 9 = Town - Remote 10 = Rural - Fringe 11 = Rural - Distant 12 = Rural - Remote
7 Noel, A., Stark, P., and Redford, J. (2013). Parent and family involvement in education, from the National Household Education Surveys Program of 2012 (NCES 2013- 028). Washington, DC: National Center for Education Statistics, Institute of Education Sciences, U.S. Department of Education.

APPENDIX B—TECHNICAL NOTES B-9
For the analyses, the first three categories from ZIPLOCL are combined to form the “City” category. Other categories from ZIPLOCL are combined to form the categories “Suburban” (categories 4, 5, and 6), “Town” (categories 7, 8, and 9), and “Rural” (10, 11, and 12). For definitions of these 12 categories of community type, see exhibit A of Provasnik et al. (2007), available at http://nces.ed.gov/pubs2007/ruraled/exhibit_a.asp.8
Student’s sex The data for the variable CSEX are taken directly from responses to the screener survey.
Student’s race/ethnicity RACEETH2 indicates the race and ethnicity of the sampled student. This variable is used in this report in the same format in which it appears on the data file and is derived from information in CHISPAN, CWHITE, CBLACK, CAMIND, CASIAN, and CPACI. If values are missing for these variables, they are imputed. If students are reported to be both Asian and Pacific Islander, and are not Hispanic, they are included in the “Asian or Pacific Islander, non-Hispanic” category.
The values of RACEETH2 follow: 1 = White, non-Hispanic 2 = Black, non-Hispanic 3 = Hispanic 4 = Asian or Pacific Islander, non-Hispanic 5 = All other races and multiple races, non-Hispanic
Student’s grade equivalent If the parent received the PFI-Homeschool survey, this variable is based on the following question, “What grade or year would this child be in if he/she was attending school?” The parent could select a check box for kindergarten (GRADEEQA) or write in the numeric grade (1 through 12) (GRADEEQB). If the parent received the PFI-Enrolled survey, this variable is based on the following question, “What is this child’s current grade or year of school?” The parent could select a check box for full-day or partial-day kindergarten (GRADEAT) or write in the numeric grade (1 through 12) (GRADEBT). For this Report, the variables were collapsed into four categories: kindergarten to grade 2, grades 3 to 5, grades 6 to 8, and grades 9 to 12.
Highest education level of parents/guardians. Parents include birth, adoptive, step or foster parents in the household or nonparent guardians in the household. PARGRADEX indicates the highest level of education for either of the child’s parents or nonparent guardians who reside in the household. This measure, which is used in this report in the same format in which it appears on the data file, is derived from PAR1EDUC and PAR2EDUC.
The values of PARGRADEX follow: 1 = Less than high school 2 = High school graduate or equivalent 3 = Vocational/technical or some college
8 Provasnik, S., KewalRamani, A., Coleman, M.M., Gilbertson, L., Herring, W., and Xie, Q. (2007). Status of Education in Rural America (NCES 2007-040). National Center for Education Statistics, Institute of Education Sciences, U.S. Department of Education. Washington, DC.

APPENDIX B—TECHNICAL NOTES B-10
4 = Bachelor’s degree 5 = Graduate or professional school
Poverty status This indicates whether a sampled student resided in a household categorized as poor or nonpoor. NHES provides an approximate measure of poverty. The income variable used to establish whether a child resided in a household categorized as poor or nonpoor is TTLHHINC, which lists possible income ranges (e.g., $0 to $10,000, $10,001 to 20,000, $20,001 to $30,000, up to over $150,001). If data for TTLHHINC are missing, they are imputed. Using the income ranges and household size (HHTOTAL), poverty thresholds are then used to establish whether a child resided in a household categorized as poor or nonpoor. Thresholds to define poverty are based on weighted averages from 2011 Census poverty thresholds. A household is considered poor if a household of a particular size matches the income categories shown in exhibit 1. Otherwise, the household is considered to be nonpoor.
Exhibit B-1. Poverty definition in Parent and Family Involvement in Education (PFI) analyses, by household size: 2012 Household size (HHTOTAL)¹ Income categories in variable TTLHHINC
2 Less than or equal to $10,000 (TTLHHINC = 1)
3 Less than or equal to $20,000 (TTLHHINC = 1, 2)
4 Less than or equal to $20,000 (TTLHHINC = 1, 2)
5 Less than or equal to $30,000 (TTLHHINC = 1, 2, 3)
6 Less than or equal to $30,000 (TTLHHINC = 1, 2, 3)
7 Less than or equal to $40,000 (TTLHHINC = 1, 2, 3, 4)
8 Less than or equal to $40,000 (TTLHHINC = 1, 2, 3, 4) 1 Indicates the total number of individuals living in the household, top-coded to eight for NHES. SOURCE: U.S. Department of Education, National Center for Education Statistics, Parent Family Involvement in Education Survey of the National Household Education Surveys Program (PFI-NHES:2012); U.S. Census Bureau, Poverty Thresholds for 2011 by Size of Family and Number of Related Children Under 18 Years, https://www.census.gov/hhes/www/poverty/data/threshld/index.html.
Reasons for homeschooling children Parents were asked whether or not they chose to homeschool their child to provide religious instruction (HSRELGON); to provide moral instruction (HSMORAL); because of a concern about the school environment such as safety, drugs, or negative peer pressure (HSSAFETYX); because of dissatisfaction with the academic instruction at other schools (HSDISSATX); to provide a nontraditional approach (HSALTX); because the child has special needs that they believed the school could not or would not meet (HSSPCLNDX); because the child has a physical or mental problem that has lasted six months or more (HSDISABLX); or for other reasons beyond those listed (HSOTHERX). Parents were asked to mark “yes” to all reasons that applied.
Parents were asked to indicate the most important reason for homeschooling their child (HSMOSTX) based on the list in the previous question. These choices included the variables listed above.
Sources of curriculum and books This variable is based on the question “Thinking about sources of curriculum or books you use to homeschool this child, please tell us about all the sources that apply to you. Since September, have you

APPENDIX B—TECHNICAL NOTES B-11
used…” Parents could mark either “yes” or “no” for each curriculum type: a public library (HSCLIBRX), a homeschooling catalog, publisher, or individual who specializes in homeschooling materials (HSCHSPUBX), another educational publisher (HSCEDPUBX), a homeschooling organization (HSCORGX), a church, synagogue, or other religious organization (HSCCHURX), your local public school or school district (HSCPUBLX), a private school (HSCPRIVX), a bookstore or other store (including online) (HSCRELX), and websites, excluding retailers (HSCNETX). Parents could also indicate an “other source” (HSCOTH).
Parent attending a course to prepare for the child’s instruction and method of attending the course (new for 2012) This variable is based on the question “In the past year, have your or another family member taken any courses, either online or in-person, to help you prepare your child’s home instruction?” (HSCOURS). The parent could respond by selecting either “No” or selecting “Yes” and the method of attending the course. These response options include “Yes, both online and in-person,” “Yes, online only,” or “Yes, in-person only.”
Enrollment in online courses and places that provide the online instruction (new for 2012) Parents provided responses to a question about whether their child took any courses over the internet and, if so, who provided that instruction. This variable is based on the questions “Some homeschooled children take courses over the Internet taught by people outside the household. Is this child receiving any instruction this way?” (HSINTNET) and if they responded “Yes” to that item were asked the following question “Is that instruction provided by any of the following places?” Parents could mark all responses that applied to them, including: your local public school (HSINTPUB), a charter school (HSINTCH), another public school (HSINTAPB), a private school (HSINTPRI), a college, community college, or university (HSINTCOL), offered by my state (HSINTST), and someplace else (HSINTOH).
Subjects taught during the time being homeschooled (new for 2012) This variable is based on the question “Thinking about all years this child has been homeschooled, which of the following subject areas has this child been taught during his or her home instruction?” The parent was instructed to mark all that apply. Figures in this report are presented for children that are in grade level equivalent of 9th–12th grade. In this report, only data for mathematics and science are reported. English or literature subject areas are not reported.
1. Math subjects: The parent responded by checking the box for the child being taught: basic algebra (Algebra I) (HSALG1), advanced algebra (Algebra II) (HSALG2), geometry (HSGEOM), calculus (HSCALC), or probability (HSPROB).
2. Science subjects: The parent responded by checking the box for the child being taught: scientific inquiry or experiments (HSSCIEN), Earth sciences or geology (HSGEOL), biology (HSBIOL), chemistry or physics (HSCHEM), or computer science (e.g., computer programming) (HSCOMSCI).

APPENDIX B—TECHNICAL NOTES B-12
Data Reliability Estimates produced using data from the NHES are subject to two types of errors: nonsampling errors and sampling errors. Nonsampling errors are errors made in the collection and processing of data. Sampling errors occur because the data are collected from a sample, rather than from a census, of the population.
Nonsampling Errors Nonsampling error is the term used to describe variations in the estimates that may be caused by population coverage limitations and data collection, processing, and reporting procedures. The sources of nonsampling errors are typically problems such as unit and item nonresponse, the differences in respondents’ interpretations of the meaning of survey questions, response differences related to the particular month or time of the year when the survey was conducted, the tendency for respondents to give socially desirable responses, and mistakes in data preparation.
In general, it is difficult to identify and estimate either the amount of nonsampling error or the bias caused by this error. For each NHES survey, efforts were made to prevent such errors from occurring and to compensate for them, where possible. For instance, during the survey design phase, cognitive interviews were conducted to assess respondents’ knowledge of the survey topics, their comprehension of questions and terms, and the sensitivity of items. For NHES:2012, one possible source of significant nonsampling error was how information was collected for part-time homeschooled students. The PFI-Enrolled survey did not collect detailed homeschooling experience information for children who were found to be homeschooled part time, but who were in the PFI-Enrolled sample.
Sampling Errors The sample of households based on addresses selected for the NHES:2012 is just one of many possible samples that could have been selected from all households based on addresses. Therefore, estimates produced from this survey may differ from estimates that would have been produced from other samples. This type of variability is called sampling error because it arises from using a sample of households rather than all households.
The standard error is a measure of the variability that results from sampling when estimating a statistic; standard errors for estimates presented in this report were computed using a jackknife replication method. Standard errors can be used as a measure of the precision expected from a particular sample. The probability that a complete census count would differ from the sample estimate by less than 1 standard error is about 68 percent and by less than 1.96 standard errors is about 95 percent.
Standard errors for all the estimates are presented in appendix A and can be used to produce confidence intervals. For example, an estimated 54 percent of homeschooled students are female (table 2). This figure has an estimated standard error of 3.4. Therefore, the estimated 95 percent confidence interval for this statistic is approximately 48 to 61 percent (54 percent +/– [1.96 * 3.4]). If repeated samples were drawn from the same population and confidence intervals were constructed for the percentage of female students, these intervals would contain the true population parameter 95 percent of the time.
When the standard error of an estimate is greater than 30 percent of that estimate, the variation is high and the estimate may not be sufficiently precise. The measure of the proportion of standard error relative to the estimate

APPENDIX B—TECHNICAL NOTES B-13
is called the coefficient of variation. Estimates that have coefficients of variation above the 30 percent threshold are noted with special symbols in the tables.
Weighting The special weighting adjustment described in the section called Defining and Estimating the Number of Homeschooled Students is used in figure 1 and tables 1 and 2 to account for measurement error in the total number of homeschoolers. The adjustment is not used in other tables or figures because the survey did not collect detailed homeschooling experience information for children who were found to be homeschooled part time, but who were in the PFI-Enrolled sample. The SAS programming code to create the weight adjustment is provided in appendix C. To produce unbiased and consistent estimates of national totals, all the responses in this report were weighted using the probabilities of selection of the respondents and other adjustments to account for nonresponse and coverage bias. The weight used in this Statistical Analysis Report is FPWT, which is the weight variable available in the PFI data file that is used to estimate the characteristics of the school-age children. In addition to weighting the responses properly, special procedures for estimating the standard errors of the estimates were employed because the NHES data were collected using a complex sample design. Complex sample designs result in data that violate some of the assumptions that are normally made when assessing the statistical significance of results from a simple random sample. For example, the standard errors of the estimates from these surveys may vary from those that would be expected if the sample were a simple random sample and the observations were independent and identically distributed random variables. The estimates and standard errors presented in this report were produced using SAS 9.2 software and the jackknife 1 (JK1) option as a replication procedure.
Response Rates In the NHES:2012 data collection, an initial screener questionnaire was sent to all sampled households to determine whether any eligible children resided in the household. Screener questionnaires were completed by mail for 99,430 households, for a weighted screener unit response rate of 73.4 percent. To calculate the screener unit response rate, each sampled address in the screener operation was classified in one of four ways: a response (R), a nonresponse (NR), an ineligible case (I), or a case of unknown eligibility (U). The screener unit response rate was calculated per NCES Standard 1-3-2,9 which corresponds to the American Association for Public Opinion Research (AAPOR) Response Rate 3 (RR3) formula:10
where
ee=E
T-U
9 U.S. Department of Education, National Center for Education Statistics. (2002). NCES Statistical Standards. Washington, DC: Author. Retrieved [12/16/2015] from https://nces.ed.gov/statprog/2002/std1_3.asp. 10 The American Association for Public Opinion Research. (2008). Standard Definitions: Final Dispositions of Case Codes and Outcome Rates for Surveys (5th ed.). Lenexa, Kansas: Author. Retrieved [12/16/2015] from http://www.aapor.org/AAPORKentico/AAPOR_Main/media/MainSiteFiles/Standard_Definitions_07_08_Final.pdf.

APPENDIX B—TECHNICAL NOTES B-14
and
R = sum of base weights of respondents,
E = sum of base weights for eligible sample units: E = R + NR, (NR = sum of base weights of nonrespondents)
U = sum of base weights for unknown-eligibility cases,
T = sum of base weights over all cases in sample, and
ee = proportion of known eligibility cases that are eligible.
The eligibility rate, ee, was estimated separately for each subgroup of address types available on the frame. See the NHES 2012 Data File User’s Manual for more detail (McPhee et al 2015).
Topical PFI questionnaires were completed by mail for 17,563 children, for a weighted unit response rate of 78.4 percent and an overall estimated unit response rate (the product of the screener unit response rate and the topical unit response rate) of 57.6 percent that included a sample of 397 homeschooled students.
Calculation of the PFI unit response rate differs from the screener response rate because it does not include unknown eligibility cases in the denominator or take into account the proportion of known eligibility cases that are actually eligible. All households with completed screener questionnaires indicating that a PFI-eligible child lives in the household are assumed to be eligible for the second-stage survey. For an overall response rate, the screener unit response rate was multiplied by the PFI response rate.
For most of the data items in the NHES, item response rates were very high. The median item response rate for the PFI survey was 97.9 percent. When questionnaires were returned with missing data, data edits and/or hot deck imputation were used to complete the missing data. All numeric and categorical data items with missing data due to item nonresponse were imputed for the NHES:2012. Readers are advised to consult the NHES:2012 Data File User’s Manual for detail on the methodology used for imputation.11
Nonresponse Bias Analysis The NHES:2012 included a bias analysis to evaluate whether nonresponse at the unit and item levels had an impact on the estimates. The term “bias” has a specific technical definition in this context: it is the expected difference between the estimate from the survey and the actual population value. For example, if all households were included in the survey (i.e., if a census had been conducted rather than a sample survey), the difference between the estimate from the survey and the actual population value (which includes persons who did not respond to the survey) would be the bias that results from unit nonresponse. Because NHES is based on a sample, the bias is defined as the expected or average value of this difference over all possible samples.
In 1999, screening interviews were completed by phone with 57,278 households. The unit response rate for the screener interview was 74 percent and the unit response rate for the topical phone interview was 88
11 McPhee, C., Bielick, S., Masterton, M., Flores, L., Parmer, R., Amchin, S., Stern, S., and McGowan, H. (2015). National Household Education Surveys Program of 2012: Data File User’s Manual (NCES 2015-030). National Center for Education Statistics, Institute of Education Sciences, U.S. Department of Education. Washington, DC.

APPENDIX B—TECHNICAL NOTES B-15
percent, yielding an overall unit response rate of 65 percent that included a sample of 275 homeschooled students.
In 2003, screening interviews were completed by phone with 32,049 households. The unit response rate for the screener interview was 65 percent. The unit response rate for the topical phone interview was 83 percent. The overall unit response rate was 54 percent that included a sample of 239 homeschooled students.
In 2007, screening interviews were completed by phone with 54,034 households. The unit response rate for the screener interview was 53 percent. The unit response rate for the topical phone interview was 74 percent. The overall unit response rate was 39 percent that included a sample of 290 homeschooled students.
Unit nonresponse bias, or the bias that results from the failure of some persons or households in the sample to respond to the survey, can be substantial when two conditions hold. First, the differences between the characteristics of respondents and nonrespondents must be relatively large. For example, consider estimating the percentage of students who were homeschooled because of a concern about the school environment. If the percentage is similar for both respondents and nonrespondents, the unit nonresponse bias of the estimate will be negligible.
Second, the unit nonresponse rate must be relatively high. If the nonresponse rate is very low relative to the magnitude of the estimates, the unit nonresponse bias in the estimates will be small, even if the differences in the characteristics between respondents and nonrespondents are relatively large. For example, if the unit nonresponse rate is only 2 percent, estimates of totals that comprise 20 or 30 percent of the population will not be greatly affected by nonresponse, even if the differences in these characteristics between respondents and nonrespondents are relatively large. If the estimate is for a small domain or subgroup (of about 5 or 10 percent of the population), even a relatively low overall rate of nonresponse can result in important biases if the differences between respondents and nonrespondents are large.
Comparisons between the full sample population and respondent populations were made before and after the nonresponse weighting adjustments were applied to evaluate the extent to which the adjustments reduced any observed nonresponse bias. Chapter 10 of the NHES:2012 Data File User’s Manual contains a detailed description of the nonresponse bias analysis. The NHES sampling frame variables were used for the unit nonresponse bias analysis for the screener and topical surveys. The analysis of unit nonresponse bias showed evidence of bias based on the distributions of the sample characteristics for the survey respondents compared with the full eligible sample. However, this bias was greatly reduced by the nonresponse weighting adjustments. In the post-adjusted screener estimates, the number of estimates showing measurable and practical differences was reduced in half. The percentage of estimates with measurable survey and sample differences greater than 1 percentage point was reduced from 7 to 3 percent for the PFI survey by the nonresponse weighting adjustments.
When key survey estimates generated with unadjusted and nonresponse adjusted weights were compared, only a small number of measurable differences were observed. This suggests that none of these variables was a powerful predictor of unit response. Therefore, the unit nonresponse adjustment had limited effect on the potential bias, but it is also possible that there was little bias to be removed based on there only being a small number of differences between key survey estimates for the full sample respondents and nonrespondents.
It is also possible that nonresponse bias may still be present in other variables that were not studied. For this reason, it is important to consider other methods of examining unit nonresponse bias. One such method is

APPENDIX B—TECHNICAL NOTES B-16
comparing NHES estimates with other sources. NHES estimates were compared with estimates from the American Community Survey, the Current Population Survey, and prior NHES collections. Comparisons were made on common variables of interest—such as child’s race/ethnicity and sex; key questionnaire items; and parents’ education and household income—to discover any indication of potential bias that may exist in the NHES:2012 data. The results from these comparisons indicate that NHES survey estimates are comparable with other data sources.
Statistical Tests All specific statements of comparisons have been tested for statistical significance at the .05 level using student’s t statistics to ensure that the differences are larger than those that might be expected owing to sampling variation. No adjustments were made for multiple comparisons. Readers are cautioned not to draw causal inferences on the basis of the results presented. Many of the variables examined in this report may be related to one another, but the complex interactions and relationships among them have not been explored. The variables examined here are also just a few of those that can be examined in these data. The tests of significance used in this report are based on student’s t statistics for the comparisons of percentages. To test for a difference between the percentages of two subgroups in the population having a particular characteristic, say p1 versus p2, the test statistic is computed as
where p1 and p2 are the estimates being compared and s.e. (p1) and s.e. (p2) are their corresponding standard errors. Thus, if p1 is the 54 percent of homeschooled students who are female, with a standard error of 3.4, and p2 is the 46 percent of homeschooled students who are male, with a standard error of 3.4, the t value is equal to –1.64.
The decision rule is to reject the null hypothesis if there is a measurable difference between the two groups in
the population in terms of the percentage having the characteristic, if df
tt;
2α> , where
dft
;2α is the value such
that the probability a student’s t random variable with df degrees of freedom exceeds that value is 2α . All
tests in this report are based on a significance level of 0.05, that is, 05.0=α . When the degrees of freedom are large, greater than 120, 96.1;025.0 ≈dft . In the example above, the t value is small enough to fail to reject the null
hypothesis (1.64 < 1.96), so we conclude that there is no measurable difference between the percentage of students by the student’s sex.

C-1
Appendix C—Implementing the Homeschool Estimates Adjustment
In order to replicate NCES’s estimate of the homeschooling rate in 2012, analysts must do three things. First, make sure that the analytic sample for the total homeschooling rate includes respondents to the enrolled questionnaire who indicated that their child is homeschooled (HOMESCHLX = 1) in addition to respondents to the homeschooling questionnaire (PATH = ‘H’). Second, adjust the existing final child level weight, called FPWT. SAS code is shown below in Exhibit C-1 that adjusts FPWT to a new weight that is used only for the purposes of estimating the total homeschooling rate and weighted count in 2012, called TOTHSWT.
Exhibit C-1. Adjusting final child level weight to estimate 2012 weighted homeschooling count and rate
TOTHSWT = . ; if HOMESCHLX=1 then TOTHSWT= FPWT*.78; else TOTHSWT=FPWT;
A third adjustment is needed to create adjusted standard errors for the estimates of total homeschooling. It adjusts the existing replicate weights, FPWT1-FPWT80, that are used for the jackknife replication method for estimating standard errors. The SAS code shown below in Exhibit C-2 adjusts FPWT1-FPWT80 to create a new set of replicate weights that are to be used only for the purposes of estimating the standard errors associated with the total homeschooling rate in 2012, called HSWT1-HSWT80.
Exhibit C-2. Creating replicate weights for estimating 2012 homeschooling rate standard errors
array repwt (*) FPWT1-FPWT80; array tothswt123 (*) TOTHSWT1-TOTHSWT80; retain FPWT1-FPWT80 TOTHSWT1-TOTHSWT80 i; do i = 1 to 80; if HOMESCHLX = 1 then tothswt123(i)= repwt(i)*.78; else tothswt123(i)=repwt(i); drop i; end;
Though NCES recommends that analysts use the modifications described above to estimate the total homeschooling rate in 2012, there are limitations to its use. Respondents to the PFI-Enrolled questionnaire who indicated that the child was homeschooled did not receive any detailed questions about homeschooling experiences, so analyses about homeschooling characteristics cannot use respondents to the enrolled questionnaire and should not use the adjusted weights. Similarly, NCES does not recommend that analysts use data from the enrolled respondents to analyze demographics of homeschoolers, particularly when homeschooled students are the denominator, because some characteristics of respondents to the PFI-Enrolled questionnaire who marked that they were homeschooled are statistically significantly different from part-time homeschoolers on the PFI-Homeschool questionnaire (see table B-3) and any potential bias will be magnified when the subgroup sample sizes are small. Questions about the homeschool weight adjustments should be directed to [email protected].