Home Prices Continue to Rise During Seasonal Slowdown
30
Equity Research United States Banc of America Securities Please see the important disclosures and analyst certification on page 27 of this report. BAS does and seeks to do business with companies covered in its research reports. As a result, investors should be aware that the firm may have a conflict of interest that could affect the objectivity of this report. Investors should consider this report as only a single factor in making their investment decision. Industry Overview Homebuilding BofA Monthly Real Estate Agent Survey Home Prices Continue to Rise During Seasonal Slowdown August 31, 2005 Daniel Oppenheim, CFA (212) 847-5733 [email protected] Michael R. Wood, CFA (212) 847-5699 [email protected] Top Picks Ticker Rating Price Target DHI B $33.72 $46.00 ♦ Agents see solid demand but lighter traffic due to seasonal factors and a lack of supply. Our survey of 217 real estate agents indicated healthy demand but reflected a seasonal decline in traffic volume, as our traffic index declined to 39.5 in August from 41.6 in July—modestly short of expectations in both months. A sharp decline in Minneapolis fully accounted for 2.1 points in overall traffic. Traffic exceeded agents’ expectations in Arizona, Florida, and Seattle, WA, while continuing to disappoint across the Midwest (Denver, Detroit, and Minneapolis) due to low confidence in the employment outlook. Agents said demand in California and NY-Northern NJ remained strong although traffic declined due to limited inventory. ♦ Home prices continue to rise at a healthy pace. Home prices increased in August relative to July in 14 of the top 20 markets, and our survey pointed to a healthy moderation of price appreciation. Our price index fell to 62.3 from 67.7 in July, still indicating widespread appreciation as the index remains well above 50.0. ♦ Agents continue to cite affordability concerns, but see little impact from higher gasoline prices. Agents cited affordability concerns in Chicago, Miami, NY-NJ and Sacramento but said supply constraints in these markets continue to support higher home prices. We continue to favor homebuilders with less exposure to frothy markets, a diversified geographic presence, and a focus on less rate-sensitive homebuyers. ♦ Standard Pacific, Pulte Homes, and Ryland Group are best positioned to benefit from strength in AZ, FL, and CA, in our opinion. ♦ Florida markets (Miami, Orlando, and Tampa) ranked highest among the top 20 markets in both demand and price appreciation, followed by Phoenix and Seattle. ♦ Midwest markets remain the weakest markets due to potential layoffs in the airline (Minneapolis) and automobile (Detroit) industries. HOV B $56.97 $74.00 Least Favorites SPF N $83.00 $103.00 CTX N $64.79 $76.00 Sector View: We see upside in the homebuilders based on the positive secular trends and reasonable valuations, which should offset the challenges from modestly rising rates. Sector Price Appreciation Potential (Median of Target Price): 23% B = Buy, N = Neutral, S = Sell, * = New Pick
Transcript of Home Prices Continue to Rise During Seasonal Slowdown

Equity Research
United States
Banc of America Securities
Please see the important disclosures and analyst certification on page 27 of this report. BAS does and seeks to do business with companies covered in its research reports. As a result, investors should be aware that the firm may have a conflict of interest that could affect the objectivity of this report. Investors should consider this report as only a single factor in making their investment decision.
Industry Overview Homebuilding
BofA Monthly Real Estate Agent SurveyHome Prices Continue to Rise During Seasonal Slowdown
August 31, 2005
Daniel Oppenheim, CFA(212) 847-5733
doppenheim@bofasecuri ties.com
Michael R. Wood, CFA(212) 847-5699
michael.r.wood@bofasecurit ies.com
Top Picks
Ticker Rating Price Target
DHI B $33.72 $46.00
♦ Agents see solid demand but lighter traffic due to seasonal factors and a lack of supply. Our survey of 217 real estate agents indicated healthy demand but reflected a seasonal decline in traffic volume, as our traffic index declined to 39.5 in August from 41.6 in July—modestly short of expectations in both months. A sharp decline in Minneapolis fully accounted for 2.1 points in overall traffic. Traffic exceeded agents’ expectations in Arizona, Florida, and Seattle, WA, while continuing to disappoint across the Midwest (Denver, Detroit, and Minneapolis) due to low confidence in the employment outlook. Agents said demand in California and NY-Northern NJ remained strong although traffic declined due to limited inventory.
♦ Home prices continue to rise at a healthy pace. Home prices increased in August relative to July in 14 of the top 20 markets, and our survey pointed to a healthy moderation of price appreciation. Our price index fell to 62.3 from 67.7 in July, still indicating widespread appreciation as the index remains well above 50.0.
♦ Agents continue to cite affordability concerns, but see little impact from higher gasoline prices. Agents cited affordability concerns in Chicago, Miami, NY-NJ and Sacramento but said supply constraints in these markets continue to support higher home prices. We continue to favor homebuilders with less exposure to frothy markets, a diversified geographic presence, and a focus on less rate-sensitive homebuyers.
♦ Standard Pacific, Pulte Homes, and Ryland Group are best positioned to benefit from strength in AZ, FL, and CA, in our opinion.
♦ Florida markets (Miami, Orlando, and Tampa) ranked highest among the top 20 markets in both demand and price appreciation, followed by Phoenix and Seattle.
♦ Midwest markets remain the weakest markets due to potential layoffs in the airline (Minneapolis) and automobile (Detroit) industries. HOV B $56.97 $74.00
Least Favorites SPF N $83.00 $103.00
CTX N $64.79 $76.00
Sector View: We see upside in the homebuilders based on the positive secular trends and reasonable valuations, which should offset the challenges from modestly rising rates.
Sector Price Appreciation Potential (Median of Target Price): 23% B = Buy, N = Neutral, S = Sel l, * = New Pick

Banc of America Securities
Daniel Oppenheim, CFA (212) 847-5733 1
Price Appreciation Moderating, Sales Healthy
Agents see solid demand but lighter traffic due to seasonal factors and a lack of supply. Our survey of 217 real estate agents indicated healthy demand but reflected a seasonal decline in traffic volume, as our traffic index declined to 39.5 in August from 41.6 in July—modestly short of expectations in both months. A sharp decline in Minneapolis fully accounted for 2.1 point in overall traffic. Traffic exceeded agents’ expectations in Arizona, Florida, and Seattle, WA, while continuing to disappoint across the Midwest (Denver, Detroit, and Minneapolis) due to low confidence in the employment outlook. Agents said demand in California and NY-Northern NJ remained strong, although traffic declined due to limited inventory.
Home prices continue to rise at a healthy pace. Home prices increased in August relative to July in 14 of the top 20 markets, and our survey pointed to a healthy moderation of price appreciation. Our price index fell to 62.3 from 67.7 in July, still indicating widespread appreciation as the index remains well above 50.0.
August Survey Shows Seasonal Decline in Traffic and Modestly Higher Home Prices
Month Buyer Traffic Index Home Price Index Incentive Index Community Supply Index
Jan-2005 61.1 61.2 31.4 70.2Feb-2005 48.6 65.5 44.9 68.2Mar-2005 52.2 76.2 42.4 72.6Apr-2005 52.3 75.8 45.0 75.9May-2005 45.2 74.8 44.9 73.8Jun-2005 48.3 75.3 41.7 72.7Jul-2005 41.6 67.7 43.7 71.5
Aug-2005 39.5 62.3 41.0 69.7Point change (2.1) (5.4) (2.7) (1.8)
Source: Banc of Amer ica Secur i t ies LLC estimates.
Agents continue to cite affordability concerns, but see little impact from higher gasoline prices. Agents cited affordability concerns in Chicago, Miami, NY-NJ and Sacramento, but said supply constraints in these markets continue to support higher home prices. We continue to favor homebuilders with less exposure to frothy markets, a diversified geographic presence, and a focus on less rate-sensitive homebuyers.

Banc of America Securities
Daniel Oppenheim, CFA (212) 847-5733 2
Standard Pacific (SPF, $43.11, Neutral, TP: $51.50), Pulte Homes (PHM, $85.22, Neutral, TP: $100) and Ryland Group (RYL, $71.64, Buy, TP: $84) are best positioned to benefit from strength in AZ, FL and CA, in our opinion. Florida markets (Miami, Orlando, and Tampa) ranked highest among the top 20 markets in both demand and price appreciation, followed by Phoenix and Seattle. Midwest markets remain the weakest markets, due to potential layoffs in the airline (Minneapolis) and automobile (Detroit) industries.
Standard Pacific, Ryland, and Hovnanian Best Positioned in Improving Markets
Positive Trending Markets Negative Trending Markets Neutral Markets Net Positive1 Standard Pacific Corp SPF 39% 3% 8% 36%2 Pulte Homes PHM 33% 9% 20% 23%3 Ryland Group RYL 29% 8% 29% 22%4 KB Home KBH 31% 11% 11% 20%5 MDC Holdings MDC 25% 12% 13% 13%6 Hovnanian Enterprises HOV 22% 9% 25% 13%7 WCI Communities WCI 12% 0% 0% 12%8 Lennar Corp. LEN 28% 17% 15% 11%9 D.R. Horton DHI 25% 14% 19% 11%
10 Toll Brothers TOL 14% 5% 23% 10%11 Centex Corp. CTX 11% 6% 23% 6%12 NVR, Inc NVR 0% 0% 44% 0%13 Comstock Homebuilding CHCI 0% 0% 93% 0%
Rank TickerCompany NameMarket Exposure
Source: Banc of Amer ica Secur i t ies LLC
Banc of America Securities
Daniel Oppenheim, CFA (212) 847-5733 3
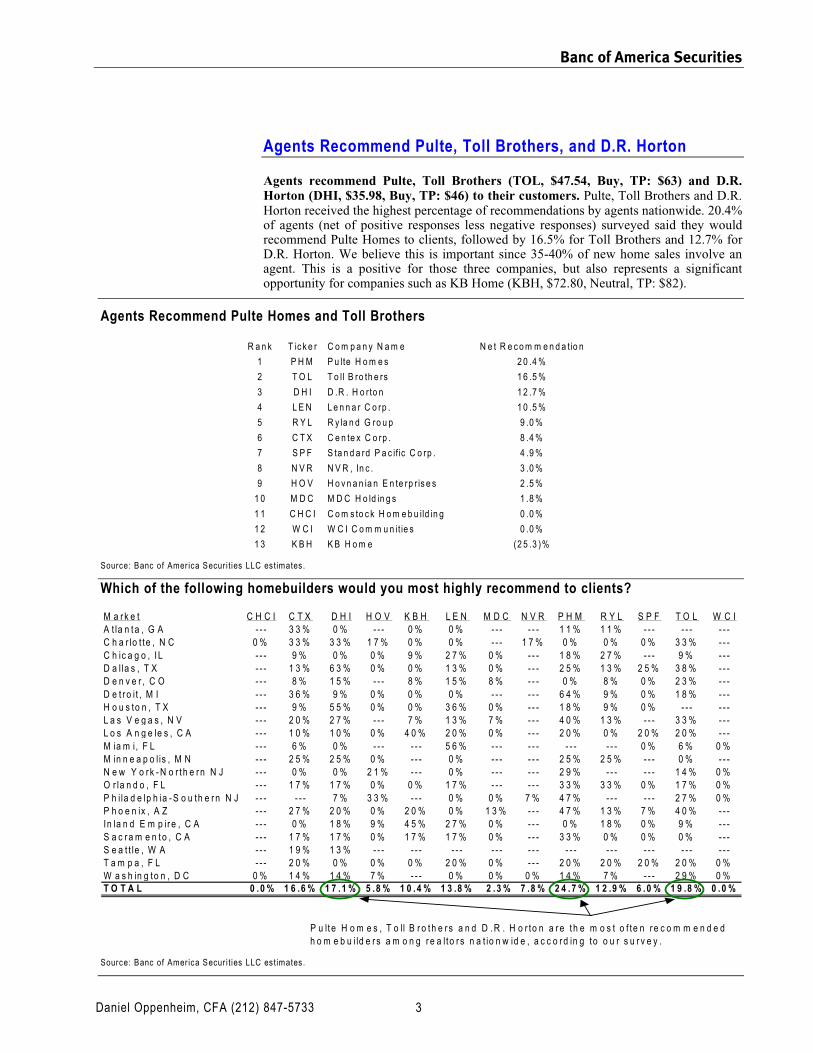
Agents Recommend Pulte, Toll Brothers, and D.R. Horton
Agents recommend Pulte, Toll Brothers (TOL, $47.54, Buy, TP: $63) and D.R. Horton (DHI, $35.98, Buy, TP: $46) to their customers. Pulte, Toll Brothers and D.R. Horton received the highest percentage of recommendations by agents nationwide. 20.4% of agents (net of positive responses less negative responses) surveyed said they would recommend Pulte Homes to clients, followed by 16.5% for Toll Brothers and 12.7% for D.R. Horton. We believe this is important since 35-40% of new home sales involve an agent. This is a positive for those three companies, but also represents a significant opportunity for companies such as KB Home (KBH, $72.80, Neutral, TP: $82).
Agents Recommend Pulte Homes and Toll Brothers
R a n k T ic k e r C o m p a n y N a m e N e t R e c o m m e n d a tio n
1 P H M P u lte H o m e s 2 0 .4 %
2 T O L T o ll B ro th e rs 1 6 .5 %
3 D H I D .R . H o r to n 1 2 .7 %
4 L E N L e n n a r C o rp . 1 0 .5 %
5 R Y L R y la n d G ro u p 9 .0 %
6 C T X C e n te x C o rp . 8 .4 %
7 S P F S ta n d a rd P a c if ic C o rp . 4 .9 %
8 N V R N V R , In c . 3 .0 %
9 H O V H o v n a n ia n E n te rp r is e s 2 .5 %
1 0 M D C M D C H o ld in g s 1 .8 %
1 1 C H C I C o m s to c k H o m e b u ild in g 0 .0 %
1 2 W C I W C I C o m m u n it ie s 0 .0 %
1 3 K B H K B H o m e (2 5 .3 )%
Source: Banc of Amer ica Secur i t ies LLC estimates.
Which of the following homebuilders would you most highly recommend to clients?
M a r k e t C H C I C T X D H I H O V K B H L E N M D C N V R P H M R Y L S P F T O L W C IA t la n t a , G A - - - 3 3 % 0 % - - - 0 % 0 % - - - - - - 1 1 % 1 1 % - - - - - - - - -C h a r lo t te , N C 0 % 3 3 % 3 3 % 1 7 % 0 % 0 % - - - 1 7 % 0 % 0 % 0 % 3 3 % - - -C h ic a g o , I L - - - 9 % 0 % 0 % 9 % 2 7 % 0 % - - - 1 8 % 2 7 % - - - 9 % - - -D a l la s , T X - - - 1 3 % 6 3 % 0 % 0 % 1 3 % 0 % - - - 2 5 % 1 3 % 2 5 % 3 8 % - - -D e n v e r , C O - - - 8 % 1 5 % - - - 8 % 1 5 % 8 % - - - 0 % 8 % 0 % 2 3 % - - -D e t r o i t , M I - - - 3 6 % 9 % 0 % 0 % 0 % - - - - - - 6 4 % 9 % 0 % 1 8 % - - -H o u s to n , T X - - - 9 % 5 5 % 0 % 0 % 3 6 % 0 % - - - 1 8 % 9 % 0 % - - - - - -L a s V e g a s , N V - - - 2 0 % 2 7 % - - - 7 % 1 3 % 7 % - - - 4 0 % 1 3 % - - - 3 3 % - - -L o s A n g e le s , C A - - - 1 0 % 1 0 % 0 % 4 0 % 2 0 % 0 % - - - 2 0 % 0 % 2 0 % 2 0 % - - -M ia m i, F L - - - 6 % 0 % - - - - - - 5 6 % - - - - - - - - - - - - 0 % 6 % 0 %M in n e a p o l is , M N - - - 2 5 % 2 5 % 0 % - - - 0 % - - - - - - 2 5 % 2 5 % - - - 0 % - - -N e w Y o r k - N o r th e r n N J - - - 0 % 0 % 2 1 % - - - 0 % - - - - - - 2 9 % - - - - - - 1 4 % 0 %O r la n d o , F L - - - 1 7 % 1 7 % 0 % 0 % 1 7 % - - - - - - 3 3 % 3 3 % 0 % 1 7 % 0 %P h i la d e lp h ia - S o u th e r n N J - - - - - - 7 % 3 3 % - - - 0 % 0 % 7 % 4 7 % - - - - - - 2 7 % 0 %P h o e n ix , A Z - - - 2 7 % 2 0 % 0 % 2 0 % 0 % 1 3 % - - - 4 7 % 1 3 % 7 % 4 0 % - - -In la n d E m p ir e , C A - - - 0 % 1 8 % 9 % 4 5 % 2 7 % 0 % - - - 0 % 1 8 % 0 % 9 % - - -S a c r a m e n to , C A - - - 1 7 % 1 7 % 0 % 1 7 % 1 7 % 0 % - - - 3 3 % 0 % 0 % 0 % - - -S e a t t le , W A - - - 1 9 % 1 3 % - - - - - - - - - - - - - - - - - - - - - - - - - - - - - -T a m p a , F L - - - 2 0 % 0 % 0 % 0 % 2 0 % 0 % - - - 2 0 % 2 0 % 2 0 % 2 0 % 0 %W a s h in g to n , D C 0 % 1 4 % 1 4 % 7 % - - - 0 % 0 % 0 % 1 4 % 7 % - - - 2 9 % 0 %T O T A L 0 .0 % 1 6 .6 % 1 7 .1 % 5 .8 % 1 0 .4 % 1 3 .8 % 2 .3 % 7 .8 % 2 4 .7 % 1 2 .9 % 6 .0 % 1 9 .8 % 0 .0 %
P u lte H o m e s , T o ll B r o th e r s a n d D .R . H o r to n a r e t h e m o s t o f te n r e c o m m e n d e d h o m e b u i ld e r s a m o n g r e a l to r s n a t io n w id e , a c c o r d in g to o u r s u r v e y .
Source: Banc of Amer ica Secur i t ies LLC estimates.
Banc of America Securities
Daniel Oppenheim, CFA (212) 847-5733 4
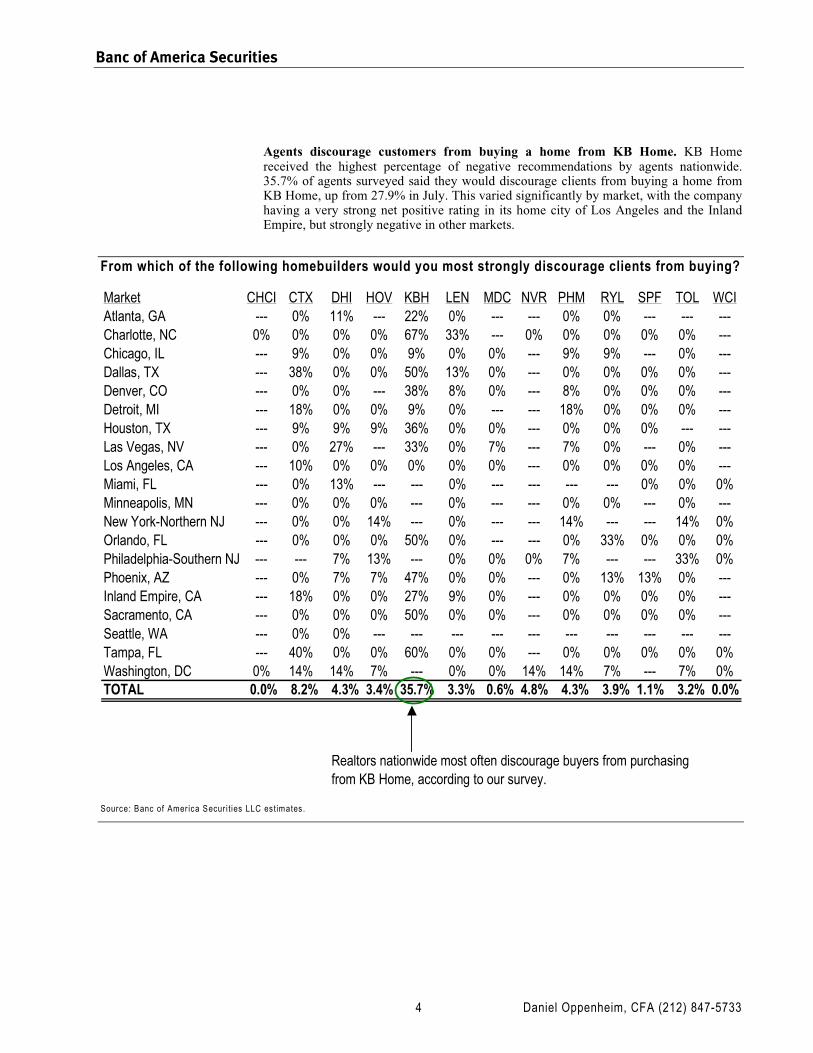
Agents discourage customers from buying a home from KB Home. KB Home received the highest percentage of negative recommendations by agents nationwide. 35.7% of agents surveyed said they would discourage clients from buying a home from KB Home, up from 27.9% in July. This varied significantly by market, with the company having a very strong net positive rating in its home city of Los Angeles and the Inland Empire, but strongly negative in other markets.
From which of the following homebuilders would you most strongly discourage clients from buying?
Market CHCI CTX DHI HOV KBH LEN MDC NVR PHM RYL SPF TOL WCIAtlanta, GA --- 0% 11% --- 22% 0% --- --- 0% 0% --- --- ---Charlotte, NC 0% 0% 0% 0% 67% 33% --- 0% 0% 0% 0% 0% ---Chicago, IL --- 9% 0% 0% 9% 0% 0% --- 9% 9% --- 0% ---Dallas, TX --- 38% 0% 0% 50% 13% 0% --- 0% 0% 0% 0% ---Denver, CO --- 0% 0% --- 38% 8% 0% --- 8% 0% 0% 0% ---Detroit, MI --- 18% 0% 0% 9% 0% --- --- 18% 0% 0% 0% ---Houston, TX --- 9% 9% 9% 36% 0% 0% --- 0% 0% 0% --- ---Las Vegas, NV --- 0% 27% --- 33% 0% 7% --- 7% 0% --- 0% ---Los Angeles, CA --- 10% 0% 0% 0% 0% 0% --- 0% 0% 0% 0% ---Miami, FL --- 0% 13% --- --- 0% --- --- --- --- 0% 0% 0%Minneapolis, MN --- 0% 0% 0% --- 0% --- --- 0% 0% --- 0% ---New York-Northern NJ --- 0% 0% 14% --- 0% --- --- 14% --- --- 14% 0%Orlando, FL --- 0% 0% 0% 50% 0% --- --- 0% 33% 0% 0% 0%Philadelphia-Southern NJ --- --- 7% 13% --- 0% 0% 0% 7% --- --- 33% 0%Phoenix, AZ --- 0% 7% 7% 47% 0% 0% --- 0% 13% 13% 0% ---Inland Empire, CA --- 18% 0% 0% 27% 9% 0% --- 0% 0% 0% 0% ---Sacramento, CA --- 0% 0% 0% 50% 0% 0% --- 0% 0% 0% 0% ---Seattle, WA --- 0% 0% --- --- --- --- --- --- --- --- --- ---Tampa, FL --- 40% 0% 0% 60% 0% 0% --- 0% 0% 0% 0% 0%Washington, DC 0% 14% 14% 7% --- 0% 0% 14% 14% 7% --- 7% 0%TOTAL 0.0% 8.2% 4.3% 3.4% 35.7% 3.3% 0.6% 4.8% 4.3% 3.9% 1.1% 3.2% 0.0%
Realtors nationwide most often discourage buyers from purchasing from KB Home, according to our survey.
Source: Banc of Amer ica Secur i t ies LLC estimates.

Banc of America Securities
Daniel Oppenheim, CFA (212) 847-5733 5
Summary of Individual Market Conditions
The key trends seen in individual markets are outlined in the table below. We surveyed agents in the 20 largest homebuilding markets (based on construction permits issued in 2004.)
August Market Summary:
Market2004 Single-
family permitsMarket
OutlookComments CHCI CTX DHI HOV KBH LEN MDC NVR PHM RYL SPF TOL WCI
Atlanta, GA* 57,316 = Solid Demand, But Modest Price Appreciation on Increased Economic Concerns 0% 2% 3% 0% 3% 0% 0% 0% 4% 6% 0% 0% 0%Charlotte, NC* 17,722 = Market Recovery Takes a Summer Vacation 0% 2% 1% 3% 0% 0% 0% 10% 1% 3% 0% 0% 0%Chicago, IL 35,810 = Home Prices Rise Modestly But Traffic Slows as Affordability Becomes Stretched 0% 3% 3% 4% 0% 4% 0% 0% 3% 7% 0% 0% 0%Dallas, TX 45,908 = In-Line with Expectations: Decent Traffic, Flat Prices 0% 9% 8% 0% 6% 4% 4% 0% 4% 8% 5% 0% 0%Denver, CO 18,533 - Inventory Creeps Higher as Demand Continues to Disappoint 0% 1% 6% 0% 3% 2% 12% 0% 1% 3% 3% 0% 0%Detroit, MI* 17,399 - Inventory Continues to Build on Weak Demand 0% 1% 0% 0% 0% 0% 0% 0% 4% 0% 0% 5% 0%Houston, TX* 45,103 - Weak Economic Growth Leads to Slow Traffic 0% 0% 5% 9% 8% 12% 0% 0% 3% 0% 0% 0% 0%Las Vegas, NV 31,741 + Traffic Rebounds; Prices Moving Up Once Again 0% 2% 4% 0% 11% 3% 0% 0% 7% 5% 0% 5% 0%Los Angeles, CA 17,591 + Low Inventory Fuels Higher Prices In Face of Seasonally Slow Traffic 0% 0% 1% 3% 2% 1% 2% 0% 0% 0% 2% 0% 0%Miami, FL* 24,653 + Strong Economy Supports Higher Home Prices Despite Decline in Affordability 0% 1% 0% 0% 0% 2% 0% 0% 0% 0% 4% 0% 12%Minneapolis* 20,212 - Worries Amid Northwest Strike Lead to Soft Housing Demand 0% 3% 3% 0% 0% 3% 0% 0% 2% 4% 0% 0% 0%NY-NJ 19,871 = Low Affordability and Seasonal Factors Hurt Traffic, But Limited Supply Helps 0% 0% 0% 5% 0% 0% 0% 0% 1% 0% 0% 5% 0%Orlando, FL* 27,493 + Demand Continues to Overwhelm Supply 0% 0% 2% 0% 4% 4% 0% 0% 2% 6% 0% 0% 0%Philadelphia-NJ 15,504 = Traffic Rebounds in August; July’s Sharp Decline Was Likely an Aberration 0% 0% 1% 3% 0% 1% 0% 8% 2% 0% 0% 7% 0%Phoenix, AZ 57,360 + Strong Economy Continues to Fuel Housing Boom 0% 4% 11% 0% 6% 5% 19% 0% 16% 7% 19% 10% 0%Inland Empire, CA 43,142 + Homebuyers Relocating From Coastal Counties Drive Solid Demand 0% 3% 4% 15% 7% 6% 5% 0% 5% 5% 4% 0% 0%Sacramento, CA 18,523 = Traffic Falls Due to a Lack of Inventory and Affordability Concerns 0% 2% 1% 2% 3% 4% 3% 0% 3% 1% 3% 0% 0%Seattle, WA 15,504 + “Prices Continue to Rise and People Want to Buy Before They are Priced Out” 0% 0% 1% 0% 0% 0% 0% 0% 0% 0% 0% 0% 0%Tampa, FL* 23,081 + “Paying Top Dollar for New Construction without any Incentives” 0% 0% 0% 4% 2% 7% 0% 0% 2% 7% 10% 0% 0%Washington, DC 26,490 = Traffic Still Light, But Likely Seasonal 58% 3% 1% 8% 0% 2% 6% 25% 2% 3% 0% 11% 0%Source: Banc of America Securities LLC, Meyers group, and Builderonline.com* Based on percentage of 2003 deliveries according to Builderonline.com
Market Exposure
The following pages provide the key findings from our survey for the individual markets. We’ve listed the markets in order of their importance based on the level of single-family construction activity in the market.
Banc of America Securities
Daniel Oppenheim, CFA (212) 847-5733 6
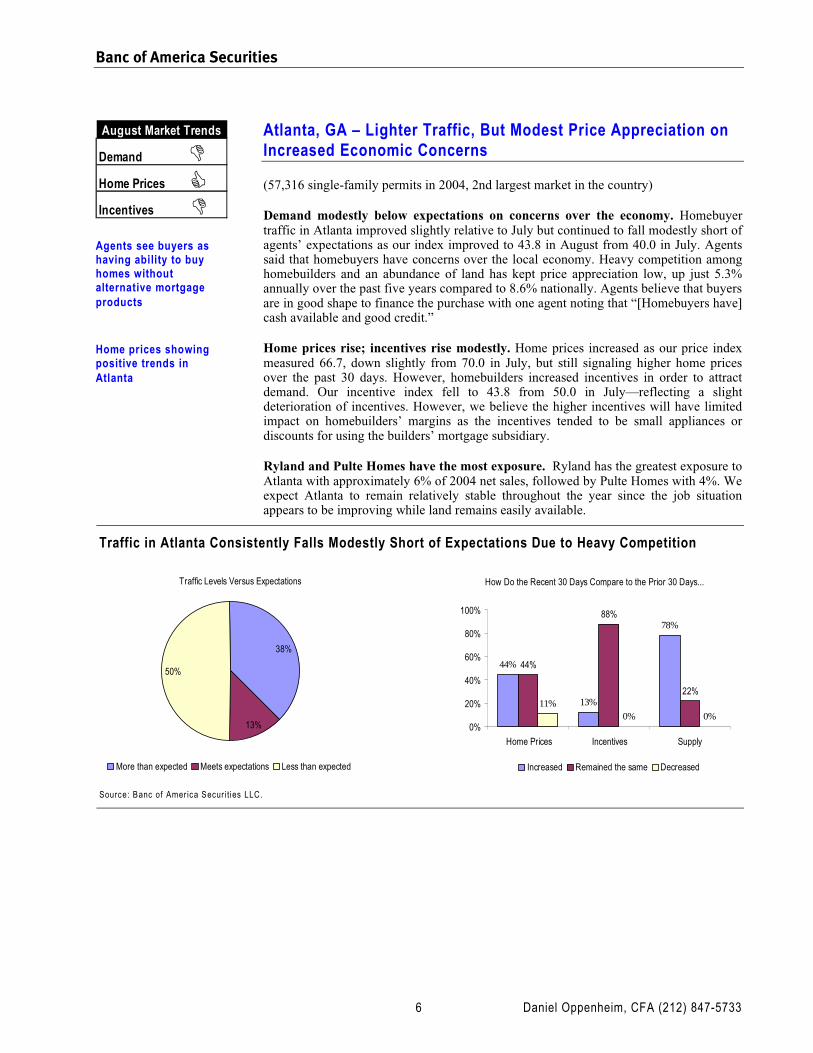
Atlanta, GA – Lighter Traffic, But Modest Price Appreciation on Increased Economic Concerns
(57,316 single-family permits in 2004, 2nd largest market in the country)
Demand modestly below expectations on concerns over the economy. Homebuyer traffic in Atlanta improved slightly relative to July but continued to fall modestly short of agents’ expectations as our index improved to 43.8 in August from 40.0 in July. Agents said that homebuyers have concerns over the local economy. Heavy competition among homebuilders and an abundance of land has kept price appreciation low, up just 5.3% annually over the past five years compared to 8.6% nationally. Agents believe that buyers are in good shape to finance the purchase with one agent noting that “[Homebuyers have] cash available and good credit.”
Home prices rise; incentives rise modestly. Home prices increased as our price index measured 66.7, down slightly from 70.0 in July, but still signaling higher home prices over the past 30 days. However, homebuilders increased incentives in order to attract demand. Our incentive index fell to 43.8 from 50.0 in July—reflecting a slight deterioration of incentives. However, we believe the higher incentives will have limited impact on homebuilders’ margins as the incentives tended to be small appliances or discounts for using the builders’ mortgage subsidiary.
Ryland and Pulte Homes have the most exposure. Ryland has the greatest exposure to Atlanta with approximately 6% of 2004 net sales, followed by Pulte Homes with 4%. We expect Atlanta to remain relatively stable throughout the year since the job situation appears to be improving while land remains easily available.
Traffic in Atlanta Consistently Falls Modestly Short of Expectations Due to Heavy Competition
Traffic Levels Versus Expectations
13%
50%
38%
More than expected Meets expectations Less than expected
How Do the Recent 30 Days Compare to the Prior 30 Days...
44%
13%
78%
44%
88%
22%11%
0% 0%0%
20%
40%
60%
80%
100%
Home Prices Incentives Supply
Increased Remained the same Decreased
Source: Banc of Amer ica Secur i t ies LLC.
Agents see buyers as having ability to buy homes without alternative mortgage products
Home prices showing positive trends in Atlanta
Demand
Home Prices
Incentives
August Market Trends
Banc of America Securities
Daniel Oppenheim, CFA (212) 847-5733 7
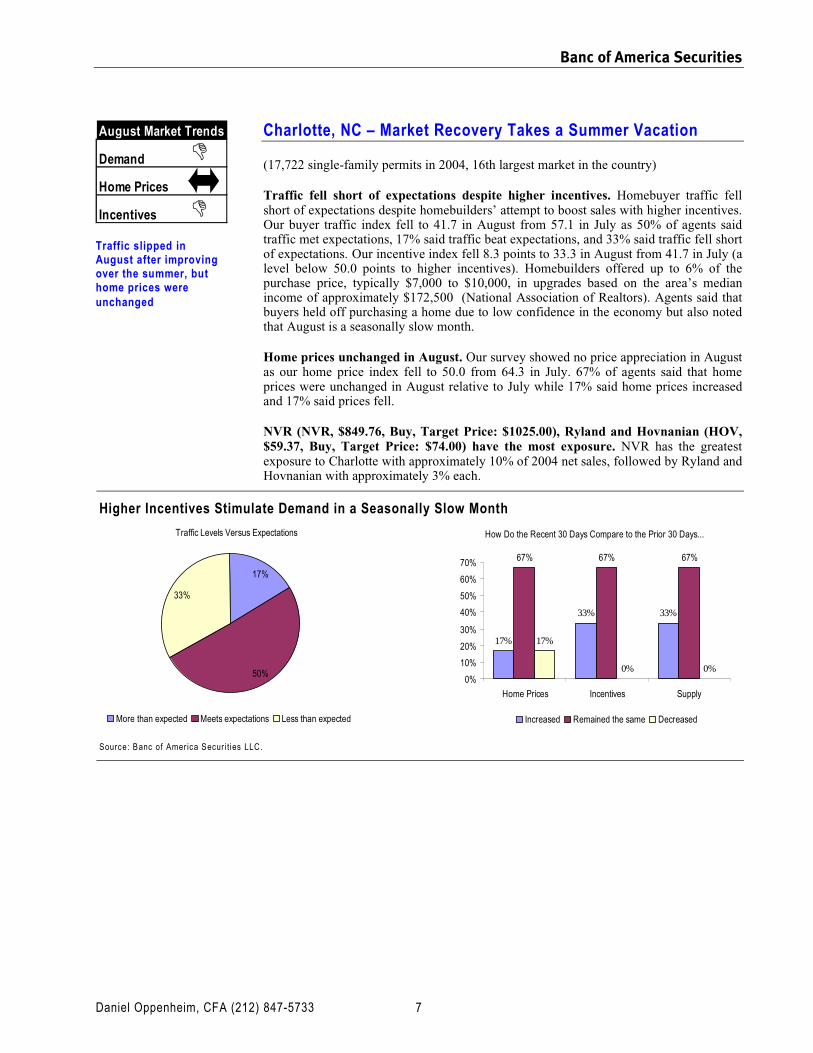
Charlotte, NC – Market Recovery Takes a Summer Vacation
(17,722 single-family permits in 2004, 16th largest market in the country)
Traffic fell short of expectations despite higher incentives. Homebuyer traffic fell short of expectations despite homebuilders’ attempt to boost sales with higher incentives. Our buyer traffic index fell to 41.7 in August from 57.1 in July as 50% of agents said traffic met expectations, 17% said traffic beat expectations, and 33% said traffic fell short of expectations. Our incentive index fell 8.3 points to 33.3 in August from 41.7 in July (a level below 50.0 points to higher incentives). Homebuilders offered up to 6% of the purchase price, typically $7,000 to $10,000, in upgrades based on the area’s median income of approximately $172,500 (National Association of Realtors). Agents said that buyers held off purchasing a home due to low confidence in the economy but also noted that August is a seasonally slow month.
Home prices unchanged in August. Our survey showed no price appreciation in August as our home price index fell to 50.0 from 64.3 in July. 67% of agents said that home prices were unchanged in August relative to July while 17% said home prices increased and 17% said prices fell.
NVR (NVR, $849.76, Buy, Target Price: $1025.00), Ryland and Hovnanian (HOV, $59.37, Buy, Target Price: $74.00) have the most exposure. NVR has the greatest exposure to Charlotte with approximately 10% of 2004 net sales, followed by Ryland and Hovnanian with approximately 3% each.
Higher Incentives Stimulate Demand in a Seasonally Slow Month
Traffic Levels Versus Expectations
50%
33%
17%
More than expected Meets expectations Less than expected
How Do the Recent 30 Days Compare to the Prior 30 Days...
17%
33% 33%
67% 67% 67%
17%
0% 0%0%
10%
20%
30%
40%
50%
60%
70%
Home Prices Incentives Supply
Increased Remained the same Decreased
Source: Banc of Amer ica Secur i t ies LLC.
Demand
Home Prices
Incentives
August Market Trends
Traffic slipped in August after improving over the summer, but home prices were unchanged

Banc of America Securities
Daniel Oppenheim, CFA (212) 847-5733 8
Chicago, IL – Home Prices Rise Modestly But Traffic Slows as Affordability Becomes Stretched
(35,810 single-family permits in 2004, 6th largest market in the country)
Stretched affordability impacting traffic. Buyer traffic fell short of agent’s expectations in August as our index decreased to 31.8 from 50.0 in July. Realtors attributed the lighted traffic to stretched affordability but also noted that summertime is a seasonally slow period. Housing costs represent 21.1% percent of the area’s median income, higher than at any previous time. In August, 45% of agents said that traffic met expectations, 9% said that it exceeded expectations and 45% said it fell short of expectations.
Home prices rose modestly. Home prices rose in August relative to July but responses from agents were mixed, suggesting only modest appreciation. Our index decreased 20.3 points to 68.2 from 88.5 in July as 45% of agents said that home prices increased, 45% said that home prices remained unchanged, and 9% said that home prices fell. Agents estimated that home prices increased approximately 1% on average over the past 30 days.
Ryland, Lennar (LEN, $61.58, Neutral, Target Price: $70.00) and Hovnanian have the most exposure. Ryland has the greatest exposure to Chicago with approximately 7% of 2004 net sales in the market, followed by Lennar Corp. with 4% of sales. We estimate Hovnanian will also derive approximately 4% of net sales from Chicago due to its recent acquisition of Town and Country Homes.
Agents Said that Home Prices Rose Modestly as Traffic Fell Short of Expectations
Traffic Levels Versus Expectations
45%
45%
9%
More than expected Meets expectations Less than expected
How Do the Recent 30 Days Compare to the Prior 30 Days...
45%40%
82%
45%
60%
18%9%
0% 0%0%
10%20%30%40%50%60%70%80%90%
Home Prices Incentives Supply
Increased Remained the same Decreased
Source: Banc of Amer ica Secur i t ies LLC.
Demand
Home Prices
Incentives
August Market Trends
Affordability has not been this stretched in the past in Chicago

Banc of America Securities
Daniel Oppenheim, CFA (212) 847-5733 9
Dallas, TX –In-Line with Expectations: Decent Traffic, Flat Prices
(45,908 single-family permits in 2004, 3rd largest market in the country)
Traffic meets expectations; incentives rise slightly. Homebuyer traffic met agents’ expectations with a typical back to school rush and warm weather in August. Traffic met expectations for 50% of agents, fell short of expectations for 25%, and exceeded expectations for 25%. Higher incentives further supported demand but agents noted examples of incentives that were only marginally higher than July’s level. Homebuilders offered $5,000 to $8,000 in upgrades and 2-5% in commissions according to agents. Our incentive index fell to 18.8 in August from 22.7 in July. This level of incentives is a function of the traditionally high incentives in Dallas with slightly deteriorating trends.
Home prices stay flat amid heavy competition. Home prices were flat in August relative to July with our home price index falling to 50.0 from 65.0. We believe price appreciation remains modest due to heavy competition among homebuilders as a result of the challenged economy, a plentiful supply of land, and a relatively short entitlement process. Price appreciation of 3% annually over the past 3 years in Dallas has lagged the 10% national average. 75% of agents said home prices did not change, 13% said home prices increased, while the remaining 13% said home prices declined. We expect home prices to remain essentially flat given the competitive market and ease of development.
Centex (CTX, $67.10, Neutral, Target Price: $76.00), Ryland and D.R. Horton have greatest exposure—D.R. Horton, Lennar and Standard Pacific can fare well given local reputation. Centex has the greatest exposure to Dallas, capturing 9% of its 2004 sales in the market, followed by Ryland and D.R. Horton with 8% each. We believe Dallas will remain a competitive market for the remainder of 2005 and that well-regarded companies such as D.R. Horton, Lennar, and Standard Pacific will be able to succeed, as these companies were most recommended by agents.
Home Prices Stay Flat Due to Heavy Competition Among Homebuilders
Traffic Levels Versus Expectations
50%
25%25%
More than expected Meets expectations Less than expected
How Do the Recent 30 Days Compare to the Prior 30 Days...
13%
75%
63%
75%
13%
38%
13% 13%
0%0%
10%
20%
30%
40%
50%
60%
70%
80%
Home Prices Incentives Supply
Increased Remained the same Decreased
Source: Banc of Amer ica Secur i t ies LLC.
Demand
Home Prices
Incentives
August Market Trends
Overbuilding continues to lead to flat prices and high (and rising) incentives

Banc of America Securities
Daniel Oppenheim, CFA (212) 847-5733 10
Denver, CO – Inventory Creeps Higher as Demand Continues to Disappoint
(18,533 single-family permits in 2004, 14th largest market in the country)
Inventory rises due to weaker-than-expected demand. Homebuyer traffic continued to disappoint agents due to Denver’s tepid economic recovery. In addition, agents said that the number of homes listed for sale increased as demand continues to remain sluggish. Our buyer traffic index fell to 30.8 in August from 37.5 in July, remaining within the range of disappointing levels recorded this year.
Home prices remain flat to modestly lower; incentives continue to rise. Home prices stayed flat to slightly lower in August, down less than 1% over the past 30 days according to agents. Our home price index fell to 42.3 in August from 55.0 in July as 85% of agents said that home prices remained the same and the remaining 15% said that home prices fell. In addition, homebuilders continue to increase incentives to help fuel soft demand and sell off excess speculative inventory.
MDC Holdings (MDC, $75.32, Neutral, Target Price: $82.00) and D.R. Horton have greatest exposure. MDC Holdings has the greatest exposure to Denver with approximately 12% of 2004 sales, followed by D.R. Horton, with approximately 6% of 2004 sales.
Homebuilders Increased Incentives, Especially on Speculative Homes, as Inventory Rises
Traffic Levels Versus Expectations
62%
38%
0%
More than expected Meets expectations Less than expected
How Do the Recent 30 Days Compare to the Prior 30 Days...
0%
50% 45%
85%
40%
55%
15%10%
0%0%
10%20%30%40%50%60%70%80%90%
Home Prices Incentives Supply
Increased Remained the same Decreased
Source: Banc of Amer ica Secur i t ies LLC.
Demand
Home Prices
Incentives
August Market Trends
The Denver housing market remains challenged

Banc of America Securities
Daniel Oppenheim, CFA (212) 847-5733 11
Detroit, MI – Inventory Continues to Build on Weak Demand
(17,399 single-family permits in 2004, 18th largest market in the country)
Auto industry layoffs continue to drive disappointing demand. Homebuyer traffic remains well below agents’ expectations due primarily to layoffs in the auto industry and a weak economy. Our traffic index remained the second worst level among the 20 largest markets at 13.6 in August, up from 10.0 in July. We expect ongoing problems among the large employers to continue to negatively impact housing demand.
Home prices and incentives worsen due to higher inventory and weak demand. Home prices and incentives worsened in August relative to July due to higher inventory as a result of prolonged soft demand. Our home price index stayed flat at 30.0 in August from 30.0 in July, suggesting that prices fell in both months. 50% of agents said that home prices fell, 40% said that prices remained unchanged, and the remaining 10% said that home prices increased. Our incentive index worsened to 11.1 in August from 16.7 in July, indicating rising incentives. We expect incentives to continue to increase as a higher inventory of both newly built and existing homes drives price competition.
Toll Brothers and Pulte Homes have the most exposure to Detroit with approximately 5% and 4%, respectively, of their 2004 unit sales.
Incentives and Home Prices Worsen as Demand Continues to Disappoint and Inventory Rises
Traffic Levels Versus Expectations
9%
9%
82%
More than expected Meets expectations Less than expected
How Do the Recent 30 Days Compare to the Prior 30 Days...
10%
78%
40%40%
22%
60%50%
0% 0%0%
10%20%30%40%50%60%70%80%90%
Home Prices Incentives Supply
Increased Remained the same Decreased
Source: Banc of Amer ica Secur i t ies LLC.
Demand
Home Prices
Incentives
August Market Trends
Housing demand follows jobs – and it looks grim in Detroit
Banc of America Securities
Daniel Oppenheim, CFA (212) 847-5733 12
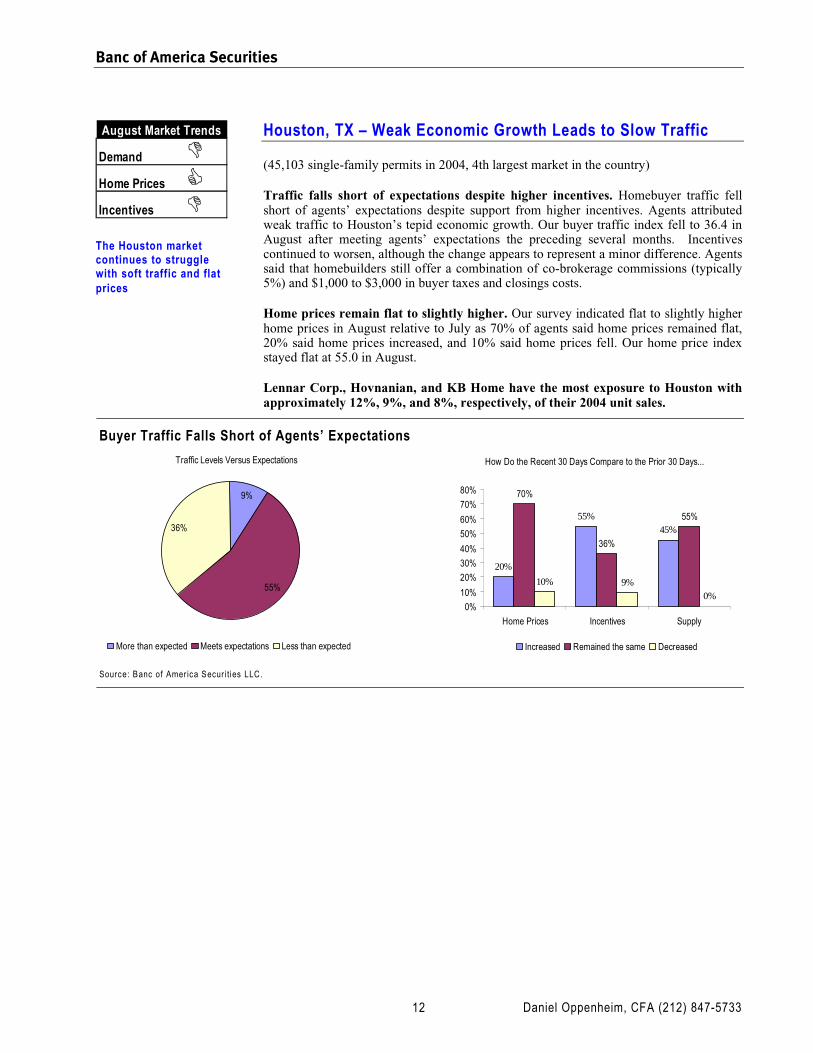
Houston, TX – Weak Economic Growth Leads to Slow Traffic
(45,103 single-family permits in 2004, 4th largest market in the country)
Traffic falls short of expectations despite higher incentives. Homebuyer traffic fell short of agents’ expectations despite support from higher incentives. Agents attributed weak traffic to Houston’s tepid economic growth. Our buyer traffic index fell to 36.4 in August after meeting agents’ expectations the preceding several months. Incentives continued to worsen, although the change appears to represent a minor difference. Agents said that homebuilders still offer a combination of co-brokerage commissions (typically 5%) and $1,000 to $3,000 in buyer taxes and closings costs.
Home prices remain flat to slightly higher. Our survey indicated flat to slightly higher home prices in August relative to July as 70% of agents said home prices remained flat, 20% said home prices increased, and 10% said home prices fell. Our home price index stayed flat at 55.0 in August.
Lennar Corp., Hovnanian, and KB Home have the most exposure to Houston with approximately 12%, 9%, and 8%, respectively, of their 2004 unit sales.
Buyer Traffic Falls Short of Agents’ Expectations
Traffic Levels Versus Expectations
55%
36%
9%
More than expected Meets expectations Less than expected
How Do the Recent 30 Days Compare to the Prior 30 Days...
20%
55%45%
70%
36%
55%
10% 9%0%
0%
10%
20%
30%
40%
50%
60%
70%
80%
Home Prices Incentives Supply
Increased Remained the same Decreased
Source: Banc of Amer ica Secur i t ies LLC.
Demand
Home Prices
Incentives
August Market Trends
The Houston market continues to struggle with soft traffic and flat prices

Banc of America Securities
Daniel Oppenheim, CFA (212) 847-5733 13
Las Vegas, NV –Traffic Rebounds; Prices Moving Up Once Again
(31,741 single-family permits in 2004, 7th largest market in the country)
Buyer traffic meets agents’ expectations as demand improves. Homebuyer traffic met agents’ expectations in August as demand rebounded from a soft patch in July. Our buyer traffic index rose 25.2 points to 46.7 from 21.4 in July. Agents said that affordability has become more reasonable given the recent modest price appreciation but continue to cite excess inventory levels and overpriced listings. We expect demand to continue to improve as strong job growth and favorable population trends work off excess inventory.
Price appreciation reaccelerates on pick-up in demand. Home prices in Las Vegas increased in August relative to July as demand rebounded in-line with expectations. Our home price index rose 10.0 points to 60.0 from 50.0 in July. 40% of agents said that home prices increased, 40% said that home prices remained unchanged, and the remaining 20% said home prices fell.
KB Home and Pulte have most exposure to Vegas. KB Home has the greatest exposure to Las Vegas with 11% of 2004 net sales, followed by Pulte with 7%.
Home Prices Rise While Incentives Worsen as Demand Improves
Traffic Levels Versus Expectations
53%
20%27%
More than expected Meets expectations Less than expected
How Do the Recent 30 Days Compare to the Prior 30 Days...
40%47%
53%
40%47%
40%
20%
7% 7%
0%
10%
20%
30%
40%
50%
60%
Home Prices Incentives Supply
Increased Remained the same Decreased
Source: Banc of Amer ica Secur i t ies LLC.
Demand
Home Prices
Incentives
August Market Trends
Traffic returns to Vegas after brief slowing in July
Banc of America Securities
Daniel Oppenheim, CFA (212) 847-5733 14
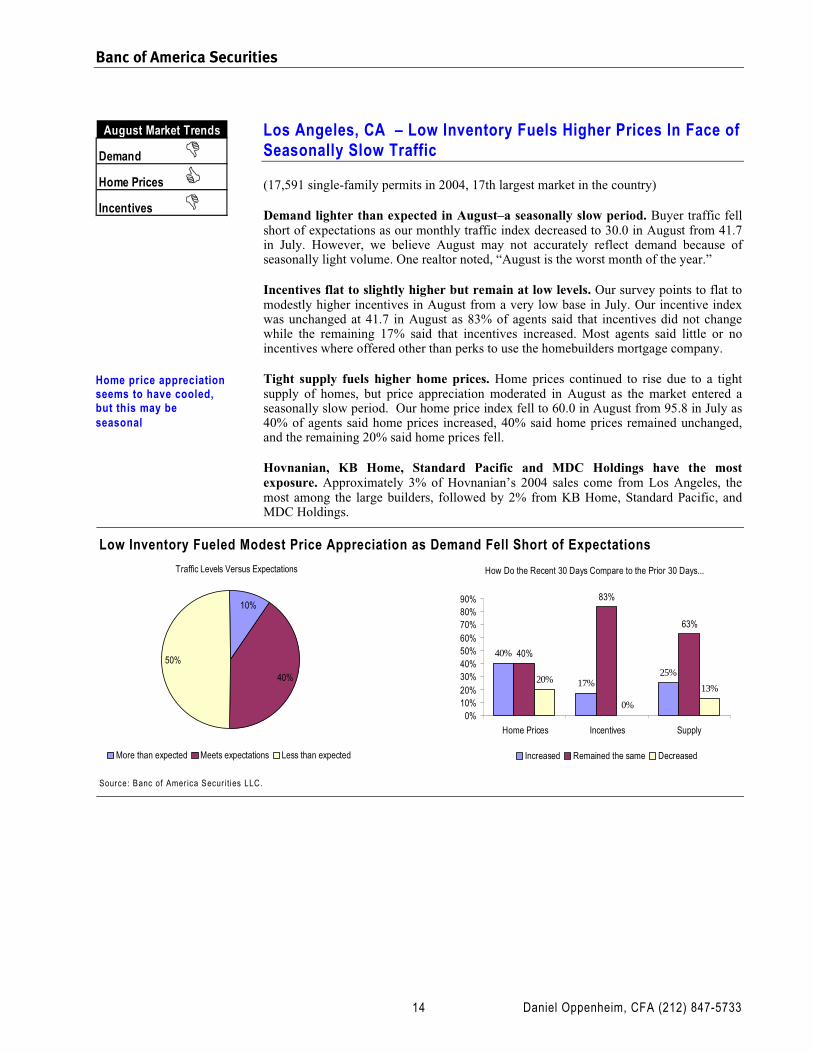
Los Angeles, CA – Low Inventory Fuels Higher Prices In Face of Seasonally Slow Traffic
(17,591 single-family permits in 2004, 17th largest market in the country)
Demand lighter than expected in August–a seasonally slow period. Buyer traffic fell short of expectations as our monthly traffic index decreased to 30.0 in August from 41.7 in July. However, we believe August may not accurately reflect demand because of seasonally light volume. One realtor noted, “August is the worst month of the year.”
Incentives flat to slightly higher but remain at low levels. Our survey points to flat to modestly higher incentives in August from a very low base in July. Our incentive index was unchanged at 41.7 in August as 83% of agents said that incentives did not change while the remaining 17% said that incentives increased. Most agents said little or no incentives where offered other than perks to use the homebuilders mortgage company.
Tight supply fuels higher home prices. Home prices continued to rise due to a tight supply of homes, but price appreciation moderated in August as the market entered a seasonally slow period. Our home price index fell to 60.0 in August from 95.8 in July as 40% of agents said home prices increased, 40% said home prices remained unchanged, and the remaining 20% said home prices fell.
Hovnanian, KB Home, Standard Pacific and MDC Holdings have the most exposure. Approximately 3% of Hovnanian’s 2004 sales come from Los Angeles, the most among the large builders, followed by 2% from KB Home, Standard Pacific, and MDC Holdings.
Low Inventory Fueled Modest Price Appreciation as Demand Fell Short of Expectations
Traffic Levels Versus Expectations
40%
50%
10%
More than expected Meets expectations Less than expected
How Do the Recent 30 Days Compare to the Prior 30 Days...
40%
17%25%
40%
83%
63%
20%
0%
13%
0%10%20%30%40%50%60%70%80%90%
Home Prices Incentives Supply
Increased Remained the same Decreased
Source: Banc of Amer ica Secur i t ies LLC.
Demand
Home Prices
Incentives
August Market Trends
Home price appreciation seems to have cooled, but this may be seasonal
Banc of America Securities
Daniel Oppenheim, CFA (212) 847-5733 15
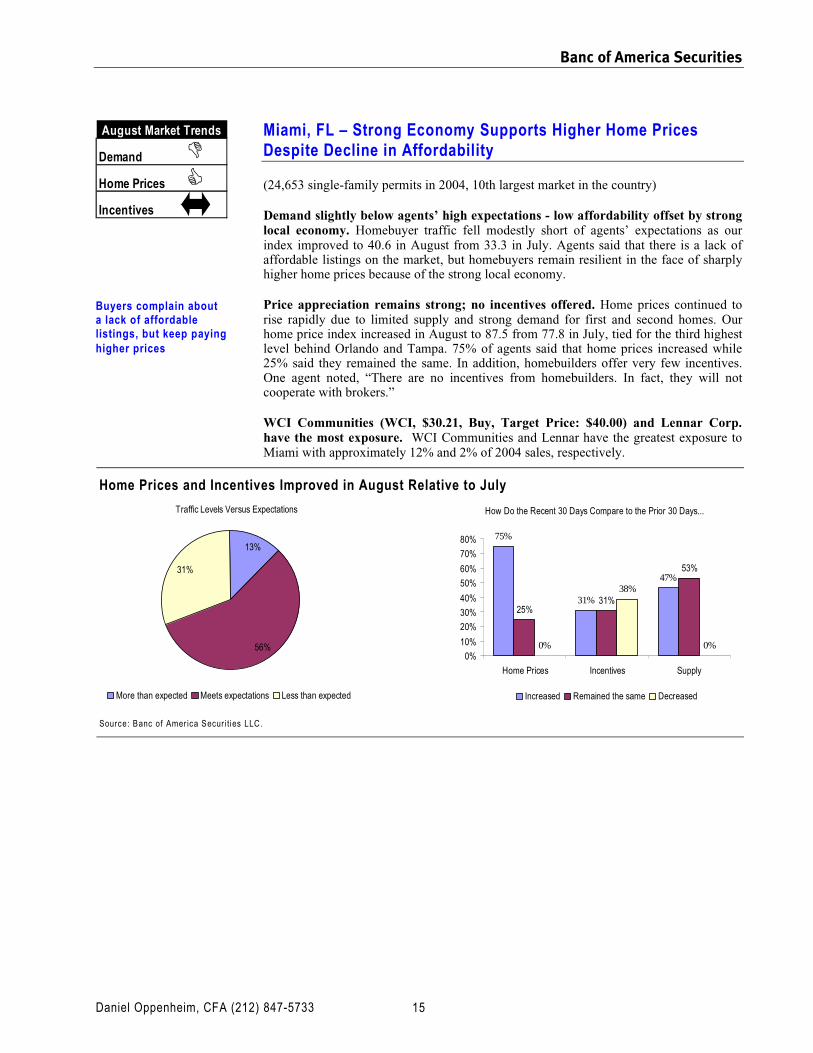
Miami, FL – Strong Economy Supports Higher Home Prices Despite Decline in Affordability
(24,653 single-family permits in 2004, 10th largest market in the country)
Demand slightly below agents’ high expectations - low affordability offset by strong local economy. Homebuyer traffic fell modestly short of agents’ expectations as our index improved to 40.6 in August from 33.3 in July. Agents said that there is a lack of affordable listings on the market, but homebuyers remain resilient in the face of sharply higher home prices because of the strong local economy.
Price appreciation remains strong; no incentives offered. Home prices continued to rise rapidly due to limited supply and strong demand for first and second homes. Our home price index increased in August to 87.5 from 77.8 in July, tied for the third highest level behind Orlando and Tampa. 75% of agents said that home prices increased while 25% said they remained the same. In addition, homebuilders offer very few incentives. One agent noted, “There are no incentives from homebuilders. In fact, they will not cooperate with brokers.”
WCI Communities (WCI, $30.21, Buy, Target Price: $40.00) and Lennar Corp. have the most exposure. WCI Communities and Lennar have the greatest exposure to Miami with approximately 12% and 2% of 2004 sales, respectively.
Home Prices and Incentives Improved in August Relative to July
Traffic Levels Versus Expectations
56%
13%
31%
More than expected Meets expectations Less than expected
How Do the Recent 30 Days Compare to the Prior 30 Days...
75%
31%
47%
25%31%
53%
0%
38%
0%0%
10%
20%
30%
40%
50%
60%
70%
80%
Home Prices Incentives Supply
Increased Remained the same Decreased
Source: Banc of Amer ica Secur i t ies LLC.
Demand
Home Prices
Incentives
August Market Trends
Buyers complain about a lack of affordable listings, but keep paying higher prices

Banc of America Securities
Daniel Oppenheim, CFA (212) 847-5733 16
Minneapolis, MN – Worries Amid Northwest Strike Lead to Soft Housing Demand
(20,212 single-family permits in 2004, 12th largest market in the country)
Demand disappoints due to job uncertainty related to Northwest strike. Homebuyer traffic disappointed each and every real estate agent we surveyed, many of whom attributed the weak traffic to fear of potential job losses surrounding the job strike at Minnesota-based Northwest Airlines. We expect demand in Minneapolis to remain weak in the near term, as we believe a positive outlook for job growth is necessary to bring about better demand and higher home prices.
Home prices decline as buyers can’t be found. Weaker-than-expected traffic and a large inventory of homes drove home prices lower in August relative to July. The area’s home price index fell to 37.5 from 43.8 in July—the second-worst reading behind Detroit, which is plagued by its reliance on the auto manufacturers. Several realtors commented on a buildup in inventory while another said, “Homebuyers can really pick and choose what they want.”
Ryland, D.R. Horton, Centex, and Lennar have the greatest exposure. Ryland has the greatest exposure to Minneapolis with approximately 4% of 2004 net sales, followed by D.R. Horton, Centex and Lennar with 3% each.
Weaker than Expected Traffic and Excess Supply Negatively Pressured Home Prices
Traffic Levels Versus Expectations
0%
100%
0%
More than expected Meets expectations Less than expected
How Do the Recent 30 Days Compare to the Prior 30 Days...
0%
60%
40%
60%
40%
60%
40%
0% 0%0%
10%
20%
30%
40%
50%
60%
70%
Home Prices Incentives Supply
Increased Remained the same Decreased
Source: Banc of Amer ica Secur i t ies LLC.
Demand
Home Prices
Incentives
August Market Trends
Fears over job losses with Northwest lead to a sharp decline in traffic and lower home prices
Banc of America Securities
Daniel Oppenheim, CFA (212) 847-5733 17
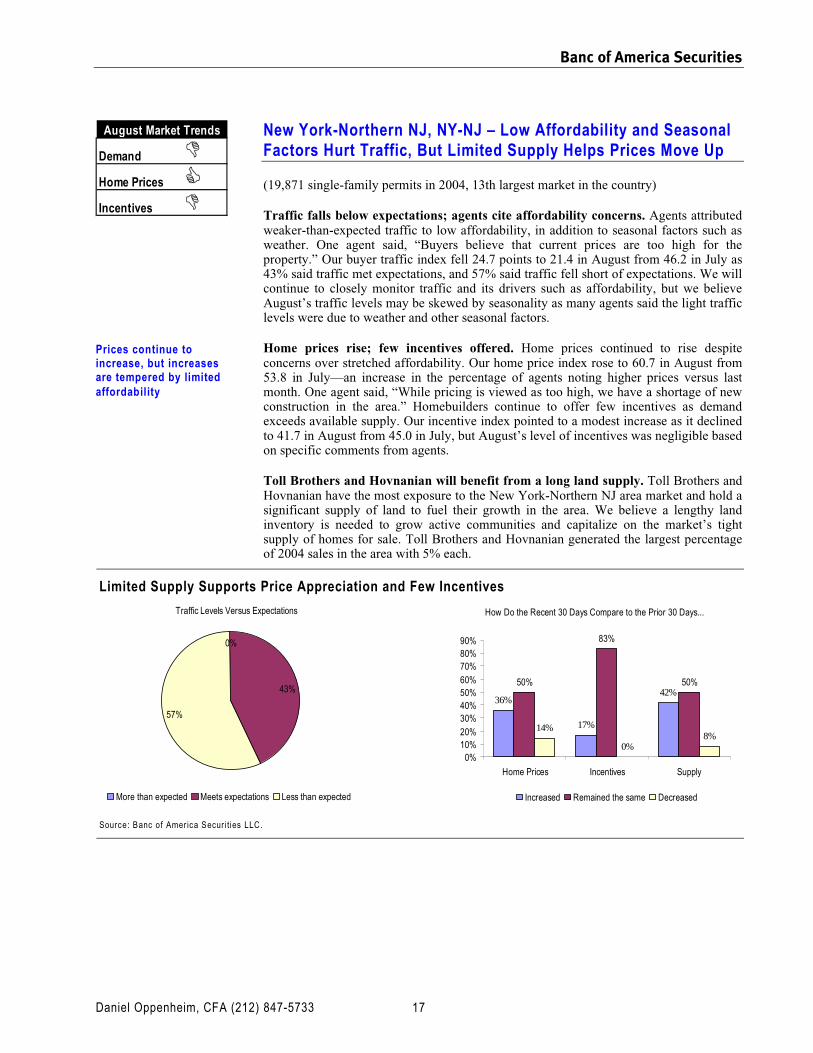
New York-Northern NJ, NY-NJ – Low Affordability and Seasonal Factors Hurt Traffic, But Limited Supply Helps Prices Move Up
(19,871 single-family permits in 2004, 13th largest market in the country)
Traffic falls below expectations; agents cite affordability concerns. Agents attributed weaker-than-expected traffic to low affordability, in addition to seasonal factors such as weather. One agent said, “Buyers believe that current prices are too high for the property.” Our buyer traffic index fell 24.7 points to 21.4 in August from 46.2 in July as 43% said traffic met expectations, and 57% said traffic fell short of expectations. We will continue to closely monitor traffic and its drivers such as affordability, but we believe August’s traffic levels may be skewed by seasonality as many agents said the light traffic levels were due to weather and other seasonal factors.
Home prices rise; few incentives offered. Home prices continued to rise despite concerns over stretched affordability. Our home price index rose to 60.7 in August from 53.8 in July—an increase in the percentage of agents noting higher prices versus last month. One agent said, “While pricing is viewed as too high, we have a shortage of new construction in the area.” Homebuilders continue to offer few incentives as demand exceeds available supply. Our incentive index pointed to a modest increase as it declined to 41.7 in August from 45.0 in July, but August’s level of incentives was negligible based on specific comments from agents.
Toll Brothers and Hovnanian will benefit from a long land supply. Toll Brothers and Hovnanian have the most exposure to the New York-Northern NJ area market and hold a significant supply of land to fuel their growth in the area. We believe a lengthy land inventory is needed to grow active communities and capitalize on the market’s tight supply of homes for sale. Toll Brothers and Hovnanian generated the largest percentage of 2004 sales in the area with 5% each.
Limited Supply Supports Price Appreciation and Few Incentives
Traffic Levels Versus Expectations
43%
0%
57%
More than expected Meets expectations Less than expected
How Do the Recent 30 Days Compare to the Prior 30 Days...
36%
17%
42%50%
83%
50%
14%
0%8%
0%10%20%30%40%50%60%70%80%90%
Home Prices Incentives Supply
Increased Remained the same Decreased
Source: Banc of Amer ica Secur i t ies LLC.
Demand
Home Prices
Incentives
August Market Trends
Prices continue to increase, but increases are tempered by limited affordability

Banc of America Securities
Daniel Oppenheim, CFA (212) 847-5733 18
Orlando, FL – Demand Continues to Overwhelm Supply
(27,493 single-family permits in 2004, 8th largest market in the country)
Traffic exceeded expectations once again on strength in both the primary and second home market. Buyer traffic continued to exceed agents’ expectations, even as our traffic index fell to 58.3 in August from 65.4 in July. Orlando recorded the second highest traffic reading among the top 20 markets, trailing only Tampa. 17% of agents said that demand exceeded their expectations, and met expectations for the remaining 83%.
Limited supply and frenzied demand drove home prices higher. Home prices continued their rapid ascent, as demand continues to overwhelm available supply. Orlando’s home price index recorded the second highest level among top 20 markets at 91.7, behind only Tampa, and essentially unchanged from 92.3 in July. Rapidly rising prices should contribute to further margin expansion for homebuilders. We believe strong demand for both primary and second homes will continue to push home prices higher.
Few incentives seen; homebuilders decreased commissions paid to agents. Incentives decreased in August as our index increased to 80.0 from 66.7 in July. Homebuilders overall are offering very few incentives as lottery systems and waitlists are typical to select homebuyers out of an overwhelming buyer pool. In addition, many homebuilders have moved to a flat fee commission system to reduce the percentage of the purchase price directed to real estate agents amid significant price appreciation.
Ryland, KB Home, and Lennar will continue to benefit the most from market’s strength. Ryland has the largest percent of sales from Orlando at approximately 6%, followed by KB Home and Lennar with 4% each. We also expect Hovnanian to rapidly increase exposure to Orlando following its recent acquisition of Cambridge Homes.
Orlando Recorded the 2nd Highest Traffic and Home Price Index Among Top 20 Markets
Traffic Levels Versus Expectations
83%
17%0%
More than expected Meets expectations Less than expected
How Do the Recent 30 Days Compare to the Prior 30 Days...
83%
20%
33%
17%
0%
50%
0%
80%
17%
0%10%20%30%40%50%60%70%80%90%
Home Prices Incentives Supply
Increased Remained the same Decreased
Source: Banc of Amer ica Secur i t ies LLC.
Demand
Home Prices
Incentives
August Market Trends
Absolutely no slowing of Orlando’s hot market in August
Banc of America Securities
Daniel Oppenheim, CFA (212) 847-5733 19
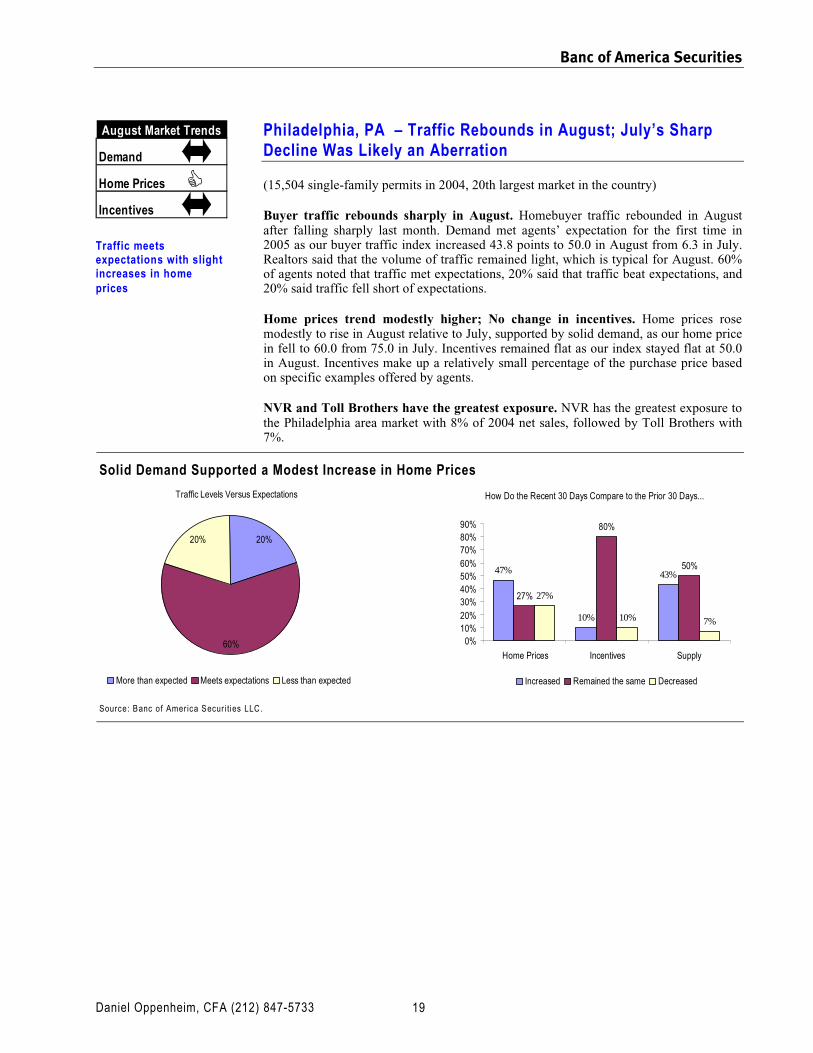
Philadelphia, PA – Traffic Rebounds in August; July’s Sharp Decline Was Likely an Aberration
(15,504 single-family permits in 2004, 20th largest market in the country)
Buyer traffic rebounds sharply in August. Homebuyer traffic rebounded in August after falling sharply last month. Demand met agents’ expectation for the first time in 2005 as our buyer traffic index increased 43.8 points to 50.0 in August from 6.3 in July. Realtors said that the volume of traffic remained light, which is typical for August. 60% of agents noted that traffic met expectations, 20% said that traffic beat expectations, and 20% said traffic fell short of expectations.
Home prices trend modestly higher; No change in incentives. Home prices rose modestly to rise in August relative to July, supported by solid demand, as our home price in fell to 60.0 from 75.0 in July. Incentives remained flat as our index stayed flat at 50.0 in August. Incentives make up a relatively small percentage of the purchase price based on specific examples offered by agents.
NVR and Toll Brothers have the greatest exposure. NVR has the greatest exposure to the Philadelphia area market with 8% of 2004 net sales, followed by Toll Brothers with 7%.
Solid Demand Supported a Modest Increase in Home Prices
Traffic Levels Versus Expectations
60%
20%20%
More than expected Meets expectations Less than expected
How Do the Recent 30 Days Compare to the Prior 30 Days...
47%
10%
43%
27%
80%
50%
27%
10% 7%
0%10%20%30%40%50%60%70%80%90%
Home Prices Incentives Supply
Increased Remained the same Decreased
Source: Banc of Amer ica Secur i t ies LLC.
Demand
Home Prices
Incentives
August Market Trends
Traffic meets expectations with slight increases in home prices
Banc of America Securities
Daniel Oppenheim, CFA (212) 847-5733 20
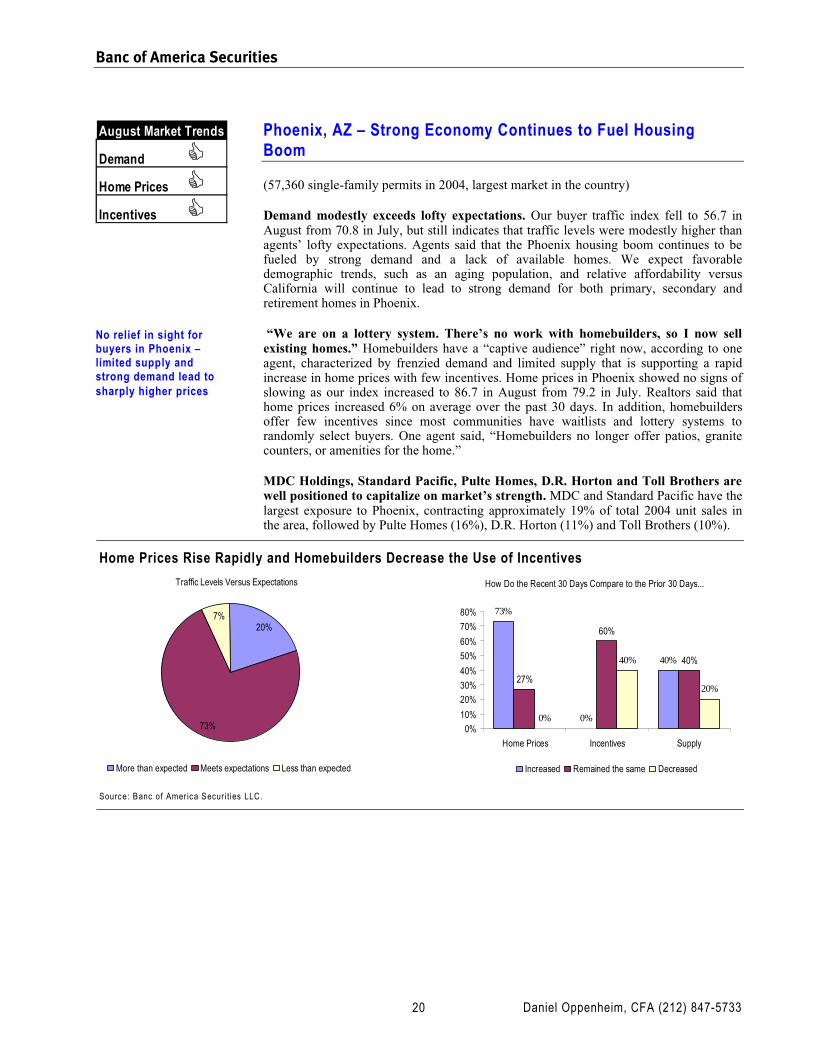
Phoenix, AZ – Strong Economy Continues to Fuel Housing Boom
(57,360 single-family permits in 2004, largest market in the country)
Demand modestly exceeds lofty expectations. Our buyer traffic index fell to 56.7 in August from 70.8 in July, but still indicates that traffic levels were modestly higher than agents’ lofty expectations. Agents said that the Phoenix housing boom continues to be fueled by strong demand and a lack of available homes. We expect favorable demographic trends, such as an aging population, and relative affordability versus California will continue to lead to strong demand for both primary, secondary and retirement homes in Phoenix.
“We are on a lottery system. There’s no work with homebuilders, so I now sell existing homes.” Homebuilders have a “captive audience” right now, according to one agent, characterized by frenzied demand and limited supply that is supporting a rapid increase in home prices with few incentives. Home prices in Phoenix showed no signs of slowing as our index increased to 86.7 in August from 79.2 in July. Realtors said that home prices increased 6% on average over the past 30 days. In addition, homebuilders offer few incentives since most communities have waitlists and lottery systems to randomly select buyers. One agent said, “Homebuilders no longer offer patios, granite counters, or amenities for the home.”
MDC Holdings, Standard Pacific, Pulte Homes, D.R. Horton and Toll Brothers are well positioned to capitalize on market’s strength. MDC and Standard Pacific have the largest exposure to Phoenix, contracting approximately 19% of total 2004 unit sales in the area, followed by Pulte Homes (16%), D.R. Horton (11%) and Toll Brothers (10%).
Home Prices Rise Rapidly and Homebuilders Decrease the Use of Incentives
Traffic Levels Versus Expectations
73%
7%20%
More than expected Meets expectations Less than expected
How Do the Recent 30 Days Compare to the Prior 30 Days...
73%
0%
40%
27%
60%
40%
0%
40%
20%
0%
10%
20%
30%
40%
50%
60%
70%
80%
Home Prices Incentives Supply
Increased Remained the same Decreased
Source: Banc of Amer ica Secur i t ies LLC.
Demand
Home Prices
Incentives
August Market Trends
No relief in sight for buyers in Phoenix – limited supply and strong demand lead to sharply higher prices
Banc of America Securities
Daniel Oppenheim, CFA (212) 847-5733 21
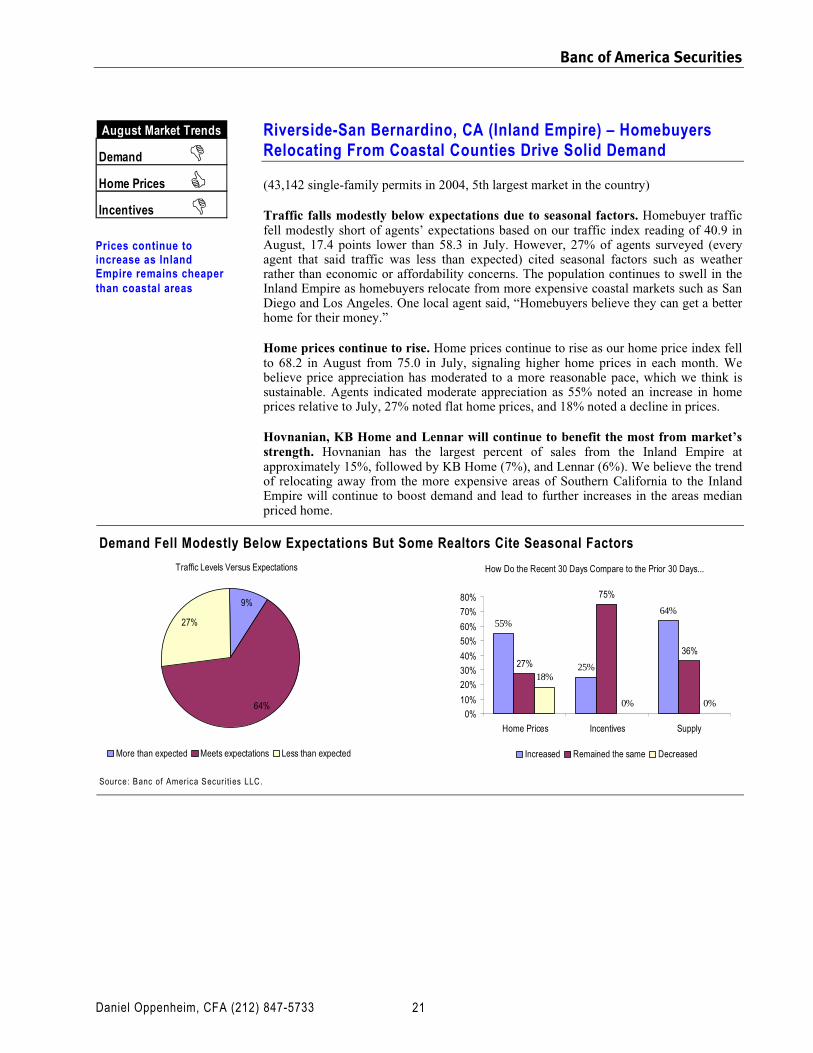
Riverside-San Bernardino, CA (Inland Empire) – Homebuyers Relocating From Coastal Counties Drive Solid Demand
(43,142 single-family permits in 2004, 5th largest market in the country)
Traffic falls modestly below expectations due to seasonal factors. Homebuyer traffic fell modestly short of agents’ expectations based on our traffic index reading of 40.9 in August, 17.4 points lower than 58.3 in July. However, 27% of agents surveyed (every agent that said traffic was less than expected) cited seasonal factors such as weather rather than economic or affordability concerns. The population continues to swell in the Inland Empire as homebuyers relocate from more expensive coastal markets such as San Diego and Los Angeles. One local agent said, “Homebuyers believe they can get a better home for their money.”
Home prices continue to rise. Home prices continue to rise as our home price index fell to 68.2 in August from 75.0 in July, signaling higher home prices in each month. We believe price appreciation has moderated to a more reasonable pace, which we think is sustainable. Agents indicated moderate appreciation as 55% noted an increase in home prices relative to July, 27% noted flat home prices, and 18% noted a decline in prices.
Hovnanian, KB Home and Lennar will continue to benefit the most from market’s strength. Hovnanian has the largest percent of sales from the Inland Empire at approximately 15%, followed by KB Home (7%), and Lennar (6%). We believe the trend of relocating away from the more expensive areas of Southern California to the Inland Empire will continue to boost demand and lead to further increases in the areas median priced home.
Demand Fell Modestly Below Expectations But Some Realtors Cite Seasonal Factors
Traffic Levels Versus Expectations
64%
9%
27%
More than expected Meets expectations Less than expected
How Do the Recent 30 Days Compare to the Prior 30 Days...
55%
25%
64%
27%
75%
36%
18%
0% 0%0%
10%
20%
30%
40%
50%
60%
70%
80%
Home Prices Incentives Supply
Increased Remained the same Decreased
Source: Banc of Amer ica Secur i t ies LLC.
Demand
Home Prices
Incentives
August Market Trends
Prices continue to increase as Inland Empire remains cheaper than coastal areas

Banc of America Securities
Daniel Oppenheim, CFA (212) 847-5733 22
Sacramento, CA – Traffic Falls Due to a Lack of Inventory and Affordability Concerns
(18,523 single-family permits in 2004, 15th largest market in the country)
Traffic falls short of expectations due to limited supply—demand still strong. Buyer traffic in Sacramento remained far below agents’ expectations due to a limited supply of homes for sale, which is a positive for homebuilders in our view. Agents said that demand remained strong even though homebuyers expressed increased concern over affordability. One agent noted, “There are waiting lists of home buyers.” Our buyer traffic index reflected a lack of supply rather than weak demand as it increased to 25.0 in August from 22.2 in July.
Home prices flat to slightly lower relative to July. Home prices in Sacramento remained flat to slightly lower likely due to the recent sharp decline in affordability. Sacramento’s home price index fell to 41.7 in August from 55.0 in July, as 17% of agents that said home prices increased, 50% that said home prices remained the same, and 33% that said home prices fell.
Lennar, KB Home, Pulte Homes, Standard Pacific Homes, and MDC Holdings have the greatest exposure. Lennar has the greatest exposure with approximately 4% of 2004 sales, followed by KB Home, Pulte Homes, Standard Pacific Homes, and MDC Holdings each with approximately 3% of net sales.
Agents Said that A Lack of Inventory Led to Lower than Expected Traffic Levels
Traffic Levels Versus Expectations
50%50%
0%
More than expected Meets expectations Less than expected
How Do the Recent 30 Days Compare to the Prior 30 Days...
17% 20% 17%
50%
80%
50%
33%
0%
33%
0%10%20%30%40%50%60%70%80%90%
Home Prices Incentives Supply
Increased Remained the same Decreased
Source: Banc of Amer ica Secur i t ies LLC.
Demand
Home Prices
Incentives
August Market Trends
Stretched affordability may lead to a brief pause in the Sacramento market
Banc of America Securities
Daniel Oppenheim, CFA (212) 847-5733 23
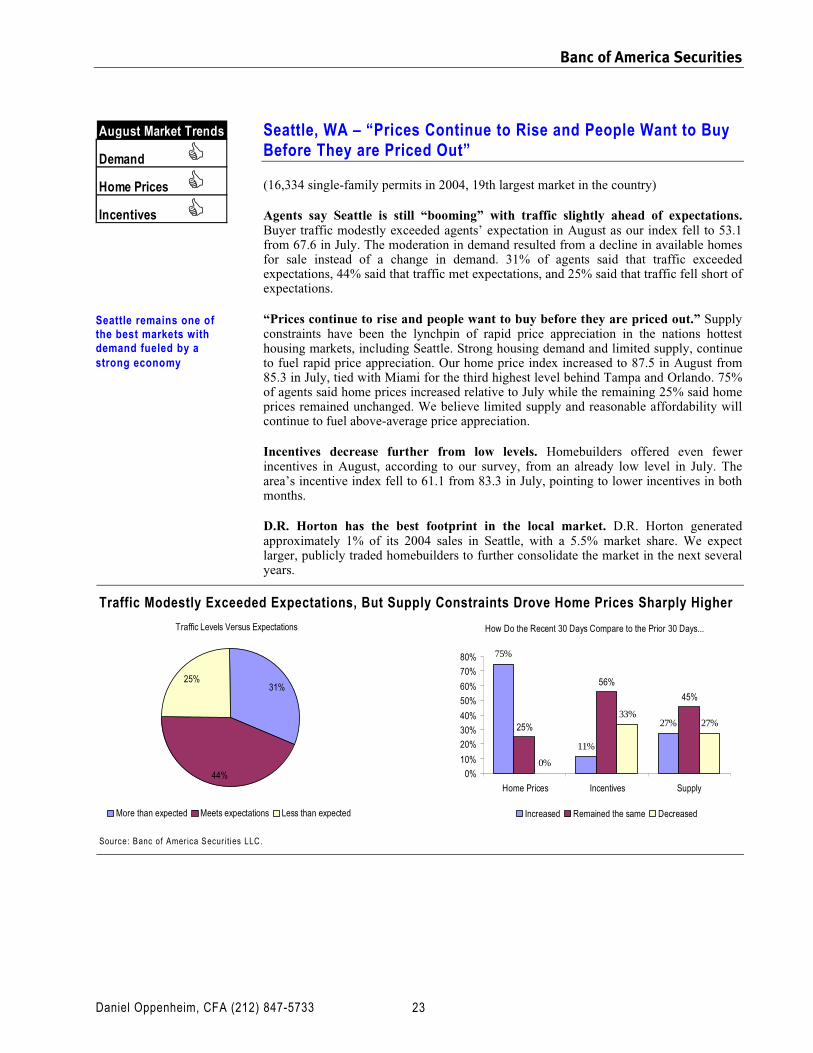
Seattle, WA – “Prices Continue to Rise and People Want to Buy Before They are Priced Out”
(16,334 single-family permits in 2004, 19th largest market in the country)
Agents say Seattle is still “booming” with traffic slightly ahead of expectations. Buyer traffic modestly exceeded agents’ expectation in August as our index fell to 53.1 from 67.6 in July. The moderation in demand resulted from a decline in available homes for sale instead of a change in demand. 31% of agents said that traffic exceeded expectations, 44% said that traffic met expectations, and 25% said that traffic fell short of expectations.
“Prices continue to rise and people want to buy before they are priced out.” Supply constraints have been the lynchpin of rapid price appreciation in the nations hottest housing markets, including Seattle. Strong housing demand and limited supply, continue to fuel rapid price appreciation. Our home price index increased to 87.5 in August from 85.3 in July, tied with Miami for the third highest level behind Tampa and Orlando. 75% of agents said home prices increased relative to July while the remaining 25% said home prices remained unchanged. We believe limited supply and reasonable affordability will continue to fuel above-average price appreciation.
Incentives decrease further from low levels. Homebuilders offered even fewer incentives in August, according to our survey, from an already low level in July. The area’s incentive index fell to 61.1 from 83.3 in July, pointing to lower incentives in both months.
D.R. Horton has the best footprint in the local market. D.R. Horton generated approximately 1% of its 2004 sales in Seattle, with a 5.5% market share. We expect larger, publicly traded homebuilders to further consolidate the market in the next several years.
Traffic Modestly Exceeded Expectations, But Supply Constraints Drove Home Prices Sharply Higher
Traffic Levels Versus Expectations
44%
31%25%
More than expected Meets expectations Less than expected
How Do the Recent 30 Days Compare to the Prior 30 Days...
75%
11%
27%25%
56%
45%
0%
33%27%
0%
10%
20%
30%
40%
50%
60%
70%
80%
Home Prices Incentives Supply
Increased Remained the same Decreased
Source: Banc of Amer ica Secur i t ies LLC.
Demand
Home Prices
Incentives
August Market Trends
Seattle remains one of the best markets with demand fueled by a strong economy
Banc of America Securities
Daniel Oppenheim, CFA (212) 847-5733 24
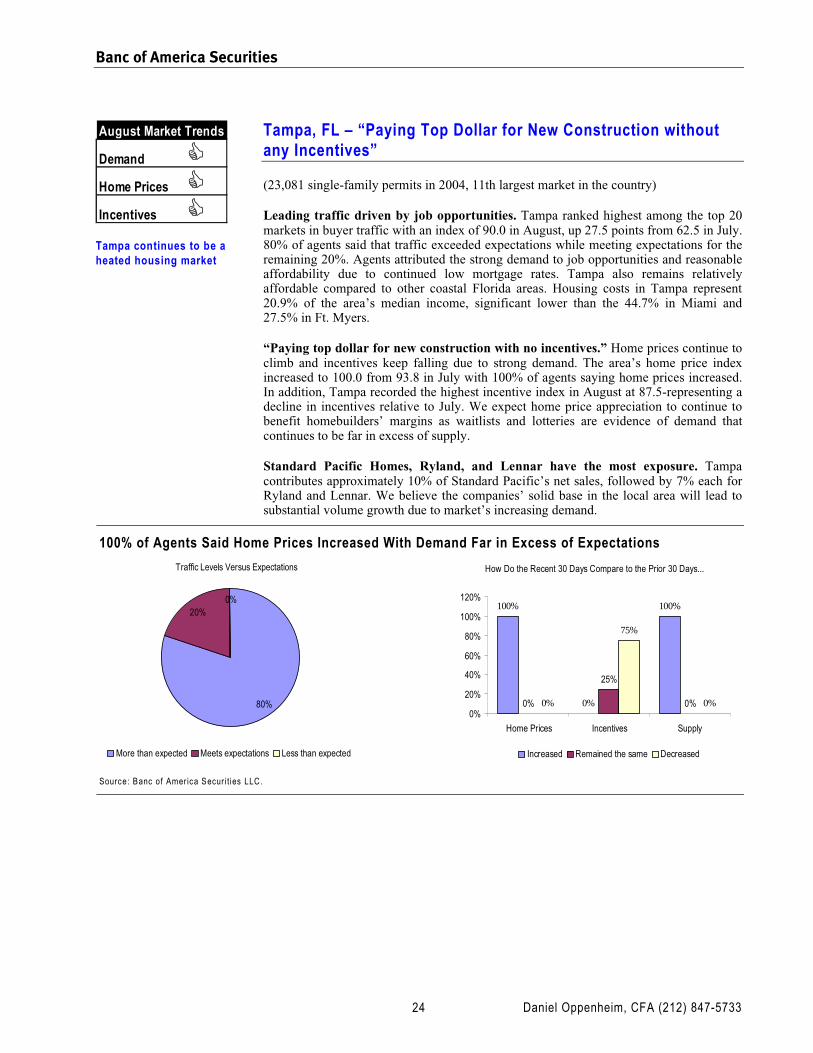
Tampa, FL – “Paying Top Dollar for New Construction without any Incentives”
(23,081 single-family permits in 2004, 11th largest market in the country)
Leading traffic driven by job opportunities. Tampa ranked highest among the top 20 markets in buyer traffic with an index of 90.0 in August, up 27.5 points from 62.5 in July. 80% of agents said that traffic exceeded expectations while meeting expectations for the remaining 20%. Agents attributed the strong demand to job opportunities and reasonable affordability due to continued low mortgage rates. Tampa also remains relatively affordable compared to other coastal Florida areas. Housing costs in Tampa represent 20.9% of the area’s median income, significant lower than the 44.7% in Miami and 27.5% in Ft. Myers.
“Paying top dollar for new construction with no incentives.” Home prices continue to climb and incentives keep falling due to strong demand. The area’s home price index increased to 100.0 from 93.8 in July with 100% of agents saying home prices increased. In addition, Tampa recorded the highest incentive index in August at 87.5-representing a decline in incentives relative to July. We expect home price appreciation to continue to benefit homebuilders’ margins as waitlists and lotteries are evidence of demand that continues to be far in excess of supply.
Standard Pacific Homes, Ryland, and Lennar have the most exposure. Tampa contributes approximately 10% of Standard Pacific’s net sales, followed by 7% each for Ryland and Lennar. We believe the companies’ solid base in the local area will lead to substantial volume growth due to market’s increasing demand.
100% of Agents Said Home Prices Increased With Demand Far in Excess of Expectations
Traffic Levels Versus Expectations
20%0%
80%
More than expected Meets expectations Less than expected
How Do the Recent 30 Days Compare to the Prior 30 Days...
100%
0%
100%
0%
25%
0%0%
75%
0%0%
20%
40%
60%
80%
100%
120%
Home Prices Incentives Supply
Increased Remained the same Decreased
Source: Banc of Amer ica Secur i t ies LLC.
Demand
Home Prices
Incentives
August Market Trends
Tampa continues to be a heated housing market

Banc of America Securities
Daniel Oppenheim, CFA (212) 847-5733 25
Washington, D.C. – Traffic Still Light, But Likely Seasonal
(26,940 single-family permits in 2004, 9th largest market in the country)
79% of agents say traffic volume fell – likely due to typical seasonal trends. Homebuyer traffic fell short of agents’ expectations for the third consecutive month, as our index remained steady at 28.6 in August. 79% of Washington D.C. area real estate agents commented that the volume of traffic remained light in August due to a typical “summer slowdown.” We believe strong job growth in government jobs and defense-related contractors should support continued seasonally strong demand.
Home prices remain flat to slightly lower; Incentives rise from low base in July. Home prices paused in August, remaining flat to slightly lower according to agents. Our home price index fell to 42.9 from 50.0 in July with home prices unchanged relative to July according to 57% of agents, rising according to 14%, and falling according to 29%. We view a moderation in price appreciation to be a positive, as this will prolong the cycle. Home prices in Washington, D.C. increased 26.2% in 2Q05 from 2Q04 and rose 21.9% and 18.8% annually for the most recent three and five year period, respectively. In addition, agents noted that incentives increased but remain at low levels and our incentive index fell to 20.0 in August from 33.3 in July.
NVR, Toll Brothers and Hovnanian have the greatest exposure. NVR has the most exposure to the Washington, D.C. market, as it represented approximately 25% of the company’s 2004 sales. Washington represented 11% of Toll Brothers’ sales and 8% of Hovnanian’s sales.
Traffic Fell Short of Agents’ Expectations Amid Sluggish Summer Demand
Traffic Levels Versus Expectations
43%
7%
50%
More than expected Meets expectations Less than expected
How Do the Recent 30 Days Compare to the Prior 30 Days...
14%
60%
27%
57%
40%
64%
29%
0%9%
0%
10%
20%
30%
40%
50%
60%
70%
Home Prices Incentives Supply
Increased Remained the same Decreased
Source: Banc of Amer ica Secur i t ies LLC.
Demand
Home Prices
Incentives
August Market Trends
We’ll be watching D.C. closely to see if the soft traffic is seasonal or indicates a weaker market
Banc of America Securities
Daniel Oppenheim, CFA (212) 847-5733 26
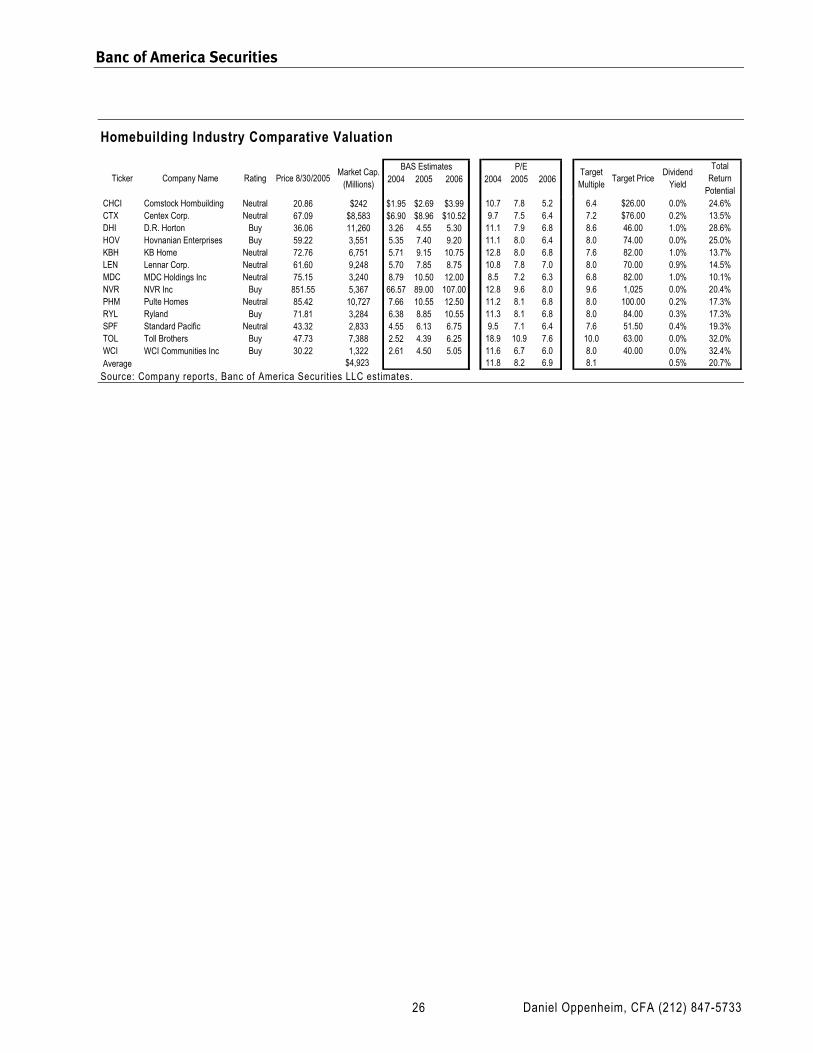
Homebuilding Industry Comparative Valuation
2004 2005 2006 2004 2005 2006
CHCI Comstock Hombuilding Neutral 20.86 $242 $1.95 $2.69 $3.99 10.7 7.8 5.2 6.4 $26.00 0.0% 24.6%CTX Centex Corp. Neutral 67.09 $8,583 $6.90 $8.96 $10.52 9.7 7.5 6.4 7.2 $76.00 0.2% 13.5%DHI D.R. Horton Buy 36.06 11,260 3.26 4.55 5.30 11.1 7.9 6.8 8.6 46.00 1.0% 28.6%HOV Hovnanian Enterprises Buy 59.22 3,551 5.35 7.40 9.20 11.1 8.0 6.4 8.0 74.00 0.0% 25.0%KBH KB Home Neutral 72.76 6,751 5.71 9.15 10.75 12.8 8.0 6.8 7.6 82.00 1.0% 13.7%LEN Lennar Corp. Neutral 61.60 9,248 5.70 7.85 8.75 10.8 7.8 7.0 8.0 70.00 0.9% 14.5%MDC MDC Holdings Inc Neutral 75.15 3,240 8.79 10.50 12.00 8.5 7.2 6.3 6.8 82.00 1.0% 10.1%NVR NVR Inc Buy 851.55 5,367 66.57 89.00 107.00 12.8 9.6 8.0 9.6 1,025 0.0% 20.4%PHM Pulte Homes Neutral 85.42 10,727 7.66 10.55 12.50 11.2 8.1 6.8 8.0 100.00 0.2% 17.3%RYL Ryland Buy 71.81 3,284 6.38 8.85 10.55 11.3 8.1 6.8 8.0 84.00 0.3% 17.3%SPF Standard Pacific Neutral 43.32 2,833 4.55 6.13 6.75 9.5 7.1 6.4 7.6 51.50 0.4% 19.3%TOL Toll Brothers Buy 47.73 7,388 2.52 4.39 6.25 18.9 10.9 7.6 10.0 63.00 0.0% 32.0%WCI WCI Communities Inc Buy 30.22 1,322 2.61 4.50 5.05 11.6 6.7 6.0 8.0 40.00 0.0% 32.4%Average $4,923 11.8 8.2 6.9 8.1 0.5% 20.7%
Company NameTickerTarget Multiple
BAS Estimates P/EMarket Cap.
(Millions)Price 8/30/2005 Target Price
Dividend Yield
Total Return
PotentialRating
Source: Company reports, Banc of America Securities LLC estimates.
Banc of America Securities
Daniel Oppenheim, CFA (212) 847-5733 27
REG AC - ANALYST CERTIFICATION The primary research analyst whose name appears in this research report certifies the following: (1) that all of the viewsexpressed in this research report accurately reflect his or her personal views about any and all of the subject securities orissuers; and (2) that no part of the research analyst's compensation was, is, or will be directly or indirectly related to thespecific recommendations or views expressed by the research analyst in this research report.
IMPORTANT DISCLOSURES
Banc of America Securities LLC (BAS) Stock Rating System
The rating system is based on a stock's forward -12-month expected total return (price appreciation plus dividend yield). The prospective rates of return that help define the Buy, Neutral and Sell ranges are subject to change from time to time, corresponding with changes in prospective rates of return on competing investments. The specific volatility levels thatdivide our stocks into low, medium, high, and extreme ranges are subject to change from time to time, corresponding with changes in the volatility of benchmark indexes and the companies that comprise them.
Volatility Ratings Buy Neutral Sell
Low 0%-25% 8%+ 7.9%-(4.9)% (5)% or worse Medium 25%-35% 11%+ 10.9%-(6.9)% (7)% or worse High 35%-55% 15%+ 14.9%-(10.9)% (11)% or worse Extreme 55%+ 30%+ 29.9%-(19.9)% (20)% or worse
Source for volatility: Bloomberg.
Rating Distribution*
Global Coverage Coverage Universe Companies Pct. Investment Banking Clients Companies Pct.**
Buy 319 39 Buy 253 79 Hold 458 56 Hold 363 79 Sell 46 6 Sell 31 67
Consumer Sector Coverage Universe Companies Pct. Investment Banking Clients Companies Pct.**
Buy 47 31 Buy 40 85 Hold 99 66 Hold 72 73 Sell 5 3 Sell 3 60
* For the purposes of this Rating Distribution, “Hold” is equivalent to our “Neutral” rating. ** Percentage of companies in each rating group that are investment banking clients. As of 08/09/2005.
The analysts and associates responsible for preparing this research report receive compensation that is based on variousfactors, including BAS’s total revenue, a portion of which is generated by BAS’s investment banking business. They donot receive compensation based on revenue from any specific investment banking transaction.
BAS prohibits analysts and members of their households from maintaining a financial interest in the securities or optionsof any company that the analyst covers or that falls within the analyst’s coverage sector except in limited circumstances(for securities and options acquired prior to July 9, 2002), as permitted by the New York Stock Exchange and the NASD. Stock ownership in the companies mentioned in this report by the analyst who has prepared this report and members ofhis or her household is disclosed below. The absence of such disclosure means that the analyst(s) preparing this report(including members of his or her household) does not have any direct stock ownership in companies mentioned in thisreport. BAS also permits analysts and members of their households to own diversified mutual funds and to maintainfinancial interests in funds and other private investments that may include companies in a sector that the analyst covers ifthe person acquired the financial interest prior to July 9, 2002.
Banc of America Securities
Daniel Oppenheim, CFA (212) 847-5733 28
BAS is a subsidiary of Bank of America Corporation (BAC). "BofA Equity Research" refers to the division of BAS that produces equity research.
BAS and affiliate policy prohibits research personnel from disclosing a rating, recommendation or investment thesis forreview by an issuer prior to the publication of a research report containing such rating, recommendation or investment thesis. Materials prepared by BAS and affiliate research personnel are based on public information.
With the exception of members of research management named on the directory located at www.bofasecurities.com oron the back page of this report, the persons listed on this directory have the title of "research analyst." Any othercontributors named on the front cover of this research report but not shown on this directory have the title "researchassociate."
For applicable current disclosures, please call us at 1-888-583-8900 and ask for your BAS representative, or write us at Banc of America Securities LLC, Attn. Compliance Department, 40 West 57th Street, New York, NY 10019, or visit our website at www.bofasecurities.com and follow these steps to get to a webpage containing all applicable currentdisclosures: click tab ‘Go to client Log-In’; fill in your username and password and log-in; click ‘Search Document Library’ in the ‘U.S. Equity Research Library’; fill in the ticker symbol of the company in the search field and hit ‘Search’. If you do not have a username or password, please contact your BAS representative or call the number above.
Further information on any security or financial instrument mentioned herein is available upon request.
Company - Specific Disclosures BAS currently maintains a market in this security and otherwise purchases and sells securities of this company as principal: Comstock Homebuilding Companies, Inc..
BAS and/or its affiliates have lead- or co-managed an offering of securities for this company in the previous 12 months: Centex Corporation; Comstock Homebuilding Companies, Inc.; Hovnanian Enterprises, Inc.; Lennar Corporation; M.D.C. Holdings, Inc.; Pulte Homes, Inc.; Standard Pacific Corp.; The Ryland Group, Inc.; WCI Communities, Inc..
This company, its subsidiaries and/or its affiliates are (is) or have (has) been a client of BAS in the previous 12 months. During this period, BAS has performed investment banking services for this company, its subsidiaries and/or its affiliates and has received compensation for those services: Centex Corporation; Comstock Homebuilding Companies, Inc.; D.R. Horton, Inc.; Hovnanian Enterprises, Inc.; KB Home; Lennar Corporation; M.D.C. Holdings, Inc.; NVR, Inc.; Pulte Homes, Inc.; The Ryland Group, Inc.; Toll Brothers, Inc.; WCI Communities, Inc..
BAS and/or its affiliates expect(s) to receive, or intend(s) to seek, compensation during the next three months for investment banking services from this company, its subsidiaries and/or its affiliates: Centex Corporation; D.R. Horton, Inc.; Hovnanian Enterprises, Inc.; KB Home; Lennar Corporation; M.D.C. Holdings, Inc.; Pulte Homes, Inc.; Standard Pacific Corp.; The Ryland Group, Inc.; Toll Brothers, Inc.; WCI Communities, Inc..
BAS and/or its affiliates beneficially own 1% or more of a class of common equity securities of this company: KB Home; Lennar Corporation; M.D.C. Holdings, Inc.; Toll Brothers, Inc..
BAS is affiliated with an NYSE specialist organization that specializes in one or more securities issued by the companies listed below. This affiliated NYSE specialist organization may make a market in, maintain a long or short position in or be on the opposite side of orders executed on the Floor of the NYSE in connection with one or more of the securities issued by these companies: D.R. Horton, Inc.; Standard Pacific Corp..
This company, its subsidiaries and/or its affiliates are (is) or have (has) been a client of BAS in the previous 12 months. During this period, BAS has performed non-investment banking securities-related services for this company, its subsidiaries and/or its affiliates and has received compensation for those services: Centex Corporation; D.R. Horton, Inc.; Hovnanian Enterprises, Inc.; KB Home; Lennar Corporation; Pulte Homes, Inc.; Standard Pacific Corp.; The Ryland Group, Inc.; Toll Brothers, Inc..
This company, its subsidiaries and/or its affiliates are (is) or have (has) been a client of BAS in the previous 12 months. During this period, BAS has performed non-securities services for this company, its subsidiaries and/or its affiliates and has received compensation for those services: Centex Corporation; Comstock Homebuilding Companies, Inc.; D.R. Horton, Inc.; Hovnanian Enterprises, Inc.; KB Home; Lennar Corporation; M.D.C. Holdings, Inc.; NVR, Inc.; Pulte Homes, Inc.; Standard Pacific Corp.; The Ryland Group, Inc.; Toll Brothers, Inc.; WCI Communities, Inc..
Banc of America Securities
Daniel Oppenheim, CFA (212) 847-5733 29
DisclaimersUnless otherwise stated above, this report is prepared by Banc of America Securities LLC (BAS), member NYSE, NASD and SIPC as part of its researchactivity and not in connection with any proposed offering of securities or as agent of the issuer of any securities. This report has been prepared independentlyof any issuer of securities mentioned herein. None of BAS, its affiliates or their analysts (collectively, BofA) have any authority whatsoever to make anyrepresentation or warranty on behalf of the issuer(s). This report is provided for information purposes only and is not an offer or a solicitation for thepurchase or sale of any financial instrument. Any decision to purchase or subscribe for securities in any offering must be based solely on existing publicinformation on such security or the information in the prospectus or other offering document issued in connection with such offering, and not on this report.
For securities recommended in this report in which BofA is not a market maker, BofA usually provides bids and offers and may act as principal in connectionwith such transactions. BofA is a regular issuer of traded financial instruments linked to securities that may have been recommended in this report. BofAmay hold, at any time, a trading position (long or short) in the shares of the subject company(ies) discussed in this report. BofA may engage in securitiestransactions in a manner inconsistent with this research report and, with respect to securities covered by the report, will buy or sell from customers on aprincipal basis.
Securities recommended, offered or sold by BofA are not insured by the Federal Deposit Insurance Corporation, are not deposits or other obligations ofany insured depository institution (including Bank of America, N.A.) and are subject to investment risks, including the possible loss of the principal amountinvested. Although information has been obtained from and is based on sources believed to be reliable, we do not guarantee its accuracy, and it may beincomplete or condensed. All opinions, projections and estimates constitute the judgment of the author as of the date of the report and are subject to changewithout notice. Prices also are subject to change without notice. BofA’s ability to publish research on the subject company(ies) in the future is subject toapplicable quiet periods.
Investing in non-U.S. securities, including ADRs, may entail certain risks. The securities of non-U.S. issuers may not be registered with, nor be subject to,the reporting requirements of the U.S. Securities and Exchange Commission. There may be limited information available on foreign securities. In general,foreign companies are not subject to uniform audit and reporting standards, practices and requirements comparable to those of U.S. companies. In addition,exchange rate movements may have an adverse effect on the value of an investment in a foreign stock and its corresponding dividend payment for U.S.investors. Net dividends to ADR investors are estimated, using withholding tax rate conventions, deemed accurate, but investors are urged to consult theirtax advisor for exact dividend computations. Investors who have received this report from BAS or an affiliate may be prohibited in certain states or otherjurisdictions from purchasing securities mentioned in this report from BAS or its affiliate(s).
Investments in general, and derivatives (that is, options, futures, warrants, and contracts for differences) in particular, involve numerous risks, including,among others, market risk, counterparty default risk and liquidity risk. Derivatives are not suitable investments for all investors, and an investor may loseall principal invested and, in some cases, may incur unlimited losses. It may be difficult to sell an investment and to obtain reliable information about itsvalue or the risks to which it is exposed. Past performance of securities, loans or other financial instruments is not indicative of future performance. Thisreport is not prepared as or intended to be investment advice and is issued without regard to the specific investment objectives, financial situation or particularneeds of any specific recipient. Neither BAS nor any officer or employee of BAS or any affiliate thereof accepts any liability whatsoever for any direct,indirect or consequential damages or losses arising from any use of this report or its contents.
With the exception of information regarding BAS and its affiliates, materials prepared by BAS research personnel are based on public information. Factsand views presented in this material have not been reviewed by, and may not reflect information known to, professionals in other business areas of BASand its affiliates, including investment banking personnel.
To European and Asian Customers: This report is distributed in Europe by Banc of America Securities Limited and in Asia by Banc of America SecuritiesAsia Limited.
To U.S. Customers: BAS has accepted responsibility for the distribution of this report in the United States to BAS clients, but not to the clients of its affiliate,Banc of America Investment Services, Inc. (BAI). Transactions by U.S. persons (other than BAI and its clients) in any security discussed herein must becarried out through BAS. BAS provides research to its affiliate, BAI. BAI is a registered broker-dealer, member NASD and SIPC, and is a nonbank subsidiaryof Bank of America N.A.
To U.K. Customers: This document has been approved for distribution in the United Kingdom by Banc of America Securities Limited, which is authorizedand regulated by the Financial Services Authority for the conduct of investment business in the United Kingdom. Prices, values or income ascribed toinvestments in this report may fall against your interests. The investments may not be suitable for you, and if in any doubt, you should seek advice froman investment advisor. Changes in rates of exchange may have an adverse effect on the value, price or income from an investment. Levels and basis fortaxation may change. The protection provided by the U.K. regulatory regime, including the Financial Services Scheme, do not apply in general to businesscoordinated by BAS or its affiliates from an office outside of the United Kingdom.
These disclosures should be read in conjunction with the Banc of America Securities Limited general policy statement on the handling of researchconflicts–available upon request.
To German Customers: In Germany, this report should be read as though BAS has acted as a member of a consortium that has underwritten the most recentoffering of securities during the past five years for companies covered in this report and holds 1% or more of the share capital of such companies.
To Canadian Customers: The contents of this report are intended solely for the use of, and only may be issued or passed on to, persons to whom BAS isentitled to distribute this report under applicable Canadian securities laws. In the province of Ontario, any person wishing to effect a transaction should doso with BAS, which is registered as an International Dealer. With few exceptions, BAS only may effect transactions in Ontario with designated institutionsin foreign securities as such terms are defined in the Securities Act (Ontario).
To Hong Kong Customers: Any Hong Kong person wishing to effect a transaction in any securities discussed in this report should contact Banc of AmericaSecurities Asia Limited.
To Customers in Other Countries: This report, and the securities discussed herein, may not be eligible for distribution or sale in all countries or to certaincategories of investors. In general, this report may be distributed only to professional and institutional investors.
This report may not be reproduced or distributed by any person for any purpose without the prior written consent of BAS. Please cite source when quoting.All rights are reserved.
BAS (United States)Banc of America Securities LLC
9 West 57th StreetNew York, New York 10019Tel. Contact: 212-583-8000
600 Montgomery StreetSan Francisco, California 94111Tel. Contact: 415-627-2000
100 North Tryon StreetCharlotte, North Carolina 28255Tel. Contact: 888-279-3457
2005 Bank of America Corporation
BASL (United Kingdom)Banc of America Securities Limited
5 Canada SquareLondon E14 5AQ, EnglandTel. Contact: +44 20 7174 4000
Equity Web Site: www.bofasecurities.comBloomberg: Type BAC [GO]First Call: www.firstcall.comMultex: www.multex.comTheMarkets.com: www.themarkets.comFor access, please contact your sales representative.
BAAL (Hong Kong)Banc of America Securities Asia Limited
Bank of America Tower2nd Floor, Hong KongTel. Contact: 852-2847-6175