Home Décor - PhillipCapitalbackoffice.phillipcapital.in/Backoffice/Researchfiles/PC_-_Home... ·...
94
Home Décor Making Homes, Decorating Returns • Higher disposable income and urbanization to be the key demand drivers • Increasing preference for branded goods, driven by aggressive advertizing • FMCG like business model with high cash flow and ROEs • Distribution network a key entry barrier, in an attractive industry • Decreasing dependence on real estate growth Kapil Bagaria & Vibhor Singhal
Transcript of Home Décor - PhillipCapitalbackoffice.phillipcapital.in/Backoffice/Researchfiles/PC_-_Home... ·...

Home Décor Making Homes, Decorating Returns
• Higher disposable income and urbanization to be the key demand drivers • Increasing preference for branded goods, driven by aggressive advertizing • FMCG like business model with high cash flow and ROEs • Distribution network a key entry barrier, in an attractive industry • Decreasing dependence on real estate growth Kapil Bagaria & Vibhor Singhal
– 2 of 94 –
Home Décor Making Homes, Decorating Returns
4 December 2012PhillipCapital (India) Pvt. Ltd.
Known companies, a different lens In this report, we analyze five leading companies of a sector, which has been there right in front of our eyes, but hasn’t been brought under the magnifying glass as a complete basket – the Home Décor sector. This sector has historically been dominated by small local players, but over the last decade, it has seen emergence of few large players (listed and private) which have registered robust earnings growth, and look set to continue the same over the next five years. Macro tailwinds to provide boost to the earnings growth With increasing urbanization, growth in disposable income and growing aspirations of the Indian middle class, we believe the market pie for home décor products is set to expand significantly over the next five years. At the same time, increasing preference for branded goods would help the organized segment to garner a much larger share of this increasing pie. We expect the organized companies to report 15‐20% topline growth over the next three years. FMCG like business model ensures high cash flow generation and ROEs Most of the home décor companies (except plywood) have negative to low working capital cycle and high asset turnover. This helps in converting large part of the operating profit into free cash flow for the companies. The high cash flow in‐turn keeps the leverage in check, and hence the ROE are typically in the range of 20‐40%. Attractive industry, but not without entry barriers The home décor sector has two key entry barriers – Dealer network and Brands. Companies in this sector operate through a vast network of exclusive dealers, who ‘seemed’ happy with the current business environment (in our dealer visits), and have been the prime reason behind the exponential growth of their respective companies. At the same time, the companies have been investing large part of their revenue on advertizing, building a strong brand for their products. Decreasing dependence on real estate growth The product replacement cycle of all the home décor products has shrunk substantially over the last decade. This decouples the growth of these companies from real estate growth in the country, though a large part of their sales still caters to the ‘new’ home sales category. An excellent investment opportunity for the investors We believe the home décor sector represents an excellent investment opportunity, to ride the consumer wave of the Indian economy. In this report, we have identified five sub‐segments in the home décor sector, and analyzed the leading company in that sub‐segment. We expect all of these five companies to register robust earnings growth over the next three years, and outperform their peers. While most of them look attractive on valuations too, each of them has a unique reason and investment story behind it. We recommend BUY on Kajaria Ceramics, HSIL, Havells Ltd, Greenply Industries and Berger Paints.
Companies Covered Kajaria Ceramics CMP Rs259Reco BUYTarget Price Rs325 HSIL Ltd CMP Rs137Reco BUYTarget Price Rs193 Havells Ltd CMP Rs585Reco BUYTarget Price Rs695 Greenply Industries CMP Rs305Reco BUYTarget Price Rs405 Berger Paints CMP Rs153Reco BUYTarget Price Rs182 Upside Potential
19% 19%25%
32%41%
Havells
Berger
Kajaria
Green
ply
HSIL
Relative positioning
HSIL
Berger
0
10
20
30
0 10 20 30 40
P/E
ROE (%)
Greenply
Havells
Kajaria
Kapil Bagaria (+ 9122 6667 9965) [email protected] Vibhor Singhal (+ 9122 6667 9949) [email protected]

3 of 94
4 December 2012 / INDIA EQUITY RESEARCH / HOME DÉCOR
Table of Contents
Investment Thesis ........................................................................... 4
Why This Sector? ............................................................................. 5
Business Model ................................................................................ 9
Valuations ........................................................................................ 12
Dealer feedback .............................................................................. 13
Companies Covered
Kajaria Ceramics .............................................................................. 15
HSIL .................................................................................................. 33
Havells Ltd ....................................................................................... 53
Greenply Industries ......................................................................... 71
Berger Paints ................................................................................... 83

4 of 94
4 December 2012 / INDIA EQUITY RESEARCH / HOME DÉCOR
Investment Thesis The Home Décor segment has grown considerably in the past few years – both in terms of market size and the variety of products available. Gone are the days when all you could get for your home decoration were bland single‐color tiles and standard bathroom fittings. The market today is flush with multi‐design, multi‐colored tiles, along with bathroom fittings of the most innovative designs. The furniture no longer has that old‐boring look; and the plain vanilla bulbs and tube‐lights have long been replaced by fancy elegant fixtures carrying advanced CFL tubes. The Home Décor segment doesn’t have a strict definition, but we have identified five major sub‐segments, where most of the companies under the umbrella reside: • Ceramics: This segment comprises of companies manufacturing and distributing tiles
– glazed and vitrified, used for covering walls (interior and exterior) and ceiling. Its market size in India currently stands at Rs170bn, having grown at over 15% CAGR over the last five years.
• Sanitaryware: This segment mainly comprises of companies that make sanitaryware and bathroom fittings. Its market size in India currently stands at Rs20bn, having grown at over 15% CAGR over the last five years.
• Electricals: This segment consists of various sub‐segments, but we have grouped the companies under the umbrella of companies that solve the electrical needs of a residential/commercial place – switches, circuit breakers, wires, lightings and electrical durables. The current market size of all these put together, is a whopping Rs625bn, and has grown at CAGR of 19% over the last five years.
• Furniture: In the furniture segment, we look at the companies that manufacture various forms of plywood and laminates, in the absence of a furniture maker of significant size. The current market size for this industry is Rs200bn, and has grown at CAGR of 7% over the last five years.
• Paints: And lastly, the paints segment comprises of the companies making various forms of paints. The market size of this segment is currently estimated to be ~Rs250bn, and has grown over 12% CAGR over last five years.
Home décor market at a glance Segment Market size
(FY12) Rs bn
CAGR (FY07‐12)
%
Organized share (FY12)
%
Major listed players Major private players
Ceramics 170 15% 50% Kajaria, Somany HR Johnson
Sanitary ware 20 15% 60% HSIL, Cera Jaguar
Electricals 626 19% 50% Havells, Bajaj, Crompton Philips, Anhor, Polycab
Furniture 200 7% 44% Century ply, Greenply Uniply, Marino
Paints 250 12% 70% Asian Paints, Berger ‐
Source: PhillipCapital India Research
While the home décor sector has grown in size, so has the valuation of the companies listed in the space. The market cap of the leading ten companies in the sector has more than trebled in the last five years. However, we expect the momentum to continue over the next five years. We believe riding this growth wave can lead to significant value creation for investors, and the sector presents an extremely interesting investment opportunity, at current levels.
5 of 94
4 December 2012 / INDIA EQUITY RESEARCH / HOME DÉCOR
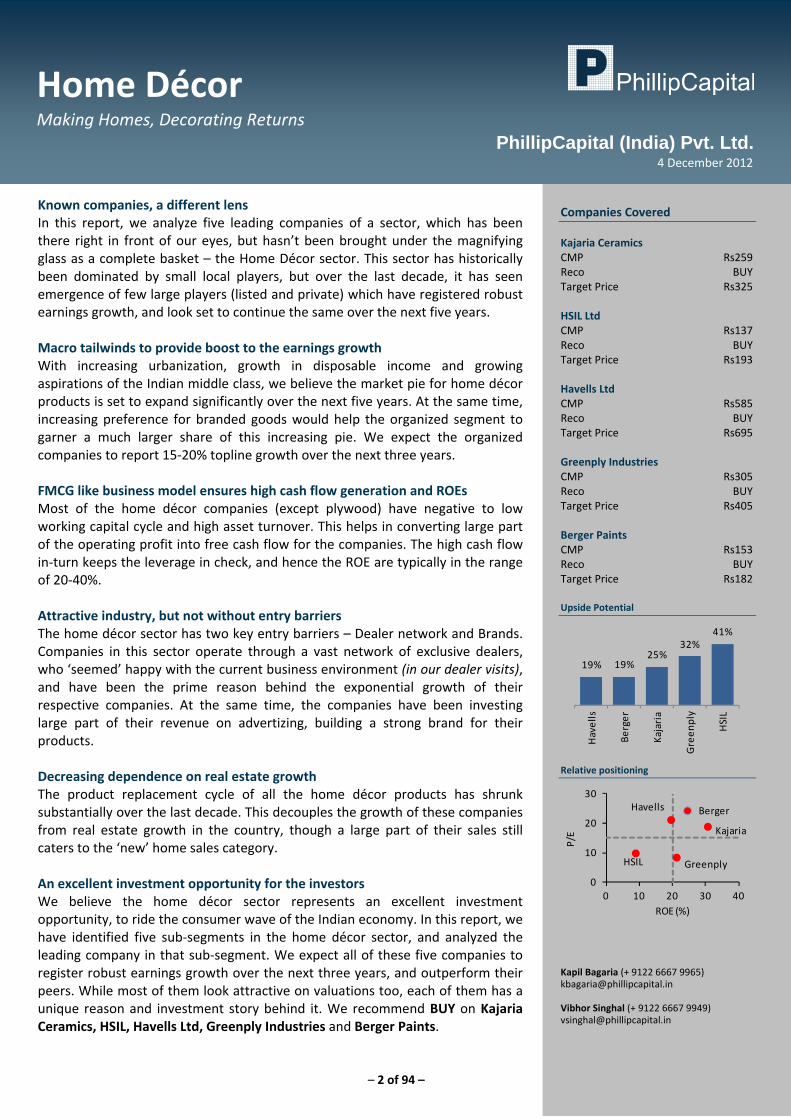
Why This Sector? Increasing Market Pie The House Décor sector has demonstrated robust growth over the last five years. On an average, all the sub‐segments have grown at 14% CAGR over the period FY07‐12. We expect the sector and the companies to continue reporting strong growth over the next three years, driven by the following factors: Increasing urbanization
Increasing Urbanization
‐
200
400
600
800
1,000
1,200
1,400
1,600
1991 2001 2008 2030
0%
5%
10%
15%
20%
25%
30%
35%
40%
45%Total Population, mn (lhs)
Urbanization rate (rhs)
Source: Mckinsey Research
Increasing affluence level and disposable income
Source: Mckinsey Research

6 of 94
4 December 2012 / INDIA EQUITY RESEARCH / HOME DÉCOR
More people will join the great Indian middle class, over the next two decades
6450
2615
31
34
40
32
12
25
29
6
17
7
0%
20%
40%
60%
80%
100%
2000 2008 2020 2030
Deprived Aspirers Seekers Strivers Globals
Source: Mckinsey Research
Decreasing Dependence on Real Estate Growth One of the popular perceptions about the home décor sector is that its growth is heavily dependent on the growth in real estate sector, and the former will witness a downturn (if not already) due to slowdown in the latter. While the real estate growth definitely drives the growth for home décor sector and the two have a high correlation, we note that the dependence has been “increasingly decreasing”. And the main reason for the decreasing dependence has been the shortening product replacement cycle – people now tend to replace their old furniture, tiles and electrical goods much more frequently, than twenty years ago. Sales growth does not seem to have a high correlation with real estate sales
‐20%
0%
20%
40%
60%
80%
100%
1Q08
2Q08
3Q08
4Q08
1Q09
2Q09
3Q09
4Q09
1Q10
2Q10
3Q10
4Q10
1Q11
2Q11
3Q11
YoY Sales grow
th (%
)
‐5%
0%
5%
10%
15%
20%
25%
Net absorption rate (%
)
Havells Greenply KajariaHSIL Berger Residential
Source: PhillipCapital India Research, Jones Lang Lasalle
Category Annual Income (Rs thousand) Deprived < 90 Aspirers 90 ‐ 200 Seekers 200 ‐ 500 Strivers 500 ‐ 1000 Globals > 1000
Net absorption rate (ratio of sales over inventory of residential units) for top seven cities of India – Mumbai, NCR‐Delhi, Bangalore, Chennai, Pune, Hyderabad and Kolkata
7 of 94
4 December 2012 / INDIA EQUITY RESEARCH / HOME DÉCOR
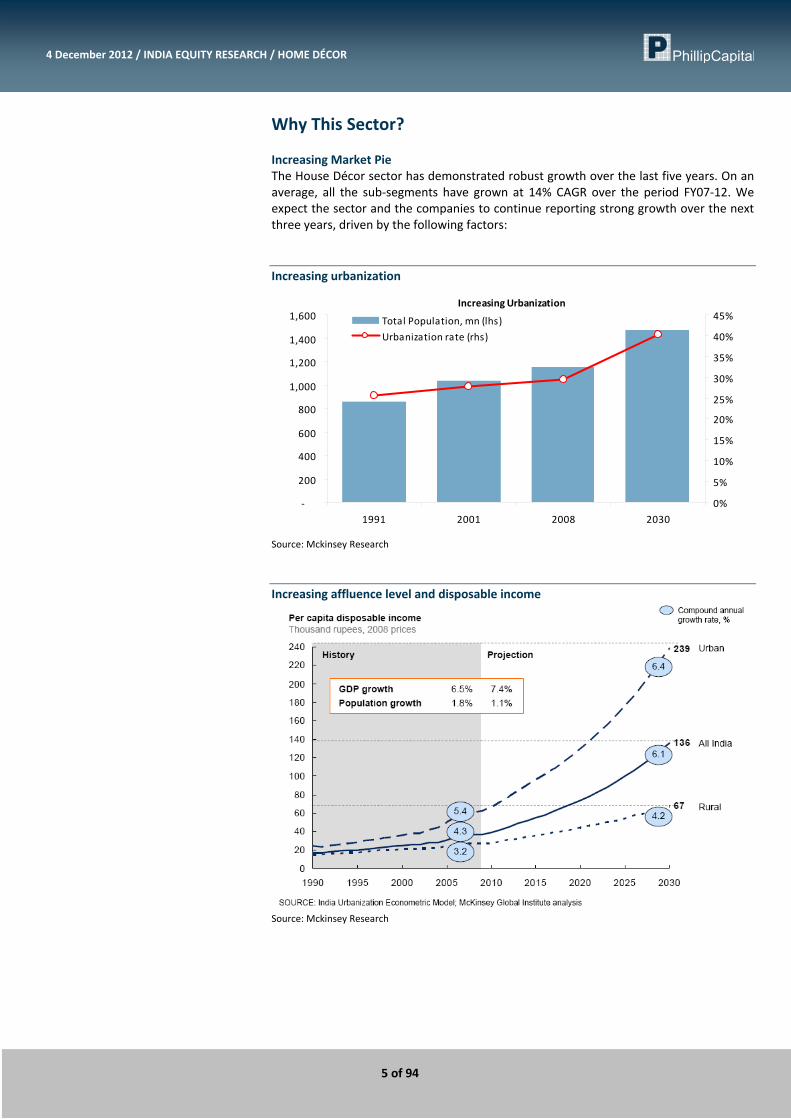
Increasing Share Of Pie (Organized Market) While the market size of the home décor sector has been growing, so has the share of the organized market. Over the last ten years, organized players have garnered, on an average, 2‐3% market share every year, from the unorganized players. This has been driven by increasing brand awareness amongst the consumers, which has in‐turn been driven by the increasing focus of these companies on advertizing and brand building. Increasing share of advertisement expenses
0%
1%
2%
3%
4%
5%
6%
FY07 FY08 FY09 FY10 FY11 FY12
Advertizing expe
nses as % of sales
Havells Ltd Greenply Kajaria CermaicsHSIL Ltd Berger Paints
Source: Companies, PhillipCapital India Research

8 of 94
4 December 2012 / INDIA EQUITY RESEARCH / HOME DÉCOR
Branding by Aggressive Advertizing
Kajaria Ceramics
HSIL Ltd
Havells
Greenply
Berger Paints
Source: PhillipCapital India Research
9 of 94
4 December 2012 / INDIA EQUITY RESEARCH / HOME DÉCOR
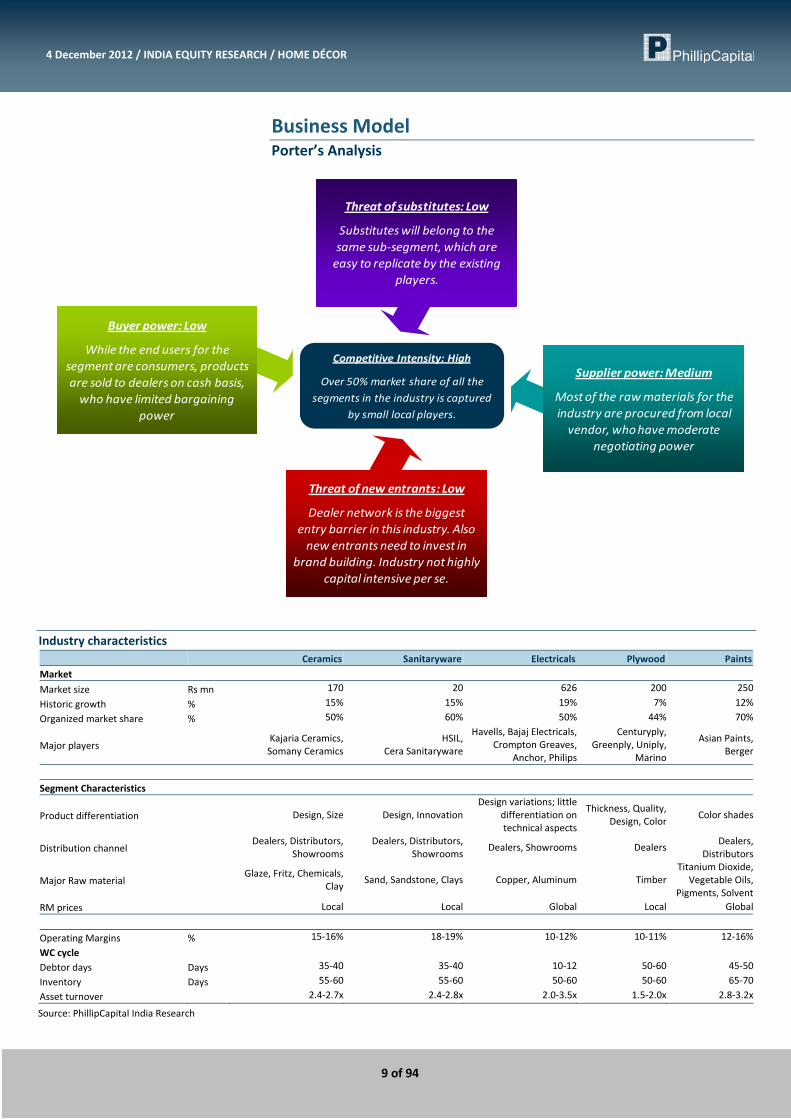
Business Model Porter’s Analysis
Supplier power: Medium
Most of the raw materials for the industry are procured from local vendor, who have moderate
negotiating power
Threat of new entrants: Low
Dealer network is the biggest entry barrier in this industry. Also new entrants need to invest in
brand building. Industry not highly capital intensive per se.
Buyer power: Low
While the end users for the segment are consumers, products are sold to dealers on cash basis, who have limited bargaining
power
Threat of substitutes: Low
Substitutes will belong to the same sub‐segment, which are easy to replicate by the existing
players.
Competitive Intensity: High
Over 50% market share of all the segments in the industry is captured
by small local players.
Industry characteristics Ceramics Sanitaryware Electricals Plywood Paints
Market
Market size Rs mn 170 20 626 200 250
Historic growth % 15% 15% 19% 7% 12%
Organized market share % 50% 60% 50% 44% 70%
Major players Kajaria Ceramics, Somany Ceramics
HSIL, Cera Sanitaryware
Havells, Bajaj Electricals,Crompton Greaves,
Anchor, Philips
Centuryply, Greenply, Uniply,
Marino
Asian Paints,Berger
Segment Characteristics
Product differentiation Design, Size Design, Innovation Design variations; little
differentiation ontechnical aspects
Thickness, Quality, Design, Color
Color shades
Distribution channel Dealers, Distributors,
ShowroomsDealers, Distributors,
ShowroomsDealers, Showrooms Dealers
Dealers,Distributors
Major Raw material Glaze, Fritz, Chemicals,
ClaySand, Sandstone, Clays Copper, Aluminum Timber
Titanium Dioxide,Vegetable Oils,
Pigments, SolventRM prices Local Local Global Local Global
Operating Margins % 15‐16% 18‐19% 10‐12% 10‐11% 12‐16%
WC cycle Debtor days Days 35‐40 35‐40 10‐12 50‐60 45‐50
Inventory Days 55‐60 55‐60 50‐60 50‐60 65‐70
Asset turnover 2.4‐2.7x 2.4‐2.8x 2.0‐3.5x 1.5‐2.0x 2.8‐3.2x
Source: PhillipCapital India Research
10 of 94
4 December 2012 / INDIA EQUITY RESEARCH / HOME DÉCOR
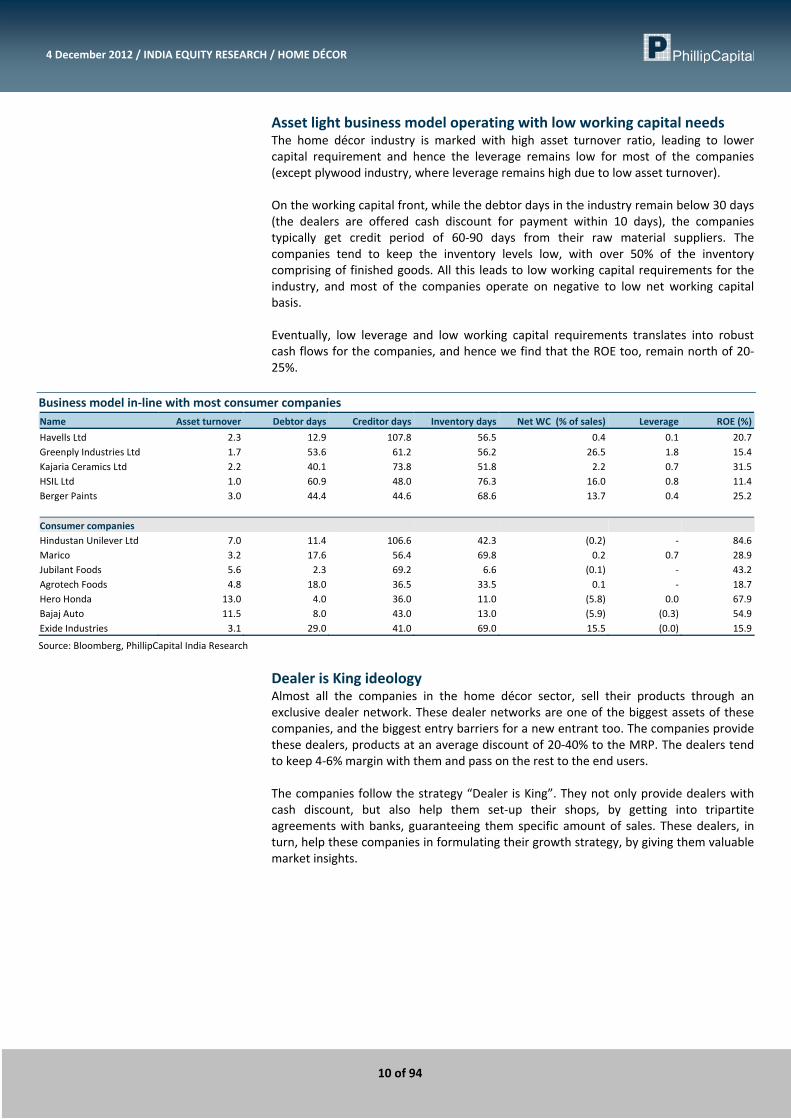
Asset light business model operating with low working capital needs The home décor industry is marked with high asset turnover ratio, leading to lower capital requirement and hence the leverage remains low for most of the companies (except plywood industry, where leverage remains high due to low asset turnover). On the working capital front, while the debtor days in the industry remain below 30 days (the dealers are offered cash discount for payment within 10 days), the companies typically get credit period of 60‐90 days from their raw material suppliers. The companies tend to keep the inventory levels low, with over 50% of the inventory comprising of finished goods. All this leads to low working capital requirements for the industry, and most of the companies operate on negative to low net working capital basis. Eventually, low leverage and low working capital requirements translates into robust cash flows for the companies, and hence we find that the ROE too, remain north of 20‐25%.
Business model in‐line with most consumer companies Name Asset turnover Debtor days Creditor days Inventory days Net WC (% of sales) Leverage ROE (%)
Havells Ltd 2.3 12.9 107.8 56.5 0.4 0.1 20.7 Greenply Industries Ltd 1.7 53.6 61.2 56.2 26.5 1.8 15.4 Kajaria Ceramics Ltd 2.2 40.1 73.8 51.8 2.2 0.7 31.5 HSIL Ltd 1.0 60.9 48.0 76.3 16.0 0.8 11.4 Berger Paints 3.0 44.4 44.6 68.6 13.7 0.4 25.2
Consumer companies Hindustan Unilever Ltd 7.0 11.4 106.6 42.3 (0.2) ‐ 84.6 Marico 3.2 17.6 56.4 69.8 0.2 0.7 28.9 Jubilant Foods 5.6 2.3 69.2 6.6 (0.1) ‐ 43.2 Agrotech Foods 4.8 18.0 36.5 33.5 0.1 ‐ 18.7 Hero Honda 13.0 4.0 36.0 11.0 (5.8) 0.0 67.9 Bajaj Auto 11.5 8.0 43.0 13.0 (5.9) (0.3) 54.9 Exide Industries 3.1 29.0 41.0 69.0 15.5 (0.0) 15.9
Source: Bloomberg, PhillipCapital India Research
Dealer is King ideology Almost all the companies in the home décor sector, sell their products through an exclusive dealer network. These dealer networks are one of the biggest assets of these companies, and the biggest entry barriers for a new entrant too. The companies provide these dealers, products at an average discount of 20‐40% to the MRP. The dealers tend to keep 4‐6% margin with them and pass on the rest to the end users. The companies follow the strategy “Dealer is King”. They not only provide dealers with cash discount, but also help them set‐up their shops, by getting into tripartite agreements with banks, guaranteeing them specific amount of sales. These dealers, in turn, help these companies in formulating their growth strategy, by giving them valuable market insights.

11 of 94
4 December 2012 / INDIA EQUITY RESEARCH / HOME DÉCOR
Dealer network expansion
‐
2,000
4,000
6,000
8,000
10,000
12,000
14,000
16,000
FY07 FY08 FY09 FY10 FY11 FY12
No of dealers
Havells Ltd Greenply Kajaria Cermaics
HSIL Ltd Berger Paints
Source: Company, PhillipCapital India Research
This Was History, How Does The Future Look? While this was how the past decade has fared for the industry, the future looks even brighter in our opinion. Most of these companies have already put in enough capacity to see them through the next three‐five years (except Greenply) and hence the utilization levels remain significantly below 100%. With the demand for branded home décor products on the rise, on the back of increasing disposable income, brand awareness and share of organized market, we expect the industry to clock an average 15% CAGR in revenue and earnings over the period FY12‐14E. At the same time, the operating cash flows too should register healthy growth, leading to an average ROE of 20% over the same period.
Past and Future _________________FY07‐12_________________ _________________FY12‐14E_________________
Name Market Cap
(Rs mn) Rev
CAGREarnings
CAGRAnnual OCF
(Rs mn) Avg ROERev
CAGR Earnings
CAGR Annual OCF
(Rs mn) Avg ROE
Havells Ltd 71,624 19% 24% 2,458 26% 19% 18% 4,344 21%Greenply Industries 7,362 33% 19% 168 23% 16% 42% 1,050 19%Kajaria Ceramics Ltd 18,908 26% 60% 643 17% 20% 28% 1,415 31%HSIL Ltd 8,771 25% 26% 684 15% 19% 17% 1,473 11%Berger Paints 44,642 19% 15% 1,273 26% 15% 18% 1,260 25%
Source: Bloomberg, PhillipCapital India Research
12 of 94
4 December 2012 / INDIA EQUITY RESEARCH / HOME DÉCOR
Valuations
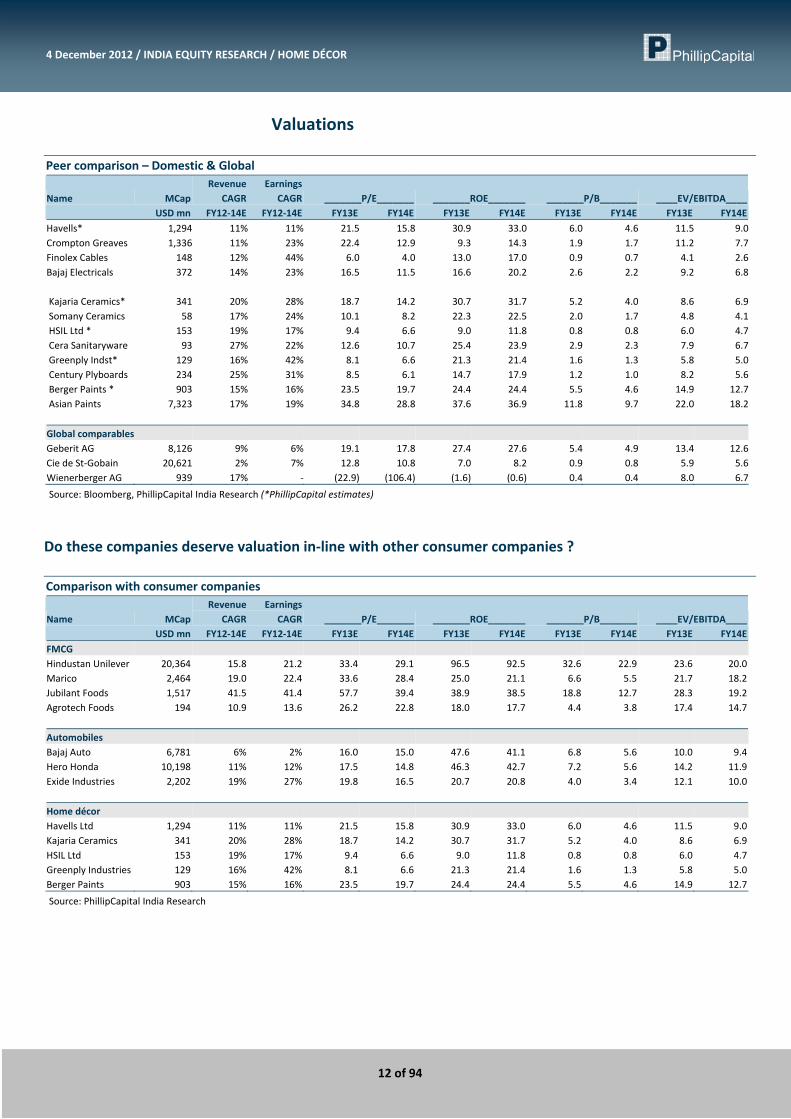
Peer comparison – Domestic & Global
Name MCap Revenue
CAGR Earnings
CAGR _______P/E_______ _______ROE_______ _______P/B_______ ____EV/EBITDA____ USD mn FY12‐14E FY12‐14E FY13E FY14E FY13E FY14E FY13E FY14E FY13E FY14E
Havells* 1,294 11% 11% 21.5 15.8 30.9 33.0 6.0 4.6 11.5 9.0Crompton Greaves 1,336 11% 23% 22.4 12.9 9.3 14.3 1.9 1.7 11.2 7.7Finolex Cables 148 12% 44% 6.0 4.0 13.0 17.0 0.9 0.7 4.1 2.6Bajaj Electricals 372 14% 23% 16.5 11.5 16.6 20.2 2.6 2.2 9.2 6.8 Kajaria Ceramics* 341 20% 28% 18.7 14.2 30.7 31.7 5.2 4.0 8.6 6.9 Somany Ceramics 58 17% 24% 10.1 8.2 22.3 22.5 2.0 1.7 4.8 4.1 HSIL Ltd * 153 19% 17% 9.4 6.6 9.0 11.8 0.8 0.8 6.0 4.7 Cera Sanitaryware 93 27% 22% 12.6 10.7 25.4 23.9 2.9 2.3 7.9 6.7 Greenply Indst* 129 16% 42% 8.1 6.6 21.3 21.4 1.6 1.3 5.8 5.0 Century Plyboards 234 25% 31% 8.5 6.1 14.7 17.9 1.2 1.0 8.2 5.6 Berger Paints * 903 15% 16% 23.5 19.7 24.4 24.4 5.5 4.6 14.9 12.7 Asian Paints 7,323 17% 19% 34.8 28.8 37.6 36.9 11.8 9.7 22.0 18.2
Global comparables Geberit AG 8,126 9% 6% 19.1 17.8 27.4 27.6 5.4 4.9 13.4 12.6Cie de St‐Gobain 20,621 2% 7% 12.8 10.8 7.0 8.2 0.9 0.8 5.9 5.6Wienerberger AG 939 17% ‐ (22.9) (106.4) (1.6) (0.6) 0.4 0.4 8.0 6.7
Source: Bloomberg, PhillipCapital India Research (*PhillipCapital estimates)
Do these companies deserve valuation in‐line with other consumer companies ?
Comparison with consumer companies
Name MCap Revenue
CAGR Earnings
CAGR _______P/E_______ _______ROE_______ _______P/B_______ ____EV/EBITDA____ USD mn FY12‐14E FY12‐14E FY13E FY14E FY13E FY14E FY13E FY14E FY13E FY14E
FMCG Hindustan Unilever 20,364 15.8 21.2 33.4 29.1 96.5 92.5 32.6 22.9 23.6 20.0Marico 2,464 19.0 22.4 33.6 28.4 25.0 21.1 6.6 5.5 21.7 18.2Jubilant Foods 1,517 41.5 41.4 57.7 39.4 38.9 38.5 18.8 12.7 28.3 19.2Agrotech Foods 194 10.9 13.6 26.2 22.8 18.0 17.7 4.4 3.8 17.4 14.7
Automobiles Bajaj Auto 6,781 6% 2% 16.0 15.0 47.6 41.1 6.8 5.6 10.0 9.4Hero Honda 10,198 11% 12% 17.5 14.8 46.3 42.7 7.2 5.6 14.2 11.9Exide Industries 2,202 19% 27% 19.8 16.5 20.7 20.8 4.0 3.4 12.1 10.0
Home décor Havells Ltd 1,294 11% 11% 21.5 15.8 30.9 33.0 6.0 4.6 11.5 9.0Kajaria Ceramics 341 20% 28% 18.7 14.2 30.7 31.7 5.2 4.0 8.6 6.9HSIL Ltd 153 19% 17% 9.4 6.6 9.0 11.8 0.8 0.8 6.0 4.7Greenply Industries 129 16% 42% 8.1 6.6 21.3 21.4 1.6 1.3 5.8 5.0Berger Paints 903 15% 16% 23.5 19.7 24.4 24.4 5.5 4.6 14.9 12.7
Source: PhillipCapital India Research
13 of 94
4 December 2012 / INDIA EQUITY RESEARCH / HOME DÉCOR
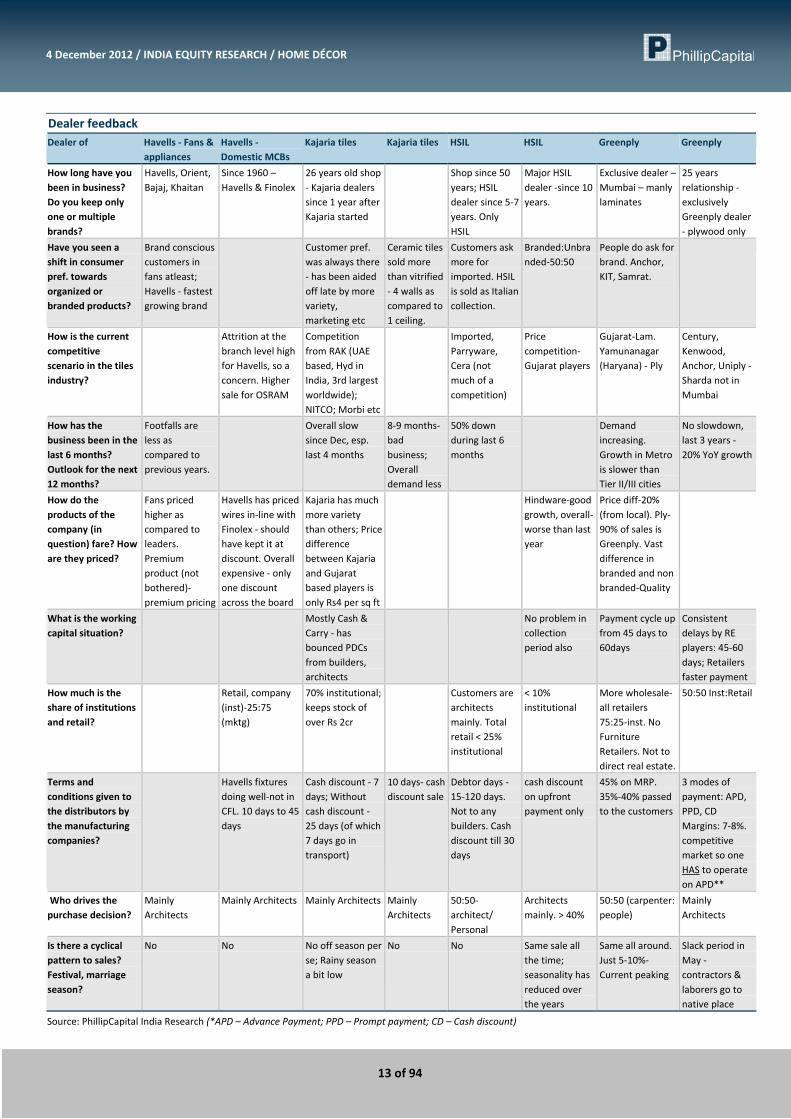
Dealer feedback Dealer of Havells ‐ Fans &
appliances Havells ‐ Domestic MCBs
Kajaria tiles Kajaria tiles HSIL HSIL Greenply Greenply
How long have you been in business? Do you keep only one or multiple brands?
Havells, Orient, Bajaj, Khaitan
Since 1960 – Havells & Finolex
26 years old shop ‐ Kajaria dealers since 1 year after Kajaria started
Shop since 50 years; HSIL dealer since 5‐7 years. Only HSIL
Major HSIL dealer ‐since 10 years.
Exclusive dealer – Mumbai – manly laminates
25 years relationship ‐ exclusively Greenply dealer ‐ plywood only
Have you seen a shift in consumer pref. towards organized or branded products?
Brand conscious customers in fans atleast; Havells ‐ fastest growing brand
Customer pref. was always there ‐ has been aided off late by more variety, marketing etc
Ceramic tiles sold more than vitrified ‐ 4 walls as compared to 1 ceiling.
Customers ask more for imported. HSIL is sold as Italian collection.
Branded:Unbranded‐50:50
People do ask for brand. Anchor, KIT, Samrat.
How is the current competitive scenario in the tiles industry?
Attrition at the branch level high for Havells, so a concern. Higher sale for OSRAM
Competition from RAK (UAE based, Hyd in India, 3rd largest worldwide); NITCO; Morbi etc
Imported, Parryware, Cera (not much of a competition)
Price competition‐Gujarat players
Gujarat‐Lam. Yamunanagar (Haryana) ‐ Ply
Century, Kenwood, Anchor, Uniply ‐ Sharda not in Mumbai
How has the business been in the last 6 months? Outlook for the next 12 months?
Footfalls are less as compared to previous years.
Overall slow since Dec, esp. last 4 months
8‐9 months‐ bad business; Overall demand less
50% down during last 6 months
Demand increasing. Growth in Metro is slower than Tier II/III cities
No slowdown, last 3 years ‐ 20% YoY growth
How do the products of the company (in question) fare? How are they priced?
Fans priced higher as compared to leaders. Premium product (not bothered)‐premium pricing
Havells has priced wires in‐line with Finolex ‐ should have kept it at discount. Overall expensive ‐ only one discount across the board
Kajaria has much more variety than others; Price difference between Kajaria and Gujarat based players is only Rs4 per sq ft
Hindware‐good growth, overall‐worse than last year
Price diff‐20% (from local). Ply‐90% of sales is Greenply. Vast difference in branded and non branded‐Quality
What is the working capital situation?
Mostly Cash & Carry ‐ has bounced PDCs from builders, architects
No problem in collection period also
Payment cycle up from 45 days to 60days
Consistent delays by RE players: 45‐60 days; Retailers faster payment
How much is the share of institutions and retail?
Retail, company (inst)‐25:75 (mktg)
70% institutional; keeps stock of over Rs 2cr
Customers are architects mainly. Total retail < 25% institutional
< 10% institutional
More wholesale‐all retailers 75:25‐inst. No Furniture Retailers. Not to direct real estate.
50:50 Inst:Retail
Terms and conditions given to the distributors by the manufacturing companies?
Havells fixtures doing well‐not in CFL. 10 days to 45 days
Cash discount ‐ 7 days; Without cash discount ‐ 25 days (of which 7 days go in transport)
10 days‐ cash discount sale
Debtor days ‐15‐120 days. Not to any builders. Cash discount till 30 days
cash discount on upfront payment only
45% on MRP. 35%‐40% passed to the customers
3 modes of payment: APD, PPD, CD Margins: 7‐8%. competitive market so one HAS to operate on APD**
Who drives the purchase decision?
Mainly Architects
Mainly Architects Mainly Architects Mainly Architects
50:50‐architect/ Personal
Architects mainly. > 40%
50:50 (carpenter: people)
Mainly Architects
Is there a cyclical pattern to sales? Festival, marriage season?
No No No off season per se; Rainy season a bit low
No No Same sale all the time; seasonality has reduced over the years
Same all around. Just 5‐10%‐ Current peaking
Slack period in May ‐ contractors & laborers go to native place
Source: PhillipCapital India Research (*APD – Advance Payment; PPD – Prompt payment; CD – Cash discount)

14 of 94
4 December 2012 / INDIA EQUITY RESEARCH / HOME DÉCOR
Compa
nies Section
– 15 of 94 –
Kajaria Ceramics Ltd Leadership through acquisitions and premiumisation
MIDCAP: HOME DÉCOR |Initiating Coverage 4 December 2012
PhillipCapital (India) Pvt. Ltd.
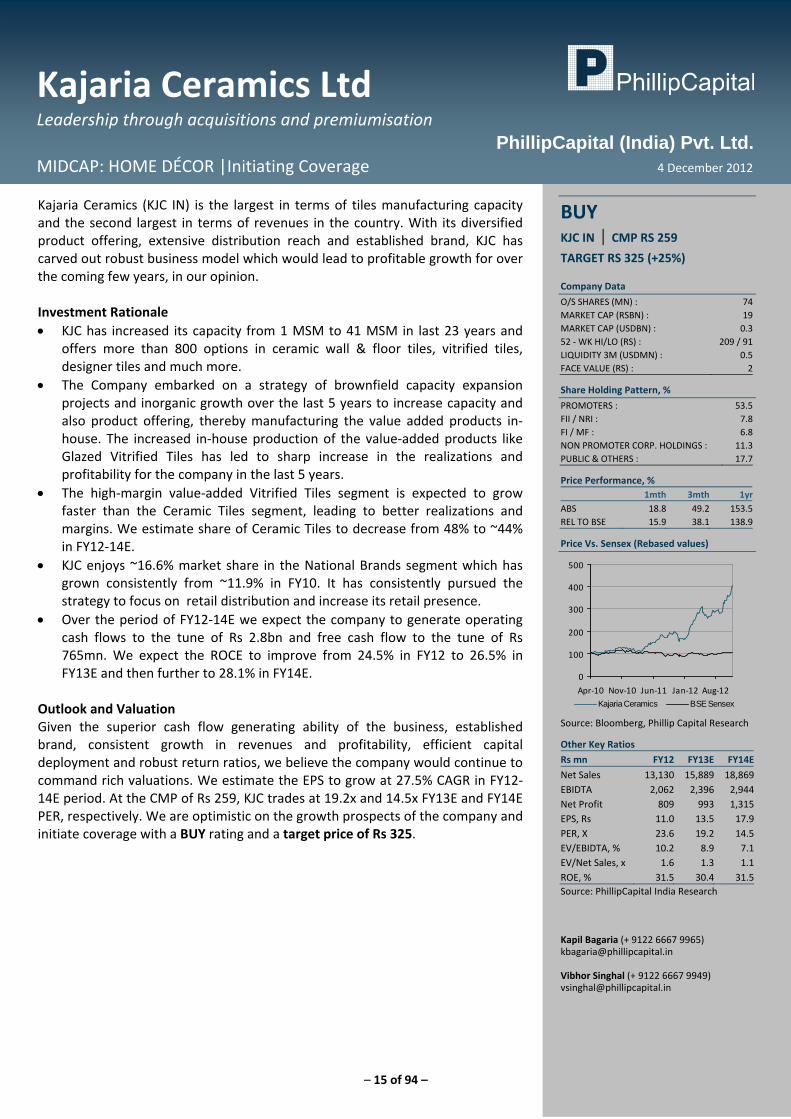
Kajaria Ceramics (KJC IN) is the largest in terms of tiles manufacturing capacity and the second largest in terms of revenues in the country. With its diversified product offering, extensive distribution reach and established brand, KJC has carved out robust business model which would lead to profitable growth for over the coming few years, in our opinion. Investment Rationale • KJC has increased its capacity from 1 MSM to 41 MSM in last 23 years and
offers more than 800 options in ceramic wall & floor tiles, vitrified tiles, designer tiles and much more.
• The Company embarked on a strategy of brownfield capacity expansion projects and inorganic growth over the last 5 years to increase capacity and also product offering, thereby manufacturing the value added products in‐house. The increased in‐house production of the value‐added products like Glazed Vitrified Tiles has led to sharp increase in the realizations and profitability for the company in the last 5 years.
• The high‐margin value‐added Vitrified Tiles segment is expected to grow faster than the Ceramic Tiles segment, leading to better realizations and margins. We estimate share of Ceramic Tiles to decrease from 48% to ~44% in FY12‐14E.
• KJC enjoys ~16.6% market share in the National Brands segment which has grown consistently from ~11.9% in FY10. It has consistently pursued the strategy to focus on retail distribution and increase its retail presence.
• Over the period of FY12‐14E we expect the company to generate operating cash flows to the tune of Rs 2.8bn and free cash flow to the tune of Rs 765mn. We expect the ROCE to improve from 24.5% in FY12 to 26.5% in FY13E and then further to 28.1% in FY14E.
Outlook and Valuation Given the superior cash flow generating ability of the business, established brand, consistent growth in revenues and profitability, efficient capital deployment and robust return ratios, we believe the company would continue to command rich valuations. We estimate the EPS to grow at 27.5% CAGR in FY12‐14E period. At the CMP of Rs 259, KJC trades at 19.2x and 14.5x FY13E and FY14E PER, respectively. We are optimistic on the growth prospects of the company and initiate coverage with a BUY rating and a target price of Rs 325.
BUY KJC IN | CMP RS 259
TARGET RS 325 (+25%) Company Data
O/S SHARES (MN) : 74MARKET CAP (RSBN) : 19MARKET CAP (USDBN) : 0.352 ‐ WK HI/LO (RS) : 209 / 91LIQUIDITY 3M (USDMN) : 0.5FACE VALUE (RS) : 2
Share Holding Pattern, %
PROMOTERS : 53.5FII / NRI : 7.8FI / MF : 6.8NON PROMOTER CORP. HOLDINGS : 11.3PUBLIC & OTHERS : 17.7
Price Performance, % 1mth 3mth 1yr
ABS 18.8 49.2 153.5REL TO BSE 15.9 38.1 138.9
Price Vs. Sensex (Rebased values)
0
100
200
300
400
500
Apr‐10 Nov‐10 Jun‐11 Jan‐12 Aug‐12Kajaria Ceramics BSE Sensex
Source: Bloomberg, Phillip Capital Research
Other Key Ratios
Rs mn FY12 FY13E FY14E
Net Sales 13,130 15,889 18,869EBIDTA 2,062 2,396 2,944Net Profit 809 993 1,315EPS, Rs 11.0 13.5 17.9PER, X 23.6 19.2 14.5EV/EBIDTA, % 10.2 8.9 7.1EV/Net Sales, x 1.6 1.3 1.1ROE, % 31.5 30.4 31.5Source: PhillipCapital India Research Kapil Bagaria (+ 9122 6667 9965) [email protected] Vibhor Singhal (+ 9122 6667 9949) [email protected]
– 16 of 94 –
4 December 2012 / INDIA EQUITY RESEARCH / KAJARIA CERAMIC
Investment Overview At the CMP of Rs 216, KJC trades at 19.2x FY13E and 14.5x FY14E PER, respectively. In terms of EV/EBIDTA, the stock trades at 8.9x and 7.1x, on FY13E and FY14E financials respectively. Given the superior cash flow generating ability of the business, established brand, consistent growth in revenues and profitability, efficient capital deployment and robust return ratios, we believe the company would continue to command higher valuations. We are optimistic on the growth prospects of the company and initiate coverage with a BUY rating and a target price of Rs 325. Challenges • The demand for tiles is discretionary in nature and is viewed as lifestyle enhancing.
Consumer sentiment plays a vital role in determining the demand for Tiles. Upbeat consumer confidence will lead to good demand for these products whereas vice‐versa is also very much applicable. Concerns over rise in prices of essential commodities and worries about employment prospects have dragged down the confidence of urban consumers in India during September 2012, says a study by financial services provider BluFin. BluFin's Consumer Confidence Index (CCI) slipped by 2.9 points from August to 36.7 in September. This was the biggest month‐on‐month decline to date for the index. This short term decline in the consumer confidence may lead to lower growth in the short term.
• Chinese products were posing stiff competition to the profitability of Indian tile manufacturers prior to 2008‐09. To safeguard the interest of the Indian manufacturers, anti‐dumping duty was levied on ceramic tiles in 2009. Currently, anti‐dumping duty of Rs 137 per SQM is imposed on ceramics tiles of over 16 cms in size and Rs 215 per SQM on all vitrified tiles imported from China. The date for review of this Anti‐dumping duty is being set as December 2014. If this duty is not retained it could pose a threat of cheaper imports after December 2014.
• Unorganised sector accounts for 50% of the total tiles industry. These unorganized players have lower fixed overheads enabling them to keep the pricing competitive and garner market share. Stiff competition from players in the unorganised segment can exert pressure on margins. We believe that KJC’s strategy to increase the brand awareness through advertisements and brand building initiatives will help it to compete with organised as well as unorganised players.
• During FY12, net imports of the company stood at ~18.5% of the net revenues (although lower as compared to 29.5% in FY11) but still the currency depreciation does impact the profitability of the company quite significantly. Thus sharp depreciation of rupee impacts the margins of the company adversely. We believe that the reducing trend in imports as a percentage of sales (due to enhanced in‐house manufacturing capabilities) will lower the volatility of profits on this account.

– 17 of 94 –
4 December 2012 / INDIA EQUITY RESEARCH / KAJARIA CERAMIC
Assumptions and value drivers Key data and assumptions FY10 FY11 FY12 FY13E FY14E
Costs (Rs per MSM)
‐ Raw Material cost 49.5 56.4 49.6 50.1 49.9
‐ Staff Cost 60.1 103.2 67.3 67.9 67.7
‐ Power & Fuel cost 1.7 1.7 1.7 1.7 1.7
‐ Other Exp 5.9 4.5 3.7 4.3 4.3
‐ Advertising Expenses 14.3 9.8 16.0 16.0 16.0
‐ Total A&SP 8.3 8.0 8.2 8.2 7.9
‐ Interest Cost 26.5 20.0 26.6 26.7 26.5
‐ Depreciation 5.1 3.2 3.7 3.0 2.5
Margins
‐ Gross margin per MSM 146.8 139.6 168.2 182.2 191.2
‐ EBIDTA Margin per MSM 48.5 41.3 47.3 50.3 51.7
‐ PAT Margin per MSM 15.6 15.5 15.7 15.1 15.6
‐ Gross Margin % 12.1 12.5 12.8 12.3 13.1
‐ EBIDTA Margins % 7.0 9.4 9.1 9.4 10.6
‐ EBIT Margins % 4.9 6.4 6.2 6.4 7.2
‐ PBT Margins % 45.4 49.8 52.4 55.1 59.6
‐ PAT Margins % 14.2 20.4 20.5 22.8 26.6
Sales
‐ Volumes 25.3 29.7 39.4 43.5 49.4
YoY growth, % 11.9 17.5 32.5 10.5 13.5
‐ Realisation (Rs per MSM) 302.8 337.7 355.3 362.4 369.7
YoY growth, % (0.8) 11.5 5.2 2.0 2.0
‐ Realisation (Rs per SQFT) 28.1 31.4 33.0 33.7 34.3
Share of Total Sales
‐ Mfg Sales as % of Total Sales 62.5 54.7 62.8 63.2 64.4
‐ Outsourced Sales as % of Total Sales 37.5 45.3 37.2 36.8 35.6
‐ Ceramic Tiles as % of Total Sales 63 51 48 46 44
‐ Polishes Vitirified Tiles as % of Total Sales 23 33 36 37 39
‐ Glazed Vitirified Tiles as % of Total Sales 8 12 10 10 10
‐ Kajaria World as % of Total Sales 5 3 5 6 6
‐ Bathware / Wooden as % of total Sales ‐ 0.8 1.1 1.1 1.1
Source: Company, PhillipCapital India Research Estimates
Working Capital
Days FY10 FY11 FY12 FY13E FY14E
Inventory Turnover 70 59 52 53 54
Debtor Turnover 38 36 40 40 39
Creditor Turnover 60 91 74 70 65
Source: Company, PhillipCapital India Research Estimates

– 18 of 94 –
4 December 2012 / INDIA EQUITY RESEARCH / KAJARIA CERAMIC
Company Overview • Kajaria Ceramics is the largest manufacturers of ceramic and vitrified tiles in India
with an annual aggregate capacity of 41 MSM. Founded more than two decades ago by Mr. Ashok Kajaria, it is today the second largest in terms of revenues in the country only to H&R Johnson. The manufacturing capacities are distributed across six plants – Sikandrabad in Uttar Pradesh, Gailpur in Rajasthan, three plants in Morbi in Gujarat and one at Vijayawada in Andhra Pradesh. Its Gailpur plant is India’s largest tile manufacturing capacity in a single location with installed capacity of 20.1 MSM. KJC is a member of the Indian Green Building Council, reassuring that its products are eco‐friendly. It is the world’s only ceramic tile company to receive the ISO:50001 certificate (for energy conservation).
• KJC has increased its capacity from 1 MSM to 41 MSM in last 23 years and offers more than 800 options in ceramic wall & floor tiles, vitrified tiles, designer tiles and much more. These tiles come in a wide range of colours and textures to complement bathrooms, living rooms, corridors, study rooms & kitchen. It has pioneered the digitally polished glazed vitrified tiles in India (60x60cm).
• The company’s products are marketed across India through an extensive distribution network of dealers (825), sub‐dealers, company‐owned showrooms and also through the project sales to major real estate developers. It derives 70% of its revenue from retail customers, while institutional sales account for 30%.
• Over the years, the company has developed three pillars of growth – namely State of the art huge installed capacities, pan‐India distribution network to reach out to the consumers and the Kajaria brand.
• KJC forayed into the high‐end sanitaryware business which positions the company as a complete bathroom solution provider by way of tie up with VitrA (Eczacibasi Group from Turkey) and also established a foothold in wooden flooring solutions, by way of import from China.
• The sales volume for the company has increased at 17.3% CAGR during FY08‐12 period as they jumped from 20.8 MSM in FY08 to 39.4 MSM in FY12. Consequently the net revenues for the company rose by 27.1% from Rs 5bn in FY08 to Rs 13bn in FY12. EBIDTA during the said period has also increased at a CAGR of 26% from Rs 819mn in FY08 to Rs 2,062mn in FY12. PAT for the period from FY08‐12 has registered a CAGR of 52.3% as it increased from Rs 150mn in FY08 to Rs 809mn in FY12.
Manufacturing facilities The company has manufacturing capacities distributed across six plants‐Sikandrabad in Uttar Pradesh, Gailpur in Rajasthan, three plants in Morbi in Gujarat and one at Vijayawada in Andhra Pradesh. The current manufacturing capacity of the company stands at 41 MSM across all the plants. Its Gailpur plant is India’s largest tile manufacturing capacity in a single location with installed capacity of 20.1 MSM. KJC is a member of the Indian Green Building Council, reassuring that its products are eco‐friendly.
– 19 of 94 –
4 December 2012 / INDIA EQUITY RESEARCH / KAJARIA CERAMIC
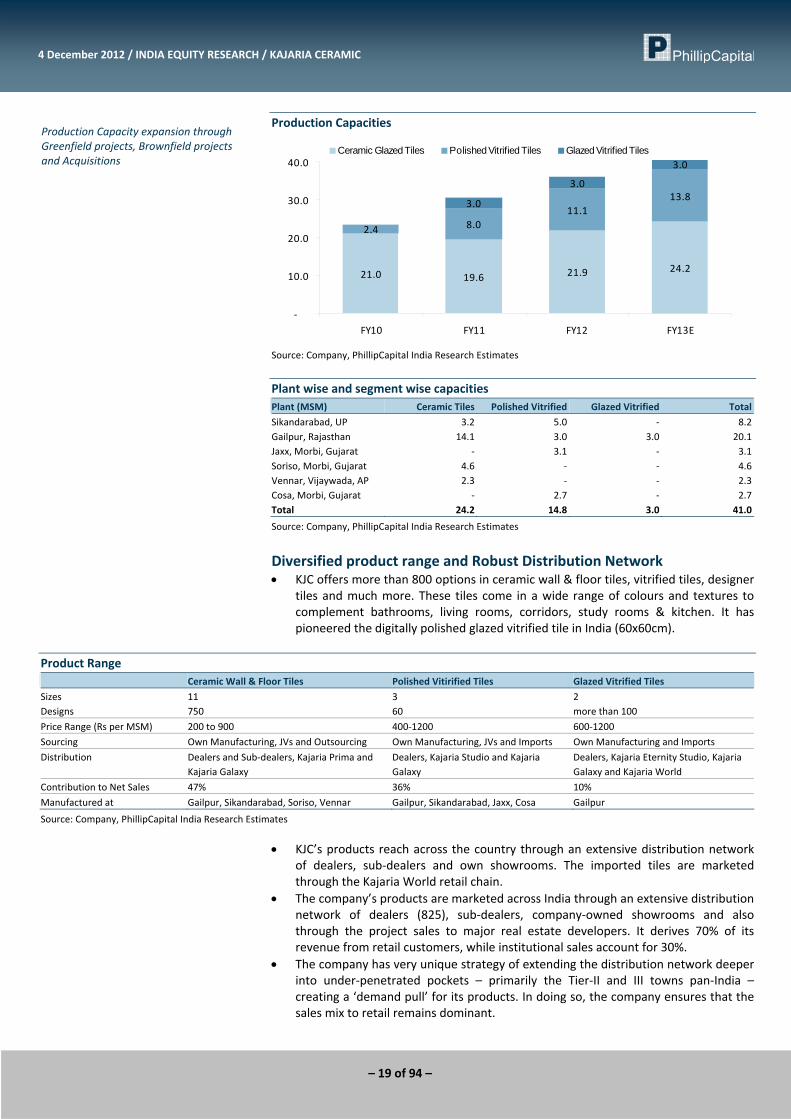
Production Capacities
21.0 19.6 21.9 24.2
2.4 8.011.1
13.83.0
3.0
3.0
‐
10.0
20.0
30.0
40.0
FY10 FY11 FY12 FY13E
Ceramic Glazed Tiles Polished Vitrified Tiles Glazed Vitrified Tiles
Source: Company, PhillipCapital India Research Estimates
Plant wise and segment wise capacities Plant (MSM) Ceramic Tiles Polished Vitrified Glazed Vitrified Total
Sikandarabad, UP 3.2 5.0 ‐ 8.2Gailpur, Rajasthan 14.1 3.0 3.0 20.1Jaxx, Morbi, Gujarat ‐ 3.1 ‐ 3.1Soriso, Morbi, Gujarat 4.6 ‐ ‐ 4.6Vennar, Vijaywada, AP 2.3 ‐ ‐ 2.3Cosa, Morbi, Gujarat ‐ 2.7 ‐ 2.7Total 24.2 14.8 3.0 41.0
Source: Company, PhillipCapital India Research Estimates
Diversified product range and Robust Distribution Network • KJC offers more than 800 options in ceramic wall & floor tiles, vitrified tiles, designer
tiles and much more. These tiles come in a wide range of colours and textures to complement bathrooms, living rooms, corridors, study rooms & kitchen. It has pioneered the digitally polished glazed vitrified tile in India (60x60cm).
Product Range Ceramic Wall & Floor Tiles Polished Vitirified Tiles Glazed Vitrified Tiles Sizes 11 3 2 Designs 750 60 more than 100 Price Range (Rs per MSM) 200 to 900 400‐1200 600‐1200 Sourcing Own Manufacturing, JVs and Outsourcing Own Manufacturing, JVs and Imports Own Manufacturing and Imports Distribution Dealers and Sub‐dealers, Kajaria Prima and
Kajaria Galaxy Dealers, Kajaria Studio and Kajaria Galaxy
Dealers, Kajaria Eternity Studio, Kajaria Galaxy and Kajaria World
Contribution to Net Sales 47% 36% 10% Manufactured at Gailpur, Sikandarabad, Soriso, Vennar Gailpur, Sikandarabad, Jaxx, Cosa Gailpur Source: Company, PhillipCapital India Research Estimates
• KJC’s products reach across the country through an extensive distribution network of dealers, sub‐dealers and own showrooms. The imported tiles are marketed through the Kajaria World retail chain.
• The company’s products are marketed across India through an extensive distribution network of dealers (825), sub‐dealers, company‐owned showrooms and also through the project sales to major real estate developers. It derives 70% of its revenue from retail customers, while institutional sales account for 30%.
• The company has very unique strategy of extending the distribution network deeper into under‐penetrated pockets – primarily the Tier‐II and III towns pan‐India – creating a ‘demand pull’ for its products. In doing so, the company ensures that the sales mix to retail remains dominant.
Production Capacity expansion through Greenfield projects, Brownfield projects and Acquisitions
– 20 of 94 –
4 December 2012 / INDIA EQUITY RESEARCH / KAJARIA CERAMIC
Investment Thesis
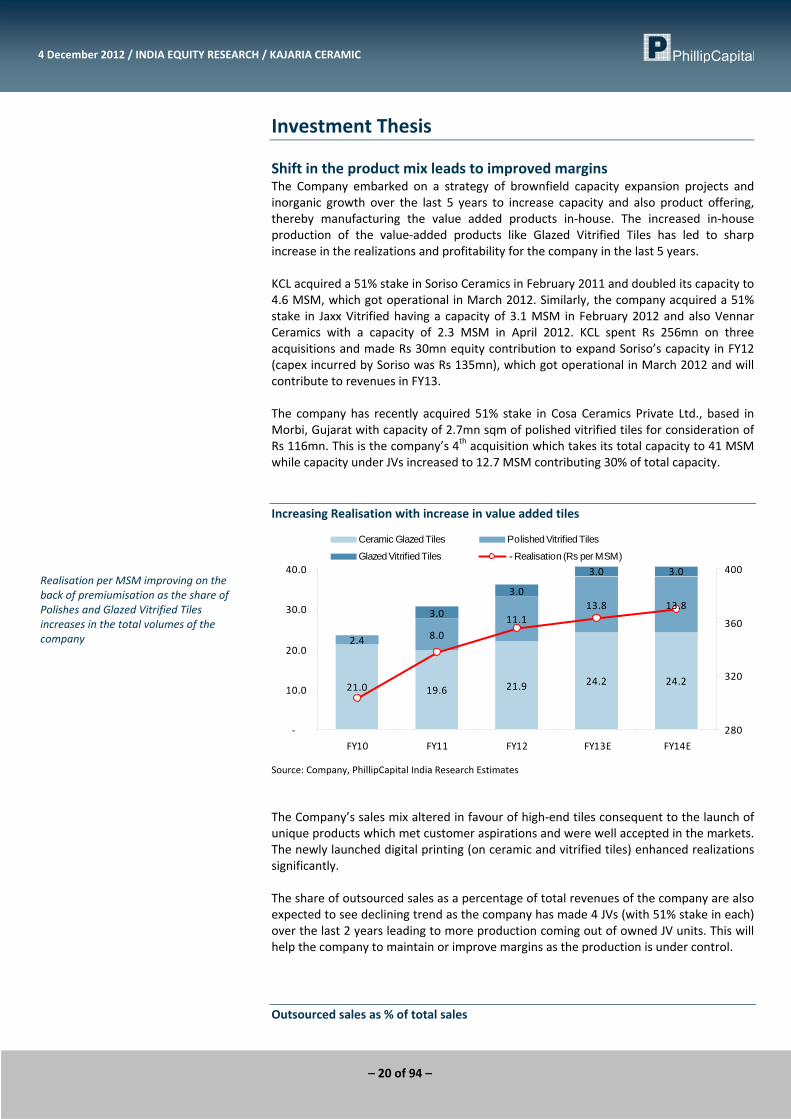
Shift in the product mix leads to improved margins The Company embarked on a strategy of brownfield capacity expansion projects and inorganic growth over the last 5 years to increase capacity and also product offering, thereby manufacturing the value added products in‐house. The increased in‐house production of the value‐added products like Glazed Vitrified Tiles has led to sharp increase in the realizations and profitability for the company in the last 5 years. KCL acquired a 51% stake in Soriso Ceramics in February 2011 and doubled its capacity to 4.6 MSM, which got operational in March 2012. Similarly, the company acquired a 51% stake in Jaxx Vitrified having a capacity of 3.1 MSM in February 2012 and also Vennar Ceramics with a capacity of 2.3 MSM in April 2012. KCL spent Rs 256mn on three acquisitions and made Rs 30mn equity contribution to expand Soriso’s capacity in FY12 (capex incurred by Soriso was Rs 135mn), which got operational in March 2012 and will contribute to revenues in FY13. The company has recently acquired 51% stake in Cosa Ceramics Private Ltd., based in Morbi, Gujarat with capacity of 2.7mn sqm of polished vitrified tiles for consideration of Rs 116mn. This is the company’s 4th acquisition which takes its total capacity to 41 MSM while capacity under JVs increased to 12.7 MSM contributing 30% of total capacity. Increasing Realisation with increase in value added tiles
21.0 19.6 21.9 24.2 24.2
2.4 8.0
11.113.8 13.8
3.0
3.0
3.0 3.0
‐
10.0
20.0
30.0
40.0
FY10 FY11 FY12 FY13E FY14E
280
320
360
400
Ceramic Glazed Tiles Polished Vitrified Tiles
Glazed Vitrified Tiles - Realisation (Rs per MSM)
Source: Company, PhillipCapital India Research Estimates
The Company’s sales mix altered in favour of high‐end tiles consequent to the launch of unique products which met customer aspirations and were well accepted in the markets. The newly launched digital printing (on ceramic and vitrified tiles) enhanced realizations significantly. The share of outsourced sales as a percentage of total revenues of the company are also expected to see declining trend as the company has made 4 JVs (with 51% stake in each) over the last 2 years leading to more production coming out of owned JV units. This will help the company to maintain or improve margins as the production is under control. Outsourced sales as % of total sales
Realisation per MSM improving on the back of premiumisation as the share of Polishes and Glazed Vitrified Tiles increases in the total volumes of the company
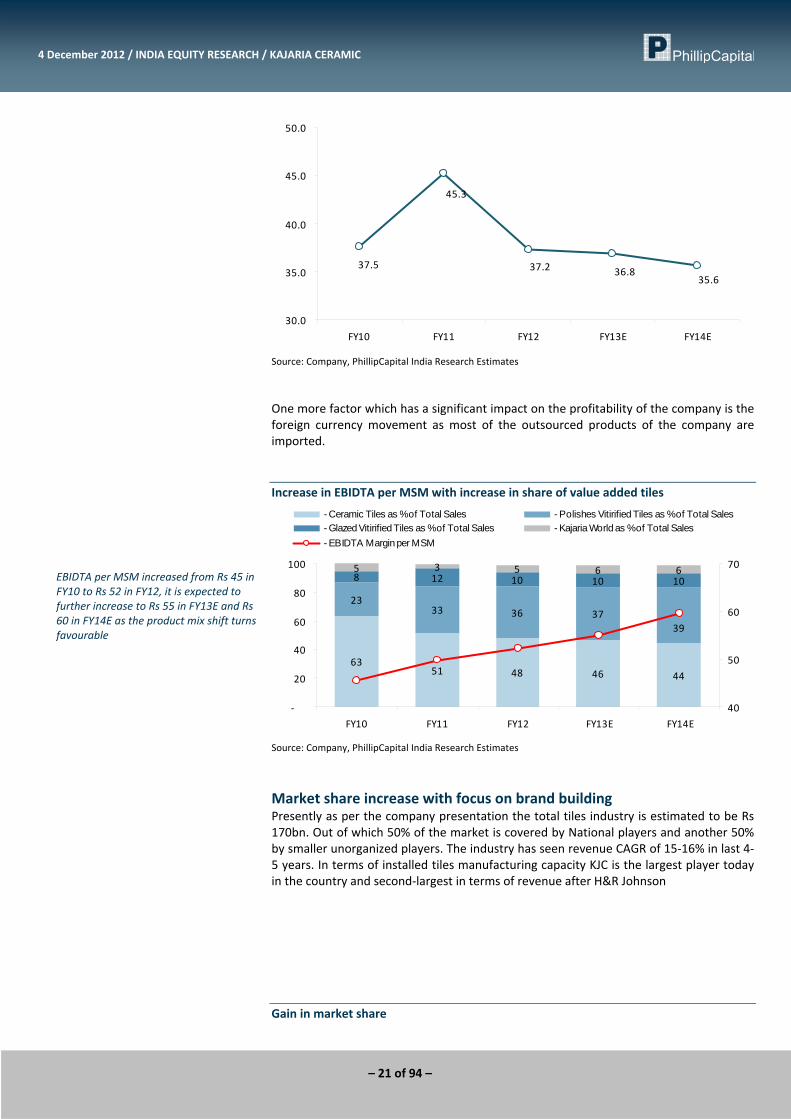
– 21 of 94 –
4 December 2012 / INDIA EQUITY RESEARCH / KAJARIA CERAMIC
37.5
45.3
37.2 36.835.6
30.0
35.0
40.0
45.0
50.0
FY10 FY11 FY12 FY13E FY14E
Source: Company, PhillipCapital India Research Estimates
One more factor which has a significant impact on the profitability of the company is the foreign currency movement as most of the outsourced products of the company are imported. Increase in EBIDTA per MSM with increase in share of value added tiles
6351 48 46 44
2333 36 37
8 12 10 10 105 3 5 6
39
6
‐
20
40
60
80
100
FY10 FY11 FY12 FY13E FY14E
40
50
60
70
- Ceramic Tiles as % of Total Sales - Polishes Vitirified Tiles as % of Total Sales - Glazed Vitirified Tiles as % of Total Sales - Kajaria World as % of Total Sales - EBIDTA Margin per MSM
Source: Company, PhillipCapital India Research Estimates
Market share increase with focus on brand building Presently as per the company presentation the total tiles industry is estimated to be Rs 170bn. Out of which 50% of the market is covered by National players and another 50% by smaller unorganized players. The industry has seen revenue CAGR of 15‐16% in last 4‐5 years. In terms of installed tiles manufacturing capacity KJC is the largest player today in the country and second‐largest in terms of revenue after H&R Johnson Gain in market share
EBIDTA per MSM increased from Rs 45 in FY10 to Rs 52 in FY12, it is expected to further increase to Rs 55 in FY13E and Rs 60 in FY14E as the product mix shift turns favourable

– 22 of 94 –
4 December 2012 / INDIA EQUITY RESEARCH / KAJARIA CERAMIC
18.519.9 20.3
11.913.6
16.6
‐
5
10
15
20
25
FY10 FY11 FY12
‐
10
20
30
40
50
Mkt Share for HRJ, % Mkt Share for KJC, %
HRJ YoY Sales growth, % KJC YoY Sales growth, %
Source: Company, PhillipCapital India Research Estimates
As per FY12 data, KJC enjoys ~16.6% market share in the National Brands segment. Over the years, the company has narrowed the gap between itself and the largest player H&R Johnson. The market share for KJC has increased from 11.9% in FY10 to 13.6% in FY11 and then to 16.6% in FY12. KJC reported revenue growth of 40.2% during FY12 as against 17.4% revenue growth reported by H&R Johnson. KJC has consistently pursued the strategy to focus on retail distribution and increase its retail presence, whereas HRJ is more focused on government projects and thus KJC has benefitted from the brand building initiatives as the consumers become more brand conscious.
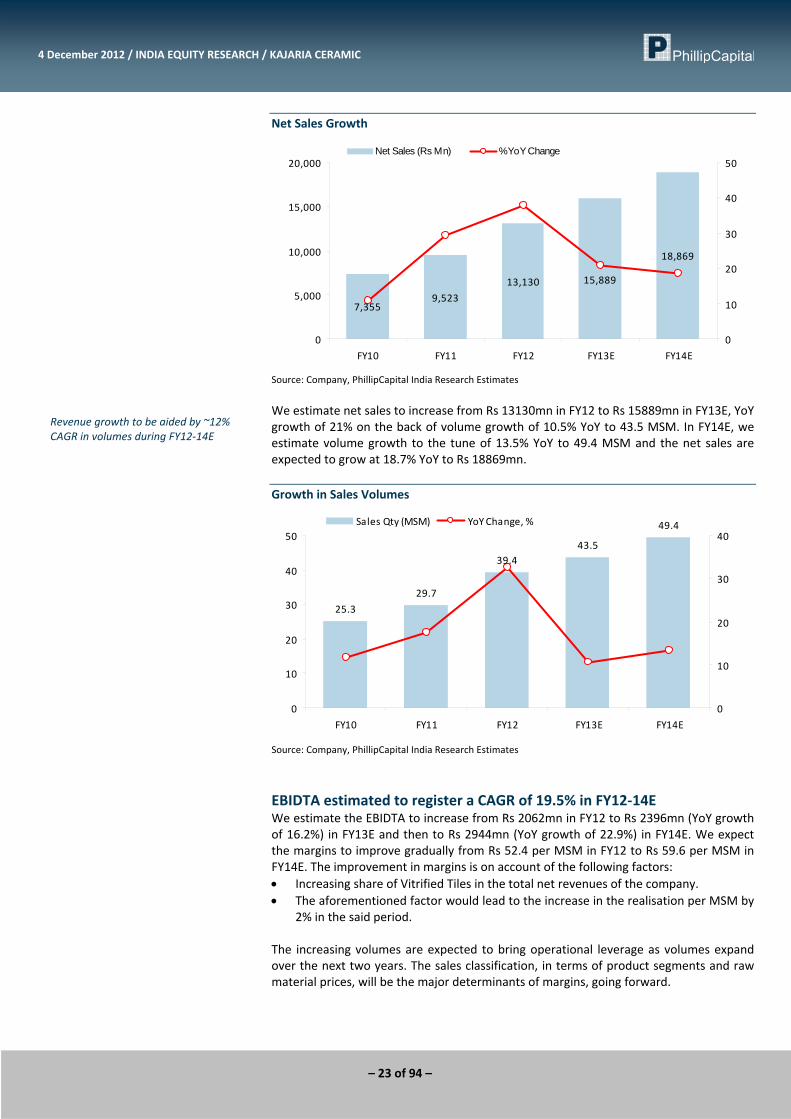
Revenue growth of 19.9% during FY12‐14E We expect revenue to grow at a CAGR of 19.9% for FY12‐FY14E for the company on the back of volume growth of 12%. We estimate volumes to climb to 43.5 MSM in FY13E (YoY increase of ~10.5%) and then to 49.4 MSM in FY14E (YoY growth of 13.5%), registering a CAGR of 12% in FY12‐FY14E. The high‐margin value‐added Vitrified Tiles segment is expected to grow faster than the Ceramic Tiles segment. We estimate the share of Ceramic Tiles to decrease from 48% in FY12 to ~44% in FY14E. This share has already seen a decline from 63% in FY10 to 48% in FY12. The share of Vitrified Tiles (Glazed as well as Polished) as a percentage of total sales is expected to increase from 46% in FY12 to ~49% in FY14E. Thus, we expect the high‐margin business to increase its share to the total revenues at the expense of the low‐margin businesses, leading to better realisation and better profitability.
Growing faster than the industry leader and gaining market share
– 23 of 94 –
4 December 2012 / INDIA EQUITY RESEARCH / KAJARIA CERAMIC
Net Sales Growth
7,3559,523
13,130
18,869
15,889
0
5,000
10,000
15,000
20,000
FY10 FY11 FY12 FY13E FY14E
0
10
20
30
40
50Net Sales (Rs Mn) % YoY Change
Source: Company, PhillipCapital India Research Estimates
We estimate net sales to increase from Rs 13130mn in FY12 to Rs 15889mn in FY13E, YoY growth of 21% on the back of volume growth of 10.5% YoY to 43.5 MSM. In FY14E, we estimate volume growth to the tune of 13.5% YoY to 49.4 MSM and the net sales are expected to grow at 18.7% YoY to Rs 18869mn. Growth in Sales Volumes
25.3
29.7
39.443.5
49.4
0
10
20
30
40
50
FY10 FY11 FY12 FY13E FY14E
0
10
20
30
40Sales Qty (MSM) YoY Change, %
Source: Company, PhillipCapital India Research Estimates
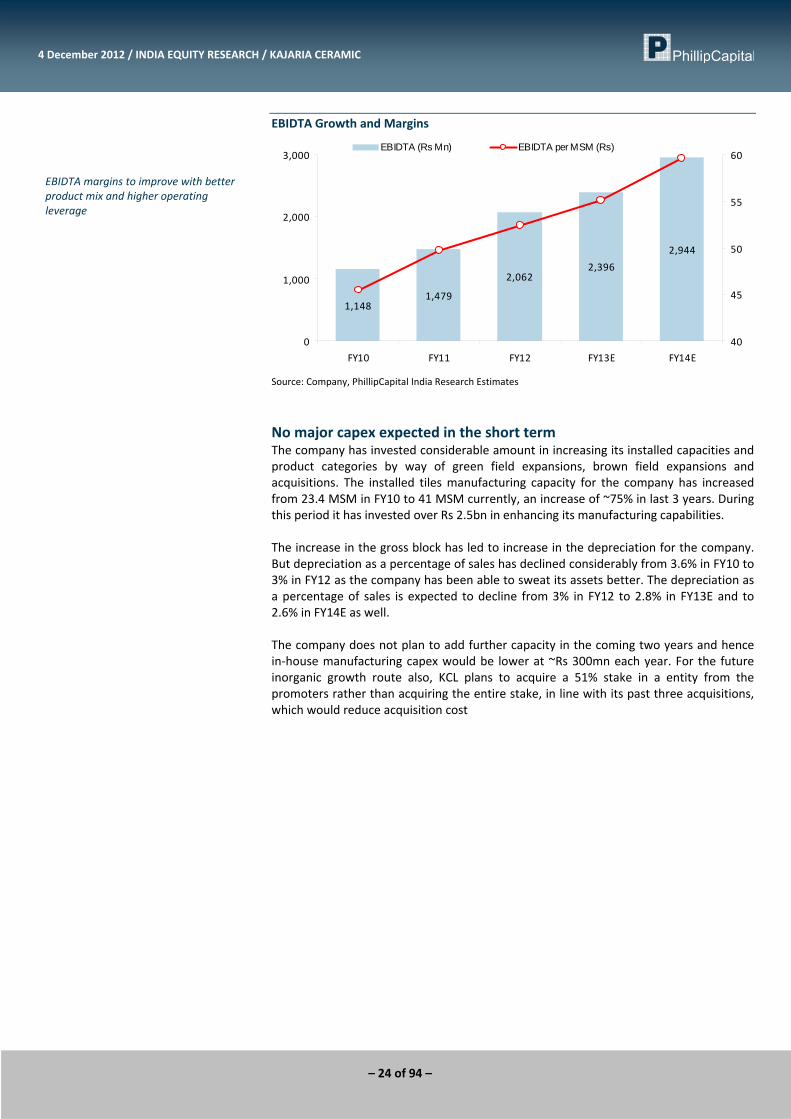
EBIDTA estimated to register a CAGR of 19.5% in FY12‐14E We estimate the EBIDTA to increase from Rs 2062mn in FY12 to Rs 2396mn (YoY growth of 16.2%) in FY13E and then to Rs 2944mn (YoY growth of 22.9%) in FY14E. We expect the margins to improve gradually from Rs 52.4 per MSM in FY12 to Rs 59.6 per MSM in FY14E. The improvement in margins is on account of the following factors: • Increasing share of Vitrified Tiles in the total net revenues of the company. • The aforementioned factor would lead to the increase in the realisation per MSM by
2% in the said period. The increasing volumes are expected to bring operational leverage as volumes expand over the next two years. The sales classification, in terms of product segments and raw material prices, will be the major determinants of margins, going forward.
Revenue growth to be aided by ~12% CAGR in volumes during FY12‐14E
– 24 of 94 –
4 December 2012 / INDIA EQUITY RESEARCH / KAJARIA CERAMIC
EBIDTA Growth and Margins
1,1481,479
2,0622,396
2,944
0
1,000
2,000
3,000
FY10 FY11 FY12 FY13E FY14E
40
45
50
55
60EBIDTA (Rs Mn) EBIDTA per MSM (Rs)
Source: Company, PhillipCapital India Research Estimates
No major capex expected in the short term The company has invested considerable amount in increasing its installed capacities and product categories by way of green field expansions, brown field expansions and acquisitions. The installed tiles manufacturing capacity for the company has increased from 23.4 MSM in FY10 to 41 MSM currently, an increase of ~75% in last 3 years. During this period it has invested over Rs 2.5bn in enhancing its manufacturing capabilities. The increase in the gross block has led to increase in the depreciation for the company. But depreciation as a percentage of sales has declined considerably from 3.6% in FY10 to 3% in FY12 as the company has been able to sweat its assets better. The depreciation as a percentage of sales is expected to decline from 3% in FY12 to 2.8% in FY13E and to 2.6% in FY14E as well. The company does not plan to add further capacity in the coming two years and hence in‐house manufacturing capex would be lower at ~Rs 300mn each year. For the future inorganic growth route also, KCL plans to acquire a 51% stake in a entity from the promoters rather than acquiring the entire stake, in line with its past three acquisitions, which would reduce acquisition cost
EBIDTA margins to improve with better product mix and higher operating leverage
– 25 of 94 –
4 December 2012 / INDIA EQUITY RESEARCH / KAJARIA CERAMIC
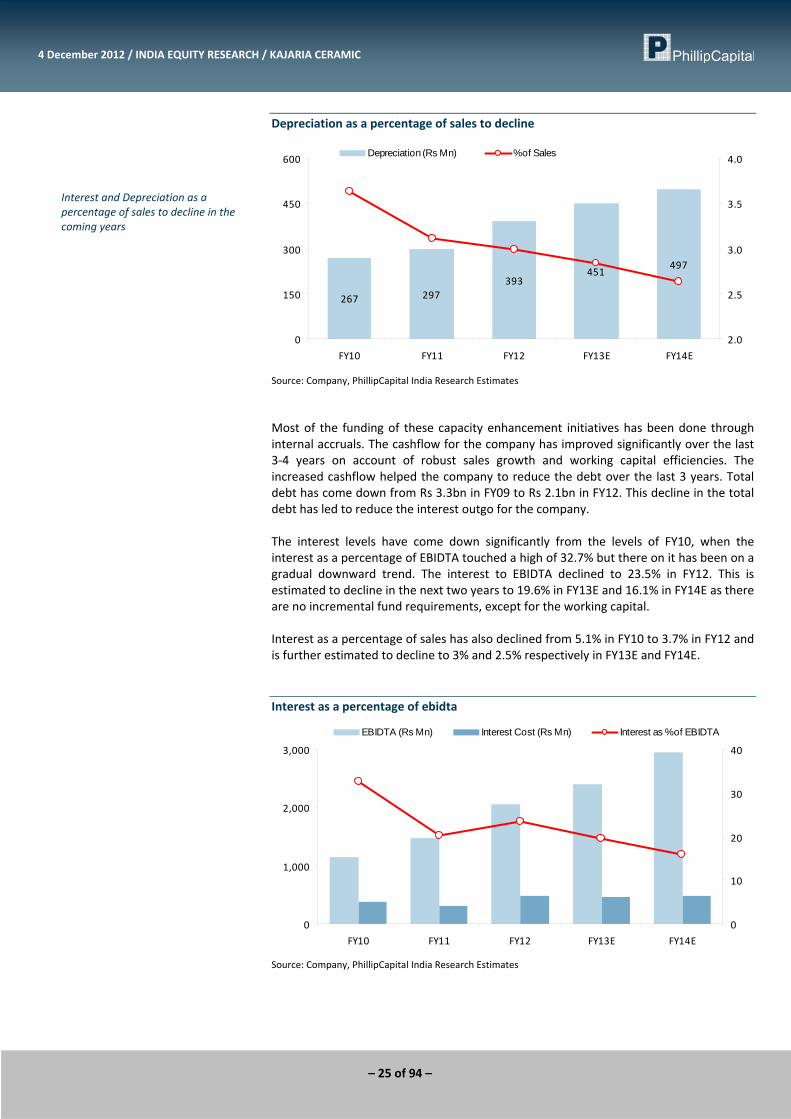
Depreciation as a percentage of sales to decline
267 297393
451497
0
150
300
450
600
FY10 FY11 FY12 FY13E FY14E
2.0
2.5
3.0
3.5
4.0Depreciation (Rs Mn) % of Sales
Source: Company, PhillipCapital India Research Estimates
Most of the funding of these capacity enhancement initiatives has been done through internal accruals. The cashflow for the company has improved significantly over the last 3‐4 years on account of robust sales growth and working capital efficiencies. The increased cashflow helped the company to reduce the debt over the last 3 years. Total debt has come down from Rs 3.3bn in FY09 to Rs 2.1bn in FY12. This decline in the total debt has led to reduce the interest outgo for the company. The interest levels have come down significantly from the levels of FY10, when the interest as a percentage of EBIDTA touched a high of 32.7% but there on it has been on a gradual downward trend. The interest to EBIDTA declined to 23.5% in FY12. This is estimated to decline in the next two years to 19.6% in FY13E and 16.1% in FY14E as there are no incremental fund requirements, except for the working capital. Interest as a percentage of sales has also declined from 5.1% in FY10 to 3.7% in FY12 and is further estimated to decline to 3% and 2.5% respectively in FY13E and FY14E. Interest as a percentage of ebidta
0
1,000
2,000
3,000
FY10 FY11 FY12 FY13E FY14E
0
10
20
30
40
EBIDTA (Rs Mn) Interest Cost (Rs Mn) Interest as % of EBIDTA
Source: Company, PhillipCapital India Research Estimates
Interest and Depreciation as a percentage of sales to decline in the coming years
– 26 of 94 –
4 December 2012 / INDIA EQUITY RESEARCH / KAJARIA CERAMIC
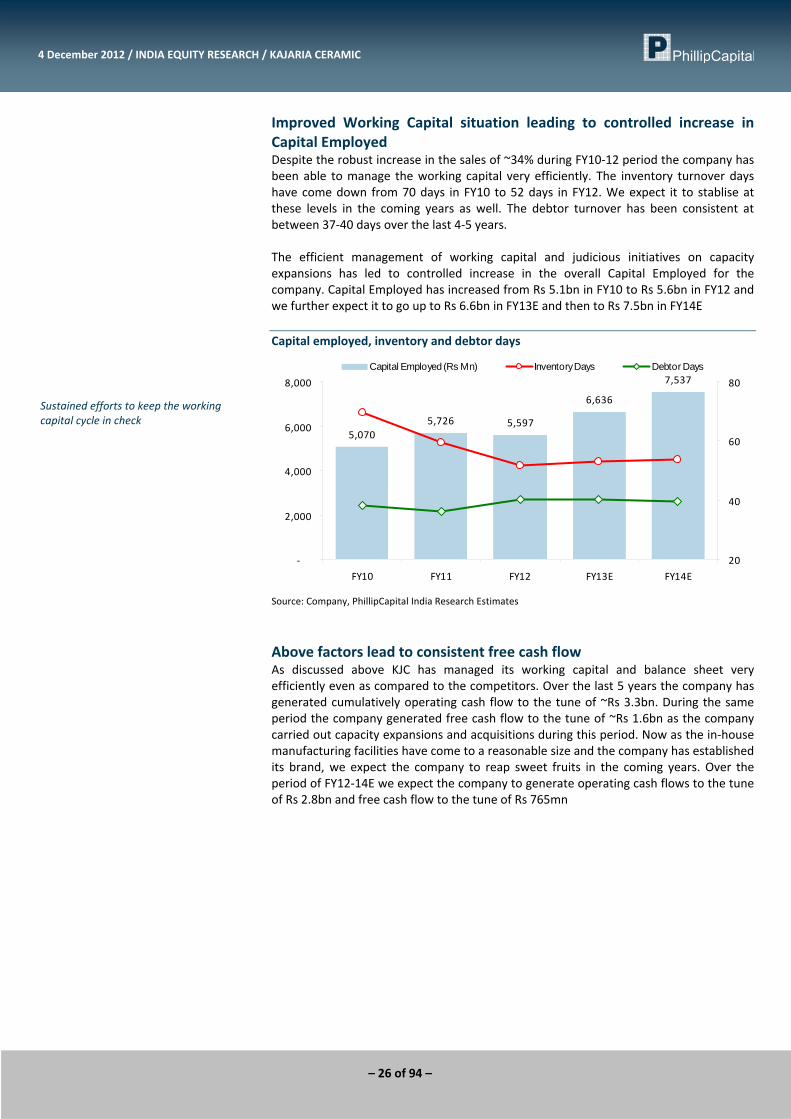
Improved Working Capital situation leading to controlled increase in Capital Employed Despite the robust increase in the sales of ~34% during FY10‐12 period the company has been able to manage the working capital very efficiently. The inventory turnover days have come down from 70 days in FY10 to 52 days in FY12. We expect it to stablise at these levels in the coming years as well. The debtor turnover has been consistent at between 37‐40 days over the last 4‐5 years. The efficient management of working capital and judicious initiatives on capacity expansions has led to controlled increase in the overall Capital Employed for the company. Capital Employed has increased from Rs 5.1bn in FY10 to Rs 5.6bn in FY12 and we further expect it to go up to Rs 6.6bn in FY13E and then to Rs 7.5bn in FY14E Capital employed, inventory and debtor days
5,0705,726 5,597
6,636
7,537
‐
2,000
4,000
6,000
8,000
FY10 FY11 FY12 FY13E FY14E
20
40
60
80
Capital Employed (Rs Mn) Inventory Days Debtor Days
Source: Company, PhillipCapital India Research Estimates
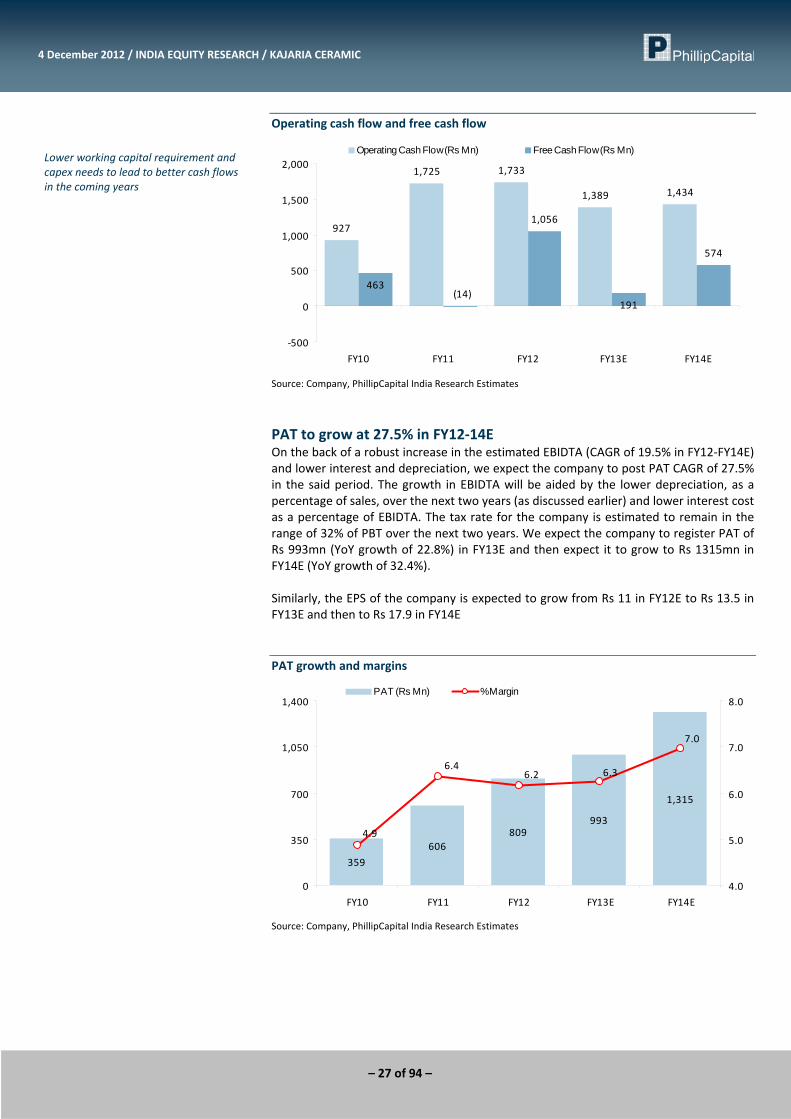
Above factors lead to consistent free cash flow As discussed above KJC has managed its working capital and balance sheet very efficiently even as compared to the competitors. Over the last 5 years the company has generated cumulatively operating cash flow to the tune of ~Rs 3.3bn. During the same period the company generated free cash flow to the tune of ~Rs 1.6bn as the company carried out capacity expansions and acquisitions during this period. Now as the in‐house manufacturing facilities have come to a reasonable size and the company has established its brand, we expect the company to reap sweet fruits in the coming years. Over the period of FY12‐14E we expect the company to generate operating cash flows to the tune of Rs 2.8bn and free cash flow to the tune of Rs 765mn
Sustained efforts to keep the working capital cycle in check
– 27 of 94 –
4 December 2012 / INDIA EQUITY RESEARCH / KAJARIA CERAMIC
Operating cash flow and free cash flow
927
1,725 1,733
1,389 1,434
(14)
1,056
574
463
191
‐500
0
500
1,000
1,500
2,000
FY10 FY11 FY12 FY13E FY14E
Operating Cash Flow (Rs Mn) Free Cash Flow (Rs Mn)
Source: Company, PhillipCapital India Research Estimates
PAT to grow at 27.5% in FY12‐14E On the back of a robust increase in the estimated EBIDTA (CAGR of 19.5% in FY12‐FY14E) and lower interest and depreciation, we expect the company to post PAT CAGR of 27.5% in the said period. The growth in EBIDTA will be aided by the lower depreciation, as a percentage of sales, over the next two years (as discussed earlier) and lower interest cost as a percentage of EBIDTA. The tax rate for the company is estimated to remain in the range of 32% of PBT over the next two years. We expect the company to register PAT of Rs 993mn (YoY growth of 22.8%) in FY13E and then expect it to grow to Rs 1315mn in FY14E (YoY growth of 32.4%). Similarly, the EPS of the company is expected to grow from Rs 11 in FY12E to Rs 13.5 in FY13E and then to Rs 17.9 in FY14E PAT growth and margins
359
606809
993
1,315
4.9
6.46.2 6.3
7.0
0
350
700
1,050
1,400
FY10 FY11 FY12 FY13E FY14E
4.0
5.0
6.0
7.0
8.0PAT (Rs Mn) % Margin
Source: Company, PhillipCapital India Research Estimates
Lower working capital requirement and capex needs to lead to better cash flows in the coming years
– 28 of 94 –
4 December 2012 / INDIA EQUITY RESEARCH / KAJARIA CERAMIC
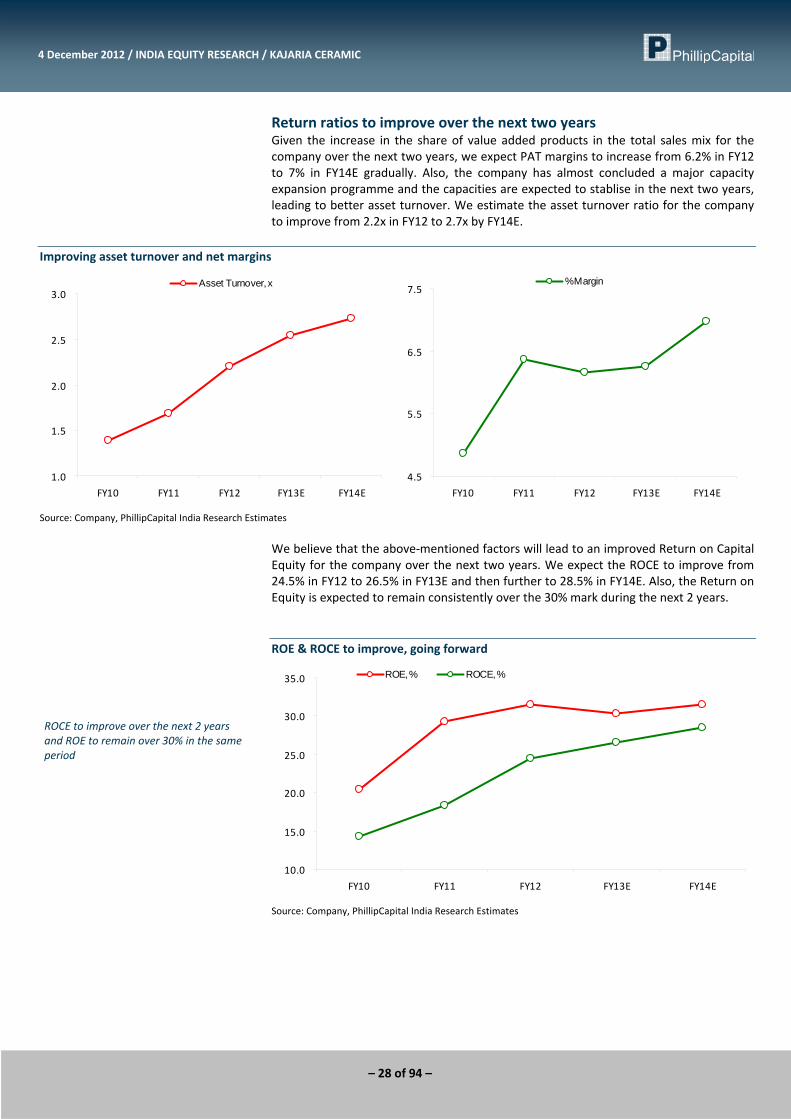
Return ratios to improve over the next two years Given the increase in the share of value added products in the total sales mix for the company over the next two years, we expect PAT margins to increase from 6.2% in FY12 to 7% in FY14E gradually. Also, the company has almost concluded a major capacity expansion programme and the capacities are expected to stablise in the next two years, leading to better asset turnover. We estimate the asset turnover ratio for the company to improve from 2.2x in FY12 to 2.7x by FY14E.
Improving asset turnover and net margins
1.0
1.5
2.0
2.5
3.0
FY10 FY11 FY12 FY13E FY14E
Asset Turnover, x
4.5
5.5
6.5
7.5
FY10 FY11 FY12 FY13E FY14E
% Margin
Source: Company, PhillipCapital India Research Estimates
We believe that the above‐mentioned factors will lead to an improved Return on Capital Equity for the company over the next two years. We expect the ROCE to improve from 24.5% in FY12 to 26.5% in FY13E and then further to 28.5% in FY14E. Also, the Return on Equity is expected to remain consistently over the 30% mark during the next 2 years. ROE & ROCE to improve, going forward
10.0
15.0
20.0
25.0
30.0
35.0
FY10 FY11 FY12 FY13E FY14E
ROE, % ROCE, %
Source: Company, PhillipCapital India Research Estimates
ROCE to improve over the next 2 years and ROE to remain over 30% in the same period
– 29 of 94 –
4 December 2012 / INDIA EQUITY RESEARCH / KAJARIA CERAMIC
Sector Outlook
Global Tile Industry The global tile industry has shown a ~6% CAGR over CY06‐10 to 9350 MSM in terms of volumes. Following rising manufacturing costs, there has been a shift in manufacturing capacity from developed countries. This is visible from the fact that Spain, the second‐largest producer of tiles in CY03, witnessing a 7.4% CAGR decline over CY03‐10. Similarly, Italy, the fourth‐largest producer of tiles in CY03, witnessed a 6.1% CAGR decline over the same period. At the cost of producers in developed countries, China and India have benefited the most, witnessing 10.4% and 12.6% production CAGR, respectively, over the same period. Currently, China, Brazil and India are top three producers as well as consumers of tiles globally. China accounted for 44%/37.4%, Brazil accounted for 7.9%/7.5% while India accounted for 5.8%/6.0% of the world’s production/consumption of tiles, respectively, in CY10. World tile consumption
(MSM) CY06 CY07 CY08 CY09 CY10
China 2450 2700 2830 3030 3500
Brazil 484 535 605 645 700
India 350 397 403 494 557
Iran 182 236 265 295 335
Vietnam 145 210 220 240 330
Indonesia 148 178 262 297 277
Egypt 103 105 140 180 200
Usa 308 249 211 173 186
Saudi Arabia 95 110 136 166 182
Mexico 167 173 176 163 168
Total 7420 8060 8350 8460 9350
Source: Company, PhillipCapital India Research Estimates
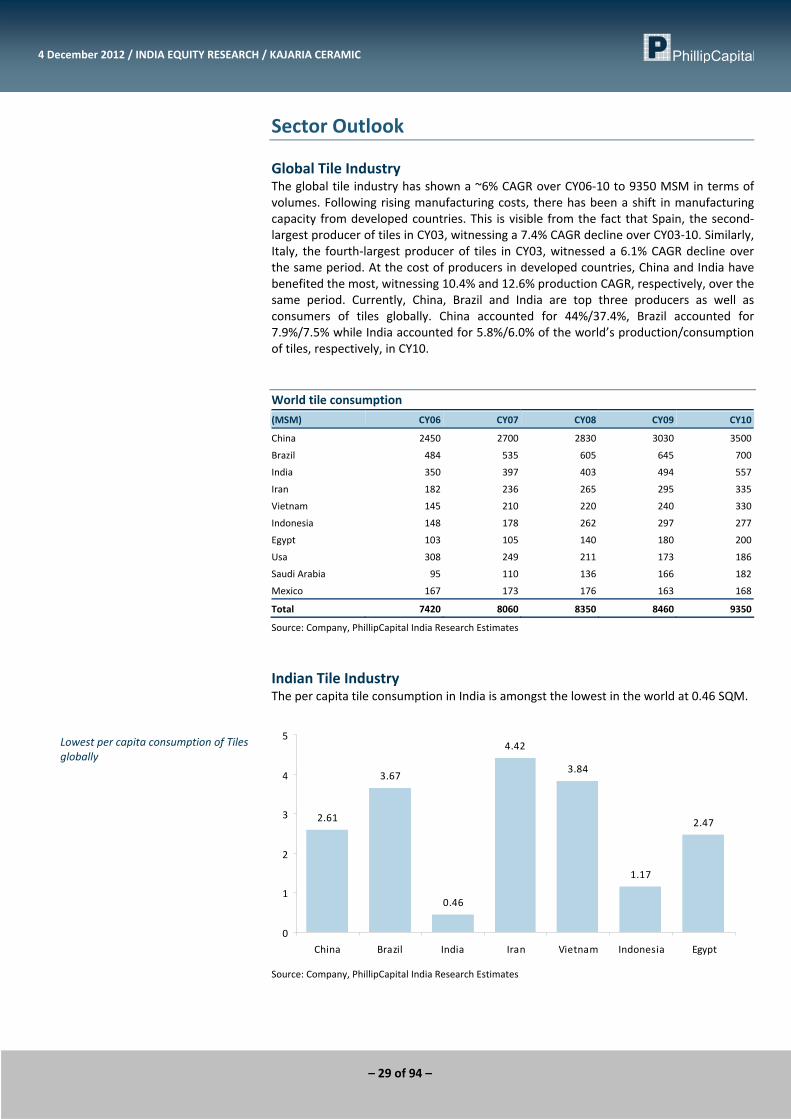
Indian Tile Industry The per capita tile consumption in India is amongst the lowest in the world at 0.46 SQM.
2.61
3.67
0.46
4.42
3.84
1.17
2.47
0
1
2
3
4
5
China Brazil India Iran Vietnam Indonesia Egypt
Source: Company, PhillipCapital India Research Estimates
Lowest per capita consumption of Tiles globally

– 30 of 94 –
4 December 2012 / INDIA EQUITY RESEARCH / KAJARIA CERAMIC
Indian tile industry was around 557 MSM as of March 2011 and estimated to be 625 MSM as of March 2012. The size of the industry is estimated to be ~Rs 170bn as of March 2012 and 50% of the market is expected to be controlled by the National Brands and rest by the regional local brands. The industry has been growing at a healthy rate of 15‐16% CAGR over the last 4‐5 years. Rs mn FY12 Turnover
H&R Johnson 17290
Kajaria Ceramics 14070
Nitco Tiles 9590
Somany Ceramics 9270
Asian Granito 6220
RAK Ceramics 6000
Orient Bell Ceramics 5840
Varmora 3560
Murudeshwar Ceramics 1900
Regency Ceramics 1660
Euro Ceramics 1600
Bell Granito 1400
Others (Marbomax, Restile, Decolight, Marbito, Spartek etc) 6600
Total 85000
Source: Company, PhillipCapital India Research Estimates
H&R Johnson (20% market share) today is the largest tile company in terms of revenues whereas Kajaria is currently the second largest player with ~16.5% market share.
Segmentation in the Indian Tiles industry
Glazed Vitrified Tiles (20 MSM/ Rs 10bn)
Polished Vitrified Tiles(205 MSM / Rs 70bn)
Ceramic Glazed Tiles(400 MSM / Rs 90bn)
The company has manufacturing capacity of 8 MSM at Gailpur (Rajasthan) and Sikandrabad (UP) put up between Feb’11 & March’11 substituting the imports from China significantly. Also acquired 51% stake in Jaxx Vitrified in Feb’12 further reducing the import portion to 40% of the PVT sale and now with Cosa acquisition it has further enhanced its manufacturing capacity to 13.80 MSM
KJC has manufacturing capacity of 17.30 MSM at Gailpur (Rajasthan) and Sikandrabad (UP). Also acquired 51% Soriso (morbi) in February 2011 & Vennar Ceramics (AP) in April 2012. Total aggregate capacity currently stands at
24.20 MSM.
KJC has manufacturing capacity of 3 MSM at Gailpur (Rajasthan),
put up in March 2011 substituting the imports from Europe and China significantly.
10 MSM Imported
4 MSM Imported
15 MSM Imported
Source: Company, PhillipCapital India Research Estimates
– 31 of 94 –
4 December 2012 / INDIA EQUITY RESEARCH / KAJARIA CERAMIC
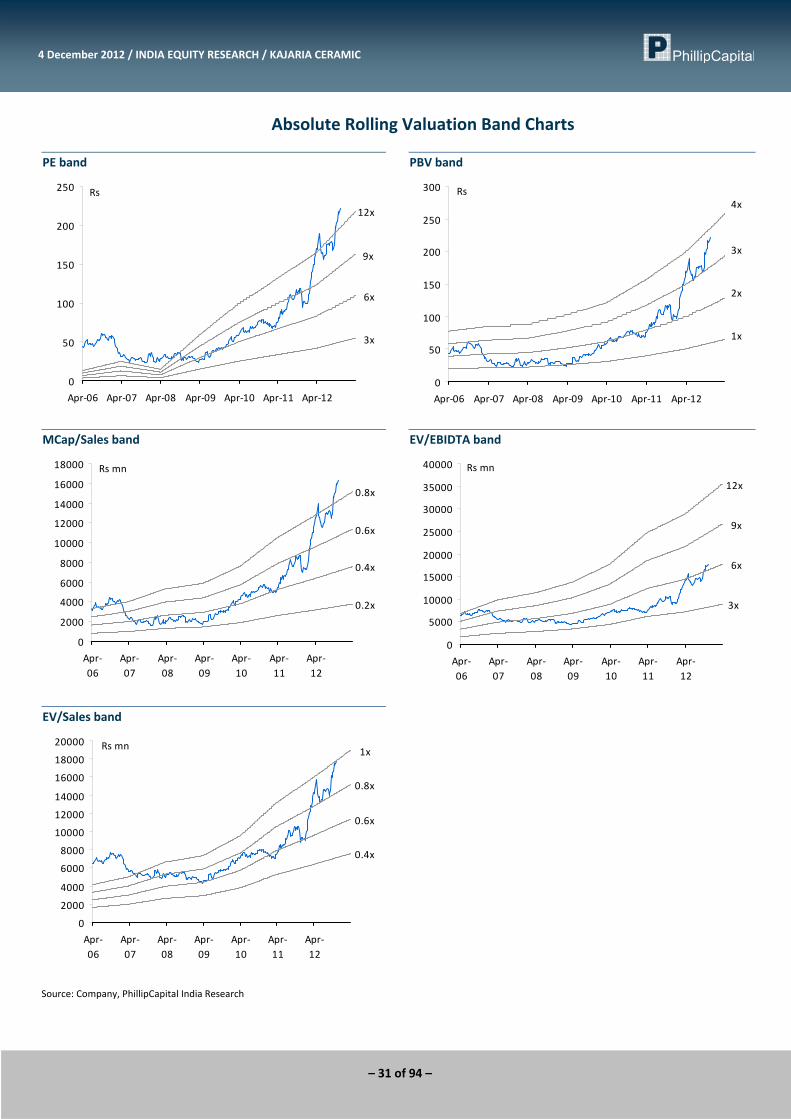
Absolute Rolling Valuation Band Charts
PE band
3x
6x
9x
12x
0
50
100
150
200
250
Apr‐06 Apr‐07 Apr‐08 Apr‐09 Apr‐10 Apr‐11 Apr‐12
Rs
PBV band
1x
2x
3x
4x
0
50
100
150
200
250
300
Apr‐06 Apr‐07 Apr‐08 Apr‐09 Apr‐10 Apr‐11 Apr‐12
Rs
MCap/Sales band
0.2x
0.4x
0.6x
0.8x
0
2000
4000
6000
8000
10000
12000
14000
16000
18000
Apr‐06
Apr‐07
Apr‐08
Apr‐09
Apr‐10
Apr‐11
Apr‐12
Rs mn
EV/EBIDTA band
3x
6x
9x
12x
0
5000
10000
15000
20000
25000
30000
35000
40000
Apr‐06
Apr‐07
Apr‐08
Apr‐09
Apr‐10
Apr‐11
Apr‐12
Rs mn
EV/Sales band
0.4x
0.6x
0.8x
1x
0
2000
4000
6000
8000
10000
12000
14000
16000
18000
20000
Apr‐06
Apr‐07
Apr‐08
Apr‐09
Apr‐10
Apr‐11
Apr‐12
Rs mn
Source: Company, PhillipCapital India Research

– 32 of 94 –
4 December 2012 / INDIA EQUITY RESEARCH / KAJARIA CERAMIC
Financials (Consolidated)
Income Statement Y/E Mar, Rs mn FY11 FY12 FY13E FY14E
Net sales 9,523 13,130 15,889 18,869
Growth, % 29.5 37.9 21.0 18.7
Other income 11 15 15 19
Total income 9,534 13,145 15,904 18,888
Operating expenses ‐8,044 ‐11,068 ‐13,493 ‐15,924
EBITDA 1,479 2,062 2,396 2,944
Growth, % 28.8 39.4 16.2 22.9
Margin, % 15.5 15.7 15.1 15.6
Depreciation ‐297 ‐393 ‐451 ‐497
EBIT 1,182 1,669 1,944 2,447
Growth, % 34.1 41.2 16.5 25.9
Margin, % 12.4 12.7 12.2 13.0
Interest paid ‐301 ‐485 ‐469 ‐473
Pre‐tax profit 892 1,199 1,490 1,993
Tax provided ‐285 ‐381 ‐477 ‐638
Profit after tax 607 818 1,013 1,355
Net Profit 606 809 993 1,315
Growth, % 69.1 33.4 22.8 32.4
Unadj. shares (m) 74 74 74 74
Wtd avg shares (m) 74 74 74 74
Balance Sheet Y/E Mar, Rs mn FY11 FY12 FY13E FY14E
Cash & bank 38 72 48 165
Debtors 942 1,442 1,756 2,036
Inventory 1,546 1,865 2,304 2,774
Loans & advances 811 549 659 758
Total current assets 3,338 3,928 4,767 5,733
Investments 34 1 401 601
Gross fixed assets 7,178 7,865 8,666 9,296
Less: Depreciation ‐2,263 ‐2,656 ‐3,107 ‐3,604
Add: Capital WIP 1 24 20 50
Net fixed assets 4,916 5,233 5,579 5,742
Non‐current assets 0 1 0 0
Total assets 8,287 9,162 10,747 12,076
Current liabilities 3,238 4,352 5,086 5,460
Provisions 389 357 421 480
Total current liabilities 3,627 4,709 5,507 5,941
Non‐current liabilities 2,435 1,633 1,682 1,562
Total liabilities 6,062 6,341 7,190 7,503
Paid‐up capital 147 147 147 147
Reserves & surplus 2,078 2,673 3,410 4,426
Shareholders’ equity 2,225 2,821 3,557 4,573
Total equity & liabilities 8,287 9,162 10,747 12,076
Source: Company, PhillipCapital India Research Estimates
Cash Flow Y/E Mar, Rs mn FY11 FY12 FY13E FY14E
Pre‐tax profit 892 1,199 1,490 1,993
Depreciation 297 393 451 497
Chg in working capital 679 664 ‐111 ‐462
Total tax paid ‐142 ‐523 ‐442 ‐594
Cash flow from operating activities 1,725 1,733 1,389 1,434
Capital expenditure ‐1,739 ‐710 ‐798 ‐660
Chg in investments 0 33 ‐400 ‐200
Cash flow from investing activities ‐1,739 ‐677 ‐1,198 ‐860
Free cash flow ‐14 1,056 191 574
Equity raised/(repaid) ‐46 0 0 0
Debt raised/(repaid) 178 ‐896 0 ‐200
Dividend (incl. tax) ‐86 ‐171 ‐214 ‐257
Cash flow from financing activities 46 ‐1,067 ‐214 ‐457
Net chg in cash 32 ‐11 ‐23 117
Valuation Ratios & Per Share Data FY11 FY12 FY13E FY14E
EPS, Rs 8.2 11.0 13.5 17.9
BVPS, Rs 30.5 39.3 49.6 63.9
DPS, Rs 2.0 2.5 3.0 3.5
Return on assets (%) 10.8 12.9 13.2 14.5
Return on equity (%) 29.3 31.5 30.4 31.5
Return on Invested capital (%) 14.3 19.1 21.2 24.0
RoIC/Cost of capital (x) 1.1 1.4 1.5 1.7
RoIC ‐ Cost of capital (%) 1.2 5.3 7.3 10.2
Return on capital employed (%) 18.3 24.5 26.5 28.5
Cost of capital (%) 13.1 13.8 13.9 13.8
RoCE ‐ Cost of capital (%) 5.2 10.7 12.6 14.7
Asset turnover (x) 1.7 2.2 2.5 2.7
Sales/Total assets (x) 1.3 1.5 1.6 1.7
Sales/Net FA (x) 2.3 2.6 2.9 3.3
Receivable days 36.1 40.1 40.3 39.4
Inventory days 59.3 51.8 52.9 53.7
Payable days 90.7 73.8 69.6 64.9
Current ratio (x) 0.9 0.9 0.9 1.0
Quick ratio (x) 0.5 0.4 0.5 0.5
Interest cover (x) 3.9 3.4 4.1 5.2
Dividend cover (x) 4.1 4.4 4.5 5.1
PER (x) 31.4 23.6 19.2 14.5
Price/Book (x) 8.5 6.6 5.2 4.1
EV/EBIT (x) 18.5 12.6 11.0 8.6
EV/NOPLAT (x) 27.2 18.5 16.1 12.6
EV/CE 4.7 4.6 4.0 3.4
EV/IC (x) 3.9 3.5 3.4 3.0

– 33 of 94 –
HSIL Ltd. Leader in Sanitary ware business
MIDCAP: HOME DÉCOR |Initiating Coverage 4 December 2012
PhillipCapital (India) Pvt. Ltd.
HSIL is the leader in the domestic Sanitaryware market and the second largest player in the container glass segment. HSIL has established an extensive distribution channel and brand over a period of years. We initiate coverage on HSIL with a BUY rating. Investment Rationale • HSIL is the leading player in the sanitaryware market with a ~40% share by
revenue in the organised space. Its brand Hindware has a very significant recall as compared to the competitor brands. The company sells its products through a wide distribution network of ~2,000 dealers and ~15,000 retailers making it the most penetrated player in the sanitaryware segment.
• HSIL is the second largest player in the domestic container glass industry with ~18% market share in terms of revenues and 20% market share in terms of capacity. It is one of the leading players in the South India market with ~60% of the total container glass capacity.
• For FY09‐12 period, HSIL has shown healthy CAGR growth of 33.4% and 29.3% in Revenue and PAT, respectively. The company has been in a capacity expansion phase for the last 4 years in both its business segments to drive this growth. The gross fixed assets of the company have increased from Rs 6.5bn in FY09 to Rs 15.5bn in FY12 and are further expected to increase to Rs 20.4bn by FY14E. Despite this big capital expenditure the balance sheet of the company remains strong with the debt to equity at 0.8x in FY12.
• We expect consolidated revenues to register a CAGR of 19.3% for FY12‐14E to reach Rs 20.8bn in FY14E from Rs 14.6bn in FY12. We expect the EBIDTA margins to consolidate at around 17% in the next two years and thus estimate the EBIDTA to grow at a CAGR of 18.5% in FY12‐14E period. PAT for the period is expected to grow at a CAGR of 16.5% to Rs 1272mn in FY14.
Outlook and Valuations Given the market leadership in business segments, superior brand recall, extensive distribution reach, cash flow generating ability of the sanitary ware business, consistent growth in revenues and profitability, we believe the company would see re‐rating in the coming years. As the capacity utilization of the new assets moves up, the profitability of the company will see major boost. We estimate the EPS to grow at 16.5% CAGR in FY12‐14E period. At the CMP of Rs 137, HSIL trades at 10.1x and 7.1x FY13E and FY14E PER, respectively, which we believe, are attractive valuations. We are positive on the growth prospects of the company and initiate coverage with a BUY rating and a target price of Rs 193.
BUY HSI IN | CMP RS 137
TARGET RS 193 (+41%) Company Data
O/S SHARES (MN) : 66MARKET CAP (RSBN) : 8MARKET CAP (USDBN) : 0.252 ‐ WK HI/LO (RS) : 181 / 104LIQUIDITY 3M (USDMN) : 0.3FACE VALUE (RS) : 2
Share Holding Pattern, %
PROMOTERS : 51.6FII / NRI : 29.7FI / MF : 2.7NON PROMOTER CORP. HOLDINGS : 2.2PUBLIC & OTHERS : 13.9
Price Performance, % 1mth 3mth 1yr
ABS 18.3 30.3 ‐9.0REL TO BSE 15.4 19.3 ‐23.6
Price Vs. Sensex (Rebased values)
0
50
100
150
200
250
300
350
Apr‐10 Jan‐11 Oct‐11 Jul‐12
HSIL BSE Sensex
Source: Bloomberg, Phillip Capital Research
Other Key Ratios
Rs mn FY12 FY13E FY14E
Net Sales 14,628 17,704 20,811EBIDTA 2,498 2,794 3,507Net Profit 937 898 1,272EPS, Rs 14.2 13.6 19.3PER, X 9.7 10.1 7.1EV/EBIDTA, x 6.5 6.1 4.8EV/Net Sales, x 1.1 1.0 0.8ROE, % 11.4 9.0 11.8Source: Phillip Capital India Research Kapil Bagaria (+ 9122 6667 9965) [email protected] Vibhor Singhal (+ 9122 6667 9949) [email protected]
– 34 of 94 –
4 December 2012 / INDIA EQUITY RESEARCH / HSIL LTD.
Investment Overview At the CMP of Rs 137, HSIL trades at 10.1x FY13E and 7.1x FY14E PER, respectively. In terms of EV/EBIDTA, the stock trades at 6.1x and 4.8x, respectively, on FY13E and FY14E financials. Given the market leadership in business segments, superior brand recall, extensive distribution reach, cash flow generating ability of the sanitary ware business, consistent growth in revenues and profitability, we believe the company would see re‐rating in the coming years. As the capacity utilization of the new assets moves up the profitability of the company will see major boost. We are positive on the growth prospects of the company and initiate coverage with a BUY rating and a target price of Rs 193. Challenges • Soda ash is one of the important raw materials for container glass segment of HSIL
and is mostly imported. It constitutes around ~14% of glass manufacturing cost and ~34% of HSIL’s overall material cost. A sharp volatility in prices could impact margins in the segment.
• Unorganised sector plays an important role in the market dynamics of the sanitary ware business in the country with around 35% market share. These unorganized players have lower fixed overheads enabling them to keep the pricing competitive and garner market share. Stiff competition from players in the unorganised segment can exert pressure on margins. We believe that HSIL has over the years built a brand which will help it to compete with organised as well as unorganised players.
• During FY12, imported raw material stood at ~11% of the net revenues and ~33% (37% in FY11) of the total raw material consumption for the company. Thus sharp depreciation of rupee impacts the margins of the company adversely. We believe that the reducing trend in imports as a percentage of sales (due to enhanced in‐house manufacturing capabilities) will lower the volatility of profits on this account.
• The container glass business of the company is a B2B business and is heavily dependent on the demand of the user segments like beer, beverages, pharma, etc. Any deviation in the demand for these products may lead to adverse revenue trends for HSIL. Also the capacities in this segment have also increased significantly over the last 3 years and this has reduced the bargaining power for the glass container manufacturers.
• The replacement of PET bottles and aluminium cans for packaging in F&B and beer industries is picking up pace may pose a threat to the overall demand for the container glass. However, the acquisition of Garden Polymer is expected to mitigate the risk to some extent.

– 35 of 94 –
4 December 2012 / INDIA EQUITY RESEARCH / HSIL LTD.
Assumptions and value drivers Key data and assumptions FY10 FY11 FY12 FY13E FY14E
Costs ‐ RM % of sales 29.1 30.0 32.4 32.0 32.3 ‐ Advtg Exp as % of Sales 10.0 9.8 9.8 9.7 9.7 ‐ Total Selling & Distribution as % of Sales 12.5 12.4 11.9 11.7 11.7 ‐ Power Costs as % of Sales 20.4 18.2 18.9 22.5 20.5 ‐ Staff costs as % of sales 10.8 11.2 10.9 10.0 10.7 ‐ Total OE as % of Sales 42.3 39.9 39.6 42.3 40.2 ‐ Interest as % of Sales 4.9 3.3 2.9 3.7 3.5 ‐ Depreciation as % of Sales 6.2 5.1 4.4 4.8 4.5 Margins ‐ Gross Margin % 60.1 58.7 56.7 58.1 57.1 ‐ EBIDTA Margins 17.8 18.8 17.1 15.8 16.9 ‐ EBIT Margins 11.9 14.1 13.0 11.4 12.7 ‐ PBT Margins 7.0 10.8 10.1 7.6 9.2 ‐ PAT Margins 5.3 7.1 6.4 5.1 6.1 Sales Break up ‐ BP reveunes (Rs Mn) 3,721 4,991 6,164 7,458 8,535 YoY growth % 10.3 34.1 23.5 21.0 14.5 ‐ CG reveunes (Rs Mn) 4,261 5,491 7,165 8,495 9,990 YoY growth % 28.6 28.9 30.5 18.6 17.6 ‐ Hindware Retail (Rs Mn) 211 356 658 987 1,381 YoY growth % 226.8 69.0 84.5 50.0 40.0 ‐ Garden Polymers (Rs Mn) ‐ ‐ 503 629 754 YoY growth % ‐ ‐ ‐ 25.0 20.0 ‐ BP % of Total Sales 45 46 43 42 41 ‐ CG % of Total Sales 52 51 49 48 48 ‐ Hindware Retail % of Total Sales 3 3 5 6 7 ‐ Garden Polymer % of Total Sales ‐ ‐ 3 4 4
Source: Company, PhillipCapital India Research Estimates
Working capital
Days FY10 FY11 FY12 FY13E FY14E
Inventory Turnover 73 74 76 74 74
Debtors Turnover 63 55 61 60 60
Creditors Turnover 56 53 48 46 46
Source: Company, PhillipCapital India Research Estimates
– 36 of 94 –
4 December 2012 / INDIA EQUITY RESEARCH / HSIL LTD.
Company Overview • HSIL is the market leader in the building products market, and a dominant player in
the container glass segment in the country. The Building Products commands ~40% of the organized market in the sanitaryware industry, while the Container Glass is the second largest player in India.
• The product range of the company has a wide spectrum from Sanitaryware to Wellness, to Faucets and Kitchen Appliances, thus meeting all the needs of bathroom and kitchen products.
• HSIL sells its products through an extensive distribution channel made up of more than 2000 distributors and ~15,000 retailers in addition to its own outlets and dealer shops in malls.
• The institutional client list includes some of large business houses of the country – DLF, The Taj Hotels, GMR, Unitech, ITC Hotels, Mahindra, Infosys, Coca Cola, Pepsi, Dr. Reddy’s Laboratories, Hindustan Unilever, Pernod Ricard, Pfizer, Sab Miller, Dabur, Nestle, to name a few.
• HSIL is the second largest player in the domestic container glass industry with ~18% market share in terms of revenues and 20% market share in terms of capacity. The company has a strategic presence in southern India with its capacity representing ~60% of total capacity as the region represents the highest net capita consumption.
• HSIL is recognized among the top 300 companies in India, while rated amongst the best 100 small and medium sized companies in the world by the Forbes Magazine.
• In 2008, the company forayed into the retail of Home Interiors to extend its reach to the end‐customer through its wholly owned subsidiary Hindware Home Retail Private Limited (HHRPL). It has introduced EVOK brand which specializes in providing a comfortable and convenient one‐stop shopping experience. Currently the EVOK has 18 stores across all metro and category‐A cities and it plans to consolidate its presence across all states.
• “Hindware" brand has been recognized as a Super brand for the last four consecutive years.
• The sales for the company have increased at 33.4% CAGR during FY09‐12 period. The net revenues rose from Rs 6158mn in FY09 to Rs 14628mn in FY12. EBIDTA during the said period has also increased at a CAGR of 37.2% from Rs 967mn in FY09 to Rs 2498mn in FY12. PAT for the period from FY09‐12 has registered a CAGR of 29.3% as it increased from Rs 433mn in FY09 to Rs 937mn in FY12.
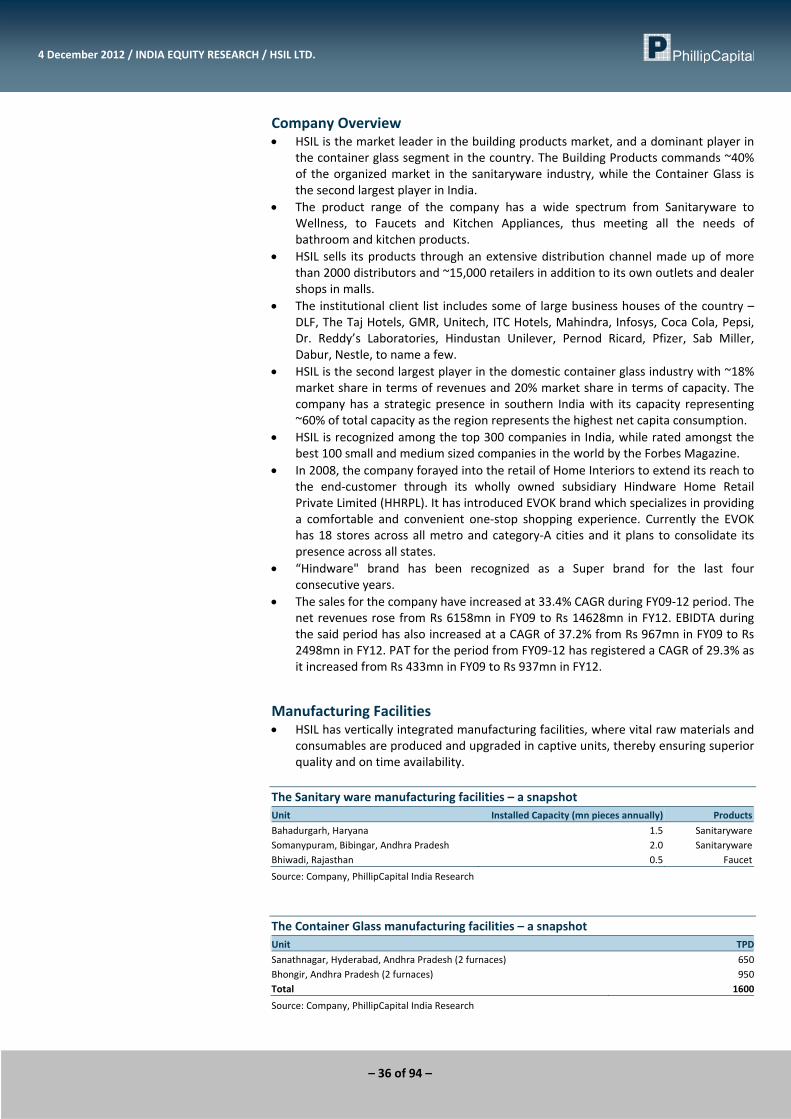
Manufacturing Facilities • HSIL has vertically integrated manufacturing facilities, where vital raw materials and
consumables are produced and upgraded in captive units, thereby ensuring superior quality and on time availability.
The Sanitary ware manufacturing facilities – a snapshot Unit Installed Capacity (mn pieces annually) Products
Bahadurgarh, Haryana 1.5 SanitarywareSomanypuram, Bibingar, Andhra Pradesh 2.0 SanitarywareBhiwadi, Rajasthan 0.5 Faucet
Source: Company, PhillipCapital India Research
The Container Glass manufacturing facilities – a snapshot Unit TPD
Sanathnagar, Hyderabad, Andhra Pradesh (2 furnaces) 650Bhongir, Andhra Pradesh (2 furnaces) 950Total 1600
Source: Company, PhillipCapital India Research

– 37 of 94 –
4 December 2012 / INDIA EQUITY RESEARCH / HSIL LTD.
Business Model HSIL primarily operates in four key business segments: • Building products: This segment encompasses the Sanitaryware business, Faucets
and other allied products and accounted for ~42% of the consolidated revenues of the company in FY12. The sanitaryware business comprises of around 67% of this segment’s sales.
• Container glass: This segment contributed to ~49% of the consolidated revenues of the company during FY12. The company is the second largest player in container glass industry with a market share of ~18% by revenue and ~20% by capacity.
• Hindware Home Retail Pvt. Ltd.: Company is also into home retail furnishing through its wholly owned subsidiary (HHRPL) and has opened 18 mega stores under the brand name ‘EVOK’ over the past five years. ~5% of the consolidated revenues of the company during FY12 came from this segment. Furniture accounts for ~60% of the sales. This segment is expected to be positive from FY14.
• Garden Polymers: This is one of the inorganic initiatives of the company to expand its product offering in the packaging industry. Garden Polymer manufactures PET bottles and caps. HSIL acquired 100% stake in this company in August 2011 through a share purchase agreement for Rs 870 mn. Garden polymers accounted for ~3% of the consolidated revenues of the company in FY12.
Business structure and revenue break‐up (consolidated)
Hindware Home Retail Pvt Ltd(~5% of total sales)
Currently 18 stores ~60% of its sales comes from furniture
Sanitaryware(~66% of Building Products)
Garden Polymer(~3% of total sales)
Manufacturer of PET bottles and caps Capacity of ~8000 tpa
Building Products Segment(~42% of total sales)
Container Glass Segment(~49% of total sales)
Faucets(~19% of Building Products)
Other allied products(~15% of Building Products)
BrandsSuper Premium: Queo,
Premium: Hindware Italian,Hindware Art
Standard Hindware Art,Hindware)
Basic Raasi
BrandsBenelaveQueoHindware
BrandsSold under Hindware Brand
HSIL
Source: Company, PhillipCapital India Research
The key businesses of the company include Building Products, Container Glass, Home Retail and Polymer Containers
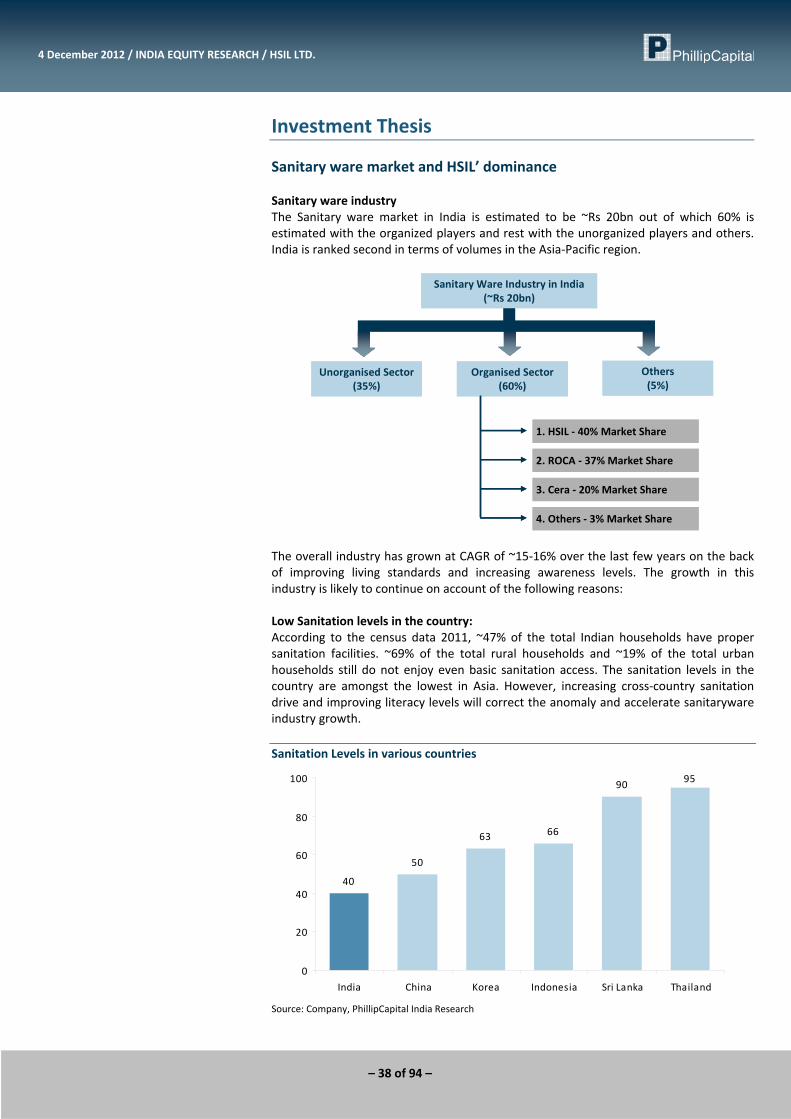
– 38 of 94 –
4 December 2012 / INDIA EQUITY RESEARCH / HSIL LTD.
Investment Thesis Sanitary ware market and HSIL’ dominance Sanitary ware industry The Sanitary ware market in India is estimated to be ~Rs 20bn out of which 60% is estimated with the organized players and rest with the unorganized players and others. India is ranked second in terms of volumes in the Asia‐Pacific region.
Unorganised Sector (35%)
Organised Sector (60%)
Others (5%)
1. HSIL ‐ 40% Market Share
3. Cera ‐ 20% Market Share
2. ROCA ‐ 37% Market Share
4. Others ‐ 3% Market Share
Sanitary Ware Industry in India(~Rs 20bn)
Unorganised Sector (35%)
Organised Sector (60%)
Others (5%)
1. HSIL ‐ 40% Market Share
3. Cera ‐ 20% Market Share
2. ROCA ‐ 37% Market Share
4. Others ‐ 3% Market Share
Sanitary Ware Industry in India(~Rs 20bn)
The overall industry has grown at CAGR of ~15‐16% over the last few years on the back of improving living standards and increasing awareness levels. The growth in this industry is likely to continue on account of the following reasons: Low Sanitation levels in the country: According to the census data 2011, ~47% of the total Indian households have proper sanitation facilities. ~69% of the total rural households and ~19% of the total urban households still do not enjoy even basic sanitation access. The sanitation levels in the country are amongst the lowest in Asia. However, increasing cross‐country sanitation drive and improving literacy levels will correct the anomaly and accelerate sanitaryware industry growth. Sanitation Levels in various countries
40
50
63 66
90 95
0
20
40
60
80
100
India China Korea Indonesia Sri Lanka Thailand
Source: Company, PhillipCapital India Research
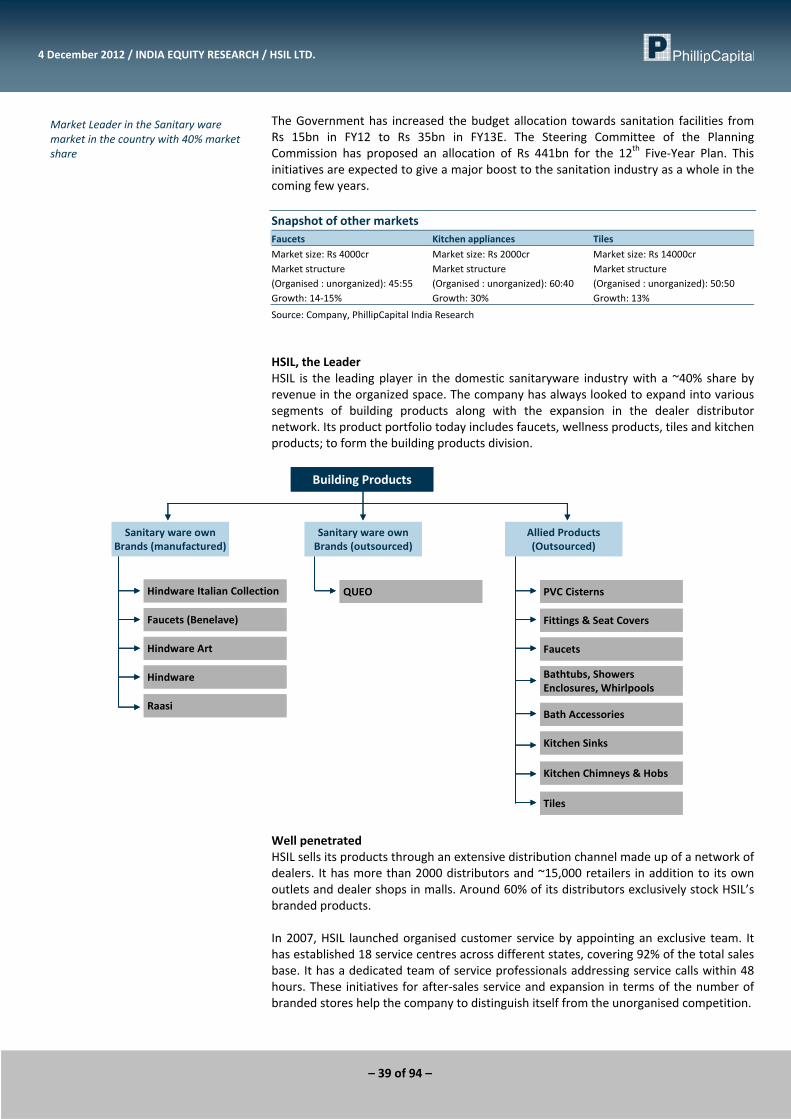
– 39 of 94 –
4 December 2012 / INDIA EQUITY RESEARCH / HSIL LTD.
The Government has increased the budget allocation towards sanitation facilities from Rs 15bn in FY12 to Rs 35bn in FY13E. The Steering Committee of the Planning Commission has proposed an allocation of Rs 441bn for the 12th Five‐Year Plan. This initiatives are expected to give a major boost to the sanitation industry as a whole in the coming few years. Snapshot of other markets Faucets Kitchen appliances Tiles
Market size: Rs 4000cr Market size: Rs 2000cr Market size: Rs 14000cr Market structure Market structure Market structure (Organised : unorganized): 45:55 (Organised : unorganized): 60:40 (Organised : unorganized): 50:50 Growth: 14‐15% Growth: 30% Growth: 13%
Source: Company, PhillipCapital India Research
HSIL, the Leader HSIL is the leading player in the domestic sanitaryware industry with a ~40% share by revenue in the organized space. The company has always looked to expand into various segments of building products along with the expansion in the dealer distributor network. Its product portfolio today includes faucets, wellness products, tiles and kitchen products; to form the building products division.
Faucets (Benelave)
Hindware Italian Collection
Hindware Art
Hindware
Raasi
Sanitary ware own Brands (manufactured)
QUEO
Sanitary ware own Brands (outsourced)
Building Products
PVC Cisterns
Faucets
Fittings & Seat Covers
Bathtubs, Showers Enclosures, Whirlpools
Bath Accessories
Kitchen Sinks
Kitchen Chimneys & Hobs
Tiles
Allied Products (Outsourced)
Well penetrated HSIL sells its products through an extensive distribution channel made up of a network of dealers. It has more than 2000 distributors and ~15,000 retailers in addition to its own outlets and dealer shops in malls. Around 60% of its distributors exclusively stock HSIL’s branded products. In 2007, HSIL launched organised customer service by appointing an exclusive team. It has established 18 service centres across different states, covering 92% of the total sales base. It has a dedicated team of service professionals addressing service calls within 48 hours. These initiatives for after‐sales service and expansion in terms of the number of branded stores help the company to distinguish itself from the unorganised competition.
Market Leader in the Sanitary ware market in the country with 40% market share
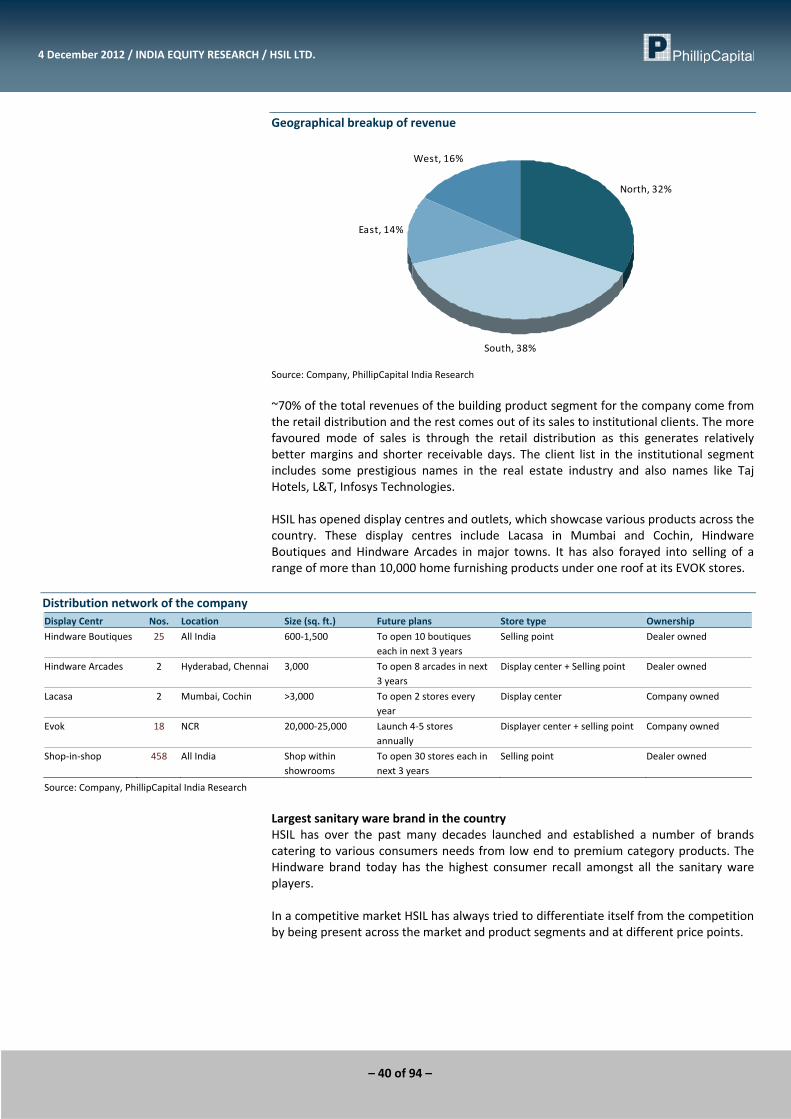
– 40 of 94 –
4 December 2012 / INDIA EQUITY RESEARCH / HSIL LTD.
Geographical breakup of revenue
North, 32%
South, 38%
East, 14%
West, 16%
Source: Company, PhillipCapital India Research
~70% of the total revenues of the building product segment for the company come from the retail distribution and the rest comes out of its sales to institutional clients. The more favoured mode of sales is through the retail distribution as this generates relatively better margins and shorter receivable days. The client list in the institutional segment includes some prestigious names in the real estate industry and also names like Taj Hotels, L&T, Infosys Technologies. HSIL has opened display centres and outlets, which showcase various products across the country. These display centres include Lacasa in Mumbai and Cochin, Hindware Boutiques and Hindware Arcades in major towns. It has also forayed into selling of a range of more than 10,000 home furnishing products under one roof at its EVOK stores.
Distribution network of the company Display Centr Nos. Location Size (sq. ft.) Future plans Store type Ownership
Hindware Boutiques 25 All India 600‐1,500 To open 10 boutiques each in next 3 years
Selling point Dealer owned
Hindware Arcades 2 Hyderabad, Chennai 3,000 To open 8 arcades in next 3 years
Display center + Selling point Dealer owned
Lacasa 2 Mumbai, Cochin >3,000 To open 2 stores every year
Display center Company owned
Evok 18 NCR 20,000‐25,000 Launch 4‐5 stores annually
Displayer center + selling point Company owned
Shop‐in‐shop 458 All India Shop within showrooms
To open 30 stores each in next 3 years
Selling point Dealer owned
Source: Company, PhillipCapital India Research
Largest sanitary ware brand in the country HSIL has over the past many decades launched and established a number of brands catering to various consumers needs from low end to premium category products. The Hindware brand today has the highest consumer recall amongst all the sanitary ware players. In a competitive market HSIL has always tried to differentiate itself from the competition by being present across the market and product segments and at different price points.
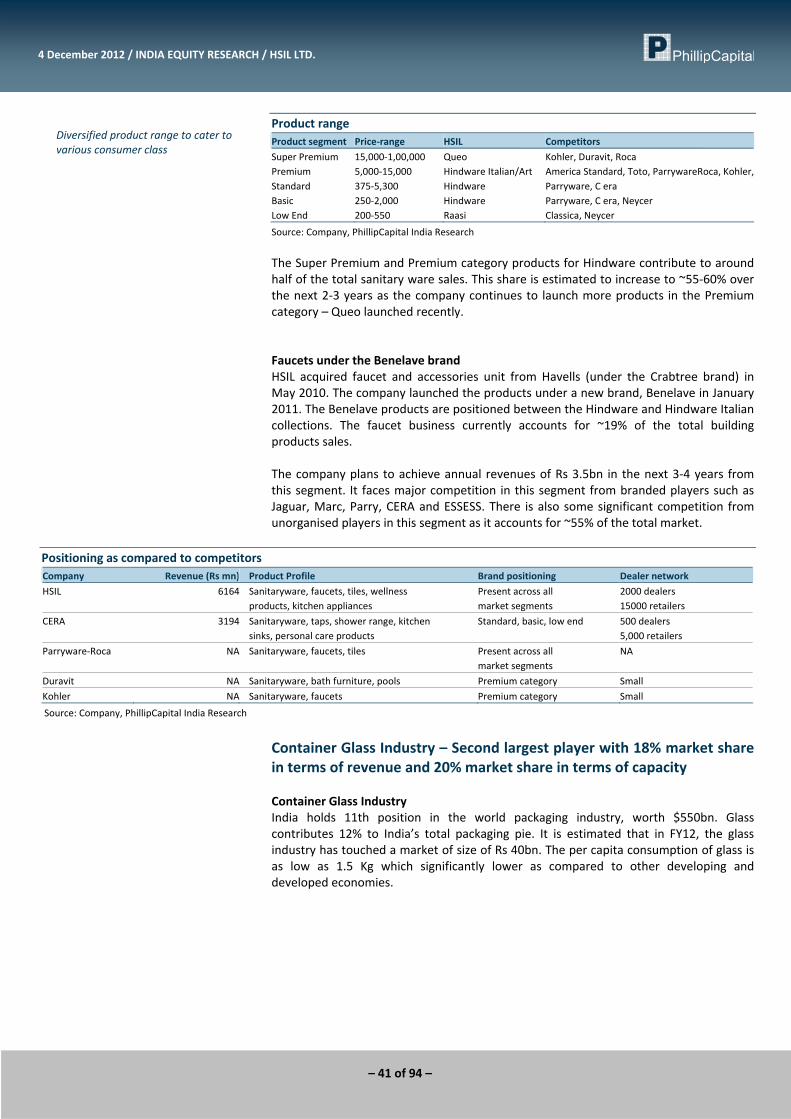
– 41 of 94 –
4 December 2012 / INDIA EQUITY RESEARCH / HSIL LTD.
Product range Product segment Price‐range HSIL Competitors
Super Premium 15,000‐1,00,000 Queo Kohler, Duravit, Roca Premium 5,000‐15,000 Hindware Italian/Art America Standard, Toto, ParrywareRoca, Kohler, Standard 375‐5,300 Hindware Parryware, C era Basic 250‐2,000 Hindware Parryware, C era, Neycer Low End 200‐550 Raasi Classica, Neycer
Source: Company, PhillipCapital India Research
The Super Premium and Premium category products for Hindware contribute to around half of the total sanitary ware sales. This share is estimated to increase to ~55‐60% over the next 2‐3 years as the company continues to launch more products in the Premium category – Queo launched recently. Faucets under the Benelave brand HSIL acquired faucet and accessories unit from Havells (under the Crabtree brand) in May 2010. The company launched the products under a new brand, Benelave in January 2011. The Benelave products are positioned between the Hindware and Hindware Italian collections. The faucet business currently accounts for ~19% of the total building products sales. The company plans to achieve annual revenues of Rs 3.5bn in the next 3‐4 years from this segment. It faces major competition in this segment from branded players such as Jaguar, Marc, Parry, CERA and ESSESS. There is also some significant competition from unorganised players in this segment as it accounts for ~55% of the total market.
Positioning as compared to competitors Company Revenue (Rs mn) Product Profile Brand positioning Dealer network
HSIL 6164 Sanitaryware, faucets, tiles, wellness Present across all 2000 dealers products, kitchen appliances market segments 15000 retailers
CERA 3194 Sanitaryware, taps, shower range, kitchen Standard, basic, low end 500 dealers sinks, personal care products 5,000 retailers
Parryware‐Roca NA Sanitaryware, faucets, tiles Present across all NA market segments
Duravit NA Sanitaryware, bath furniture, pools Premium category Small
Kohler NA Sanitaryware, faucets Premium category Small
Source: Company, PhillipCapital India Research
Container Glass Industry – Second largest player with 18% market share in terms of revenue and 20% market share in terms of capacity Container Glass Industry India holds 11th position in the world packaging industry, worth $550bn. Glass contributes 12% to India’s total packaging pie. It is estimated that in FY12, the glass industry has touched a market of size of Rs 40bn. The per capita consumption of glass is as low as 1.5 Kg which significantly lower as compared to other developing and developed economies.
Diversified product range to cater to various consumer class

– 42 of 94 –
4 December 2012 / INDIA EQUITY RESEARCH / HSIL LTD.
Per Capita Glass Consumption
89.0
63.9
50.3
27.5 27.519.5
10.25.9 4.8 1.5 1.2
0
20
40
60
80
100
S Ko
rea
France
Spain UK
USA
Mexico
Japan
China
Brazil
India
Indo
nesia
Source: Company, PhillipCapital India Research
The glass industry is growing at 11% annually and is anticipated to touch a market value of over $21bn by 2015. The demand is expected to be driven by liquor, beer, food, beverage and pharmaceutical industries, which are witnessing higher growth than the country’s GDP. All the industries that use the products manufactured by HSIL are expected to witness robust growth over the next few years. Industry growth rates, %
1516
11
9
0
5
10
15
20
Liquor & Beer Pharma Food Industry Beverages
Source: Company, PhillipCapital India Research
The container glass industry in India is largely dominated by the top three players – Hindustan National Glass (HNGIL), HSIL and Piramal Glass (PG).
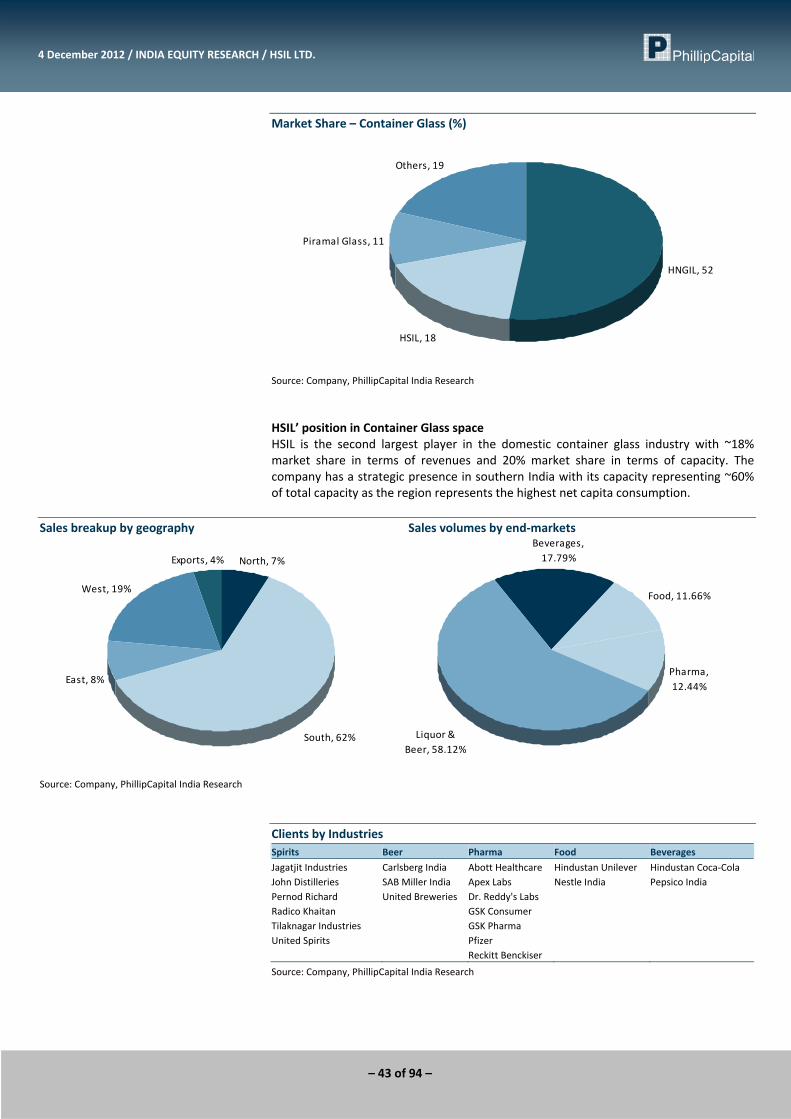
– 43 of 94 –
4 December 2012 / INDIA EQUITY RESEARCH / HSIL LTD.
Market Share – Container Glass (%)
HNGIL, 52
HSIL, 18
Piramal Glass, 11
Others, 19
Source: Company, PhillipCapital India Research
HSIL’ position in Container Glass space HSIL is the second largest player in the domestic container glass industry with ~18% market share in terms of revenues and 20% market share in terms of capacity. The company has a strategic presence in southern India with its capacity representing ~60% of total capacity as the region represents the highest net capita consumption.
Sales breakup by geography Sales volumes by end‐markets
North, 7%
South, 62%
East, 8%
West, 19%
Exports, 4%
Beverages, 17.79%
Food, 11.66%
Pharma, 12.44%
Liquor & Beer, 58.12%
Source: Company, PhillipCapital India Research
Clients by Industries Spirits Beer Pharma Food Beverages
Jagatjit Industries Carlsberg India Abott Healthcare Hindustan Unilever Hindustan Coca‐Cola John Distilleries SAB Miller India Apex Labs Nestle India Pepsico India Pernod Richard United Breweries Dr. Reddy's Labs Radico Khaitan GSK Consumer Tilaknagar Industries GSK Pharma United Spirits Pfizer Reckitt Benckiser
Source: Company, PhillipCapital India Research

– 44 of 94 –
4 December 2012 / INDIA EQUITY RESEARCH / HSIL LTD.
Revenue CAGR of 19.3% for FY12‐14E, aided by around 17.7% CAGR in building products business and 18.1% CAGR in container glass business Building products business We expect revenue to grow at a CAGR of 17.7% for FY12‐FY14E in the building products business on the back of volume growth of 10% and realisation growth of 7% in the said period. The increase in capacities of the sanitary ware and faucets facilities along with the sales push is expected to drive the volumes for the company in the coming years. The company has increased the Bibinagar plant capacity for sanitary ware from 1.3 million pieces to 2 million during FY12. So the full utilization of the plant will be seen in FY13E. It is also setting up a new production unit for faucets with a capacity of 2.5 mn in Kaharani, Bhiwadi, Rajasthan. The expansion will be done in two phases ‐ 1.5 mn by Q2FY14 and another 1.0 mn by Q4FY14 for which the company has already been allotted 10 acres of land by the Rajasthan State Industrial Development and Investment Corporation (RIICO). The company is also palnning to set up a greenfield plant for sanitaryware at Jhagadia, Gujarat with installed capacity of 1.2 million pieces which will be completed by Q1FY15 for which 55 acres of land has been allotted by Gujarat Industrial Development Corporation (GIDC), thereby enabling the company to increase the current presence in the western and central India and also to boost the exports. The company’s strategy to move to increase the share of the premium category products in the total volumes will enable it improve its realization in the medium to long term. Company has undertaken price hike during the current financial year in the building product division of 9% (4% in June 2012 and 5% in November 2012) to off‐set the pressure on margins due to increase in input and inflation costs. HSIL launched its premium and high value‐added products under the sub Hindware brands‐ Hindware Italian and Hindware Art in FY06. Hindware Italian collection and Hindware Art products are priced at 3‐4x and ~2‐3x of “Hindware” labeled products. The company forayed into the high‐end luxury segment and the super premium segment and launched 8 new series of high‐end luxury sanitaryware and faucets under the QUEO brand. This brand forms the part of the brand portfolio of its UK based wholly owned subsidiary, Barwood. With the launch of this brand, the company has entered the ultra‐premium market segment, which is dominated by international players. The products under this brand is priced in the range of Rs 15,000 to Rs 1 lakh. Thus, we expect the high‐margin business to increase its share to the total revenues at the expense of the low‐margin businesses, leading to better realisation and better profitability. Net Sales Growth – Building Products
‐
2,000
4,000
6,000
8,000
10,000
FY10 FY11 FY12 FY13E FY14E
0
10
20
30
40Buliding Products (Rs Mn) YoY growth %
Source: Company, PhillipCapital India Research Estimates
All the business segments to grow at decent pace for the company to grow at ~19% CAGR during FY12‐14E
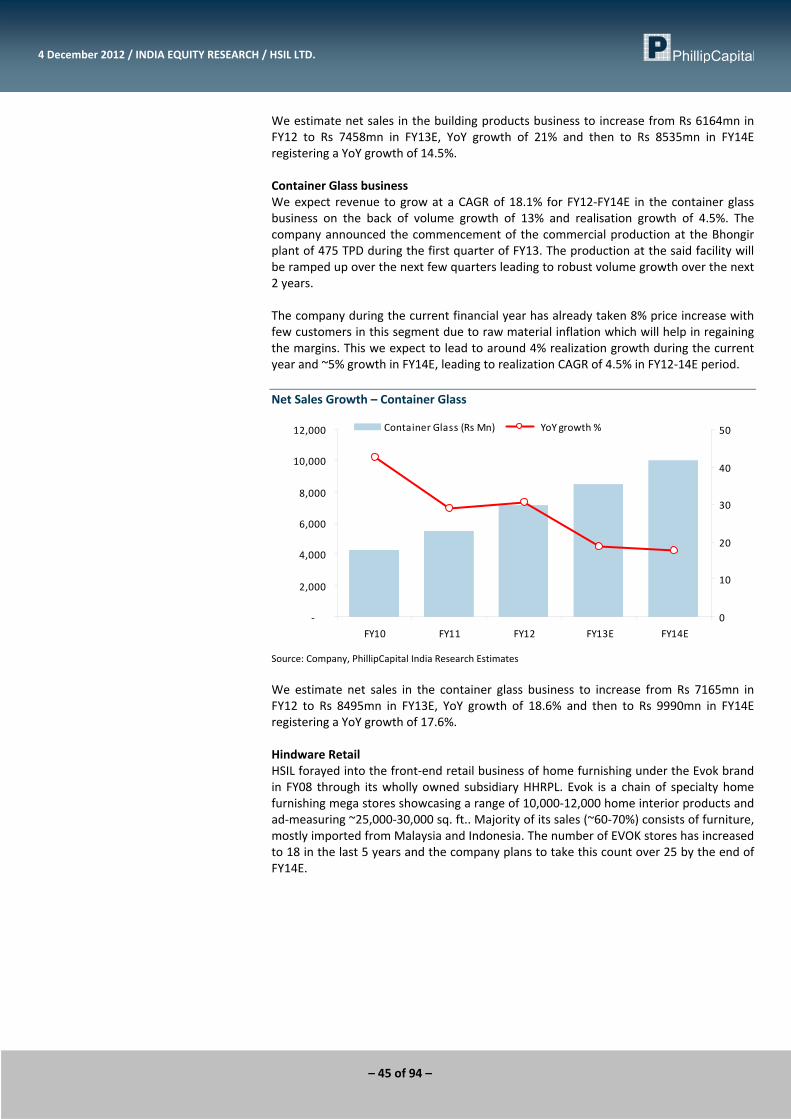
– 45 of 94 –
4 December 2012 / INDIA EQUITY RESEARCH / HSIL LTD.
We estimate net sales in the building products business to increase from Rs 6164mn in FY12 to Rs 7458mn in FY13E, YoY growth of 21% and then to Rs 8535mn in FY14E registering a YoY growth of 14.5%. Container Glass business We expect revenue to grow at a CAGR of 18.1% for FY12‐FY14E in the container glass business on the back of volume growth of 13% and realisation growth of 4.5%. The company announced the commencement of the commercial production at the Bhongir plant of 475 TPD during the first quarter of FY13. The production at the said facility will be ramped up over the next few quarters leading to robust volume growth over the next 2 years. The company during the current financial year has already taken 8% price increase with few customers in this segment due to raw material inflation which will help in regaining the margins. This we expect to lead to around 4% realization growth during the current year and ~5% growth in FY14E, leading to realization CAGR of 4.5% in FY12‐14E period. Net Sales Growth – Container Glass
‐
2,000
4,000
6,000
8,000
10,000
12,000
FY10 FY11 FY12 FY13E FY14E
0
10
20
30
40
50Container Glass (Rs Mn) YoY growth %
Source: Company, PhillipCapital India Research Estimates
We estimate net sales in the container glass business to increase from Rs 7165mn in FY12 to Rs 8495mn in FY13E, YoY growth of 18.6% and then to Rs 9990mn in FY14E registering a YoY growth of 17.6%. Hindware Retail HSIL forayed into the front‐end retail business of home furnishing under the Evok brand in FY08 through its wholly owned subsidiary HHRPL. Evok is a chain of specialty home furnishing mega stores showcasing a range of 10,000‐12,000 home interior products and ad‐measuring ~25,000‐30,000 sq. ft.. Majority of its sales (~60‐70%) consists of furniture, mostly imported from Malaysia and Indonesia. The number of EVOK stores has increased to 18 in the last 5 years and the company plans to take this count over 25 by the end of FY14E.

– 46 of 94 –
4 December 2012 / INDIA EQUITY RESEARCH / HSIL LTD.
Number of EVOK Stores
2
5
8
1719
25
0
10
20
30
FY09 FY10 FY11 FY12 FY13E FY14E
Source: Company, PhillipCapital India Research Estimates
We estimate net sales in the retail segment to increase from Rs 658mn in FY12 to Rs 987mn in FY13E, YoY growth of 50% and then to Rs 1381mn in FY14E registering a YoY growth of 40% on back of rapid store addition. Garden Polymer HSIL has acquired 100% equity share capital of Garden Polymers Private Limited with effect from 12 August 2011 under Share Purchase Agreement dated 2 June 2011 and Amendment Agreement dated 8 June 2011. Garden Polymers is engaged in the business of manufacturing PET bottles, caps and closures, having plants at Dharwad (Karnataka) and Selaqui (Uttarakhand). It is a leading supplier to premier customers in Liquor, Pharma and FMCG Industry. This acquisition has synergies with company’s container glass division which supplies to the similar set of customers. This will further strengthen company’s position as packaging solution provider and will be value accretive for its shareholders. We estimate net sales for Garden polymers to increase from Rs 503mn in FY12 to Rs 629mn in FY13E, YoY growth of 25% and then to Rs 754mn in FY14E registering a YoY growth of 20%. Overall revenues to register 17.7% CAGR in FY12‐14E period Based on the above discussion, we estimate overall net sales for the company to increase from Rs 14628mn in FY12 to Rs 17704mn in FY13E, YoY growth of 21% and then to Rs 20811mn in FY14E registering a YoY growth of 17.5% on the back of robust growth in all the business verticals.
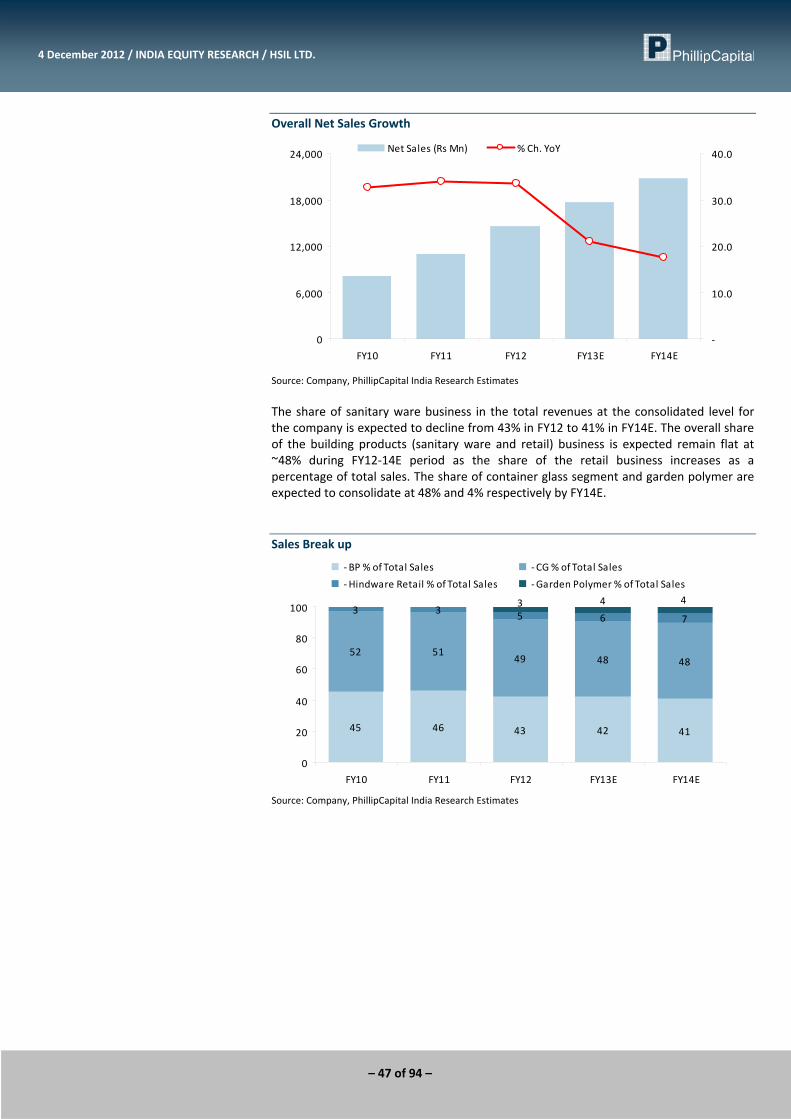
– 47 of 94 –
4 December 2012 / INDIA EQUITY RESEARCH / HSIL LTD.
Overall Net Sales Growth
0
6,000
12,000
18,000
24,000
FY10 FY11 FY12 FY13E FY14E
‐
10.0
20.0
30.0
40.0Net Sales (Rs Mn) % Ch. YoY
Source: Company, PhillipCapital India Research Estimates
The share of sanitary ware business in the total revenues at the consolidated level for the company is expected to decline from 43% in FY12 to 41% in FY14E. The overall share of the building products (sanitary ware and retail) business is expected remain flat at ~48% during FY12‐14E period as the share of the retail business increases as a percentage of total sales. The share of container glass segment and garden polymer are expected to consolidate at 48% and 4% respectively by FY14E. Sales Break up
45 46 43 42 41
52 5149 48 48
3 3 5 6 7
443
0
20
40
60
80
100
FY10 FY11 FY12 FY13E FY14E
‐ BP % of Total Sales ‐ CG % of Total Sales
‐ Hindware Retail % of Total Sales ‐ Garden Polymer % of Total Sales
Source: Company, PhillipCapital India Research Estimates

– 48 of 94 –
4 December 2012 / INDIA EQUITY RESEARCH / HSIL LTD.
EBIDTA estimated to register a CAGR of ~18.5% in FY12‐14E We estimate the EBIDTA to increase from Rs 2498mn in FY12 to Rs 2794mn (YoY growth of 11.9%) in FY13E and then to Rs 3507mn (YoY growth of 25.5%) in FY14E. We expect the consolidated margins to improve gradually from current levels of ~17%. Ebidta Growth and Margins
0
1,000
2,000
3,000
4,000
FY10 FY11 FY12 FY13E FY14E
14.0
15.0
16.0
17.0
18.0
19.0
20.0PBIDT (Rs Mn) % Margin
Source: Company, PhillipCapital India Research Estimates
Some of the key issues impacting the margins of the company in the coming years are as under: • Increasing share of premium and super premium category products in the total
building products business. • The ramping up of production at the new facilities of sanitary ware and container
glass which have come up recently and the green‐field faucets and sanitary ware plant that is coming up. The increasing utilization levels will provide operating leverage benefits to the company. Faucets are expected to reach 25% of the total sanitary ware segment in coming three years.
• The negative contribution from the retail business may impact the margins of the company adversely. The home retail subsidiary posted a EBIDTA loss of Rs 100mn and PAT level loss of Rs 170mn in FY12. We expect the loss to come down a bit Rs 130mn during FY13E (EBIDTA level loss Rs 80mn) despite new stores being opened. The company has guided for EBIDTA break‐even during FY14E and PAT break even by FY15E.
• Two other factors that may impact the profitability of the company are raw material costs and power & fuel costs. The fuel costs as a percentage of sales have been closer to 20% in last 5 years. Any deviation in the same may have adverse impact on the margins.
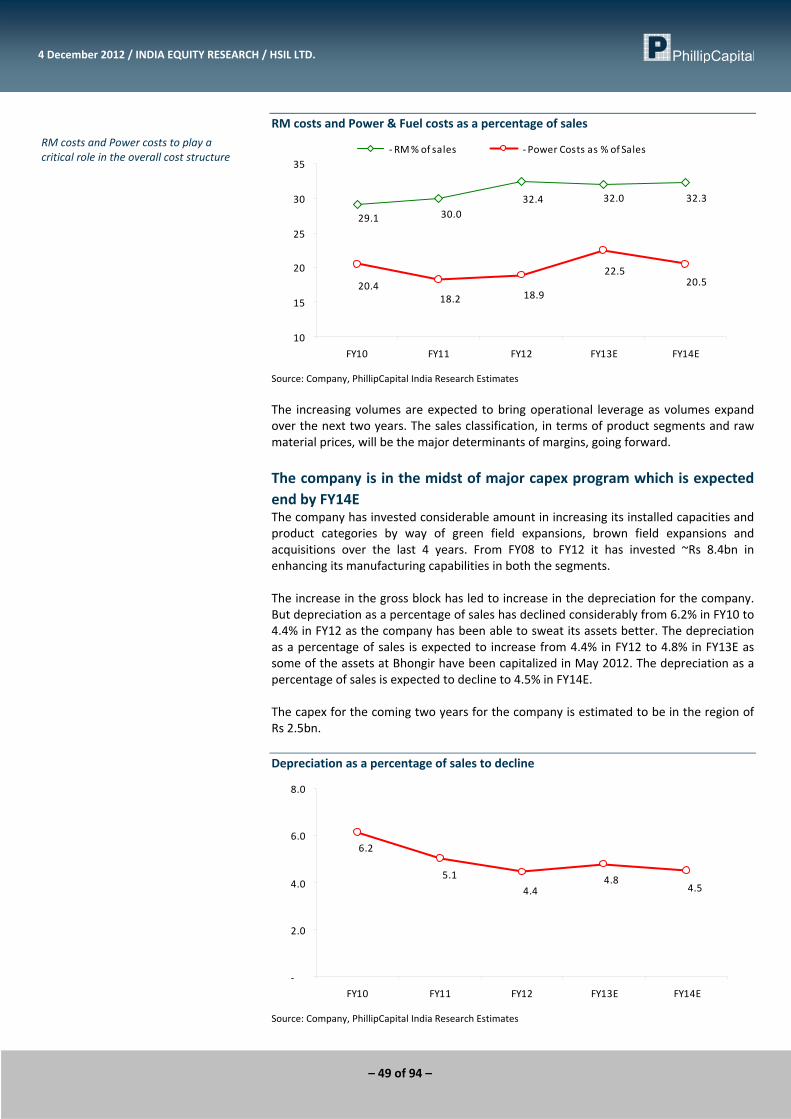
– 49 of 94 –
4 December 2012 / INDIA EQUITY RESEARCH / HSIL LTD.
RM costs and Power & Fuel costs as a percentage of sales
29.1 30.032.4 32.0 32.3
20.418.2 18.9
22.520.5
10
15
20
25
30
35
FY10 FY11 FY12 FY13E FY14E
‐ RM % of sales ‐ Power Costs as % of Sales
Source: Company, PhillipCapital India Research Estimates
The increasing volumes are expected to bring operational leverage as volumes expand over the next two years. The sales classification, in terms of product segments and raw material prices, will be the major determinants of margins, going forward.
The company is in the midst of major capex program which is expected end by FY14E The company has invested considerable amount in increasing its installed capacities and product categories by way of green field expansions, brown field expansions and acquisitions over the last 4 years. From FY08 to FY12 it has invested ~Rs 8.4bn in enhancing its manufacturing capabilities in both the segments. The increase in the gross block has led to increase in the depreciation for the company. But depreciation as a percentage of sales has declined considerably from 6.2% in FY10 to 4.4% in FY12 as the company has been able to sweat its assets better. The depreciation as a percentage of sales is expected to increase from 4.4% in FY12 to 4.8% in FY13E as some of the assets at Bhongir have been capitalized in May 2012. The depreciation as a percentage of sales is expected to decline to 4.5% in FY14E. The capex for the coming two years for the company is estimated to be in the region of Rs 2.5bn. Depreciation as a percentage of sales to decline
6.2
5.1
4.44.8
4.5
‐
2.0
4.0
6.0
8.0
FY10 FY11 FY12 FY13E FY14E
Source: Company, PhillipCapital India Research Estimates
RM costs and Power costs to play a critical role in the overall cost structure
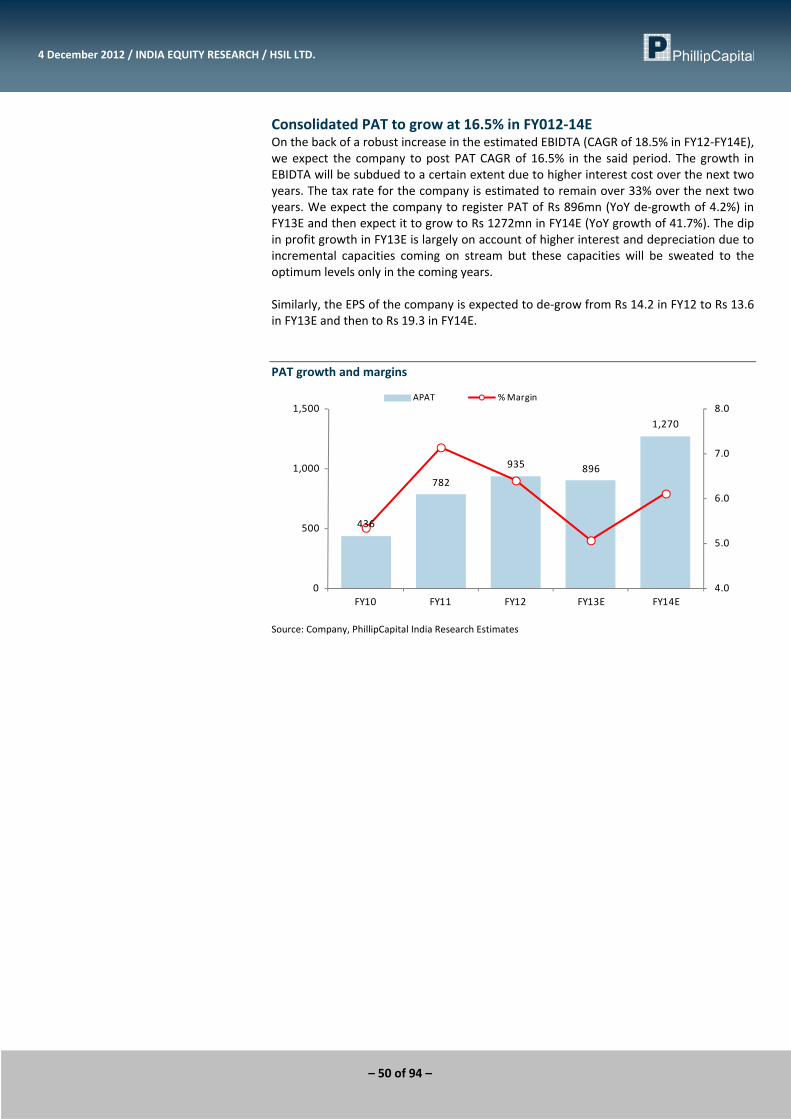
– 50 of 94 –
4 December 2012 / INDIA EQUITY RESEARCH / HSIL LTD.
Consolidated PAT to grow at 16.5% in FY012‐14E On the back of a robust increase in the estimated EBIDTA (CAGR of 18.5% in FY12‐FY14E), we expect the company to post PAT CAGR of 16.5% in the said period. The growth in EBIDTA will be subdued to a certain extent due to higher interest cost over the next two years. The tax rate for the company is estimated to remain over 33% over the next two years. We expect the company to register PAT of Rs 896mn (YoY de‐growth of 4.2%) in FY13E and then expect it to grow to Rs 1272mn in FY14E (YoY growth of 41.7%). The dip in profit growth in FY13E is largely on account of higher interest and depreciation due to incremental capacities coming on stream but these capacities will be sweated to the optimum levels only in the coming years. Similarly, the EPS of the company is expected to de‐grow from Rs 14.2 in FY12 to Rs 13.6 in FY13E and then to Rs 19.3 in FY14E. PAT growth and margins
436
782
935 896
1,270
4.0
5.0
6.0
7.0
8.0
0
500
1,000
1,500
FY10 FY11 FY12 FY13E FY14E
APAT % Margin
Source: Company, PhillipCapital India Research Estimates
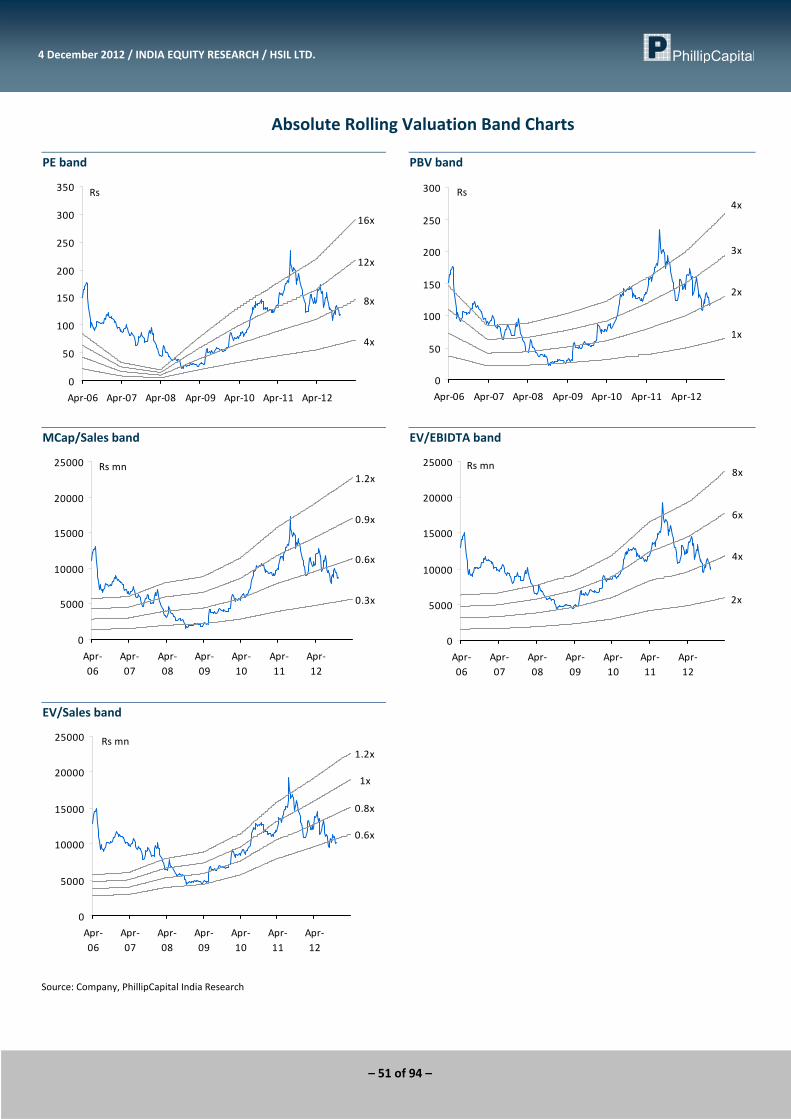
– 51 of 94 –
4 December 2012 / INDIA EQUITY RESEARCH / HSIL LTD.
Absolute Rolling Valuation Band Charts
PE band
4x
8x
12x
16x
0
50
100
150
200
250
300
350
Apr‐06 Apr‐07 Apr‐08 Apr‐09 Apr‐10 Apr‐11 Apr‐12
Rs
PBV band
1x
2x
3x
4x
0
50
100
150
200
250
300
Apr‐06 Apr‐07 Apr‐08 Apr‐09 Apr‐10 Apr‐11 Apr‐12
Rs
MCap/Sales band
0.3x
0.6x
0.9x
1.2x
0
5000
10000
15000
20000
25000
Apr‐06
Apr‐07
Apr‐08
Apr‐09
Apr‐10
Apr‐11
Apr‐12
Rs mn
EV/EBIDTA band
2x
4x
6x
8x
0
5000
10000
15000
20000
25000
Apr‐06
Apr‐07
Apr‐08
Apr‐09
Apr‐10
Apr‐11
Apr‐12
Rs mn
EV/Sales band
0.6x
0.8x
1x
1.2x
0
5000
10000
15000
20000
25000
Apr‐06
Apr‐07
Apr‐08
Apr‐09
Apr‐10
Apr‐11
Apr‐12
Rs mn
Source: Company, PhillipCapital India Research
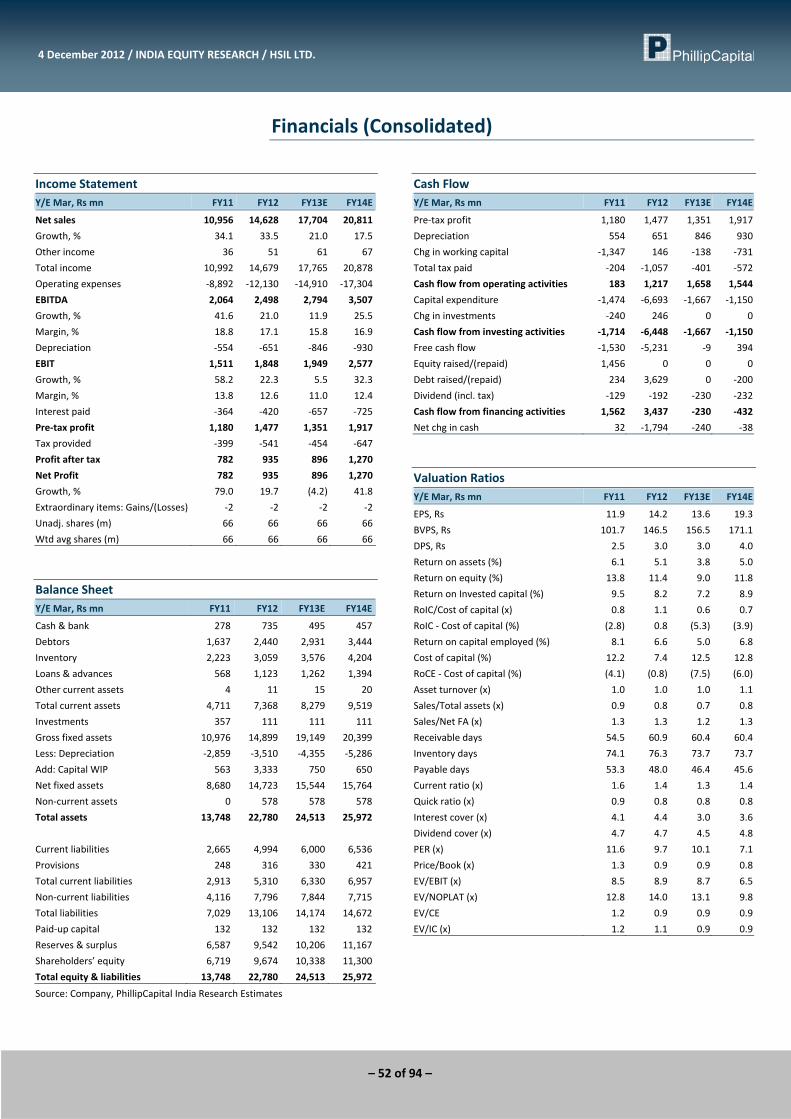
– 52 of 94 –
4 December 2012 / INDIA EQUITY RESEARCH / HSIL LTD.
Financials (Consolidated)
Income Statement Y/E Mar, Rs mn FY11 FY12 FY13E FY14E
Net sales 10,956 14,628 17,704 20,811
Growth, % 34.1 33.5 21.0 17.5
Other income 36 51 61 67
Total income 10,992 14,679 17,765 20,878
Operating expenses ‐8,892 ‐12,130 ‐14,910 ‐17,304
EBITDA 2,064 2,498 2,794 3,507
Growth, % 41.6 21.0 11.9 25.5
Margin, % 18.8 17.1 15.8 16.9
Depreciation ‐554 ‐651 ‐846 ‐930
EBIT 1,511 1,848 1,949 2,577
Growth, % 58.2 22.3 5.5 32.3
Margin, % 13.8 12.6 11.0 12.4
Interest paid ‐364 ‐420 ‐657 ‐725
Pre‐tax profit 1,180 1,477 1,351 1,917
Tax provided ‐399 ‐541 ‐454 ‐647
Profit after tax 782 935 896 1,270
Net Profit 782 935 896 1,270
Growth, % 79.0 19.7 (4.2) 41.8
Extraordinary items: Gains/(Losses) ‐2 ‐2 ‐2 ‐2
Unadj. shares (m) 66 66 66 66
Wtd avg shares (m) 66 66 66 66
Balance Sheet Y/E Mar, Rs mn FY11 FY12 FY13E FY14E
Cash & bank 278 735 495 457
Debtors 1,637 2,440 2,931 3,444
Inventory 2,223 3,059 3,576 4,204
Loans & advances 568 1,123 1,262 1,394
Other current assets 4 11 15 20
Total current assets 4,711 7,368 8,279 9,519
Investments 357 111 111 111
Gross fixed assets 10,976 14,899 19,149 20,399
Less: Depreciation ‐2,859 ‐3,510 ‐4,355 ‐5,286
Add: Capital WIP 563 3,333 750 650
Net fixed assets 8,680 14,723 15,544 15,764
Non‐current assets 0 578 578 578
Total assets 13,748 22,780 24,513 25,972
Current liabilities 2,665 4,994 6,000 6,536
Provisions 248 316 330 421
Total current liabilities 2,913 5,310 6,330 6,957
Non‐current liabilities 4,116 7,796 7,844 7,715
Total liabilities 7,029 13,106 14,174 14,672
Paid‐up capital 132 132 132 132
Reserves & surplus 6,587 9,542 10,206 11,167
Shareholders’ equity 6,719 9,674 10,338 11,300
Total equity & liabilities 13,748 22,780 24,513 25,972
Source: Company, PhillipCapital India Research Estimates
Cash Flow Y/E Mar, Rs mn FY11 FY12 FY13E FY14E
Pre‐tax profit 1,180 1,477 1,351 1,917
Depreciation 554 651 846 930
Chg in working capital ‐1,347 146 ‐138 ‐731
Total tax paid ‐204 ‐1,057 ‐401 ‐572
Cash flow from operating activities 183 1,217 1,658 1,544
Capital expenditure ‐1,474 ‐6,693 ‐1,667 ‐1,150
Chg in investments ‐240 246 0 0
Cash flow from investing activities ‐1,714 ‐6,448 ‐1,667 ‐1,150
Free cash flow ‐1,530 ‐5,231 ‐9 394
Equity raised/(repaid) 1,456 0 0 0
Debt raised/(repaid) 234 3,629 0 ‐200
Dividend (incl. tax) ‐129 ‐192 ‐230 ‐232
Cash flow from financing activities 1,562 3,437 ‐230 ‐432
Net chg in cash 32 ‐1,794 ‐240 ‐38
Valuation Ratios Y/E Mar, Rs mn FY11 FY12 FY13E FY14E
EPS, Rs 11.9 14.2 13.6 19.3
BVPS, Rs 101.7 146.5 156.5 171.1
DPS, Rs 2.5 3.0 3.0 4.0
Return on assets (%) 6.1 5.1 3.8 5.0
Return on equity (%) 13.8 11.4 9.0 11.8
Return on Invested capital (%) 9.5 8.2 7.2 8.9
RoIC/Cost of capital (x) 0.8 1.1 0.6 0.7
RoIC ‐ Cost of capital (%) (2.8) 0.8 (5.3) (3.9)
Return on capital employed (%) 8.1 6.6 5.0 6.8
Cost of capital (%) 12.2 7.4 12.5 12.8
RoCE ‐ Cost of capital (%) (4.1) (0.8) (7.5) (6.0)
Asset turnover (x) 1.0 1.0 1.0 1.1
Sales/Total assets (x) 0.9 0.8 0.7 0.8
Sales/Net FA (x) 1.3 1.3 1.2 1.3
Receivable days 54.5 60.9 60.4 60.4
Inventory days 74.1 76.3 73.7 73.7
Payable days 53.3 48.0 46.4 45.6
Current ratio (x) 1.6 1.4 1.3 1.4
Quick ratio (x) 0.9 0.8 0.8 0.8
Interest cover (x) 4.1 4.4 3.0 3.6
Dividend cover (x) 4.7 4.7 4.5 4.8
PER (x) 11.6 9.7 10.1 7.1
Price/Book (x) 1.3 0.9 0.9 0.8
EV/EBIT (x) 8.5 8.9 8.7 6.5
EV/NOPLAT (x) 12.8 14.0 13.1 9.8
EV/CE 1.2 0.9 0.9 0.9
EV/IC (x) 1.2 1.1 0.9 0.9

– 53 of 94 –
Havells Ltd. Lighting Homes with Returns
MIDCAP: HOME DÉCOR |Initiating Coverage 4 December 2012
PhillipCapital (India) Pvt. Ltd.
Havells is a Fast Moving Electrical Goods (FMEG) Company and a major power distribution equipment manufacturer. It has presence in industrial and domestic circuit protection switchgears, cables and wires, motors, fans, power capacitors, CFL lamps, luminaries for domestic/commercial and industrial applications, and modular switches. It has 7 manufacturing plants in India and 6 manufacturing plants located across Europe and Latin America, through its subsidiary Sylvania.
Electrical goods constitute one of the very important ingredients of home décor sector, with their utility varying from necessity based (switches and wires) to decoration based (lightings and fixtures). While the segment has a large set of listed and unlisted companies, Havells is one of the leading players.
Robust business model with strong balance sheet Havells’ business model is built on high asset turnover and low working capital – more like an FMCG company. It operates through a vast network of 5,700 dealers across 100,000 outlets and focuses on strong brand building. This has strengthened the balance sheet of the company, which remains a net cash company (standalone) and generates strong operating cash flows.
Superior earnings growth to enhance return profile We expect Havells to report 20% CAGR in topline and 21% CAGR in earnings over the period FY12‐14E. The company has historically performed even better – CAGR of 18.5% in top‐line and 24.5% in earnings over FY07‐12. This should enable the company to deliver average ROE of 21% over FY12‐14E (historical average ROE of 22% over FY08‐12).
Dominant market position in all segments Havells enjoys market leadership in almost all the segments it operates. It is one of the top three players in Switchgear, Cables, Lightings & Fixtures and Fans segments and prices its products at 0‐5% premium to the market leader. ‘Electrical durables’ is one segment where it is yet to establish its dominance, though its products are still priced at par with the market leader (Philips).
Sylvania concerns remain, turnaround not yet in sight The 2QFY13 results showed that the Sylvania turnaround story is not yet complete. Turbulent times in Europe and low penetration in Latin American markets will continue to pose big impediments in Sylvania’s recovery path, in our opinion. We expect its contribution to the consolidated earnings to decline over the next two years, and the overhang to continue for few more quarters.
Valuations still attractive, re‐rating on the cards Havells is currently trading at 17x FY14 standalone earnings (15x FY14 consolidated). Considering 21% ROE and earnings growth over FY12‐14, we do not see the multiple as exceptionally high. We believe the stock deserves a higher multiple, considering the similarity between the FMCG and its business model (high asset turnover, net cash, small working capital cycle). We value Havells standalone (India business) at 19x FY14 earnings and Sylvania (overseas business) at 6x EV/EBITDA. Put together, it gives us a price target of Rs695, representing 19% upside from current levels. We recommend BUY.
BUY HAVL IN | CMP RS 585
TARGET RS 695 (+19%) Company Data
O/S SHARES (MN) : 125MARKET CAP (RSBN) : 73MARKET CAP (USDBN) : 1.352 ‐ WK HI/LO (RS) : 672 / 365LIQUIDITY 3M (USDMN) : 2.9FACE VALUE (RS) : 5
Share Holding Pattern, %
PROMOTERS : 61.6FII / NRI : 30.0FI / MF : 1.1NON PROMOTER CORP. HOLDINGS : 1.1PUBLIC & OTHERS : 5.6
Price Performance, % 1mth 3mth 1yr
ABS ‐0.1 6.2 37.5REL TO BSE ‐3.0 ‐4.9 22.9
Price Vs. Sensex (Rebased values)
0
40
80
120
160
200
240
Apr‐10 Jan‐11 Oct‐11 Jul‐12Havells BSE Sensex
Source: Bloomberg, Phillip Capital Research
Other Key Ratios
Rs mn FY12 FY13E FY14E
Net Sales 36,156 43,078 51,006EBIDTA 4,557 5,048 5,895Net Profit 3,054 3,399 4,282EPS, Rs 24.5 27.2 34.3PER, X 23.9 21.4 17.0EV/EBIDTA, x 15.9 14.1 11.7EV/Net Sales, x 2.0 1.6 1.3ROE, % 20.7 19.6 21.2Source: Phillip Capital India Research Vibhor Singhal (+ 9122 6667 9949) [email protected] Kapil Bagaria (+ 9122 6667 9965) [email protected]
– 54 of 94 –
4 December 2012 / INDIA EQUITY RESEARCH / HAVELLS LTD.
Investment Thesis We initiate coverage of Havells Ltd, with a BUY rating and price target of Rs695. Our investment thesis rests on the following: 1) Superior return profile and balance sheet strength: We expect Havells to deliver
average ROE of 21% over FY12‐14E (historical average ROE of 22% over FY08‐12). The parent company is a net cash company (Net debt: ‐Rs3.7bn FY14E) with negligible interest expense (1% of EBITDA FY14E).
2) Robust topline and earnings growth: We expect the company to report 20.4% CAGR in topline and 21.4% CAGR in earnings over the period FY12‐14E. The company has historically performed even better – CAGR of 18.5% in top‐line and 24.5% in earnings over FY07‐12.
3) Valuations still attractive, considering the high growth profile: As per our estimates, Havells is currently trading at 18x FY14 earnings (standalone). Considering 21% ROE and high earnings growth over FY12‐14, we do not see the multiple as exceptionally high. We believe the stock deserves a higher multiple, considering the similarity between the FMCG and its business model (high asset turnover, net cash, small working capital cycle).
4) Excellent business model with high asset turnover and small working capital cycle: The company has a robust business model, more in‐line with FMCG companies. Almost all the segments it operates in, are characterized with high asset turnover (2.1x average Asset turnover FY12‐14E). The company operates through a vast dealer network spread across the country on cash payment basis, helping it operate on zero to negative net working capital basis.
5) “Dealer is King” ideology driving the growth: Havells operates exclusively through its dealer network spread the country (2,500 specialized dealers, 100 Havells galaxies and 30,000 retail outlets). The company provides these dealers, a discount of 15‐20% to the MRP, on all products, and leaves it to dealers to keep the margin for themselves (passing the remaining benefit to the customers). It is this network of trusted dealers that helps the company garner market share at the expense of its peers, and provides it with valuable inputs for formulating its growth strategy.
6) Dominant market position in ALL segments: Havells enjoys market leadership in almost all the segments it operates. It is one of the top three players in Switchgear, Cables, Lightings and Fans segments; and prices its products at 0‐5% premium to the market leader. It is yet to establish its dominance in the Electrical durables, though its products are still priced at par with the market leader (Philips).
7) Sylvania turnaround not yet in sight, overhang to remain: Havells acquired Sylvania in 2007 at acquisition cost of €235mn. While in FY12, Sylvania reported net profit of €10mn, the 2QFY13 results (Adjusted PAT loss €1.5mn) demonstrated that the turnaround story is not yet complete. Turbulent times in Europe and low penetration in Latin American markets will pose big impediments in Sylvania’s recovery path, in our opinion. We expect its contribution to consolidated earnings to decline over next two years, and the overhang to continue for few more quarters.
8) Macro environment to support robust growth profile: Over 70% of Havells’ products are sold to retail customers. With the disposable income expected to increase by 6.1% CAGR over FY08‐30 (4.3% over FY90‐08), increasing share of the organized market and increasing brand awareness (on the back of higher advertizing spend), we expect the company to continue reporting 15‐20% growth in top‐line on a recurring basis.
9) Reducing product replacement cycle to shield from real estate downturn: Across the electrical industry, the product replacement cycle has shortened significantly. While the lightings (lamps, CFLs) need replacement almost every two‐three years, Fans too, have witnessed reduction in their replacement period (consumers are changing the wall colors more frequently these days, than before). This ensures that the topline growth of the company is not tied to new home sales only – approx 8‐10% of Havells’s sales can be attributed to product replacement.
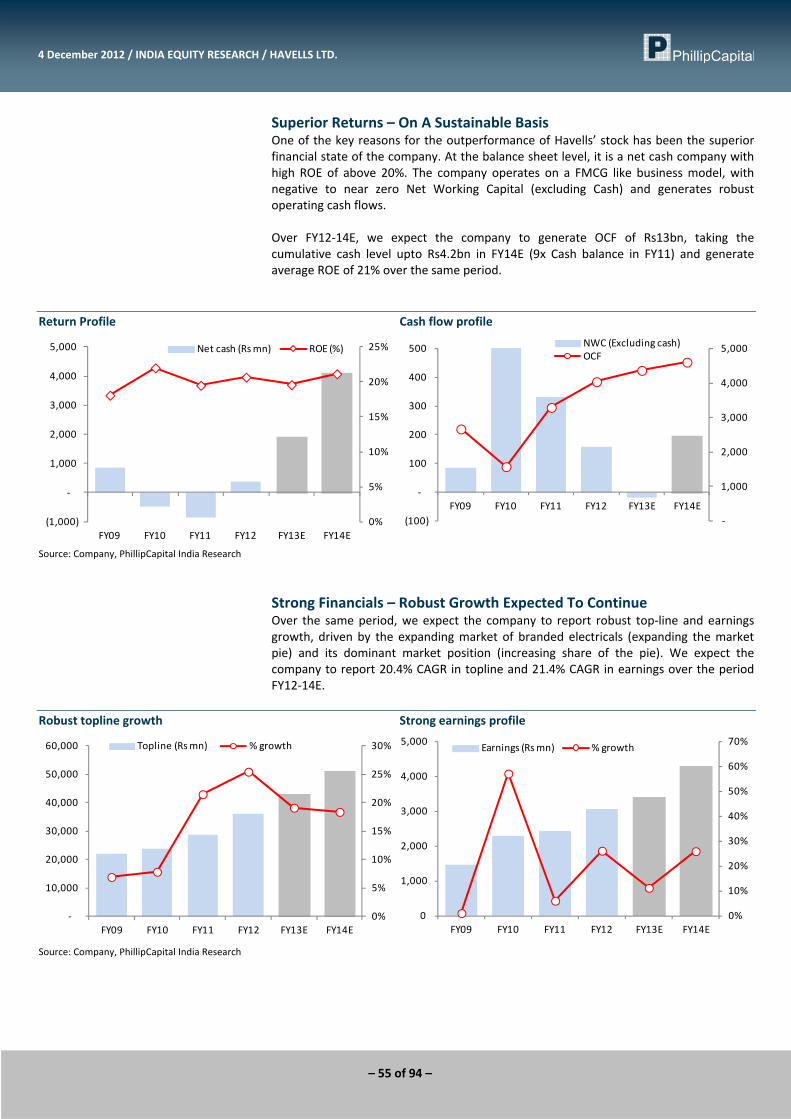
– 55 of 94 –
4 December 2012 / INDIA EQUITY RESEARCH / HAVELLS LTD.
Superior Returns – On A Sustainable Basis One of the key reasons for the outperformance of Havells’ stock has been the superior financial state of the company. At the balance sheet level, it is a net cash company with high ROE of above 20%. The company operates on a FMCG like business model, with negative to near zero Net Working Capital (excluding Cash) and generates robust operating cash flows. Over FY12‐14E, we expect the company to generate OCF of Rs13bn, taking the cumulative cash level upto Rs4.2bn in FY14E (9x Cash balance in FY11) and generate average ROE of 21% over the same period.
Return Profile Cash flow profile
0%
5%
10%
15%
20%
25%
(1,000)
‐
1,000
2,000
3,000
4,000
5,000
FY09 FY10 FY11 FY12 FY13E FY14E
Net cash (Rs mn) ROE (%)
‐
1,000
2,000
3,000
4,000
5,000
(100)
‐
100
200
300
400
500
FY09 FY10 FY11 FY12 FY13E FY14E
NWC (Excluding cash)OCF
Source: Company, PhillipCapital India Research
Strong Financials – Robust Growth Expected To Continue Over the same period, we expect the company to report robust top‐line and earnings growth, driven by the expanding market of branded electricals (expanding the market pie) and its dominant market position (increasing share of the pie). We expect the company to report 20.4% CAGR in topline and 21.4% CAGR in earnings over the period FY12‐14E.
Robust topline growth Strong earnings profile
0%
5%
10%
15%
20%
25%
30%
‐
10,000
20,000
30,000
40,000
50,000
60,000
FY09 FY10 FY11 FY12 FY13E FY14E
Topline (Rs mn) % growth
0%
10%
20%
30%
40%
50%
60%
70%
0
1,000
2,000
3,000
4,000
5,000
FY09 FY10 FY11 FY12 FY13E FY14E
Earnings (Rs mn) % growth
Source: Company, PhillipCapital India Research
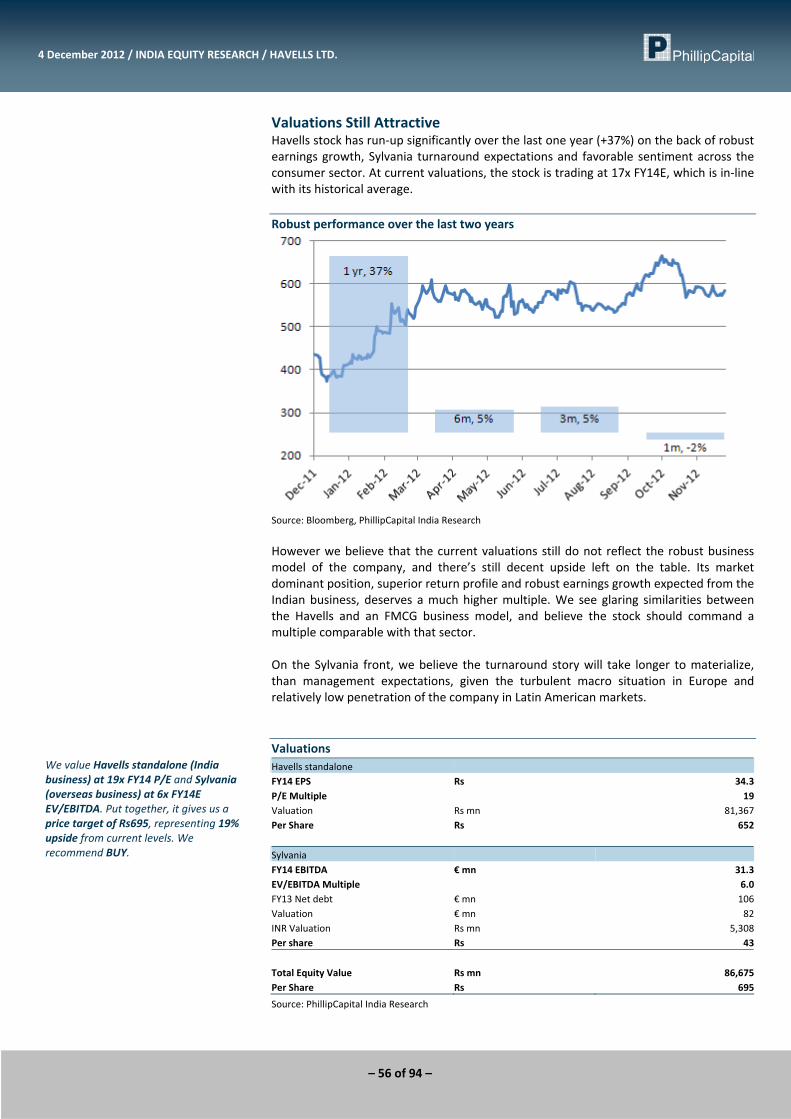
– 56 of 94 –
4 December 2012 / INDIA EQUITY RESEARCH / HAVELLS LTD.
Valuations Still Attractive Havells stock has run‐up significantly over the last one year (+37%) on the back of robust earnings growth, Sylvania turnaround expectations and favorable sentiment across the consumer sector. At current valuations, the stock is trading at 17x FY14E, which is in‐line with its historical average. Robust performance over the last two years
Source: Bloomberg, PhillipCapital India Research
However we believe that the current valuations still do not reflect the robust business model of the company, and there’s still decent upside left on the table. Its market dominant position, superior return profile and robust earnings growth expected from the Indian business, deserves a much higher multiple. We see glaring similarities between the Havells and an FMCG business model, and believe the stock should command a multiple comparable with that sector. On the Sylvania front, we believe the turnaround story will take longer to materialize, than management expectations, given the turbulent macro situation in Europe and relatively low penetration of the company in Latin American markets. Valuations Havells standalone FY14 EPS Rs 34.3P/E Multiple 19 Valuation Rs mn 81,367Per Share Rs 652
Sylvania FY14 EBITDA € mn 31.3EV/EBITDA Multiple 6.0FY13 Net debt € mn 106Valuation € mn 82INR Valuation Rs mn 5,308Per share Rs 43
Total Equity Value Rs mn 86,675Per Share Rs 695
Source: PhillipCapital India Research
We value Havells standalone (India business) at 19x FY14 P/E and Sylvania (overseas business) at 6x FY14E EV/EBITDA. Put together, it gives us a price target of Rs695, representing 19% upside from current levels. We recommend BUY.
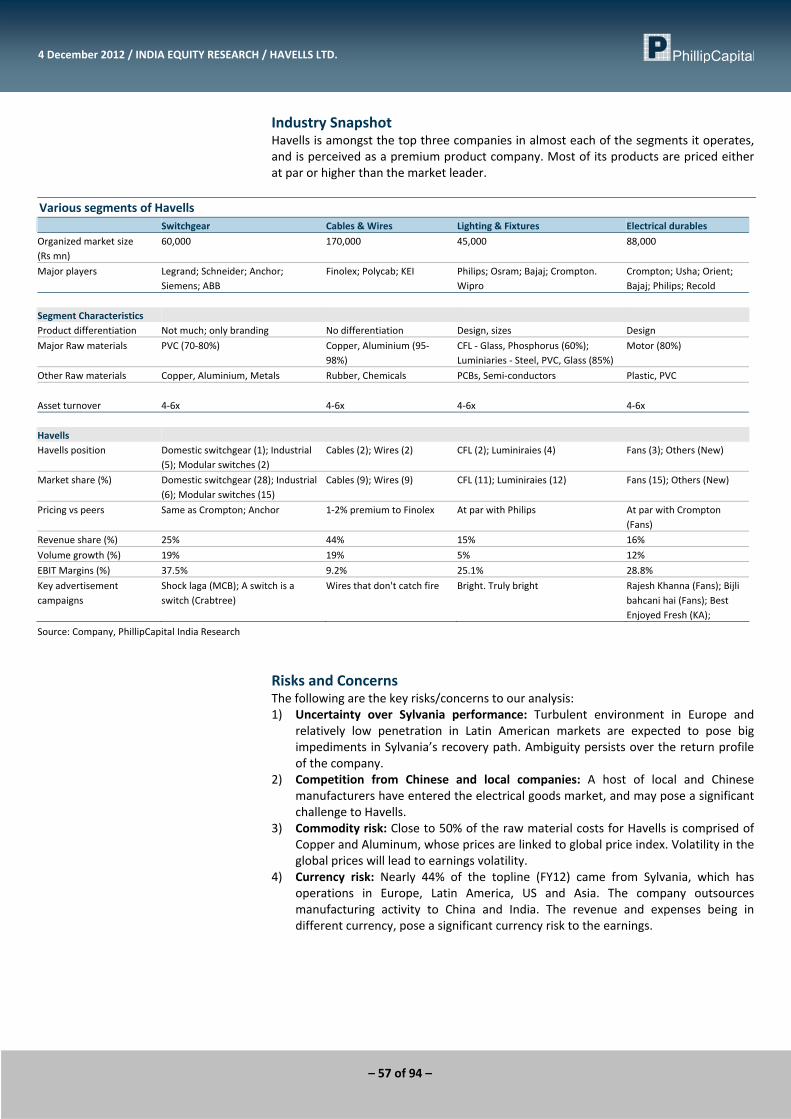
– 57 of 94 –
4 December 2012 / INDIA EQUITY RESEARCH / HAVELLS LTD.
Industry Snapshot Havells is amongst the top three companies in almost each of the segments it operates, and is perceived as a premium product company. Most of its products are priced either at par or higher than the market leader.
Various segments of Havells Switchgear Cables & Wires Lighting & Fixtures Electrical durables
Organized market size (Rs mn)
60,000 170,000 45,000 88,000
Major players Legrand; Schneider; Anchor; Siemens; ABB
Finolex; Polycab; KEI Philips; Osram; Bajaj; Crompton. Wipro
Crompton; Usha; Orient; Bajaj; Philips; Recold
Segment Characteristics Product differentiation Not much; only branding No differentiation Design, sizes Design
Major Raw materials PVC (70‐80%) Copper, Aluminium (95‐98%)
CFL ‐ Glass, Phosphorus (60%); Luminiaries ‐ Steel, PVC, Glass (85%)
Motor (80%)
Other Raw materials Copper, Aluminium, Metals Rubber, Chemicals PCBs, Semi‐conductors Plastic, PVC
Asset turnover 4‐6x 4‐6x 4‐6x 4‐6x
Havells Havells position Domestic switchgear (1); Industrial
(5); Modular switches (2) Cables (2); Wires (2) CFL (2); Luminiraies (4) Fans (3); Others (New)
Market share (%) Domestic switchgear (28); Industrial (6); Modular switches (15)
Cables (9); Wires (9) CFL (11); Luminiraies (12) Fans (15); Others (New)
Pricing vs peers Same as Crompton; Anchor 1‐2% premium to Finolex At par with Philips At par with Crompton (Fans)
Revenue share (%) 25% 44% 15% 16%
Volume growth (%) 19% 19% 5% 12%
EBIT Margins (%) 37.5% 9.2% 25.1% 28.8%
Key advertisement campaigns
Shock laga (MCB); A switch is a switch (Crabtree)
Wires that don't catch fire Bright. Truly bright Rajesh Khanna (Fans); Bijli bahcani hai (Fans); Best Enjoyed Fresh (KA);
Source: Company, PhillipCapital India Research
Risks and Concerns The following are the key risks/concerns to our analysis: 1) Uncertainty over Sylvania performance: Turbulent environment in Europe and
relatively low penetration in Latin American markets are expected to pose big impediments in Sylvania’s recovery path. Ambiguity persists over the return profile of the company.
2) Competition from Chinese and local companies: A host of local and Chinese manufacturers have entered the electrical goods market, and may pose a significant challenge to Havells.
3) Commodity risk: Close to 50% of the raw material costs for Havells is comprised of Copper and Aluminum, whose prices are linked to global price index. Volatility in the global prices will lead to earnings volatility.
4) Currency risk: Nearly 44% of the topline (FY12) came from Sylvania, which has operations in Europe, Latin America, US and Asia. The company outsources manufacturing activity to China and India. The revenue and expenses being in different currency, pose a significant currency risk to the earnings.

– 58 of 94 –
4 December 2012 / INDIA EQUITY RESEARCH / HAVELLS LTD.
Business Model
Segmental revenue break‐up (consolidated) – FY12
Sylvania 44% Standalone 56%Havells
Lamps 67%Fixtures 33%
Others 6%Europe 62% Americas 32%
Cables 44%Switchgear 25% Durables 16%Lightings 15%
East 23%North 34% South 28%West 15%
Sylvania 44% Standalone 56%Havells
Lamps 67%Fixtures 33%
Others 6%Europe 62% Americas 32%
Cables 44%Switchgear 25% Durables 16%Lightings 15%
East 23%North 34% South 28%West 15%
Source: Company, PhillipCapital India Research
Cables & Wires segment, though largest contributor to the topline, contributes only ~20% to profit, due to low operating margins in the segment. Switchgears, on the other hand, is the largest contributor to operating profit.
Segmental Contribution End consumer profile
43%
25%
19%
44%
18%
15%
21%
16%
0% 20% 40% 60% 80% 100%
EBITTopline
Switchgears Cables Lightings Durables
20% 5% 25% 19% 15% 16%
Industrial, 30%
Domestic, 70%
0% 20% 40% 60% 80% 100%
Segmental
End Consumer
Switchgears Cables Lightings Durables
Source: Company, PhillipCapital India Research
Close to 30% of the sales are to Industrial customers – comprising of Industrial Cables (25%) and Industrial Switchgears (5%). Raw material break‐up (Standalone) – FY12
Copper, 32%
Aluminium, 18%
Plastic, 8%
Paints & Chemicals, 6%
Steel, 5%
Packing material, 5%
Others, 26%
Source: Company, PhillipCapital India Research
Copper and Aluminum form almost 50% of the total cost of raw material for the company. The prices of these are determined in accordance with the global prices.
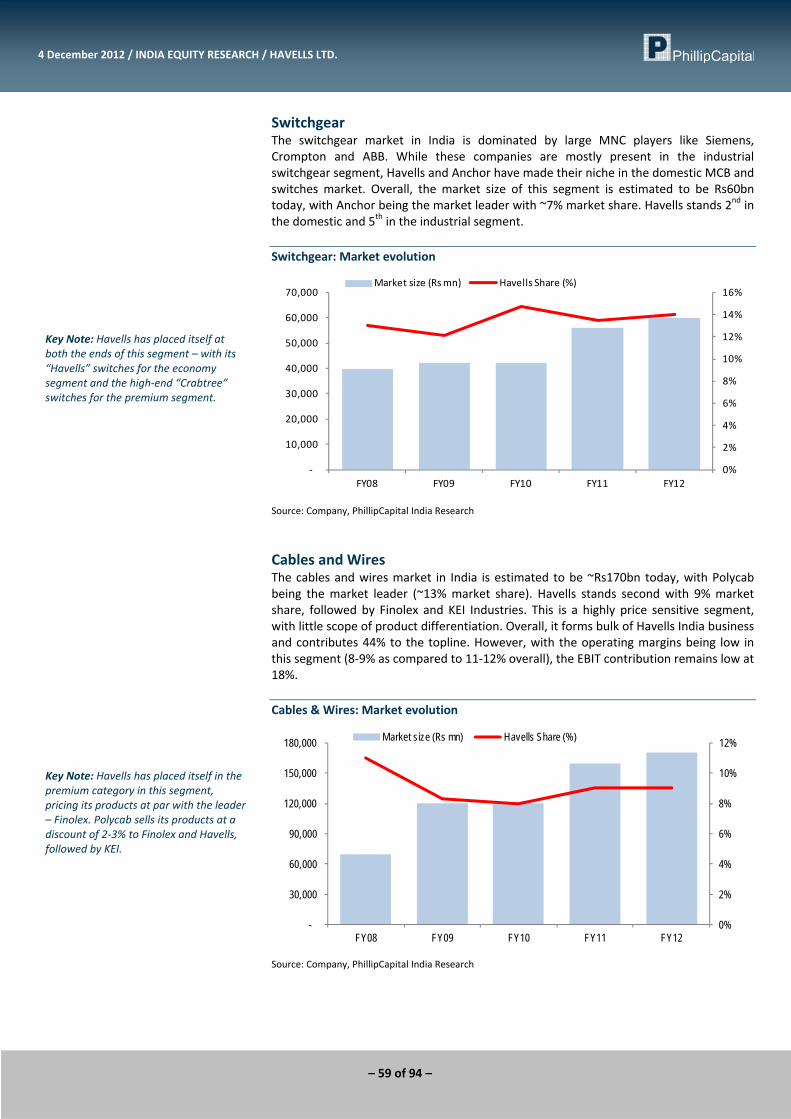
– 59 of 94 –
4 December 2012 / INDIA EQUITY RESEARCH / HAVELLS LTD.
Switchgear The switchgear market in India is dominated by large MNC players like Siemens, Crompton and ABB. While these companies are mostly present in the industrial switchgear segment, Havells and Anchor have made their niche in the domestic MCB and switches market. Overall, the market size of this segment is estimated to be Rs60bn today, with Anchor being the market leader with ~7% market share. Havells stands 2nd in the domestic and 5th in the industrial segment. Switchgear: Market evolution
0%
2%
4%
6%
8%
10%
12%
14%
16%
‐
10,000
20,000
30,000
40,000
50,000
60,000
70,000
FY08 FY09 FY10 FY11 FY12
Market size (Rs mn) Havells Share (%)
Source: Company, PhillipCapital India Research
Cables and Wires The cables and wires market in India is estimated to be ~Rs170bn today, with Polycab being the market leader (~13% market share). Havells stands second with 9% market share, followed by Finolex and KEI Industries. This is a highly price sensitive segment, with little scope of product differentiation. Overall, it forms bulk of Havells India business and contributes 44% to the topline. However, with the operating margins being low in this segment (8‐9% as compared to 11‐12% overall), the EBIT contribution remains low at 18%. Cables & Wires: Market evolution
0%
2%
4%
6%
8%
10%
12%
-
30,000
60,000
90,000
120,000
150,000
180,000
FY08 FY09 FY10 FY11 FY12
Market size (Rs mn) Havells Share (%)
Source: Company, PhillipCapital India Research
Key Note: Havells has placed itself at both the ends of this segment – with its “Havells” switches for the economy segment and the high‐end “Crabtree” switches for the premium segment.
Key Note: Havells has placed itself in the premium category in this segment, pricing its products at par with the leader – Finolex. Polycab sells its products at a discount of 2‐3% to Finolex and Havells, followed by KEI.
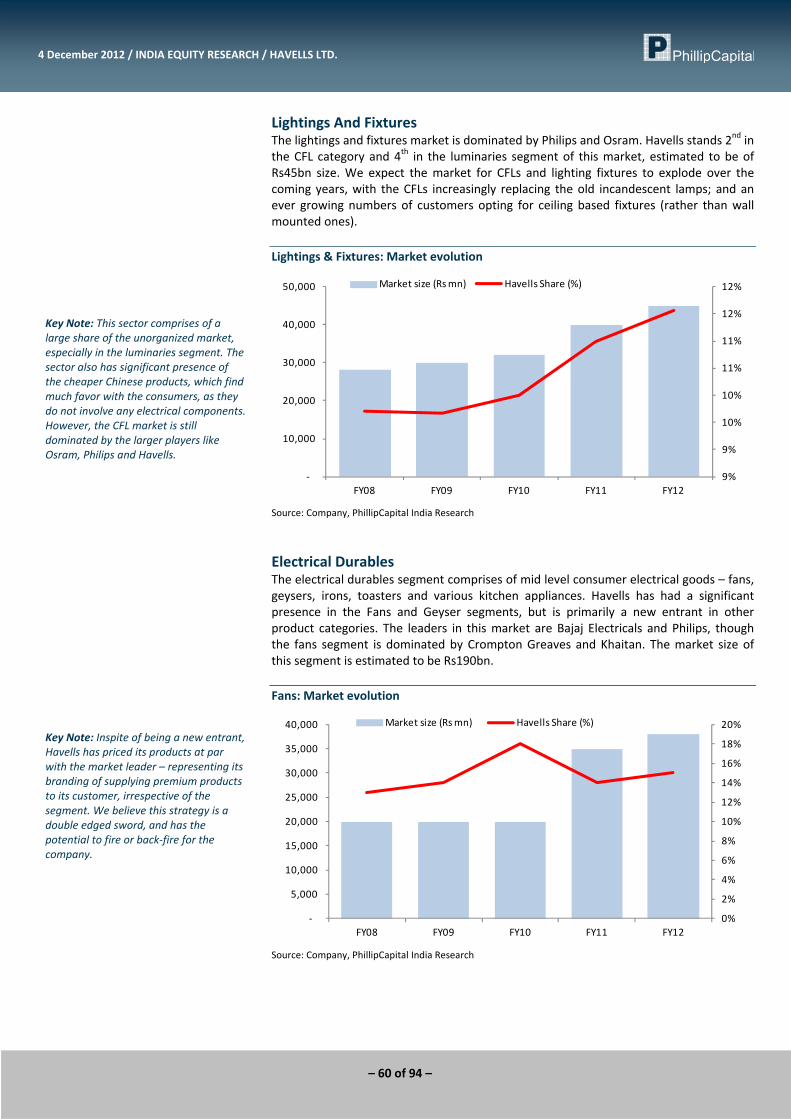
– 60 of 94 –
4 December 2012 / INDIA EQUITY RESEARCH / HAVELLS LTD.
Lightings And Fixtures The lightings and fixtures market is dominated by Philips and Osram. Havells stands 2nd in the CFL category and 4th in the luminaries segment of this market, estimated to be of Rs45bn size. We expect the market for CFLs and lighting fixtures to explode over the coming years, with the CFLs increasingly replacing the old incandescent lamps; and an ever growing numbers of customers opting for ceiling based fixtures (rather than wall mounted ones). Lightings & Fixtures: Market evolution
9%
9%
10%
10%
11%
11%
12%
12%
‐
10,000
20,000
30,000
40,000
50,000
FY08 FY09 FY10 FY11 FY12
Market size (Rs mn) Havells Share (%)
Source: Company, PhillipCapital India Research
Electrical Durables The electrical durables segment comprises of mid level consumer electrical goods – fans, geysers, irons, toasters and various kitchen appliances. Havells has had a significant presence in the Fans and Geyser segments, but is primarily a new entrant in other product categories. The leaders in this market are Bajaj Electricals and Philips, though the fans segment is dominated by Crompton Greaves and Khaitan. The market size of this segment is estimated to be Rs190bn. Fans: Market evolution
0%
2%
4%
6%
8%
10%
12%
14%
16%
18%
20%
‐
5,000
10,000
15,000
20,000
25,000
30,000
35,000
40,000
FY08 FY09 FY10 FY11 FY12
Market size (Rs mn) Havells Share (%)
Source: Company, PhillipCapital India Research
Key Note: This sector comprises of a large share of the unorganized market, especially in the luminaries segment. The sector also has significant presence of the cheaper Chinese products, which find much favor with the consumers, as they do not involve any electrical components. However, the CFL market is still dominated by the larger players like Osram, Philips and Havells.
Key Note: Inspite of being a new entrant, Havells has priced its products at par with the market leader – representing its branding of supplying premium products to its customer, irrespective of the segment. We believe this strategy is a double edged sword, and has the potential to fire or back‐fire for the company.

– 61 of 94 –
4 December 2012 / INDIA EQUITY RESEARCH / HAVELLS LTD.
Segmental Analysis FY10 FY11 FY12 FY13E FY14E
Revenue (Rs mn) Switchgears 6,732 7,344 8,962 10,306 11,336Cables 9,843 12,318 15,930 19,116 22,939Lightings 3,493 4,447 5,544 6,791 8,150Durables 3,342 4,692 5,721 6,865 8,581
Total 23,409 28,800 36,156 43,078 51,006
Revenue Growth (%) Switchgears 11% 9% 22% 15% 10%Cables ‐1% 25% 29% 20% 20%Lightings 26% 27% 25% 23% 20%Durables 21% 40% 22% 20% 25%
Total 9% 23% 26% 19% 18%
EBIT* (Rs mn) Switchgears 2,611 2,719 3,363 3,813 4,194Cables 888 900 1,461 1,625 1,950Lightings 706 820 1,393 1,528 1,834Durables 1,019 1,295 1,650 1,888 2,360
Total 5,224 5,734 7,868 8,854 10,338
EBIT Margins (%) Switchgears 39% 37% 38% 37% 37%Cables 9% 7% 9% 9% 9%Lightings 20% 18% 25% 23% 23%Durables 31% 28% 29% 28% 28%
Total 22% 20% 22% 21% 20%
Source: Company, PhillipCapital India Research
Volume growth driving the business growth …. ….. while utilization levels remain low
‐80%
‐40%
0%
40%
80%
120%
160%
FY08 FY09 FY10 FY11 FY12
Volume growth (% YoY)
Switchgears CablesLightings Durables
61%
52%
70%
88%
0%
20%
40%
60%
80%
100%
Switchgears Cables Lightings Durables
Source: Company, PhillipCapital India Research
Factories and capacities Factories Segment Capacity Comments
Sahibabad Switchgear (industrial) ‐ ‐ Alwar Cables & Wires 1,150 mn mts Largest cable factory in India Baddi Switchgear (domestic) ‐ Largest MCB plant in India; 5th largest globally Faridabad Switchgear (industrial) ‐ ‐ Haridwar Fans, Switchgear (domestic) 4.8mn units Largest fans factory in India Neemrana Lightings & Fixtures 55.5mn units Largest lightings plant in India Noida Lightings (PCBs etc) ‐ ‐
Source: Company, PhillipCapital India Research
Over the next two years, we expect robust growth in Lightings and Durables segments, with muted growth in the Switchgear division. As a result, the revenue contribution of the switchgear division is expected to come down from 25% in FY12 to 22% in FY14.
*Does not include unallocated expenses, which amount to ~10% of sales
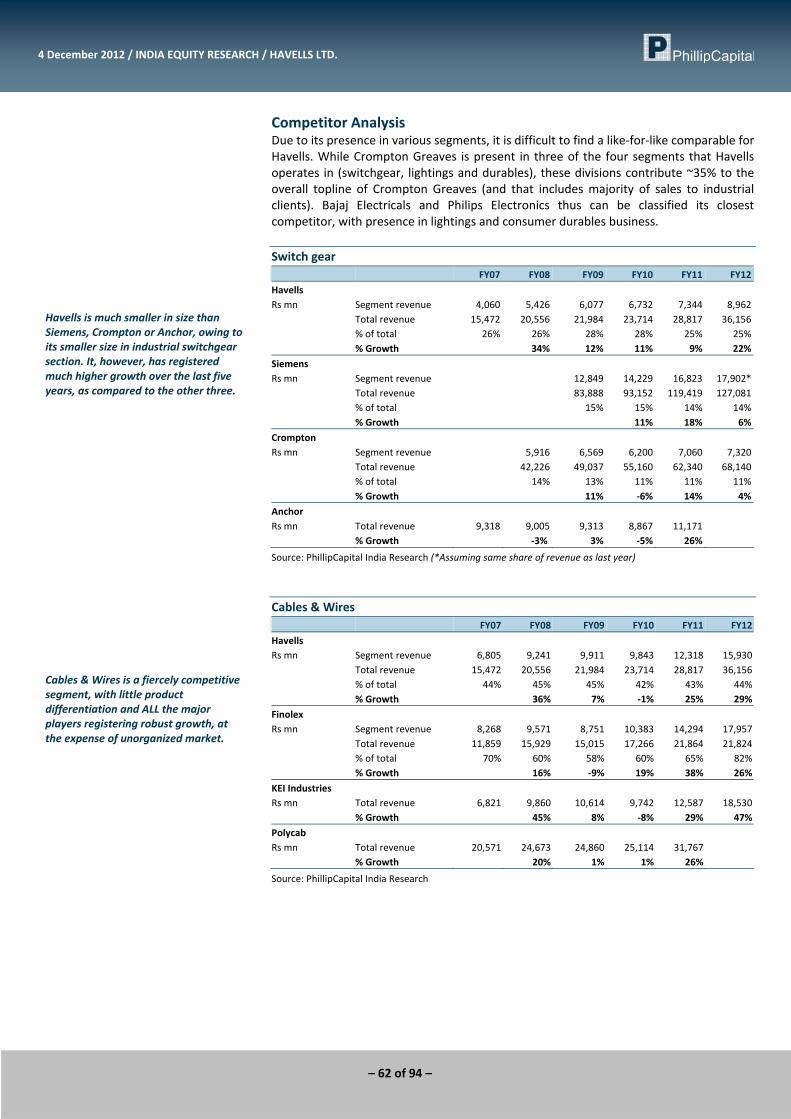
– 62 of 94 –
4 December 2012 / INDIA EQUITY RESEARCH / HAVELLS LTD.
Competitor Analysis Due to its presence in various segments, it is difficult to find a like‐for‐like comparable for Havells. While Crompton Greaves is present in three of the four segments that Havells operates in (switchgear, lightings and durables), these divisions contribute ~35% to the overall topline of Crompton Greaves (and that includes majority of sales to industrial clients). Bajaj Electricals and Philips Electronics thus can be classified its closest competitor, with presence in lightings and consumer durables business. Switch gear FY07 FY08 FY09 FY10 FY11 FY12
Havells Rs mn Segment revenue 4,060 5,426 6,077 6,732 7,344 8,962 Total revenue 15,472 20,556 21,984 23,714 28,817 36,156 % of total 26% 26% 28% 28% 25% 25% % Growth 34% 12% 11% 9% 22%
Siemens Rs mn Segment revenue 12,849 14,229 16,823 17,902* Total revenue 83,888 93,152 119,419 127,081 % of total 15% 15% 14% 14% % Growth 11% 18% 6%
Crompton Rs mn Segment revenue 5,916 6,569 6,200 7,060 7,320 Total revenue 42,226 49,037 55,160 62,340 68,140 % of total 14% 13% 11% 11% 11% % Growth 11% ‐6% 14% 4%
Anchor Rs mn Total revenue 9,318 9,005 9,313 8,867 11,171 % Growth ‐3% 3% ‐5% 26%
Source: PhillipCapital India Research (*Assuming same share of revenue as last year)
Cables & Wires FY07 FY08 FY09 FY10 FY11 FY12
Havells Rs mn Segment revenue 6,805 9,241 9,911 9,843 12,318 15,930 Total revenue 15,472 20,556 21,984 23,714 28,817 36,156 % of total 44% 45% 45% 42% 43% 44% % Growth 36% 7% ‐1% 25% 29%
Finolex Rs mn Segment revenue 8,268 9,571 8,751 10,383 14,294 17,957 Total revenue 11,859 15,929 15,015 17,266 21,864 21,824 % of total 70% 60% 58% 60% 65% 82% % Growth 16% ‐9% 19% 38% 26%
KEI Industries Rs mn Total revenue 6,821 9,860 10,614 9,742 12,587 18,530 % Growth 45% 8% ‐8% 29% 47%
Polycab Rs mn Total revenue 20,571 24,673 24,860 25,114 31,767 % Growth 20% 1% 1% 26%
Source: PhillipCapital India Research
Havells is much smaller in size than Siemens, Crompton or Anchor, owing to its smaller size in industrial switchgear section. It, however, has registered much higher growth over the last five years, as compared to the other three.
Cables & Wires is a fiercely competitive segment, with little product differentiation and ALL the major players registering robust growth, at the expense of unorganized market.
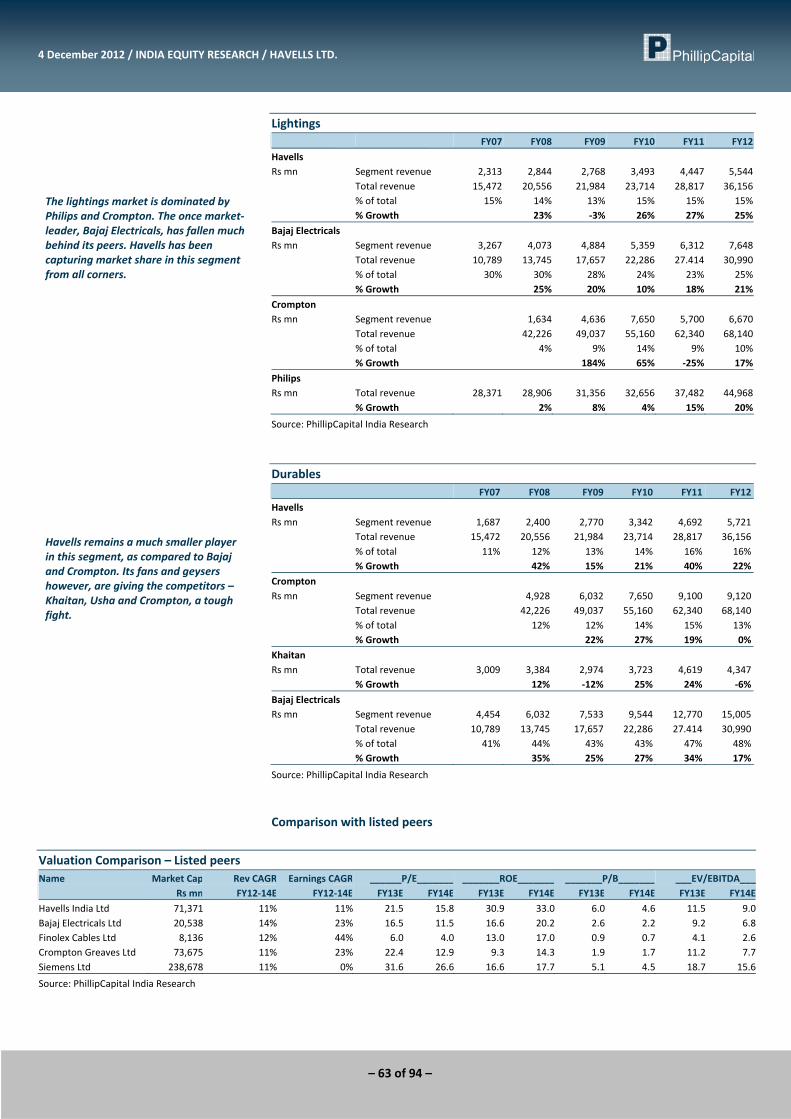
– 63 of 94 –
4 December 2012 / INDIA EQUITY RESEARCH / HAVELLS LTD.
Lightings FY07 FY08 FY09 FY10 FY11 FY12
Havells Rs mn Segment revenue 2,313 2,844 2,768 3,493 4,447 5,544 Total revenue 15,472 20,556 21,984 23,714 28,817 36,156 % of total 15% 14% 13% 15% 15% 15% % Growth 23% ‐3% 26% 27% 25%
Bajaj Electricals Rs mn Segment revenue 3,267 4,073 4,884 5,359 6,312 7,648 Total revenue 10,789 13,745 17,657 22,286 27.414 30,990 % of total 30% 30% 28% 24% 23% 25% % Growth 25% 20% 10% 18% 21%
Crompton Rs mn Segment revenue 1,634 4,636 7,650 5,700 6,670 Total revenue 42,226 49,037 55,160 62,340 68,140 % of total 4% 9% 14% 9% 10% % Growth 184% 65% ‐25% 17%
Philips Rs mn Total revenue 28,371 28,906 31,356 32,656 37,482 44,968 % Growth 2% 8% 4% 15% 20%
Source: PhillipCapital India Research
Durables FY07 FY08 FY09 FY10 FY11 FY12
Havells Rs mn Segment revenue 1,687 2,400 2,770 3,342 4,692 5,721 Total revenue 15,472 20,556 21,984 23,714 28,817 36,156 % of total 11% 12% 13% 14% 16% 16% % Growth 42% 15% 21% 40% 22%
Crompton Rs mn Segment revenue 4,928 6,032 7,650 9,100 9,120 Total revenue 42,226 49,037 55,160 62,340 68,140 % of total 12% 12% 14% 15% 13% % Growth 22% 27% 19% 0%
Khaitan Rs mn Total revenue 3,009 3,384 2,974 3,723 4,619 4,347 % Growth 12% ‐12% 25% 24% ‐6%
Bajaj Electricals Rs mn Segment revenue 4,454 6,032 7,533 9,544 12,770 15,005 Total revenue 10,789 13,745 17,657 22,286 27.414 30,990 % of total 41% 44% 43% 43% 47% 48% % Growth 35% 25% 27% 34% 17%
Source: PhillipCapital India Research
Comparison with listed peers
Valuation Comparison – Listed peers Name Market Cap Rev CAGR Earnings CAGR ______P/E_______ _______ROE_______ _______P/B_______ ___EV/EBITDA___ Rs mn FY12‐14E FY12‐14E FY13E FY14E FY13E FY14E FY13E FY14E FY13E FY14E
Havells India Ltd 71,371 11% 11% 21.5 15.8 30.9 33.0 6.0 4.6 11.5 9.0Bajaj Electricals Ltd 20,538 14% 23% 16.5 11.5 16.6 20.2 2.6 2.2 9.2 6.8Finolex Cables Ltd 8,136 12% 44% 6.0 4.0 13.0 17.0 0.9 0.7 4.1 2.6Crompton Greaves Ltd 73,675 11% 23% 22.4 12.9 9.3 14.3 1.9 1.7 11.2 7.7Siemens Ltd 238,678 11% 0% 31.6 26.6 16.6 17.7 5.1 4.5 18.7 15.6
Source: PhillipCapital India Research
The lightings market is dominated by Philips and Crompton. The once market‐leader, Bajaj Electricals, has fallen much behind its peers. Havells has been capturing market share in this segment from all corners.
Havells remains a much smaller player in this segment, as compared to Bajaj and Crompton. Its fans and geysers however, are giving the competitors – Khaitan, Usha and Crompton, a tough fight.
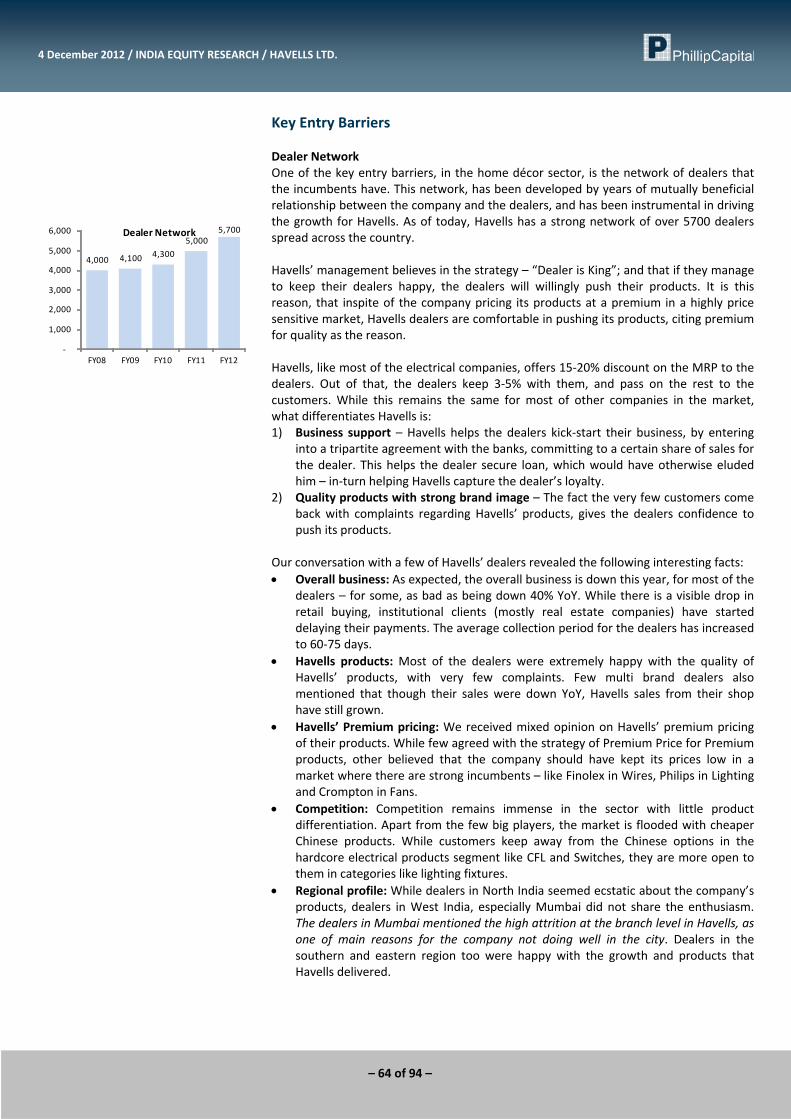
– 64 of 94 –
4 December 2012 / INDIA EQUITY RESEARCH / HAVELLS LTD.
Key Entry Barriers Dealer Network One of the key entry barriers, in the home décor sector, is the network of dealers that the incumbents have. This network, has been developed by years of mutually beneficial relationship between the company and the dealers, and has been instrumental in driving the growth for Havells. As of today, Havells has a strong network of over 5700 dealers spread across the country. Havells’ management believes in the strategy – “Dealer is King”; and that if they manage to keep their dealers happy, the dealers will willingly push their products. It is this reason, that inspite of the company pricing its products at a premium in a highly price sensitive market, Havells dealers are comfortable in pushing its products, citing premium for quality as the reason. Havells, like most of the electrical companies, offers 15‐20% discount on the MRP to the dealers. Out of that, the dealers keep 3‐5% with them, and pass on the rest to the customers. While this remains the same for most of other companies in the market, what differentiates Havells is: 1) Business support – Havells helps the dealers kick‐start their business, by entering
into a tripartite agreement with the banks, committing to a certain share of sales for the dealer. This helps the dealer secure loan, which would have otherwise eluded him – in‐turn helping Havells capture the dealer’s loyalty.
2) Quality products with strong brand image – The fact the very few customers come back with complaints regarding Havells’ products, gives the dealers confidence to push its products.
Our conversation with a few of Havells’ dealers revealed the following interesting facts: • Overall business: As expected, the overall business is down this year, for most of the
dealers – for some, as bad as being down 40% YoY. While there is a visible drop in retail buying, institutional clients (mostly real estate companies) have started delaying their payments. The average collection period for the dealers has increased to 60‐75 days.
• Havells products: Most of the dealers were extremely happy with the quality of Havells’ products, with very few complaints. Few multi brand dealers also mentioned that though their sales were down YoY, Havells sales from their shop have still grown.
• Havells’ Premium pricing: We received mixed opinion on Havells’ premium pricing of their products. While few agreed with the strategy of Premium Price for Premium products, other believed that the company should have kept its prices low in a market where there are strong incumbents – like Finolex in Wires, Philips in Lighting and Crompton in Fans.
• Competition: Competition remains immense in the sector with little product differentiation. Apart from the few big players, the market is flooded with cheaper Chinese products. While customers keep away from the Chinese options in the hardcore electrical products segment like CFL and Switches, they are more open to them in categories like lighting fixtures.
• Regional profile: While dealers in North India seemed ecstatic about the company’s products, dealers in West India, especially Mumbai did not share the enthusiasm. The dealers in Mumbai mentioned the high attrition at the branch level in Havells, as one of main reasons for the company not doing well in the city. Dealers in the southern and eastern region too were happy with the growth and products that Havells delivered.
4,000 4,100 4,300
5,000 5,700
‐
1,000
2,000
3,000
4,000
5,000
6,000
FY08 FY09 FY10 FY11 FY12
Dealer Network

– 65 of 94 –
4 December 2012 / INDIA EQUITY RESEARCH / HAVELLS LTD.
Superior brand perception In a market where there is little product or price differentiation, what motivates a buyer to buy Havells’ products, is the brand image, and the perception associated with it, that it is a quality product which won’t break‐down after few months. While a large part of the brand building is credited to their dealer network, the company’s sustained focus on advertizing has also gone a long way in strengthening its position. The company has, year after year, spent ~3% of sales on advertizing expenses. Some of the most memorable advertisements have helped the company capture consumers’ share of mind, and has also translated into share of wallet. Increasing Ad Spend
0.00%
0.50%
1.00%
1.50%
2.00%
2.50%
3.00%
3.50%
4.00%
0
200
400
600
800
1000
1200
FY07 FY08 FY09 FY10 FY11 FY12
Growing advertizement expenses
Advertisement expenses (Rs mn)
% of Sales
Source: Company, PhillipCapital India Research
Havells MCB – Shock Laga Havells MCB Havells Wires – Wires that don’t catch fire
Havells Fans – Rajesh Khanna Havells Fans Havells Fans – Bijli ko Bachao
Source: PhillipCapital India Research
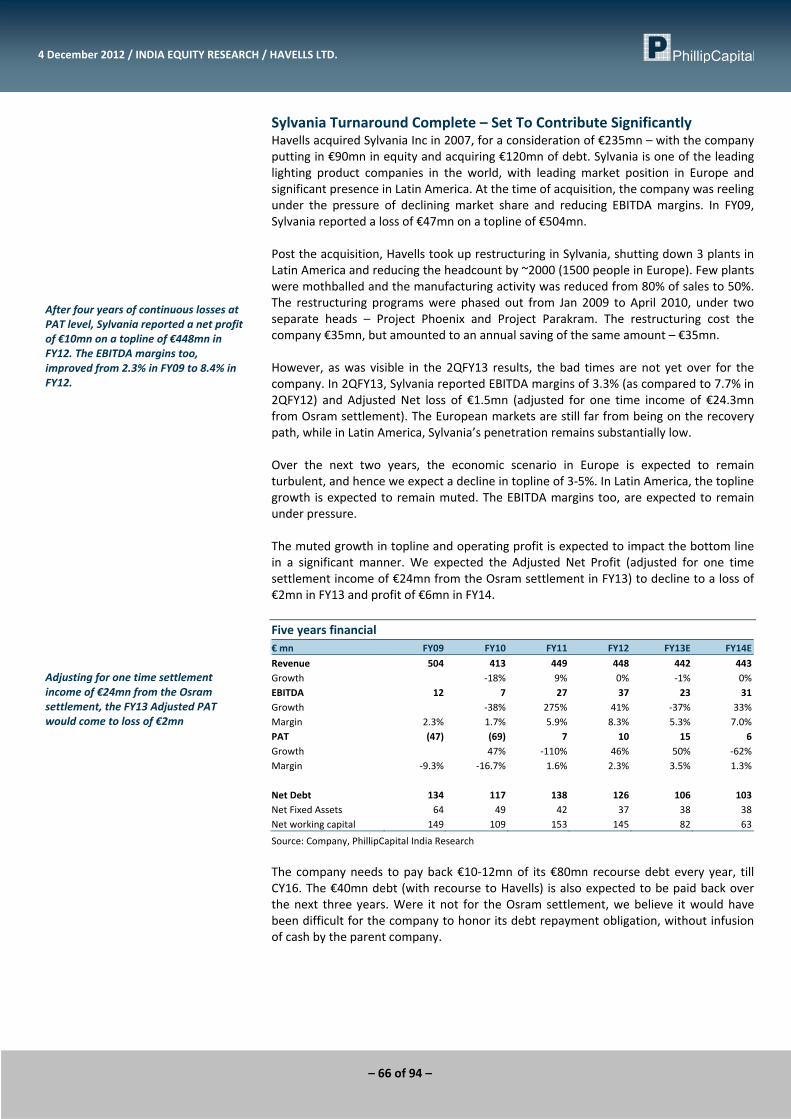
– 66 of 94 –
4 December 2012 / INDIA EQUITY RESEARCH / HAVELLS LTD.
Sylvania Turnaround Complete – Set To Contribute Significantly Havells acquired Sylvania Inc in 2007, for a consideration of €235mn – with the company putting in €90mn in equity and acquiring €120mn of debt. Sylvania is one of the leading lighting product companies in the world, with leading market position in Europe and significant presence in Latin America. At the time of acquisition, the company was reeling under the pressure of declining market share and reducing EBITDA margins. In FY09, Sylvania reported a loss of €47mn on a topline of €504mn. Post the acquisition, Havells took up restructuring in Sylvania, shutting down 3 plants in Latin America and reducing the headcount by ~2000 (1500 people in Europe). Few plants were mothballed and the manufacturing activity was reduced from 80% of sales to 50%. The restructuring programs were phased out from Jan 2009 to April 2010, under two separate heads – Project Phoenix and Project Parakram. The restructuring cost the company €35mn, but amounted to an annual saving of the same amount – €35mn. However, as was visible in the 2QFY13 results, the bad times are not yet over for the company. In 2QFY13, Sylvania reported EBITDA margins of 3.3% (as compared to 7.7% in 2QFY12) and Adjusted Net loss of €1.5mn (adjusted for one time income of €24.3mn from Osram settlement). The European markets are still far from being on the recovery path, while in Latin America, Sylvania’s penetration remains substantially low. Over the next two years, the economic scenario in Europe is expected to remain turbulent, and hence we expect a decline in topline of 3‐5%. In Latin America, the topline growth is expected to remain muted. The EBITDA margins too, are expected to remain under pressure. The muted growth in topline and operating profit is expected to impact the bottom line in a significant manner. We expected the Adjusted Net Profit (adjusted for one time settlement income of €24mn from the Osram settlement in FY13) to decline to a loss of €2mn in FY13 and profit of €6mn in FY14. Five years financial € mn FY09 FY10 FY11 FY12 FY13E FY14E
Revenue 504 413 449 448 442 443 Growth ‐18% 9% 0% ‐1% 0%EBITDA 12 7 27 37 23 31 Growth ‐38% 275% 41% ‐37% 33%Margin 2.3% 1.7% 5.9% 8.3% 5.3% 7.0%PAT (47) (69) 7 10 15 6 Growth 47% ‐110% 46% 50% ‐62%Margin ‐9.3% ‐16.7% 1.6% 2.3% 3.5% 1.3% Net Debt 134 117 138 126 106 103 Net Fixed Assets 64 49 42 37 38 38 Net working capital 149 109 153 145 82 63
Source: Company, PhillipCapital India Research
The company needs to pay back €10‐12mn of its €80mn recourse debt every year, till CY16. The €40mn debt (with recourse to Havells) is also expected to be paid back over the next three years. Were it not for the Osram settlement, we believe it would have been difficult for the company to honor its debt repayment obligation, without infusion of cash by the parent company.
After four years of continuous losses at PAT level, Sylvania reported a net profit of €10mn on a topline of €448mn in FY12. The EBITDA margins too, improved from 2.3% in FY09 to 8.4% in FY12.
Adjusting for one time settlement income of €24mn from the Osram settlement, the FY13 Adjusted PAT would come to loss of €2mn

– 67 of 94 –
4 December 2012 / INDIA EQUITY RESEARCH / HAVELLS LTD.
We note that while the overall financial situation of Sylvania is far from being bright, it is excellently placed in terms of its product portfolio, which comprises of full spectrum of professional and architectural lighting solutions. Market position in various segments in Europe and Lat Am Sylvania Lamps Fixtures
Global More of an organized market ‐ 80% market share of major players
Extremely fragmented market ‐ 75% market share of local small players
Europe Major players ‐ Philips, Osram, Sylvania market share: 4‐5%
Major players ‐ Zumbotel, Philips. Sylvania market share: 6‐7%
Latin America Major player ‐ GE. Sylvania market share: 7‐17%
Sylvania has negligible presence here
Source: Company, PhillipCapital India Research
Sylvania product portfolio
Source: Company
We expect the Sylvania turnaround story to take a little more time to realize, than what the management believes it will. We hence value Sylvania business at 6x FY14 EV/EBITDA (implicit P/E of 14x), to reflect the uncertainty in earnings amid turbulent times in Europe. That gives us a valuation of €82mn (Rs5.3bn) for the business, representing Rs43 per share. Share of revenue and earnings – FY12 and FY14
57%65%
82%92%
43%35%
18%8%
0%
20%
40%
60%
80%
100%
FY12 FY14E FY12 FY14E
Topline Earnings
Sylvania ContributionHavells Sylvania
Source: Company, PhillipCapital India Research
Sylvania is one of the top four players in the European market, in both lamps and fixtures segment. In Latin America however, it is present only in the lamps division.
Over the next two years, we expect Sylvania’s contribution to the consolidated earnings to decline from 18% in FY12 to 8% in FY14, primarily on the back of muted topline growth and declining earnings
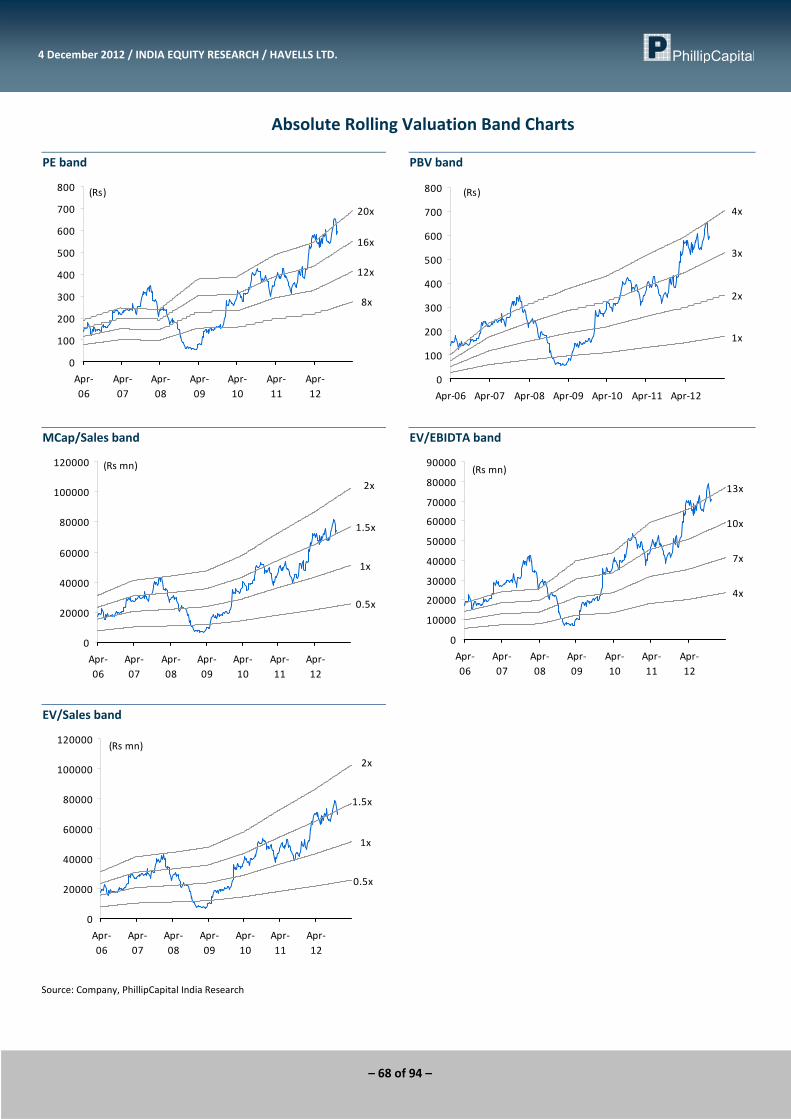
– 68 of 94 –
4 December 2012 / INDIA EQUITY RESEARCH / HAVELLS LTD.
Absolute Rolling Valuation Band Charts
PE band
8x
12x
16x
20x
0
100
200
300
400
500
600
700
800
Apr‐06
Apr‐07
Apr‐08
Apr‐09
Apr‐10
Apr‐11
Apr‐12
(Rs)
PBV band
1x
2x
3x
4x
0
100
200
300
400
500
600
700
800
Apr‐06 Apr‐07 Apr‐08 Apr‐09 Apr‐10 Apr‐11 Apr‐12
(Rs)
MCap/Sales band
0.5x
1x
1.5x
2x
0
20000
40000
60000
80000
100000
120000
Apr‐06
Apr‐07
Apr‐08
Apr‐09
Apr‐10
Apr‐11
Apr‐12
(Rs mn)
EV/EBIDTA band
4x
7x
10x
13x
0
10000
20000
30000
40000
50000
60000
70000
80000
90000
Apr‐06
Apr‐07
Apr‐08
Apr‐09
Apr‐10
Apr‐11
Apr‐12
(Rs mn)
EV/Sales band
0.5x
1x
1.5x
2x
0
20000
40000
60000
80000
100000
120000
Apr‐06
Apr‐07
Apr‐08
Apr‐09
Apr‐10
Apr‐11
Apr‐12
(Rs mn)
Source: Company, PhillipCapital India Research
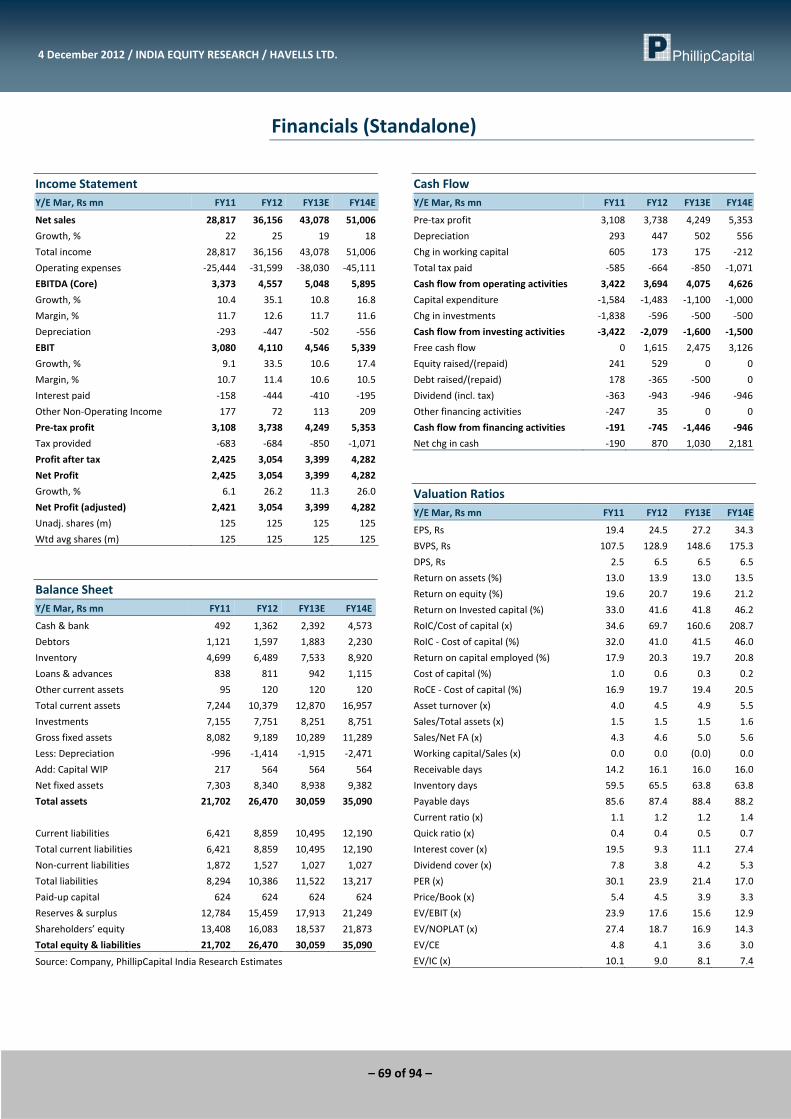
– 69 of 94 –
4 December 2012 / INDIA EQUITY RESEARCH / HAVELLS LTD.
Financials (Standalone)
Income Statement Y/E Mar, Rs mn FY11 FY12 FY13E FY14E
Net sales 28,817 36,156 43,078 51,006
Growth, % 22 25 19 18
Total income 28,817 36,156 43,078 51,006
Operating expenses ‐25,444 ‐31,599 ‐38,030 ‐45,111
EBITDA (Core) 3,373 4,557 5,048 5,895
Growth, % 10.4 35.1 10.8 16.8
Margin, % 11.7 12.6 11.7 11.6
Depreciation ‐293 ‐447 ‐502 ‐556
EBIT 3,080 4,110 4,546 5,339
Growth, % 9.1 33.5 10.6 17.4
Margin, % 10.7 11.4 10.6 10.5
Interest paid ‐158 ‐444 ‐410 ‐195
Other Non‐Operating Income 177 72 113 209
Pre‐tax profit 3,108 3,738 4,249 5,353
Tax provided ‐683 ‐684 ‐850 ‐1,071
Profit after tax 2,425 3,054 3,399 4,282
Net Profit 2,425 3,054 3,399 4,282
Growth, % 6.1 26.2 11.3 26.0
Net Profit (adjusted) 2,421 3,054 3,399 4,282
Unadj. shares (m) 125 125 125 125
Wtd avg shares (m) 125 125 125 125
Balance Sheet Y/E Mar, Rs mn FY11 FY12 FY13E FY14E
Cash & bank 492 1,362 2,392 4,573
Debtors 1,121 1,597 1,883 2,230
Inventory 4,699 6,489 7,533 8,920
Loans & advances 838 811 942 1,115
Other current assets 95 120 120 120
Total current assets 7,244 10,379 12,870 16,957
Investments 7,155 7,751 8,251 8,751
Gross fixed assets 8,082 9,189 10,289 11,289
Less: Depreciation ‐996 ‐1,414 ‐1,915 ‐2,471
Add: Capital WIP 217 564 564 564
Net fixed assets 7,303 8,340 8,938 9,382
Total assets 21,702 26,470 30,059 35,090
Current liabilities 6,421 8,859 10,495 12,190
Total current liabilities 6,421 8,859 10,495 12,190
Non‐current liabilities 1,872 1,527 1,027 1,027
Total liabilities 8,294 10,386 11,522 13,217
Paid‐up capital 624 624 624 624
Reserves & surplus 12,784 15,459 17,913 21,249
Shareholders’ equity 13,408 16,083 18,537 21,873
Total equity & liabilities 21,702 26,470 30,059 35,090
Source: Company, PhillipCapital India Research Estimates
Cash Flow Y/E Mar, Rs mn FY11 FY12 FY13E FY14E
Pre‐tax profit 3,108 3,738 4,249 5,353
Depreciation 293 447 502 556
Chg in working capital 605 173 175 ‐212
Total tax paid ‐585 ‐664 ‐850 ‐1,071
Cash flow from operating activities 3,422 3,694 4,075 4,626
Capital expenditure ‐1,584 ‐1,483 ‐1,100 ‐1,000
Chg in investments ‐1,838 ‐596 ‐500 ‐500
Cash flow from investing activities ‐3,422 ‐2,079 ‐1,600 ‐1,500
Free cash flow 0 1,615 2,475 3,126
Equity raised/(repaid) 241 529 0 0
Debt raised/(repaid) 178 ‐365 ‐500 0
Dividend (incl. tax) ‐363 ‐943 ‐946 ‐946
Other financing activities ‐247 35 0 0
Cash flow from financing activities ‐191 ‐745 ‐1,446 ‐946
Net chg in cash ‐190 870 1,030 2,181
Valuation Ratios Y/E Mar, Rs mn FY11 FY12 FY13E FY14E
EPS, Rs 19.4 24.5 27.2 34.3
BVPS, Rs 107.5 128.9 148.6 175.3
DPS, Rs 2.5 6.5 6.5 6.5
Return on assets (%) 13.0 13.9 13.0 13.5
Return on equity (%) 19.6 20.7 19.6 21.2
Return on Invested capital (%) 33.0 41.6 41.8 46.2
RoIC/Cost of capital (x) 34.6 69.7 160.6 208.7
RoIC ‐ Cost of capital (%) 32.0 41.0 41.5 46.0
Return on capital employed (%) 17.9 20.3 19.7 20.8
Cost of capital (%) 1.0 0.6 0.3 0.2
RoCE ‐ Cost of capital (%) 16.9 19.7 19.4 20.5
Asset turnover (x) 4.0 4.5 4.9 5.5
Sales/Total assets (x) 1.5 1.5 1.5 1.6
Sales/Net FA (x) 4.3 4.6 5.0 5.6
Working capital/Sales (x) 0.0 0.0 (0.0) 0.0
Receivable days 14.2 16.1 16.0 16.0
Inventory days 59.5 65.5 63.8 63.8
Payable days 85.6 87.4 88.4 88.2
Current ratio (x) 1.1 1.2 1.2 1.4
Quick ratio (x) 0.4 0.4 0.5 0.7
Interest cover (x) 19.5 9.3 11.1 27.4
Dividend cover (x) 7.8 3.8 4.2 5.3
PER (x) 30.1 23.9 21.4 17.0
Price/Book (x) 5.4 4.5 3.9 3.3
EV/EBIT (x) 23.9 17.6 15.6 12.9
EV/NOPLAT (x) 27.4 18.7 16.9 14.3
EV/CE 4.8 4.1 3.6 3.0
EV/IC (x) 10.1 9.0 8.1 7.4
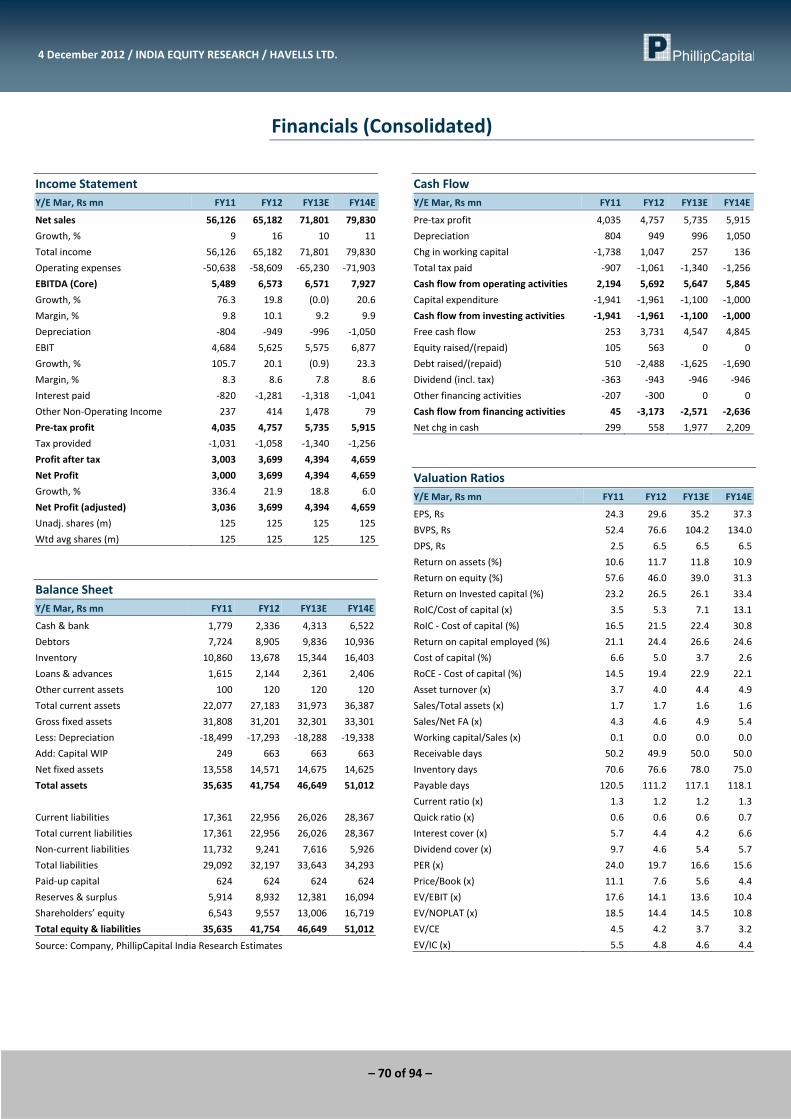
– 70 of 94 –
4 December 2012 / INDIA EQUITY RESEARCH / HAVELLS LTD.
Financials (Consolidated)
Income Statement Y/E Mar, Rs mn FY11 FY12 FY13E FY14E
Net sales 56,126 65,182 71,801 79,830
Growth, % 9 16 10 11
Total income 56,126 65,182 71,801 79,830
Operating expenses ‐50,638 ‐58,609 ‐65,230 ‐71,903
EBITDA (Core) 5,489 6,573 6,571 7,927
Growth, % 76.3 19.8 (0.0) 20.6
Margin, % 9.8 10.1 9.2 9.9
Depreciation ‐804 ‐949 ‐996 ‐1,050
EBIT 4,684 5,625 5,575 6,877
Growth, % 105.7 20.1 (0.9) 23.3
Margin, % 8.3 8.6 7.8 8.6
Interest paid ‐820 ‐1,281 ‐1,318 ‐1,041
Other Non‐Operating Income 237 414 1,478 79
Pre‐tax profit 4,035 4,757 5,735 5,915
Tax provided ‐1,031 ‐1,058 ‐1,340 ‐1,256
Profit after tax 3,003 3,699 4,394 4,659
Net Profit 3,000 3,699 4,394 4,659
Growth, % 336.4 21.9 18.8 6.0
Net Profit (adjusted) 3,036 3,699 4,394 4,659
Unadj. shares (m) 125 125 125 125
Wtd avg shares (m) 125 125 125 125
Balance Sheet Y/E Mar, Rs mn FY11 FY12 FY13E FY14E
Cash & bank 1,779 2,336 4,313 6,522
Debtors 7,724 8,905 9,836 10,936
Inventory 10,860 13,678 15,344 16,403
Loans & advances 1,615 2,144 2,361 2,406
Other current assets 100 120 120 120
Total current assets 22,077 27,183 31,973 36,387
Gross fixed assets 31,808 31,201 32,301 33,301
Less: Depreciation ‐18,499 ‐17,293 ‐18,288 ‐19,338
Add: Capital WIP 249 663 663 663
Net fixed assets 13,558 14,571 14,675 14,625
Total assets 35,635 41,754 46,649 51,012
Current liabilities 17,361 22,956 26,026 28,367
Total current liabilities 17,361 22,956 26,026 28,367
Non‐current liabilities 11,732 9,241 7,616 5,926
Total liabilities 29,092 32,197 33,643 34,293
Paid‐up capital 624 624 624 624
Reserves & surplus 5,914 8,932 12,381 16,094
Shareholders’ equity 6,543 9,557 13,006 16,719
Total equity & liabilities 35,635 41,754 46,649 51,012
Source: Company, PhillipCapital India Research Estimates
Cash Flow Y/E Mar, Rs mn FY11 FY12 FY13E FY14E
Pre‐tax profit 4,035 4,757 5,735 5,915
Depreciation 804 949 996 1,050
Chg in working capital ‐1,738 1,047 257 136
Total tax paid ‐907 ‐1,061 ‐1,340 ‐1,256
Cash flow from operating activities 2,194 5,692 5,647 5,845
Capital expenditure ‐1,941 ‐1,961 ‐1,100 ‐1,000
Cash flow from investing activities ‐1,941 ‐1,961 ‐1,100 ‐1,000
Free cash flow 253 3,731 4,547 4,845
Equity raised/(repaid) 105 563 0 0
Debt raised/(repaid) 510 ‐2,488 ‐1,625 ‐1,690
Dividend (incl. tax) ‐363 ‐943 ‐946 ‐946
Other financing activities ‐207 ‐300 0 0
Cash flow from financing activities 45 ‐3,173 ‐2,571 ‐2,636
Net chg in cash 299 558 1,977 2,209
Valuation Ratios Y/E Mar, Rs mn FY11 FY12 FY13E FY14E
EPS, Rs 24.3 29.6 35.2 37.3
BVPS, Rs 52.4 76.6 104.2 134.0
DPS, Rs 2.5 6.5 6.5 6.5
Return on assets (%) 10.6 11.7 11.8 10.9
Return on equity (%) 57.6 46.0 39.0 31.3
Return on Invested capital (%) 23.2 26.5 26.1 33.4
RoIC/Cost of capital (x) 3.5 5.3 7.1 13.1
RoIC ‐ Cost of capital (%) 16.5 21.5 22.4 30.8
Return on capital employed (%) 21.1 24.4 26.6 24.6
Cost of capital (%) 6.6 5.0 3.7 2.6
RoCE ‐ Cost of capital (%) 14.5 19.4 22.9 22.1
Asset turnover (x) 3.7 4.0 4.4 4.9
Sales/Total assets (x) 1.7 1.7 1.6 1.6
Sales/Net FA (x) 4.3 4.6 4.9 5.4
Working capital/Sales (x) 0.1 0.0 0.0 0.0
Receivable days 50.2 49.9 50.0 50.0
Inventory days 70.6 76.6 78.0 75.0
Payable days 120.5 111.2 117.1 118.1
Current ratio (x) 1.3 1.2 1.2 1.3
Quick ratio (x) 0.6 0.6 0.6 0.7
Interest cover (x) 5.7 4.4 4.2 6.6
Dividend cover (x) 9.7 4.6 5.4 5.7
PER (x) 24.0 19.7 16.6 15.6
Price/Book (x) 11.1 7.6 5.6 4.4
EV/EBIT (x) 17.6 14.1 13.6 10.4
EV/NOPLAT (x) 18.5 14.4 14.5 10.8
EV/CE 4.5 4.2 3.7 3.2
EV/IC (x) 5.5 4.8 4.6 4.4
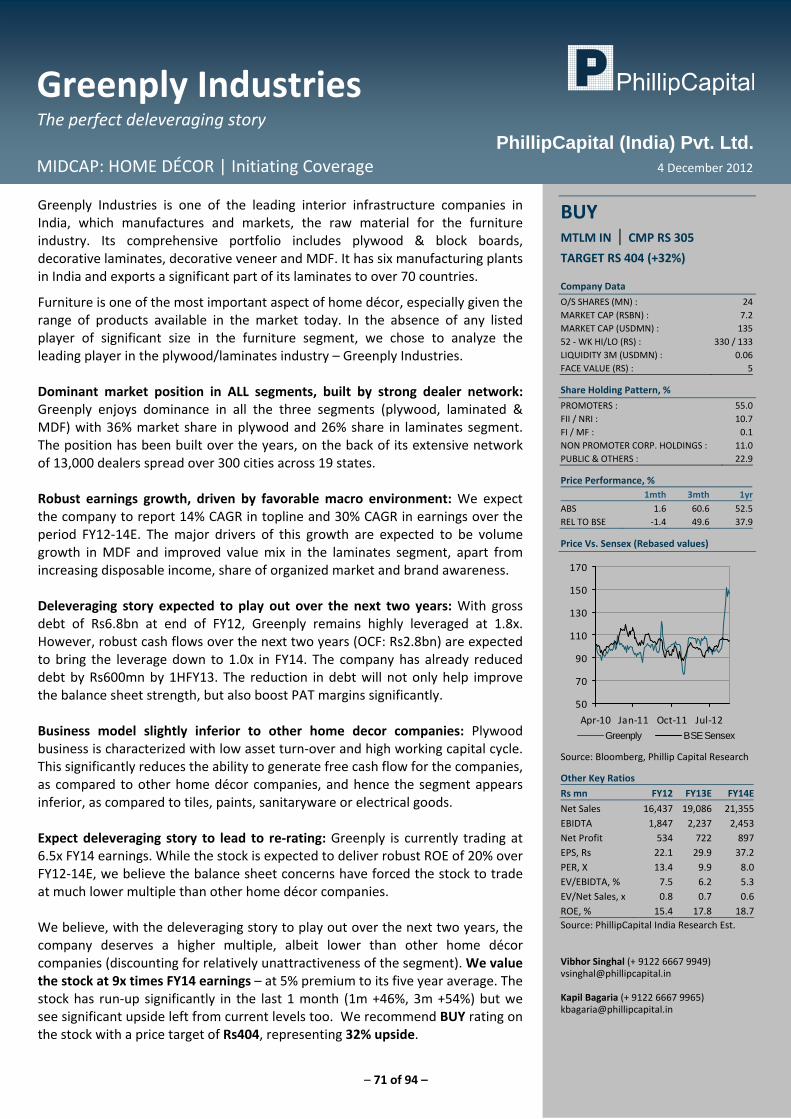
– 71 of 94 –
Greenply Industries The perfect deleveraging story
MIDCAP: HOME DÉCOR | Initiating Coverage 4 December 2012
PhillipCapital (India) Pvt. Ltd.
Greenply Industries is one of the leading interior infrastructure companies in India, which manufactures and markets, the raw material for the furniture industry. Its comprehensive portfolio includes plywood & block boards, decorative laminates, decorative veneer and MDF. It has six manufacturing plants in India and exports a significant part of its laminates to over 70 countries.
Furniture is one of the most important aspect of home décor, especially given the range of products available in the market today. In the absence of any listed player of significant size in the furniture segment, we chose to analyze the leading player in the plywood/laminates industry – Greenply Industries. Dominant market position in ALL segments, built by strong dealer network: Greenply enjoys dominance in all the three segments (plywood, laminated & MDF) with 36% market share in plywood and 26% share in laminates segment. The position has been built over the years, on the back of its extensive network of 13,000 dealers spread over 300 cities across 19 states. Robust earnings growth, driven by favorable macro environment: We expect the company to report 14% CAGR in topline and 30% CAGR in earnings over the period FY12‐14E. The major drivers of this growth are expected to be volume growth in MDF and improved value mix in the laminates segment, apart from increasing disposable income, share of organized market and brand awareness. Deleveraging story expected to play out over the next two years: With gross debt of Rs6.8bn at end of FY12, Greenply remains highly leveraged at 1.8x. However, robust cash flows over the next two years (OCF: Rs2.8bn) are expected to bring the leverage down to 1.0x in FY14. The company has already reduced debt by Rs600mn by 1HFY13. The reduction in debt will not only help improve the balance sheet strength, but also boost PAT margins significantly. Business model slightly inferior to other home decor companies: Plywood business is characterized with low asset turn‐over and high working capital cycle. This significantly reduces the ability to generate free cash flow for the companies, as compared to other home décor companies, and hence the segment appears inferior, as compared to tiles, paints, sanitaryware or electrical goods. Expect deleveraging story to lead to re‐rating: Greenply is currently trading at 6.5x FY14 earnings. While the stock is expected to deliver robust ROE of 20% over FY12‐14E, we believe the balance sheet concerns have forced the stock to trade at much lower multiple than other home décor companies. We believe, with the deleveraging story to play out over the next two years, the company deserves a higher multiple, albeit lower than other home décor companies (discounting for relatively unattractiveness of the segment). We value the stock at 9x times FY14 earnings – at 5% premium to its five year average. The stock has run‐up significantly in the last 1 month (1m +46%, 3m +54%) but we see significant upside left from current levels too. We recommend BUY rating on the stock with a price target of Rs404, representing 32% upside.
BUY MTLM IN | CMP RS 305
TARGET RS 404 (+32%) Company Data
O/S SHARES (MN) : 24MARKET CAP (RSBN) : 7.2MARKET CAP (USDMN) : 13552 ‐ WK HI/LO (RS) : 330 / 133LIQUIDITY 3M (USDMN) : 0.06FACE VALUE (RS) : 5
Share Holding Pattern, %
PROMOTERS : 55.0FII / NRI : 10.7FI / MF : 0.1NON PROMOTER CORP. HOLDINGS : 11.0PUBLIC & OTHERS : 22.9
Price Performance, % 1mth 3mth 1yr
ABS 1.6 60.6 52.5REL TO BSE ‐1.4 49.6 37.9
Price Vs. Sensex (Rebased values)
50
70
90
110
130
150
170
Apr‐10 Jan‐11 Oct‐11 Jul‐12Greenply BSE Sensex
Source: Bloomberg, Phillip Capital Research
Other Key Ratios
Rs mn FY12 FY13E FY14E
Net Sales 16,437 19,086 21,355EBIDTA 1,847 2,237 2,453Net Profit 534 722 897EPS, Rs 22.1 29.9 37.2PER, X 13.4 9.9 8.0EV/EBIDTA, % 7.5 6.2 5.3EV/Net Sales, x 0.8 0.7 0.6ROE, % 15.4 17.8 18.7Source: PhillipCapital India Research Est. Vibhor Singhal (+ 9122 6667 9949) [email protected] Kapil Bagaria (+ 9122 6667 9965) [email protected]
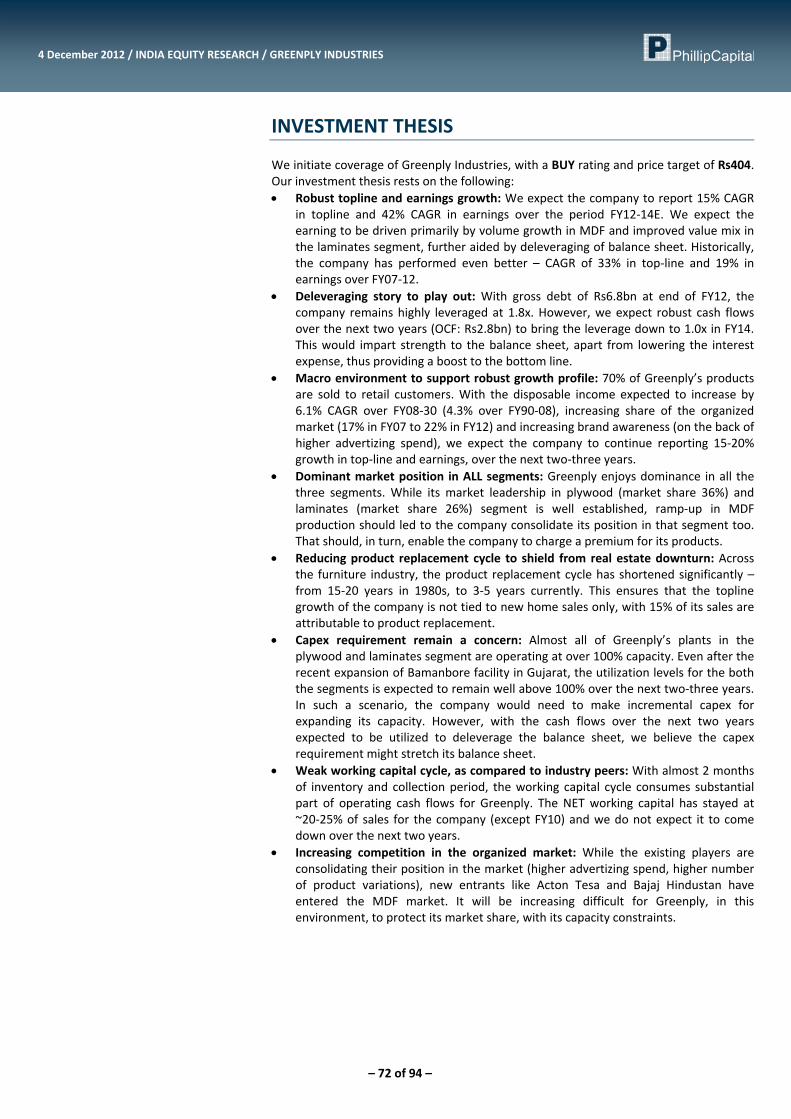
– 72 of 94 –
4 December 2012 / INDIA EQUITY RESEARCH / GREENPLY INDUSTRIES
INVESTMENT THESIS We initiate coverage of Greenply Industries, with a BUY rating and price target of Rs404. Our investment thesis rests on the following: • Robust topline and earnings growth: We expect the company to report 15% CAGR
in topline and 42% CAGR in earnings over the period FY12‐14E. We expect the earning to be driven primarily by volume growth in MDF and improved value mix in the laminates segment, further aided by deleveraging of balance sheet. Historically, the company has performed even better – CAGR of 33% in top‐line and 19% in earnings over FY07‐12.
• Deleveraging story to play out: With gross debt of Rs6.8bn at end of FY12, the company remains highly leveraged at 1.8x. However, we expect robust cash flows over the next two years (OCF: Rs2.8bn) to bring the leverage down to 1.0x in FY14. This would impart strength to the balance sheet, apart from lowering the interest expense, thus providing a boost to the bottom line.
• Macro environment to support robust growth profile: 70% of Greenply’s products are sold to retail customers. With the disposable income expected to increase by 6.1% CAGR over FY08‐30 (4.3% over FY90‐08), increasing share of the organized market (17% in FY07 to 22% in FY12) and increasing brand awareness (on the back of higher advertizing spend), we expect the company to continue reporting 15‐20% growth in top‐line and earnings, over the next two‐three years.
• Dominant market position in ALL segments: Greenply enjoys dominance in all the three segments. While its market leadership in plywood (market share 36%) and laminates (market share 26%) segment is well established, ramp‐up in MDF production should led to the company consolidate its position in that segment too. That should, in turn, enable the company to charge a premium for its products.
• Reducing product replacement cycle to shield from real estate downturn: Across the furniture industry, the product replacement cycle has shortened significantly – from 15‐20 years in 1980s, to 3‐5 years currently. This ensures that the topline growth of the company is not tied to new home sales only, with 15% of its sales are attributable to product replacement.
• Capex requirement remain a concern: Almost all of Greenply’s plants in the plywood and laminates segment are operating at over 100% capacity. Even after the recent expansion of Bamanbore facility in Gujarat, the utilization levels for the both the segments is expected to remain well above 100% over the next two‐three years. In such a scenario, the company would need to make incremental capex for expanding its capacity. However, with the cash flows over the next two years expected to be utilized to deleverage the balance sheet, we believe the capex requirement might stretch its balance sheet.
• Weak working capital cycle, as compared to industry peers: With almost 2 months of inventory and collection period, the working capital cycle consumes substantial part of operating cash flows for Greenply. The NET working capital has stayed at ~20‐25% of sales for the company (except FY10) and we do not expect it to come down over the next two years.
• Increasing competition in the organized market: While the existing players are consolidating their position in the market (higher advertizing spend, higher number of product variations), new entrants like Acton Tesa and Bajaj Hindustan have entered the MDF market. It will be increasing difficult for Greenply, in this environment, to protect its market share, with its capacity constraints.
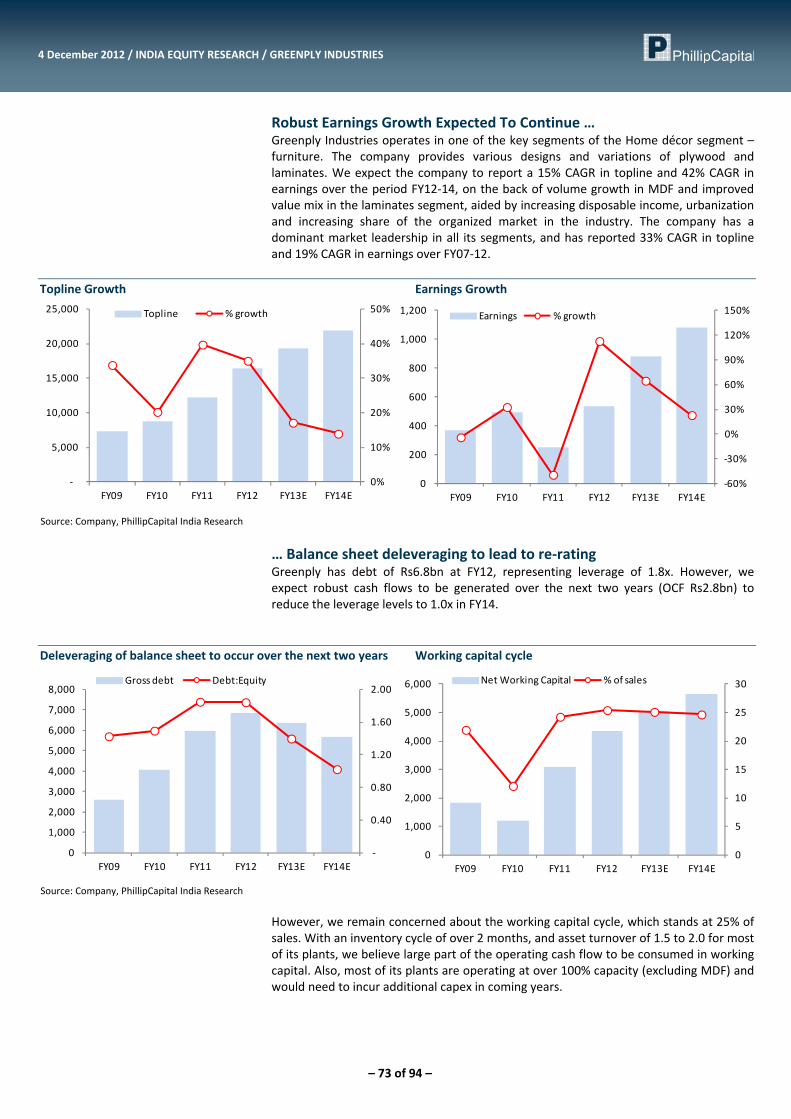
– 73 of 94 –
4 December 2012 / INDIA EQUITY RESEARCH / GREENPLY INDUSTRIES
Robust Earnings Growth Expected To Continue … Greenply Industries operates in one of the key segments of the Home décor segment – furniture. The company provides various designs and variations of plywood and laminates. We expect the company to report a 15% CAGR in topline and 42% CAGR in earnings over the period FY12‐14, on the back of volume growth in MDF and improved value mix in the laminates segment, aided by increasing disposable income, urbanization and increasing share of the organized market in the industry. The company has a dominant market leadership in all its segments, and has reported 33% CAGR in topline and 19% CAGR in earnings over FY07‐12.
Topline Growth Earnings Growth
0%
10%
20%
30%
40%
50%
‐
5,000
10,000
15,000
20,000
25,000
FY09 FY10 FY11 FY12 FY13E FY14E
Topline % growth
‐60%
‐30%
0%
30%
60%
90%
120%
150%
0
200
400
600
800
1,000
1,200
FY09 FY10 FY11 FY12 FY13E FY14E
Earnings % growth
Source: Company, PhillipCapital India Research
… Balance sheet deleveraging to lead to re‐rating Greenply has debt of Rs6.8bn at FY12, representing leverage of 1.8x. However, we expect robust cash flows to be generated over the next two years (OCF Rs2.8bn) to reduce the leverage levels to 1.0x in FY14.
Deleveraging of balance sheet to occur over the next two years Working capital cycle
‐
0.40
0.80
1.20
1.60
2.00
0
1,000
2,000
3,000
4,000
5,000
6,000
7,000
8,000
FY09 FY10 FY11 FY12 FY13E FY14E
Gross debt Debt:Equity
0
5
10
15
20
25
30
0
1,000
2,000
3,000
4,000
5,000
6,000
FY09 FY10 FY11 FY12 FY13E FY14E
Net Working Capital % of sales
Source: Company, PhillipCapital India Research
However, we remain concerned about the working capital cycle, which stands at 25% of sales. With an inventory cycle of over 2 months, and asset turnover of 1.5 to 2.0 for most of its plants, we believe large part of the operating cash flow to be consumed in working capital. Also, most of its plants are operating at over 100% capacity (excluding MDF) and would need to incur additional capex in coming years.
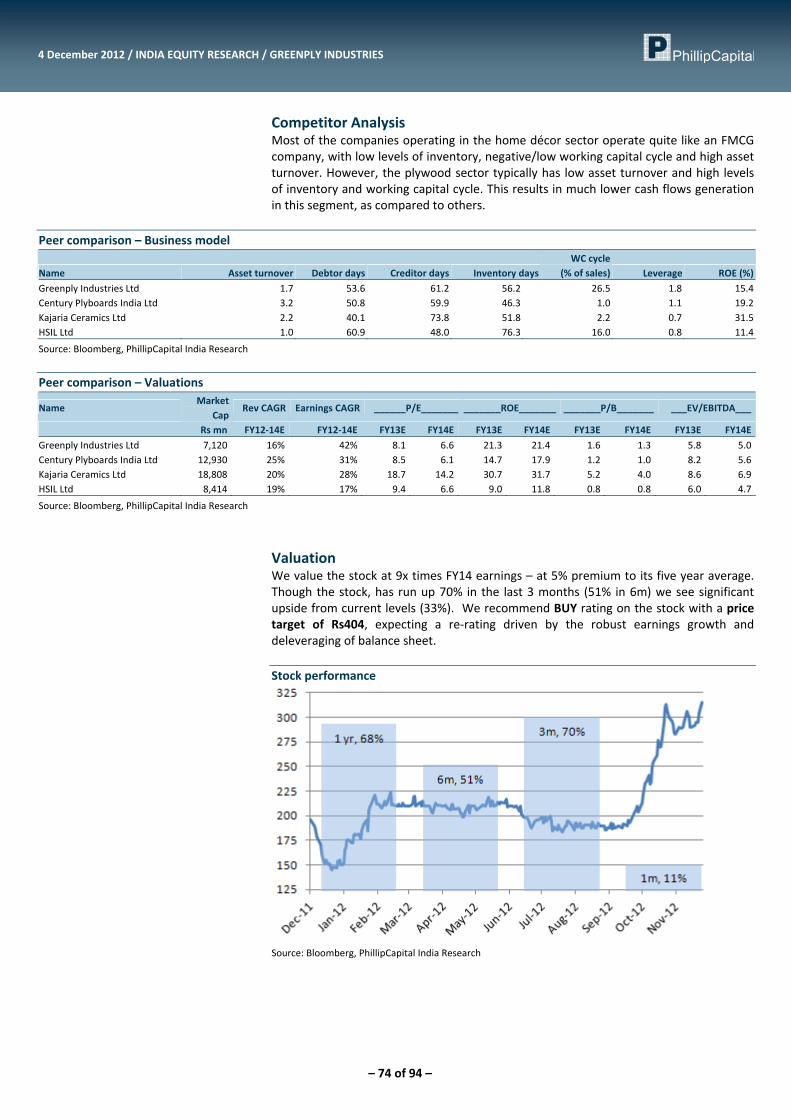
– 74 of 94 –
4 December 2012 / INDIA EQUITY RESEARCH / GREENPLY INDUSTRIES
Competitor Analysis Most of the companies operating in the home décor sector operate quite like an FMCG company, with low levels of inventory, negative/low working capital cycle and high asset turnover. However, the plywood sector typically has low asset turnover and high levels of inventory and working capital cycle. This results in much lower cash flows generation in this segment, as compared to others.
Peer comparison – Business model
Name Asset turnover Debtor days Creditor days Inventory days WC cycle
(% of sales) Leverage ROE (%)
Greenply Industries Ltd 1.7 53.6 61.2 56.2 26.5 1.8 15.4 Century Plyboards India Ltd 3.2 50.8 59.9 46.3 1.0 1.1 19.2 Kajaria Ceramics Ltd 2.2 40.1 73.8 51.8 2.2 0.7 31.5 HSIL Ltd 1.0 60.9 48.0 76.3 16.0 0.8 11.4
Source: Bloomberg, PhillipCapital India Research
Peer comparison – Valuations
Name Market
Cap Rev CAGR Earnings CAGR ______P/E_______ _______ROE_______ _______P/B_______ ___EV/EBITDA___
Rs mn FY12‐14E FY12‐14E FY13E FY14E FY13E FY14E FY13E FY14E FY13E FY14E
Greenply Industries Ltd 7,120 16% 42% 8.1 6.6 21.3 21.4 1.6 1.3 5.8 5.0Century Plyboards India Ltd 12,930 25% 31% 8.5 6.1 14.7 17.9 1.2 1.0 8.2 5.6Kajaria Ceramics Ltd 18,808 20% 28% 18.7 14.2 30.7 31.7 5.2 4.0 8.6 6.9HSIL Ltd 8,414 19% 17% 9.4 6.6 9.0 11.8 0.8 0.8 6.0 4.7
Source: Bloomberg, PhillipCapital India Research
Valuation We value the stock at 9x times FY14 earnings – at 5% premium to its five year average. Though the stock, has run up 70% in the last 3 months (51% in 6m) we see significant upside from current levels (33%). We recommend BUY rating on the stock with a price target of Rs404, expecting a re‐rating driven by the robust earnings growth and deleveraging of balance sheet. Stock performance
Source: Bloomberg, PhillipCapital India Research
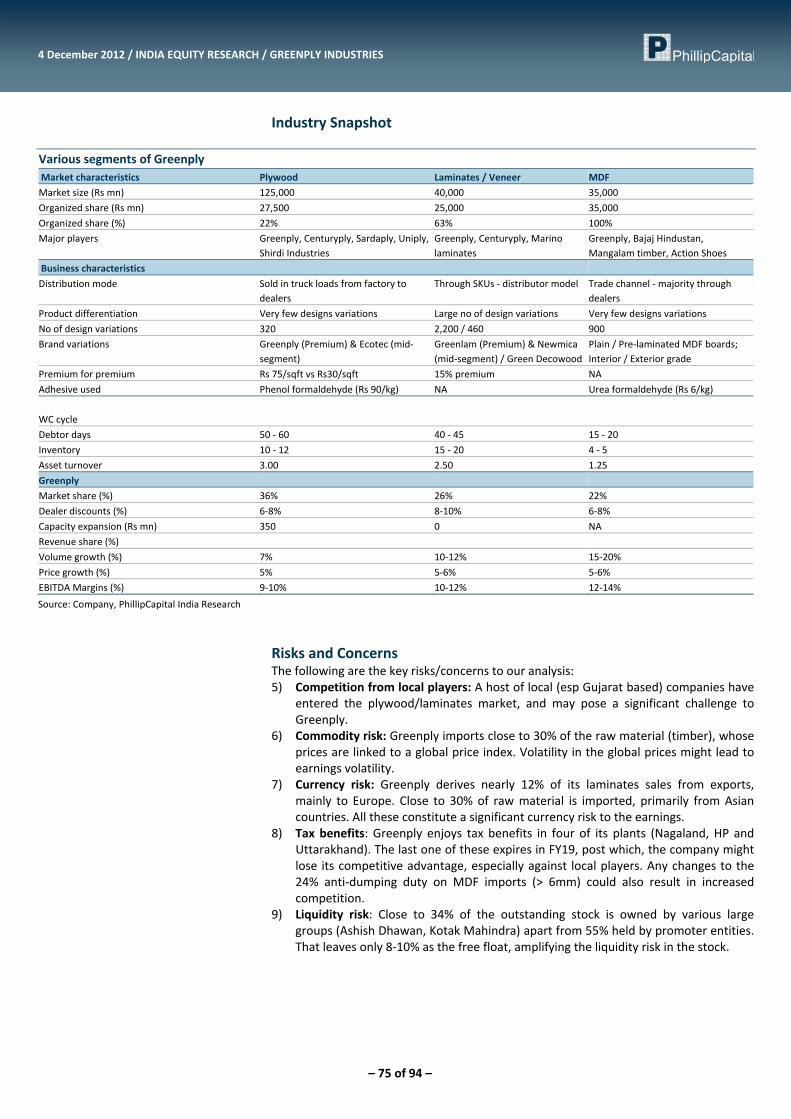
– 75 of 94 –
4 December 2012 / INDIA EQUITY RESEARCH / GREENPLY INDUSTRIES
Industry Snapshot
Various segments of Greenply Market characteristics Plywood Laminates / Veneer MDF
Market size (Rs mn) 125,000 40,000 35,000
Organized share (Rs mn) 27,500 25,000 35,000
Organized share (%) 22% 63% 100%
Major players Greenply, Centuryply, Sardaply, Uniply, Shirdi Industries
Greenply, Centuryply, Marino laminates
Greenply, Bajaj Hindustan, Mangalam timber, Action Shoes
Business characteristics
Distribution mode Sold in truck loads from factory to dealers
Through SKUs ‐ distributor model Trade channel ‐ majority through dealers
Product differentiation Very few designs variations Large no of design variations Very few designs variations
No of design variations 320 2,200 / 460 900
Brand variations Greenply (Premium) & Ecotec (mid‐segment)
Greenlam (Premium) & Newmica (mid‐segment) / Green Decowood
Plain / Pre‐laminated MDF boards; Interior / Exterior grade
Premium for premium Rs 75/sqft vs Rs30/sqft 15% premium NA
Adhesive used Phenol formaldehyde (Rs 90/kg) NA Urea formaldehyde (Rs 6/kg)
WC cycle
Debtor days 50 ‐ 60 40 ‐ 45 15 ‐ 20
Inventory 10 ‐ 12 15 ‐ 20 4 ‐ 5
Asset turnover 3.00 2.50 1.25
Greenply
Market share (%) 36% 26% 22%
Dealer discounts (%) 6‐8% 8‐10% 6‐8%
Capacity expansion (Rs mn) 350 0 NA
Revenue share (%)
Volume growth (%) 7% 10‐12% 15‐20%
Price growth (%) 5% 5‐6% 5‐6%
EBITDA Margins (%) 9‐10% 10‐12% 12‐14%
Source: Company, PhillipCapital India Research
Risks and Concerns The following are the key risks/concerns to our analysis: 5) Competition from local players: A host of local (esp Gujarat based) companies have
entered the plywood/laminates market, and may pose a significant challenge to Greenply.
6) Commodity risk: Greenply imports close to 30% of the raw material (timber), whose prices are linked to a global price index. Volatility in the global prices might lead to earnings volatility.
7) Currency risk: Greenply derives nearly 12% of its laminates sales from exports, mainly to Europe. Close to 30% of raw material is imported, primarily from Asian countries. All these constitute a significant currency risk to the earnings.
8) Tax benefits: Greenply enjoys tax benefits in four of its plants (Nagaland, HP and Uttarakhand). The last one of these expires in FY19, post which, the company might lose its competitive advantage, especially against local players. Any changes to the 24% anti‐dumping duty on MDF imports (> 6mm) could also result in increased competition.
9) Liquidity risk: Close to 34% of the outstanding stock is owned by various large groups (Ashish Dhawan, Kotak Mahindra) apart from 55% held by promoter entities. That leaves only 8‐10% as the free float, amplifying the liquidity risk in the stock.
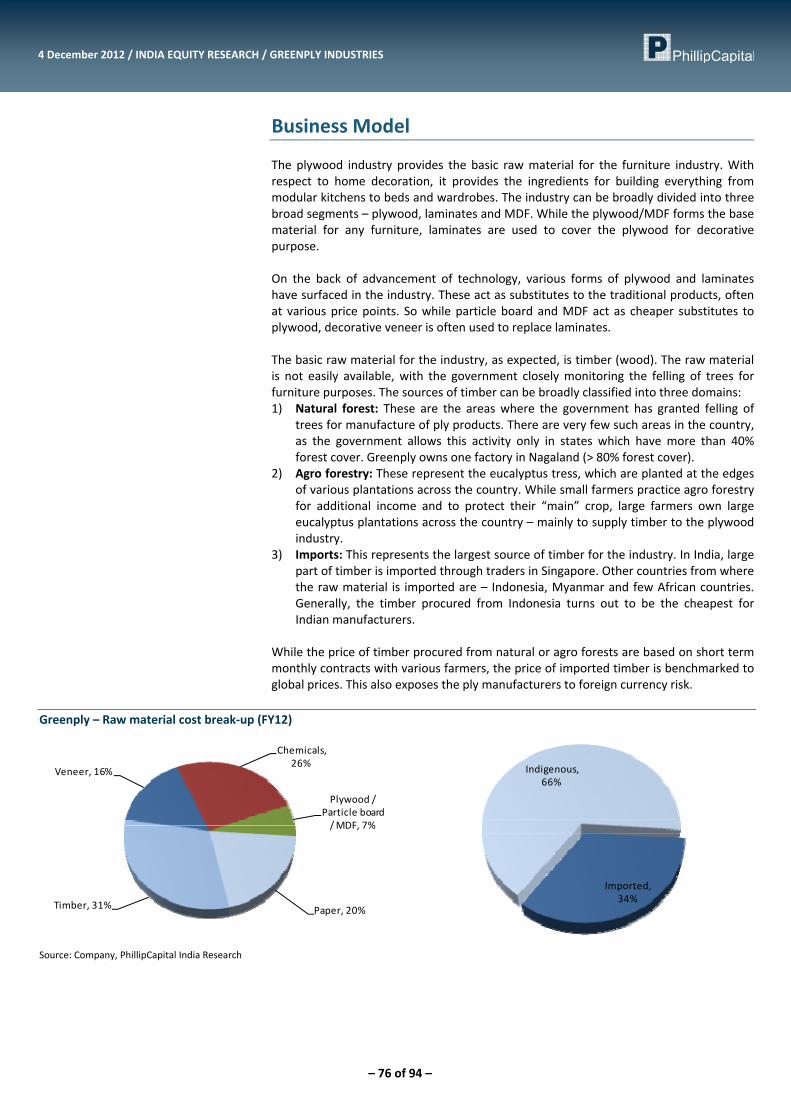
– 76 of 94 –
4 December 2012 / INDIA EQUITY RESEARCH / GREENPLY INDUSTRIES
Business Model The plywood industry provides the basic raw material for the furniture industry. With respect to home decoration, it provides the ingredients for building everything from modular kitchens to beds and wardrobes. The industry can be broadly divided into three broad segments – plywood, laminates and MDF. While the plywood/MDF forms the base material for any furniture, laminates are used to cover the plywood for decorative purpose. On the back of advancement of technology, various forms of plywood and laminates have surfaced in the industry. These act as substitutes to the traditional products, often at various price points. So while particle board and MDF act as cheaper substitutes to plywood, decorative veneer is often used to replace laminates. The basic raw material for the industry, as expected, is timber (wood). The raw material is not easily available, with the government closely monitoring the felling of trees for furniture purposes. The sources of timber can be broadly classified into three domains: 1) Natural forest: These are the areas where the government has granted felling of
trees for manufacture of ply products. There are very few such areas in the country, as the government allows this activity only in states which have more than 40% forest cover. Greenply owns one factory in Nagaland (> 80% forest cover).
2) Agro forestry: These represent the eucalyptus tress, which are planted at the edges of various plantations across the country. While small farmers practice agro forestry for additional income and to protect their “main” crop, large farmers own large eucalyptus plantations across the country – mainly to supply timber to the plywood industry.
3) Imports: This represents the largest source of timber for the industry. In India, large part of timber is imported through traders in Singapore. Other countries from where the raw material is imported are – Indonesia, Myanmar and few African countries. Generally, the timber procured from Indonesia turns out to be the cheapest for Indian manufacturers.
While the price of timber procured from natural or agro forests are based on short term monthly contracts with various farmers, the price of imported timber is benchmarked to global prices. This also exposes the ply manufacturers to foreign currency risk.
Greenply – Raw material cost break‐up (FY12)
Paper, 20%Timber, 31%
Veneer, 16%
Chemicals, 26%
Plywood / Particle board / MDF, 7%
Imported, 34%
Indigenous, 66%
Source: Company, PhillipCapital India Research
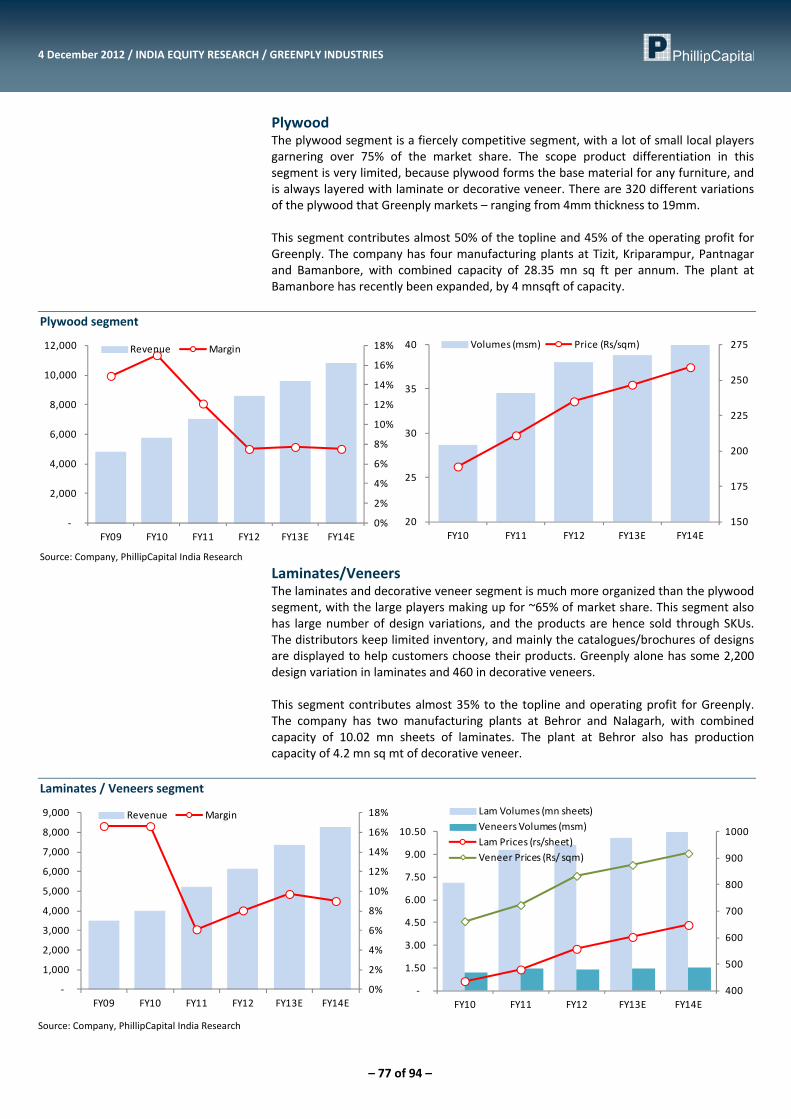
– 77 of 94 –
4 December 2012 / INDIA EQUITY RESEARCH / GREENPLY INDUSTRIES
Plywood The plywood segment is a fiercely competitive segment, with a lot of small local players garnering over 75% of the market share. The scope product differentiation in this segment is very limited, because plywood forms the base material for any furniture, and is always layered with laminate or decorative veneer. There are 320 different variations of the plywood that Greenply markets – ranging from 4mm thickness to 19mm. This segment contributes almost 50% of the topline and 45% of the operating profit for Greenply. The company has four manufacturing plants at Tizit, Kriparampur, Pantnagar and Bamanbore, with combined capacity of 28.35 mn sq ft per annum. The plant at Bamanbore has recently been expanded, by 4 mnsqft of capacity.
Plywood segment
0%
2%
4%
6%
8%
10%
12%
14%
16%
18%
‐
2,000
4,000
6,000
8,000
10,000
12,000
FY09 FY10 FY11 FY12 FY13E FY14E
Revenue Margin
150
175
200
225
250
275
20
25
30
35
40
FY10 FY11 FY12 FY13E FY14E
Volumes (msm) Price (Rs/sqm)
Source: Company, PhillipCapital India Research
Laminates/Veneers The laminates and decorative veneer segment is much more organized than the plywood segment, with the large players making up for ~65% of market share. This segment also has large number of design variations, and the products are hence sold through SKUs. The distributors keep limited inventory, and mainly the catalogues/brochures of designs are displayed to help customers choose their products. Greenply alone has some 2,200 design variation in laminates and 460 in decorative veneers. This segment contributes almost 35% to the topline and operating profit for Greenply. The company has two manufacturing plants at Behror and Nalagarh, with combined capacity of 10.02 mn sheets of laminates. The plant at Behror also has production capacity of 4.2 mn sq mt of decorative veneer.
Laminates / Veneers segment
0%
2%
4%
6%
8%
10%
12%
14%
16%
18%
‐
1,000
2,000
3,000
4,000
5,000
6,000
7,000
8,000
9,000
FY09 FY10 FY11 FY12 FY13E FY14E
Revenue Margin
400
500
600
700
800
900
1000
‐
1.50
3.00
4.50
6.00
7.50
9.00
10.50
FY10 FY11 FY12 FY13E FY14E
Lam Volumes (mn sheets)Veneers Volumes (msm)Lam Prices (rs/sheet)Veneer Prices (Rs/ sqm)
Source: Company, PhillipCapital India Research
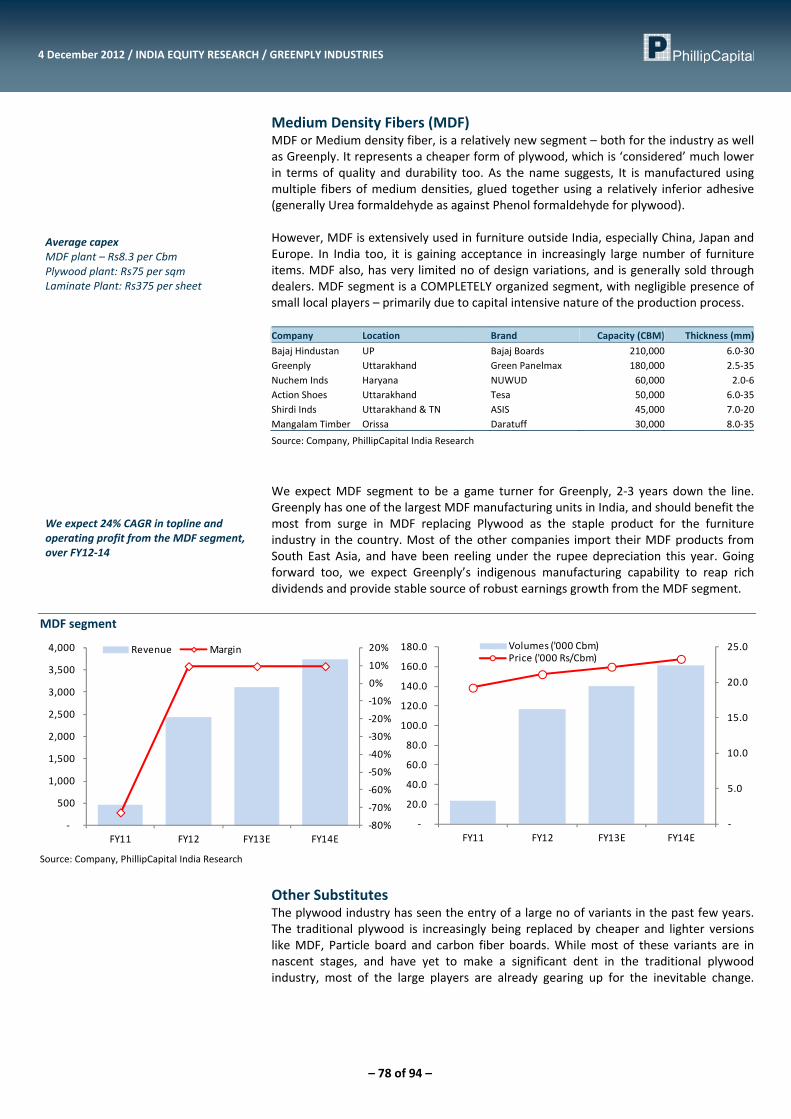
– 78 of 94 –
4 December 2012 / INDIA EQUITY RESEARCH / GREENPLY INDUSTRIES
Medium Density Fibers (MDF) MDF or Medium density fiber, is a relatively new segment – both for the industry as well as Greenply. It represents a cheaper form of plywood, which is ‘considered’ much lower in terms of quality and durability too. As the name suggests, It is manufactured using multiple fibers of medium densities, glued together using a relatively inferior adhesive (generally Urea formaldehyde as against Phenol formaldehyde for plywood). However, MDF is extensively used in furniture outside India, especially China, Japan and Europe. In India too, it is gaining acceptance in increasingly large number of furniture items. MDF also, has very limited no of design variations, and is generally sold through dealers. MDF segment is a COMPLETELY organized segment, with negligible presence of small local players – primarily due to capital intensive nature of the production process. Company Location Brand Capacity (CBM) Thickness (mm)
Bajaj Hindustan UP Bajaj Boards 210,000 6.0‐30Greenply Uttarakhand Green Panelmax 180,000 2.5‐35Nuchem Inds Haryana NUWUD 60,000 2.0‐6Action Shoes Uttarakhand Tesa 50,000 6.0‐35Shirdi Inds Uttarakhand & TN ASIS 45,000 7.0‐20Mangalam Timber Orissa Daratuff 30,000 8.0‐35
Source: Company, PhillipCapital India Research
We expect MDF segment to be a game turner for Greenply, 2‐3 years down the line. Greenply has one of the largest MDF manufacturing units in India, and should benefit the most from surge in MDF replacing Plywood as the staple product for the furniture industry in the country. Most of the other companies import their MDF products from South East Asia, and have been reeling under the rupee depreciation this year. Going forward too, we expect Greenply’s indigenous manufacturing capability to reap rich dividends and provide stable source of robust earnings growth from the MDF segment.
MDF segment
‐80%
‐70%
‐60%
‐50%
‐40%
‐30%
‐20%
‐10%
0%
10%
20%
‐
500
1,000
1,500
2,000
2,500
3,000
3,500
4,000
FY11 FY12 FY13E FY14E
Revenue Margin
‐
5.0
10.0
15.0
20.0
25.0
‐
20.0
40.0
60.0
80.0
100.0
120.0
140.0
160.0
180.0
FY11 FY12 FY13E FY14E
Volumes ('000 Cbm)Price ('000 Rs/Cbm)
Source: Company, PhillipCapital India Research
Other Substitutes The plywood industry has seen the entry of a large no of variants in the past few years. The traditional plywood is increasingly being replaced by cheaper and lighter versions like MDF, Particle board and carbon fiber boards. While most of these variants are in nascent stages, and have yet to make a significant dent in the traditional plywood industry, most of the large players are already gearing up for the inevitable change.
Average capex MDF plant – Rs8.3 per Cbm Plywood plant: Rs75 per sqm Laminate Plant: Rs375 per sheet
We expect 24% CAGR in topline and operating profit from the MDF segment, over FY12‐14

– 79 of 94 –
4 December 2012 / INDIA EQUITY RESEARCH / GREENPLY INDUSTRIES
Entry Barriers Dealer Network One of the key entry barriers, in the home décor sector, is the network of dealers that the incumbents have. This network, has been developed by years of mutually beneficial relationship between the company and the dealers, and has been instrumental in driving the growth for Greenply. As of today, Greenply has a strong network of over 13,000 dealers spread across the country. Our conversation with a few of Greenply’ dealers revealed the following facts: • Overall business: Contrary to what other home décor dealers stated, Greenply
dealers have seen demand increasing or remaining flat. Some of them (Exclusive Greenply dealers) even spoke of 20% YoY growth. However, institutional clients (mostly real estate companies) have been delaying their payments. The average collection period for the dealers has increased to 50‐60 days.
• Competition: Greenply dealers are facing competition from other brands (Anchor, KIT, Samrat and Anchor) and Gujarat based small players. However, the dealers mentioned that there is HUGE difference between the quality of Greenply’s products and those manufactured by local players. The price differential too remain high: ~20% with respect to local brands.
Branding Greenply invests ~2.5% of its annual sales, into advertizing and promotion activities. This has helped company create a strong brand image and capture higher share of mind as well as share of wallet of its target consumers. Substantial spend on branding and advertizement
2.0%
2.5%
3.0%
3.5%
4.0%
0
100
200
300
400
500
FY07 FY08 FY09 FY10 FY11 FY12
Advertizement expenses
Advertisement expenses (Rs mn)
Source: Company, PhillipCapital India Research
Greenply plywood – Always Hoyenga Greenply – Savithri Greenply laminates
Source: Company, PhillipCapital India Research
8,360
11,500 12,000 13,000 13,000
0
2,000
4,000
6,000 8,000
10,000
12,000
14,000
FY08 FY09 FY10 FY11 FY12
Dealer network
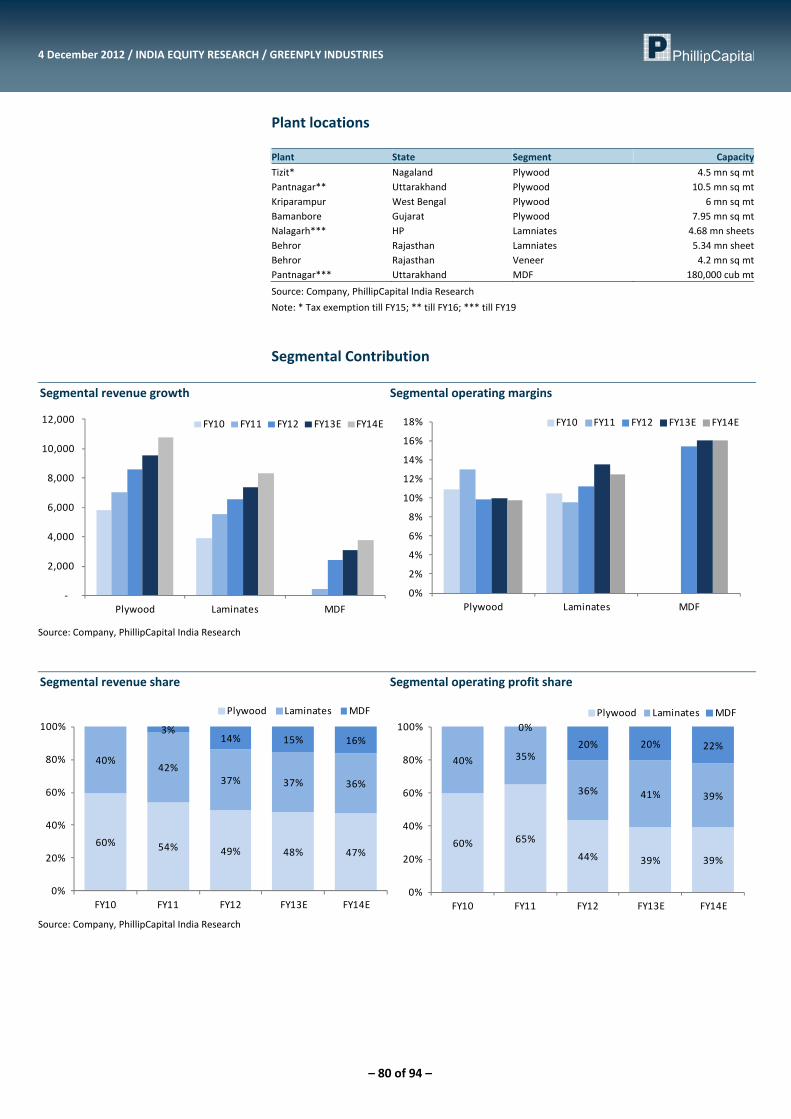
– 80 of 94 –
4 December 2012 / INDIA EQUITY RESEARCH / GREENPLY INDUSTRIES
Plant locations Plant State Segment Capacity
Tizit* Nagaland Plywood 4.5 mn sq mtPantnagar** Uttarakhand Plywood 10.5 mn sq mtKriparampur West Bengal Plywood 6 mn sq mtBamanbore Gujarat Plywood 7.95 mn sq mtNalagarh*** HP Lamniates 4.68 mn sheetsBehror Rajasthan Lamniates 5.34 mn sheetBehror Rajasthan Veneer 4.2 mn sq mtPantnagar*** Uttarakhand MDF 180,000 cub mt
Source: Company, PhillipCapital India Research
Note: * Tax exemption till FY15; ** till FY16; *** till FY19
Segmental Contribution
Segmental revenue growth Segmental operating margins
‐
2,000
4,000
6,000
8,000
10,000
12,000
Plywood Laminates MDF
FY10 FY11 FY12 FY13E FY14E
0%
2%
4%
6%
8%
10%
12%
14%
16%
18%
Plywood Laminates MDF
FY10 FY11 FY12 FY13E FY14E
Source: Company, PhillipCapital India Research
Segmental revenue share Segmental operating profit share
60% 54% 49% 48% 47%
40%42%
37% 37% 36%
3%14% 15% 16%
0%
20%
40%
60%
80%
100%
FY10 FY11 FY12 FY13E FY14E
Plywood Laminates MDF
60% 65%
44% 39% 39%
40% 35%
36% 41% 39%
0%
20% 20% 22%
0%
20%
40%
60%
80%
100%
FY10 FY11 FY12 FY13E FY14E
Plywood Laminates MDF
Source: Company, PhillipCapital India Research
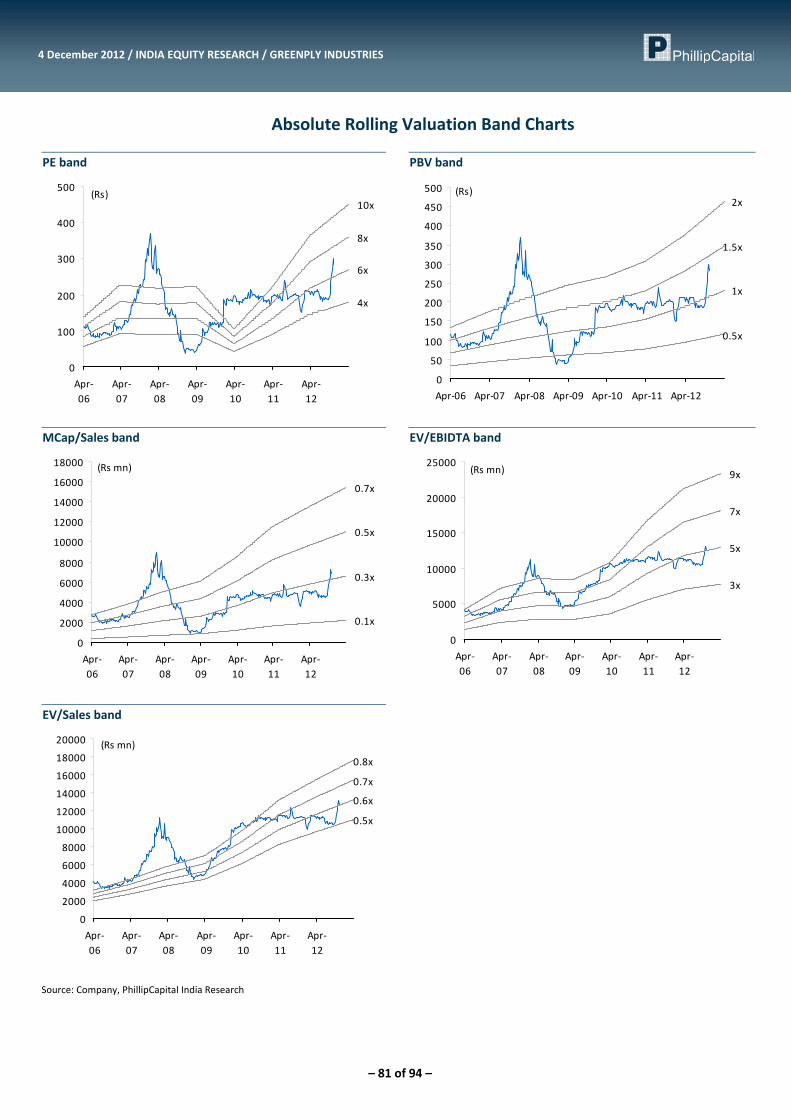
– 81 of 94 –
4 December 2012 / INDIA EQUITY RESEARCH / GREENPLY INDUSTRIES
Absolute Rolling Valuation Band Charts
PE band
4x
6x
8x
10x
0
100
200
300
400
500
Apr‐06
Apr‐07
Apr‐08
Apr‐09
Apr‐10
Apr‐11
Apr‐12
(Rs)
PBV band
0.5x
1x
1.5x
2x
0
50
100
150
200
250
300
350
400
450
500
Apr‐06 Apr‐07 Apr‐08 Apr‐09 Apr‐10 Apr‐11 Apr‐12
(Rs)
MCap/Sales band
0.1x
0.3x
0.5x
0.7x
0
2000
4000
6000
8000
10000
12000
14000
16000
18000
Apr‐06
Apr‐07
Apr‐08
Apr‐09
Apr‐10
Apr‐11
Apr‐12
(Rs mn)
EV/EBIDTA band
3x
5x
7x
9x
0
5000
10000
15000
20000
25000
Apr‐06
Apr‐07
Apr‐08
Apr‐09
Apr‐10
Apr‐11
Apr‐12
(Rs mn)
EV/Sales band
0.5x
0.6x
0.7x
0.8x
0
2000
4000
6000
8000
10000
12000
14000
16000
18000
20000
Apr‐06
Apr‐07
Apr‐08
Apr‐09
Apr‐10
Apr‐11
Apr‐12
(Rs mn)
Source: Company, PhillipCapital India Research

– 82 of 94 –
4 December 2012 / INDIA EQUITY RESEARCH / GREENPLY INDUSTRIES
Financials (Standalone)
Income Statement Y/E Mar, Rs mn FY11 FY12 FY13E FY14E
Net sales 12,174 16,437 19,248 21,929
Growth, % 40 35 17 14
Total income 12,174 16,437 19,248 21,929
Operating expenses ‐10,974 ‐14,589 ‐16,897 ‐19,347
EBITDA (Core) 1,200 1,847 2,352 2,582
Growth, % 28.3 53.9 27.3 9.8
Margin, % 9.9 11.2 12.2 11.8
Depreciation ‐410 ‐468 ‐490 ‐566
EBIT 791 1,380 1,861 2,016
Growth, % 10.7 74.5 34.9 8.3
Margin, % 6.5 8.4 9.7 9.2
Interest paid ‐443 ‐608 ‐643 ‐572
Other Non‐Operating Income 47 59 40 50
Pre‐tax profit 309 649 1,173 1,444
Tax provided ‐58 ‐115 ‐293 ‐361
Profit after tax 251 534 880 1,083
Net Profit 251 534 880 1,083
Growth, % (49.3) 112.9 64.7 23.1
Net Profit (adjusted) 251 534 880 1,083
Unadj. shares (m) 24 24 24 24
Wtd avg shares (m) 24 24 24 24
Balance Sheet Y/E Mar, Rs mn FY11 FY12 FY13E FY14E
Cash & bank 134 122 107 105
Debtors 2,127 2,909 3,296 3,630
Inventory 2,293 2,773 3,241 3,630
Loans & advances 747 915 1,046 1,192
Other current assets 3 3 3 3
Total current assets 5,304 6,721 7,693 8,559
Investments 87 87 87 87
Gross fixed assets 7,278 7,883 8,033 8,383
Less: Depreciation ‐1,239 ‐1,667 ‐2,157 ‐2,723
Add: Capital WIP 105 112 112 112
Net fixed assets 6,145 6,328 5,988 5,771
Total assets 11,536 13,136 13,768 14,418
Current liabilities 2,084 2,242 2,550 2,823
Total current liabilities 2,084 2,242 2,550 2,823
Non‐current liabilities 6,221 7,180 6,680 6,030
Total liabilities 8,305 9,422 9,230 8,853
Paid‐up capital 121 121 121 121
Reserves & surplus 3,110 3,594 4,418 5,444
Shareholders’ equity 3,231 3,715 4,538 5,565
Total equity & liabilities 11,536 13,136 13,768 14,418
Source: Company, PhillipCapital India Research
Cash Flow Y/E Mar, Rs mn FY11 FY12 FY13E FY14E
Pre‐tax profit 309 649 1,173 1,444
Depreciation 410 468 490 566
Chg in working capital ‐1,901 ‐1,271 ‐678 ‐595
Total tax paid 0 ‐27 ‐293 ‐361
Cash flow from operating activities ‐1,183 ‐181 692 1,054
Capital expenditure ‐998 ‐651 ‐150 ‐350
Chg in investments ‐46 0 0 0
Cash flow from investing activities ‐1,044 ‐651 ‐150 ‐350
Free cash flow ‐2,227 ‐832 542 704
Equity raised/(repaid) 350 76 0 0
Debt raised/(repaid) 1,900 870 ‐500 ‐650
Dividend (incl. tax) ‐28 ‐56 ‐56 ‐56
Other financing activities ‐50 ‐70 0 0
Cash flow from financing activities 2,172 820 ‐556 ‐706
Net chg in cash ‐55 ‐12 ‐14 ‐2
Valuation Ratios Y/E Mar, Rs mn FY11 FY12 FY13E FY14E
EPS, Rs 10.4 22.1 36.5 44.9
BVPS, Rs 133.9 153.9 188.0 230.6
DPS, Rs 1.0 2.0 2.0 2.0
Return on assets (%) 5.0 7.5 9.6 10.3
Return on equity (%) 8.4 15.4 21.3 21.4
Return on Invested capital (%) 8.0 11.4 12.9 13.5
RoIC/Cost of capital (x) 1.2 1.7 2.1 2.5
RoIC ‐ Cost of capital (%) 1.2 4.6 6.7 8.2
Return on capital employed (%) 6.5 9.1 11.7 12.7
Cost of capital (%) 6.8 6.8 6.1 5.3
RoCE ‐ Cost of capital (%) (0.3) 2.3 5.6 7.4
Asset turnover (x) 1.5 1.7 1.8 2.0
Sales/Total assets (x) 1.1 1.3 1.4 1.6
Sales/Net FA (x) 2.1 2.6 3.1 3.7
Working capital/Sales (x) 0.3 0.3 0.3 0.3
Receivable days 63.8 64.6 62.5 60.4
Inventory days 68.7 61.6 61.5 60.4
Payable days 64.9 51.2 50.9 49.6
Current ratio (x) 2.5 3.0 3.0 3.0
Quick ratio (x) 1.4 1.8 1.7 1.7
Interest cover (x) 1.8 2.3 2.9 3.5
Dividend cover (x) 10.4 11.1 18.2 22.4
PER (x) 29.3 13.8 8.4 6.8
Price/Book (x) 2.3 2.0 1.6 1.3
EV/EBIT (x) 16.7 10.2 7.3 6.4
EV/NOPLAT (x) 11.6 8.1 6.6 5.8
EV/CE 1.4 1.3 1.2 1.1
EV/IC (x) 1.7 1.4 1.3 1.2
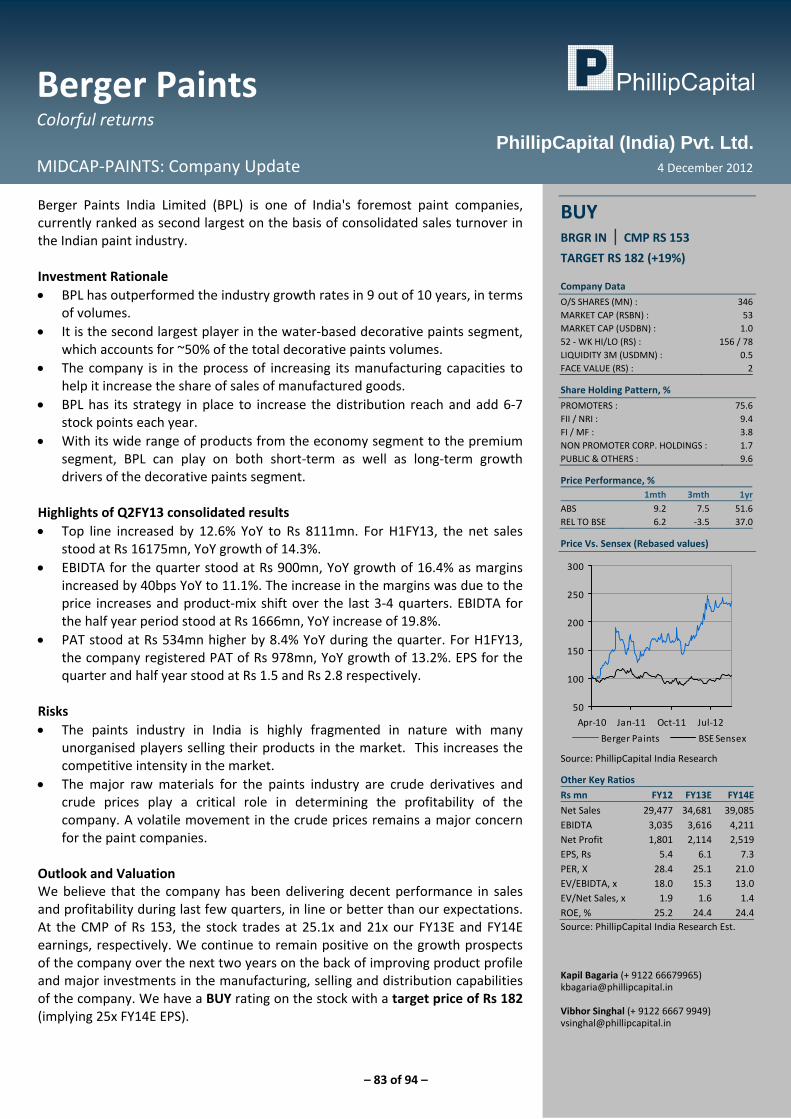
– 83 of 94 –
Berger Paints Colorful returns
MIDCAP‐PAINTS: Company Update 4 December 2012
PhillipCapital (India) Pvt. Ltd.
Berger Paints India Limited (BPL) is one of India's foremost paint companies, currently ranked as second largest on the basis of consolidated sales turnover in the Indian paint industry. Investment Rationale • BPL has outperformed the industry growth rates in 9 out of 10 years, in terms
of volumes. • It is the second largest player in the water‐based decorative paints segment,
which accounts for ~50% of the total decorative paints volumes. • The company is in the process of increasing its manufacturing capacities to
help it increase the share of sales of manufactured goods. • BPL has its strategy in place to increase the distribution reach and add 6‐7
stock points each year. • With its wide range of products from the economy segment to the premium
segment, BPL can play on both short‐term as well as long‐term growth drivers of the decorative paints segment.
Highlights of Q2FY13 consolidated results • Top line increased by 12.6% YoY to Rs 8111mn. For H1FY13, the net sales
stood at Rs 16175mn, YoY growth of 14.3%. • EBIDTA for the quarter stood at Rs 900mn, YoY growth of 16.4% as margins
increased by 40bps YoY to 11.1%. The increase in the margins was due to the price increases and product‐mix shift over the last 3‐4 quarters. EBIDTA for the half year period stood at Rs 1666mn, YoY increase of 19.8%.
• PAT stood at Rs 534mn higher by 8.4% YoY during the quarter. For H1FY13, the company registered PAT of Rs 978mn, YoY growth of 13.2%. EPS for the quarter and half year stood at Rs 1.5 and Rs 2.8 respectively.
Risks • The paints industry in India is highly fragmented in nature with many
unorganised players selling their products in the market. This increases the competitive intensity in the market.
• The major raw materials for the paints industry are crude derivatives and crude prices play a critical role in determining the profitability of the company. A volatile movement in the crude prices remains a major concern for the paint companies.
Outlook and Valuation We believe that the company has been delivering decent performance in sales and profitability during last few quarters, in line or better than our expectations. At the CMP of Rs 153, the stock trades at 25.1x and 21x our FY13E and FY14E earnings, respectively. We continue to remain positive on the growth prospects of the company over the next two years on the back of improving product profile and major investments in the manufacturing, selling and distribution capabilities of the company. We have a BUY rating on the stock with a target price of Rs 182 (implying 25x FY14E EPS).
BUY BRGR IN | CMP RS 153
TARGET RS 182 (+19%) Company Data
O/S SHARES (MN) : 346MARKET CAP (RSBN) : 53MARKET CAP (USDBN) : 1.052 ‐ WK HI/LO (RS) : 156 / 78LIQUIDITY 3M (USDMN) : 0.5FACE VALUE (RS) : 2
Share Holding Pattern, %
PROMOTERS : 75.6FII / NRI : 9.4FI / MF : 3.8NON PROMOTER CORP. HOLDINGS : 1.7PUBLIC & OTHERS : 9.6
Price Performance, % 1mth 3mth 1yr
ABS 9.2 7.5 51.6REL TO BSE 6.2 ‐3.5 37.0
Price Vs. Sensex (Rebased values)
50
100
150
200
250
300
Apr‐10 Jan‐11 Oct‐11 Jul‐12
Berger Paints BSE Sensex
Source: PhillipCapital India Research
Other Key Ratios
Rs mn FY12 FY13E FY14E
Net Sales 29,477 34,681 39,085EBIDTA 3,035 3,616 4,211Net Profit 1,801 2,114 2,519EPS, Rs 5.4 6.1 7.3PER, X 28.4 25.1 21.0EV/EBIDTA, x 18.0 15.3 13.0EV/Net Sales, x 1.9 1.6 1.4ROE, % 25.2 24.4 24.4Source: PhillipCapital India Research Est. Kapil Bagaria (+ 9122 66679965) [email protected] Vibhor Singhal (+ 9122 6667 9949) [email protected]

– 84 of 94 –
4 December 2012 / INDIA EQUITY RESEARCH / BERGER PAINTS
Company Overview • Berger Paints India Limited (BPL) is one of India's foremost paint companies,
currently ranked as second largest on the basis of consolidated sales turnover in Indian paint industry. BPL was incorporated in 1947 as British Paints (India) Limited by taking over Kolkata‐based Hadfield's (India) Limited, to manufacture ready mixed stiff paints, varnishes and distempers and was rechristened as Berger Paints India Limited on 31 December 1983, fourteen years after being acquired by Berger, Jenson Nicholson Limited, UK.
• BPL markets its products and services through 109 depots and more than 12000 paint retailers across the country.
• BPL is second only to Asian Paints in the decorative paints segment in the country and more than 75% of the top line of the company comes from this segment with a small share in industrial paints namely, automotive paints (~10%), high performance or protection coatings (~10%) and powder coatings.
• With Head Office in Kolkata the company manufactures and markets a range of decorative & industrial paint products under various product brands and has it operations spread throughout the length & breath of the country; with seven manufacturing facilities in India and more than 85 depots, several regional & area offices, besides four facilities overseas. It has a workforce of over 2500 employees and a countrywide distribution network of 15000 plus dealers.
• The sales for the company have increased at 22% CAGR during FY09‐12 period. The net revenues rose from Rs 16239mn in FY09 to Rs 29477mn in FY12. EBIDTA during the said period has also increased at a CAGR of 31.7% from Rs 1329mn in FY09 to Rs 3035mn in FY12. PAT for the period from FY09‐12 has registered a CAGR of 27.5% as it increased from Rs 828mn in FY09 to Rs 1801mn in FY12.
Segment‐wise sales
80%
20%
Decorative Paints
Industrial Paints
Source: Company, PhillipCapital India Research
• In the decorative paints segment, BPL is a widely accepted brand, with a presence in
both solvents as well as water‐based emulsions. It has a Technical License Agreement with TIGERWERK Lack –u.Farbenfabrik GmbH & Co. KG, Austria for specialised powder coatings. Products manufactured with know–how of the collaborator has been well received by the customers.

– 85 of 94 –
4 December 2012 / INDIA EQUITY RESEARCH / BERGER PAINTS
Product Portfolio Surface Major brands/products
Interior walls Silk, Breathe Easy, Rangoli Easy Clean, Rangoli Super Acrylic Emulsion, Bison AcrylicEmulsion, Illusions, Illusions Image, Metallica, Marble
Distempers Bison Distemper, Jadoo Acrylic Distemper
Exterior walls WeatherCoat All Guard, WeatherCoat Smooth, WeatherCoat Longlife, WeatherCoat TileProtektor, Walmasta
Primer WeatherCoat Biowash, WeatherCoat Exterior Wall Primer
Wood, metals, walls Woodkeeper PU Legend, Premium Wood Coatings from Becker Acroma (Italy), 2‐pack PUSystem, 3‐Pack Polyester Coating
Enamels Breathe Easy Enamel, Luxol Satin Enamel, Luxol High Gloss Enamel, Berger Butterfly GPEnamel, Jadoo Enamel
Source: Company, PhillipCapital India Research
Subsidiaries and Joint Ventures BPL has six subsidiaries, one in India and 5 in other countries: • Beepee Coatings Private Limited, India is a wholly‐owned subsidiary with its entire
manufacturing facilities dedicated to processing the company’s products. • Berger Jenson & Nicholson (Nepal) Private Limited, Nepal (100% subsidiary) has
operations in Nepal and with a profitable and sound business in place. • Berger Paints (Cyprus) Limited, Cyprus (100% subsidiary) and Lusako Trading
Limited, Cyprus (100% subsidiary) are SPVs for the purpose of making investments in the overseas interests of the company.
• Berger Paints Overseas Limited, Russia, has just started manufacturing operations, but is severely impacted by the slowdown in Russia.
• Bolix S. A., Poland (100% subsidiary) is one of the technology leaders in External Insulation Finishing Systems and it will help the company to access its technology to launch new products.
• JV with Becker Industrial Coatings (Sweden), Berger Becker Coatings Private Limited (49% stake) to manufacture water‐based wood coating in India.
• JV with Nippon Bee Chemicals Co. of Japan (NBC), BNB Coatings India Limited (BNB), Ltd. (49% stake) for manufacture of coatings for plastic substrates of automobiles.
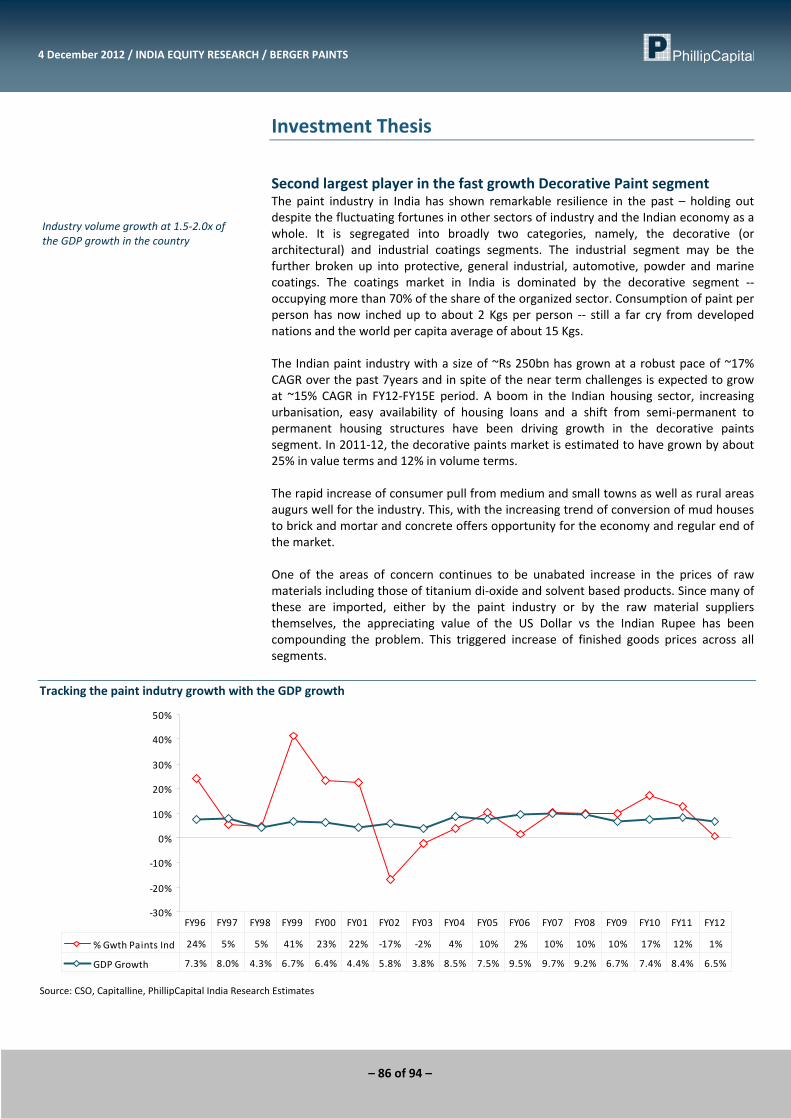
– 86 of 94 –
4 December 2012 / INDIA EQUITY RESEARCH / BERGER PAINTS
Investment Thesis
Second largest player in the fast growth Decorative Paint segment The paint industry in India has shown remarkable resilience in the past – holding out despite the fluctuating fortunes in other sectors of industry and the Indian economy as a whole. It is segregated into broadly two categories, namely, the decorative (or architectural) and industrial coatings segments. The industrial segment may be the further broken up into protective, general industrial, automotive, powder and marine coatings. The coatings market in India is dominated by the decorative segment ‐‐ occupying more than 70% of the share of the organized sector. Consumption of paint per person has now inched up to about 2 Kgs per person ‐‐ still a far cry from developed nations and the world per capita average of about 15 Kgs. The Indian paint industry with a size of ~Rs 250bn has grown at a robust pace of ~17% CAGR over the past 7years and in spite of the near term challenges is expected to grow at ~15% CAGR in FY12‐FY15E period. A boom in the Indian housing sector, increasing urbanisation, easy availability of housing loans and a shift from semi‐permanent to permanent housing structures have been driving growth in the decorative paints segment. In 2011‐12, the decorative paints market is estimated to have grown by about 25% in value terms and 12% in volume terms. The rapid increase of consumer pull from medium and small towns as well as rural areas augurs well for the industry. This, with the increasing trend of conversion of mud houses to brick and mortar and concrete offers opportunity for the economy and regular end of the market. One of the areas of concern continues to be unabated increase in the prices of raw materials including those of titanium di‐oxide and solvent based products. Since many of these are imported, either by the paint industry or by the raw material suppliers themselves, the appreciating value of the US Dollar vs the Indian Rupee has been compounding the problem. This triggered increase of finished goods prices across all segments.
Tracking the paint indutry growth with the GDP growth
‐30%
‐20%
‐10%
0%
10%
20%
30%
40%
50%
% Gwth Paints Ind 1%12%17%10%10%10%2%10%4%‐2%‐17%22%23%41%5%5%24%
GDP Growth 6.5%8.4%7.4%6.7%9.2%9.7%9.5%7.5%8.5%3.8%5.8%4.4%6.4%6.7%4.3%8.0%7.3%
FY12FY11FY10FY09FY08FY07FY06FY05FY04FY03FY02FY01FY00FY99FY98FY97FY96
Source: CSO, Capitalline, PhillipCapital India Research Estimates
Industry volume growth at 1.5‐2.0x of the GDP growth in the country
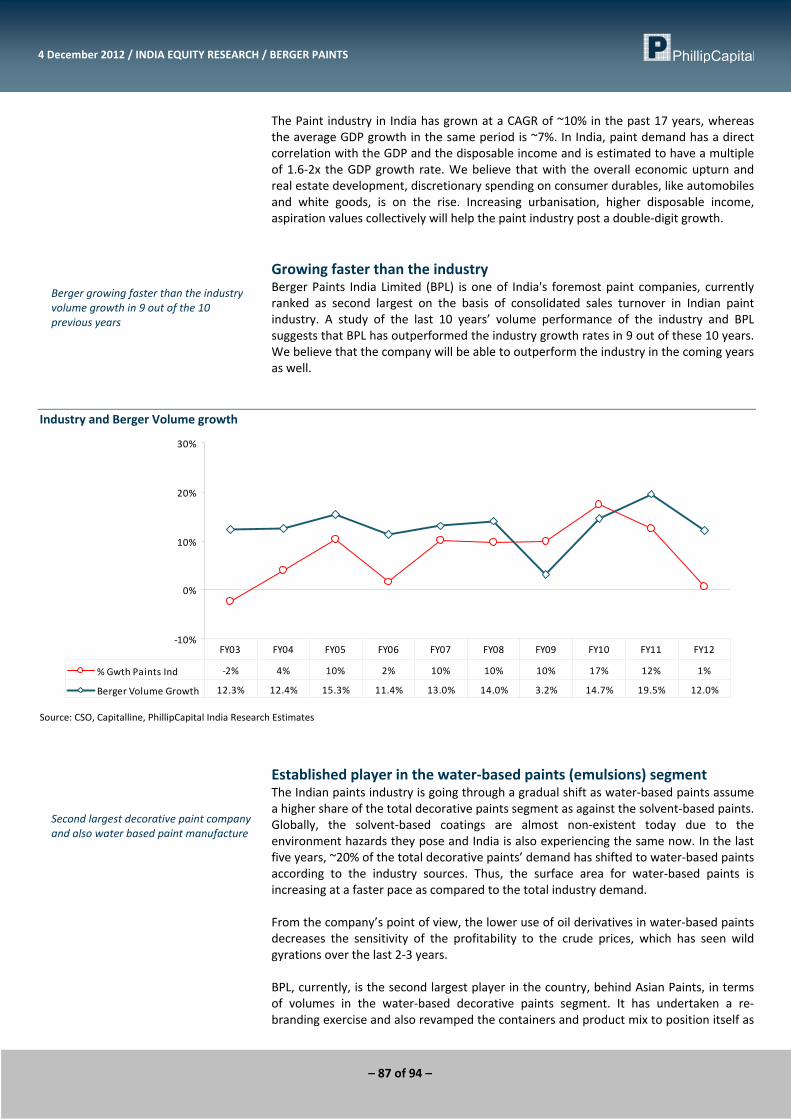
– 87 of 94 –
4 December 2012 / INDIA EQUITY RESEARCH / BERGER PAINTS
The Paint industry in India has grown at a CAGR of ~10% in the past 17 years, whereas the average GDP growth in the same period is ~7%. In India, paint demand has a direct correlation with the GDP and the disposable income and is estimated to have a multiple of 1.6‐2x the GDP growth rate. We believe that with the overall economic upturn and real estate development, discretionary spending on consumer durables, like automobiles and white goods, is on the rise. Increasing urbanisation, higher disposable income, aspiration values collectively will help the paint industry post a double‐digit growth.
Growing faster than the industry Berger Paints India Limited (BPL) is one of India's foremost paint companies, currently ranked as second largest on the basis of consolidated sales turnover in Indian paint industry. A study of the last 10 years’ volume performance of the industry and BPL suggests that BPL has outperformed the industry growth rates in 9 out of these 10 years. We believe that the company will be able to outperform the industry in the coming years as well.
Industry and Berger Volume growth
‐10%
0%
10%
20%
30%
% Gwth Paints Ind 1%12%17%10%10%10%2%10%4%‐2%
Berger Volume Growth 12.0%19.5%14.7%3.2%14.0%13.0%11.4%15.3%12.4%12.3%
FY12FY11FY10FY09FY08FY07FY06FY05FY04FY03
Source: CSO, Capitalline, PhillipCapital India Research Estimates
Established player in the water‐based paints (emulsions) segment The Indian paints industry is going through a gradual shift as water‐based paints assume a higher share of the total decorative paints segment as against the solvent‐based paints. Globally, the solvent‐based coatings are almost non‐existent today due to the environment hazards they pose and India is also experiencing the same now. In the last five years, ~20% of the total decorative paints’ demand has shifted to water‐based paints according to the industry sources. Thus, the surface area for water‐based paints is increasing at a faster pace as compared to the total industry demand. From the company’s point of view, the lower use of oil derivatives in water‐based paints decreases the sensitivity of the profitability to the crude prices, which has seen wild gyrations over the last 2‐3 years. BPL, currently, is the second largest player in the country, behind Asian Paints, in terms of volumes in the water‐based decorative paints segment. It has undertaken a re‐branding exercise and also revamped the containers and product mix to position itself as
Berger growing faster than the industry volume growth in 9 out of the 10 previous years
Second largest decorative paint company and also water based paint manufacture

– 88 of 94 –
4 December 2012 / INDIA EQUITY RESEARCH / BERGER PAINTS
an environment‐friendly paints company. This re‐branding helped the company improve its positioning in the retail market and has got a major breakthrough in the premium water‐based paint segment, where it has more than doubled its sales growth rate. In order to take advantage of the rising demand for water‐based paints and improve its margin profile, BPL is setting up a 150,000 MT water‐based paint plant in Andhra Pradesh.
Focus on market penetration – Second largest dealer network The company has marketing strength in the north and east of India. It is now focusing on expanding its reach in the Southern and Western parts of the country. The company currently has more than 110 stock points across the country and is looking to add at least 6‐7 such stock points every year and thus, strengthen the distribution network. It has the second dealer network in the country with ~16000 dealers across the country, second only to Asian Paints. The maximum distance that the products of the company travel between the factory and stock point has come down to ~600 kilometers as against ~1000 kilometers 3 years ago. Apart from this, BPL is also looking to expand the network through the following steps: • Ensuring better supply lines, • Improving the depth of sales at the existing channels, and, • Increasing the spread of the dealers. Also, the company will look to create a demand pull for its premium products through advertising campaigns and better positioning with the water‐based product range.
Leader in the tinting machines installations The company is looking to remain at the forefront of all the new innovations which are coming to the industry. BPL has got the second largest network of tinting machines in the country with more than 9000 tinting machines installed at various dealers’ outlets. The tinting machines improve the inventory management for the dealers (thus, improving the working capital management) as well as the company and also helps the dealers to offer a wider range of colour shades to the customer at a given point in time. The dealer only buys the base colours from the company and then mixes the base colours and gets the desired shades for the customer.
Shift in consumer preferences to BPL’s advantage BPL's decorative paints brands fall in all the major segments as ~25%‐30% of the product offering fall in the economy segment, ~50%‐60% in the mid‐segment and the remaining ~10%‐25% in the premium segment. A strong presence in the economy and mid‐range segments will surely benefit BPL in cashing in on consumers that upgrade from low‐end products to paints. Also, the presence in the premium segment will help the company garner better margins.
Early mover advantage in Tinting machines – currently 9000 machines installed across country
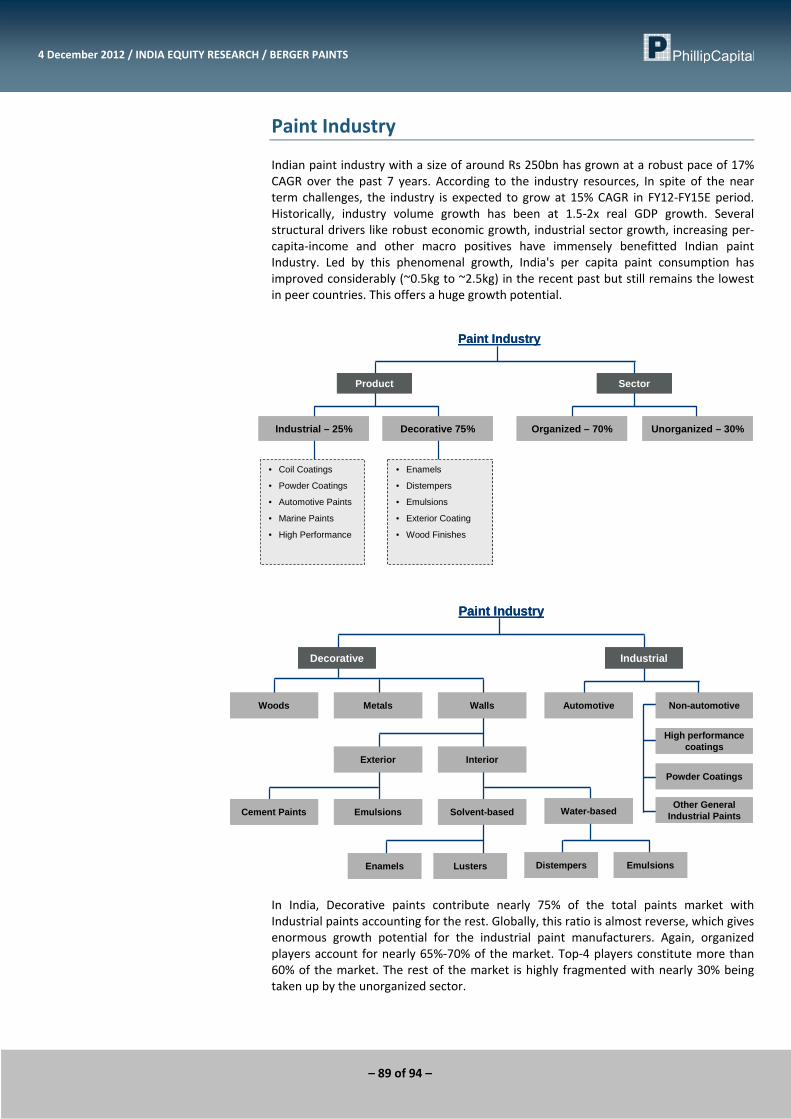
– 89 of 94 –
4 December 2012 / INDIA EQUITY RESEARCH / BERGER PAINTS
Paint Industry Indian paint industry with a size of around Rs 250bn has grown at a robust pace of 17% CAGR over the past 7 years. According to the industry resources, In spite of the near term challenges, the industry is expected to grow at 15% CAGR in FY12‐FY15E period. Historically, industry volume growth has been at 1.5‐2x real GDP growth. Several structural drivers like robust economic growth, industrial sector growth, increasing per‐capita‐income and other macro positives have immensely benefitted Indian paint Industry. Led by this phenomenal growth, India's per capita paint consumption has improved considerably (~0.5kg to ~2.5kg) in the recent past but still remains the lowest in peer countries. This offers a huge growth potential.
Paint Industry
Industrial – 25% Decorative 75%
• Coil Coatings
• Powder Coatings
• Automotive Paints
• Marine Paints
• High Performance
• Enamels
• Distempers
• Emulsions
• Exterior Coating
• Wood Finishes
Organized – 70% Unorganized – 30%
Product Sector
Paint Industry
Industrial – 25% Decorative 75%
• Coil Coatings
• Powder Coatings
• Automotive Paints
• Marine Paints
• High Performance
• Enamels
• Distempers
• Emulsions
• Exterior Coating
• Wood Finishes
Organized – 70% Unorganized – 30%
Product Sector
Paint Industry
Decorative Industrial
Automotive
Exterior Interior
Cement Paints Emulsions Solvent-based Water-based
Enamels Lusters
Woods Metals Walls
Distempers Emulsions
Non-automotive
High performance coatings
Powder Coatings
Other General Industrial Paints
Paint Industry
Decorative Industrial
Automotive
Exterior Interior
Cement Paints Emulsions Solvent-based Water-based
Enamels Lusters
Woods Metals Walls
Distempers Emulsions
Non-automotive
High performance coatings
Powder Coatings
Other General Industrial Paints
In India, Decorative paints contribute nearly 75% of the total paints market with Industrial paints accounting for the rest. Globally, this ratio is almost reverse, which gives enormous growth potential for the industrial paint manufacturers. Again, organized players account for nearly 65%‐70% of the market. Top‐4 players constitute more than 60% of the market. The rest of the market is highly fragmented with nearly 30% being taken up by the unorganized sector.

– 90 of 94 –
4 December 2012 / INDIA EQUITY RESEARCH / BERGER PAINTS
Market share
52.9%
17.5%
18.5%
9.0%2.1%
Asian Paints
Kansai Nerolac
Berger Paints
Akzo Nobel
Others
Source: Company, Capital Line, PhillipCapital India Research
Demand drivers for the sector include: The per capita consumption for paints in India at 2.5kg is well below the developed (20kgs) as well as the developing markets’ standards. Rising income levels will act as a significant catalyst for demand growth in decorative paints. With increasing media exposure, there is a gradual shift from the unbranded to branded segment as well as improvement in product mix for bigger players as demand for emulsions continues to outpace enamels and distempers. With production of passenger cars expected to grow, demand for automotive paints will continue to remain healthy in the coming times. With realty majors launching new projects, construction activity is expected to gain momentum and generate demand for decorative paints. The emerging trends in the decorative industry are: • Consumers are increasingly involved in making purchase decisions. • Consumers expect better and more relevant functional benefits from paints. • Emulsion paints are outgrowing the industry growth rate. • Tinting systems at store level are the order of the day. • Companies are getting more consumer‐centric and a lot of value‐added services are
being offered, like application support, colour consultancy, etc.
Industrial Paints Decorative Paints
50.0
5.010.0
30.0
5.0
Automotive Paints Coil CoatingPower Coating High Performance CoatingMarine Paints
32%
26%
13%
4%
15%
10%
Enamels Emulsions DistempersCement Paints Primmers, Thinners Others
Source: Company, PhillipCapital India Research
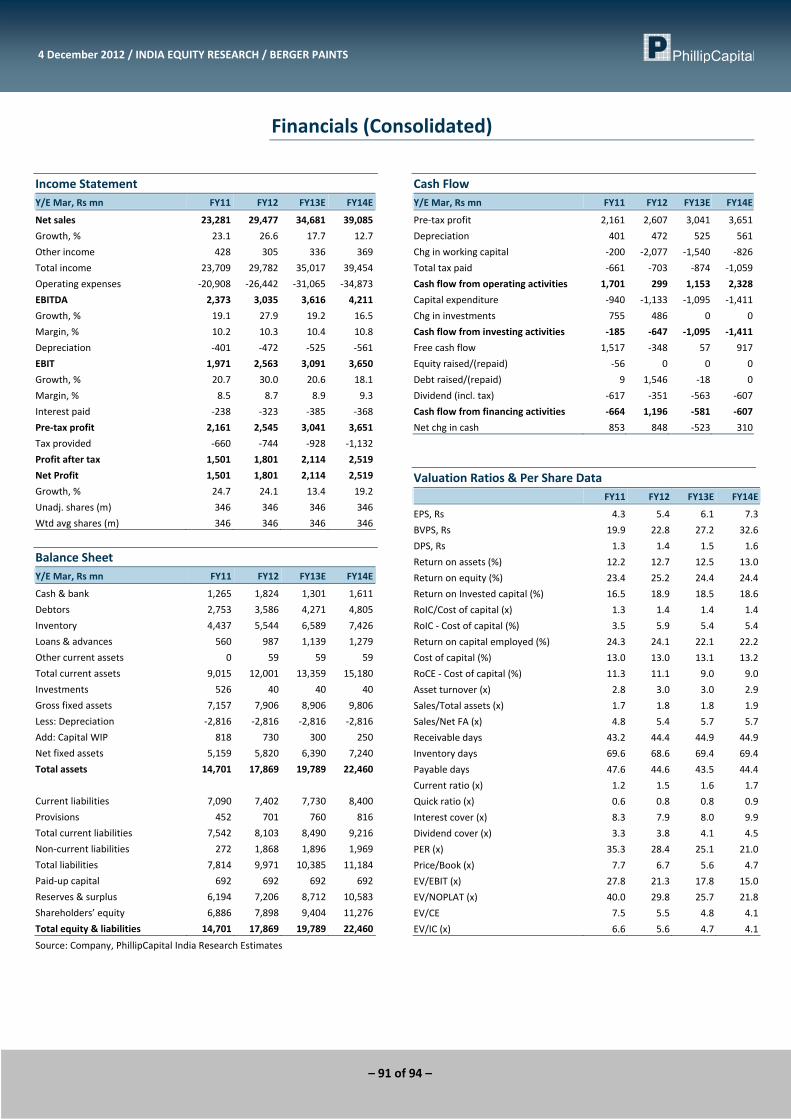
– 91 of 94 –
4 December 2012 / INDIA EQUITY RESEARCH / BERGER PAINTS
Financials (Consolidated)
Income Statement Y/E Mar, Rs mn FY11 FY12 FY13E FY14E
Net sales 23,281 29,477 34,681 39,085
Growth, % 23.1 26.6 17.7 12.7
Other income 428 305 336 369
Total income 23,709 29,782 35,017 39,454
Operating expenses ‐20,908 ‐26,442 ‐31,065 ‐34,873
EBITDA 2,373 3,035 3,616 4,211
Growth, % 19.1 27.9 19.2 16.5
Margin, % 10.2 10.3 10.4 10.8
Depreciation ‐401 ‐472 ‐525 ‐561
EBIT 1,971 2,563 3,091 3,650
Growth, % 20.7 30.0 20.6 18.1
Margin, % 8.5 8.7 8.9 9.3
Interest paid ‐238 ‐323 ‐385 ‐368
Pre‐tax profit 2,161 2,545 3,041 3,651
Tax provided ‐660 ‐744 ‐928 ‐1,132
Profit after tax 1,501 1,801 2,114 2,519
Net Profit 1,501 1,801 2,114 2,519
Growth, % 24.7 24.1 13.4 19.2
Unadj. shares (m) 346 346 346 346
Wtd avg shares (m) 346 346 346 346
Balance Sheet Y/E Mar, Rs mn FY11 FY12 FY13E FY14E
Cash & bank 1,265 1,824 1,301 1,611
Debtors 2,753 3,586 4,271 4,805
Inventory 4,437 5,544 6,589 7,426
Loans & advances 560 987 1,139 1,279
Other current assets 0 59 59 59
Total current assets 9,015 12,001 13,359 15,180
Investments 526 40 40 40
Gross fixed assets 7,157 7,906 8,906 9,806
Less: Depreciation ‐2,816 ‐2,816 ‐2,816 ‐2,816
Add: Capital WIP 818 730 300 250
Net fixed assets 5,159 5,820 6,390 7,240
Total assets 14,701 17,869 19,789 22,460
Current liabilities 7,090 7,402 7,730 8,400
Provisions 452 701 760 816
Total current liabilities 7,542 8,103 8,490 9,216
Non‐current liabilities 272 1,868 1,896 1,969
Total liabilities 7,814 9,971 10,385 11,184
Paid‐up capital 692 692 692 692
Reserves & surplus 6,194 7,206 8,712 10,583
Shareholders’ equity 6,886 7,898 9,404 11,276
Total equity & liabilities 14,701 17,869 19,789 22,460
Source: Company, PhillipCapital India Research Estimates
Cash Flow Y/E Mar, Rs mn FY11 FY12 FY13E FY14E
Pre‐tax profit 2,161 2,607 3,041 3,651
Depreciation 401 472 525 561
Chg in working capital ‐200 ‐2,077 ‐1,540 ‐826
Total tax paid ‐661 ‐703 ‐874 ‐1,059
Cash flow from operating activities 1,701 299 1,153 2,328
Capital expenditure ‐940 ‐1,133 ‐1,095 ‐1,411
Chg in investments 755 486 0 0
Cash flow from investing activities ‐185 ‐647 ‐1,095 ‐1,411
Free cash flow 1,517 ‐348 57 917
Equity raised/(repaid) ‐56 0 0 0
Debt raised/(repaid) 9 1,546 ‐18 0
Dividend (incl. tax) ‐617 ‐351 ‐563 ‐607
Cash flow from financing activities ‐664 1,196 ‐581 ‐607
Net chg in cash 853 848 ‐523 310
Valuation Ratios & Per Share Data FY11 FY12 FY13E FY14E
EPS, Rs 4.3 5.4 6.1 7.3
BVPS, Rs 19.9 22.8 27.2 32.6
DPS, Rs 1.3 1.4 1.5 1.6
Return on assets (%) 12.2 12.7 12.5 13.0
Return on equity (%) 23.4 25.2 24.4 24.4
Return on Invested capital (%) 16.5 18.9 18.5 18.6
RoIC/Cost of capital (x) 1.3 1.4 1.4 1.4
RoIC ‐ Cost of capital (%) 3.5 5.9 5.4 5.4
Return on capital employed (%) 24.3 24.1 22.1 22.2
Cost of capital (%) 13.0 13.0 13.1 13.2
RoCE ‐ Cost of capital (%) 11.3 11.1 9.0 9.0
Asset turnover (x) 2.8 3.0 3.0 2.9
Sales/Total assets (x) 1.7 1.8 1.8 1.9
Sales/Net FA (x) 4.8 5.4 5.7 5.7
Receivable days 43.2 44.4 44.9 44.9
Inventory days 69.6 68.6 69.4 69.4
Payable days 47.6 44.6 43.5 44.4
Current ratio (x) 1.2 1.5 1.6 1.7
Quick ratio (x) 0.6 0.8 0.8 0.9
Interest cover (x) 8.3 7.9 8.0 9.9
Dividend cover (x) 3.3 3.8 4.1 4.5
PER (x) 35.3 28.4 25.1 21.0
Price/Book (x) 7.7 6.7 5.6 4.7
EV/EBIT (x) 27.8 21.3 17.8 15.0
EV/NOPLAT (x) 40.0 29.8 25.7 21.8
EV/CE 7.5 5.5 4.8 4.1
EV/IC (x) 6.6 5.6 4.7 4.1

– 92 of 94 –
4 December 2012 / INDIA EQUITY RESEARCH / BERGER PAINTS
Recommendation History Recommendation Target, Rs CMP, Rs Date
Buy 182 153 4 December 2012
Buy 162 141 8 August 2012
Buy 155 139 7 June 2012
Buy 120 101 7 February 2012
Buy 117 92 8 December 2010
– 93 of 94 –
4 December 2012 / INDIA EQUITY RESEARCH / BERGER PAINTS
Management Vineet Bhatnagar (Managing Director) (91 22) 2300 2999 Sajid Khalid (Head – Institutional Equities) (91 22) 6667 9972 Jignesh Shah (Head – Equity Derivatives) (91 22) 6667 9735
Research Automobiles, IT Services Deepak Jain (9122) 6667 9758 Neha Garg (9122) 6667 9996 Varun Vijayan (9122) 6667 9992 Banking, NBFCs Manish Agarwalla (9122) 6667 9962 Sachit Motwani, FRM (9122) 6667 9953 Consumer, Media, Telecom Naveen Kulkarni, CFA, FRM (9122) 6667 9947 Ennette Fernandes (9122) 6667 9764 Vivekanand Subbaraman (9122) 6667 9766 Cement Vaibhav Agarwal (9122) 6667 9967
Economics Anjali Verma (9122) 6667 9969 Engineering, Capital Goods Ankur Sharma (9122) 6667 9759 Jishar Thoombath (9122) 6667 9986 Metals Dhawal Doshi (9122) 6667 9769 Dharmesh Shah (9122) 6667 9974 Infrastructure Vibhor Singhal (9122) 6667 9949 Raheel Arathodi (9122) 6667 9768 Oil&Gas, Agri Inputs Gauri Anand (9122) 6667 9943 Saurabh Rathi (9122) 6667 9951
Retail, Real Estate Abhishek Ranganathan, CFA (9122) 6667 9952 Neha Garg (9122) 6667 9996 Mid‐caps Kapil Bagaria (9122) 6667 9965 Raheel Arathodi (9122) 6667 9768 Technicals & Quant Neppolian Pillai (9122) 6667 9989 Shikha Khurana (9122) 6667 9948 Sr. Manager – Equities Support Rosie Ferns (9122) 6667 9971
Sales & Distribution Sudhir Padiyar (9122) 6667 9991 Kinshuk Tiwari (9122) 6667 9946 Pawan Kakumanu (9122) 6667 9934 Shubhangi Agrawal (9122) 6667 9964 Dipesh Sohani (9122) 6667 9756
Sunil Kamath (Sales Trader) (9122) 6667 9747 Chetan Savla (Sales Trader) (9122) 6667 9745 Rajesh Ashar (Sales Trader) (9122) 6667 9746
Mayur Shah (Execution) (9122) 6667 9945 Gurudatt Uchil (Execution) (9122) 6667 9750
Contact Information (Regional Member Companies)
SINGAPORE
Phillip Securities Pte Ltd 250 North Bridge Road, #06‐00 Raffles City Tower,
Singapore 179101 Tel : (65) 6533 6001 Fax: (65) 6535 3834
www.phillip.com.sg
MALAYSIA Phillip Capital Management Sdn Bhd B‐3‐6 Block B Level 3, Megan Avenue II,
No. 12, Jalan Yap Kwan Seng, 50450 Kuala Lumpur Tel (60) 3 2162 8841 Fax (60) 3 2166 5099
www.poems.com.my
HONG KONG Phillip Securities (HK) Ltd
11/F United Centre 95 Queensway Hong Kong Tel (852) 2277 6600 Fax: (852) 2868 5307
www.phillip.com.hk
JAPAN Phillip Securities Japan, Ltd
4‐2 Nihonbashi Kabutocho, Chuo‐ku Tokyo 103‐0026
Tel: (81) 3 3666 2101 Fax: (81) 3 3664 0141 www.phillip.co.jp
INDONESIA PT Phillip Securities Indonesia
ANZ Tower Level 23B, Jl Jend Sudirman Kav 33A, Jakarta 10220, Indonesia
Tel (62) 21 5790 0800 Fax: (62) 21 5790 0809 www.phillip.co.id
CHINA Phillip Financial Advisory (Shanghai) Co. Ltd.
No 550 Yan An East Road, Ocean Tower Unit 2318 Shanghai 200 001
Tel (86) 21 5169 9200 Fax: (86) 21 6351 2940 www.phillip.com.cn
THAILAND Phillip Securities (Thailand) Public Co. Ltd.
15th Floor, Vorawat Building, 849 Silom Road, Silom, Bangrak, Bangkok 10500 Thailand
Tel (66) 2 2268 0999 Fax: (66) 2 2268 0921 www.phillip.co.th
FRANCE King & Shaxson Capital Ltd.
3rd Floor, 35 Rue de la Bienfaisance 75008 Paris France
Tel (33) 1 4563 3100 Fax : (33) 1 4563 6017 www.kingandshaxson.com
UNITED KINGDOM King & Shaxson Ltd.
6th Floor, Candlewick House, 120 Cannon Street London, EC4N 6AS
Tel (44) 20 7929 5300 Fax: (44) 20 7283 6835 www.kingandshaxson.com
UNITED STATES Phillip Futures Inc.
141 W Jackson Blvd Ste 3050 The Chicago Board of Trade Building
Chicago, IL 60604 USA Tel (1) 312 356 9000 Fax: (1) 312 356 9005
AUSTRALIA PhillipCapital Australia
Level 37, 530 Collins Street Melbourne, Victoria 3000, Australia
Tel: (61) 3 9629 8380 Fax: (61) 3 9614 8309 www.phillipcapital.com.au
SRI LANKA Asha Phillip Securities Limited
Level 4, Millennium House, 46/58 Navam Mawatha, Colombo 2, Sri Lanka
Tel: (94) 11 2429 100 Fax: (94) 11 2429 199 www.ashaphillip.net/home.htm
INDIA PhillipCapital (India) Private Limited
No. 1, C‐Block, 2nd Floor, Modern Center , Jacob Circle, K. K. Marg, Mahalaxmi Mumbai 400011 Tel: (9122) 2300 2999 Fax: (9122) 6667 9955 www.phillipcapital.in
– 94 of 94 –
4 December 2012 / INDIA EQUITY RESEARCH / HOME DÉCOR
Disclosures and Disclaimers PhillipCapital (India) Pvt. Ltd. has three independent equity research groups: Institutional Equities, Institutional Equity Derivatives and Private Client Group. This report has been prepared by Institutional Equities Group. The views and opinions expressed in this document may or may not match or may be contrary at times with the views, estimates, rating, target price of the other equity research groups of PhillipCapital (India) Pvt. Ltd. This report is issued by PhillipCapital (India) Pvt. Ltd. which is regulated by SEBI. PhillipCapital (India) Pvt. Ltd. is a subsidiary of Phillip (Mauritius) Pvt. Ltd. References to "PCIPL" in this report shall mean PhillipCapital (India) Pvt. Ltd unless otherwise stated. This report is prepared and distributed by PCIPL for information purposes only and neither the information contained herein nor any opinion expressed should be construed or deemed to be construed as solicitation or as offering advice for the purposes of the purchase or sale of any security, investment or derivatives. The information and opinions contained in the Report were considered by PCIPL to be valid when published. The report also contains information provided to PCIPL by third parties. The source of such information will usually be disclosed in the report. Whilst PCIPL has taken all reasonable steps to ensure that this information is correct, PCIPL does not offer any warranty as to the accuracy or completeness of such information. Any person placing reliance on the report to undertake trading does so entirely at his or her own risk and PCIPL does not accept any liability as a result. Securities and Derivatives markets may be subject to rapid and unexpected price movements and past performance is not necessarily an indication to future performance. This report does not have regard to the specific investment objectives, financial situation and the particular needs of any specific person who may receive this report. Investors must undertake independent analysis with their own legal, tax and financial advisors and reach their own regarding the appropriateness of investing in any securities or investment strategies discussed or recommended in this report and should understand that statements regarding future prospects may not be realized. In no circumstances it be used or considered as an offer to sell or a solicitation of any offer to buy or sell the Securities mentioned in it. The information contained in the research reports may have been taken from trade and statistical services and other sources, which we believe are reliable. PhillipCapital (India) Pvt. Ltd. or any of its group/associate/affiliate companies do not guarantee that such information is accurate or complete and it should not be relied upon as such. Any opinions expressed reflect judgments at this date and are subject to change without notice Important: These disclosures and disclaimers must be read in conjunction with the research report of which it forms part. Receipt and use of the research report is subject to all aspects of these disclosures and disclaimers. Additional information about the issuers and securities discussed in this research report is available on request. Certifications: The research analyst(s) who prepared this research report hereby certifies that the views expressed in this research report accurately reflect the research analyst’s personal views about all of the subject issuers and/or securities, that the analyst have no known conflict of interest and no part of the research analyst’s compensation was, is or will be, directly or indirectly, related to the specific views or recommendations contained in this research report. The Research Analyst certifies that he /she or his / her family members does not own the stock(s) covered in this research report. Independence: PhillipCapital (India) Pvt. Ltd. has not had an investment banking relationship with, and has not received any compensation for investment banking services from, the subject issuers in the past twelve (12) months, and PhillipCapital (India) Pvt. Ltd does not anticipate receiving or intend to seek compensation for investment banking services from the subject issuers in the next three (3) months. PhillipCapital (India) Pvt. Ltd is not a market maker in the securities mentioned in this research report, although it or its affiliates may hold either long or short positions in such securities. PhillipCapital (India) Pvt. Ltd does not hold more than 1% of the shares of the company(ies) covered in this report. Suitability and Risks: This research report is for informational purposes only and is not tailored to the specific investment objectives, financial situation or particular requirements of any individual recipient hereof. Certain securities may give rise to substantial risks and may not be suitable for certain investors. Each investor must make its own determination as to the appropriateness of any securities referred to in this research report based upon the legal, tax and accounting considerations applicable to such investor and its own investment objectives or strategy, its financial situation and its investing experience. The value of any security may be positively or adversely affected by changes in foreign exchange or interest rates, as well as by other financial, economic or political factors. Past performance is not necessarily indicative of future performance or results. Sources, Completeness and Accuracy: The material herein is based upon information obtained from sources that PCIPL and the research analyst believe to be reliable, but neither PCIPL nor the research analyst represents or guarantees that the information contained herein is accurate or complete and it should not be relied upon as such. Opinions expressed herein are current opinions as of the date appearing on this material and are subject to change without notice.Furthermore, PCIPL is under no obligation to update or keep the information current. Copyright: The copyright in this research report belongs exclusively to PCIPL. All rights are reserved. Any unauthorized use or disclosure is prohibited. No reprinting or reproduction, in whole or in part, is permitted without the PCIPL’s prior consent, except that a recipient may reprint it for internal circulation only and only if it is reprinted in its entirety. Caution: Risk of loss in trading in can be substantial. You should carefully consider whether trading is appropriate for you in light of your experience, objectives, financial resources and other relevant circumstances. PhillipCapital (India) Pvt. Ltd. 2nd Floor, C‐Block, Modern Centre, Mahalaxmi, Mumbai ‐ 400011