Holt McDougal Algebra 2 Sampling Distributions Holt Algebra 2 Warm Up Warm Up Lesson Presentation...
22
Holt McDougal Algebra 2 Sampling Distributions Sampling Distributions Holt Algebra 2 Warm Up Warm Up Lesson Presentation Lesson Presentation Lesson Quiz Lesson Quiz Holt McDougal Algebra 2
-
Upload
brett-jacobs -
Category
Documents
-
view
281 -
download
6
Transcript of Holt McDougal Algebra 2 Sampling Distributions Holt Algebra 2 Warm Up Warm Up Lesson Presentation...
Holt McDougal Algebra 2
Sampling DistributionsSampling Distributions
Holt Algebra 2
Warm UpWarm Up
Lesson PresentationLesson Presentation
Lesson QuizLesson Quiz
Holt McDougal Algebra 2
Holt McDougal Algebra 2
Sampling Distributions
Warm Up
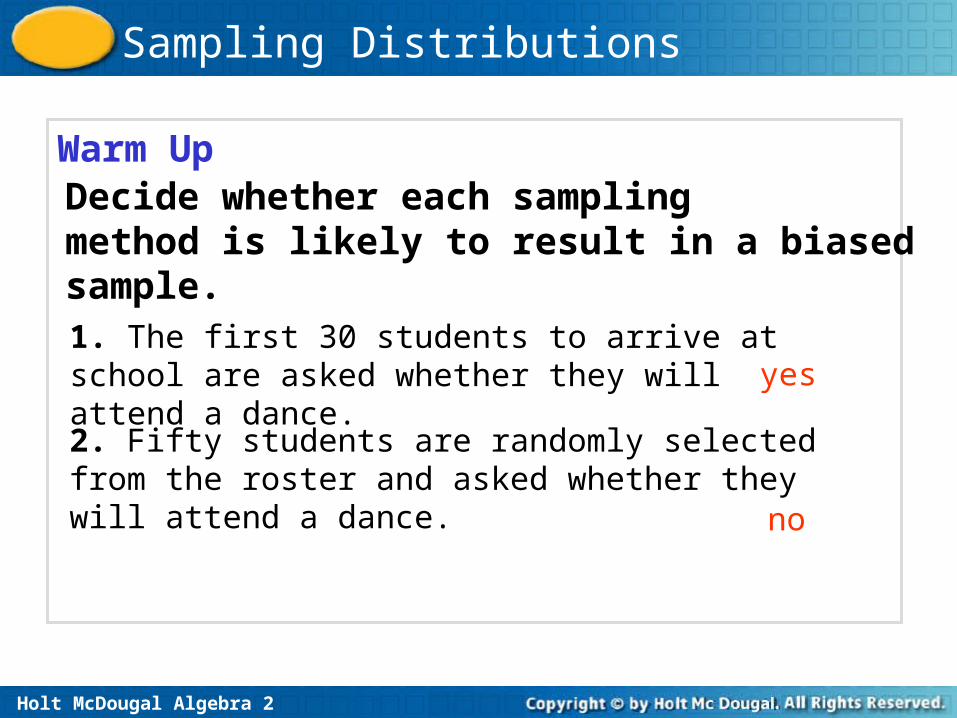
Decide whether each samplingmethod is likely to result in a biased sample.1. The first 30 students to arrive at school are asked whether they will attend a dance. yes
2. Fifty students are randomly selected from the roster and asked whether they will attend a dance. no
Holt McDougal Algebra 2
Sampling Distributions
Warm Up : Continued
no
A café owner wants to know how many people in the area would come for Sunday brunch. She asks 20 customers that come for dinner on a Sunday.
3. Is the sample likely to be representative of the population?
Holt McDougal Algebra 2
Sampling Distributions
Estimate population means and proportions and develop margin of error from simulations involving random sampling. Analyze surveys, experiments, and observational studies to judge the validity of the conclusion.
Objectives

Holt McDougal Algebra 2
Sampling Distributions
simple random samplesystematic samplestratified samplecluster sampleconvenience sampleself-selected sampleprobability samplemargin of error
Vocabulary

Holt McDougal Algebra 2
Sampling Distributions
When a survey is used to gather data, it is important to consider how the sample is selected for the survey. If the sampling method is biased, the survey will not accurately reflect the population.
Most national polls that are reported in the news are conducted using careful sampling methods in order to minimize bias.

Holt McDougal Algebra 2
Sampling Distributions
Other polls, such as those where people phone in to express their opinion, are not usually reliable as a reflection of the general population
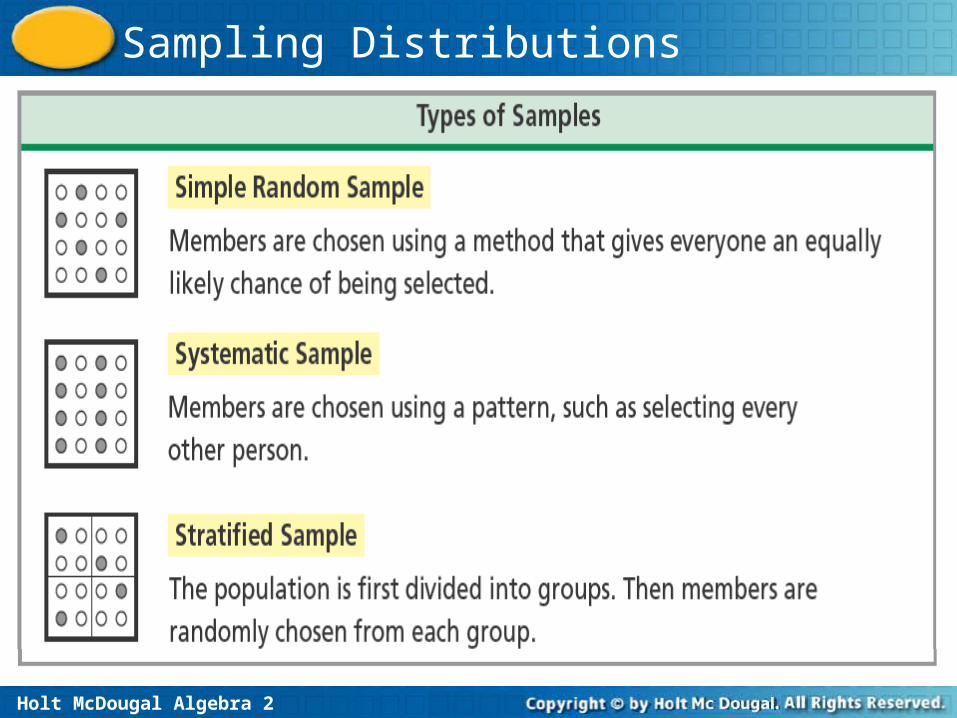
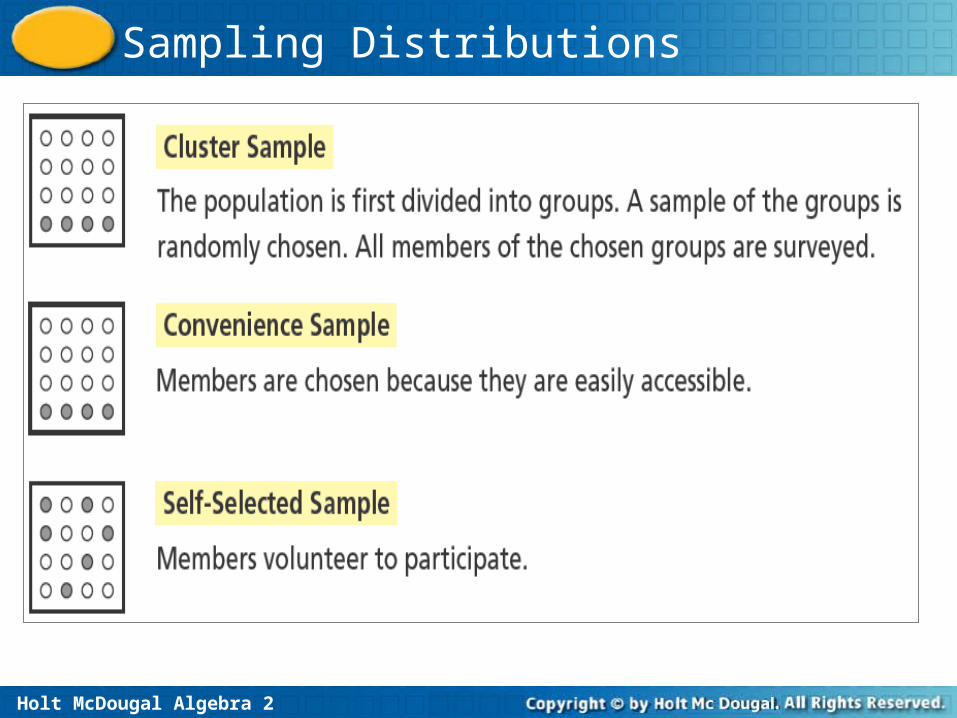
Remember that a random sample is one that involves chance. Six different types of samples are shown below.
Holt McDougal Algebra 2
Sampling Distributions
Holt McDougal Algebra 2
Sampling Distributions
Holt McDougal Algebra 2
Sampling DistributionsExample 1:Classifying a Sample
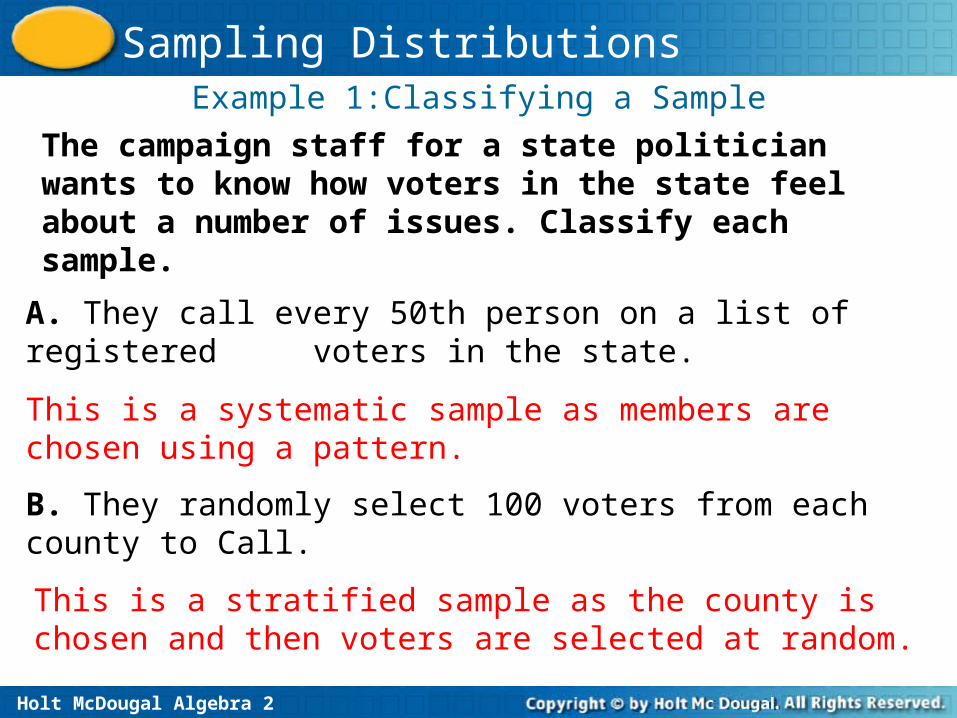
A. They call every 50th person on a list of registered voters in the state.
B. They randomly select 100 voters from each county to Call.
The campaign staff for a state politician wants to know how voters in the state feel about a number of issues. Classify each sample.
This is a stratified sample as the county is chosen and then voters are selected at random.
This is a systematic sample as members are chosen using a pattern.
Holt McDougal Algebra 2
Sampling DistributionsExample 1:Classifying a Sample continued
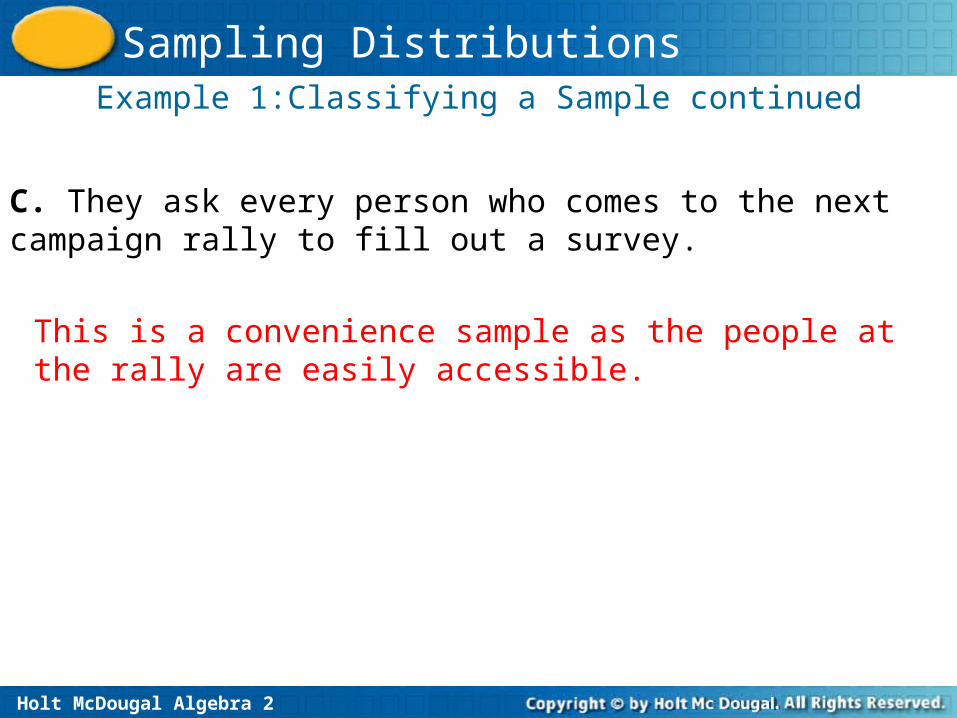
C. They ask every person who comes to the next campaign rally to fill out a survey.
This is a convenience sample as the people at the rally are easily accessible.
Holt McDougal Algebra 2
Sampling Distributions
Check It Out! Example 1
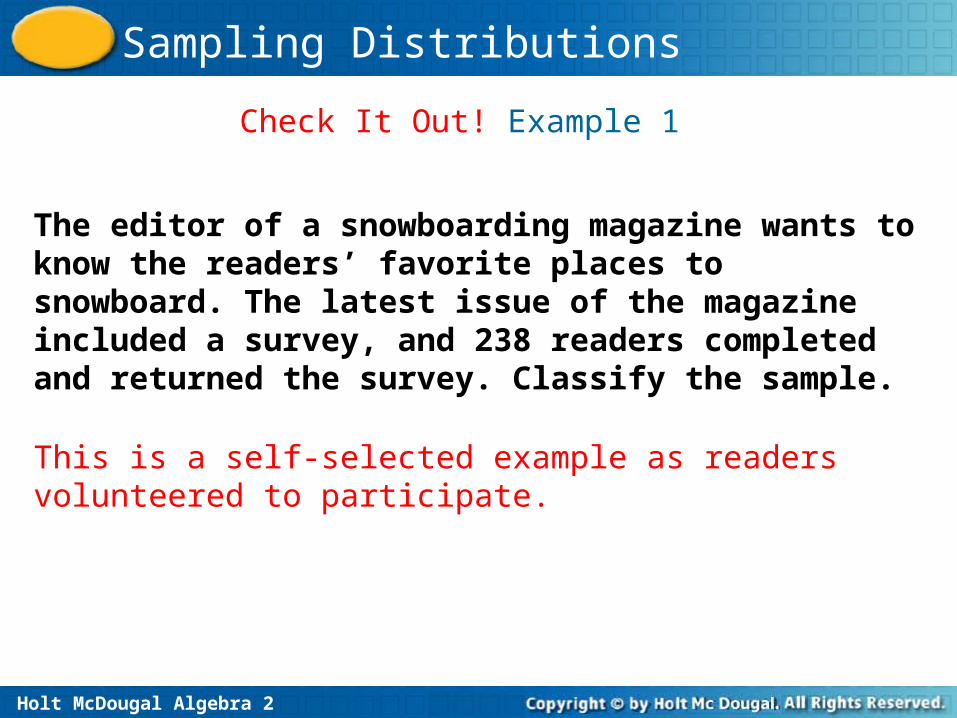
The editor of a snowboarding magazine wants to know the readers’ favorite places to snowboard. The latest issue of the magazine included a survey, and 238 readers completed and returned the survey. Classify the sample.
This is a self-selected example as readers volunteered to participate.
Holt McDougal Algebra 2
Sampling Distributions
A probability sample is a sample where every member of the population being sampled has a nonzero probability of being selected. Simple random samples, stratified samples, and cluster samples are all examples of probability sampling.
Holt McDougal Algebra 2
Sampling DistributionsExample 2: Evaluating Sampling Methods
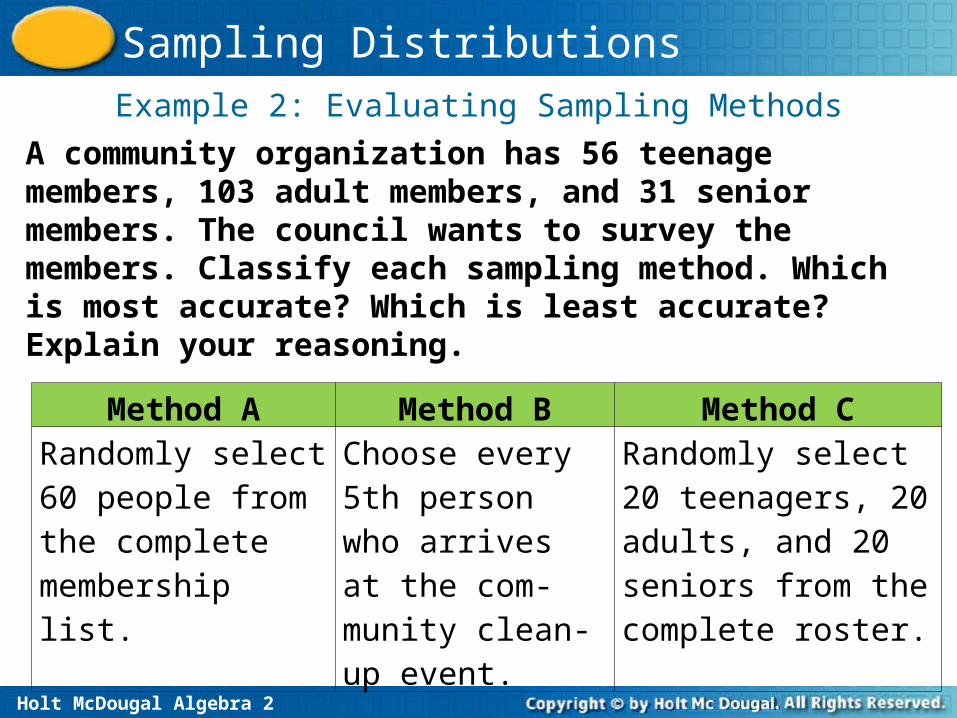
A community organization has 56 teenage members, 103 adult members, and 31 senior members. The council wants to survey the members. Classify each sampling method. Which is most accurate? Which is least accurate? Explain your reasoning.
Method A Method B Method CRandomly select 60 people from the complete membership list.
Choose every 5th person who arrives at the com-munity clean-up event.
Randomly select 20 teenagers, 20 adults, and 20 seniors from the complete roster.
Holt McDougal Algebra 2
Sampling DistributionsExample 2:Continued
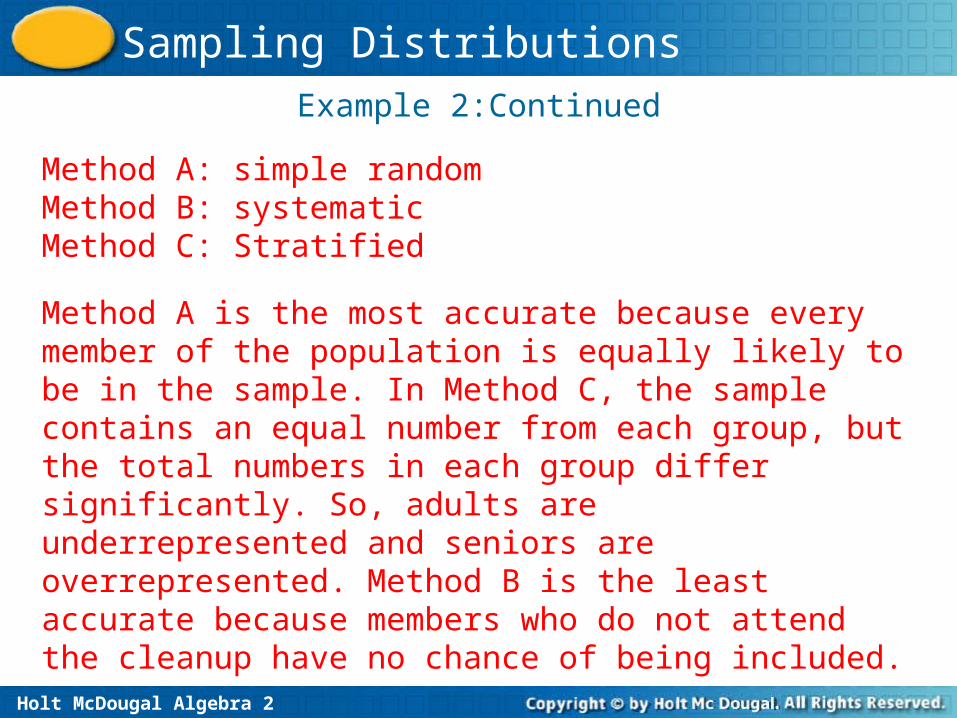
Method A is the most accurate because every member of the population is equally likely to be in the sample. In Method C, the sample contains an equal number from each group, but the total numbers in each group differ significantly. So, adults are underrepresented and seniors are overrepresented. Method B is the least accurate because members who do not attend the cleanup have no chance of being included.
Method A: simple randomMethod B: systematicMethod C: Stratified
Holt McDougal Algebra 2
Sampling DistributionsCheck It Out! Example 2
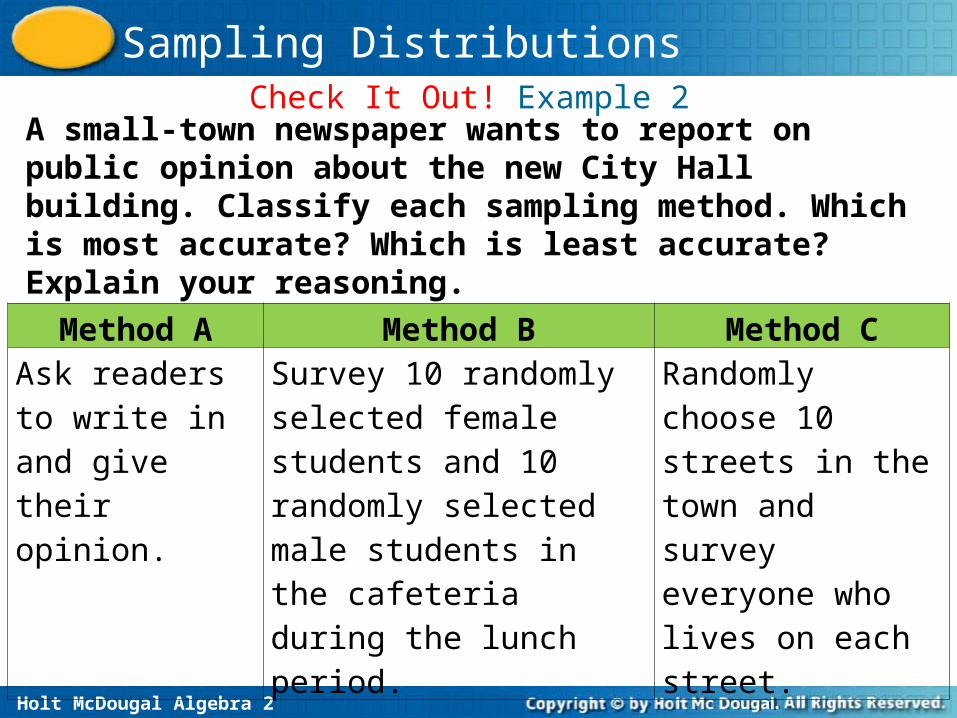
A small-town newspaper wants to report on public opinion about the new City Hall building. Classify each sampling method. Which is most accurate? Which is least accurate? Explain your reasoning.
Method A Method B Method CAsk readers to write in and give their opinion.
Survey 10 randomly selected female students and 10 randomly selected male students in the cafeteria during the lunch period.
Randomly choose 10 streets in the town and survey everyone who lives on each street.
Holt McDougal Algebra 2
Sampling DistributionsCheck It Out! Example 2 continued
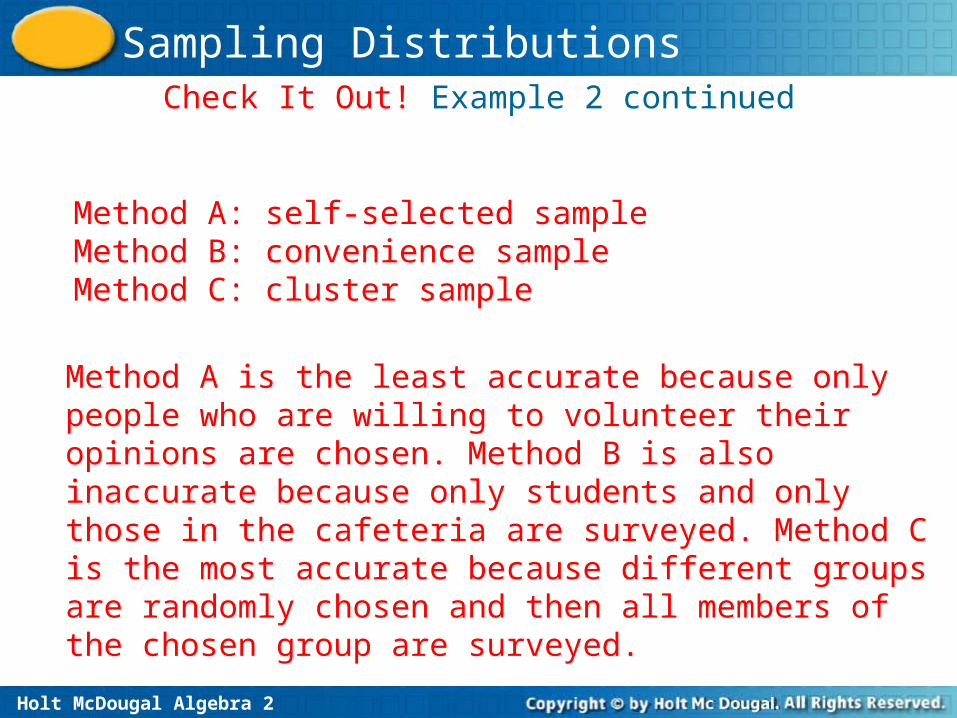
Method A is the least accurate because only people who are willing to volunteer their opinions are chosen. Method B is also inaccurate because only students and only those in the cafeteria are surveyed. Method C is the most accurate because different groups are randomly chosen and then all members of the chosen group are surveyed.
Method A: self-selected sample Method B: convenience sampleMethod C: cluster sample
Holt McDougal Algebra 2
Sampling Distributions
The margin of error of a random sample defines an interval, centered on the sample percent, in which the population percent is most likely to lie
Holt McDougal Algebra 2
Sampling DistributionsExample 3: Interpreting a Margin of Error
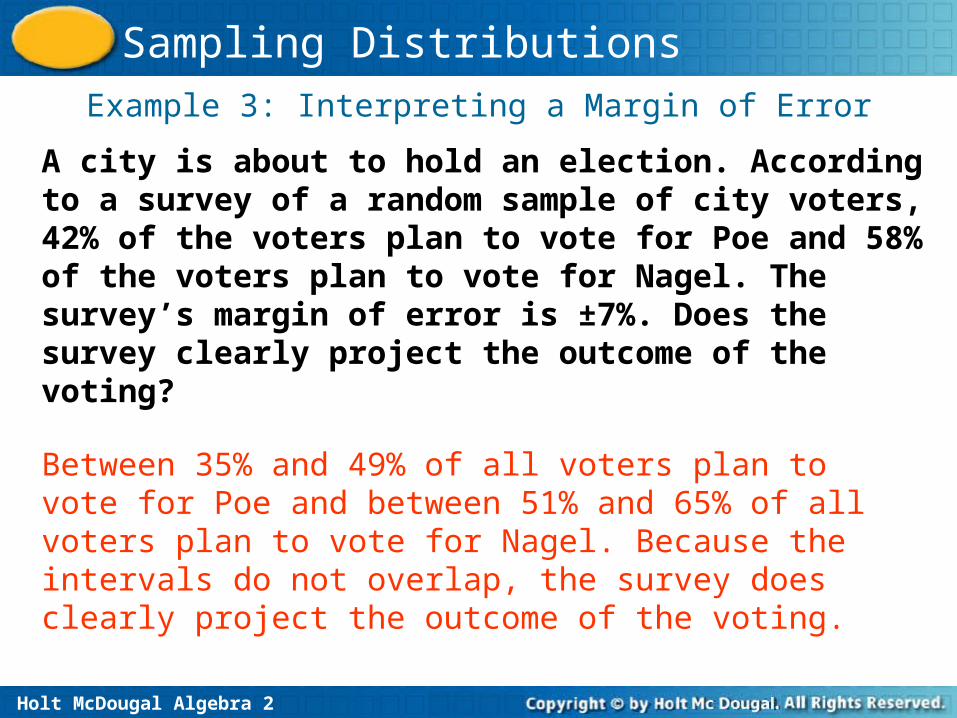
Between 35% and 49% of all voters plan to vote for Poe and between 51% and 65% of all voters plan to vote for Nagel. Because the intervals do not overlap, the survey does clearly project the outcome of the voting.
A city is about to hold an election. According to a survey of a random sample of city voters, 42% of the voters plan to vote for Poe and 58% of the voters plan to vote for Nagel. The survey’s margin of error is ±7%. Does the survey clearly project the outcome of the voting?
Holt McDougal Algebra 2
Sampling DistributionsCheck It Out! Example 3
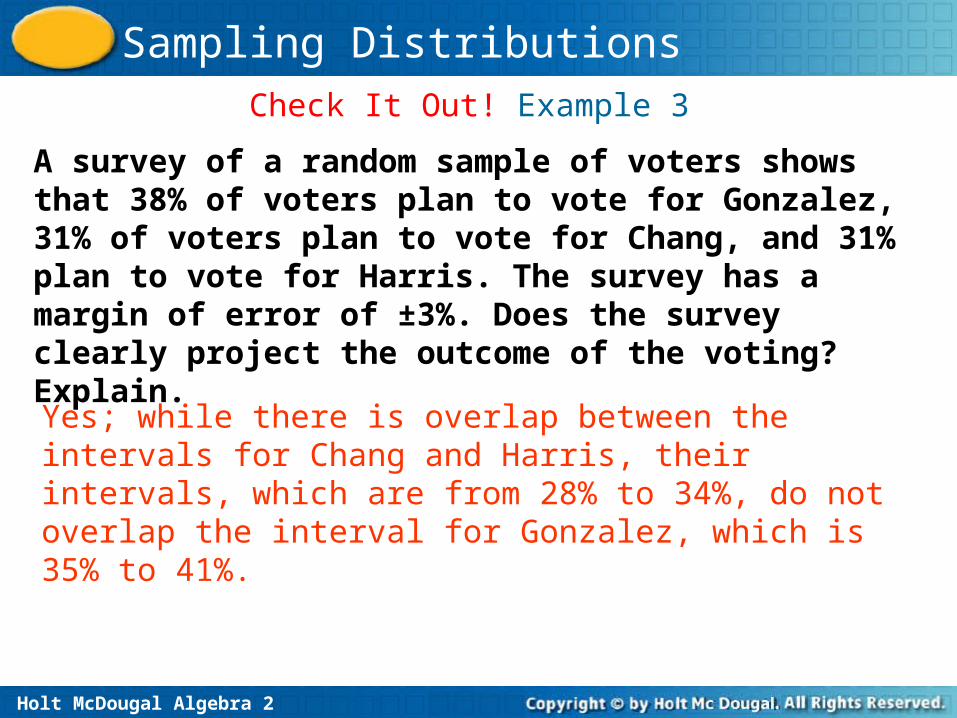
A survey of a random sample of voters shows that 38% of voters plan to vote for Gonzalez, 31% of voters plan to vote for Chang, and 31% plan to vote for Harris. The survey has a margin of error of ±3%. Does the survey clearly project the outcome of the voting? Explain.
Yes; while there is overlap between the intervals for Chang and Harris, their intervals, which are from 28% to 34%, do not overlap the interval for Gonzalez, which is 35% to 41%.
Holt McDougal Algebra 2
Sampling DistributionsLesson Quiz: Part I
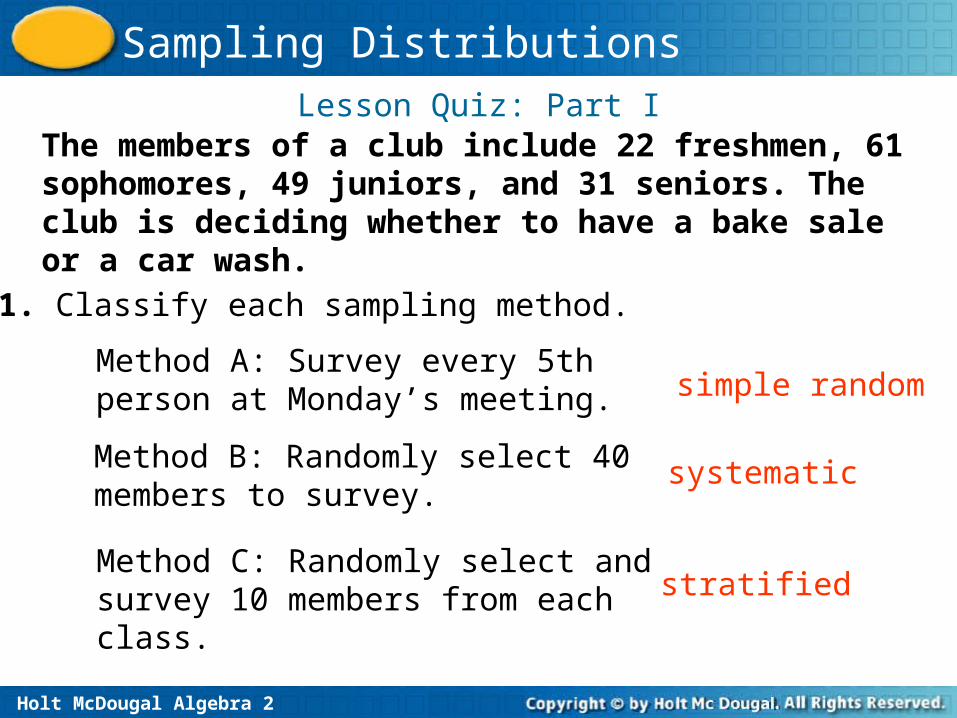
The members of a club include 22 freshmen, 61 sophomores, 49 juniors, and 31 seniors. The club is deciding whether to have a bake sale or a car wash.1. Classify each sampling method.
simple randomMethod A: Survey every 5thperson at Monday’s meeting.
Method B: Randomly select 40members to survey.
systematic
Method C: Randomly select andsurvey 10 members from eachclass.
stratified
Holt McDougal Algebra 2
Sampling DistributionsLesson Quiz: Part II
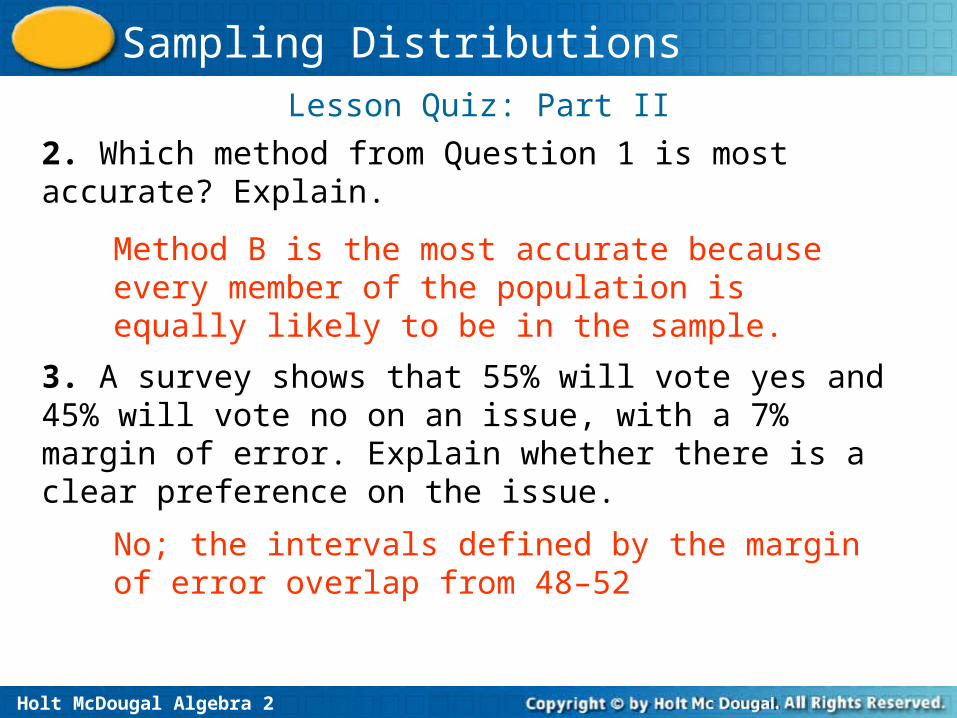
2. Which method from Question 1 is most accurate? Explain.
Method B is the most accurate because every member of the population is equally likely to be in the sample.
3. A survey shows that 55% will vote yes and 45% will vote no on an issue, with a 7% margin of error. Explain whether there is a clear preference on the issue.
No; the intervals defined by the margin of error overlap from 48–52