Holt Algebra 2 2-3 Graphing Linear Functions Determine whether a function is linear. Graph a linear...
42
Holt Algebra 2 2-3 Graphing Linear Functions Determine whether a function is linear. Graph a linear function given two points, a table, an equation, or a point and a slope. Objectives
-
Upload
mary-jenkins -
Category
Documents
-
view
214 -
download
0
Transcript of Holt Algebra 2 2-3 Graphing Linear Functions Determine whether a function is linear. Graph a linear...
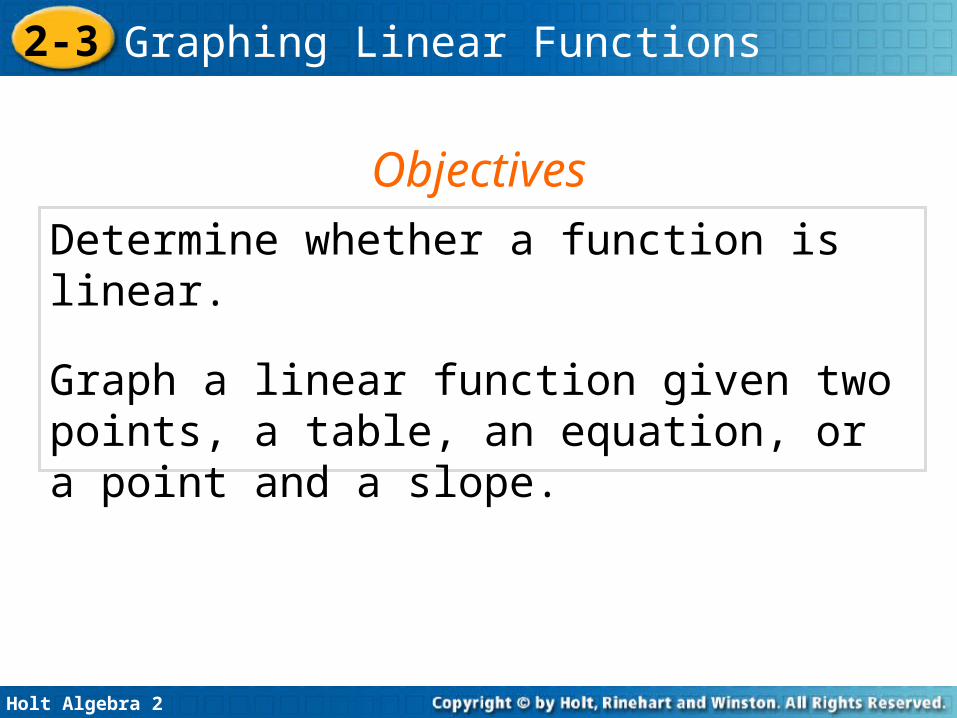
Holt Algebra 2
2-3 Graphing Linear Functions
Determine whether a function is linear.
Graph a linear function given two points, a table, an equation, or a point and a slope.
Objectives

Holt Algebra 2
2-3 Graphing Linear Functions
linear functionslopey-interceptx-interceptslope-intercept form
Vocabulary

Holt Algebra 2
2-3 Graphing Linear Functions
Meteorologists begin tracking a hurricane's distance from land when it is 350 miles off the coast of Florida and moving steadily inland.
The meteorologists are interested in the rate at which the hurricane is approaching land.

Holt Algebra 2
2-3 Graphing Linear Functions
Time (h) 0 1 2 3 4
Distance from Land (mi) 350 325 300 275 250
+1
–25
+1
–25
+1
–25
+1
–25
This rate can be expressed as .
Notice that the rate of change is constant. The hurricane moves 25 miles closer each hour.

Holt Algebra 2
2-3 Graphing Linear Functions
Functions with a constant rate of change are called linear functions. A linear function can be written in the form f(x) = mx + b, where x is the independent variable and m and b are constants. The graph of a linear function is a straight line made up of all points that satisfy y = f(x).

Holt Algebra 2
2-3 Graphing Linear Functions
Determine whether the data set could represent a linear function.
Example 1A: Recognizing Linear Functions
x –2 0 2 4
f(x) 2 1 0 –1
+2
–1
+2
–1
+2
–1
The rate of change, , is constant . So
the data set is linear.

Holt Algebra 2
2-3 Graphing Linear Functions
Determine whether the data set could represent a linear function.
Example 1B: Recognizing Linear Functions
x 2 3 4 5
f(x) 2 4 8 16
+1
+2
+1
+4
+1
+8
The rate of change, , is not constant.
2 ≠ 4 ≠ 8. So the data set is not linear.

Holt Algebra 2
2-3 Graphing Linear Functions
The constant rate of change for a linear
function is its slope. The slope of a linear
function is the ratio , or .
The slope of a line is the same between
any two points on the line. You can graph
lines by using the slope and a point.

Holt Algebra 2
2-3 Graphing Linear Functions
Example 2A: Graphing Lines Using Slope and a Point
Plot the point (–1, –3).
Graph the line with slope that passes through (–1, –3).
The slope indicates a rise of 5 and a run of 2. Move up 5 and right 2 to find another point.
Then draw a line through the points.

Holt Algebra 2
2-3 Graphing Linear Functions
Example 2B: Graphing Lines Using Slope and a Point
Plot the point (0, 2).
Graph the line with slope that passes through (0, 2).
You can move down 3 units and right 4 units, or move up 3 units and left 4 units.
The negative slope can be
viewed as
Holt Algebra 2
2-3 Graphing Linear Functions
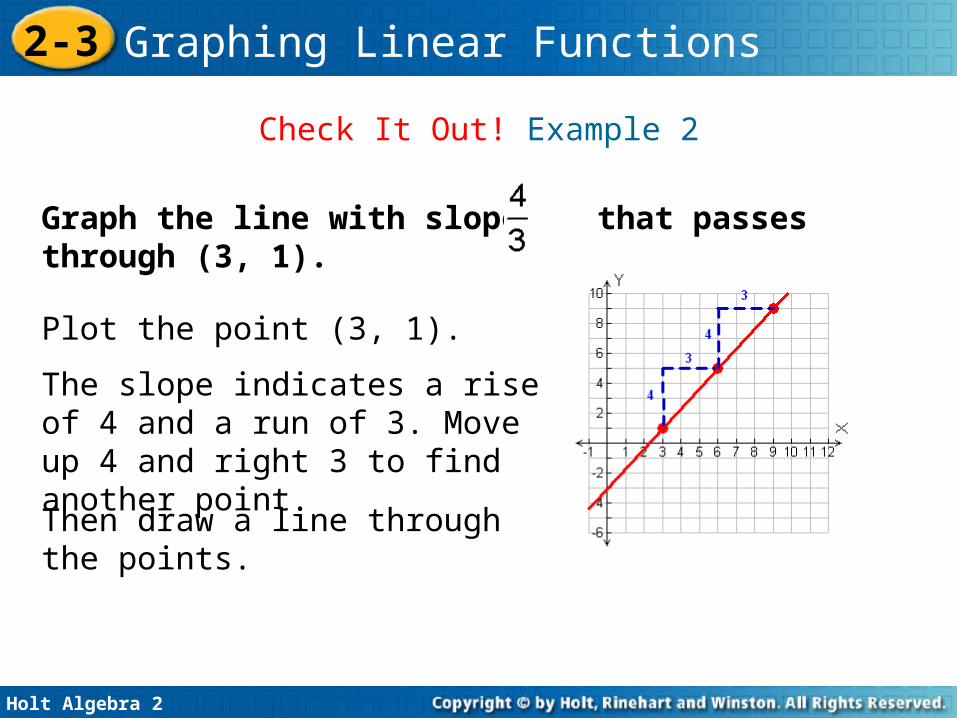
Check It Out! Example 2
Plot the point (3, 1).
The slope indicates a rise of 4 and a run of 3. Move up 4 and right 3 to find another point.
Then draw a line through the points.
Graph the line with slope that passes through (3, 1).

Holt Algebra 2
2-3 Graphing Linear Functions
Recall from geometry that two points determine a line. Often the easiest points to find are the points where a line crosses the axes.
The y-intercept is the y-coordinate of a point where the line crosses the x-axis.
The x-intercept is the x-coordinate of a point where the line crosses the y-axis.

Holt Algebra 2
2-3 Graphing Linear Functions
Example 3: Graphing Lines Using the Intercepts
Find the x-intercept: 4x – 2y = 16
Find the intercepts of 4x – 2y = 16, and graph the line.
4x – 2(0) = 16
Find the y-intercept: 4x – 2y = 16
4x = 16
x = 4
4(0) – 2y = 16
–2y = 16
y = –8
Substitute 0 for y.
The x-intercept is 4.
Substitute 0 for x.
The y-intercept is –8.
x-intercept
y-intercept

Holt Algebra 2
2-3 Graphing Linear Functions
Linear functions can also be expressed as linear equations of the form y = mx + b. When a linear function is written in the form y = mx + b, the function is said to be in slope-intercept form because m is the slope of the graph and b is the y-intercept. Notice that slope-intercept form is the equation solved for y.

Holt Algebra 2
2-3 Graphing Linear Functions
Example 4A: Graphing Functions in Slope-Intercept Form
Solve for y first.
Write the function –4x + y = –1 in slope-intercept form. Then graph the function.
–4x + y = –1
y = 4x – 1
Add 4x to both sides.+4x +4x
The line has y-intercept –1 and slope 4, which is . Plot the point (0, –1). Then move up 4 and right 1 to find other points.

Holt Algebra 2
2-3 Graphing Linear Functions
Example 4B: Graphing Functions in Slope-Intercept Form
Solve for y first.
Write the function in slope-intercept
form. Then graph the function.
Distribute.
The line has y-intercept 8 and slope . Plot the point (0, 8). Then move down 4 and right 3 to find other points.
Multiply both sides by

Holt Algebra 2
2-3 Graphing Linear Functions
An equation with only one variable can be represented by either a vertical or a horizontal line.
Holt Algebra 2
2-3 Graphing Linear Functions
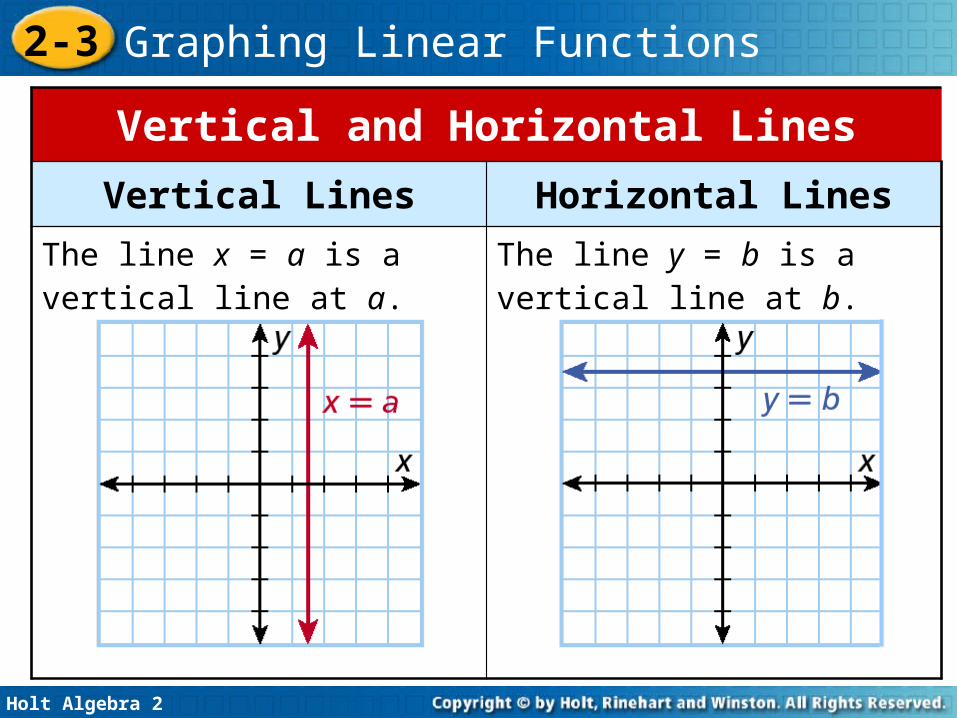
Vertical and Horizontal Lines
Vertical Lines Horizontal Lines
The line x = a is a vertical line at a.
The line y = b is a vertical line at b.

Holt Algebra 2
2-3 Graphing Linear Functions
The slope of a vertical line is undefined.
The slope of a horizontal line is zero.
Holt Algebra 2
2-3 Graphing Linear Functions
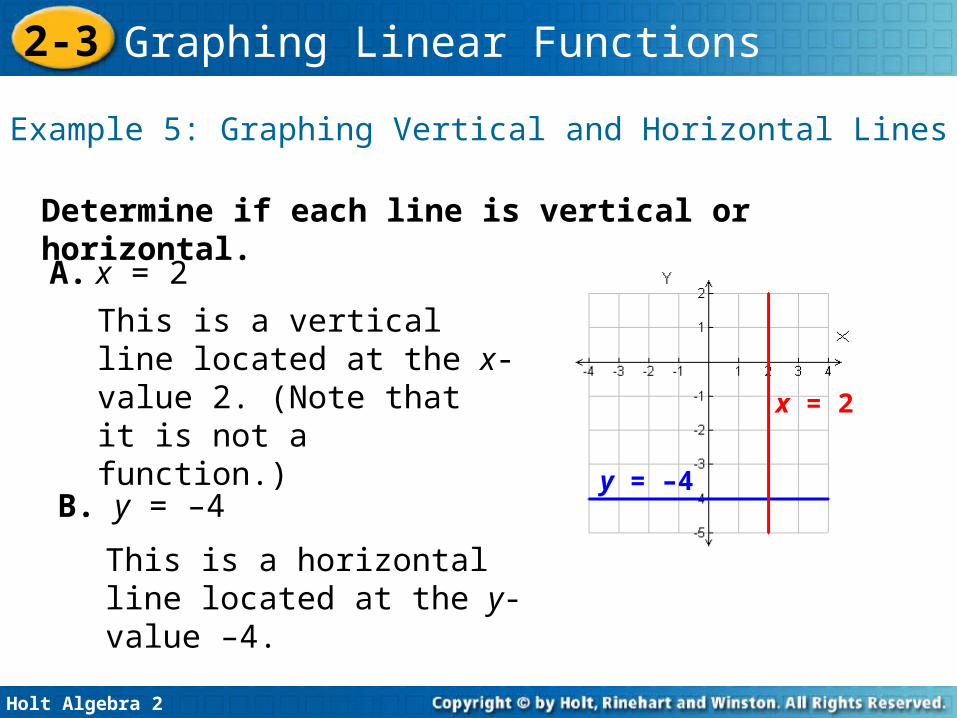
Example 5: Graphing Vertical and Horizontal Lines
Determine if each line is vertical or horizontal.
A. x = 2
B. y = –4
This is a vertical line located at the x-value 2. (Note that it is not a function.)
This is a horizontal line located at the y-value –4.
x = 2
y = –4

Holt Algebra 2
2-3 Graphing Linear Functions
Example 6: Application
A ski lift carries skiers from an altitude of 1800 feet to an altitude of 3000 feet over a horizontal distance of 2000 feet. Find the average slope of this part of the mountain. Graph the elevation against the distance.
Step 1 Find the slope.
The rise is 3000 – 1800, or 1200 ft.
The run is 2000 ft.
The slope is .
Step 2 Graph the line.The y-intercept is the original altitude, 1800 ft. Use (0, 1800) and (2000, 3000) as two points on the line. Select a scale for each axis that will fit the data, and graph the function.

Holt Algebra 2
2-3 Graphing Linear Functions
Use slope-intercept form and point-slope form to write linear functions.Write linear functions to solve problems.
Objectives
Holt Algebra 2
2-3 Graphing Linear Functions
Point-slope form
Vocabulary

Holt Algebra 2
2-3 Graphing Linear Functions
Example 1: Writing the Slope-Intercept Form of the Equation of a Line
Write the equation of the graphed line in slope-intercept form.
Step 1 Identify the y-intercept.
The y-intercept b is 1.
Holt Algebra 2
2-3 Graphing Linear Functions
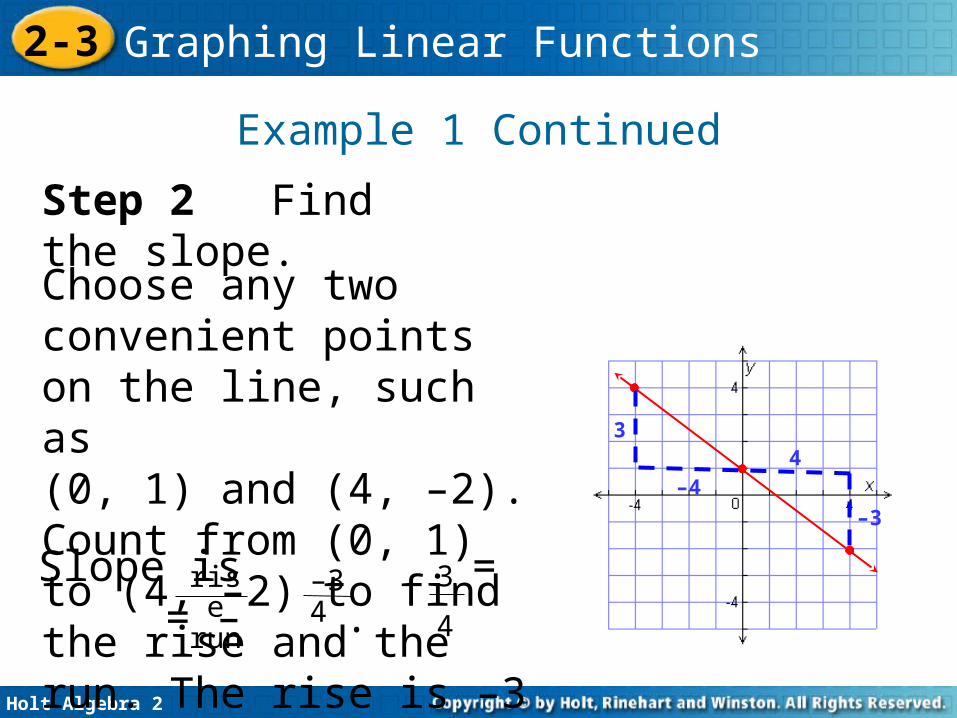
Example 1 Continued
Step 2 Find the slope.Choose any two convenient points on the line, such as (0, 1) and (4, –2). Count from (0, 1) to (4, –2) to find the rise and the run. The rise is –3 units and the run is 4 units.
Slope is = = – .
riserun
–34
3
4
3
–44
–3

Holt Algebra 2
2-3 Graphing Linear Functions
Example 1 Continued
Step 3 Write the equation in slope-intercept form.
y = mx + b 3
4y = – x + 1
m = – and b = 1. 3
4
The equation of the line is 3
4y = – x + 1.

Holt Algebra 2
2-3 Graphing Linear Functions
Notice that for two points on a line, the rise is the differences in the y-coordinates, and the run is the differences in the x-coordinates. Using this information, we can define the slope of a line by using a formula.

Holt Algebra 2
2-3 Graphing Linear Functions
Example 2A: Finding the Slope of a Line Given Two or More Points
Find the slope of the line through (–1, 1) and (2, –5).Let (x1, y1) be (–1, 1) and (x2, y2) be (2, –5).
Use the slope formula.
The slope of the line is –2.

Holt Algebra 2
2-3 Graphing Linear Functions
Example 2B: Finding the Slope of a Line Given Two or More Points
Find the slope of the line.x 4 8 12 16
y 2 5 8 11
Let (x1, y1) be (4, 2) and (x2, y2) be (8, 5). Choose any two points.
Use the slope formula.The slope of the line is
.34

Holt Algebra 2
2-3 Graphing Linear Functions
Find the slope of the line shown.Let (x1, y1) be (0,–2)
and (x2, y2) be (1, –
2).
The slope of the line is 0.
Example 2C: Finding the Slope of a Line Given Two or More Points

Holt Algebra 2
2-3 Graphing Linear Functions
Because the slope of line is constant, it is possible to use any point on a line and the slope of the line to write an equation of the line in point-slope form.
Holt Algebra 2
2-3 Graphing Linear Functions
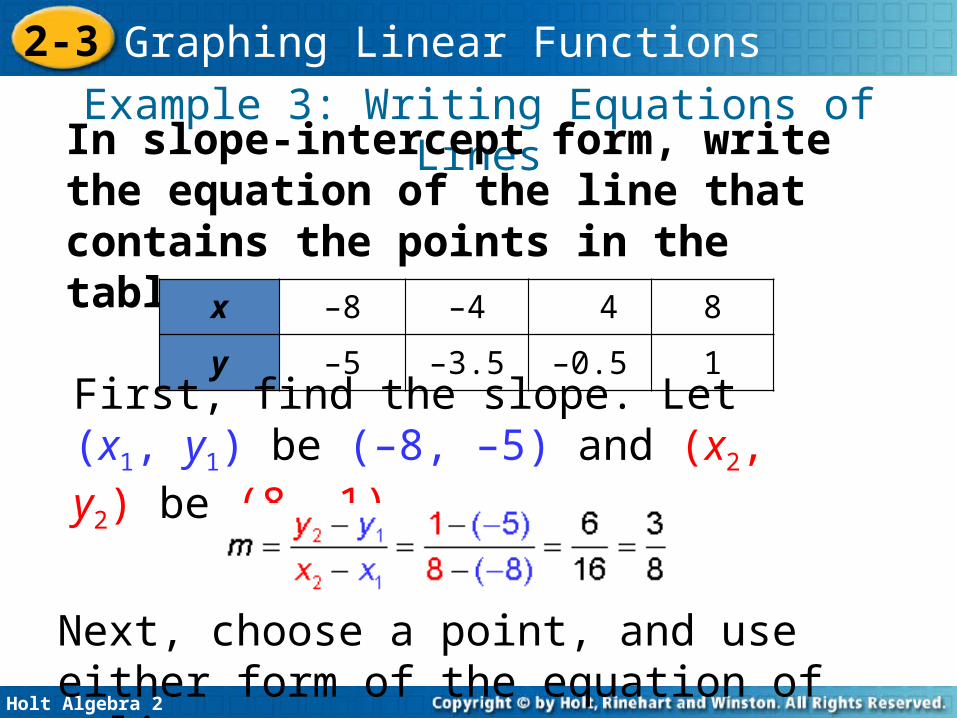
Example 3: Writing Equations of LinesIn slope-intercept form, write the equation of the line that contains the points in the table.
x –8 –4 4 8
y –5 –3.5 –0.5 1
First, find the slope. Let (x1, y1) be (–8, –5) and (x2, y2) be (8, 1).
Next, choose a point, and use either form of the equation of a line.

Holt Algebra 2
2-3 Graphing Linear Functions
Example 3 Continued
Method A Point-Slope Form Rewrite in slope-intercept form.
Substitute.
Simplify. Solve for y.
Distribute.
Using (8, 1):y – y1 = m(x – x1)
Holt Algebra 2
2-3 Graphing Linear Functions
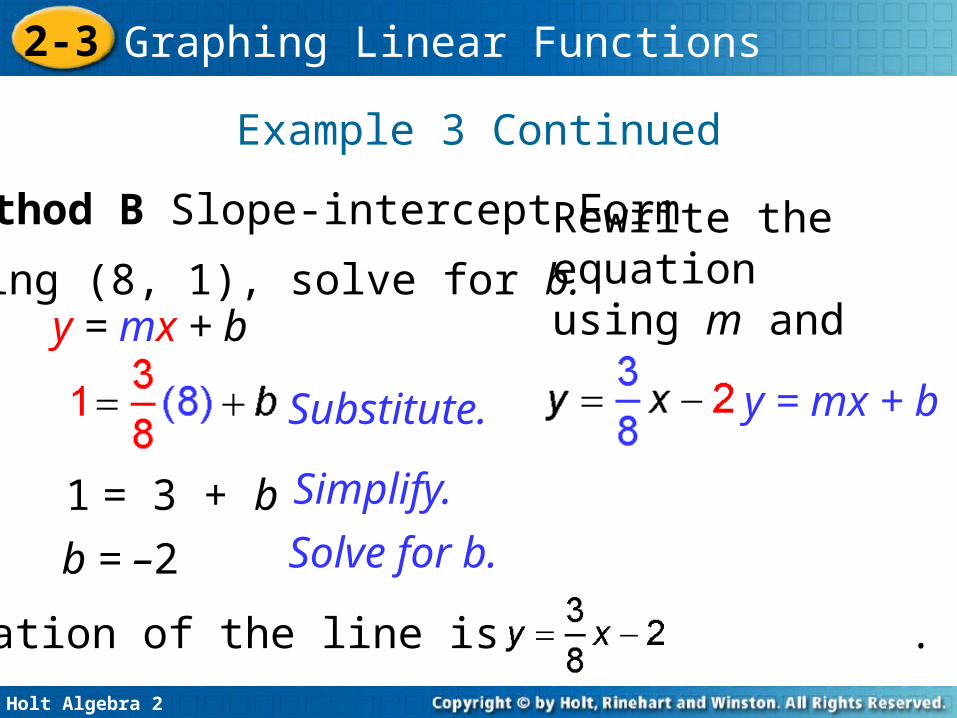
Method B Slope-intercept Form
Substitute.
Simplify.
Solve for b.
Rewrite the equation using m and b.
Using (8, 1), solve for b.
y = mx + b
b = –2
y = mx + b
1 = 3 + b
The equation of the line is .
Example 3 Continued

Holt Algebra 2
2-3 Graphing Linear Functions
Example 4A: Entertainment ApplicationThe table shows the rents and selling prices of properties from a game. Selling Price
($)Rent ($)
75 9
90 12
160 26
250 44
Express the rent as a function of the selling price.
Let x = selling price and y = rent.
Find the slope by choosing two points. Let (x1, y1) be (75, 9) and (x2, y2) be (90, 12).

Holt Algebra 2
2-3 Graphing Linear Functions
To find the equation for the rent function, use point-slope form.
Use the data in the first row of the table.
Simplify.
y – y1 = m(x – x1)
Example 4A Continued

Holt Algebra 2
2-3 Graphing Linear Functions
Example 4B: Entertainment ApplicationGraph the relationship between the selling price and the rent. How much is the rent for a property with a selling price of $230?To find the rent for a property, use the graph or substitute its selling price of $230 into the function.
Substitute.
The rent for the property is $40.
y = 46 – 6 y = 40

Holt Algebra 2
2-3 Graphing Linear Functions
By comparing slopes, you can determine if the lines are parallel or perpendicular. You can also write equations of lines that meet certain criteria.

Holt Algebra 2
2-3 Graphing Linear Functions

Holt Algebra 2
2-3 Graphing Linear Functions
Example 5A: Writing Equations of Parallel and Perpendicular Lines
Parallel lines have equal slopes. Use y – y1 = m(x – x1) with (x1, y1) = (5, 2).Distributive property.Simplify.
m = 1.8y – 2 = 1.8(x
– 5)y – 2 = 1.8x – 9 y = 1.8x – 7
Write the equation of the line in slope-intercept form.parallel to y = 1.8x + 3 and through (5, 2)

Holt Algebra 2
2-3 Graphing Linear Functions
Example 5B: Writing Equations of Parallel and Perpendicular Lines
Distributive property.
Simplify.
Use y – y1 = m(x – x1). y + 2 is equivalent to y – (–2).
Write the equation of the line in slope-intercept form.
perpendicular to and through (9, –2) The slope of the given line is , so the slope of
the perpendicular line is the opposite reciprocal, .