HMS Group 6m 2012 resultsgrouphms.com/upload/grouphms/pdf/Roadshow_12m.pdfHMS at a Glance 4 HMS...
45
HMS Group Investor Presentation, Non-Deal Road-show May, 2013
Transcript of HMS Group 6m 2012 resultsgrouphms.com/upload/grouphms/pdf/Roadshow_12m.pdfHMS at a Glance 4 HMS...

HMS Group
Investor Presentation, Non-Deal Road-show
May, 2013

Agenda
2
WHO WE ARE 3
HMS at a Glance 4
Unique business model 5
INVESTMENT HIGHLIGHTS 6
1. Supportive Industry Fundamentals 7
2. The Leading Provider of Flow Control Solutions 8
2.1 New Milestone projects in the O&G sector 9
3. Focus on Value-added Integrated Solutions 10
4. Operations on Protected Markets in Russia 11
5. Advanced R&D Capabilities 12
6. Well-established Top-tier Customer Base 13
7. Shareholders Run the Business 14
Key Investment Highlights 15
FINANCIAL PERFORMANCE 16
2012 FY Financial Highlights 17
Revenue & EBITDA by Segments 18
Compressor Business Segment 19
Cost analysis 20
Capex & Working Capital 21
Financial Position 22
STRATEGY & OUTLOOK 23
Achievements 2012: Strategy Update 24
Most of 2012 target contracts were signed 25
Backlog development: new record high 26
Selected End-Markets projects for mid-term 27
CONTACTS AND HMS GROUP KEY DETAILS 31
APPENDIX 32

WHO WE ARE
3

HMS at a Glance
4
HMS Group is the leading pump manufacturer and provider of flow control solutions and related services to oil and gas (~80% of revenue), nuclear and thermal power generation and water utility sectors in Russia and the CIS
19 operating facilities in Russia and the CIS with 6 research & development centres, one of the largest pump testing facilities
Growing markets driven by strong investments in oil & gas, power generation and water supply sectors
Unique integrated management, sales and R&D team
The story of resilient financial growth on the back of moderate debt position
Key financials for 2007-2012 Overview
Source: Company data
EPC Oil & gas equipment Industrial pumps
Pump station of the Baltic pipeline system,
Transneft
Example of Oil Pumping Station Oil Pump Station “Tayezhnaya”, Transneft
Design, engineering,
manufacturing, delivery and
installation of pumps and pump
related products
Manufacturing and installation of oil & gas equipment, including modular (pump stations, metering equipment, oil, gas and water processing and preparation units, tanks & vessels, etc.)
Project & design, oil&gas fields infrastructure construction, turn-key projects
Compressors
Twin modular compressor unit
since July 2012
Design, engineering,
manufacturing, delivery and
installation of compressors,
compressor packages and
compressor stations
50% Revenue 68% EBITDA
23% Revenue 22% EBITDA
22% Revenue 8% EBITDA
4% Revenue 1.4% EBITDA

Way of the market consolidator – from pumps to integrated solutions based on advanced R&D capabilities
Significant demand on the key market Leading installed base in Russia Exposure to key growth markets
CAPEX of Russian oil majors 2012-2020F of more than $50 bn Revenue breakdown by industries, 2012 Installed pumps and units
upstream
7%
9%
11%
9%
2% 2% 2%
-1%
1%2%
1%0% 0% 0%
1% 1%
0% 0% 0% 0%
0
100
200
300
400
500
600
2000 2002 2004 2006 2008 2010 2012F 2014F 2016F 2018F 2020F
mn
to
nn
es
Greenfield, 2009-2020F
Traditional oil regions, 2009-2020F
Total production, 2000-2008
Production growth, % YoY
2009–2012
Pump-based Integrated Solutions
2007–2008
Construction
2004–2006
Modular Equipment Design
&
Manufacturing
2003
Pump Design
&
Manufacturing
1993–2002
Pump Trading
Unique Business Model
5
Water Thermal energy midstream
Nuclear energy
Source: Company data Source: Company data Source: REnergyCo, Rosstat
2012 Revenue
Rub 33.7 bn
Pump- and Compressor-based Integrated Solutions
2012–Today
Oil industry
INVESTMENT HIGHLIGHTS
6

Modernization of basic industries, backed by state development programs leads to expenditure on equipment, including specialized pumps
Pumps for water injection, oil refineries and municipal water are expected to demonstrate the highest growth rate
Modest growth in surface pumps for oil and gas industry is largely explained by diminished growth in the segment of pumps for oil transportation due to the completion of major pipeline project (ESPO), after an explosive expansion over 2008-2012
Oil and gas equipment is expected to grow with double-digit rate driven by modernization of the current and development of new oilfields, increase of associated gas utilization ratio, installation of modern metering units
Compressors are expected to grow with CAGR of 16.6% thanks to a number of new pipelines development programs, increase of associated gas utilization ratio
CAGR 11.0%
4,768
1,395
CAGR 17.8%
Supportive Industry Fundamentals
7
4,393
2,727
Pump market revenues in Russia, US mln
Source: Frost & Sullivan research
1
2,137
CAGR 10,0%
1,581
784
O&G equipment market revenues, US mln
CAGR 6.3%
Comments
CAGR
2008-12
CAGR
2012-17E
O&G surface
includes:
Water injection -4,2% 13,6%
Oil transportation 59,5% -12,6%
Oil downstream 12,4% 15,6%
Municipal water -1,6% 16,5%
Power generation 15,0% 10,3%
Total 6,3% 10,0%
940
CAGR
2008-12
CAGR
2012-17E
Pump Stations 1,2% 11,0%
AGMUs 1,0% 10,8%
Associated Gas
Processing &
Transport Units 15,3% 12,2%
Total 4,6% 11,0%
2,215
CAGR
2008-12
CAGR
2012-17E
Oil & Gas
Production and
Transportation 14,4% 17,8%
Gas Processing 11,8% 13,2%
General Service 4,7% 11,4%
Refrigeration -8,1% 16,2%
Total 12,4% 16,6%
Compressor market revenues, US mln

1 575 2 128 2 193
865 1013 1314
2010 2011 2012
HMS Group revenue, Rub mln
Other players Revenue, Rub mln
2,748 2,785 2,664
1,301 1,813 2,009
2010 2011 2012
HMS Group revenue, Rub mln
Other players Revenue, Rub mln
7,395
12,601 14,504
10,057
13,931
15,374
2010 2011 2012
HMS Group revenue, Rub mln
Other players Revenue, Rub mln
Pumps and Oil & gas equipment
Oil and gas industry
The Leading Provider of Flow Control Solutions
Leading market share in key markets
HMS Group has leading positions in almost every key target markets, while over 2012 the Group managed to fruther expand its market share
The Group’s market share in the pumps and equipment for the oil & gas industry the remained flat, with overall growth on par with the market
In the pumps for water utilities and power generation applications, the Group’s managed to outperform market growth thanks to higher revenue from pumps for nuclear application (contracts signed in the previous years) and strong demand for water utilities pumps
Summary
2
Market growth +12% yoy
Source: Company data
Water utilities Power generation
Market growth +1% yoy
Market growth +12% yoy
HMS +11% yoy
HMS +11% yoy
HMS +30% yoy
Industrial pumps only Industrial pumps only
17,452
26,532
4,049 4,598
3,141 2,440
8
4,673
29,878
3,507

Source: Frost & Sullivan report 2009, Transneft website (www.transneft.ru)
Novorossiysk
Moscow
Unecha
Primorsk
Kozmino
Skovorodino
Verkhnechonskoye
Tengiz
Timano-Pechora basin
Caspian Pipeline Consortium expansion (35 MMt, 1,510 km)
Baltic Pipeline System-II (50 MMt, 1,000 km)
ESPO-I and ESPO-I capacity expansion (50 MMt, 2,694 km)
Russia
ESPO-II and ESPO-II capacity expansion (47 MMt, 2,046 km)
Talakanskoye
Purpe-Samotlor (25 MMt, 430 km)
Vankor
Salymskoye
Samotlor
Nizhnevartovsk
Priobskoye
Purpe
Tyamkinskoye
Russkoye
Taishet
Zapolyarnoye-Purpe (45 MMt, 536 km)
Syzran
Tikhoretsk-Tuapse 2 (12 MMt, 295 km)
Haryaga Yuzhny
Khylchuyu
Haryaga-Yuzhny Khylchuyu (8 MMt, 160 km)
Yurubcheno-Tokhomskoe
Yurubcheno-Tokhomskoe-Taishet (18 MMt, 600 km)
Tuapse
Tikhoretsk
Komsomolsky NPZ -port De-Kastry (9 MMt, 313 km)
Oil pipeline projects
Mature oil producing regions
Underdeveloped oil producing regions
Developing oil fields
HMS participation confirmed
Oil products pipeline projects
Komsomolsky NPZ
De-Kastri
“Yug” (South) (9 MMt, 1,465 km)
Komsomolsky NPZ -De-Kastry (n.d., 300 km)
New Milestone Projects in the Oil&Gas sector
Zapolyarnoye
> 3 bn tons of oil reserves to be
developed in the next several
years
Oil production development
> 10,000 km of pipelines to be constructed or
replaced
> 140 of pump stations to be constructed or
reconstructed
> 550 reservoirs with total capacity of almost 10
mln m3 to be reconstructed
Transneft investment program 2010-2017
Iraq
Significant installed base of HMS pumps from Soviet and post Soviet periods
Currently undertaking projects for Oil Ministry and BP
Export markets
26 oil refineries to be
reconstructed & modernized
Oil refining development
9
Trebs & Titov (140 MMt, 2,151 km)
Prirazlomnoye
Taas-Yuryakh
Verkhne-Shapshinskoe
Oil & gas production and oil transportation

Stronger share of integrated solutions in revenue
Focus on Value-added Integrated Solutions
Source: Company data
Advanced R&D is the basis for value-added integrated solutions
10
Standard equipment Integrated solutions & customized pumps
Size Numerous small-size contracts Single large-scale project
Impact of R&D Medium Critical
Technical entry-barriers Medium High
Competition type Price R&D and references
Competition level High Limited
Revenue growth potential Limited High
Revenue downside potential Limited Visibility for at least 1.5 years
Repeat business Very significant Possible
Aftermarket demand Average High
EBITDA margin 10-15% 25-30%
3
Super-blocks X-9001, X-9004 for Vankor oilfield, Rosneft ESPO-1 oil transportation station, Transneft
Examples of successful integrated solutions
25%
30%
1. Project & design works 2. Project management 3. Production of key elements (pump units,
auxiliary equipment) 4. Assembling 5. Testing 6. Disassembling, transportation and
assembling on customer site 7. Supervision, start-up and commissioning 8. Aftermarket services

Industry HMS IGSS Eurasia
Drilling Weir
Flow
serve
Dresser
Rand Sulzer KSB Grundfos Technip Shlumberger
Baker
Hughes
Gea
Grasso
Above
ground
Pum
ps Power generation
Oil and Gas
Water
Oil
&
gas
equip
-
ment Equipment
Repair
EP
C
Project & design
Construction
Com
pre
sso
r
s
Oil up and
midstream
Natural gas
Metals and mining
Under
ground
Serv
ice
Seismic research
Well service
Drilling
Oil product
increase
Operations on Protected Markets in Russia
Source: Company data
4
11
Where we compete…
Russian International
Limited R&D
Small scale of operations
Pump manufacturing is a non-core business for many players (Votkinsk Plant, Uralhydromash, Katasky Plant)
Products are often not in direct competition with HMS product line
Not well-positioned in terms of operational efficiency due to limited scale of operations
No single competitor in all key segments
Global players Lack of local engineering expertise (Weir, KSB, Sulzer, Grundfos, Flowserve)
Lack of references with Russian clients
Not well-positioned in terms of price of products
Chinese players Lack of relevant technologies to produce customized pumps
Lack of references
Inapplicable for mission-critical applications
No brand names
No established relationships with Russian clients
Customized Equipment Standard Equipment
Russian players

Apollo Goessnitz (acquired in 2012) is a center of innovative technologies complying with API standards in pumps for off-shore and oil refinery applications
3. Foreign innovative centers
2. Project and design institutes
Leading project and design facility in Tyumen GTNG - OIL One of the leading Russian institute for water utilities Rostov Vodokanalproekt – WATER One of the leading Russian project and design institute for compressor technologies –
OIL&GAS
12
1. Research & development and engineering centres
Leading pump R&D centers in Russia and CIS: Design office in Livny: advanced R&D works focused on pumps Research Institute VNIIAEN in Sumy: focus on high-speed centrifugal pumps Specialized R&D center in Moscow focused on design of demanding complex
solutions for energy efficient pump systems Neftemash (Tyumen): oil and gas equipment and complex solutions for oil and gas
processing Kazankomressormash (Kazan): compressors and gas processing units with improved
efficiency for natural and associated gas
Tender, pricing and
contract negotiation
1–3 months
Design and production
1–24 months
Delivery and installation
1 month
After-market services
HMS ability to participate in pre-tender preparation stage creates unique competitive advantage
Pre-tender project
preparation
up to 24 months
Advanced R&D Capabilities 5

2011 Revenue
Rub 27.5 bn
2012 Revenue
Rub 33.7 bn
Well-diversified client base of 4,000-6,000 names, stable
growth of revenue coming from small-to-mid clients with
annual purchases below Rub 200 mn
Strong and stable base of “Blue-chip” clients, which includes
the largest oil & gas and energy companies in Russia
HMS Group may have different Top-3 customers for each
period, depending on the particular project mix
Prevailing installed base in the key segments ensures
recurring business growth
Source: Company data * Large client - a client that brings revenue more than Rub 200 mn per period
13
Well-established Top-tier Customer Base 6
Revenue contribution by clients*, 2011-2012 Comments
In 2012, HMS Group sold products and services to
more than 6,000 unique clients, including VOIC,
trade companies, dealers and individual
enterpreneurs

Vladimir Lukyanenko Non-executive Director
Shareholder In company since 2005
Artem Molchanov Managing Director (CEO)
Shareholder In company since 1993
Shareholders Run the Business
The Board is comprised of professionals with significant
experience in flow control and oil and gas industries
It includes founders, who has led HMS since its
inception
HMS is the core business of the largest shareholders
Dividend policy: pay out not less than 25% of profit for
the year
Source: Company data as of May 8, 2012
7
Board of Directors Comments
Shareholders Structure
Kirill Molchanov First Deputy CEO (CFO)
Shareholder In company since 1993
German Tsoy Chairman of the Board
Shareholder In company since 1993
Yury Skrynnik Head of Compressors Business
segment Shareholder
In company since 2005
Nikolay Yamburenko Head of Industrial Pumps
Shareholder In company since 2003
Philippe Delpal Independent
Chairman Audit Committee
Andreas Petrou Non-executive
Gary Yamamoto Independent
Chairman Remuneration Committee
14
Free-f loat28.5%
Vladimir Lukyanenko
27.4%
Managers24.4%
German Tsoy
19.8%
Through H.M.S. Technologies Ltd. (Cyprus)

Key Investment Highlights
15
Supportive Industry Fundamentals 1
The Leading Provide of Flow Control Solutions 2
Operating on Protected Markets in Russia 4
Advanced Research & Development Capabilities 5
Shareholders Run the Business 7
Well-established Top-tier Customer Base 6
Focus on Value-added Integrated Solutions 3

FINANCIAL PERFORMANCE
16

Key financials
4Q’11 4Q’12 chg, qoq 2011 2012 chg, yoy
6,935 10,093 +46% Revenue 27,496 33,656 +22%
2,055 3,279 +60% Gross profit 8,365 10,010 +20%
1,111 2,210 +99% EBITDA 1 5,509 6,231 +13%
665 1,465 +120% Operating profit 4,547 4,237 -7%
434 808 +86% Net income 1 3,377 2,301 -32%
6,408 13,410 +109% Total debt 6,408 13,410 +109%
4,809 12,064 +151% Net debt 2 4,809 12,064 +151%
0.9 1.9 Net debt to EBITDA 0.9 1.9
29.6% 32.5% +286 bps Gross margin 30.4% 29.7% -70 bps
16.0% 21.9% +588 bps EBITDA margin 1 20.0% 18.5% -152 bps
9.6% 14.5% +493 bps Operating margin 16.5% 12.6% -395 bps
6.3% 8.0% +175 bps Net income margin 12.3% 6.8% -544 bps
ROCE 3 32.4% 18.7%
ROE 4 40.9% 18.0%
1 268 1 588 1 545 1 265 1 111 1 367 1 103 1 551 2 210
18,4%
22,5% 22,7%
18,9%
16,0%
18,7%
14,5%
18,0%
21,9%
4Q'10 1Q'11 2Q'11 3Q'11 4Q'11 1Q'12 2Q'12 3Q'12 4Q'12
EBITDA, Rub mn EBITDA margin
Financial Highlights
Source: Company data 1 Hereinafter, read EBITDA as EBITDA adjusted, Net income as Profit for the period / year, EBITDA margin as EBITDA adjusted margin 2 Net debt = Total debt – Cash & cash equivalents 3 ROCE = EBIT LTM / average capital employed 4 ROE = total equity period average / profit for the year
17 Source: Company data
6 912 7 051 6 806 6 703 6 935 7 307 7 632 8 624 10 093
4Q'10 1Q'11 2Q'11 3Q'11 4Q'11 1Q'12 2Q'12 3Q'12 4Q'12
Revenue, Rub mn
Financial highlights, Rub mn

15,64617,066
4,399 4,278
28.1%
25.1%
2011 2012
Revenue Pumps, Rub mn EBITDA Pumps, Rub mn
EBITDA margin Pumps, %
Oil & gas equipment Pumps
Revenue & EBITDA by Segments
Source: Company data
Inflow of small and medium orders as well as a number of large-scale projects resulted in Pumps segment revenue growth
Smaller sales share of high-margin contracts lowered FY 2012 EBITDA and EBITDA margin
18
Revenue +9% EBITDA -3%
Revenue +33% EBITDA +101%
Revenue +23% EBITDA -16%
EPC Compressors
5,900
7,828
6971,397
11.8%17.8%
2011 2012
Revenue OG equipment, Rub mn EBITDA OG equipment, Rub mn
EBITDA margin OG equipment, %
Revenue grew by 33% and EBITDA by 101% compared to 2011, primarily driven by the Vankor project and consolidation of Sibneftemash, acquired in 2011
As a result, EBITDA margin reached 17.8% vs. 11.8% last year
New business segment for HMS Group. In July 2012, HMS Group acquired Kazankompressormash, consolidated in 2H 2012 financial results
Previously KKM hasn’t applied IFRS for it’s financial reporting, and that makes impossible to compare results on yoy basis
1,426
86
6.0%
2011 2012
Revenue Compressors, Rub mn EBITDA Compressors, Rub mn
EBITDA margin Compressors, %
5,946
7,336
563 475
9.5% 6.5%
2011 2012
Revenue EPC, Rub mn EBITDA EPC, Rub mn
EBITDA margin EPC, %
Revenue growth by 23% was driven by new contracts for oilfield infrastructure construction
EBITDA contraction by 16% yoy resulted in lower EBITDA margin, mainly because of GTNG’s margin drop and operating losses caused by challenges with the EPC project at the Srednebotuobinskoye oilfield

Financial results
Since the date of acquisition Revenue of Rub 1,426 mn and EBITDA of Rub 86 mn are included in HMS’ consolidated statement for FY 2012
Year-on-year and quarter-on-quarter comparison is not relevant as HMS applied IFRS accounting principles for KKM reporting since Q3 2012
Operating results
Signed 2 contracts totaled Rub 2 bn for compressor stations (integrated solutions)
Record high 2012 backlog of Rub 2.3 bn and expected strong inflow of new contracts for compressors and based on them integrated solutions
KKM: Half-year with HMS Group
Compressors business segment
19
Main factors of revenue and profitability growth in compressors segment
Acquisition of a compressor design center in April 2013
In April 2013, HMS acquired 61.75% of NIITurbokompressor
Integrated with KKM: the R&D center holds 15.77% of KKM
The largest applied center for compressor technology in Russia and the CIS: 35 testing units, 300 patents, 310 specialist where 3 with doctor degrees and 10 with PhD
80% of KKM’s innovative production is based on design documentation prepared by the institute
Client base consists of Russian major companies, including Gazprom, Lukoil, Rosneft, Sibur, Nizhnekamskneftekhim, NLMK, etc.
Annual revenue of the institute in 2012 was approx. Rub 290 mn
1. Capability to secure large contracts for compressor-based integrated solutions
Current status:
HMS has a strong track record with Russian majors
Contracts signed in August 2012, right following the acquisition of KKM
2. Competences in project & design of a compressor-based integrated solution
– Technical solutions, more profitable for a producer – Strong negotiation power towards suppliers
Current status:
The compressor design center acquired recently
3. Competences in large flow control project management
Current status:
ESPO, Vankor, Turkmenistan
All 3 factors, brought together, should lead to revenue and EBITDA growth in 2014

2011 2012 chg, yoy
Cost of sales 19,131 23,645 +24%
% of revenue 69.6% 70.3%
Supplies and raw materials 9,603 11,767 +23%
% of revenue 34.9% 35.0%
Labour costs 4,045 5,727 +42%
% of revenue 14.7% 17.0%
Cost of goods sold 2,714 2,222 -18%
% of revenue 9.9% 6.6%
Other expenses 2,770 3,930 +42%
% of revenue 10.1% 11.7%
G&A costs grew by 58% mainly due to: Labour costs growth driven by:
1. Rub 200 mn ESPO-linked bonuses paid to the staff related to the project execution (from key managers to sales, engineering and support personnel)
2. Labor related expenses of companies acquired in 2012 3. Planned increase of all personnel salaries
New initiatives in the corporate development – IT-systems unification and export infrastructure development.
G&A costs growth must be assessed together with order intake and backlog performance, which not only hit record high, but also became more diversified
Cost analysis
Source: Company data 20
Cost of sales grew 24% yoy, that is in line with Revenue
Supplies and raw materials up 23% yoy, in line with revenue growth
Labor costs grew by 42% yoy, mainly because of consolidation of acquired in 2012 companies
Increase in expenses, related to construction subcontractors as well as depreciation and amortization, influenced other expenses, resulted in their growth
Distribution and transportation costs grew by 16% in line with revenue
Distribution and transportation expenses hold less share in revenue, 3.7% vs. 3.9% in 2011
The company decreased transportation expenses by 11% yoy thanks to better logistics
Cost of sales Comments
2011 2012 chg, yoy
Distribution & transportation expenses 1,070 1,241 +16%
% of revenue 3.9% 3.7%
Transportation expenses 469 419 -11%
% of revenue 1.7% 1.2%
Labour costs 335 461 +38%
% of revenue 1.2% 1.4%
Insurance 35 36 +2%
% of revenue 0.1% 0.1%
Other expenses 231 325 +41%
% of revenue 0.8% 1.0%
Distribution & transportation expenses
2011 2012 chg, yoy
General & administrative expenses 2,525 3,977 +58%
% of revenue 9.2% 11.8%
Labour costs 1,616 2,619 +62%
% of revenue 5.9% 7.8%
Depreciation & amortization 142 179 +26%
% of revenue 0.5% 0.5%
Audit & consultancy services 133 140 +5%
% of revenue 0.5% 0.4%
Other expenses 633 1,039 +64%
% of revenue 2.3% 3.1%
General & administrative expenses

1 598
+5,725
-174
-2,368
3 184
-8,303
+4,864
1 346
Cash as of Jan 1, 2012
Operating cash flow
before WC changes
WC changes & others
Income tax & interest
paid
Net cash used in
operating activities
Net cash used in
investing activities
Net cash from
financing activities & some adj.
Cash as of Jan 1, 2013
Comments Working capital as of 1 Jan 2013, Rub mn
Cash flow performance in 2012, Rub mn Capital expenditures2 in 2012 vs. 2011
6 029
+2,181
+197 +50
-1,673
6 784
WC 2011 Inventories change
Receivables change & other adj.
Deposits change
Payables & other adj.
WC 2012
Operating cash flow before working capital changes increased to Rub 5.7 bn, compared to Rub 5.2 bn in 2011
Working capital1 amounted to 20% of total revenue, compared to 22% last year
Net working capital decrease led to cash inflow from operating activities of Rub 3.2 bn, compared to net cash outflow of Rub 1.6 bn last year
Organic capex increased to Rub 1.6 bn from Rub 1.2 bn last year, but Capex to D&A ratio decreased to 1.6x
Payments for acquisitions of KKM and Apollo, net of cash acquired, totaled Rub 6.7 bn
CAPEX & Working Capital
Source: Company data
Source: Company data
21
6%
28%
9M 2010 9M 2011
Working capital to Revenue LTM
20%
1 Working capital formals see slide 19 2 Capital expenditures here equals Organic capex = Purchase of PPE + Purchase of intangible assets
Source: Company data
+ +
=
Organic capex (1,623) Rub mn
M&A Capex (6,690) Rub mn
+
1 194 1 623 614 1 026
1,9x
1,6x
2011 2012
Organic capex, Rub mn Depreciation & amortization, Rub mn Capex to D&A ratio, x
6%
28%
9M 2010 9M 2011
Working capital to Revenue LTM
22%
6%
28%
9M 2010 9M 2011
Working capital to Revenue LTM
Working capital to revenue LTM

2 042 3 510 5 753 3 211 208 2 708
2013E 2014E 2015E 2016E 2017E
Debt to be repaid, Rub mn Undrawn credit lines, Rub mn
Short-term debt 13.5%
Net debt grew by 151% yoy, mainly because of HMS’ M&A activities. Also debt was used for working capital needs under execution of current projects
Net Debt to EBITDA LTM ratio reached 1.94x, but this level is much lower than banks’ covenants
Company constantly works on its debt, that led to steady repayment schedule with negligible currency risk and prudent maturity structure
Euro loan was raised to finance the acquisition of Apollo
Successful 10.75% 3-year and 10.1% 5-year Ruble bonds placements, which are cheaper than proposed loans from main Russian banks
Available liquidity of Rub 4.1 bn fully covers 2013E debt repayments
2012 Interest coverage ratio1 equals 3.5
9.4% average interest rate, as of 1 April 2013
In April 2013, Sberbank approved 3 unsecured revolving credit lines, where 2 of them refinance current Rub 2.5 bn credit lines, and 1 is a new Rub 0.7 bn line. HMS plans to sign credit contracts by June 2013
Currency and maturity risks are low Comments
Comfortable repayment schedule
Cash 1,377
S&P corporate credit rating : B+ Outlook: Stable Upgrade on 31 Jan 2013
22 Source: Company data as of 01 April, 2013
Financial position
Source: Company data Source: Company data as of 01 April, 2013
Maturity payment of 3 Rub bn bonds 03
Available liquidity 4.1 Rub bn
Maturity payment of 3 Rub bn bonds 02
Net debt to EBITDA ratio less than 2.00x
2 638 3 455 4 550 4 288 4 809 12 064
1,85
2,10
2,41
1,22
0,87
1,94
2007 2008 2009 2010 2011 2012
Net Debt, Rub mn Net Debt to EBITDA LTM ratio
Fixed rate 99.7%
Floating rate 0.3%
Long-term debt 86.5%
Credits in Rub 89.2%
Euro 8.4%
Others 2.5%

STRATEGY & OUTLOOK
23

Higher margin than stand-alone products and services HMS Group’s largest customers more often prefer to work
with manufacturers that can offer integrated and customized solutions
Creates strong ties with customers, pull-through demand for aftermarket services
Take advantage of positive market trends in existing core markets
Organic expansion into attractive market segments Increase of aftermarket services component to generate
higher-margin and regular cash flows Core export opportunities: water projects in Central Asia,
Rosatom nuclear contracts, O&G in Kazakhstan and Iraq
Leverage leading R&D capabilities in order to develop next-generation customized pumps, technological upgrades and integrated pump systems
Work closely with customers to develop technical policies and standards
Commitment to integration and optimization of current production assets and commitment to increase synergies between acquired businesses
Standardization and continuous improvement of operations and business processes (e.g. ERP, budgeting and reporting methodology and software development, etc.)
Our targets are technology and R&D facilities Pursue acquisition opportunities in high-growth sectors
where HMS has limited presence Search for cost and revenue synergies
Achievements 2012: strategy update
24
Focus on high value-added products
Strengthen position in core markets
Expand R&D capabilities
Improve operational efficiency
Pursue selective and value enhancing acquisitions
2012 EBITDA margin 18.5% on the back of 24%
share of integrated solutions in revenue New contracts for integrated solutions: Vankor
(second stage), ESPO-1 extension, 3 water stations in Turkmenistan, Nuclear contracts.
A number of new material contracts signed thanks to successful delivery on the previous stages, including the follow-up ESPO, Vankor, water stations in Turkmenistan, nuclear pumps for China Nuclear Energy Industry Corporation
Entrance into gas condensate and associated petroleum gas markets (project&design)
Entrance into compressor market
Continued working on new models of pumps and equipment, including high efficiency D-type pump, high-tech feed pump PA 1840-80, innovative measuring equipment Mera MFR, etc.
Start of KKM and Apollo integration Completed integration of Sibneftemash and
Bobruisk Continued Oracle HFM implementation; Continued Infor LN (ERP) installation
Acquisitions of Kazankompressormash: new promising compressor market
Acquisition of Apollo: obtaining a unique engineering expertise and strong product portfolio of pumps for oil refineries and off-shore applications
Strategic Goals Strategic Targets Development in 2012

Project Brief description
Rosneft
Vankor 2 stage Further development. Capex for 2011 US$ 2.6 bn
Yurubcheno-Tokhomsk oilfield Start of oil production in 2016. Oil reserves & resources 513mt
Komsomolskoe, Priobskoe oilfields Achievement of 95% level of associated gas utilization
Bashneft
Trebs and Titov fields JV with Lukoil. Project development stage. Reserves 141 mt. Start of production is expected in 2013. Max capacity 6 mtpa
Transneft
Tikhorestk-Tuapse-2 pipeline Increase of the oil volume delivered to the Tuapse oil refining plant. Length of 247 km and capacity of 12 mtpa. 2 OPSs to be reconstructed
ESPO expansion OPS to be constructed to deliver oil to Khabarovsk and Komsomolsk refineries
Zapolyarye – Pur-pe pipeline Oil transportation from YANAO and Northern Krasnoyarsk region to ESPO pipeline
Yurubcheno-Takhomskoe-Taishet pipeline Oil transportation from Yurubcheno-Tokhomsk and Kuyumbinsk oilfields to ESPO-1. Length ~703 km. Capacity ~15mtpa
TNK-BP
Russkoe oilfield Giant oilfield in YANAO with specific oil. Project production 20 mtpa
Samotlor Further development of an active oilfield in Nizhnevartovsk
Uvat 21 oilfields in Tyumen region
East- and Novo- Urengoy gas & condensate fields
Planned production for 2011 is 3.2bcm
Verkhnechonsk oilfield Oilfield located in the Eastern Siberia, Irkutsk region. Development was stimulated by close proximity of the ESPO pipeline
Gazprom
Shtokman gas and condensate field The field will become a resource base for Russian pipeline gas and liquefied natural gas (LNG) exports to the Atlantic Basin markets
Gazprom neft
Priobskoe oilfield Western Siberia. Recoverable reserves ~600 mt
Kuyumbinskoe oilfield 50/50 w TNK-BP thru Slavneft. Reserves C1 65 mt, C2 151 mt
Sberbank Capital
Dulisma oilfield Irkutsk region. Further development. 3rd resource base for ESPO
Taas-Yuriah oilfield Sakha region. Further development. Total reserves ~130 mt
Refineries Refineries located in Central and Privolzhskiy Federal district
Iraq
Rumaila brownfield Consortium headed by BP
Az Zubair Consortium headed by Eni
Water utilities
Central Asia Irrigation stations for Uzbekistan and Turkmenia
Nuclear
Rosatom Inflow of several contracts for delivery of pumps and pump equipment
CNEIC Pumps for 2 block of Chinese nuclear power plant (China Nuclear Energy Industry Corporation)
Most of 2012 target contracts were signed or won
Priorities for 2012 (filled pink)
25 Sources: Public information, Company’s data Prioritized projects
signed
signed
postponed
signed
signed
signed
signed
signed
postponed
signed
partially postponed

Backlog dynamics in 2010-2012
Backlog development: New Record High
Source: Company data, Management accounts
26
Order intake dynamics in 2010-2012
In Q1 2013, the Group added Rub 9.2 bn (vs. Rub 7.8 bn in Q1 2012, +17% yoy) of orders, mainly consisted of small and mid-size regular orders across different business segment
62 476 646
1 289 1 146 1 387
2 653
4 379 3 780 301
546 2 287
1 373
4 694
4 031
4 519
1 293
7 650
8 910 5 242
1 731 19 106
17 777
21 513
2010 2011 2012
ESPO pumps 8 910 5 242 1 731
Pumps excl ESPO 4 519 1 293 7 650
Oil & Gas equipment 1 373 4 694 4 031
Compressors 301 546 2 287
EPC: Construction 2 653 4 379 3 780
EPC: Project & Design 1 289 1 146 1 387
Others 62 476 646
Total 19 106 17 777 21 513
Total without ESPO 10 196 12 535 19 781
ESPO pumps: old 8 910 5 242 76
ESPO pumps: new 1 655
1 637 611
1 955
1 366 2 198
2 086
2 637
5 533
5 450
450
2 361
3 897
7 832
8 135
7 376
6 597
11 497
12 404
4 626
29 318
23 222
36 110
2010 2011 2012
ESPO pumps 12 404 4 626
Pumps excl ESPO 7 376 6 597 11 497
Oil & Gas equipment 3 897 7 832 8 135
Compressors 450 2 361
EPC: Construction 2 637 5 533 5 450
EPC: Project & Design 1 366 2 198 2 086
Others 1 637 611 1 955
Total 29 318 23 222 36 110
Total without ESPO 16 913 23 222 31 484
ESPO pumps: old 12 404
ESPO pumps: new 4 626
-41% -67%
-71% +491%
+242% -14%
+81% +319%
+65% -14%
-11% +21%
+671% +36%
-7% +21%
+23% +58%
-41% -99%
n/a
n/a n/a
-11% +74%
+101% +4%
n/a +425%
+110% -1%
61% -5%
-63% +220%
-21% +56%
+37% +36%
n/a
n/a

Project Brief description
Rosneft
Komsomolskiy refinery Oil product pipeline from the refinery to De-Kastri harbor. Delivery of pumps and pump units
Yurubcheno-Tokhomsk oilfield Start of oil production in 2016. Oil reserves & resources 513mt. Delivery of pumps and oil&gas equipment
TNK-BP
Russkoe, Tagulskoe and Suzunskoe oilfields Oilfields in Yamal region with specific oil. Assets of TNK-BP. Can be developed using Vankor’s infrastructure. Production start is planned in 2015-2016
Lodochnoe oil-gas condensate field Discovered in Eastern Siberia in 1985. Recoverable oil reserves C1 10.5mt, C2 32.6mt. Next to Vankor. Production engineering in 2013
Uvat 22 oilfields in Tyumen region , including Protozanovskoe and Tyamkinskoe fields. Production 7mtpa in 2012. Planned production 7.5mtpa in 2015
East- and Novo- Urengoy gas & condensate fields
Rospan International project. Total reserves of 2 deposits 890bcm of gas and 133mt of gas condensate. Total development investments US$ 6bn. Current production 3.5bcm. Planned production 8.6bcm in 2015, and 16bcm in 2017
Bashneft
Trebs and Titov fields JV with Lukoil. Project development stage. Reserves C1 142mt. Oil production in 2013 Transneft
ESPO Capacity expansion of ESPO-1 and ESPO-2
Zapolyarye – Pur-pe pipeline Oil transportation from YANAO and Northern Krasnoyarsk region to ESPO pipeline
Modernization of the current pipelines Ongoing inflow of contracts
Yurubcheno-Takhomskoe-Taishet pipeline Oil transportation from Yurubcheno-Tokhomsk and Kuyumbinsk oilfields to ESPO-1. Length ~703 km. Capacity ~15mtpa
Gazprom
Kovyktinskoe gas field Total reserves of gas 1.5trncm and gas condensate 77mt. Currently in exploration program development stage. By 2016 Gazprom plans to shoot 1,300m2 and drill 10 exploration wells
Chayandinskoe oil-gas condensate field Base for creation of Yakutsk gas production center. Reserves of gas 1.2trncm and oil & gas condensate 79mt. Next to Kovyktinskoe field. Commencement planned in 2014 for oil and 2017 for gas. Field infrastructure development 2014-2017
Urengoy oil-gas condensate field The 3rd world largest with gas reserves over 10trncm, located in Tyumen region. Development of oil rims. Production plans in 2015
Mylzhinskoe OGF – Kazan OGCF – Kuybyshev trunk oil product pipeline
Pipeline construction in 2013-2014
South Stream (KMPO) Gas pipeline, which is planned to be laid on the seafloor of the Black sea from Russia to Italy and Austria thru Bulgaria, Balkan Peninsula, and other countries. Construction started in Dec 2012, completion in 2015. Total investments €16bn
Gazprom neft
Novoport (Novy port) field Recoverable reserves C1+C2 230mt of oil and 270bcm of gas. First oil in 2012. Start of year-round production in 2014 at 400-500ktpa. Planned production 6-9mtpa in 2020.
Etypurovskoe field Further development of the field
Iraq
Rumania brownfield Consortium headed by BP
Projects with South Oil Company of Iraq International oil majors
Water utilities
Central Asia Irrigation stations for Uzbekistan and Turkmenia
Russia & the CIS Modernization of outdated equipment
Nuclear
Rosatom Pumps and other equipment for new nuclear power plants and modernization of the old ones
Selected end-market projects for mid-term Our current priorities for 2013 (filled pink)
27 Sources: Public information, Company’s data Prioritized projects
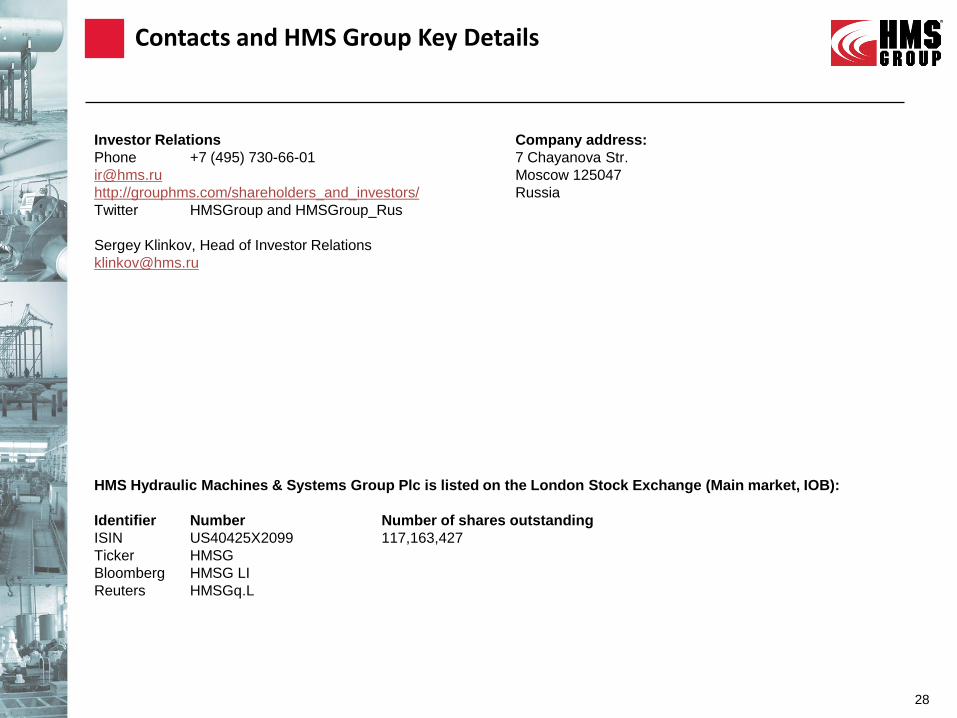
Contacts and HMS Group Key Details
28
Company address:
7 Chayanova Str.
Moscow 125047
Russia
Investor Relations
Phone +7 (495) 730-66-01
http://grouphms.com/shareholders_and_investors/
Twitter HMSGroup and HMSGroup_Rus
Sergey Klinkov, Head of Investor Relations
HMS Hydraulic Machines & Systems Group Plc is listed on the London Stock Exchange (Main market, IOB):
Identifier Number Number of shares outstanding
ISIN US40425X2099 117,163,427
Ticker HMSG
Bloomberg HMSG LI
Reuters HMSGq.L

APPENDIX
29

Consolidated statement of financial position FY 2012
30
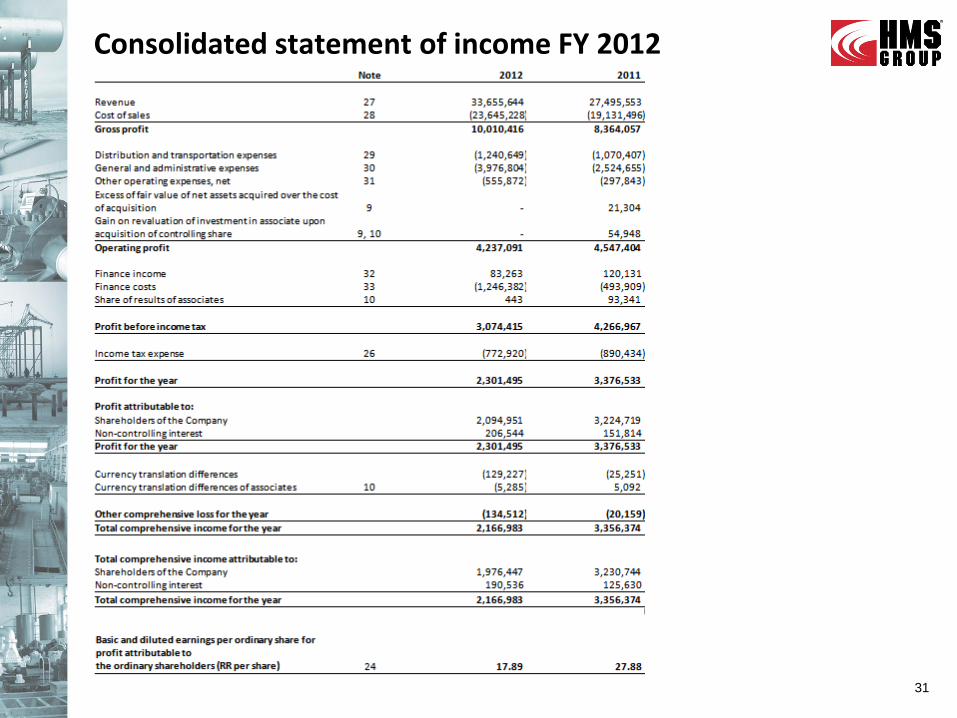
Consolidated statement of income FY 2012
31

Consolidated statement of cash flows FY 2012
32

New Projects
33

34
Russia
China
Kazakhstan
Belarus
Ukraine
India
UAE
Uzbekistan
Turkmenistan
Iraq
Vietnam
Kyrgyzstan
Tajikistan
Export Markets
Central Asia
Recently undertook turnkey construction of pumping station on Amu Darya river in Turkmenistan and construction of pumping station on water-storage basin Arnasai in Uzbekistan
Rapidly growing sales of modular equipment to oil and gas sector in Kazakhstan
Presence in water markets of Tajikistan and Kyrgyzstan
Offices in Ashkhabad (Turkmenistan) and Tashkent (Uzbekistan)
Europe
Office in Milan
Iraq
Significant installed base of HMS pumps, particularly in oil and gas, from Soviet and post Soviet periods
Office in Baghdad diversifies customer base, currently undertakes projects for Oil Ministry and BP
The UAE
Office in Dubai *
Nuclear Exports
Long history of HMS involvement in Rosatom’s foreign as well as domestic projects
International agreements in place for the construction of 19 reactors in China, India, Belarus, Turkey, Ukraine, Armenia, Slovakia, Bulgaria and Vietnam using Russian technology
― Current tenders for development of 16 other reactors worldwide
Source: Company data, media sources Note: * To be opened at 2012
HMS office
Italy Bulgaria
Turkey

TGC-13 (Enisei) Investments 2010-2015: RUB 10 bn
TGC-9 Investments 2010-2015: RUB 28 bn
TGC-8 Investments 2010-2015: RUB 18 bn
TGC-7 (Volga) Investments 2010-2015: RUB 11 bn
TGC-6 Investments 2010-2015: RUB 16 bn
TGC-5 Investments 2010-2015: RUB 14 bn
TGC-3 (Mosenergo) Investments 2010-2015: RUB 39 bn
TGC-14 Investments 2010-2015: RUB 8 bn
TGC-12 (Kuzbas) Investments 2010-2015: RUB 21 bn
TGC-11 Investments 2010-2015: RUB 26 bn
TGC-10 (Fortum) Investments 2010-2015: RUB 47 bn
TGC-4 Investments 2010-2015: RUB 21 bn
TGC-2 Investments 2010-2015: RUB 28 bn
TGC-1 Investments 2010-2015: RUB 73 bn
Source: Frost & Sullivan report 2009
Nuclear Power Plants HMS participation confirmed Projects under construction Planned projects
Leningradskaya-II
Kalininskaya
Rostovskaya
Novovoronezhskaya-II
Beloyarskaya
Kurskaya Smolenskaya
Kolskaya
New Milestone Projects
Rostovskaya
Summary of total investments in power generating capacity
Selected nuclear power plant projects abroad using Russian technology
Number of power units to be
constructed or reconstructed
Additional generation
capacity, MW
Investments 2010-
2015 (RUB bn)
TGC n/a 13,627 359
OGC n/a 11,962 467
Nuclear plants
(Russia) 41 21,500 808
Nuclear plants
(Foreign) 17 17,880 1,940
Name Country No of power units /
Unit capacity (MW)
Investments 2010-
2015 (RUB bn)
Tianwan NPP China 2 / 1,000 86
Kudankulam
NPP India 2 / 1,000 65
Mokhovtse NPP Slovakia 2 / 440 53
Akkuyu NPP Turkey 4 / 1,200 27
Other projects
Ukraine 2 / 1,200
1,581 Belarus 2 / 1,200
Armenia 1 / 1,200
Vietnam 1 / 1,200
35
Baltic
Berezovskaya SDPP
Thermal and nuclear power utilities

Zapolyarnoe-Pur-pe pipeline
Projected Zapolyarnoe–Pur-pe pipeline
Inlet pipelines from main perspective oilfields (with production level over 2mln tons in 2020)
New OPS
Maximum level of pumping capacity by 2020, mtpa
Main OPS – main oil-pumping station of the future Zapolyarnoe-Pur-per pipeline
OPS – oil-pumping station
Legend
Inlet pipelines
Inlet point Oilfield License holder Max capacity in
2020, mt
Main OPS 1 Vostochno-Messoyakhinskoe Slavneft * 10.9
Main OPS 1 Zapadno-Messoyakhinskoe Slvaneft 2.4
Total Main OPS 1 13.3
OPS 2 Russkoe TNK-BP 6.8
OPS 2 Zapolyarnoe Gazprom 2.3
OPS 2 Tazovskoe Gazprom 1.0
OPS 2 Northern Urengoyskoe Gazprom n/a
OPS 2 Salekaptskoe Lukoil 0.3
Total OPS 2 10.9
OPS 3 Urengoyskoe Gazprom 7.4
OPS 3 Pestsovoe Gazprom n/a
OPS 3 En-Yakhinskoe Gazprom n/a
OPS 3 Samburgskoe SeverEnergiya ** 0.2
OPS 3 Yaro-Yakhinskoe SeverEnergiya 0.5
OPS 3 License plot of Western Urengoyskoe TNK-BP 1.1
Total OPS 3 9.7
Total capacity to Pur-pe 34.0-45.0
* TNK-BP and Gazprom Neft have per 50% share ** Gazprom holds 51%; this shareholding should be sold to Novatek
Source: Public sources, Transneft site
Capacity, mtpa up to 45
Total length, km 488
Projected cost, RUB bn 120
Total length of inlet pipelines, km 1,200
Project figures Construction period 2012-2016
1st stage 2014
2nd stage 2015
3rd stage 2016
Implementation
1st stage
2nd stage
3rd stage
36

Kuyumba - Taishet pipeline
Main OPS: Kuyumba
37
OPS 3
OPS 4
OPS 2
Main OPS: Taishet
Capacity, mtpa 15
Total length, km 703
Projected cost, RUB bn 97
Start of project implementation 2012
Completion 2016
Project figures
Krasnoyarsk region
1 2
3 4
ESPO
8
10
5
6
7
11
9
12 13 14
4
3
2
Verkhnechonskoe oil field
Danilovskoe oil field
Dulisminskoe oil field
Talakanskoe oil field
Srednebotuobinskoe oil field
Taas-Yuryakhskoe oil field
Kuyumbinskoe oil field
Yurubcheno-Tokhomskoe oil field 1
Kuyumba - Taishet

Number of new pumping stations for increasing capacity 21
New stations contracted by HMS 3
New station contracted by Turbonasos 1
New stations to be contracted 16
Number of contracted pumping stations 20
Pumping stations under construction by HMS 12
Pumping stations constructed by Sulzer 7
Pumping stations under construction by Turbonasos 2
East Siberia – Pacific Ocean pipeline
Source: Company data, Transneft
Krasnoyarsk region
1 2
3 4 5
6 7
8
9
10
11
12 13 14 15
16 17
18
19
20
23 24
25
26 27
28 29 30
31 32 33
34
35
36
37
38
39
40
41
Buryat region
Chita region
RUSSIA
MONGOLIA
Irkutsk Chita
Ust’-Kut
Yakutsk
Skovorodino
Blagoveschensk
Vladivostok
Taishet
Irkutsk region
Khabarovsk region
Sea of Okhotsk
CHINA
Total number of pumping stations: 41
22 21
38

M&A Policy
39

How we expand acquired businesses
Main rationale: M&A approach
M&A Strategy
40 Source: Company data (RAS accounts)
Sectors: pumps, compressors, oil & gas equipment, project & design
Region: Russia and the CIS
Target revenue within $ 20-100 mn
Strong business model
Friendly management
PUMP PRODUCERS
Broadening of HMS Group’s product portfolio with complementary equipment
Potential growth of revenues and EBITDA margin of acquired companies:
– Sales power and R&D capability of HMS Group
– Well-known brands and/or technical equipment base of acquired companies
Potential growth of revenues and EBITDA margin of the whole Group through integrated solutions
Year
of
acq
uis
itio
n
O&G EQUIPMENT PRODUCERS
Trading Company, established in 2002, is a profit center that represents the Group in a number of large-scale contracts, which are executed by production facilities afterwards
42%
5%
17%
16%
17%
11%
30%
59%
23%
21%
14%
18%
14%
9%
23%
37%
HMS Neftemash
Sibneftemash
Sibna
HMS Pumps
Nasosenergomash
Livnynasos
DGHM
HMS Trading company
2004
2011
2009
2003
2005
2006
2007
2002
Revenue, CAGR %
EBITDA CAGR %
Comments:
• Proven track record of a market consolidator with 21 completed acquisition in Russia, CIS and abroad
• HMS Group expands to adjacent segments seeking complimentary technologies and R&D facilities
• High-growth sectors where HMS has limited presence are the Groups’ focus area
• M&A experience converts to synergies - strong and sustainable double digit annual EBITDA growth after acquisition
CAGR since the acquisition year to 2012

up to
Rub 50 mn
up to
Rub 500 mn
Rub 1-3 bn
Located in Kazan, Russia (~ 800 km from Moscow)
Overall area 420 ‘000 m2, production floor ~127 ‘000 m2
Developed infrastructure near railway and dense in & outbound roads network
Focuses on a gas flow control products and technologies: centrifugal and screw compressors, refrigeration and cooling units (centrifugal compressor-based), couplings, gearboxes, multipliers
Service top Russian players in the basic industries:
In April, the Group additionally acquired the Russian project and design institute ZAO “NIITurbokompressor” (Turbokompressor) located in Kazan, which focuses on centrifugal, rotarary and screw compressors and designs 10-12 of new compressor samples annually
Recent M&A: KazanKomressorMash (KKM)
41
Company description…
Focus shifts to integrated solutions to expand the business
Shift in the strategy: key points of concept 1. One gas pumping station (integrated solution) for the trunk gas pipeline is similar to current annual revenue of KKM in 2011 (around Rub 3bn) 2. There is no “one-stop shop” providers of integrated solutions in Russia with experience similar to HMS (ESPO-1, ESPO-2, Vankor) 3. Revenue of KKM can double based on several successful contracts for compressor stations
Product offering for associated gas, natural gas and basic industries in Russia and CIS…
Revenue 2012 and expectations for 2013
Compressor
Compressor unit
Compressor station
Plan 2013: +32% YoY based on the
current and expected backlog
2 contracts for compressor stations totaled Rub 2 bn were already signed, while HMS keep working on several potential ones
*- Had the acquisition occurred on 1 January 2012, the revenue of KKM would have been Rub 3,066 mn
*

Production Assets
42

Livny
Russia Ukraine
Tomsk
Nizhnevartovsk
Tyumen
Dimitrovgrad
Nizhnevartovskremservice (NRS)
Services: Maintenance and repair of pump equipment, drilling and other oil and gas field equipment
HMS Neftemash
Products: Modular equipment for oil and gas and water industries
Sibneftavtomatika (SibNA)
Products: High-precision measuring equipment for oil, gas and water flow rates
Tomskgazstroy (TGS)
Services: Trunk oil and gas pipeline and auxiliary facilities construction
Sibkomplektmontazhnaladka (SKMN)
Services: Design, construction and commissioning of oil and gas field projects
Rostov Vodokanalproekt (RVKP)
Services: Project design for water utilities
Rostov
Sumy
43
HMS Household pumps
Products: Household vibration pumps
HMS Group
Headquarters
Promburvod (PBV)
Products: Water well submersible pumps
Livnynasos (LN)
Products: Water well submersible pumps
Nasosenergomash (NEM)
Products: Pumps for thermal and nuclear power generation and oil & gas industry
VNIIAEN, associate 47%
Description: R&D center for pumps used in nuclear, thermal power generation, oil and gas industry
Dimitrovgradhimmash (DGHM)
Products: Equipment for oil and chemical industries and pumps for oil refining
HMS Pumps
Products: Industrial pumps for oil and gas, power generation
Giprotyumenneftegaz (GTNG)
Services: Project and construction design of oil and gas facilities
Belarus
Minsk
Moscow Bavleny
Industrial pumps Modular equipment EPC (Construction and Project & design) Compressors
Source: Company data
HMS’ Production Assets
Bobruisk Machine Building Plant (BMBP)
Products: Pumps for oil refining and metals & mining
Bobruisk
Sibneftemash
Products: Tanks and vessels for oil and oilfield service companies
Products: Compressors
Kazan
Kazankompressormash (KKM)
Apollo Goessnitz GmbH
Products: Centrifugal pumps and systems for oil refining
Germany Goessnitz (Thuringia)
Description: R&D center for centrifugal, rotary and screw compressors
NIITK (Turbokompressor)

Calculations
All figures in millions of Russian Rubles, unless otherwise stated
Management of the Group assesses the performance of operating segments based on a measure of adjusted EBITDA, which is derived
from the consolidated financial statements prepared in accordance with IFRS
EBITDA is defined as operating profit/loss adjusted for other operating income/expenses, depreciation and amortization, impairment of
assets, provision for obsolete inventory, provision for impairment of accounts receivable, unused vacation allowance, defined benefits
scheme expense, warranty provision, provision for legal claims, provision for VAT and other taxes receivable, other provisions, excess of
fair value of net assets acquired over the cost of acquisition. This measurement basis excludes the effects of non-recurring income and
expenses on the results of the operating segments
EBIT is calculated as Gross margin minus Distribution & transportation expenses minus General & administrative expenses
Total debt is calculated as Long-term borrowings plus Long-term financial lease liabilities plus Short-term borrowings plus Short-term
financial lease liabilities
Net debt is calculated as Total debt minus Cash & cash equivalents at the end of the period
Working capital is calculated as Inventories plus Trade and other receivables minus Trade and other payables
ROCE is calculated as EBIT LTM divided by Average Capital Employed (total debt + total equity), where EBIT equals Gross profit minus
SG&A, and Total debt equals the above formula
Backlog is calculated as the preceding backlog plus new or additional customer orders booked during the reporting period, less amounts of
contract value booked as revenue under ‘‘Russian GAAP’’ on an unconsolidated basis under the relevant contracts, plus or minus
adjustments made in the judgment of the Group’s management. The Group may also make certain adjustments to bookings to reflect
amendment, expiry or termination of contracts, cancellation of orders, changes in price terms under contracts or orders, or other factors
affecting the amount of potential revenue which the Group believes may be recognized under such contracts. The Group’s backlog
estimates are not an indication of potential revenues. Actual revenues and other measures of financial performance under IFRS may differ
materially from any estimate of backlog, and changes in backlog between periods may have limited or no correlation to changes in revenue
or any other measure of financial performance under IFRS
Notes to the presentation and formulas used for some figures’ calculations
44

The information contained herein has been prepared using information available to HMS Group (“HMS” or
“Group” or “Company”) at the time of preparation of the presentation. External or other factors may have
impacted on the business of HMS Group and the content of this presentation, since its preparation. In addition all
relevant information about HMS Group may not be included in this presentation. No representation or warranty,
expressed or implied, is made as to the accuracy, completeness or reliability of the information.
Any forward looking information herein has been prepared on the basis of a number of assumptions which may
prove to be incorrect. Forward looking statements, by the nature, involve risk and uncertainty and HMS Group
cautions that actual results may differ materially from those expressed or implied in such statements. Reference
should be made to the most recent Annual Report for a description of the major risk factors. This presentation
should not be relied upon as a recommendation or forecast by HMS Group, which does not undertake an
obligation to release any revision to these statements.
This presentation does not constitute or form part of any advertisement of securities, any offer or invitation to
sell or issue or any solicitation of any offer to purchase or subscribe for, any shares in HMS Group, nor shall it or
any part of it nor the fact of its presentation or distribution form the basis of, or be relied on in connection with,
any contract or investment decision.
Disclaimer
45