HMS Group 6 months 2013 results -...
19
HMS Group 6 months 2013 IFRS Results Conference call presentation 30 September 2013
Transcript of HMS Group 6 months 2013 results -...
HMS Group 6 months 2013 IFRS Results Conference call presentation
30 September 2013
Financial results
Business & Outlook
Appendix
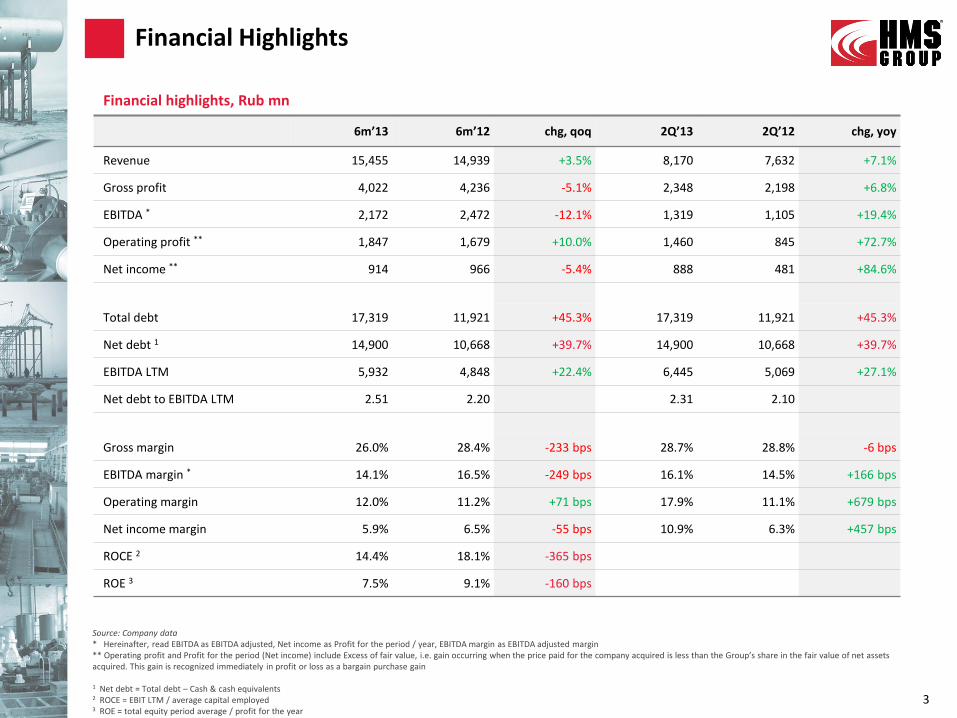
Source: Company data * Hereinafter, read EBITDA as EBITDA adjusted, Net income as Profit for the period / year, EBITDA margin as EBITDA adjusted margin ** Operating profit and Profit for the period (Net income) include Excess of fair value, i.e. gain occurring when the price paid for the company acquired is less than the Group’s share in the fair value of net assets acquired. This gain is recognized immediately in profit or loss as a bargain purchase gain 1 Net debt = Total debt – Cash & cash equivalents 2 ROCE = EBIT LTM / average capital employed 3 ROE = total equity period average / profit for the year
6m’13 6m’12 chg, qoq 2Q’13 2Q’12 chg, yoy
Revenue 15,455 14,939 +3.5% 8,170 7,632 +7.1%
Gross profit 4,022 4,236 -5.1% 2,348 2,198 +6.8%
EBITDA * 2,172 2,472 -12.1% 1,319 1,105 +19.4%
Operating profit ** 1,847 1,679 +10.0% 1,460 845 +72.7%
Net income ** 914 966 -5.4% 888 481 +84.6%
Total debt 17,319 11,921 +45.3% 17,319 11,921 +45.3%
Net debt 1 14,900 10,668 +39.7% 14,900 10,668 +39.7%
EBITDA LTM 5,932 4,848 +22.4% 6,445 5,069 +27.1%
Net debt to EBITDA LTM 2.51 2.20 2.31 2.10
Gross margin 26.0% 28.4% -233 bps 28.7% 28.8% -6 bps
EBITDA margin * 14.1% 16.5% -249 bps 16.1% 14.5% +166 bps
Operating margin 12.0% 11.2% +71 bps 17.9% 11.1% +679 bps
Net income margin 5.9% 6.5% -55 bps 10.9% 6.3% +457 bps
ROCE 2 14.4% 18.1% -365 bps
ROE 3 7.5% 9.1% -160 bps
Financial Highlights
3
Financial highlights, Rub mn

Last 12 month (LTM) comparison represents sustainability and trends of HMS’ business performance better than quarterly one
26,286 27,778 27,473 27,496 27,751 28,577
30,498
33,656 33,633 34,172
1Q'11 2Q'11 3Q'11 4Q'11 1Q'12 2Q'12 3Q'12 4Q'12 1Q'13 2Q'13
Revenue LTM, Rub mn Linear ( Revenue LTM, Rub mn)
4,721
5,512 5,666 5,509 5,287 4,848
5,132
6,231 5,718 5,932
18.0%
19.8% 20.6% 20.0%
19.1%
17.0% 16.8%
18.5% 17.0% 17.4%
1Q'11 2Q'11 3Q'11 4Q'11 1Q'12 2Q'12 3Q'12 4Q'12 1Q'13 2Q'13
EBITDA LTM, Rub mn EBITDA margin
Financial Highlights: LTM vs. Quarterly
4 Source: Company data
7,051 6,806 6,703 6,935 7,307 7,632
8,624 10,093
7,285 8,170
1,588 1,545 1,265 1,111 1,367 1,105 1,550 2,210 854 1,319
22.5% 22.7%
18.9%
16.0%
18.7%
14.5%
18.0%
21.9%
11.7%
16.1%
1Q'11 2Q'11 3Q'11 4Q'11 1Q'12 2Q'12 3Q'12 4Q'12 1Q'13 2Q'13
Revenue, Rub mn EBITDA, Rub mn EBITDA margin
EBITDA LTM performance, 2010 – 6m 2013 Revenue LTM performance, 2010 – 6m 2013
Revenue and EBITDA performance quarterly, 2011 – 6m 2013
Source: Company data
Source: Company data
Note: LTM calculation is based on periodic not quarterly one, i.e. 2q13 = 6m13+FY12-6m12, and 3q12 = 9m12+FY11-9m11, etc. both for Revenue LTM and EBITDA LTM

4,249
2,297
322 (34)
7.6%
-1.5%
6 months 2012 6 months 2013
Revenue EPC, Rub mn EBITDA EPC, Rub mn
EBITDA margin EPC, %
1,604
114
7.1%
6 months 2012 6 months 2013
Revenue Compressors, Rub mn EBITDA Compressors, Rub mn
EBITDA margin Compressors, %
4,490
3,829
1,150
381
25.6%
9.9%
6 months 2012 6 months 2013
Revenue OG equipment, Rub mn EBITDA OG equipment, Rub mn
EBITDA margin OG equipment, %
6,199
7,724
823 1,274
13.3% 16.5%
6 months 2012 6 months 2013
Revenue Pumps, Rub mn EBITDA Pumps, Rub mn
EBITDA margin Pumps, %
Oil & gas equipment Pumps
Segments overview: Half-year results
5
Revenue +25% EBITDA +55%
Revenue -15% EBITDA -67%
Revenue -46% EBITDA -111%
EPC Compressors
Strong inflow of regular orders resulted in 25% yoy revenue and 55% yoy EBITDA growth
Also, additional profit was recognized due to release of provisions for the ESPO contract due to initial conservative project budgeting
Upon the completion of the large-scale and high-margin Vankor project in 2012, it was substituted in 1H 2013 by regular projects with lower profitability, and that led to revenue and EBITDA decline by 15% yoy and 67% yoy respectively
As a result, EBITDA margin fell significantly to 9.9%
Compressors business segment was established in 2H 2012 after KKM’s acquisition, and IFRS was applied since 3Q 2012, therefore there is no relevant yoy comparison
HMS assumed significant growth of revenues compared to previous period, and financial results were fully in line with budget expectations (growth at around 30%)
The Group looks forward for margins growth due to NIITK’s acquisition and provision of integrated solutions
EPC sub-segments demonstrated differently directed financial performance, resulted in generally poor revenue and negative margin: – Project & Design generated stable revenue and EBITDA and returned to its
normal level of EBITDA margin (14.7%), reflecting management focus at operating efficiency
– Construction showed declined revenues and negative EBITDA due to intensifying competition and deteriorating terms of payments from customers Source: Company data
6m 2012 6m 2013 chg, yoy
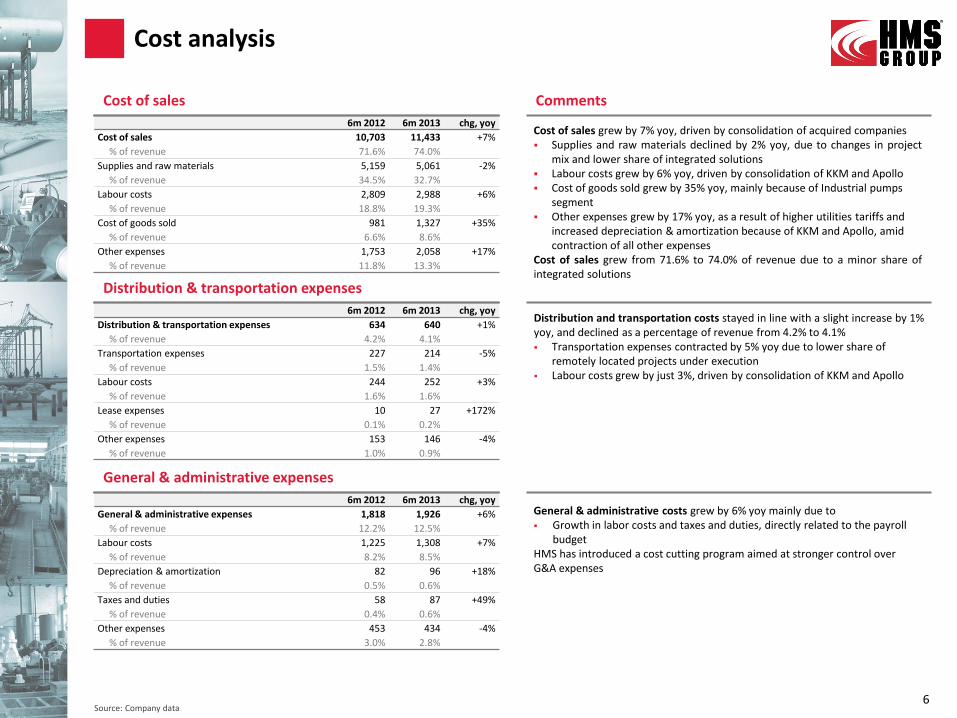
Cost of sales 10,703 11,433 +7%
% of revenue 71.6% 74.0%
Supplies and raw materials 5,159 5,061 -2%
% of revenue 34.5% 32.7%
Labour costs 2,809 2,988 +6%
% of revenue 18.8% 19.3%
Cost of goods sold 981 1,327 +35%
% of revenue 6.6% 8.6%
Other expenses 1,753 2,058 +17%
% of revenue 11.8% 13.3%
Cost analysis
6
Cost of sales Comments
6m 2012 6m 2013 chg, yoy
Distribution & transportation expenses 634 640 +1%
% of revenue 4.2% 4.1%
Transportation expenses 227 214 -5%
% of revenue 1.5% 1.4%
Labour costs 244 252 +3%
% of revenue 1.6% 1.6%
Lease expenses 10 27 +172%
% of revenue 0.1% 0.2%
Other expenses 153 146 -4%
% of revenue 1.0% 0.9%
Distribution & transportation expenses
6m 2012 6m 2013 chg, yoy
General & administrative expenses 1,818 1,926 +6%
% of revenue 12.2% 12.5%
Labour costs 1,225 1,308 +7%
% of revenue 8.2% 8.5%
Depreciation & amortization 82 96 +18%
% of revenue 0.5% 0.6%
Taxes and duties 58 87 +49%
% of revenue 0.4% 0.6%
Other expenses 453 434 -4%
% of revenue 3.0% 2.8%
General & administrative expenses
General & administrative costs grew by 6% yoy mainly due to Growth in labor costs and taxes and duties, directly related to the payroll
budget HMS has introduced a cost cutting program aimed at stronger control over G&A expenses
Cost of sales grew by 7% yoy, driven by consolidation of acquired companies Supplies and raw materials declined by 2% yoy, due to changes in project
mix and lower share of integrated solutions Labour costs grew by 6% yoy, driven by consolidation of KKM and Apollo Cost of goods sold grew by 35% yoy, mainly because of Industrial pumps
segment Other expenses grew by 17% yoy, as a result of higher utilities tariffs and
increased depreciation & amortization because of KKM and Apollo, amid contraction of all other expenses
Cost of sales grew from 71.6% to 74.0% of revenue due to a minor share of integrated solutions
Distribution and transportation costs stayed in line with a slight increase by 1% yoy, and declined as a percentage of revenue from 4.2% to 4.1% Transportation expenses contracted by 5% yoy due to lower share of
remotely located projects under execution Labour costs grew by just 3%, driven by consolidation of KKM and Apollo
Source: Company data
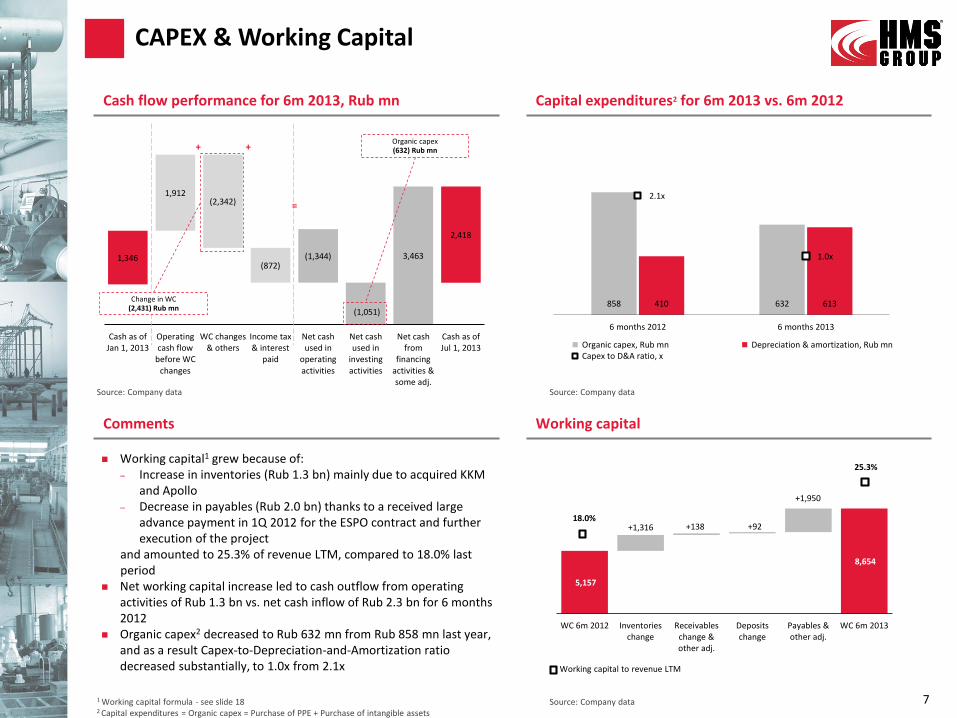
5,157
+1,316 +138 +92
+1,950
8,654
WC 6m 2012 Inventorieschange
Receivableschange &other adj.
Depositschange
Payables &other adj.
WC 6m 2013
858 632 410 613
2.1x
1.0x
6 months 2012 6 months 2013
Organic capex, Rub mn Depreciation & amortization, Rub mn Capex to D&A ratio, x
1,346
1,912 (2,342)
(872) (1,344)
(1,051)
3,463
2,418
Cash as ofJan 1, 2013
Operatingcash flow
before WCchanges
WC changes& others
Income tax& interest
paid
Net cashused in
operatingactivities
Net cashused in
investingactivities
Net cashfrom
financingactivities &some adj.
Cash as ofJul 1, 2013
Comments Working capital
Cash flow performance for 6m 2013, Rub mn Capital expenditures2 for 6m 2013 vs. 6m 2012
Working capital1 grew because of: – Increase in inventories (Rub 1.3 bn) mainly due to acquired KKM
and Apollo – Decrease in payables (Rub 2.0 bn) thanks to a received large
advance payment in 1Q 2012 for the ESPO contract and further execution of the project
and amounted to 25.3% of revenue LTM, compared to 18.0% last period
Net working capital increase led to cash outflow from operating activities of Rub 1.3 bn vs. net cash inflow of Rub 2.3 bn for 6 months 2012
Organic capex2 decreased to Rub 632 mn from Rub 858 mn last year, and as a result Capex-to-Depreciation-and-Amortization ratio decreased substantially, to 1.0x from 2.1x
CAPEX & Working Capital
Source: Company data
Source: Company data
7
6%
28%
9M 2010 9M 2011
Working capital to Revenue LTM
25.3%
1 Working capital formula - see slide 18
2 Capital expenditures = Organic capex = Purchase of PPE + Purchase of intangible assets
Source: Company data
+ +
=
Organic capex (632) Rub mn
6%
28%
9M 2010 9M 2011
Working capital to Revenue LTM
18.0%
6%
28%
9M 2010 9M 2011
Working capital to Revenue LTM
Working capital to revenue LTM
Change in WC (2,431) Rub mn
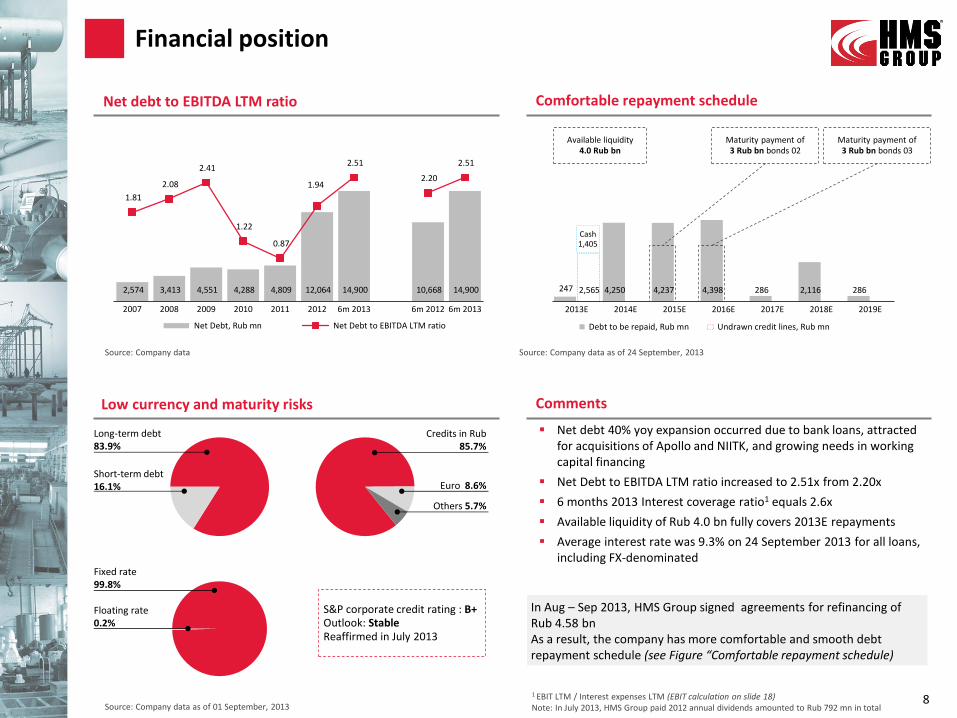
2,574 3,413 4,551 4,288 4,809 12,064 14,900 10,668 14,900
1.81
2.08
2.41
1.22
0.87
1.94
2.51
2.20
2.51
2007 2008 2009 2010 2011 2012 6m 2013 6m 2012 6m 2013
Net Debt, Rub mn Net Debt to EBITDA LTM ratio
247 4,250 4,237 4,398 286 2,116 286 2,565
2013E 2014E 2015E 2016E 2017E 2018E 2019E
Debt to be repaid, Rub mn Undrawn credit lines, Rub mn
Short-term debt 16.1%
Comments
Comfortable repayment schedule
Cash 1,405
S&P corporate credit rating : B+ Outlook: Stable Reaffirmed in July 2013
8 Source: Company data as of 01 September, 2013
Financial position
Source: Company data Source: Company data as of 24 September, 2013
Maturity payment of 3 Rub bn bonds 03
Available liquidity 4.0 Rub bn
Maturity payment of 3 Rub bn bonds 02
Net debt to EBITDA LTM ratio
1 EBIT LTM / Interest expenses LTM (EBIT calculation on slide 18) Note: In July 2013, HMS Group paid 2012 annual dividends amounted to Rub 792 mn in total
Fixed rate 99.8%
Floating rate 0.2%
Long-term debt 83.9%
Credits in Rub 85.7%
Euro 8.6%
Others 5.7%
Net debt 40% yoy expansion occurred due to bank loans, attracted for acquisitions of Apollo and NIITK, and growing needs in working capital financing
Net Debt to EBITDA LTM ratio increased to 2.51x from 2.20x
6 months 2013 Interest coverage ratio1 equals 2.6x
Available liquidity of Rub 4.0 bn fully covers 2013E repayments
Average interest rate was 9.3% on 24 September 2013 for all loans, including FX-denominated
Low currency and maturity risks
In Aug – Sep 2013, HMS Group signed agreements for refinancing of Rub 4.58 bn As a result, the company has more comfortable and smooth debt repayment schedule (see Figure “Comfortable repayment schedule)
Financial results
Business & Outlook
Appendix
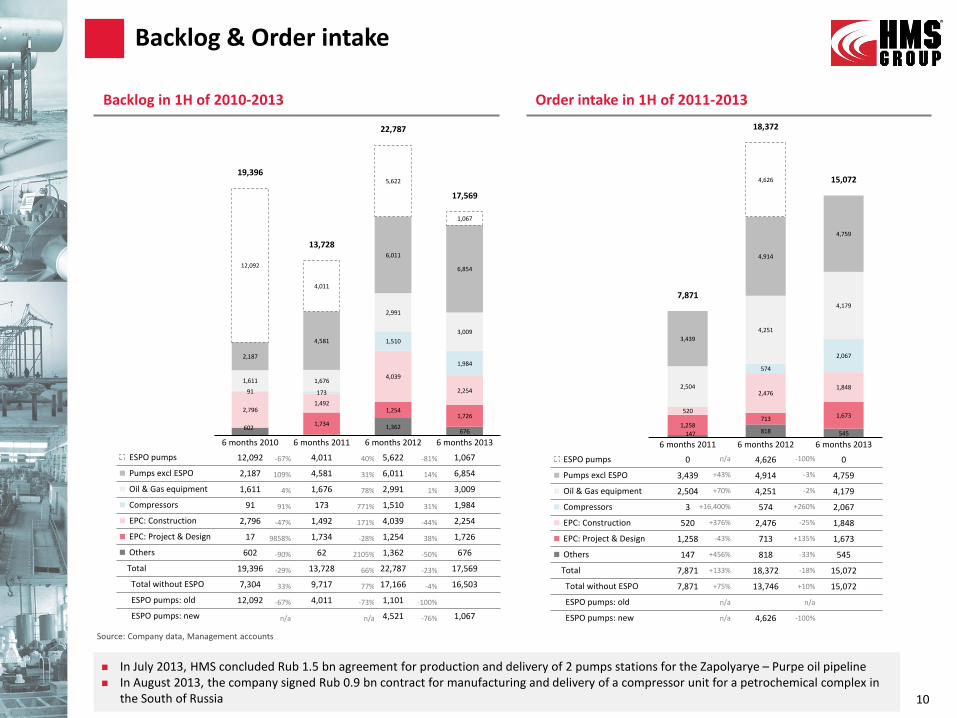
602 1,362 676
1,734
1,254 1,726
2,796 1,492
4,039
2,254 91 173
1,510
1,984
1,611 1,676
2,991
3,009
2,187
4,581
6,011
6,854 12,092
4,011
5,622
1,067
19,396
13,728
22,787
17,569
6 months 2010 6 months 2011 6 months 2012 6 months 2013
ESPO pumps 12,092 4,011 5,622 1,067
Pumps excl ESPO 2,187 4,581 6,011 6,854
Oil & Gas equipment 1,611 1,676 2,991 3,009
Compressors 91 173 1,510 1,984
EPC: Construction 2,796 1,492 4,039 2,254
EPC: Project & Design 17 1,734 1,254 1,726
Others 602 62 1,362 676
Total 19,396 13,728 22,787 17,569
Total without ESPO 7,304 9,717 17,166 16,503
ESPO pumps: old 12,092 4,011 1,101
ESPO pumps: new 4,521 1,067
147 818 545 1,258
713 1,673 520
2,476 1,848
574
2,067
2,504
4,251
4,179
3,439
4,914
4,759
4,626
7,871
18,372
15,072
6 months 2011 6 months 2012 6 months 2013
ESPO pumps 0 4,626 0
Pumps excl ESPO 3,439 4,914 4,759
Oil & Gas equipment 2,504 4,251 4,179
Compressors 3 574 2,067
EPC: Construction 520 2,476 1,848
EPC: Project & Design 1,258 713 1,673
Others 147 818 545
Total 7,871 18,372 15,072
Total without ESPO 7,871 13,746 15,072
ESPO pumps: old
ESPO pumps: new 4,626
Backlog & Order intake
Source: Company data, Management accounts
10
n/a -100%
+43% -3%
+70% -2%
+16,400% +260%
+376% -25%
-43% +135%
+456% -33%
+133% -18%
+75% +10%
n/a n/a
n/a -100%
Backlog in 1H of 2010-2013 Order intake in 1H of 2011-2013
In July 2013, HMS concluded Rub 1.5 bn agreement for production and delivery of 2 pumps stations for the Zapolyarye – Purpe oil pipeline In August 2013, the company signed Rub 0.9 bn contract for manufacturing and delivery of a compressor unit for a petrochemical complex in
the South of Russia
-67% 40% -81%
109% 31% 14%
4% 78% 1%
91% 771% 31%
-47% 171% -44%
9858% -28% 38%
-90% 2105% -50%
-29% 66% -23%
33% 77% -4%
-67% -73% -100%
n/a n/a -76%

4,657
3,586
5,131
1,313
3,200
1,313
(60)
42 376
(181)
310
(181)
-1.3% 1.2%
7.3%
-13.8%
9.7%
-13.8%
2010 2011 2012 6m 2013 6m 2012 6m 2013
Revenue, Rub mn EBITDA, Rub mn EBITDA margin, %
Construction sub-segment performance, 2010 – 6m 2013 Comments
Construction sub-segment overview and prospects
Source: Company data
11
Construction backlog performance, 2010 – 6m 2013
Source: Company data
2,653
3,469
3,293
1,895
-42%
31%
-5%
-42%
2010 2011 2012 6m 2013
Backlog, Rub mn Backlog change yoy, %
The Group acquired construction assets in 2007-2008, targeting large-scale integrated EPC projects with a high proportion of HMS’ made components. However, in Russia’s upstream practice, most projects are done under “EP” (engineering & procurement) and “C” (construction) terms separately. And in current practice, availability of construction assets is not required for execution of such EP projects as ESPO and Vankor
Construction business requires an expertise different from the one, essential for flow control research & development and manufacturing
HMS’ core machinery business units generate the Group’s bulk of revenue and EBITDA
Construction assets demonstrate relatively low EBITDA margin, thus lowering the company’s total EBITDA margin
Construction contracts, besides execution risks, are more exposed to project cancellation risks than machine-building are
High risk of further accelerated deterioration of construction market conditions such as competition and delays in payment
Poor performance of construction sub-segment, so much different from sound performance of the company’s core businesses (flow control machine-building and engineering), made HMS Group to consider several options of construction business development strategy, including its disposal
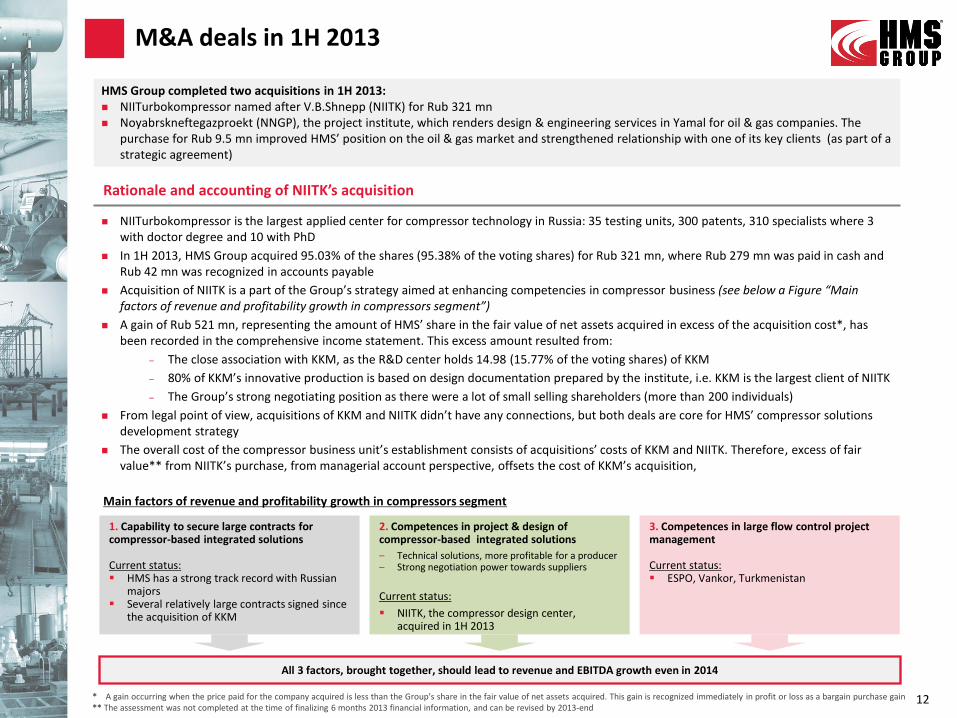
NIITurbokompressor is the largest applied center for compressor technology in Russia: 35 testing units, 300 patents, 310 specialists where 3 with doctor degree and 10 with PhD
In 1H 2013, HMS Group acquired 95.03% of the shares (95.38% of the voting shares) for Rub 321 mn, where Rub 279 mn was paid in cash and Rub 42 mn was recognized in accounts payable
Acquisition of NIITK is a part of the Group’s strategy aimed at enhancing competencies in compressor business (see below a Figure “Main factors of revenue and profitability growth in compressors segment”)
A gain of Rub 521 mn, representing the amount of HMS’ share in the fair value of net assets acquired in excess of the acquisition cost*, has been recorded in the comprehensive income statement. This excess amount resulted from:
– The close association with KKM, as the R&D center holds 14.98 (15.77% of the voting shares) of KKM
– 80% of KKM’s innovative production is based on design documentation prepared by the institute, i.e. KKM is the largest client of NIITK
– The Group’s strong negotiating position as there were a lot of small selling shareholders (more than 200 individuals)
From legal point of view, acquisitions of KKM and NIITK didn’t have any connections, but both deals are core for HMS’ compressor solutions development strategy
The overall cost of the compressor business unit’s establishment consists of acquisitions’ costs of KKM and NIITK. Therefore, excess of fair value** from NIITK’s purchase, from managerial account perspective, offsets the cost of KKM’s acquisition,
HMS Group completed two acquisitions in 1H 2013: NIITurbokompressor named after V.B.Shnepp (NIITK) for Rub 321 mn Noyabrskneftegazproekt (NNGP), the project institute, which renders design & engineering services in Yamal for oil & gas companies. The
purchase for Rub 9.5 mn improved HMS’ position on the oil & gas market and strengthened relationship with one of its key clients (as part of a strategic agreement)
M&A deals in 1H 2013
12
Rationale and accounting of NIITK’s acquisition
1. Capability to secure large contracts for compressor-based integrated solutions Current status: HMS has a strong track record with Russian
majors Several relatively large contracts signed since
the acquisition of KKM
2. Competences in project & design of compressor-based integrated solutions
– Technical solutions, more profitable for a producer – Strong negotiation power towards suppliers
Current status:
NIITK, the compressor design center, acquired in 1H 2013
3. Competences in large flow control project management Current status: ESPO, Vankor, Turkmenistan
All 3 factors, brought together, should lead to revenue and EBITDA growth even in 2014
Main factors of revenue and profitability growth in compressors segment
* A gain occurring when the price paid for the company acquired is less than the Group’s share in the fair value of net assets acquired. This gain is recognized immediately in profit or loss as a bargain purchase gain ** The assessment was not completed at the time of finalizing 6 months 2013 financial information, and can be revised by 2013-end
Contacts
13
Company address: 7 Chayanova Str. Moscow 125047 Russia
Investor Relations Phone +7 (495) 730-66-01 [email protected] http://grouphms.com/shareholders_and_investors/ Twitter HMSGroup and HMSGroup_Rus Vera Timoshenko, Head of Investor Relations [email protected]
HMS Hydraulic Machines & Systems Group Plc is listed on the London Stock Exchange (Main market, IOB): Identifier Number Number of shares outstanding ISIN US40425X2099 117,163,427 Ticker HMSG Bloomberg HMSG LI Reuters HMSGq.L
Financial results
Business & Outlook
Appendix

Consolidated statement of financial position 6 months 2013
15
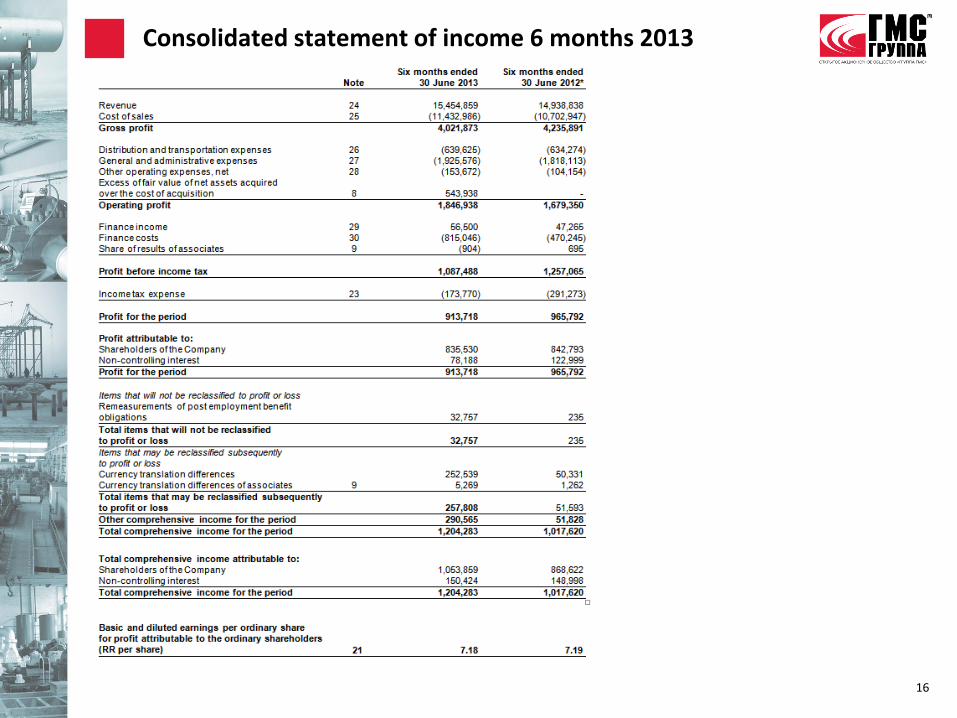
Consolidated statement of income 6 months 2013
16
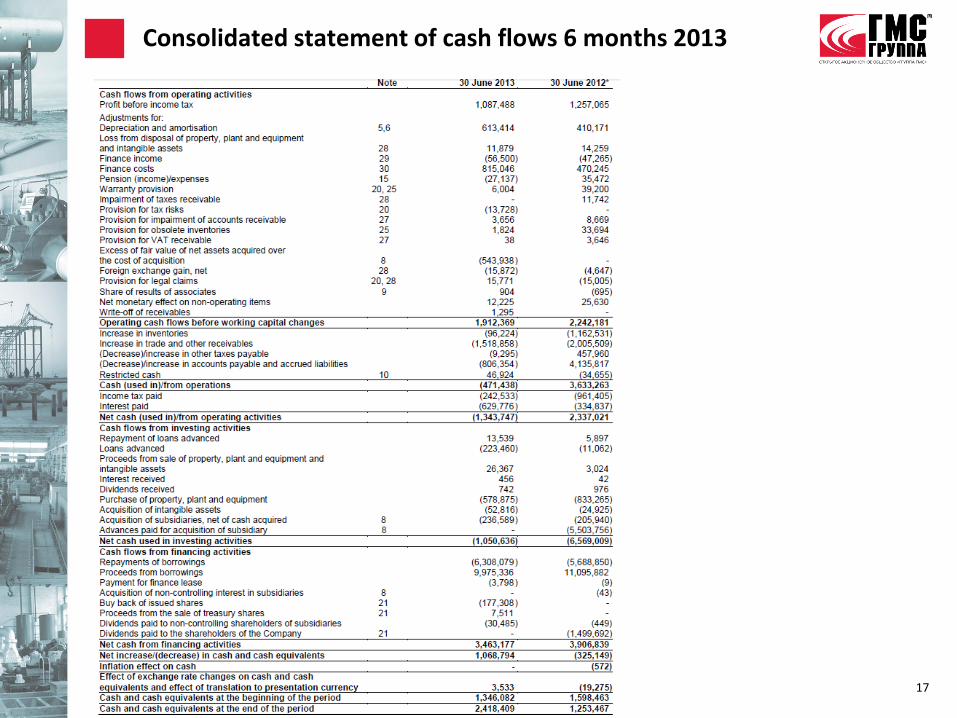
Consolidated statement of cash flows 6 months 2013
17
Calculations and formulas
18
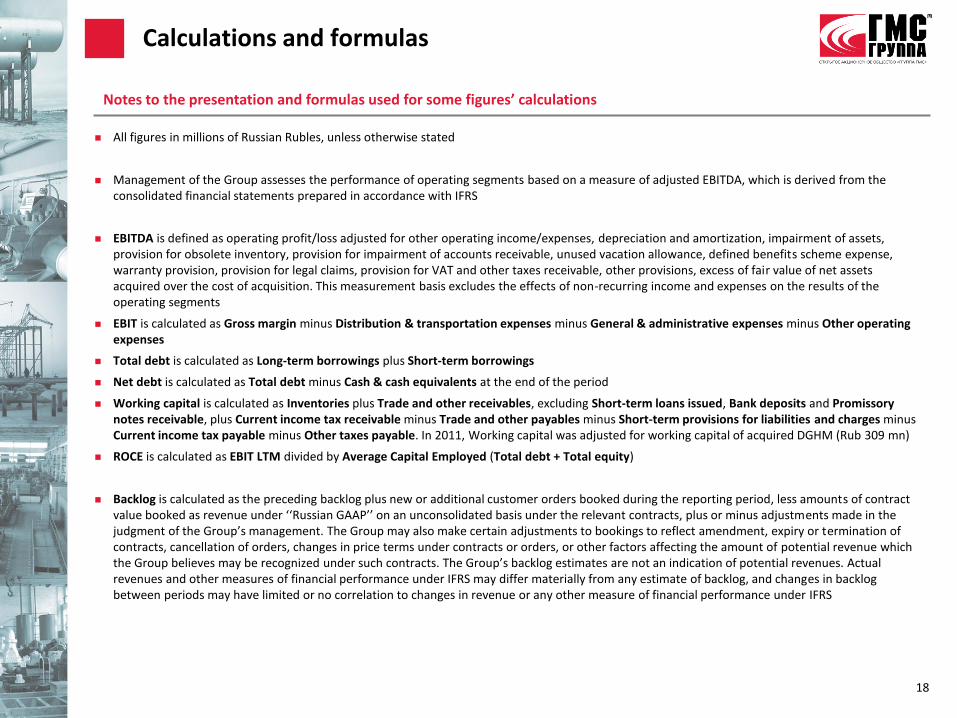
All figures in millions of Russian Rubles, unless otherwise stated
Management of the Group assesses the performance of operating segments based on a measure of adjusted EBITDA, which is derived from the consolidated financial statements prepared in accordance with IFRS
EBITDA is defined as operating profit/loss adjusted for other operating income/expenses, depreciation and amortization, impairment of assets, provision for obsolete inventory, provision for impairment of accounts receivable, unused vacation allowance, defined benefits scheme expense, warranty provision, provision for legal claims, provision for VAT and other taxes receivable, other provisions, excess of fair value of net assets acquired over the cost of acquisition. This measurement basis excludes the effects of non-recurring income and expenses on the results of the operating segments
EBIT is calculated as Gross margin minus Distribution & transportation expenses minus General & administrative expenses minus Other operating expenses
Total debt is calculated as Long-term borrowings plus Short-term borrowings
Net debt is calculated as Total debt minus Cash & cash equivalents at the end of the period
Working capital is calculated as Inventories plus Trade and other receivables, excluding Short-term loans issued, Bank deposits and Promissory notes receivable, plus Current income tax receivable minus Trade and other payables minus Short-term provisions for liabilities and charges minus Current income tax payable minus Other taxes payable. In 2011, Working capital was adjusted for working capital of acquired DGHM (Rub 309 mn)
ROCE is calculated as EBIT LTM divided by Average Capital Employed (Total debt + Total equity)
Backlog is calculated as the preceding backlog plus new or additional customer orders booked during the reporting period, less amounts of contract value booked as revenue under ‘‘Russian GAAP’’ on an unconsolidated basis under the relevant contracts, plus or minus adjustments made in the judgment of the Group’s management. The Group may also make certain adjustments to bookings to reflect amendment, expiry or termination of contracts, cancellation of orders, changes in price terms under contracts or orders, or other factors affecting the amount of potential revenue which the Group believes may be recognized under such contracts. The Group’s backlog estimates are not an indication of potential revenues. Actual revenues and other measures of financial performance under IFRS may differ materially from any estimate of backlog, and changes in backlog between periods may have limited or no correlation to changes in revenue or any other measure of financial performance under IFRS
Notes to the presentation and formulas used for some figures’ calculations

The information contained herein has been prepared using information available to HMS Group (“HMS” or “Group” or
“Company”) at the time of preparation of the presentation. External or other factors may have impacted on the
business of HMS Group and the content of this presentation, since its preparation. In addition all relevant information
about HMS Group may not be included in this presentation. No representation or warranty, expressed or implied, is
made as to the accuracy, completeness or reliability of the information.
Any forward looking information herein has been prepared on the basis of a number of assumptions which may prove
to be incorrect. Forward looking statements, by the nature, involve risk and uncertainty and HMS Group cautions that
actual results may differ materially from those expressed or implied in such statements. Reference should be made to
the most recent Annual Report for a description of the major risk factors. This presentation should not be relied upon
as a recommendation or forecast by HMS Group, which does not undertake an obligation to release any revision to
these statements.
This presentation does not constitute or form part of any advertisement of securities, any offer or invitation to sell or
issue or any solicitation of any offer to purchase or subscribe for, any shares in HMS Group, nor shall it or any part of
it nor the fact of its presentation or distribution form the basis of, or be relied on in connection with, any contract or
investment decision.
Disclaimer
19