Table of Contents Title 33 ENVIRONMENTAL QUALITY Part XI ...

292 THE INDIAN MEDICAL GAZETTE [May, 1941
Special Articles
HEMATOLOGICAL TECHNIQUE Part XI
By L. EVERARD NAPIER, f.r.c.p. (Lond.) and
P. C. SEN GUPTA, m.b. (Cal.)
(From the School of Tropical Medicine, Calcy.Ua)
Red cell diameters : Price-J ones curve
Introduction.?In the normal blood, the red cells are not all exactly the same size, but in no individual cell does the size deviate very much from the mean. However, in some forms of amemia the mean size of the red cells is much below the 'normal' mean; in others, it is far above it. But, in the latter case, there are nearly always some exceptionally small cells as well, so that the picture presented is that of cells of a great range of different sizes. This blood
picture is best presented in the form of a curve, the abscissa being the size and the ordinates the number of times that cells of the particular size have been encountered (i.e., the frequency). In the normal count, the curve rises sharply from the base line at about 6.0 /* to a peak at 7.25 n and then falls almost to the base line again at 8.50/*. This graph is usually known as a
Price-Jones curve. In the normal individual the shape of the curve is more constant than the mean diameter of the cells, which in a group of individuals will vary within, but rarely fall
outside, the range 6.7/* to 7.8/*. Price-Jones calculated what he called
' ideal' maximum and minimum normal curves (Price- Jones, 1933).
In different forms of anaemia this curve will
vary in shape, its median will move to the right or to the left, and it may be of the normal height, or flatter than normal.
These variations in the curve can be expressed in figures. The median can be given in terms of microns, but it is more usual to give the mean corpuscular diameter (MCD), also in
microns; the flatness of the curve is shown by the standard deviation ( o-) of the diameters of the cells from the mean diameter, or more
accurately by the co-efficient of variation (v), and also by the percentage microcytosis and macrocytosis. These data can all be calculated from the Price-Jones curve.
The measurement of cell volume percentage and calculation of the mean corpuscular volume (MCV) has been described already in an earlier paper in this series; this MCV gives the volume of the cells but not their diameter. Further, it is a ' mean' measurement and from it one gets no idea of the range of size of the individual
cells; it is therefore more limited in its appli- cation than the Price-Jones curve.
Neither measurement, however, alone will
give information on the thickness of the cells, but this can be calculated from the MCV and MCD. The method of making these calcula- tions will be described later. The technique of the measurement of cell
diameters.?The technique described below is a
modification of Hynes and Martin's method of measurement of red cell diameters. The images of the cells are projected on the
vertical ground-glass screen of a Bausch and Lomb euscope, at a magnification of 2,000, and the measurements are made with the help of a
celluloid protractor on which a series of circles, with diameters increasing by the equivalent of 0.25/a, have been drawn.
Apparatus required (i) A Bausch and Lomb euscope with projection
screen.
(ii) A mechanical-feed arc lamp with condenser, working at 4.5 amperes.
(Hi) A glass container filled with distilled water for cooling the beam of light from the arc
lamp (filter). (iv) A microscope with oil-immersion objective
and eye-piece to give a magnification of 2,000 on the projection screen of the euscope.
(v) A stage micrometer scale (Zeiss) with divisions lOju, apart.
(vi) A celluloid cm./mm. scale. (vii) Celluloid protractor for measuring the cells
(i>.i).
Preparing the celluloid protractor.?At a
magnification of 2,000, lyu, corresponds to 2 mm. and 0.25n to 0.5 mm. The circles on the pro- tractor are drawn with diameters increasing by the equivalent of 0.25^ (0.5 mm.), i.e., the radii of the circles increase by 0.25 mm. The measurements of the radii of the series of circles are best obtained from a diagonal scale drawn to give measurements in multiples of 0.25 mm. The circles are drawn in Indian ink with very
fine bow-pen compasses on a celluloid sheet, with radii increasing from 4 mm. to 12 mm. by steps of 0.25 mm., so as to give measurements corresponding to 4/a to 12 yu. diameter. Circles smaller and larger than the above are drawn on another sheet. The first sheet is generally sufficient for routine work; the second is needed very exceptionally {see figure 1).
Q o
6 t-H as 4.71 7
1 ?-7? #.$ ix a TTf 7-4
ft >71
Reduced to I original size.
10 1 ??11 n-t io*7S 11
IJt 1171 II 5 ibl*
Fig. 1. Fig. 1.
Reduced to f original size.

May, 1941] HEMATOLOGICAL TECHNIQUE : NAPIER & SEN GUPTA 293
Assembling and adjusting the apparatus.? Figure 2 shows the euscope with microscope
and arc lamp assembled. The concentrated beam of light from the arc lamp, cooled by Passage through water in the filter, is focused on to the concave mirror of the microscope which reflects it through the condenser; the objective, and the eye-piece of the microscope. The total reflexion prism of the euscope placed over the ocular reflects the light on to the opaque screen of the euscope. The condenser is fully raised llP, and, with the high power objective turned on, a bright beam of light is focused on the
opaque screen. After the illumination has been adjusted the micrometer scale is placed under the objective of the microscope and the image of the scale is focused on the opaque screen, first using the low power and finally the oil- immersion objective. A final adjustment of
fight is made to give the maximum illumination. The opaque screen is now moved off and the
image is focused on to the ground-glass pro- jection screen of the euscope. By moving the
microscope and/or the prism, the image of the scale is so projected that the lines of the scale are vertical, parallel and entirely free from spherical aberration, at least within an area of about 4 inches by 3 inches marked out around the centre of the viewing screen. That there is no spherical aberration within
this area can be shown by noting that the distances between the images of the lines are the same in all parts of this area. The magnifica- tion of the apparatus is adjusted to be 2,000 by using a suitable oil-immersion objective and
eye-piece, and varying the length of the draw- tube of the microscope. [A Zeiss microscope with objective 90, and a Leitz eye-piece 15 X, with a draw-tube length of 154 mm. gives a
magnification of 2,000 on the projection screen of the particular euscope used in our laboratory.] To find the magnification the distance be-
tween the images of two lines of the scale is
measured with the celluloid cm./mm. scale and, at a magnification of 2,000, the images of the fines of the scale are 2 cm. apart (2 cm. =
20,000//,). [If the different components of the
apparatus are kept fixed after the above adjust- ments, the measurements can be carried out
without repeating these adjustments every time.] Measuring the cells.?The micrometer scale
is next removed, the blood film, stained with a Romanowsky stain and counter stained with 1
per cent aqueous eosin solution, is placed under the oil-immersion objective, and the image of the cell is focused on the ground-glass screen of the euscope. Only those images of the cells that fall within the reduced field are measured. The celluloid protractor with the series of
graduated circles is superimposed on the image of the corpuscles to find the circle that fits the image of each cell. Each cell is measured to the nearest 0.25/x. The measurement of circular
corpuscles is quite easy. In the case of the
irregular-shaped corpuscles, a circle is found such that the area of the corpuscle falling out- side the circle is about the same as the area of the circle unfilled by the image of the corpuscle (see figure 3). Five hundred cells are measured
from different parts of the blood film. It is better to avoid the ' tail' end and the thick
parts of the smear, as in the former the cells are excessively spread out and in the latter the cells overlap and are not well spread. Recording the results.?By this method, 500
cells can be measured in about 40 to 90 minutes, the time depending on the size of the cells and the degree of poikilocytosis; the larger and more irregular the cells the longer is the time
required. An assistant is needed to note down the measurements and record the number of cells counted with a counting machine of the
type of a Veeder counter. From the figures obtained, the mean diameter,
standard deviation, and co-efficient of variation are calculated. A Price-Jones curve is drawn
by plotting the figures on graph paper. The
degree of microcytosis and macrocytosis can
also be determined from this curve, by com-
parison with the maximum and minimum ideal curves; the overlapping of a curve beyond the minimum ideal curve on the low side and the
maximum curve on the high side indicates the degree of microcytosis and macrocytosis, res-
pectively. Method of calculating.?The following figures
show the method of calculating the mean cell
diameter (MCD), the standard deviation, ( o-), and the co-efficient of variation (v). 6.5 n, the median, has been taken as the
arbitrary mean.
Fig. 2. Fig. 2.
Fig. 3. Fig. 3.
294 THE INDIAN MEDICAL GAZETTE [May, 1941
Dia- meters
in microns
5.25 5.50 5.75 6.00 6.25 6.50 6.75 7.00 7.25 7.50 7.75 8.00 8.25 850
Number of cor-
puscles in each class
(f)
4
Table I
Deviation (d) of each class from arb. mean, in 0.25a,
i.e., the class interval
-5 18 -4 34 67 74 107 70 50 46 18 5 4 2 1
500
-3 -2
1 0
+ 1
+ 2 + 3
+ 4 + 5 + 6 + 7 + 8
f X d
20 72
102 134 74
+ 70 + 100 + 138 + 72 + 25
+ 24
+ 14
+ 8
402
+ 451
+ 49
f X dJ
100 288 306 268 74 0 70 200 414 288 125 144 98 64
2,439
n = total number of observations = sum of fre-
quencies (/) = 500. 2 f d = sum ( 2 ) of the product of the frequencies
(/) and the degrees of deviation (d) from the
mean = + 49. 2 f da = sum of the product of the frequencies (/)
and the squares of the deviations (<f).
Class interval = 0.25/* .
Mean corpuscular diameter (MCD) =
arbitrary mean 4 X class interval^ =65 + Ga*025 > = 6.5245/*. Standard deviation Q) ^/v f d- /SfdV
n V n ) X class interval
= ^2439 soo-Gfo)2*0'25" = y,4-878?(0'098)2 XO-25,. = V/47878z::070096" X 0'25/*
=
1/4^868 X 0-25/x=2'206X 0'25/* =0"551/i.
Co-efficient of variation (v) =?2<_1^0=0^551 xlOo M CD 6*525
= 8.4 per cent
From the mean corpuscular diameter (MCD) and the mean corpuscular volume (vide part IV), the mean corpuscular average thickness (MCAT) can be calculated, by means of the following formula :?
MCAT = -M?V^ _MCV^ *r2 r
^MCDVj
Example.? Let 90 cu. n be the mean corpuscular volume (MCV) and 6.52/z the mean corpuscular diameter (MCD). Mean corpuscular average thickness (MCAT) = 90
oq
y ̂=04xl356?/X=2-69/i
The normal range of MCAT is from 1.7 to
2.5 /a (Price-Jones, Yaughan and Goddard, quoted by Whitby and Britton, 1939).
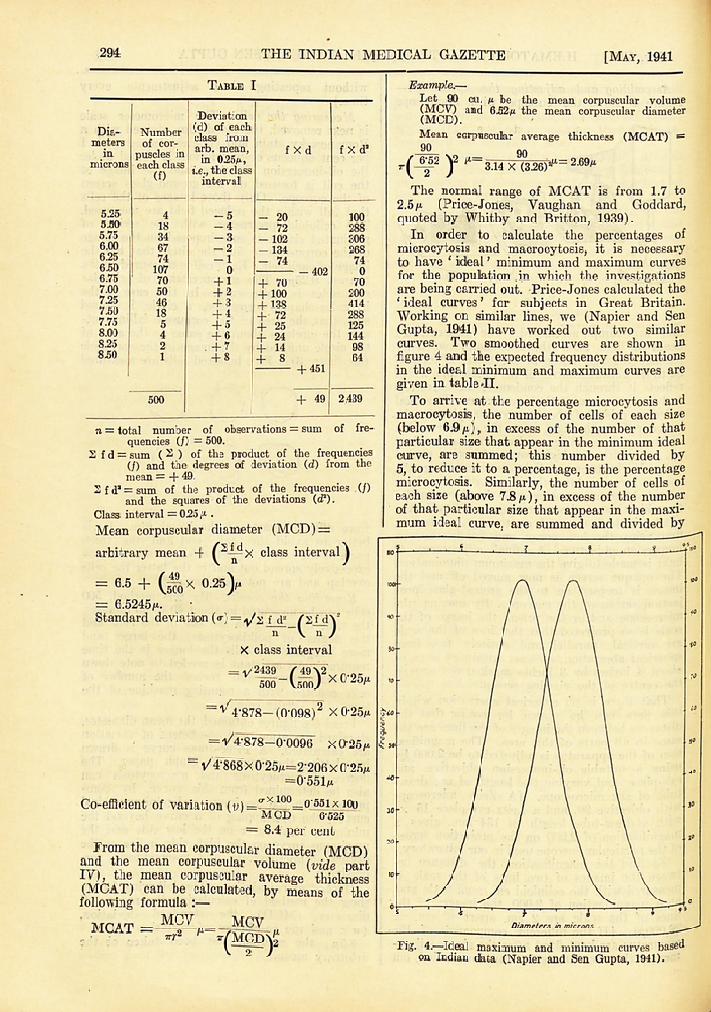
In order to calculate the percentages of
microcytosis and macrocytosis, it is necessary to have
' ideal' minimum and maximum curves for the population .in which the investigations are being carried out. Price-Jones calculated the
'ideal curves' for subjects in Great Britain. Working on similar lines, we (Napier and Sen Gupta, 1941) have worked out two similar curves. Two smoothed curves are shown in
figure 4 and the expected frequency distributions in the ideal minimum and maximum curves are
given in table'II. To arrive at the percentage microcytosis and
macrocytosis, the number of cells of each size
(below 6.9/x), in excess of the number of that particular size that appear in the minimum ideal curve, are summed; this number divided by 5, to reduce it to a percentage, is the percentage microcytosis. Similarly, the number of cells of each size (above 7.8n), in excess of the number of that particular size that appear in the maxi- mum ideal curve, are summed and divided by
T Diameters in microns
Fig. 4.?Ideal maximum and minimum curves based on Indian data (Napier and Sen Gupta, 1941).
Fig. 4.?Ideal maximum and minimum curves based on Indian data (Napier and Sen Gupta, 1941).

May, 1941] HEMATOLOGICAL TECHNIQUE : NAPIER & SEN GUPTA 295
5 to obtain the percentage macrocytosis (vide table II).
Significance of the findings.?It is not possible here to enter into any extensive discussion on
the significance of the different findings, but as a general rule it may be taken that in cases that have a high microcytosis percentage and a low MCV the anaemia is due to iron deficiency.
Measure- ment to nearest 0.25 fi
Frequency distributions for
ideal minimum curve,
MCD = 6.942m o" 0.4925w-
4.00 4.25 4.50 4.75 5.00 5.25 5.50 1 5.75 6 6.00 17 6.25 38 6.50 68 6.75 93 7.00 100 7.25 83 7.50 53 7.75 27 8.00 10 8.25 3 8.50 l 8.75 9.00 9.25 9.50 9.75 10.00 10.25 10.50 10.75 11.00 11.25 11.50 11.75 12.00
ideal maximum curve,
MCD = 7.747 m 0" = 0.4925/4
1 4 13 33 62 89 100 87 61 32 38 13 35
Table II
Cass X
Count
1 0 1 1 1 6 3
11 12 29 41 70 50 40 70 40
4 18 1 16
Excess of microcytes
Excess of macrocytes
22 14 15
8 1 .. 1 2 .. 2 1 .. 1
2 .. 2
1 .. 1
0 1 0 0 1
500 3 74
Count
7 2
7 8
22 30 43 38 56 45 39 41 31 47 27 9
11 9 7 10 3 5 3
Case Y
500
Excess of Excess of microcytes macrocytes
7 2 7 8
22 30 42
32 39 7
196
Case X
r, f . . . 3 X 100 Percentage of microcytosis = ^
= 0.6 per cent.
74 X 100 ,
? ? macrocytosis = ??= 14.8 per cent.
MCD= 7.791/* o" = 0.903 /i v = 11.5 per cent.
Case Y
Percentage of microcytosis = 500 Per cen^
7 X 100 , ,
? ? macrocytosis = ___?= 1.4 per cent. 5UO
MCD = 6.434 m o- = 1.07 m i' = 16.6 per cent.
London (Price-Jones. 1933).
Calcutta (Napier and Sen Gupta, 1941).
Number of observations
Normals
Mean corpuscular DIAMETER (MCD)/i
Max.
1(W> 7.718
25 7.747
Min.
6.686
6.941
Mean
7.202
7.344
Standard deviation (?") A4
Max.
0.500
0.643
Min.
0.400
Mean
0.487
0.341 0.492
Co-efficient of
variation {v) %
Max. Min. Mean
7.30
8.84
5.30
4.58
6.326
6.720

296 THE INDIAN MEDICAL GAZETTE [May, 1941
When such microcytosis is associated with a
normal, or even a high MCV, it means that the cells are thicker than normal and there is a
tendency to spherocytosis; such a condition is
usually found in hsemolytic anaemias. Perni- cious anaemia shows a flat curve with a wide
base, usually a high percentage of macrocytes and a few microcytes, whereas tropical macro- cytic anaemia is usually associated with a
moderately tall curve with an MCD slightly on the macrocytic side, a few macrocytes, and probably no microcytes.
REFERENCES
Napier, L. E., and Sen In press. Gupta, P. C. (1941).
Price-Jones, C. (1933). Red Blood Cell Diameters. Oxford University Press.
Whitby, L. E. H., and Disorders of the Blood. Britton, C.J. C. (1939). J. and A. Churchill, Ltd.,
London.