HM Treasury Labour Market Conference October 14 2013uctp39a/Blundell HMT Presentation October 14...
50
© Institute for Fiscal Studies What has been driving living standards? Richard Blundell University College London and Institute for Fiscal Studies Thanks to Jonathan Cribb, Wenchao Jin, Robert Joyce and Cormac O’Dea. This research is funded by the ERSC Centre (CPP) at IFS. HM Treasury Labour Market Conference October 14 th 2013
Transcript of HM Treasury Labour Market Conference October 14 2013uctp39a/Blundell HMT Presentation October 14...

© Institute for Fiscal Studies
What has been driving living standards?
Richard Blundell University College London and Institute for Fiscal Studies
Thanks to Jonathan Cribb, Wenchao Jin, Robert Joyce and Cormac O’Dea.
This research is funded by the ERSC Centre (CPP) at IFS.
HM Treasury Labour Market Conference October 14th 2013

Outline I will look (briefly) at Incomes, Earnings and Consumption
All three measures have something important to say.
1. Incomes: Working-age and Pensioners 2. Earnings: Wage Changes, Employment and Productivity 3. Consumption: Durable and Non-durable Expenditures 4. Prospects
Under each heading some summary points and supporting evidence.
Draw on three references to recent IFS research: Ø Living Standards, Poverty and Inequality in the UK.
– IFS Report R81, http://www.ifs.org.uk/comms/r81.pdf
Ø What Can Wages Tell Us about the Productivity Puzzle? – IFS Working Paper, W13/11; forthcoming Economic Journal, http://www.ifs.org.uk/wps/
wp201311.pdf
Ø Household Consumption through Recent Recessions. – Fiscal Studies, 34(2), June 2013,
http://onlinelibrary.wiley.com/doi/10.1111/j.1475-5890.2013.12003.x/abstract
© Ins&tute for Fiscal Studies

1. Incomes • Leading up the recession:
• income growth had slowed in early 2000s. • pensioners/ working-age childless were doing relatively well/
badly
• During recession and immediately afterwards: • real earnings for those in work fell; benefits/tax credit
incomes were robust. • employment rates fell for young adults but not for older
ones. • As a result:
a) income inequality fell (despite rise in earnings inequality among workers)
b) young adults did worst; pensioners did best (again)
© Ins&tute for Fiscal Studies

-‐1.0%
-‐0.5%
0.0%
0.5%
1.0%
1.5%
2.0%
2.5%
3.0%
3.5%
4.0%
10 20 30 40 50 60 70 80 90 Average an
nual re
al income chan
ge Parents and children
Working-age without children
Pensioners
Percentile point
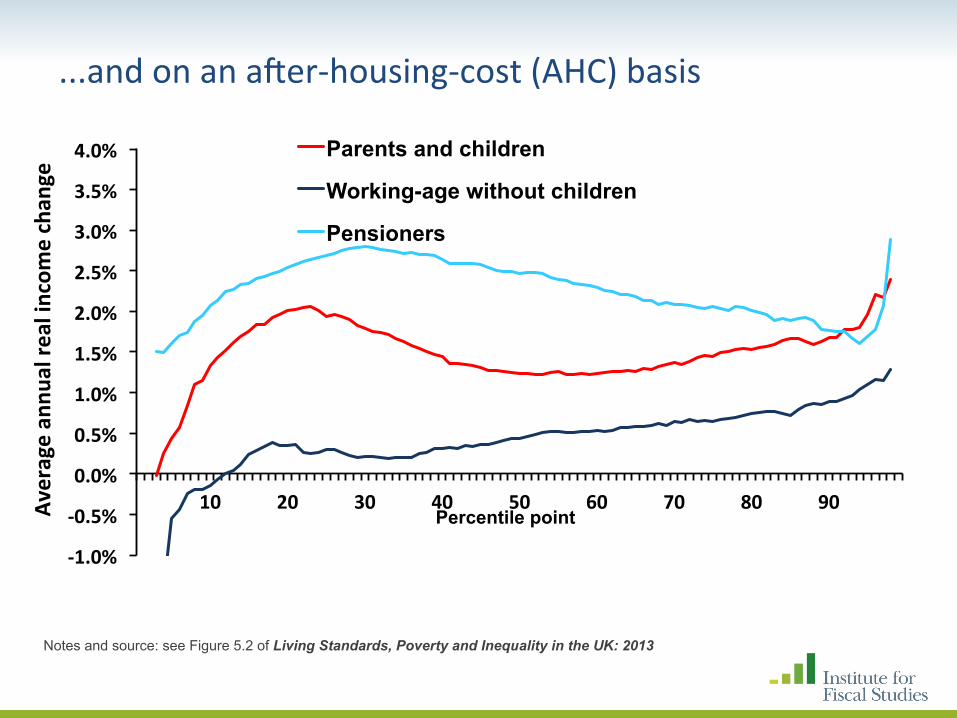
1996-‐97 to 2011-‐12: pensioners did rela&vely well; working-‐age childless rela&vely badly
Notes and source: see Figure 5.2 of Living Standards, Poverty and Inequality in the UK: 2013
-‐1.0%
-‐0.5%
0.0%
0.5%
1.0%
1.5%
2.0%
2.5%
3.0%
3.5%
4.0%
10 20 30 40 50 60 70 80 90 Average an
nual re
al income chan
ge Parents and children
Working-age without children
Pensioners
Percentile point
...and on an aFer-‐housing-‐cost (AHC) basis
Notes and source: see Figure 5.2 of Living Standards, Poverty and Inequality in the UK: 2013

Trends not uniform: slower growth from early 2000s
100
105
110
115
120
125
1997–98=100
Mean income Median Income
© Ins&tute for Fiscal Studies
Source: Family Resources Survey, various years

Trends not uniform: slower growth from early 2000s
100
105
110
115
120
125
1997–98=100
Mean income Median Income
© Ins&tute for Fiscal Studies
Source: Family Resources Survey, various years

... and large falls aFer the recession
100
105
110
115
120
125
1997–98=100
Mean income Median Income
© Ins&tute for Fiscal Studies
Source: Family Resources Survey, various years
© Ins&tute for Fiscal Studies
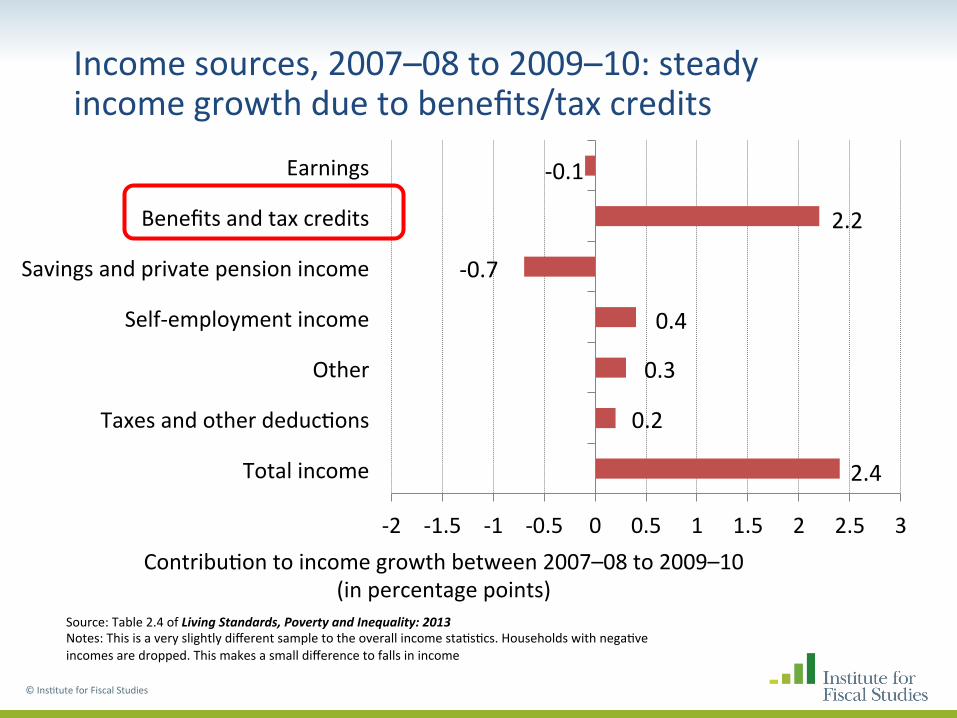
Source: Table 2.4 of Living Standards, Poverty and Inequality: 2013 Notes: This is a very slightly different sample to the overall income sta&s&cs. Households with nega&ve incomes are dropped. This makes a small difference to falls in income
Income sources, 2007–08 to 2009–10: steady income growth due to benefits/tax credits
-‐2 -‐1.5 -‐1 -‐0.5 0 0.5 1 1.5 2 2.5 3
Total income
Taxes and other deduc&ons
Other
Self-‐employment income
Savings and private pension income
Benefits and tax credits
Earnings
Contribu&on to income growth between 2007–08 to 2009–10 (in percentage points)
-‐0.1
0.4
0.3
0.2
2.4
2.2
-‐0.7

© Ins&tute for Fiscal Studies
Source: Table 2.4 of Living Standards, Poverty and Inequality: 2013 Notes: This is a very slightly different sample to the overall income sta&s&cs. Households with nega&ve incomes are dropped. This makes a small difference to falls in income
Income sources, 2009–10 to 2011–12: large income falls due to falling earnings
-‐10 -‐8 -‐6 -‐4 -‐2 0 2 4
Total income
Taxes and other deduc&ons
Other
Self-‐employment income
Savings and private pension income
Benefits and tax credits
Earnings
Contribu&on to income growth between 2009–10 to 2011–12 (in percentage points)
-‐5.7
-‐2.0
-‐0.4
2.4
-‐7.5
-‐1.0
-‐0.7

© Ins&tute for Fiscal Studies
Source: Table 2.4 of Living Standards, Poverty and Inequality: 2013 Notes: This is a very slightly different sample to the overall income sta&s&cs. Households with nega&ve incomes are dropped. This makes a small difference to falls in income
Income sources: 2007–08 to 2011–12
-‐10 -‐8 -‐6 -‐4 -‐2 0 2 4
Total income
Taxes and other deduc&ons
Other
Self-‐employment income
Savings and private pension income
Benefits and tax credits
Earnings
Contribu&on to income growth between 2007–08 to 2011–12 (in percentage points)
-‐5.9
-‐1.6
-‐0.1
2.7
-‐5.3
1.2
-‐1.5

-‐12.0%
-‐11.0%
-‐10.0%
-‐9.0%
-‐8.0%
-‐7.0%
-‐6.0%
-‐5.0%
-‐4.0%
-‐3.0%
-‐2.0%
-‐1.0%
0.0% 10 20 30 40 50 60 70 80 90
Cumula>
ve re
al cha
nge Percentile point
Weekly earnings inequality (among workers) rose between 2007-‐08 to 2011-‐12...
Notes and source: see Figure 3.10 of Living Standards, Poverty and Inequality in the UK: 2013
Note: towards bottom, much driven by falls in hours worked
(not falls in hourly wages)

...but net result was s&ll a fall in income inequality
© Ins&tute for Fiscal Studies
-12%
-8%
-4%
0%
4%
8%
10 20 30 40 50 60 70 80 90
Inco
me
chan
ge
2007–08 to 2009–10 2009–10 to 2011–12 2007–08 to 2011–12
Percentile point
Source: Figure 3.5 of Living Standards, Poverty and Inequality: 2013

Median income changes by age (BHC, GB)
Notes and source: see Figure 5.7 of Living Standards, Poverty and Inequality in the UK: 2013
-4%
-3%
-2%
-1%
0%
1%
2%
3%
4%
0s 10s 20s 30s 40s 50s 60s 70s
Aver
age
annu
al g
row
th
2007–08 to 2011–12 2001–02 to 2007–08
Age
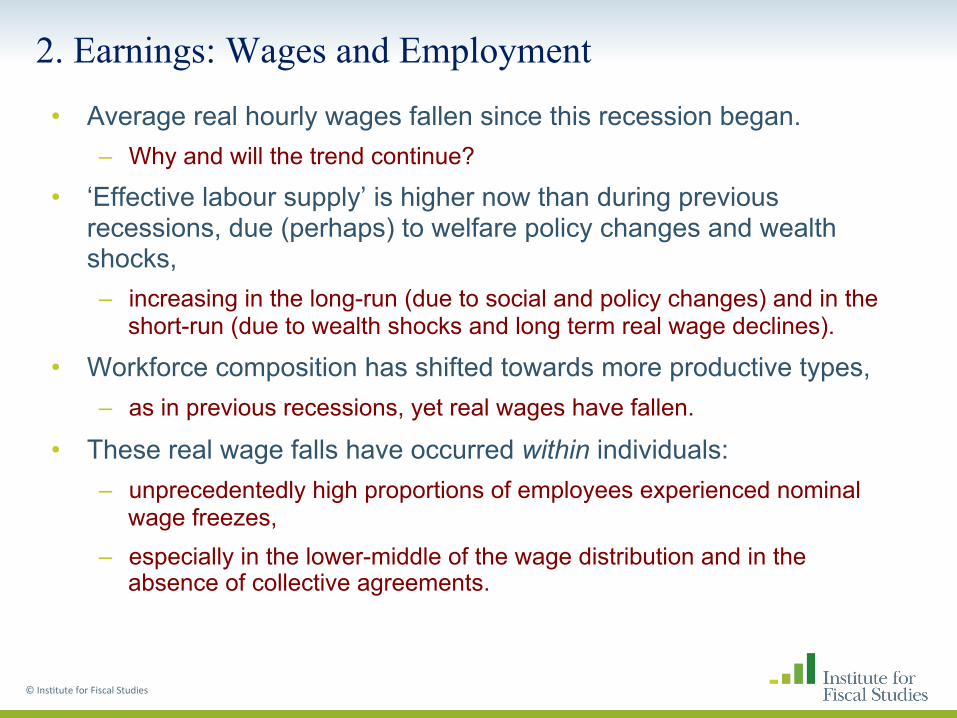
2. Earnings: Wages and Employment
• Average real hourly wages fallen since this recession began. – Why and will the trend continue?
• ‘Effective labour supply’ is higher now than during previous recessions, due (perhaps) to welfare policy changes and wealth shocks, – increasing in the long-run (due to social and policy changes) and in the
short-run (due to wealth shocks and long term real wage declines).
• Workforce composition has shifted towards more productive types, – as in previous recessions, yet real wages have fallen.
• These real wage falls have occurred within individuals: – unprecedentedly high proportions of employees experienced nominal
wage freezes, – especially in the lower-middle of the wage distribution and in the
absence of collective agreements.
© Ins&tute for Fiscal Studies

In contrast to previous recessions, real output per hour has at best been stagnant since 2008: why?
90
95
100
105
110
115
120
0 1 2 3 4 5 6 7 8 9 10 11 12 13 14 15 16 17 18 19 20 Quarter since the labelled one
Real output per hour
1979Q4 1990Q2 2008Q1 Linear trend (90Q2-‐08Q1)

Average real hourly wages have also been stagnant
95
100
105
110
115
120
0 1 2 3 4 5 6
Real hou
rly wage (first y
ear o
f recession = 100)
Years since the year in which the recession began
Average real male hourly wage (using GDP deflator)
1979 1990 2008 Linear trend 1990-‐2008

The UK is different.....
0.85
0.9
0.95
1
1.05
1.1
1.15
2007 2008 2009 2010 2011 2012
UK, GDP per hour
US, GDP per hour
France, GDP per hour
Germany, GDP per hour
UK, average wage
US, average wage
France, average wage
Germany, average wage

Employment and labour market par&cipa&on
• Labour market par&cipa&on has held up beier during this recession than previous ones. For example: – Employment rates fell less (and unemployment rates increased
less)
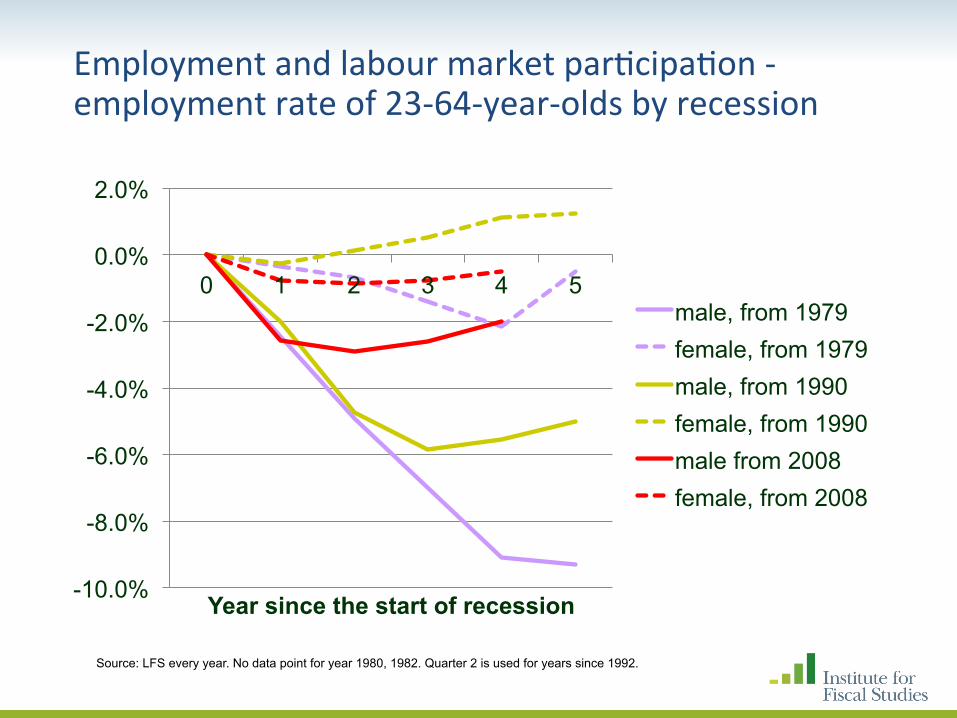
Employment and labour market par&cipa&on -‐ employment rate of 23-‐64-‐year-‐olds by recession
-10.0%
-8.0%
-6.0%
-4.0%
-2.0%
0.0%
2.0%
0 1 2 3 4 5
Year since the start of recession
male, from 1979 female, from 1979 male, from 1990 female, from 1990 male from 2008 female, from 2008
Source: LFS every year. No data point for year 1980, 1982. Quarter 2 is used for years since 1992.

Change to the propor&on of 23-‐64-‐year-‐olds who are unemployed by recession
0.0%
1.0%
2.0%
3.0%
4.0%
5.0%
6.0%
0 1 2 3 4 5
male, from 1979
female, from 1979
male, from 1990
female, from 1990
male from 2008
female, from 2008
Source: LFS every year. No data point for year 1980, 1982. Quarter 2 is used for years since 1992.
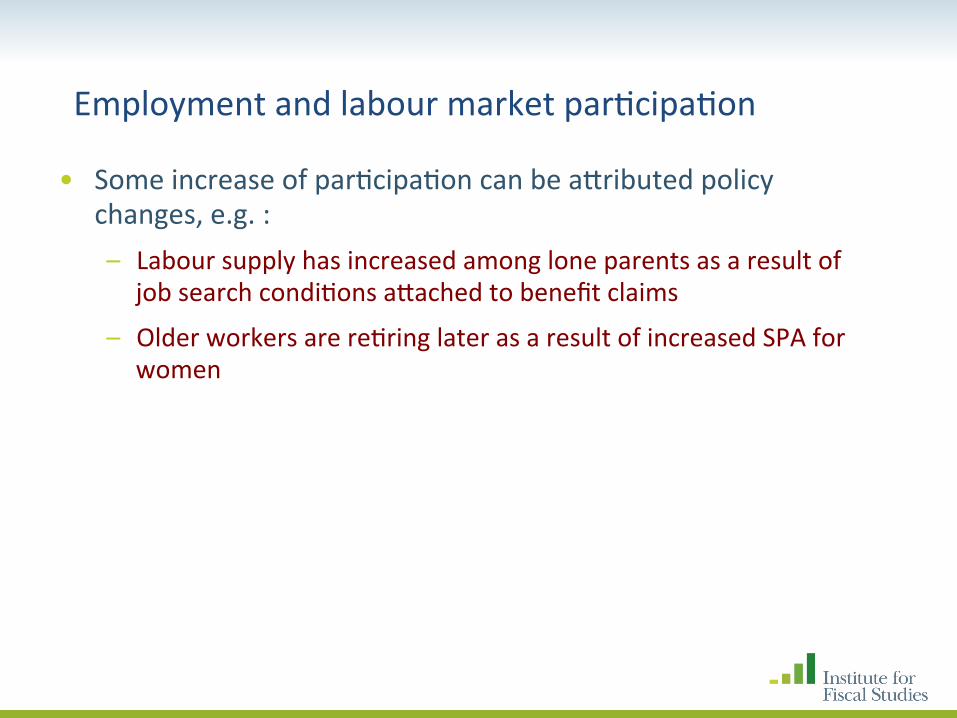
Employment and labour market par&cipa&on
• Some increase of par&cipa&on can be aiributed policy changes, e.g. : – Labour supply has increased among lone parents as a result of
job search condi&ons aiached to benefit claims
– Older workers are re&ring later as a result of increased SPA for women

Change to lone mothers’ par&cipa&on rate since policy change
-‐8% -‐6% -‐4% -‐2% 0% 2% 4% 6% 8% 10% 12% 14%
0 1 2 3 4 5 6 7 8 9 10 11 12 13 14 15 Quarter since the last quarter before policy change
youngest kid 12-‐15, 2008Q3 youngest kid10-‐11, 2009Q3
youngest kid 7-‐9, 2010Q3 youngest kid 5-‐6, 2011Q3

Impact of SPA increase for women on employment
30%
35%
40%
45%
50%
55%
60%
Counterfactual male 60-‐64 employment rate
LFS employment rate 60-‐64 men
Counterfactual female 60-‐64 employment rate
LFS employment rate 60-‐64 year old women
Note: counterfactual employment rates are estimated. See Cribb et al (2013) “Incentives, shocks or signals: labour supply effects of increasing the female state pension age in the UK”

Employment and self-‐employment rate of older people
-‐10%
-‐8%
-‐6%
-‐4%
-‐2%
0%
2%
4%
2001Q1
2001Q3
2002Q1
2002Q3
2003Q1
2003Q3
2004Q1
2004Q3
2005Q1
2005Q3
2006Q1
2006Q3
2007Q1
2007Q3
2008Q1
2008Q3
2009Q1
2009Q3
2010Q1
2010Q3
2011Q1
2011Q3
2012Q1
2012Q3
2007Q4 = 0
employment rate 60-‐74 male self-‐employment rate 60-‐74 male
employment rate 60-‐74 female self-‐employment rate 60-‐74 female

Employment status of 16-‐22-‐year-‐olds
0%
10%
20%
30%
40%
50%
60%
70%
80% % in work % unemployed
Source: LFS 2nd
quarter every year

Employment and labour market par&cipa&on
• There is also some (weak) evidence that par&cipa&on amongst older people has increased as a result of shocks to housing or financial wealth § But probably a response to falling expected real wages too.

Can changes in the composi&on of the workforce explain the fall in real hourly wages?
• Short answer: no – unlike, to an extent, in other countries.
• As in previous recessions, the composi&on of the workforce shiFed towards more produc&ve workers, – hence we would have expected the average real wage to increase
(other things being equal).
• What has been different in this recession is that the returns to those characteris&cs have fallen substan&ally.
• This is true even amongst workers who keep their jobs, who have experienced nominal wage freezes/real wage falls, – May have been facilitated by the reduced power of labour market
ins&tu&ons (e.g. unions) since previous recessions.

Average real hourly wage by age group (RPI deflated)
0
2
4
6
8
10
12
14
16
18
1993 1994 1995 1996 1997 1998 1999 2000 2001 2002 2003 2004 2005 2006 2007 2008 2009 2010 2011 2012
16-‐17
18-‐25
26-‐35
36-‐45
46-‐55
56-‐64
65+

Average real hourly wage by qualifica&on among young people
0.00
2.00
4.00
6.00
8.00
10.00
12.00
14.00
18-‐21, GCSEs or above
18-‐21, no GCSEs or equilvants
22-‐24, degree or above
22-‐24, GCSEs, no degrees
22-‐24, no GCSEs

NEET rate among young people
0%
10%
20%
30%
40%
50%
60%
18-‐21, GCSEs or above
18-‐21, no GCSEs or equilvants
22-‐24, degree or above
22-‐24, GCSEs, no degrees
22-‐24, no GCSEs

%change to real hourly wage since last year, by period

% facing nominal wage freeze in the coming year by current wage quintile
0%
2%
4%
6%
8%
10%
12%
14%
16% 1975
1976
1977
1978
1979
1980
1981
1982
1983
1984
1985
1986
1987
1988
1989
1990
1991
1992
1993
1994
1995
1996
1997
1998
1999
2000
2001
2002
2003
2004
2005
2006
2007
2008
2009
2010
Lowest-‐paid 20% 2nd quin&le 3rd quin&le 4th quin&le Highest-‐paid 20%
Source: New Earnings Survey Panel Dataset 1975-‐2011. There are 20,000-‐30,000 observa&ons underlying each data point.

More nominal pay freezes in the absence of collec&ve agreement since 2008
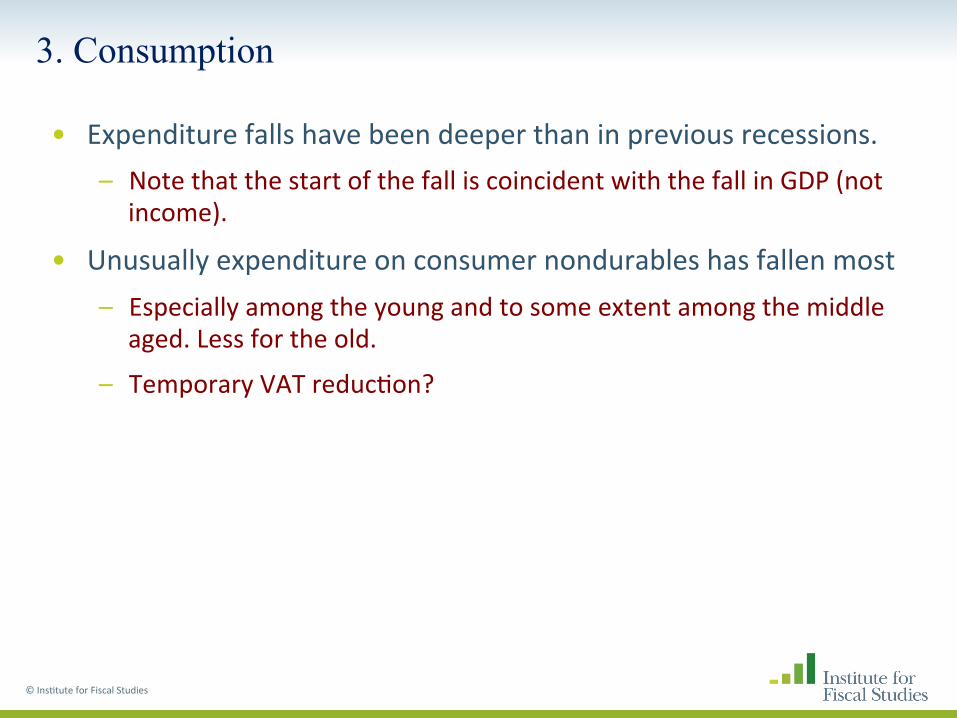
3. Consumption
• Expenditure falls have been deeper than in previous recessions. – Note that the start of the fall is coincident with the fall in GDP (not
income).
• Unusually expenditure on consumer nondurables has fallen most – Especially among the young and to some extent among the middle
aged. Less for the old.
– Temporary VAT reduc&on?
© Ins&tute for Fiscal Studies

Non-‐ and semi-‐durables
© Ins&tute for Fiscal Studies
90
92
94
96
98
100
102
104
106
108
110
0 1 2 3 4 5 6 7 8 9 10 11 12 13 14 15 16 17 18 19 20
Chan
ge since be
ginn
ing of re
cessions (q
uarter
prior to recession = 100)
Quarters since beginning of recession
1980
1990
2008

Durables
© Ins&tute for Fiscal Studies
80
85
90
95
100
105
110
115
120
125
0 1 2 3 4 5 6 7 8 9 10 11 12 13 14 15 16 17 18 19 20
Chan
ge since be
ginn
ing of re
cessions (q
uarter
prior to recession = 100)
Quarters since beginning of recession
1980
1990
2008

Components of GDP
© Ins&tute for Fiscal Studies
-‐20
-‐15
-‐10
-‐5
0
5
10
15
Chan
ge since 2008 Q1 (£b) Net exports
Govt. purchases
Consumer durables
Nondurable consump&on
Corporate investment

Propor&onate Fall in Each Component
© Ins&tute for Fiscal Studies
65
70
75
80
85
90
95
100
105
110
Chan
ge since 2008 Q1 (2008 Q1 = 100)
Govt. purchases
Consumer durables
Nondurable consump&on
Corporate investment

Consumption
• Homeowners have made the largest cuts. – In past recessions there was liile difference between owners and renters.
• Saving ra&os are lower than during the early 1980s and early 1990s – but haven risen drama&cally since 2008 (and pension contribu&ons higher).
• The data points to an expecta&on of a permanent fall in living standards, – especially among the young and middle-‐aged.
© Ins&tute for Fiscal Studies
4. Summary and … Prospects …
• What has driven living standards?
• Changes in the labour market are a key factor behind the changes, – especially for younger families/singles rela&ve to pensioners.
• Real wages and employment tell much of the story. Benefit changes have also been important drivers. – the poor employment and earnings performance of young adults
maps into big falls in their incomes rela&ve to older workers.
• The con&nued catch-‐up of pensioners rela&ve to working-‐age adults is in large part due to the sharp falls in real earnings and rela&vely robust benefit rates.
© Ins&tute for Fiscal Studies

Simula&ons up to 2015–16
© Ins&tute for Fiscal Studies
-8%
-6%
-4%
-2%
0%
2%
10 20 30 40 50 60 70 80 90
Inco
me
chan
ge
2007–08 to 2011–12 2011–12 to 2015–16 2007–08 to 2015–16
Percentile point
Note: Figure taken from Brewer et. al. (2013), Fiscal Studies, Vol. 34, No. 2, June 2013, Vol. 34, No. 2, pp. 179–201. Published before the latest HBAI release. The 2011–12 income distribu&on is therefore a simula&on, but is extremely similar to the actual data.
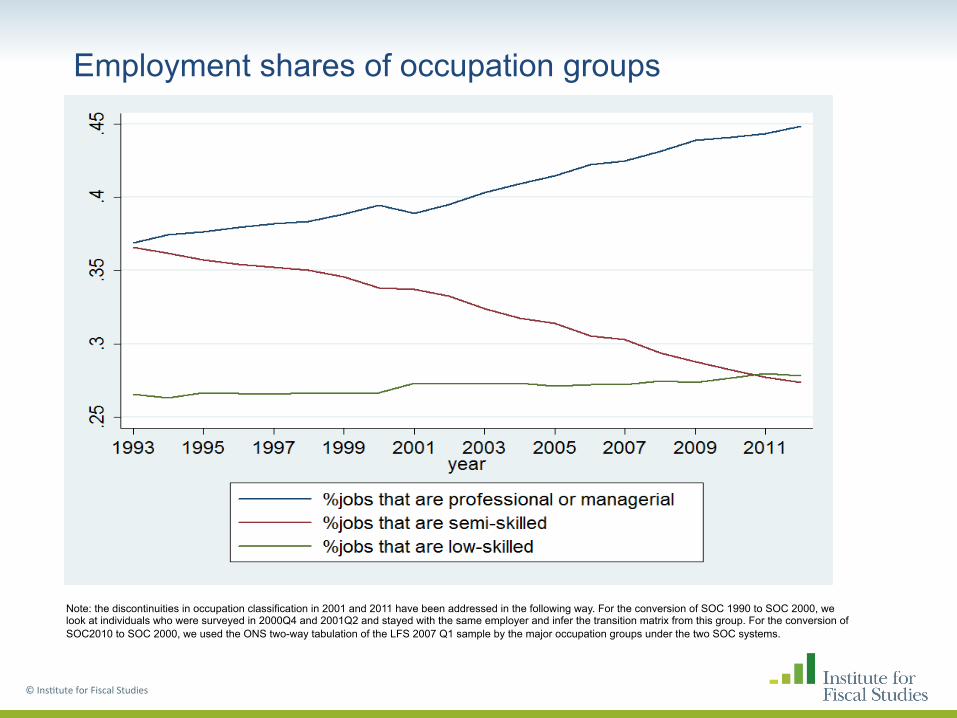
Employment shares of occupation groups
© Ins&tute for Fiscal Studies
Note: the discontinuities in occupation classification in 2001 and 2011 have been addressed in the following way. For the conversion of SOC 1990 to SOC 2000, we look at individuals who were surveyed in 2000Q4 and 2001Q2 and stayed with the same employer and infer the transition matrix from this group. For the conversion of SOC2010 to SOC 2000, we used the ONS two-way tabulation of the LFS 2007 Q1 sample by the major occupation groups under the two SOC systems.

(RPI deflated) Real wages by occupation group since 1993
© Ins&tute for Fiscal Studies
Note: the low-skilled wage would end up around the 1993 level if we use CPI instead of RPI. Each log wage series is normalized to 0 in 1993.

Prospects - I • Younger workers and families are ac&ng as if they expect a long-‐run fall
in rela&ve living standards – evidence from consump&on and saving.
• Real wages, produc&vity and capital investment have slow to pick up – we can expect the paiern of lower real wages to con&nue, but with fairly
buoyant employment due to increased supply.
• Most falls in real earnings have happened (but low/no real growth) – fiscal contrac&on implies >£20 bn year of benefit cuts by end of this parliament
– trends by age maybe more durable, e.g. pensioner benefits protected
• The number of rou&ne jobs near the middle of the earnings distribu&on has declined steadily &ll 2009 – more jobs are now professional or managerial. In the late 90s to early 2000s, wages
grew fast for high (and mid-‐skilled) occupa&ons, but this slowed down around 2003 and real wages fell since 2009.
• Suggests longer term earnings growth will mostly come from high-‐skilled occupa&ons, with some at the very boiom.
Prospects - II • But s&ll much to do in focussing on older workers in general, on return
to work for parents/mothers, and on entry into work.
• There are s&ll some poten&al big gains here, – for example, as (higher skilled) women age in the workforce.
• Tax/welfare reforms to enhance earnings (from Mirrlees): – refocus incen&ves towards transi&on to work, return to work for lower
skilled mothers and on enhancing incen&ves among older workers.
• Produc&vity is s&ll the key, – (financial) capital misalloca&on and poten&al investment returns.
• Human capital and ‘on the job’ wage/produc&vity complementarity – note the rela&ve importance of mismatch of entry skills in the recession.
• Produc&vity and wages are closely related but note recent growth in the wedge between labour costs and hourly wages, – the growing importance of pensions and NI in the UK,
– what will the trends in this wedge look like?

Employer contribu&ons to pension funds – in constant prices terms
Source: Office for National Statistics Notes: Data for Q4 2012 is not yet published so has been estimated based on Q4 2011 to Q3 2012 data

Prospects - II • But s&ll much to do in focussing on older workers in general, on return
to work for parents/mothers, and on entry into work.
• There are s&ll some poten&al big gains here, – for example, as (higher skilled) women age in the workforce.
• Tax/welfare reforms to enhance earnings (from Mirrlees): – refocus incen&ves towards transi&on to work, return to work for lower
skilled mothers and on enhancing incen&ves among older workers.
• Produc&vity is s&ll the key, – (financial) capital misalloca&on and poten&al investment returns.
• Human capital and ‘on the job’ wage/produc&vity complementarity – note the rela&ve importance of mismatch of entry skills in the recession.
• Produc&vity and wages are closely related but note recent growth in the wedge between labour costs and hourly wages, – the growing importance of pensions and NI in the UK,
– what will the trends in this wedge look like?
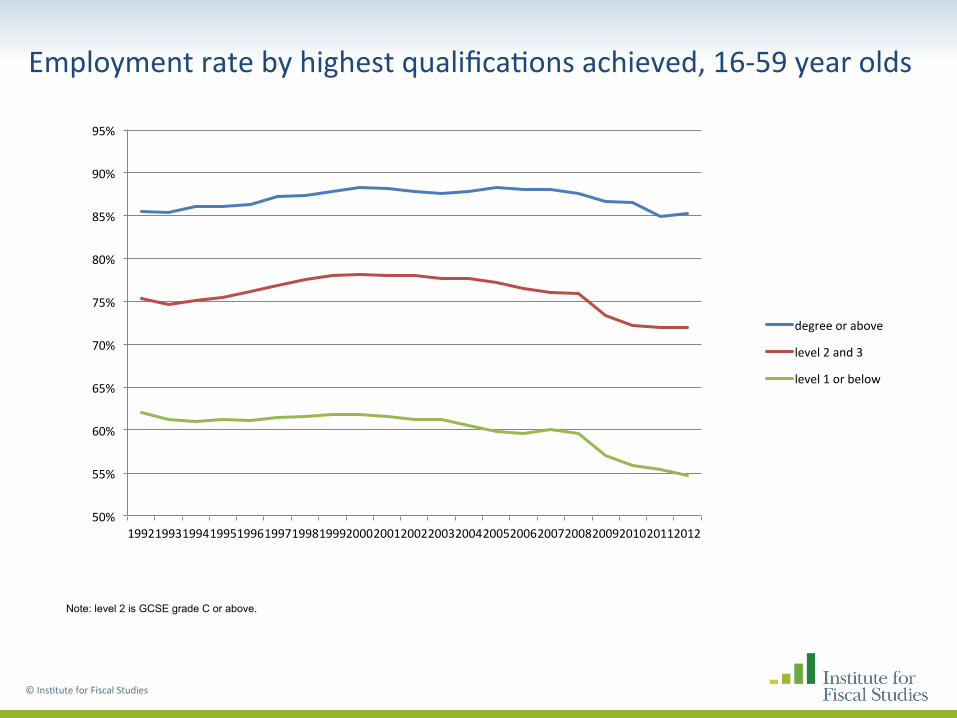
Employment rate by highest qualifica&ons achieved, 16-‐59 year olds
© Ins&tute for Fiscal Studies
Note: level 2 is GCSE grade C or above.
50%
55%
60%
65%
70%
75%
80%
85%
90%
95%
1992 1993 1994 1995 1996 1997 1998 1999 2000 2001 2002 2003 2004 2005 2006 2007 2008 2009 2010 2011 2012
degree or above
level 2 and 3
level 1 or below

Par&cipa&on rates over &me
0.0% 10.0% 20.0% 30.0% 40.0% 50.0% 60.0% 70.0% 80.0% 90.0%
100.0%
23-64, male 23-64, female 65-84, male 65-84, female