H&M group capital markets day stockholm 2018 · H&M group capital markets day Stockholm 2018 ......
49
H&M group capital markets day Stockholm 2018 H&M GROUP CAPITAL MARKETS DAY 2018
Transcript of H&M group capital markets day stockholm 2018 · H&M group capital markets day Stockholm 2018 ......

H&M groupcapital markets day
Stockholm 2018
H & M G R O U P C A P I T A L M A R K E T S D A Y 2 0 1 8
Disclaimer THIS PRESENTATION IS NOT AN OFFER OR SOLICITATION OF AN OFFER TO BUY OR SELL SECURITIES. IT IS SOLELY FOR USE AT A CAPITAL MARKETS EVENT AND IS PROVIDED AS INFORMATION ONLY. THIS PRESENTATION DOES NOT CONTAIN ALL OF THE INFORMATION THAT IS MATERIAL TO AN INVESTOR. THIS PRESENTATION IN AND OF ITSELF SHOULD NOT FORM THE BASIS OF ANY INVESTMENT DECISION. BY ATTENDING THE PRESENTATION OR BY READING THE PRESENTATION SLIDES YOU AGREE TO BE BOUND AS FOLLOWS: This presentation is not an offer for sale of securities in the United States, Canada or any other jurisdiction.
This presentation may not be all-inclusive and may not contain all of the information that you may consider material. Neither H&M group nor any third party nor any of their respective affiliates, shareholders, directors, officers, employees, agents and advisers makes any expressed or implied representation or warranty as to the completeness, fairness or reasonableness of the information contained herein and none of them accepts any responsibility or liability (including any third party liability) for any loss or damage, whether or not arising from any error or omission in compiling such information or as a result of any party’s reliance on or use of such information.
Certain data in this presentation was obtained from various external data sources and H&M group has not verified such data with independent sources. Accordingly, H&M group makes no representations as to the accuracy or completeness of that data. Such data involves these risks and uncertainties and is subject to change based on various factors.
By accessing this presentation the recipient will be deemed to represent that they possess, either individually or through their advisers, sufficient investment expertise to understand the information contained herein. The recipient of this presentation must make its own independent investigation and appraisal of the business and financial condition of H&M group. Each recipient is strongly advised to seek its own independent financial, legal, tax, accounting and regulatory advice in relation to any investment.
This presentation does not constitute a prospectus or other offering document or an offer or invitation to subscribe for or purchase any securities and nothing contained herein shall form the basis of any contract or commitment whatsoever. This presentation is being furnished to you solely for your information and may not be reproduced, copied, shared, disseminated or redistributed, in whole or in part, in any manner whatsoever to any other person. The distribution of this presentation in certain jurisdictions may be restricted by law and persons into whose possession this presentation comes should inform themselves about, and observe, any such restrictions.
No securities have been or will be registered under the U.S. Securities Act of 1933, as amended (the Securities Act) or with any securities regulatory authority of any state or other jurisdiction of the United States and securities may not be offered, sold or transferred within the United States or to U.S. persons except pursuant to an exemption from, or in a transaction not subject to, the registration requirements of the Securities Act and applicable state securities laws. This presentation is not a public offer of securities for sale in the United States.
In the United Kingdom this presentation is being made only to and is directed only at (a) persons who have professional experience in matters relating to investments who fall within Article 19(1) of the Financial Services and Markets Act 2000 (Financial Promotion) Order 2005 (the Order) and (b) other persons to whom it may otherwise lawfully be communicated in accordance with the Order (all such persons together being referred to as relevant persons). Any investment activity to which this communication may relate is only
available to, and any invitation, offer, or agreement to engage in such investment activity will be engaged in only with, relevant persons. Any person who is not a relevant person should not act or rely on this document or any of its contents.
Certain statements contained in this presentation reflect H&M group’s current views with respect to future events and financial and operational performance. Except for the historical information contained herein, statements in this presentation which contain words or phrases such as “will”, “aim”, “will likely result”, “would”, “believe”, “may”, “result”, “expect”, “will continue”, “anticipate”, “estimate”, “intend”, “plan”, “contemplate”, “seek to”, “future”, “objective”, “goal”, “strategy”, “philosophy”, “project”, “should”, “view ”, “will pursue” and similar expressions or variations of such expressions may constitute “forward-looking statements”. These forward-looking statements involve a number of risks, uncertainties and other factors that could cause H&M group’s actual development and results to differ materially from any development or result expressed or implied by such forward-looking statements. H&M group undertakes no obligation to publicly update or revise forward-looking statements contained herein, whether as a result of new information, future events or otherwise. In addition, forward-looking statements contained in this presentation regarding past trends or activities should not be taken as a representation that such trends or activities will continue in the future. You should not place undue reliance on forward-looking statements, which speak only as of the date of this presentation.
H & M G R O U P C A P I T A L M A R K E T S D A Y 2 0 1 8

a market overview
H & M G R O U P C A P I T A L M A R K E T S D A Y 2 0 1 8

— apparel is a large and relevant industry
A MARKET OVERVIEW H & M G R O U P C A P I T A L M A R K E T S D A Y 2 0 1 8
second largest
consumerindustry
global growth
6% 2012 — 2017
Packaged Food
Apparel
Home and Garden
Tobacco
Alcoholic Drinks
Consumer Electronics
Personal Accessories
Soft Drinks
Beauty and Personal Care
Consumer Appliances
6%
2012 2017
1.1 1.2
2.0
1.2
0.9
0.7
0.6
0.6
0.5
0.5
0.4
0.4
Note: Global retail value 2017 (€T)Note: Overall growth, constant prices, fixed 2017 exchange ratesSource: Euromonitor

. . . with big growth potential
A MARKET OVERVIEW H & M G R O U P C A P I T A L M A R K E T S D A Y 2 0 1 8
growth outlook
10%2017 - 2022
strong online
penetration and growth
apparel retail value (€T) online penetration (%) apparel
Note: overall growth, constant prices, fixed 2017 exchange ratesSource: Euromonitor
10%
2017 2022e
1.2 1.3
2012 2017
7%
16%
2022
20-25%
1.7%H&M group global market
share

a market intransformation
A MARKET OVERVIEW H & M G R O U P C A P I T A L M A R K E T S D A Y 2 0 1 8

a market in transformation
A MARKET OVERVIEW H & M G R O U P C A P I T A L M A R K E T S D A Y 2 0 1 8
changing customer behaviour
changing competitive landscape
techas the
catalyst

tech as the catalyst
A MARKET OVERVIEW H & M G R O U P C A P I T A L M A R K E T S D A Y 2 0 1 8
ROBOTICS
3D
CLOUD
DIGITAL COMMERCE
VOICE & IMAGE
BLOCKCHAIN
RFID IOT
PRICEPERFORMANCE
AI
AUTONOMOUS VEHICLES & DRONES
BIG DATA
EXPONENTIAL GROWTH
AUGMENTED & VIRTUAL REALITY
CONNECTIVITY/MOBILE

changing customer behaviour and higher expectations
A MARKET OVERVIEW H & M G R O U P C A P I T A L M A R K E T S D A Y 2 0 1 8
personalised
frictionless
anywhere anytime
services & experiences
design, quality and price
social
sustainability
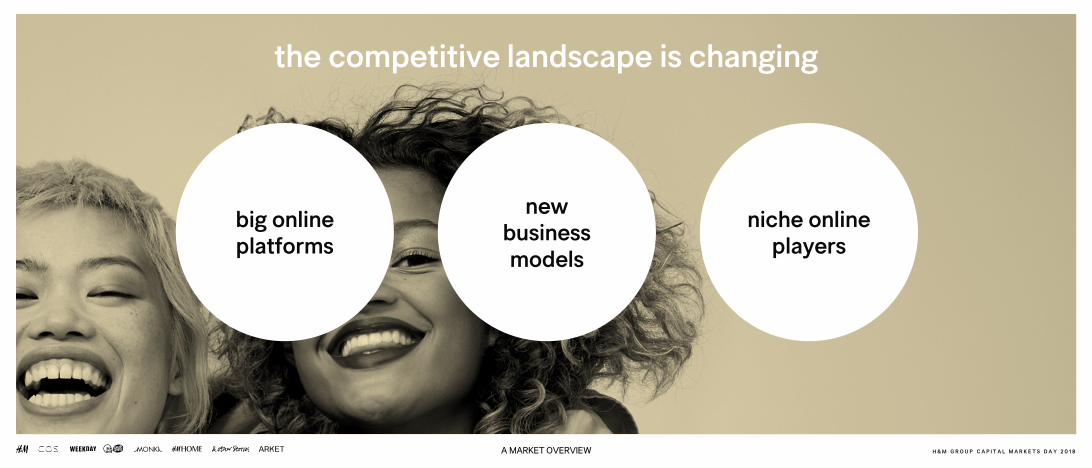
the competitive landscape is changing
A MARKET OVERVIEW H & M G R O U P C A P I T A L M A R K E T S D A Y 2 0 1 8
big online platforms
new business models
niche onlineplayers

the H&M group well positioned
A MARKET OVERVIEW H & M G R O U P C A P I T A L M A R K E T S D A Y 2 0 1 8

H&M group
H & M G R O U P C A P I T A L M A R K E T S D A Y 2 0 1 8

H&M group
H & M G R O U P C A P I T A L M A R K E T S D A Y 2 0 1 8

H&M GROUP H & M G R O U P C A P I T A L M A R K E T S D A Y 2 0 1 8
shared group assets
customer driven supply chain advanced analytics & AI tech foundation
financial resources
global sourcing talent & skillslarge data assets
global store network country organisations multibrand
central functions online platforms CO:LAB
external brandsexternal brands
external brandsexternal brands

our way
H&M GROUP H & M G R O U P C A P I T A L M A R K E T S D A Y 2 0 1 8
customer first culture sustainability long term view

customer first
— know our customers — best customer offering— desired state first— constantly reinvest in our customer offering
H&M GROUP H & M G R O U P C A P I T A L M A R K E T S D A Y 2 0 1 8

culture
H&M GROUP H & M G R O U P C A P I T A L M A R K E T S D A Y 2 0 1 8
we are one team constant improvement
entrepreneurial spirit
straightforward and open-
minded
cost conscious we believe in people
keep it simple
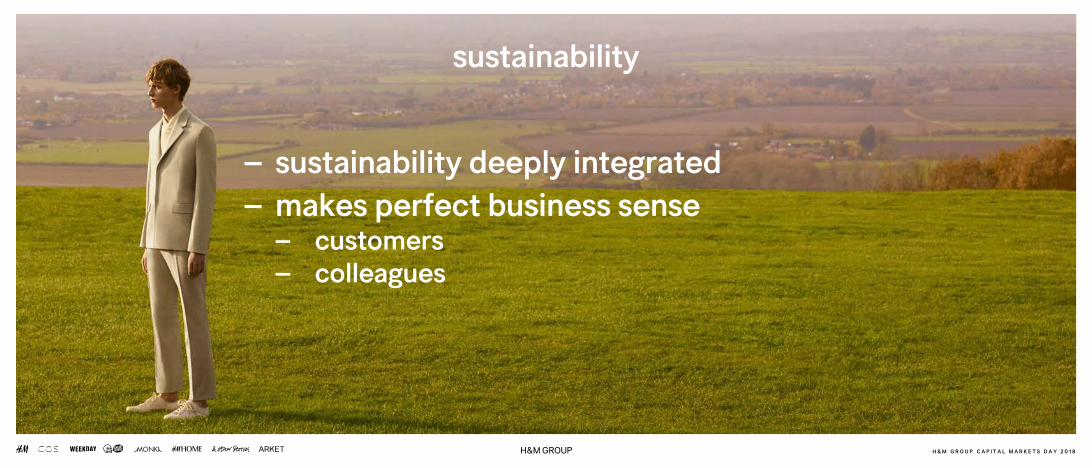
sustainability
— sustainability deeply integrated— makes perfect business sense
— customers— colleagues
H&M GROUP H & M G R O U P C A P I T A L M A R K E T S D A Y 2 0 1 8

long-term view
— sustainable profits— invest in existing brands
and new growth engines— deliver on short and
long-term goals
H&M GROUP H & M G R O U P C A P I T A L M A R K E T S D A Y 2 0 1 8

financial overview
H & M G R O U P C A P I T A L M A R K E T S D A Y 2 0 1 8

H & M G R O U P C A P I T A L M A R K E T S D A Y 2 0 1 8
sales 2017
FINANCIAL OVERVIEW
store14.3 bn
83%
online3.0 bn
17%
new business SEK 17.3 bnstore
189 bn88%
online26 bn12%
H&M SEK 215 bn
store203 bn87.5%
online29 bn12.5%
H&M group SEK 232 bn
LOCAL CURRENCIES INCL VAT TRANSLATED TO SEK, AVG RATE FINANCIAL YEAR 2017
H & M G R O U P C A P I T A L M A R K E T S D A Y 2 0 1 8
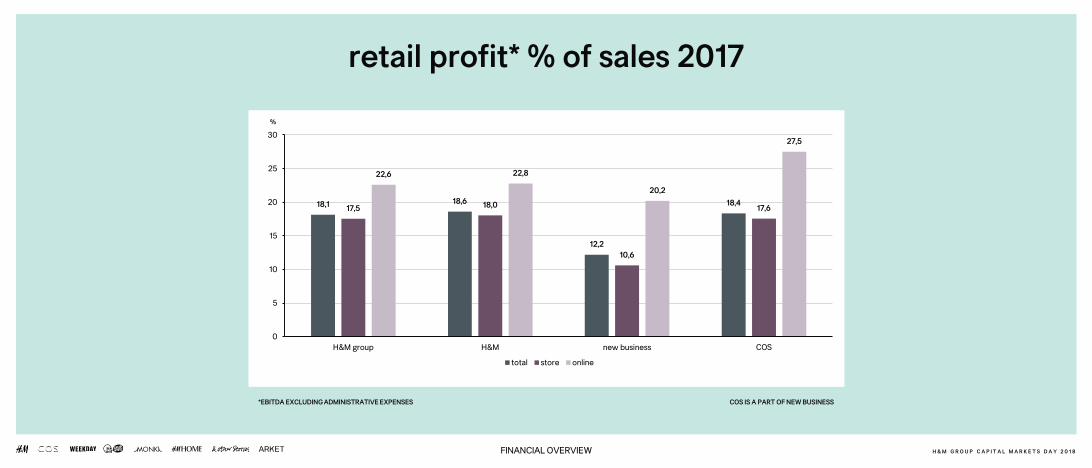
retail profit* % of sales 2017
FINANCIAL OVERVIEW
18,1 18,6
12,2
18,417,5 18,0
10,6
17,6
22,6 22,8
20,2
27,5
0
5
10
15
20
25
30
H&M group H&M new business COS
total store online
COS IS A PART OF NEW BUSINESS*EBITDA EXCLUDING ADMINISTRATIVE EXPENSES
%
H & M G R O U P C A P I T A L M A R K E T S D A Y 2 0 1 8
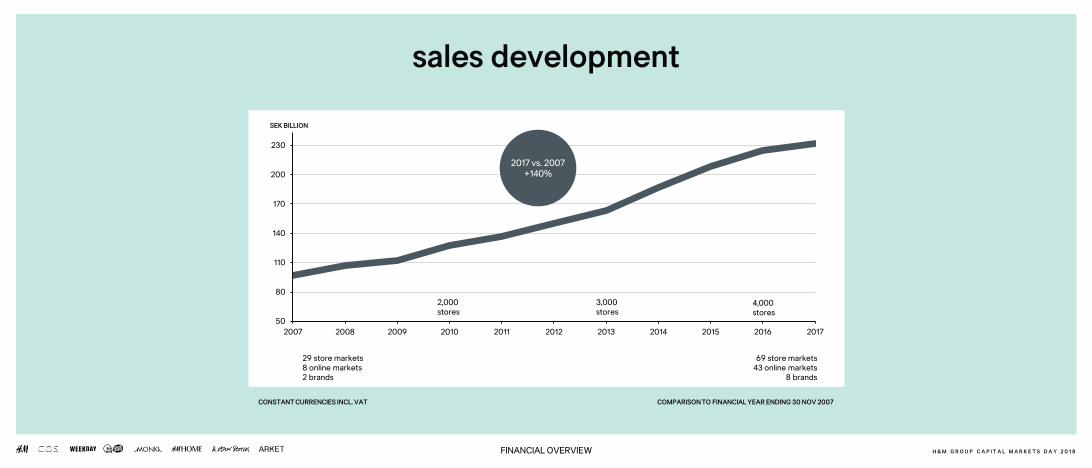
sales development
50
80
110
140
170
200
230
2007 2008 2009 2010 2011 2012 2013 2014 2015 2016 2017
2,000stores
3,000stores
4,000stores
FINANCIAL OVERVIEW
29 store markets8 online markets2 brands
69 store markets43 online markets
8 brands
COMPARISON TO FINANCIAL YEAR ENDING 30 NOV 2007CONSTANT CURRENCIES INCL. VAT
SEK BILLION
2017 vs. 2007+140%

H & M G R O U P C A P I T A L M A R K E T S D A Y 2 0 1 8
sales growth per channel
0
5
10
15
20
25
30
2007 2008 2009 2010 2011 2012 2013 2014 2015 2016 2017
online sales
FINANCIAL OVERVIEW
0
50
100
150
200
250
300
2007 2008 2009 2010 2011 2012 2013 2014 2015 2016 2017
store salesSEK BILLION SEK BILLION
COMPARISON TO FINANCIAL YEAR ENDING 30 NOV 2007CONSTANT CURRENCIES INCL. VAT
2017 vs. 2007+118%
+8% AAGR
2017 vs. 2007+741%
+25% AAGR
H & M G R O U P C A P I T A L M A R K E T S D A Y 2 0 1 8
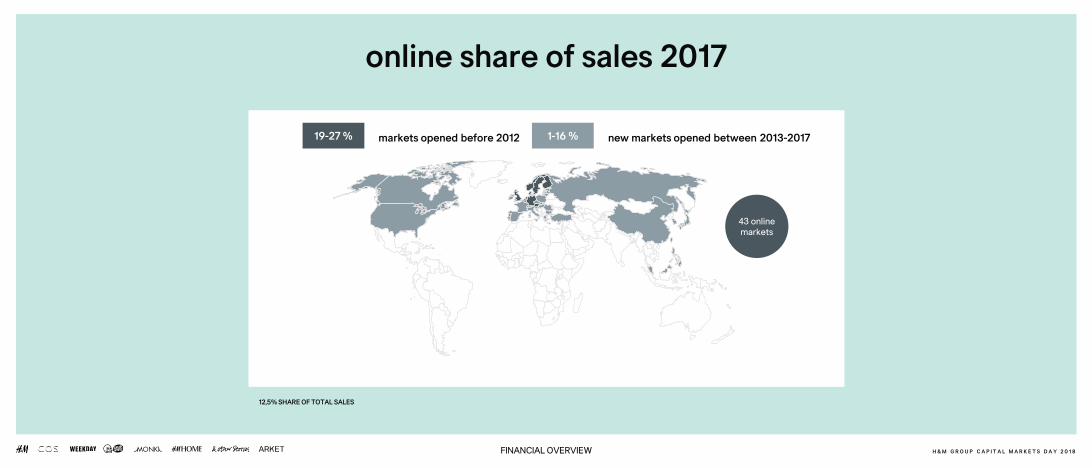
online share of sales 2017
FINANCIAL OVERVIEW
markets opened before 2012 new markets opened between 2013-201719-27 % 1-16 %
43 online markets
12,5% SHARE OF TOTAL SALES

H & M G R O U P C A P I T A L M A R K E T S D A Y 2 0 1 8
sales development
50
80
110
140
170
200
230
2007 2008 2009 2010 2011 2012 2013 2014 2015 2016 2017
2,000stores
3,000stores
4,000stores
FINANCIAL OVERVIEW
29 store markets8 online markets2 brands
69 store markets43 online markets
8 brands
COMPARISON TO FINANCIAL YEAR ENDING 30 NOV 2007CONSTANT CURRENCIES INCL. VAT
SEK BILLION
2017 vs. 2007+140%
2016 +7%2017 +3%
2007-2015>10%
AAGR

0%
4%
8%
12%
16%
20%
2007 2008 2009 2010 2011 2012 2013 2014 2015 2016 2017 2018 2019 2020 target range stock in trade as % of net sales
% OF SALES
H & M G R O U P C A P I T A L M A R K E T S D A Y 2 0 1 8
stock-in-trade in relation to net sales
FINANCIAL OVERVIEW
201716.9%

0
5
10
15
20
25
30
2007 2008 2009 2010 2011 2012 2013 2014 2015 2016 2017
SEK BILLION
H & M G R O U P C A P I T A L M A R K E T S D A Y 2 0 1 8
EBIT development
FINANCIAL OVERVIEW
COMPARISON TO FINANCIAL YEAR ENDING 30 NOV 2007CONSTANT CURRENCIES
2017 vs. 2007+6%
2015 vs. 2007+38%
+5% AAGR
0
1
2
3
4
5
2007 2008 2009 2010 2011 2012 2013 2014 2015 2016 2017
EBIT online
0
5
10
15
20
25
30
2007 2008 2009 2010 2011 2012 2013 2014 2015 2016 2017
EBIT storeSEK BILLION
H & M G R O U P C A P I T A L M A R K E T S D A Y 2 0 1 8
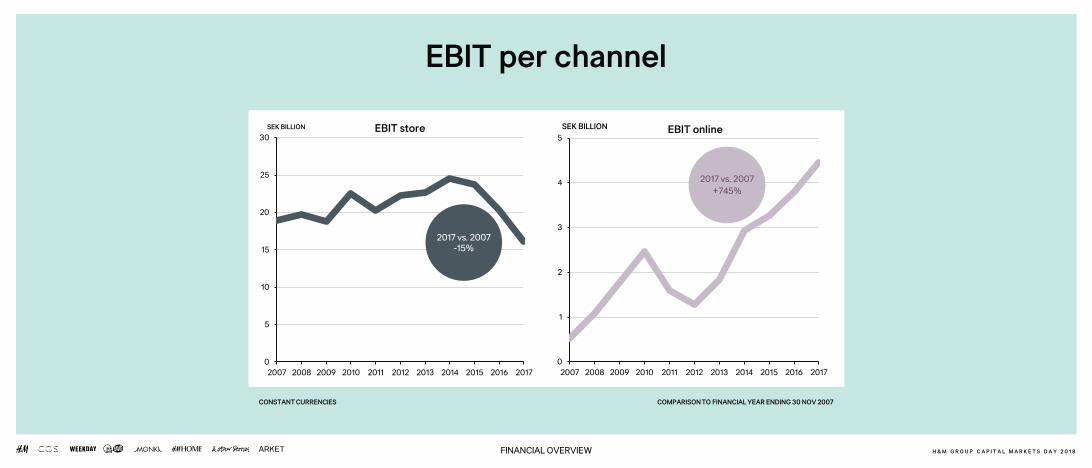
EBIT per channel
FINANCIAL OVERVIEW
SEK BILLION
CONSTANT CURRENCIES
2017 vs. 2007-15%
2017 vs. 2007+745%
COMPARISON TO FINANCIAL YEAR ENDING 30 NOV 2007

0
2
4
6
8
10
12
14
2008 2009 2010 2011 2012 2013 2014 2015 2016 2017
SEK BILLION
H & M G R O U P C A P I T A L M A R K E T S D A Y 2 0 1 8
strategic growth investments
FINANCIAL OVERVIEW
CONSTANT CURRENCIES
digital45%
store55%
store capex net digital capex digital investments expensed

key enablers* 42%
online 58%
digital 56%
store 44%
H & M G R O U P C A P I T A L M A R K E T S D A Y 2 0 1 8
digital investments 2018 - share of total investments
FINANCIAL OVERVIEW
*KEY ENABLERS: CUSTOMER DRIVEN SUPPLY CHAIN, ADVANCED ANALYTICS & AI AND TECH FOUNDATION.

investments in 2008-2017
— a scalable world class backbone — a scalable online platform enabling a strong
development for online growth — highly automated online warehouses— a strong store network with updated
technology – supports online growth— a portfolio of brands with big potential
FINANCIAL OVERVIEW H & M G R O U P C A P I T A L M A R K E T S D A Y 2 0 1 8
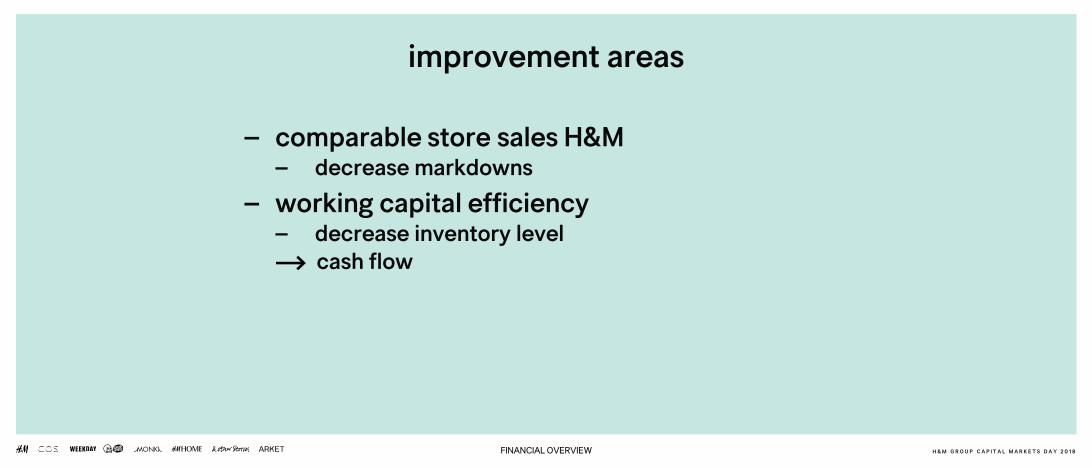
improvement areas
— comparable store sales H&M— decrease markdowns
— working capital efficiency— decrease inventory level
cash flow
FINANCIAL OVERVIEW H & M G R O U P C A P I T A L M A R K E T S D A Y 2 0 1 8
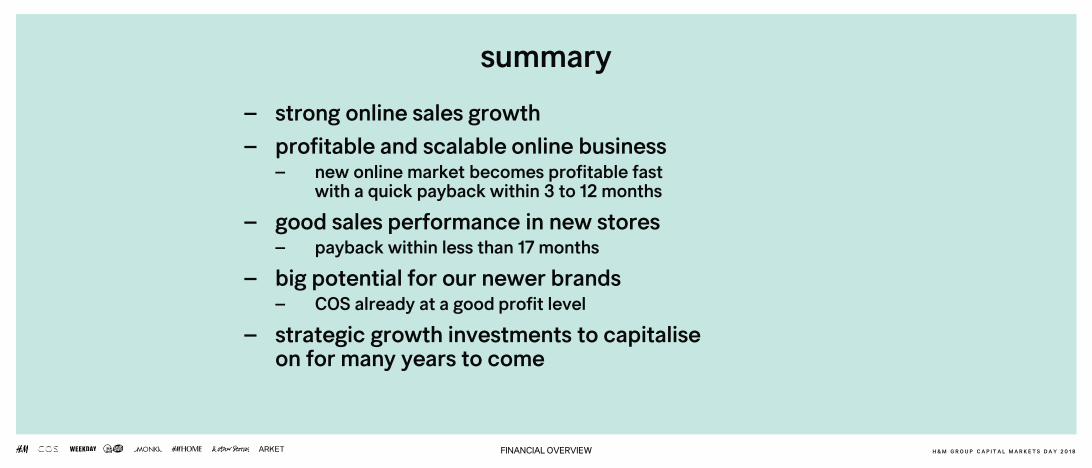
summary— strong online sales growth— profitable and scalable online business
— new online market becomes profitable fast with a quick payback within 3 to 12 months
— good sales performance in new stores— payback within less than 17 months
— big potential for our newer brands— COS already at a good profit level
— strategic growth investments to capitaliseon for many years to come
FINANCIAL OVERVIEW H & M G R O U P C A P I T A L M A R K E T S D A Y 2 0 1 8

how to drive profitable growth
H & M G R O U P C A P I T A L M A R K E T S D A Y 2 0 1 8

how to drive profitable growth
HOW TO DRIVE PROFITABLE GROWTH H & M G R O U P C A P I T A L M A R K E T S D A Y 2 0 1 8
restlesslydevelop our
brands
acceleratekey enablers new growth
— product and assortment
— inspiring, relevant and convenient shopping
— customer driven supply chain
— advanced analytics & AI
— tech foundation
— online growth for existing brands
— new stores for existing brands
— new concepts
— new brands and new initiatives

H & M G R O U P C A P I T A L M A R K E T S D A Y 2 0 1 8HOW TO DRIVE PROFITABLE GROWTH
restlesslydevelop our
brands

product & assortment
inspiring, relevant and convenient shopping
H & M G R O U P C A P I T A L M A R K E T S D A Y 2 0 1 8
restlessly develop our brands
HOW TO DRIVE PROFITABLE GROWTH
store— new concepts— new formats— optimise
portfolio
online— a/b testing— faster
development cycles
seamless— fast & flexible
deliveries — fast & easy payments — omni features
restlesslydevelop our
brands
— design— quality— price— relevance

customer driven supply chain advanced analytics & AI tech foundation
financial resources
global sourcing talent & skillslarge data assets
global store network country organisations multibrand
central functions online platforms
HOW TO DRIVE PROFITABLE GROWTH H & M G R O U P C A P I T A L M A R K E T S D A Y 2 0 1 8
accelerate key enablers
acceleratekey
enablerscustomer driven supply chain advanced analytics & AI tech foundation

customer driven supply chain
HOW TO DRIVE PROFITABLE GROWTH H & M G R O U P C A P I T A L M A R K E T S D A Y 2 0 1 8
agility & speed
future proof & optimised
digitalisation & automation
acceleratekey
enablers

advanced analytics & AI
HOW TO DRIVE PROFITABLE GROWTH H & M G R O U P C A P I T A L M A R K E T S D A Y 2 0 1 8
— give our brands competitive advantages and increased profitability
— empower the creation of the right products and the best customer experiences— trend detection and design support— demand forecasting, quantification and allocation— price management — personalisation
acceleratekey
enablers
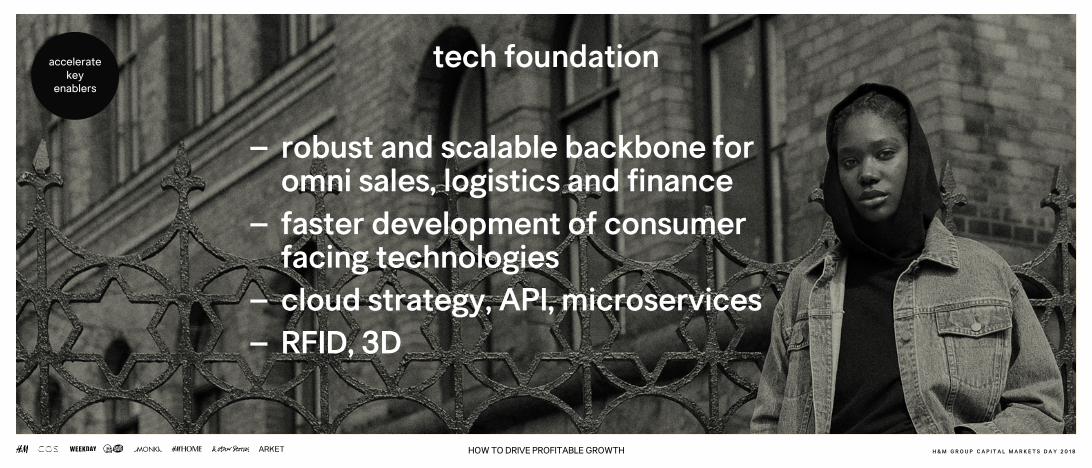
tech foundation
— robust and scalable backbone for omni sales, logistics and finance
— faster development of consumer facing technologies
— cloud strategy, API, microservices — RFID, 3D
HOW TO DRIVE PROFITABLE GROWTH H & M G R O U P C A P I T A L M A R K E T S D A Y 2 0 1 8
acceleratekey
enablers

H & M G R O U P C A P I T A L M A R K E T S D A Y 2 0 1 8HOW TO DRIVE PROFITABLE GROWTH
H&M groupnew growth
customer driven supply chain advanced analytics & AI tech foundation
financial resources
global sourcing talent & skillslarge data assets
global store network country organisations multibrand
central functions online platforms

online growth for existing brands— new markets — wider assortment — partnerships
— online platforms — social commerce
H & M G R O U P C A P I T A L M A R K E T S D A Y 2 0 1 8
new growth
HOW TO DRIVE PROFITABLE GROWTH
new growth
new brands and new initiatives
new stores for existing brands — H&M focus on emerging markets — new brands focus on established markets
new concepts

HOW TO DRIVE PROFITABLE GROWTH H & M G R O U P C A P I T A L M A R K E T S D A Y 2 0 1 8
new growth
shared group assets
customer driven supply chain advanced analytics & AI tech foundation
financial resources
global sourcing talent & skillslarge data assets
global store network country organisations multibrand
central functions online platformsCO:LA
B
initiative 2
initiative 1
external brandsexternal brands
external brandsexternal brands
H & M G R O U P C A P I T A L M A R K E T S D A Y 2 0 1 8
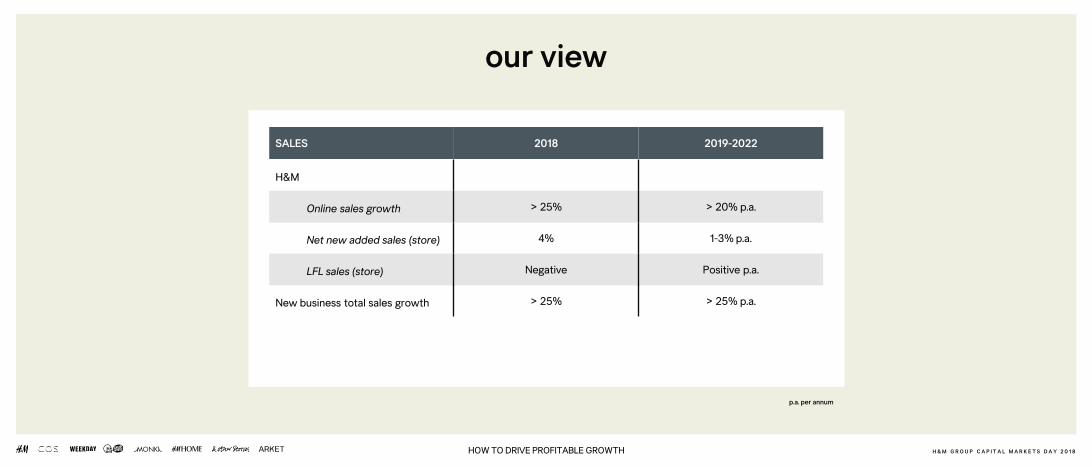
our view
HOW TO DRIVE PROFITABLE GROWTH
SALES 2018 2019-2022
p.a. per annum
H&M
Online sales growth > 25% > 20% p.a.
Net new added sales (store) 4% 1-3% p.a.
LFL sales (store) Negative Positive p.a.
New business total sales growth > 25% > 25% p.a.

H & M G R O U P C A P I T A L M A R K E T S D A Y 2 0 1 8
our view
HOW TO DRIVE PROFITABLE GROWTH
COSTS 2018 2019-2022
Markdowns Flat/slight increase vs. 2017 Considerableimprovements vs. 2017
SG&A + 4–5 % (local currencies) Grow slower than sales (%)
PROFIT DEVELOPMENT 2018 2019-2022
EBIT in bn SEK Moderate increase vs. 2017 Yearly increases
STOCK IN TRADE 2018 2019-2022
Stock-in-trade as % of salesLower % vs 2017, but still above
target range 12-14% Within target range 12-14%

successful years to come
— omni-model with brand control and direct customer relationships
— portfolio of brands with proven business models and most growth ahead of us
— strong group assets clear direction forward:— comprehensive action plan to drive profitable growth
— restlessly develop our brands, accelerate key enablers and new growth
HOW TO DRIVE PROFITABLE GROWTH H & M G R O U P C A P I T A L M A R K E T S D A Y 2 0 1 8

thank you!
H & M G R O U P C A P I T A L M A R K E T S D A Y 2 0 1 8