
HLL is a popular household name with its brands like Surf ...
138
1 CHAPTER – I INTRODUCTION 1.1 Background of the Study The speedy development of any country in this modern era is depends upon to some extent with financial activities of the country. Financial activities play a role of catalyst in the process of economic development of the country. In Nepal financial sectors (banks, finance companies etc.) plays a vital role in the economic development of the country. The current state of Nepalese economy is characterized by unutilized natural sources, miserable agriculture, deficit trade, mass poverty, illiteracy and so forth. Agriculture is the main occupation of almost village people but no scientific methods of agriculture have yet been implemented. It is one of the richest countries in the world in terms of natural resources. The natural resources available here have remained unutilized due to reasons. A tiny landlocked country is south Asia, Nepal remains as one of the 48 least developed countries in the world. The country's per capital income has been growing at little over two percent annum at a situation when more than two-fifth of the country's population is in absolute poverty. Nepal's current economic situation is best with nearly half of the population living below poverty line, and unemployment and disguised unemployment together depriving one half of the labor force. Investments in productive sectors increase the economic activities. The unutilized financial resources should be diverted towards productive sector in order to increase the economic activities. To develop the Nepalese economy, the financial institutions should be established. The participations of the private sectors play ever more important role for the economic development. Hence, various banks, insurance companies, financial companies etc. have been established in the private sector and government sector as well to develop the economy to develop the economy of the country, their providing their active participation for the economic development. But however even with the rapid development and expansion of financial
Transcript of HLL is a popular household name with its brands like Surf ...

1
CHAPTER – I
INTRODUCTION
1.1 Background of the StudyThe speedy development of any country in this modern era is depends upon to some extent with
financial activities of the country. Financial activities play a role of catalyst in the process of
economic development of the country. In Nepal financial sectors (banks, finance companies etc.)
plays a vital role in the economic development of the country. The current state of Nepalese
economy is characterized by unutilized natural sources, miserable agriculture, deficit trade, mass
poverty, illiteracy and so forth. Agriculture is the main occupation of almost village people but
no scientific methods of agriculture have yet been implemented. It is one of the richest countries
in the world in terms of natural resources. The natural resources available here have remained
unutilized due to reasons.
A tiny landlocked country is south Asia, Nepal remains as one of the 48 least developed
countries in the world. The country's per capital income has been growing at little over two
percent annum at a situation when more than two-fifth of the country's population is in absolute
poverty. Nepal's current economic situation is best with nearly half of the population living
below poverty line, and unemployment and disguised unemployment together depriving one
half of the labor force.
Investments in productive sectors increase the economic activities. The unutilized financial
resources should be diverted towards productive sector in order to increase the economic
activities. To develop the Nepalese economy, the financial institutions should be established.
The participations of the private sectors play ever more important role for the economic
development. Hence, various banks, insurance companies, financial companies etc. have been
established in the private sector and government sector as well to develop the economy to
develop the economy of the country, their providing their active participation for the economic
development. But however even with the rapid development and expansion of financial
2
institutions, the country has not been able to achieve the desired income so far which is due to
the poor capital market condition of our country and due to the early stage of economic growth.
As aforementioned, the financial institutions play a vital role in the economic development e.g.
the banks, especially the commercial banks; finance companies and insurance companies have
been established.
The Profit planning and control mechanism is being widely practiced in manufacturing industries
but it is relatively new in non-manufacturing/service, industries/sectors. However this concept is
equally applicable to any kind of business concern for the best utilization of the scarce resources
and effectively and efficiently achieving goal.
Every company or institution is established based on the definite goals and objectives. According
to the objectives, the company performs is tasks. Mainly two types of institutions such as profit
oriented and service-oriented instructions are established, but most of them are profit oriented
because profit is the life blood of the business which not only keeps it alive but also assures the
future and makes it sound. Profit planning is an important tool of the firm to achieve the
objectives. "Profit do not just happen, profits are managed (Lynch and Williamson, 1989: 125).
So, to manage the profit, the management should follow various processes of profit planning
because the management process and profit planning and control are interrelated to each other.
Profit maximization is the basic objectives of a firm and to make it reliable service should render
to its customers. Profit is a device to measure efficiency of a firm.
Planning is the first essence of a management and all other functions are performed with the
framework of planning. Planning means deciding in advanced what is to be done in future.
Planning starts from forecasting and predetermination of future events. The main objective of
planning in business is to increase the chance of making profit. The budget is the primary
planning operation document committed to performance. In this sense budget is also called a
profit planning.

3
Planning is the process of developing enterprise objectives and selecting a future course of
action to accomplish them. The term comprehensive profit planning and control it defined as a
systematic and formalized approach for performing significant phase of the management
planning and control function (Welsch, et al, 2001: 45).
The development and application of broad and long range objectives of the enterprise.
The specification of enterprise goals.
A long range profit plan developed in broad terms.
A short range profit plan detailed by assigned responsibilities (divisions, product, project
etc.)
systematic periodic performance reports detailed by assigned responsibilities, and
Follow-up procedures.
As like in the other profit oriented organizations, a commercial bank has also to make
reasonable profit for its survival. Most of the commercial banks are formed as a company
with joint stock and the shares being traded at stock exchanges. Therefore, profit made
by them is the important parameter for measurement of effectiveness efficiency of
them.
1.2 Statement Of The Problem
The profit planning tool is a newly developed concept as a crucial way in the business
organization. The concept of profit planning has not even familiarized in the most of the
business concern, by proper profit planning a business can be managed more effectively and
efficiently.
Every financial institutions, as a commercial bank must make profit out of its operations for its
survival and fulfillment of the responsibilities assigned. Major activities of a commercial bank
comprise mobilization of resources, which involves cost, and profitable deployment of those

4
resources, which generates income. The different interest income over the interest cost, which is
popularly called as interest margin, can be considered as the contribution margin in the profit of
the bank. The bank attempts to compensate the other operational expenses by generating other
income out of non-fund based business activities of the bank.
The present study aims to analyze and examines the application of PPC tool in the commercial
banks taking a case of Nepal Investment Bank Ltd, Nabil Bank Ltd and SBI Bank Ltd In this
ground, the study deals with the following issues for the purpose of this study.
What is the relationship between investment, loan and advances with total
deposit, net profit and outside assets?
How properly the collected fund has been used?
What is the profitability position of the banks?
What is the trend position of banks in terms of deposits collection and net profit?
What is the effect of investment decision on profitability position of the banks?
Is there significant relationship between loan and advances, total interest earned
to total outside assets etc?
1.3 Objectives of the Study
The basic objectives of the study are to analysis the profit planning policy of commercial banks
with reference to NIBL, NABIL and SBI. The specific objectives of the study are:
To find out the relationships between total investment, loan and advances,
deposit, net profit and outside assets.
To identify the investment priority sectors of Commercial Banks.
To assess the impact of investment on profitability.
5
To analyze and forecast the trend and structure of deposit utilization and its
projection for Five years of Commercial Banks.
To provide suggestions and possible guidelines to improve investment policy and
its problems.
To provide suggestion and recommendations for improvements of the overall
profitability of the banks.
1.4 Significance Of The StudyThe researcher study is connected with the profit planning in commercial Banks with a case
study of Nepal Investment Bank, Nabil Bank Limited and Nepal SBI Bank Limited with the major
objectives of examining the proper applicability of profit planning system in the Bank
Accomplishment of objective in every organization depends on the application of scare
resources most effectively. Also the functional performance of an organization depends purely
on the use of its resources. Budgeting is the key, to productive functional planning. So all the
organization running under commercial principles has to give regards these most important
single tools while managing their physical and financial targets. If the planning process of an
organization is effective and result oriented, the place of development naturally steps forwards.
Profit planning is a part of an overall process and is an area in which finance function plays major
role. It is now an important responsibility of financial manager while activities of those require
an accounting background. It's also need knowledge of business principles, economic statistics
and mathematics. Hence profit planning represents on overall plan of preparation for a definite
period of time.
Profit planning is crucial for management. Profit is the most important indicators for judging
managerial efficiency and does not just happened for this every organization has to manage.
Various functional budgets are the basic tools for proper planning of profit and control.
Therefore, this study will be useful for those who want to know the profit-planning tool and also
for next researcher as a reference.

6
1.5 Limitations of the StudyThe study confines only profit planning aspect of the Nepal Investment Bank Limited, Nabil Bank
Ltd. and SBI Bank Ltd. So, the limitations of this study are:
1. This study focuses on profit planning control and its application in the NIBL,Nabil and SBI.
2. Only profit planning aspect of Nepal Investment Bank, Nabil Bank and SBI Bank has been
analyzed.
3. This study covers the related data of the banks from FY 2003/04 to 2008/09.
4. The study is mostly based on secondary sources of data.
1.6 Organization of The Study
The study is divided into the following five chapters.
Chapter- I Introduction
Chapter- II Conceptual Framework and Review of Literature
Chapter- III Research methodology
Chapter - IV Data Presentation and Analysis
Chapter - V Summary, Conclusion and Recommendations.
The first chapter deals the background of the study, brief profile of the NIBL, NABIL and SBI,
statement of problem, objectives of the study, significance of the study, limitation of the study
and organization of the study etc.
Second chapter deals with the review of available literature. It takes in review of related books,
journals, articles and previous unpublished Master Degree Dissertation etc.
The third chapter is deals with the research methodology employed in this study. It includes
research design, population and sample, data collection procedure and sources of data, data
analysis techniques etc.

7
The fourth chapter is the important chapter of the study which implies the presentation and
analysis of data as well as major findings of the study.
The fifth and last chapter covers the summary of the study, the main conclusion that flows from
the study and offers some recommendations as well as suggestions for further improvement.
8
CHAPTER-II
CONCEPTUAL FRAMEWORK AND REVIEW OF LITERATURE
In this part, focus has been made on the conceptual framework and the review of literature that
is relevant regarding to the profit planning concepts. In this regard, various books, journals and
articles concerned to this topic have been reviewed. Review of literature is based on available
literature in the field of research. Every possible effort has been made to grasp knowledge and
information that is available from libraries; document collection center helps to take adequate
feed back to broaden the information to study. The first part of the chapter deals with the
conceptual framework of the study and the second part is concern with the review of previous
articles, journals and dissertation. Some philosophers, writers or researchers have given the
contribution on it since many years. There are two parts in the review of literature. They are:-
2.1 Conceptual Framework
2.2 Review Of Previous Study
2.1.1 General Concept of Profit Planning
Profit planning involves selection of defined periods of time for the strategic and tactical profit
plans (often five years and one year, respectively) in other words profit planning is a
comprehensive statement of intentions expressed in financial terms for the operation of both
short and long period. It is a plan of the firm’s expectation and is used as a basis for measuring
the actual performance of managers and their units. A profit plan has an immense value in
management; it helps in planning and co-coordinating if used appropriate, but not a
replacement for management. Profit planning is a comprehensive and co-coordinated plan
expressed in financial terms, for the operations and resource of an enterprise for some specific
period in the future.

9
A profit plan or budget is the formal expression of the enterprises plans and objectives stated in
financial terms for a specified future period of time (Fremgen, 1973; 144).
Profit planning is a predetermined detailed plan of action developed and distributed as a guide
to current operations and as a partial basis for the subsequent is a tool which may be used by
the management in planning the future course of actions and controlling the actual performance
(Gupta, 1992; 521).
Profit plan is estimation and predetermination of revenues and expenses that estimates how
much income will be generated and how it should be spent in order to meet investment and
profit requirements. In the case of institutional operations it presents a plan for spending
income in a manner that does not result in a loss
The term comprehensive profit planning and control it defined as a systematic and formalized
approach for performing significant phase of the management planning and control functions
specially it involves:
• The development and application of broad and long range objectives of the enterprise.
• The development of strategic long rang profit plan in broad terms.
• The specification of enterprises goals.
• The specification of tactical short range profit plan detailed by assigned responsibility (Division,
Products, projects).
• The establishment of a system of periodic performance reports detailed by assigned
responsibility and follow up procedures.
In many of the better-managed companies comprehensive PPC has been identified as a way of
managing it focuses directly up on a rational and systematic approach to management by
objectives and realistic flexibility in performing the management process.
A profit planning and control program can be one of the more effective communications
network is in an enterprise. Communication for effective planning and control requires that both
the executive and the subordinate have the same under standing of responsibilities, ensures a
degree of understanding not otherwise understanding of responsibilities; ensure a degree of
understanding not otherwise possible. Full and open reporting in performance reports that, fouls

10
on assigned responsibilities likewise enhance the degree of communication essential to sound
management.
Profit planning is an example of short range planning. This planning focuses on improving the
profit especially from especially from a particular product over a relatively short period of time.
Therefore as used here, it is not the same as corporate planning of a cost rendition program
(Terry, 1968:2).
Profit planning involves streamlining activities in order to get employees profit minded and to
secure maximum benefit from minimum effort and expenditure. Best results seem to be
obtained by assigning a profit planner to investigate all the footers affecting the profit obtained
from a single production the planner is given the right to prove the economics, the organization.
The mode of operations, the pricing, the marketing or any fact of making and selling the product
that in his judgment affects profit accruing from that product. The concentration of profit efforts
upon one product and the fight of the planner to cross traditional functional boundaries of the
enterprise of translate needs from one group of another and to obtain concurred profit building
efforts among those who can affect profits are the fundamental factors that contribute to the
success of profit planning.
A profit plan is an advance decision of expected achievement based on the most efficient
operating standards in effect or and prospect of time it is established against which actual
accomplishment is regularly compared.
Profit Planning through volume of cost analysis, however, is a modern concept of management
planning tools designated primarily for industrial enterprises. It involves a study of what a
business cost and expenses should be and will be at different level of operations and it include a
study of the resultant effect up to due to this hanging relationships between volume and cost.
Profit Planning is a comprehensive statement of intentions expressed in financial terms for the
operation of both short and long period. It is a plan of the firm's expectation and is used as a
basis for measuring the actual performance of managers and their units. A profit plan has an
immense value in management; it helps in planning and coordinating if used appropriately, but
not a replacement for management. Profit planning is a comprehensive and coordinated plan

11
expressed in financial terms for the operations and resource of an enterprise for some specific
period in the future (Fremgen, 1973: 12).
Profit Planning is a predetermined detailed plan of action developed and distributed as a guide
to current operations and as a partial basis for the subsequent evaluation of performance. Thus
it can say that profit planning is a tool which may be used by the management in planning the
future course of actions and controlling the actual performance (Gupta, 1992:3).
The term comprehensive profit planning and control it defined as a systematic and formalized
approach for performing significant phase of the management planning and control functions.
A profit planning and control program can be one of the more effective communication
networks in an enterprise. Communication for effective planning and control requires that both
the executive and the subordinate have the same understanding of responsibilities, ensure a
degree of understanding not otherwise understanding of responsibilities, and ensure a degree of
understanding not otherwise possible. Full and open reporting in performing reports that, fouls
on assigned responsibilities likewise enhance the degree of communication essential to sound
management (Welsch,et al., 2001:215).
Profit Planning is an example of short range planning. This planning focuses on improving the
profit especially from a particular product over a relatively short period of time. Therefore as
used here, it is not the same as corporate planning of a cost rendition program (Terry,
1968:245).
Profit Planning involves streamlining activities in order to get employees profit minded and to
secure maximum benefit from minimum effort and expenditure. Best results seem to be
obtained by assigning a profit planner to investigate all the footers affecting the profit obtained
from a single product; the planner is given the right to prove the economics, the organization.
The mode of operations, the pricing, the marketing or any fact of making and selling the product
that in his judgment affects profit accruing from that product.

12
A profit plan is an advance decision of expected achievement based on the most efficient
operating standards in effect or n prospect of time. It is established against which actual
accomplishment is regularly compared (Niel, 2001:305).
Profit Planning through volume of cost analysis, however, is a modern concept of management
planning tools designated primarily for industrial enterprises. It involves a study of what a
business cost and expenses should be and will be at different level of operations and it include a
study of the resultant effect due to this hanging relationships between volume and cost (Young
Dong, 200:74).
2.1.2 Concept Of ProfitProfit is the basic elements of profit plan so that the concept of profit planning may not be
completed and meaningful in absence of the clear-cut well defined idea of profit. Oxford
dictionary defines profit as a (a) financial gain and amount of money gained in business
especially the difference between the amount earned and the amount spent (b) Advantage or
benefits gained from something (Hornby et al., 1992:63).
According to some theories, profits are the factor payment for talking the risk for agreeing to
take what is left over after contractual outlays have been made. In the second type of profit
theory they viewed as a wage for the service of innovation. Profits in this theory are tied to
dynamic development. Profit around which all enterprises activities directly or indirectly revolve
play the significant role for judging the managerial efficiency. In absence of profit nobody can
think about the long-term survivability of the enterprises.
2.1.3 Concept Of PlanningPlanning is the first essence of management and all other functions are performed within the
framework of planning. Planning means deciding in advance what is to be done in future.
Planning starts from forecasting and predetermination of future events. Planning is the whole
concept of any business organization with proper and effective planning. No firm can accomplish
its predetermined goals and objectives. Hence it is the life blood of any organization which helps

13
them to run efficiently in competitive environment. Planning is a techniques were by the use
pattern of resources is carried out (Agrawal, et al., 1989:24).
A planning process includes setting goals, evaluating resources forecasting by different methods
and formulating a master plan. Planning depends upon the organized objectives. For the
planning purpose a firm's objectives can distinguish mainly three types, the first is prime, the
second is instrumental objectives are aims for accomplishment of more basis aim. For this
purpose the company has established divisional departmental and individual job objectives.
Specific objectives are those objectives that have been specified as to tome and magnitude
which is known as goals. As a result of specifying a time period and a target amount, this goal is
capable of giving specific guidance to various senses of management planning. Objective setting
of a firm is very difficult task. Unfortunately, most top management fails to develop a clear and
operational statement of company objectives. More carefulness is necessary for this tedious job
and it stated from firm's objectives. More carefulness is necessary for this tedious job. Carefully
stated firm's objectives would yield at least the following benefits.
1. Company objectives provide the ultimate criteria for resolving difficult company decisions.
2. Company objectives are the basis for long-range profit planning.
Planning is the process of developing enterprises objectives and selecting future course of action
to accomplish them. It includes (Welsch, et al., 1992:127).
1. Establishing enterprises objectives,
2. Developing premises about the environment in which they are to be accomplished,
3. Decision making,
4. Identifying activities necessary to translate plans in to action, and
5. Current re-planning to current deficiencies.
The planning processes both short and long term is the most crucial component of the whole
system. It is both foundation and the bond for the other elements because it is through the
planning process that we determine what we are going to do, how we are going to do it and who

14
is going to do it. It operates as the brain centre of an organization and like the brain it both
reason and communicate (Welsch, et al., 1992:73).
Planning is the conscious recognition of the futurity of present decision (Drucker, 1989:87).
Planning is the feed forward process to reduce uncertainty about the future. The planning
process is based on the conviction that management can plan its activities and condition that
state of the enterprise that determines its density (Pandey, 1991:325).
Planning could be taken as the tools of achieving organizational goals efficiently and effectively
from the selection of various alternatives with in a acceptable time frame. The essence of
planning is:
1. To accomplish goals
2. To reduce uncertainty
3. To provide direction by determining the course of action in advance.
Planning is determined course of action for achieving organizational goals or objectives
effectively and efficiently at a fluid environment with a certain time frame through the selection
of various alternatives. On the other hand it holds accountability and responsibility about result
to individual. A full appreciation of the firm task requires distinguishing among three types of
company's activities which we call strategic planning, management control and operational
control. The strategic planning is a important function of top management. Planning requires the
management to setting a future state toward which effort will be directed i.e. objective,
assessing the organization's resources, i.e. what the organization is going to work with, assessing
the current and future environment with which the organization must connected to achieve its
goals and lately determine how and when to allocate resource accomplish the objective.
Planning on the other hand is selecting objective and determining a course of action including
allocation of resources in order to achieve those objectives in a specific time period. Planning
states what, when, and how things will be accomplished. An adequate planning is necessary for
control of operations.
15
2.1.4 Types of Planning
Corporate Planning
Corporate planning means the systematic process of setting corporate objectives and making
strategic decisions and developing the plans necessary to achieve these objectives. Corporate
planning is one part of profit plan. It was first started in the USA in 1950, and it is however being
used in one form or another in many companies there. Corporate planning is to determine the
long-term goals of a company as a whole and then to generate plan designated to achieve these
goals bearing in mind probable change in its environment. He pointed out the premises of the
corporate planning are:
Before drawing up a plan, which is designed to do something, decide what you want
it to do.
In these days of rapid change it is necessary to look ahead as far a possible to
anticipate these changes.
Instead of treating a company as a collection of department, treat it as a corporate
whole.
Take full account of the company’s environment before doing up any up any
plan.(Robertson,1968; 535)
Long term planning is included in corporate planning. Corporate planning often is considered
synonymous with long-term planning. The main objectives of corporate planning are as follows.
Achieving objectives.
Embodiment of goals and objectives in the Enterprises.
Formulating realistic and attainable objectives.
Clarity and adequacy of goals and objectives.
Communication of goals and objectives.
Involvement of personnel in developing the goals of the enterprises.

16
Strategic Long-Range Planning
Strategic planning is a top management function in which the organization's purpose, mission
and overall objectives and policies are developed to position the organization advantageously in
its operating environment. It refers to the selection of company objective and the determination
of the growth or at least constant and competitive policies that are most likely to accomplish
those objectives. It is carried out the highest policy making level of the organization will travel.
Management planning and control is the process carried on within the framework established by
strategic planning. "Long range 5 to 10 years varying with the enterprise sometimes extended to
10 years. It is one of the most difficult times span involved in planning as many problems in short
range planning can be traced to the absence of clear sense of direction and the practice which a
comprehensive long-range plan provides. Basically, the long-range planning is more important
for broad and long living enterprises. 'A long-range planning is closely concerned with the
concept of the corporation as a long living institution (David, 1964:298).
The planner must include the following factors in his/her plan from the analysis of available
information.
a. Probable future opportunity
b. Uncertainty and
c. Challenges
Long range planning is the continuous process of making present entrepreneurial (risk taking)
decision. Systematically and best possible organizing efforts is need to carry out these decisions
and measuring the result of these decisions against the expectations through organized
systematic feedback (Ducker, 1964:165).
It is a decision making process. Such decision should be related about:
Determination of goals, objectives and strategies.
Level and direction of capital expenditure.
Accession of new sources of funds.
Organization design and structure etc.

17
Tactical Short Term Planning
Tactical plan is a short-range plan. It is developed for a short period of time usually a year,
initially by quarters and by months for the first quarter. A tactical planning is done at all level and
involves directing the organizations activities to achieve overall it strategic objectives consistent
with the organization’s mission and policies. Standing plans provides consistency by and
efficiency for non-going operations, and single use plans are developed for unique situation.
Projects are short-term plans designed to achieve objective within large-scale programs. Short-
term plans cover about a year, and are less formal and detailed than long-range plans, which
usually cover more than three months. The short range planning is selected to conform to fiscal
quarter for years. Because of the practical needed for conforming plans to accounting periods
and the some. What arbitrary limitation of the long range to three to five years is usually based
as has been indicated on the prevailing belief that the degree of uncertainty over a long period
makes planning of questionable value.
2.1.5 Role of Forecasting in Planning
The forecasting is to take future decision at present from the analysis of relevant factors of past
and present situation. It is an integral part of decision-making activities of management. An
organization established goals and objectives seeks to predict the environmental factors that
selects action all that is hopes will result in attainment of goals and objectives. The need for
forecasting is increasing as management attempts to decrease its dependence on change and
become more scientific in dealing with its environment. Since each area of organization is
related to all others. A good or bad forecast can affect the entire organization. “It should be
realized that building is not merely forecasting although forecasting is form of the basis of
budgeting. Forecasting is estimate of the future environment with in which the company will
operate. Budgeting or planning on the other hand involves the determination of what should be
done, how the goals may be reached and what individual units are to be assumed responsible
and be held accountable. Budget provides orderly way to attain goals and also provides a time
schedule for future action to produce. Measure result” (Pandey; 1991; 576)

18
Forecasting is indispensable in planning. Forecasts are statement of expected future conditions
definite statements of what will actually happen are partially impossible. Expectations depend
upon the assumptions made. If the assumptions are possible the forecast has a better chance of
being useful forecasting assumptions and techniques vary with the kind of planning needed. The
short-term forecasting is needed in budget making. A budget set for the following year will be
much useful. It is regarded to sales levels, which will eventuate rather than nearly to current
sales level. As budget distributed according to current sales may establish policy as to lines of
emphasis, but will obviously required successive adjustment if sales levels changes. Forecasting
is indispensable in planning. Forecast is statement of expected future conditions definite
statements of what will actually happen are patently impossible. Expectation depends upon the
assumptions made. If the assumptions are possible the forecast has a better chance of being
useful forecasting assumptions and techniques vary with the kind of planning needed. The short-
term forecasting is needed in budget making. A budget set for the following year will be much
useful. It is regarded to sales levels, which will eventuate rather than current sales level. As
budget distributed according to current sales may establish policy as to lines of emphasis, but
will obviously required successive adjustment if sales levels changes (Bratt, 1985:246).
2.1.6 Planning Verses Forecasting
Planning is clearly district from forecasting. Forecasting one of the essential elements of planning
is a prediction of what will happen on the basis of certain assumption. Planning is an attempt to
determine what should happen and what will make it likely to happen. A forecast is not a plan,
rather it is a statement of and or quantified assessment of future conditions about a particular
subject (sales revenue) based on one of more explicit assumption. A forecast should be viewed
as only one input into the development of a sales plan. The management of a company may
accept modify or eject the forecast. In contrast a sales plan incorporates management decision
that are based on the forecast, other inputs and management judgment about such related
items as sales volume, price, production and sales, effort and financing (Welsch, 2001:109).
19
2.1.7 ControlAfter being clear about the concept of profit and planning we move towards the third
component of profit planning and control i.e. control the dictionary meaning of control.
i. Have a power or authority over same body or same thing
ii. Regulate something
iii. Management, guidance, restriction
iv. Standard of comparison for checking the results of the experiment.
Controlling can be defined as a process of measuring and evaluating actual performance of each
organizational component of an enterprises and initializing corrective action when necessary to
ensure efficient accomplishment of enterprises objectives goals, policies and standards. Planning
establishes the objectives, goals, policies and standards of an enterprise. Control is exercised by
using personal evaluation periodic performance reports and special reports. Control is an
ambiguous word; it means the ability direct oneself and one's work. It can also mean domination
of one person by another (management). Objectives are the basis of control in the first sense,
but they must never become the basis of control as in the second for this would defeat their
purpose, indeed one of the major contributions of management by substitute management. By
objective is that it enables us to substitute management by self control for management by
domination (Drumeker, 1954: 244).
An important aspect of control that is frequently overlooked is its relationship to the point of
action or at the time or commitment. Effective control requires feed forward. In other words it is
assumed that objectives plans polices and standard have been develop and communicated to
those manager who have the related performance responsibilities. Therefore, control must
necessarily rest upon the concept of feedback, which requires performances measurement and
tiggers corrective action designed tonsure attainment of the objective. When plans become
operational control must be exercised to measure progress. In some cases control also results in
the revisions of prior plans and goals or in the formulation new plans changes in operations and
reassignment of people. Control approach must be tailored to the characteristics of the
operation and the organizational structure. A control process designed to help monitor the
periodic activities of business and of each responsibility center has the following phases.

20
i.Compare actual performance for the period with the planned goals and objectives.
ii. Prepare a performance report that shows actual results, planned results
iii. Any differences between the two (i.e. variations above or below planned results)
iv. Analyze the variations and the related operations to determine the underlying causes of
the variations.
v. Develop alternative courses of action to correct any deficiencies and learn from the
successes.
vi. Make a choice (corrective action) from the set of alter-natives and implement it.
vii. Follow up to appraise the effectiveness of the correction. Follow with feed forward for
re-planning.
The Comparison of actual result with planned goals and standard Constitutes measurement of
the effectiveness of control during a specified past period. This provides the basis for effective
feedback the facts shown in a performance report cannot be changed, however the historical
measurement may lead to improve control in the future. The significant concept here is that
objective policies and standards fulfill two basic requirements in the overall control process
namely.
1. Feed forward to provide a basis for control at the point of action.
2. Feedback-to provide a basis for measurement of the effectiveness of control after the action
was taken place more over feedback is instrumental in re planning.
2.1.8 Purposes of Profit PlanningSome purposes for the application of profit planning are:
1. To state the firms expectations in clear and facilitate for attainability.
2. To communicate expectations to all concerned with the management of the firm so that
they are understood, supported and implanted.
3. To provide a detail plan of action for reducing uncertainty and for the proper direction of
individual and group efforts to achieve goals.
4. To coordinate the activities and efforts in such as way the use of resource in maximized.

21
5. To provide a means of measuring the performance of individuals and units and to supply
information on the basis of which the necessary corrective action can be taken.
There is controversy is term of profit. It is defined by different people from different aspect.
Usually profits does not just happen, profits are managed. Before we can make intelligent
approaches to the management concept of profit, there are after all, several different
interpretations of the term. Profit, an economist says that profit is the reward of
entrepreneurship for risk taking. A labour leader might say that it is a measure of how efficiently
labour has produced and that it provides a base for negotiating a wage increase. An inverter
views it as a gauge for return on his/her investment. An internal revenue agent might regard, it
is the base for determining income taxes. The accountant will define it simply as the excess of
firm's revenue over the expenses of producing revenue in a given period. Management thinks of
profit as a tangible expression of the goals it has set for the firm, a measure of the performance
towards the achievement of it, as a means of measuring the health, growth and continuity of the
economy (Lynch and Williamson ,1989:249).
2.1.9 Long Range and Short Range Profit Plan
There are two types of profit plans developed; one strategic (long-range) and another tactical
(short-range). The former profit plan takes a time horizon of 5 to 20 years and the later for short
period. The long range planning is a picture of more summary data. A part of this plan is more or
less informal as presented by tentative commitments made by the executive committee in the
organizational planning seasons. The formal portion of long-range profit plan includes the
following component detailed by each year.
Income Statement
Balance Sheet
Capital Expenditure Plan
Personnel Requirements
Research Plan and
Long Range Market Penetration Plan

22
Thus the long range profit plan covers all the key areas of anticipated activity; sales, expenses,
research and development, capital expenditure, cash, profit and return on investment. The short
range tactical profit plan shows the primarily annual results, the detail by months, responsibility
and products. In an organization these annual summaries should be prepared to provide a
general understanding of the profit plan and to provide an overall view of the comprehensive
short range profit plan.It is possible for the firms to develop these two profit plans for all aspects
of the operations (Welsch, et al., 2001:524).
Assuming participatory planning and receipt of the executive instruments, the manager of each
responsibility center will immediately initiate activities within his or her responsibility center to
develop strategic profit plan and tactical profit plan. Certain format and normally the financial
function should establish the general format, amount of detail, and other relevant procedural
and format requirements essentially for aggregation of the plan. All these activities must be
coordinating among the centers in conformity with the organization structure (Welsch, et al.,
2001:523).
The preparation of long-range profit planning in addition to short range profit planning is also
viewed as a total planning concept of business. Long range planning is essential to maintain the
annual profit at improving level. The ultimate measure of the success of a business in generally
based on growth in the volume of sales, increasing return on capital investment, efficient
organization and these are all long-term consideration.
2.1.10 Budgeting and Budget
A budget is a detailed plan outlining the acquisition and use of financial and other resources over
a given period of time. It represents the plan for the future expressed informal quantities terms.
The act of preparing a budget is called budgeting. The uses of a budget to control a firm’s
activities are known as budgetary control.
A budget is a detailed plan expressed in quantitative terms that specifies how resources will be
acquired and used during a specified period of time. The procedures used to develop a budget
constitute a budgeting system (Hilton, 2001; 404).

23
A budget is the quantitative expression of a proposed plan of action by management for a future
time period and is an aid to the coordination and implementation of the plan. Budget is defined
as a comprehensive and coordinated plan, expressed in financial terms for the operations and
resources of enterprises for some specified period in the future.
Budget is defined as a comprehensive and coordinated plan, expressed in financial terms for the
operations and resources of enterprises for some specified period in the future (Fregmen,
1976:256).
According to his definition the essential elements of a budget ate:
Plan
Operations and Resources
Financial Terms
Specified Future Period
Comprehensiveness
Co-operation
Therefore, we can say that budget is a tool, which may be used by the management in planning
the future course of action-and in controlling the actual performance.
2.1.11 Budgeting: As a Device of Profit Plan
Budgeting, as a tool of planning, is closely related to the broader system of planning in an
organization. It serves basically as a device for management, control; it is rather pivot of any
effective scheme of control. Budgeting is the principle tool of planning and control offered to
management by accounting function (Welsch,et al. 2001; 632).
The prime objective of budgeting is to assist in systematic planning and in controlling the
operations of the enterprises. In fact budgeting is best sources of communication and an
important tool in the hands of management. Since, budgeting deals with fundamental policies
and objectives, it is prepared by top management. A formal budget by itself will not ensure that
a firm’s operations will be automatically geared to the achievement of the goals set in the

24
budget. For this to happen, the top-level managers and lower level employees have to
understand the goals and support them and coordinate their efforts to attain them. A budget is
comprehensive in that all the activities and operations of an organization are included in it. It
covers the organization as a whole and not only some segments. The budgets are prepared for
each segment of an organization. These are integrated into an overall budget for the entire
organization. The overall budget is referred to as the master budget. Budgeting is a device of a
planning and control that serves as a guide to conduct operation and a basis for evaluating
actual results.
Budgets are an important tool of profit planning. The main objectives of budgeting are:
Explicit statement of expectations
Communication
Co-ordination
Expectation as a framework for judging performance.
2.1.12 Essentials of an Effective Budgeting
An effective budgeting system should have some essential feature to ensure best results. The
following are the chief characteristics of an effective budgeting.
Sound Forecasting
Forecasts are the foundation of budgets, these forecasts are discussed by the executives and
when most profitable combinations of forecasts are selected they becomes budgets. The
sounder are the forecasts better result would come out of the budgeting system
An Adequate and Planned Accounting System
There should be proper flow of accurate and timely information in the enterprise which is, must
for the preparation of budgets. This can be ensured only by having an adequate and planned
accounting system in the firm.
25
Efficient Organization with Definite Lines of ResponsibilityAn efficient adequate and best organization is imperative for budget preparation and its
operation. Thus a budgeting system should always be supported by a sound organization
structure demarcating clearly the lines of Authority and responsibility. Not only this, there
should be a true delegation of authority from top to low levels of management. This will provide
adequate opportunity to all executives to make decisions and also to participate in the function
of budget preparation. Thus, an efficient organization helps not only in budget co-ordination but
it also plays important role in budget co-ordination and operation.
Formation of Budget Committee
As mentioned earlier, budget committee receives the forecasts and targets of each department
as well as periodic reports and finalizes. And also approves the departmental budgets. Thus in
order to make a budgeting system more and more effective, a budget committee should always
be set up.
Clearly Defined Business PoliciesEvery budget reflects the business policies formulated by the top management. In other words
budgets should always prepare talking in to account the policies set for particular department or
functions. But for this purpose, policies should be precise and clearly defined as well as free from
any ambiguity.
Availability of Statistical InformationSince budgets are always prepared and expressed in quantitative terms. It is necessary that
sufficient and accurate relevant that should be made available to each department. Such data
may not be available from accounting system alone and therefore they may be processed
through statistical technique. These data should be as far as possible, reliable accurate and
adequate.
Support of Top Management
If a budget program is to be made successful, the sympathy of each member of the management
team, it should start preferably from top level (chairman). The enthusiasm for budget operation
as well as direction for it should initiate and come from top.

26
Good Reporting SystemAn effective budgeting system also requires the presence of a proper feedback system. As work
proceeds in the budget period, actual performance should not only be recorded but it should
also be compared with budgeted performance. The variations should be reported promptly and
clearly to the appropriate levels of management.
Motivational ApproachAll the employees or staff other than executives should be strongly a properly motivate towards
budgeting system. In an organization it is needed to make each staff member feel too much
involved in the budgeting system. To meet this end motivational approach towards budgeting
should be followed.
2.1.13 Fundamental of PPCComprehensively profit planning and control is one of the more important approaches that has
been developed to facilitate effective performance of the management process. The concepts
and techniques of PPC have wide application in individual business enterprises, government
units, charitable organizations and virtually all group endeavors. "The fundamental concepts of
PPC include the underlying activities or tasks that must be carried out to attain maximum
usefulness from PPC. The fundamentals of PPC are:
1. Managerial involvement and commitment
2. Organizational adaptation
3. Responsibility accounting
4. Full communication
5. Realistic expectation
6. Flexible application
7. Timeless
8. Individual and group recognition
9. Zero base budgeting
10. Activity costing

27
11. Behavioral view point
12. Management control using PPC
13. Follow up (Goet, et al., 2062; 1.3)
Each of these fundamentals is discussed briefly in the following paragraphs. And it’s tried to
proof to what extent they are playing the role to make PPC a meaning full and a comprehensive
approach.
Managerial involvement and commitment: -
Managerial involvement entails managerial support, confidence, and participation and
performance orientation. All levels of management especially top level management should
consider following points in order to make PPC program successful. Managerial support,
confidence, participations and performance orientations include managerial involvement. All
level of management especially top level management should consider following points in order
to make PPC program successful.
Understand the nature and characteristics of profit planning and control.
Be convinced that this particular approach to manage is preferable for their
situation.
Be willing to devote the effort required to make it operative.
Support the program in all its ramifications.
View the results of the planning process as performance commitments.
For the comprehensive profit planning and control (PPC) program to be successful it must have
the full support of each a members of management, starting with the president the impetus and
direction most come from the very top(Goet, et al.,2062;1.4)
Organizational Adaptation
A profit planning and control programmed must rest upon sound organizational structure for the
enterprise and a clear-cut designation of lines of authorities and responsibilities. The purpose of
organizational structure and the assignment of authority is to establish a frame work with in
which enterprise objectives may be attained in a co-ordinate and effective way on a continuing
28
basis. The responsibility for the obligation of each departmental manager should be well
clarified. Whatever may be the nature and sense of organizational structure, one should always
bear in mind the fact that no organizational structure can be taken as ends itself but it should
always be treated as means or tools to attain the goal. “In conclusion the organizational
involvement includes.
Delegation of authority and responsibility to each functional sub Units.
Sub-divide the whole organization into different functional subunits
Each subunits should prepare its own annual or periodic plan
Based upon plan prepared by subunits a master plan is to be prepared by higher
management.”(Goet, et al., 2062; 1.4)
Responsibility AccountingIn order to set up profit planning and control on a sound basis, there must be a responsibility
accounting system that is one tailored first and foremost to the organizational responsibilities. A
responsibility accounting system can be designed and implemented on a relevant basis
regardless of the accounting system standard cost system, direct costing systems, and so on.
Therefore PPC requires responsibility accounting system.
Full communication
Communication can be defined as an interchange of thought or information to bring about a
mutual understanding between two or more parries.
Communication can be either f dialogue messages or understanding from working together.
Although most of the management gives least importance on communication but it is the most
important thing for any organization observation and control. Most of the organization faces lot
of problem due to bad communication system.
For profit planning and control; effective communication means development of well defined
objectives specification of goals, development of profit plans and reporting and follow up
activities related to performance evaluation for each responsibility center. Communication for

29
effective planning and control requires same understanding of responsibilities and goals in both
the executives and subordinates.
Realistic Expectation
Perfection on setting goal or objectives of the future sales, production levels, costs, capital
expenditures, cash flow and so on determines the success of profit planning and control
programmed. So, for profit planning and control purpose, a realistic approach with time
dimension and external and internal environment that will prevail during the time span should
be considered. This is called realistic expectation.
Timeliness
‘Time and Tide wait for none’. Whether an individual or an entity remains idle or busy, time
passes at the same rate. The problem of the manager in one hand is to accomplish the planned
activities in a given time and on the other hand is to prepare the plan itself phasing of the
planning is of two types:
Timing of planning horizons and
Timing of planning activities.
Planning horizons refers to the period of time into the future for which management should
plan. Decision made to the organizations obviously can affect only the future. No present
decisions can effects or change the past, since all managerial decisions are futuristic each
management is faced with the basic question of time dimension. The effective implementation
of PPC concepts requires that the management of ES establish a definite time dimension for
certain types of decision. And timing of planning activities suggests that there should be a
definite management time schedule established for initiating and completing certain phases if
the planning process (Goet, et al., 2062; 1.5).
Flexible Application
This stress that a PPC programmed must not dominate the business and that flexibility in
applying the plan must be forthright management policy. So that strait jackets are not imposed

30
and all favorable opportunities are seized even through “They are not covered by the budget.
Rigidity in practicability will be the harmful boundary in an association in an occasion for the
enterprises. So, such boundary should be avoided which mean there should be flexibility in PPC
so that the unseen golden opportunity should be grasped in future for the betterment of that
organization (Goet, et al., 2062; 1.5) .
Zero Base Budgeting: -
Zero Base Budgeting is a method of budgeting in which managers are required to start from zero
level every year and to justify all costs as if the programs involved were being initiated for the
first time. Under zero-base budgeting, every budget is constructed on the premise that every
activity in the budget must be justified. It starts with the basic premise that the budget for next
year is zero and that every expenditure, old and new, must be justified on the basis of its cost
and benefit.
Activity Costing: -
Responsibility accounting system generally accumulates costs by department and product
costing systems associate costs with units of product or service organization also frequently finds
it useful to associate costs with activities. By decomposing an organizations production process
into discrete set of activities, and then associating costs with each of those activities. Moreover,
by systematically identifying the activities throughout the organizations managers can identify
redundant activities (Welsch,et al., 2001; 42).
Individual and Group Recognition: -Behavioral aspects of human being are of the field of study of the psychologist, educators and
businessman, and finding was that there could be so many unknown misconception and
speculations, which has to be considered for an efficient management. A good and dynamic
leadership can resolve this problem by integrating all the group efforts for betterment of the
organization.
31
Management Control Using PPCThe primary purpose of control is to ensure attainment of the objective, goals and standards of
the enterprises. Control has many facets such as direct observation, oral express, policies and
procedures, reports of actual results and performance reports.
PPC focuses on performance reporting and evaluation of performance to determine the causes
of both high and low performance. The essential characteristics of a PPC performance reports
are as follows (Welsch et al., 2001; 40).
Performance is classified by assigned responsibilities
Controllable and non controllable items are designated
Timely reports are issued.
Emphasis is given to a comparison of actual results and planned results should be designated the
responsible manager and show actual results.
Behavioral ViewpointAn ounce of behavior is better than a quintal of the theorem so ever be the theory and theorem,
the organization only when it improves its behavior, is best or in another way Welsch has
suggested that the motivation of human resources through dynamic leadership central to
effective management. It is found by many psychologist and educators and businessmen that,
there are many known and unknown, misconception and speculations concerning the responses
of the individual and the group in the varying situation so the PPC programs bring many of these
behavior problems in the sharp and focus and trying to resolve (Welsch,et al., 2001; 53) .
Management by ExceptionA comprehensive profit planning and control program facilities in many ways, underlying these is
the measurement of actual performance against planned objectives goals, and standards and
the reporting if that measurement in performance reports. This measurement and reporting
extends to all areas of operations and to all responsibility centers in the enterprises. It involves
reporting

32
a) Actual result
b) Budgeted or planned results and
c) The differences between the two
This type of reporting represents an effective application of the well- recognized management
exception principle. The exception principle holds that the manager should concentrate primarily
on the exceptional or unusual items that appear in daily, weekly and monthly reports, thereby
living sufficient managerial time for overall policy and planning considerations. It is the ‘out of
line ‘that need immediate managerial attention to determine causes and to take corrective
action. The items that are not out of line need not utilize extensive management time, however;
they should trigger “rewards” in appropriate ways. To implement the exception principle,
techniques, Procedures must be adopted to call the manager attention to the ‘out of control’
items. Performance reports because they include a comparison of actual results with plans by
areas of responsibility, emphasize in a relevant ways performance variation. The out of line
items stand out. It is with respect to these items that the busy executive should investigate,
determine the causes and take corrective action (Welsh-et al., 2001; 45).
Follow Up
This fundamentals holds that both good and substandard performance should be carefully
investigated the purpose being three fold.
In the case of substandard performance, to lead in a constructive manner to
immediate corrective action.
In the case of outstanding performance, to recognize it and perhaps provide for a
transfer of knowledge to similar operation and
To provide a basis for better planning and control in the future.
2.1.14 Profit Planning and Control Process
A PPC program includes more than the traditional idea of a periodic or master budget. Rather, it
encompasses the application of a number of related management concepts through a variety of

33
approaches techniques and sequential steps. These steps are out lined in this study in the
following manner.
Identification and Evaluation of External Variables
The variable identification phase of the PPC process focuses on (1) identifying and (2) evaluating
the effects of the external variables. Management planning must focus on how to manipulate
controllable variables and how to work with the existing situation of non-controllable variables.
Variables, which have a direct and significant impact on the enterprises, are called relevant
variables. Variables may have their different relevancy according to the market nature. For the
enterprises purpose the external relevant variables are population, G.N.P. competitive activities
product line, and industry sales. And so far internal variables are concerned employees, capital,
research productivity, pricing, operating costs, advertisements etc. A particularly significant
phase of this analysis includes an evaluation of the present strength and weakness of the
enterprises. The comprehensive PPC approach is based on the expectation that these significant
aspects of operations will be critically analyzed and evaluated periodically and in an orderly
manner.
Development for the Board Objectives of the Enterprises
Development of the broad objectives of the enterprises is a responsibility of executive
management. Based on a realistic evaluation of the relevant variables and an assessment of the
strength and weakness of the organization, executive management, can specify or restate this
phase of the PPC process.
The statement of broad objectives should express the mission, vision and ethnical character of
the enterprise. Its purpose is to provide enterprise identify continuity of purpose is to provide
and identification. One research study listed the purpose of the statement essentially as follows.
1. To define of the purpose of the Co.
2. To clarify the philosophy character of the Co.
3. To create particular climate with in the business.

34
4. To set down a guide for managers so that the decisions they make will reflect the best
interest of the business with fairness and justice to those concerned.
Development of Specific Goals for the EnterprisesThis component of a comprehensive PPC process is to bring the statement of broad objectives
into sharper focus and to move from the realm of general information to more specific planning
information. It provides both narrative and quantitative goals that are definite and measurable.
These are specific goals that relate to the enterprises as a whole and to the major responsibility
centers.
These goals should be developed by executive management as the second component of the
substantive plan for the upcoming budget year. Executive management should exercise
leadership in this planning phase so that there will be a realistic and clearly articulated
framework within which operations will be conducted toward common goals.
Development and Evaluation of Company Strategy
Companies’ strategies are the basis thrusts ways and tactics that will be used to attain planned
objectives and goals. Some examples of basic strategies are:
Increase long-term market penetration by using technology to development new products
and innovation the product.
Emphasize product equality and price for the top market.
Expand market the company will not enter foreign markets in the foreseeable future.
Market with low price to expand value.
Use both institutional and local advertisement program to build market share.
Improve employee morale and productivity by initiating a behavior management program.
Executive Management Planning Instruction
Executive management explicitly establishes a planning foundation that is a condition precedent
to the movement in the planning foundation the statement of planning guidelines is set as
executive management instructions and is disseminated in order to initiate a sophisticated and
potent move from broad corporate planning to the development of profits plans by each major

35
responsibility center in the enterprises. It is simply a communication steps from executive
management to the lower levels of management and it should adopt the fundamentals of full
communication.
Preparation and Evaluation of Project Plans
Periodic plans and project plans are different in feature and functions. It will be recalled that
project plans encompasses different time horizons because each project has a unique time
dimension, they encompasses such items as plans for improvements of present, products, view
and expanded physical facilities, entrance in to new industrial unit from products and industries
and new technology and other major activities that can be separately identified for planning
purpose. The nature of projects is such that they must be planned as separate units.
Consistent with this approach during the formal planning cycle, management must evaluated
decide up on the plan status of each project in process and select any new projects to be
initiated during time dimension covered by the upcoming strategies and tactical profit plans.
Development of Strategies and Tactical Profit PlanWhen the managers of the various responsibility centers in the enterprises receive the executive
management planning instruction and the projects plans, they can begin intensive activities to
develop their respective strategic or tactical profit plans. The strategic and tactical profit plans
are usually developed concurrently. Certain format and procedural instructions should be
provided by a centralized source, normally the financial functions, to establish the general
format, amount of detail and other relevant procedural and format requirement essential for
aggregation of the plans of the responsibility centers, into the overall profit plans. All of this
activity must be coordinated among the centers in conformity with the organization structure.
When the two profit plans for the overall enterprises are completed, executive management
should subject the entire planning package to a careful analysis and evaluation to determine
whether overall plans are the most realistic set that can be developed under the circumstances.
When this point reaches the two profit plans should be formally approved by the top executive
and distributed to the appropriate managers.

36
Implementation of Profits PlansThat profit plans strategies should be implemented by every level management is an accepted
norm. Implementation of management plans that have been developed and approved in the
planning process, involves the management functions of leading subordinates in attaining
enterprises objectives and goals. Thus effective management at all levels requires that
enterprises objectives, goals, strategies, and policy to be communicated and understood by
subordinates. There are many facets involved in management leadership. However the
comprehensive PPC program may aid substantially in performing this function, plans, strategies
and policies foundation for effective communication. The plan should have been developed with
the managerial conviction that they are going to be met or exceeded in all major respects. If
these principles are effective in the development process, the various effective and supervisor
will have a clear understanding of their responsibilities and the expected level of performance.
Use of Periodic Performance ReportsOnly implementing the strategy will be on no meaning when the implementation is not checked
and trial whether used appropriately. So that the significance has been raised that monthly and
three monthly performance reports are to be prepared.
Follow UpIt is an important part of control. Because of performance reports are based on assigned
responsibilities, they are the basis for effective follow up actions. Finally, there should be a
special follow up of the prior follow up actions. This step should be designed to:
Determinate the effectiveness of prior corrective action and
Provide a basis for improving future planning and control procedures.
2.1.15 Basic Assumptions and Limitations of Profit Plan
Profit planning systems are more common in business organizations and non-business
organization. But there are so many assumptions of using profit-planning program. Firstly, the
basic plans of the business must be measured in items of money, if there is to be any assurance
that many will be available for the needs of the business. Secondly, it is possible to plan for the

37
future of a business in a comprehensive way, coordinating every aspect of the business, with
every other aspect to establish optimum profits goals. Thirdly, profit planning is preplanning not
merely what to do if things work out as forecasted, but also what to do if things work out
differently from the forecast. In developing and using a profit planning and control (PPC)
program, the following limitations should consider:
1. Profit plan is based on estimates.
2. A PPC program must be continually adapted to fit changing circumstances.
3. Execution of a profit plan will not occur automatically the profit plan is not a substitute for
management.
The profit plan should be regarded not as a master but as a servant. It is not one of the best
tools yet devised for advancing the affairs of a company and the individuals in their various
spheres of managerial activity. It is not assumed that any profit plan is perfect. The most
important consideration is to make sure, by intelligent use of profit plans that all possible
attainable benefits are derived from the plans as rendered and to re-plan when there are
compelling business reasons.
2.1.16 Development of Profit PlanDevelopment of profit plan in commercial Bank begins with the preparation of various functional
budgets. Those functional budgets are in fact the picture of various activities of the Bank to be
performed during a particular period of time. Therefore the functional budgets of a Bank are
activity based such as budget for deposit collection, budget for lending and investments, budget
for non-fund based business, budgets for expenditures and revenues. The development of profit
plans process that involves managerial decisions and ideally a high level of management
participation. The following are the budgets, which are developed in a bank while making a
profit plan.

38
2.1.17 Resources Mobilization Plan or Budget
Planning for resources mobilization is the foundation for planning in a bank. The all other
planning is based on it. The major and the sustainable resource of a bank are the customer
deposits. Therefore, the plan for resources mobilization has a primary focus on the customer
deposit mobilization. The lending and investment activities are depended on the deposit
mobilized by the Bank. So the deposit mobilization or collection plan is the starting point in
preparing the other different plan.
Deposit mobilization is the primary function of a bank, which has major contribution in the total
resources of the bank. In terms of cost for the Bank, customer's deposit are of two kinds, viz. (i)
interest free deposits i.e. current deposits, margin deposits etc. and (ii) interest bearing deposit
i.e. saving deposits, fixed deposits of various tenure, call deposits etc. The interest free deposits
are cost free but are generally volatile in nature. Those can be withdrawn without restriction
from the bank, thus cannot be invested into higher income yielding assets. Further, interest
bearing deposits involve cost of deposit but their retention ratio with the bank are much better
so they can be put to high income yielding assets having longer tenure. Therefore, a proper mix
of cost free and costly deposits corresponding to short term and longer term deposits are to be
maintained by the bank in its deposit mix in order to minimize its average cost of deposit at the
same time having comfortable mix of income yielding assets. The cost of deposit of banks is also
affected by the prevailing deposit interest rate of other banks in the market.
Budgeted targets for deposit mobilization during a particular year is set in advance with each
view of optimizing the cost of deposit and the same are allocated to the different branches of
the banks. Such allocations may be regarded as the tactical plan for deposit mobilization of the
banks. Banks resources other than customer deposits are the borrowing from other banks and
the capital fund. Generally banks borrows from other banks to meet temporary requirement of
liquidity which may occur, sometimes, during the occurs of banking operation caused due to
unexpected withdrawals of deposit or deferment in loan repayments by the borrower by some
reason or other. Such activities are managed from the Head Office with the least possible cost.
39
Among the capital fund, the equity capital is formed generally one time during opening of the
bank. The central bank (NRB) may from time to time instruct the bank to enhance the paid up
capital to improve the capital adequacy of the bank.
Further, the bankers may choose by themselves whether or not to increase the owner's capital
by raising the other item included in capital funds beside paid up capital and general reserves. It
is always better to have a higher capital fund base of a bank because, creation of bank's assets,
and the size of lending to any particular borrower are tried up with the capital adequacy
requirement by the central Bank. As per NRB directives, banks shall have to build their capital
base at least of 12 percent by the end of FY 2060/61. And a bank can take the size of exposure
per borrower equivalent to maximum of 25 percent of its core capital in fund based, and 50
percent of than in non-fund based exposure.
2.1.18 Resources Deployment Plan or Budget
Planning for development of resources starts from assessment of nature of resources to be
mobilized. That is the assets are allocated on the basis of the nature of resources. This approach
of deployment of resources is called asset allocation approach. The fundamental criterion which
must be followed in allocating funds for acquiring different types of assets is that the velocity-
turnover rate of different sources of supply of fund determines the appropriate maturity of the
assets acquired through fund utilization, for instance while relatively stable fund, like saving
deposits, fixed deposits and paid up capital could be used to buy long dated high yielding
securities, demand deposit which are more volatile, could be used to acquire relatively liquid
assets like cash or money at call and short notice on which little or no return is made by the bank
(Vaish, 1996:365).
Funds kept as cash in vault and as balance with NRB and other banks in current account are the
most liquid assets of the bank. Normally banks have to maintain certain fixed percentage of their
deposit liability in this form as directed by the Central Bank from time to time. There is no yield
in the fund deployed as liquid assets.

40
Deployment for lower income yielding assets are generally placing the funds in short term
securities, treasury bills etc. which provides reasonable liquidity to be bank as well as yield some
return although they are at very low rate. Major portion the income of the Bank comes as
interest income from the resources deployed to loans advances and Bill discounting (LDO). As
the most part of the resources are for LDO. Banks make its lending budgets in advance as per
their lending policies. Lending targets and fixed at various sector of economy for various kinds of
trades and commercial activities and to various borrowers ensuring well diversification of the
assets. The targets are allocated to the branches, which are generally operated as separated
profit centers.
2.1.19 Planning for Non-Funded Business Activities
Other activities of commercial banks where it does not have to involve its fund yet it can
generate other income are called non-funded business activities of the Bank. They are usually
letter of credit and Bank guarantee issuance business of the bank where the bank undertakes
payment liabilities, which are contingent in nature and the banks charges certain percentage of
commission on such transaction to their client who are availing these facilities from the bank.
The bank fixes annual target for such business and those are allocated to the branches of the
bank.
Expenditure Planning
The expenses planning and controlling are very necessary for supporting the objectives and
planned programs of the firm. An expense is related with profit. It is real fact, that the
minimization of cost is maximization profit. So the expenses must be planned carefully for
developing a profit plan. In Bank there are generally following types of expenses:
a. Interest Expenses
b. Personnel Expenses
c. Office Operating Expenses
d. Expenses meeting the loss in Exchange Fluctuation
e. Non-operating expenses

41
f. Expenses for provision for loan loss
g. Expenses for provision for staff bonus
h. Expenses for provision of income tax
The interest expenses are incurred while paying for the deposit mobilized by the bank and
include the expenses incurred for interest payment in all kinds of interest bearing deposit as per
the agreed rate between the bank and the borrower. In the total expenses of a bank, the portion
of interest expenses is quite higher. Therefore, the expenses are categorized into interest
expenses and other expenses while the later includes other expenses as mention above except
the interest expense.
Interest expenses in a bank depend on the average cost of deposit (COD) mobilized by the bank.
Lower the COD lower the interest expenses and thus higher the profitability. Therefore from
profitability point of view banks plan their COD at lowest possible level. The nature of interest
expense is that of a variable expense. The net earnings from interest income of a bank deducting
the interest expense for the deposit mobilized is called 'Spread' which is similar to the
'Contribution Margin' in sales of commodities by a manufacturing units.
Other expenses are the administrative expenses those are generally incurred by the bank during
the course of its operation. Higher the volume of business transaction of a bank, higher will be
the amount of its other expenses. Therefore, the expense should be related with the business
activities, which ultimately should yield in income for the bank. Such other expenses from
burden to the profitability as it consume the spread earned. Therefore budgets are prepared
with an aim of reducing the burden as far as possible. The expenses budgets are formulated in
co related with the activities of the bank and the targets are allocated to different branches.
Revenue Plan
Revenue of a bank is generated from the income yielding activities of the bank. Therefore while
preparing the resources deployment plan and non-funded business activities plan, the banks
make the estimation of the revenue in advance during the period for which the plan is
developed. Revenues of a bank are generated in the following forms:

42
a. Interest income
b. Commission and discounts
c. Dividend
d. Other income
e. Foreign exchange income
f. Non-operating income
Generally the interest income of a commercial bank holds a major portion in total revenue of the
bank and it provides the major source of earning of a bank. Therefore total income of a bank is
categorized in two type viz. interest income and other income, while the later including other
income items as listed above except the interest income.
The interest income is earned by charging interest on the fund deployed in interest earning
assets such as loan and advances, overdraft, investments in government securities, debentures
etc. For this study, the income from Bills discounting has also been treated as interest income, as
we consider loans overdraft and bills discounting together as a single asset portfolio as LDO.
As the average rate of interest on LDO are comparatively higher than any other kind of income
yielding assets, from the profitability point of view, higher asset allocation into LDO, higher will
be the income. The other income are generate from other activities of the bank such as issuance
of L/C Bank Guarantees, from remittance charges, cheque collection fee, locker charges, service
charges, commitment charges, trading gain on foreign exchange, revaluation gain on foreign
exchange reserves etc. The amount of other income of a bank greatly contributes in lowering the
burden on the profitability. Higher the other income earned by the bank, lower will be the net
burden amount and thus better will be the profitability of the bank.
Income of a bank is essentially activity based i.e. the volume of business. Higher the income
generating activities of a bank, higher will be the amount of its revenue. Therefore the bank
develops its plans for various activities in such a way that it optimizes its revenue.

43
2.1.20 Implementation of the Profit PlanDevelopment of an annual profit plan ends with the planned income statement, the balance
sheet and the planned statement of changes in financial position. These three statements
summaries and integrate the details of plans developed by management for the period. They
also report the primary impact of detailed plans on the financial characteristics of the firm.
Before redistributing the completed profit plan it is general desirable to recast certain budget
schedules so that technical accounting mechanics and jargon are avoided as much as possible.
The redesigned budget schedules should be assembled in on logical order, reproduced and
distributed before the first day of the upcoming budget period. The profit plan completion data
is important. Issuance of a profit plan after the beginning of the budget period is one sure way of
destroying much of the budget potential. Timely completion of the planning budget suggests the
need for a budget calendar.
The final test of whether the efforts and cost in developing a profit plan are worthwhile is its
usefulness to management. The plan should be developed with the conviction that the
enterprises are going to meet or exceed all major objectives. Participation enhances
communication. If this principle is to be effective, the various executives and supervisors should
have a clear understanding of their responsibilities. The copies of the complete profit plan be
prepared and distributed to the member of executive management. The guiding principle in
establishing the distribution policy might be to provide one copy to each member of the
management team according to his/her overall responsibilities, while taking in to account the
problem of security. After distribution of the profit plan a series of profit plan conferences
should be held. The top executives discuss comprehensively the plans expectations and steps in
implementation. At this top level meeting the importance of action, flexibility and continuous
control may well be emphasized. In essence, each manager has to realize that the budget is a
tool for his or her use. Conferences should be a held so as to convey the profit plan to each level
of management.
The manager of each responsibility centre obtains an approved profit plan for this centre and it
becomes the basis for current operations and excerpts considerable coordinating and controlling

44
effects. Performance must be measured and reported to management. Execution of the plan is
assured through control procedure must be established so that accomplishment, or failure is
immediately known. On this basis action can be taken to correct or minimize and undesirable
effects. Short term performance reporting is essential.
A budget program viewed and administrated in a sophisticated way does not hamper or restrict
management, instead, it provide definite goals around which day today and mouth to mouth
decisions are made. Flexibility in the use and application of both the profit plan and variable
budgets also should be considered in detail. Flexibility in budget application is essential and it
increases the probabilities of achieving or bettering the objectives.
2.1.21 Performance Reports
Performance reporting is an important part of a comprehensive PPC system. Its phase of a
comprehensive PPC program significantly influences the extent to which the organization's
planned goals and objectives are attained. Performance reports deal with control aspect of PPC.
The control function of management defined as the action necessary to assure the objectives
plans, policies and standards are being attended. Performance reports are one of the vital tools
of management to exercise its control function effectively.
Special external reports, reports to owner and internal reports are specially presented in the
organization. Performance reports include in internal reports groups. It is usually prepared on an
monthly basis and follows a standardized format. Such reports are designed to facilitate internal
control by management. Fundamentally actual results of reports are compared with goals and
budget plans. Frequently they identify problems that require special attention since these
reports are prepared to pinpoint both efficient and inefficient performance.
Features of Performance ReportsIn comprehensive PPC, performance report is very important. The main objective of
performance reports is the communication of performance measurement, actual results and the
related variances. Performance reports offer management essential insights in to all the facts of
operational efficiencies. Performance reports should be:

45
1. Tailored to the organizational structure and focus of controllability (that is by responsibility
centers).
2. Designed to implement the management by exception principle.
3. Repetitive and related to short term period.
4. Adapted to the requirements of the primary users.
5. Simple understandable and reports only essential information.
6. Accurate and designed to pinpoint significant distinctions.
7. Prepared and presently promptly.
8. Constructive in tone.
Aspects of Performance Reports
The various managers use their performance reports depends on many factors, some behavioral
and some technical. One important factor is the extent to while the performance reports serves
the management and decisions making needs of the users. Top management needs reports that
give a complete and readily comprehensive summary of the overall aspects of operations and
identification of major events. Middle management needs summary data as well as detailed data
on day-to-day operation. Similarly lower level management needs reports that must be detailed,
simple understandable and limited to items having a direct bearing on the supervisor's
operational responsibilities.
In the design and preparation of performance reports careful attention must be given that titles
and headings should be descriptive; column heading and side caption should clearly identify the
data, and the technical jargon should be avoided. Reports should not be too long and complex;
tabulations should be avoided. Performance reports should be standardized to a reasonable
degree and if should be relevant.
Performance reports should be available on a timely basis. To attain a realistic balance between
immediate reporting and the costs of detailed reporting, monthly performance reports are
widely used in the organization.

46
2.1.22 Concept of Banking:
Bank is a financial institution, which plays a significant role in the development of the country. It
facilitates the growth of trade and industry and other sectors of the national economy. It is a
resource for economic development, which maintains the self-confidence of segments of society
and extends credit to the people. The more development financial system of the world
characteristically falls into three parts: The central bank, the commercial banks and other
financial institutions. They are also known as financial intermediaries. A bank is a business
organization that receives and holds deposits of funds from others makes loans or extends
credits and transfers funds by written orders of depositors. The business in banking is one of
collecting funds from the community and extending credit (making loans) to people for useful
purpose. Banks have played a pivotal role in moving money from lenders to borrowers. Banking
is a profit seeking business not a community charity. As a profit seeker, it is expected to pay
dividends and otherwise add to the wealth of its shareholders. In the Nepalese context, owadays
three types of banks are being operated by performing their activities in different sectors, such
as Central Bank (Nepal Rastra Bank), Commercial Banks and Development Banks, commercial
banking are either operated fully in the public sector (RBB) or the joint sector (NBL) or being
operated under joint venture with foreign banks with private participation (NABIL/ NIBL).
Evolution of Commercial Bank The world 'Bank' is derived from the word 'Banco', "Bancus' or
'Banque' all meaning to a bench. This refers that early bankers transacted their money lending
activities on banches in the marketplace exhibiting the coins of different countries in different
denominations for the purpose of changing and or lending money. Some writers are of the
opinion that the word 'Bank' came from the German word 'Banc' meaning joint stock fund
(Varshney, 1993:169).
In its native from, banking is as old as in the authentic history and origins of the modern
commercial banking are traceable in ancient times. In ancient Greece, around 2000 B.C., the
famous temples of Ephesus, Delphi and Olympia were used as depositories for people surplus
fund and these temples were the centers for money lending transactions. The pries of these
temples acted as financial agents until public confidence was destroyed by the spread of
disbelief in the religion. Later, however, for a few centuries, banking as an organized system of

47
money lending receded because of the religious belief that the charging of interest was immoral.
However, the banking as we know today, made its first beginning around the middle of 12 th
century in Italy. The Bank of Venice, founded in 1157 A.D. was the first public banking
institutions. Following this, in 14th century, the Bank of Barcelona and the Bank of Genoa were
established in 1401 A.D. and 1407 A.D. respectively (Vaish, 1996:192).
In England, start of Banking can be accounted for as far back as the region of Edward III. Those
days, the Royal Exchanger used to exchange the various coins into British money and also used
to supply foreign money to the British men going out of the country. The bankers of Lombardy
were famous n medieval Europe as the credit of planning the seed of modern banking in England
goes to them when they settled in London in the locality now famous as the Lombard Street.
The goldsmiths can be considered as the initial Bankers in England as they used to keep strong
rooms with watchmen employed. People entrusted their cash to them. The goldsmiths used to
issue duly signed receipt of the deposits with the undertaking to return the money on demand
charging some fee for safe keeping. These undertaking helped in gaining a further confidence of
the public therefore the money were kept with them for longer periods. They were thereby
encouraged to lend some part of these funds, which became profitable business to them.
Therefore they started offering interest on the deposits to attract more funds. In the course of
time independent banking concerned were set up. The Bank of England was established in 1694,
under a special Royal Charter. Further in 1833 legislative sanction was granted for establishment
of joint stock banks in London, which served as a big impetus to the development of joint stock
banking. These banks took the initiative for extending current account facilities and also
introduced the facilities of withdrawals through cheques.
In India, the ancient Hindu scriptures refer to the money lending activities in the Vedic period.
During the Ramayan and Mahabharata eras, banking had become a full-fledged business activity
and during the smiriti period (after the Vedic period), the business of Banking was carried on by
the members of Vanish community. Manu, the great law giver of the time speaks of the earning
of interest as the business of Bishyas. The bankers in the Smriti period performed most of those
functions which the banks in modern times performs such as the accepting of deposits, granting

48
loans, acting as the treasurer, granting loans to the king in times of grave arises and banker to
the state and issuing and managing the currency of the country (Vanish, 1992:183).
In Nepal, although the monetary history dates back to 1st century (Lichhavi Dynasty), the banking
history is comparatively very short. The development of organized banking has started in Nepal
only from around the starting of 20th century of Bikram Sambat. Nepal Bank Limited, established
in B.S. 1994 with an authorized capital of Rs.1 crore and paid up capital of Rs.8 lacs 42 thousand
is the first organized bank established in Nepal (NRB, 2045). Although during the Prime Minister-
ship of Rana Prime Minister Ranadwip Singh an office called "Tejarath Adda" was established for
granting loans to government officials and also to the general public against the security of gold,
silver and other valuables, it could not be considered as Bank in real sense as it did not collect
deposit. Later after establishment of Nepal Bank, the functions of "Tejarath Adda' were limited
upto providing loans to government officials only (NRB Report, 2045:12).
Banking development in Nepal found another break after the establishment of Nepal Rastra
Bank, the Central Bank of Nepal in 2013 B.S. (NRB, 2045:14). This has helped organizing the
monetary system in the country before which the duel currency system (Indian and Nepalese
currency) was prevailing in the system. Larger sector of economy was none monetized. In the
course of organized development of banking sector, second commercial bank, Rastriya Banijya
Bank was established in 2022 B.S. at the state ownership (NRB Report, 2045:16). Later on, in FY
2039/40, the policy for allowing establishment of foreign joint venture banks was taken with an
aim of having fair competition and skill development in banking sector, which had added a new
dimension in development of banking in Nepal. Accordingly, Nepal Arab Bank Ltd. (presently
renamed as Nabil Bank) has been established as the first joint venture bank in Nepal in 2041 B.S.
(NRB Report, 2045:17).
Afterward, various commercial banks were opened with foreign joint venture under private
sectors in Nepal which had contributed a lot to bring the commercial banking at present day
position. Nepal Bangladesh Bank has established in the year 2051 B.S.
49
2.1.23 Concept of Commercials BanksThe term 'Bank', signifies the place where we keep our money for safe keeping as well as for
earning some interest or the place from where we borrow money as loan. As regard to the
borrowing money from the Bank, we may consider its function as that of money lender in our
society. But a bank a moneylender is different in the sense that the former lends the money
which is principally collected from their depositors while later does so from its own resources.
The Random House Dictionary of the English Language defines the bank as an institution for
receiving money and is some cases, issuing notes and transiting other financial business (Stein
and Urdang, 1985:29).
Banks refer to an institution, which perform the activities related with money and credit. Banks
have been traditionally regarded as merely the purveyor of money. But today they are not
merely purveyor of money but creator or manufacturer of money in an economic system.
Maclead, in this book 'theory of credit' has defined the bank not only as an institution, that
borrows and lend money but also the institution for creating credit. In the opinion of Sayers,
Banks are the institutions whose debts usually are referred to as bank deposit and are commonly
acceptable in final settlement of other people's debt. He has taken the bank deposit as the debt
owe by bank and that particular depositor can set off his liability with his creditor by the deposit
in the Bank to the extent of his deposit amount.
The Commercial Bank Act 2031, under which commercial banks in Nepal are established and
operated, has defined Commercial Bank as a bank which exchanges money, accepts deposit,
advances loans and performs other commercial transactions and which is not specially
established with the objectives of co-operative, agricultural, industrial or any other of such kind
of specified purpose. The Act has defined the commercial Bank on the basis of its objectives and
activities. Referring to the act, a commercial bank:
Should be established with a specified objective of co-operative, agricultural, industrial or
any of such of specific purpose.
Should accept customer deposit.
Should advance loans and make investments.

50
Perform commercial transactions.
The same Act has provided for the modalities of establishing a commercial bank, as per which a
commercial bank can be established under the Company Act as a limited liability company only
with the recommendations of Nepal Rastra Bank.
From the various definition made and opinion produced regarding commercial banking, it can be
concluded that a commercial bank is set up to collect scattered funds and employ them to
productive sector of economy.
2.1.24 Function of Commercial Banks:Commercial banks are the important type of financial institution for the nation in terms of
aggregate assets. The business of banking is very broad in modern business age. The number and
variety of services provided by commercial bank will probably expand. Recent innovation in
banking includes the introduction of credit cards, accounting services for business firms,
factoring, leasing participation in the Eurodollar market, and lock-box banking. The major
functions of commercial banks are explained in brief below:
a. Creating MoneyOne of the major functions of the commercial bank that separates it from other financial
institutions is its ability to create money and to destroy money, which is accomplished by the
lending and investing activities. The power of commercial banking system to create money is of
great economic significance as it results in the elastic credit system that is necessary for
economic progress at relatively steady rate of growth.
b. Payment MechanismProviding for a payment mechanism or the transfer of funds is one of the important functions
performed by commercial banks and it is increasing in importance as greater reliance is placed
on the use of cheques and credit cards. Moreover, bank credit card can be used to withdraw
cash from a depositors account, make deposits and loan payment and transfer funds between a
depositor's saving and checking account.

51
C. Pooling of Nation is SavingCommercial banks perform vital services to all sector of the economy by providing facilities for
the pooling of national saving and making them available for economically and socially desirable
purposes. The saver is rewarded by the payment of interest on saving. These pooled funds are
made available to businessman who may use them for the expansion of their productivity
capacity and to consumers for such items as housing and consumer goods.
d. Extension of CreditThe major function of commercial bank is the extension of credit to worthy borrowers. Bank
lending is very important to the economy for it makes possible the financing of agriculture,
commercial and industrial activities of the country. Moreover, the provision of bank credit
provides for the smooth operation of government such as capital improvements for building of
school and hospitals and purchasing of new fire-trucks, construction of highways and dams and
for the nation defense.
e. Facilities for the financing of Foreign TradeThe other primary function of commercial banks is making arrangements for the amount of
foreign exchange needed by business organization to pay in foreign country. Banks provide more
satisfactory guarantee to an individual or firms bought the issuance of commercial letter of
credit, drafts telegraphic transfer (TT) and an accepting traveler's letter of credit or traveler's
cheques.
f. Trust ServiceIncreased incomes have made possible the accumulation of wealth, which in turn has
contributed to the growth of the trust services of commercial banks. Trust department serve as
trustees in connection with bond issues and as transfer agents and registers for corporation.
They may also administer sinking funds and perform other related activities with the issuance
and redemption of bonds and stocks.
g. Safekeeping of ValuablesThe safekeeping of valuables is one of the oldest services provided by commercial banks. The
protection of valuables falls into two areas or a department of a bank: safe deposit boxes and
safekeeping. Safe deposit boxes are made available to customer on a rental basis that may be
useful provides a place for securities, deeds, insurance policies and personal items of valuable
52
only to the owners. In other hand, safekeeping differs form safe deposits box services in that the
bank has custody of valuables and acts as an agent for the customer.
2.1.25 Role of Commercial Banks in the Development of EconomyCommercial Banks play an important role in facilitating the affairs of the economy in various
ways. The operations of commercial Banks record the economic pulse of the country. The size
and composition of their transaction reflect the economic happening in the country. Commercial
Banks have played a vital role in giving the direction in economic growth over the time by
financing the requirement of industries and trade in the country. By encouraging thrift among
the people, banks have fostered the process of capital formation in the country. In the context of
deposit mobilization, commercial banks induce the savers to hold their savings in the form of
bank deposits thus help bringing the scattered resources into the organized banking sector
which can be allocated to the different economic activities. In his way they help in country's
capital assets formation. Through their advances, banks also help the creation of income out of
which further saving by the community and further growth potentials emerge for the good of
the economy. In a planned economy, banks make the entire planned productive process possible
by providing funds to the public sector, joint sector or private sector for any type of organization.
All employment income distribution and other objectives of the plan as far as possible subsumed
into the production plan which banks finance.
The importance of commercial banks in directing the economic activities in the system is
immense. Not only in the highly developed economies where the commercial and industrial
activities are paralyzed in the absence of banks, even in the developing countries' economy are
most of the economic activities particularly of organized sectors bank based. Therefore, in a
nutshell it can be said that the growth of the economy is tied up with the growth of the
commercial banks in the economy.
53
2.2 Review of Previous StudiesPandey (2008) carried a study entitled “Profit planning in commercial banks with a case study
of Bank of Kathmandu Ltd and Himalayan Bank Ltd.” for the purpose of the partial fulfillment of
the requirement for Master Degree in Business Administration. The main objective of this study
is to trace out the situation of profit planning in Nepalese commercial banks.
His main objectives:
To highlight the current profit planning premises adopted and its effectiveness in HB
Land BOK.
To analyze the variance of budgeted and actual achievements.
To study the growth of the business of the Banks over the period.
To provide suggestion and recommendations for improvements of the overall
profitability of the banks.
His Major Findings:
Major concentration of the analysis on profit planning in commercial banks is at deposit
mobilization. In this respect, they are incurring higher cost toward deposit mobilizations.
The average growth rate of total deposit of BOK is more than of HBL i.e.17.0725% >
11.36%.
The LABP of both banks are fluctuating rate over the study period, but in the FY 2002/03
is negative growth of BOK by -1.54% (on the basis of FY 2001/02). Comparatively BOK is
good position than HBL. From the average growth rate i.e. 16.08% > 14.11% respectively.
In the BOK, NLABP has found high at first years and negative in second year then after
fluctuate. At the last it growth rate is 22.19 percent (on the basis of 2004/05). Similarly
the HBL, NLABP has found positive in 5 years and negative in two years. At last year it's
growth rate is negative by -7.79 percent (on the basis of 2004/05) .
Expenditure of the both banks are increasing trend but in the FY 2002/03 of BOK and FY
2001/02 of HBL is decreased. In comparatively more increasing trend in the HBL than
BOK.
54
His Major Recommendations:
The deposit collections of both the banks are increasing over the period but the
collection of HBL is not satisfactory in comparison with BOK. So, it is recommended to
HBL to collect more amounts as deposit through large variety of deposit scheme and
facilities, like cumulative deposit scheme, gift cheques recurring deposit scheme (life
insurance), and monthly interest income. The minimum amount needed to open on
account should be minimizes so that it will attract other small deposits.
The average cost of deposit of BOK is high than HBL. Therefore BOK should try to lower it
by mobilizing more and more low cost or Cost free deposits there by reducing the
interest cost because due to high cost of deposit, bank is forced to invest its fund more
on high yield assets, which are generally not liquid and obviously risky for the bank.
Correlation between interest expenses and deposit of HBL is negative, it shows there is
no relation between interest expenses and deposit but it is not possible. So HBL should
increase its cost of deposit rate.
Kharel (2008) conducted a study entitled "Profit planning of commercial banks in Nepal
comparative study of Everest Bank, Nabil Bank and Bank of Kathmandu " for the purpose of
the partial fulfillment of the requirement for Master Degree in Business Studies.
His main objectives:
To find out the relationships between total investment loan and advances, deposit, net
profit and outside assets.
To identify the investment priority sectors of commercial Bank
To assess the impact of investment on profitability.
To analyze and forecast the trend and structure of deposit utilization and its projection
for five years of Commercial Bank
55
His Major Findings:
The liquidity position of EBL is comparatively better than that NABIL and BOK. EBL
has invested higher sector in government
Securities than BOK less then portion than of Nabil. Asset management ratio
found that EBL is better position as compared to that of Nabil and BOK.
EBL has trying to best in loan loss provision.
Investment on share and debenture to total working found ratio is higher in BOK.
The interest earned to total outside asset and return on total working fund ratio
of EBL is lowest of all. However, over all analysis of profitability ratios is average
profitable in comparison to other compared bank. I.e. Nabil and BOK. to make the
profit BOK is taking highest risk by providing the higher portion of its deposit as a
loan.
The return, loan, advances ratio, and return on assets of EBL are lowest of all. The
ratio suggests that the earning capacities of the bank's loan and advances is
satisfactory. The return on asset of the bank is good in average. It indicates the
good earning capacity of the bank assets and good utilization of its assets.
The total interest paid to working fund ratio is less than the interest earned to
total working fund ratio. so it is profitable position as it is profitable position as it
is getting higher return that is interest cost .
EBL has showing its good performance by increasing the total deposit, loan and
advance and investment in profitable sectors interested earning by providing loan
to clients.
The trend of the total investment, total deposit, loan and advances and net profits
of EBL shows better position than that of NABIL and BOK.
56
Kunwar (2009), has submitted thesis on the topic Profit Planning of Nabil Bank Limited.' The
study is conducted on profit planning of Nabil Bank, which is one of the leading banks in Nepal.
Main Objectives:
To find out the relationships between total investment loan and advances, deposit, net
profit and outside assets.
To identify the investment priority sectors of commercial Bank
To assess the impact of investment on profitability.
To analyze and forecast the trend and structure of deposit utilization and its projection
for five years of Commercial Bank
To provide suggestion and possible guidelines to improve investment policy and its
problems.
Major Findings:
NABIL has been maintaining a steady growth rate over this period.
NABIL has earned a net profit of Rs 747 million for the fiscal year 2007/08 and this comes
to be 10.83% more as compared to the same period in the previous fiscal year.
NABIL earned a operating profit of Rs 1122.7 million for the fiscal year 2007/08 and this
comes to be 8.19%more as compared to the same period in the previous fiscal year.
Total deposit is Rs 31915 million for the fiscal year 2007/08 and this comes to be 36.72%
more as compared to the same period in the previous fiscal year.
Total loan is Rs 21759 million which is increase by 36.8%compare as previous fiscal year.
Nabil bank has adequate liquidity position. It shows that bank's investment is
appropriate.
Loan loss provision to total loan and advances ratio of NABIL is in decreasing trend. This
shows that good quality of assets in total volume of loan and advances.
Total non-performing assets to total assets ratio is also in decreasing trend. It indicates
proper mange of total asset. This ratio indicates the more efficient operating of credit
management. Ratios are decreasing trends it indicates the bank is decreasing the non-
performing loan from total loan.

57
Interest expenses to total deposit ratio of NABIL is increased in fiscal year 2007/08. That
this ratio does not indicate higher interest expenses on total deposit.
Equity portion of the bank is slightly increasing in the recent years due to issue of
directives by Nepal Rastra Bank (NRB) the entire bank to increases it's paid up capital.
His Major Recommendations:
Cash and bank balance of NABIL is high. Banks efficiency should be increased to satisfy
the demand of depositor at low level of cash and bank balance does not provide return
to the bank. Therefore some percentage of the cash and bank balance should be invested
in profitable sectors.
Bank is suggested to make policy to ensure rapid identification of delinquent loans. Bank
should make immediate follow-up of loan until it is recovered. The recovery of loan is
very challenging as well as important part of the bank. Therefore bank must be careful to
strengthen credit collection policy
NABIL should avoid extending credits merely based on oral information presented at the
credit interview. Historical financial and trade records should be obtained for proper
assessment of the proposal.
Maharjan (2009) conducted a study on the topic 'Profit Planning in a Commercial Bank (a case
study of Standard Chartered Bank)'
Main Objectives:
To highlight the current profit-planning premises adopted and its effectiveness in
Standard Chartered Bank.
To observe Standard Chartered Bank's Profit Planning on the basis of overall managerial
Budgets developed by Bank.
To analyze the variance of budgeted and actual achievements
To study the growth of the business of the Bank over the period.
To make necessary suggestions and recommendations.
58
His Major Findings:
The decision making process is highly centralized however, management takes the feed
forwards for annual planning and strategy building through manager conferences and
strategy building through manager conferences and strategic meeting organized twice in
every year at the head office.
Interest expenses amount is the highest among total expense items of the bank every
year.
The total deposit of the bank is found increasing every year corresponding to the
Increase in interest expenses the total deposit is perfectly and positively correlated with
total interest expenses.
The Profitability ratio shows that it is a useful measurement for all financial researchers
invested in the assets. As Return on assets is high during 2005/06 with 2.55% and return
on equity is high in same fiscal year with 37.55%. This shows that overall efficiency of the
SC Bank and better utilization of total resources available is higher and strong.
His Major Recommendations:
Profit Planning & control technique should be used for making long term banking
strategies and managerial decisions.
Employee training & career planning at advance level should be given more focus in
order to keep the man power updated with the changing practices and the technologies.
The average cost of deposit of the Bank is high. Therefore, bank should try to lower it by
mobilizing more and more low cost or cost free deposits thereby reducing the interest
cost due to high cost of deposit, bank is forced to invest its liquid and obviously risky for
the bank.
Bank CD ratio is high, which is rather a compulsion to meet the cost of high cost deposits.
Higher CD ratio although gives better return in short term, it hampers the liquid and is
more risky for the bank and calls for more provision for loan loss. In this way, the
profitability of the bank also gets hampered on the long run. Therefore, the bank should

59
improve its position from lowering the deposit cost and increase the investments in
liquid assets although they are of low yield.
2.3 Research Gap
Today’s world is marketed by rapid changes and new developments, financial recession, as such
researchers conducted a few years back may not be adequate to explain current phenomena.
Thus continuous attempt needs to be taken and new researcher and conducted to build our
existing knowledge base, interpret and analyze events in the face of dynamism. Most of the past
research studies about profit planning system are basically related to the profit planning system
of manufacturing organization or production oriented activities. The researcher could find some
study so far that has been related to profit planning system of commercial bank in Bank Of
Kathmandu Limited, Himalayan Bank, Standard Chartered Bank, Nepal Investment Bank, Nabil
Bank Limited, and Everest Bank Limited. All the dissertations have pointed out that there is no
proper profit planning system and recommend for the effective implementation of profit
planning system in the concerned institution. Through many affiliate researchers have been
done in this area but these have been very few exclusive researchers on this subject.
This study shall be a new study in this field as no study has been made so far in the profit
planning of commercial banks i.e. comparative study on profit planning in Nepal Investment
Bank Limited, NABIL Bank Limited and SBI Bank Limited. This study has tried to indicate the
implementation of profit planning system as well as to see how far the banks are practicing. This
study has analyzed the financial position of NIBL, NABIL and SBI by applying the tools of ratio
analysis and other mathematical and statistical tools. Finally it concludes the various findings of
research and recommendations to the NIBL, NABIL and SBI.

60
CHAPTER – III
RESEARCH METHODOLOGY
The term ‘research’ is believed to be derived from the French word ‘Researcher’ meaning to
search again. The research work is undertaken following a systematic way, which is called
Research Methodology. As per Kother, it is the way to solve systematically about the research
problem. This chapter refers to the overall research method comprising the theoretical aspect to
the collection and analysis of data. This study covers quantitative methodology in a greater
extent and also cases the descriptive part based on both technical aspect and logical aspect. This
study has intense relation with the application of planning and control in a commercial Bank
with a specific reference to NIBL, Nabil and Nepal SBI Bank Ltd regarding the objectives to
analyze, examine and interpret the application of profit planning in the Bank. The Research
Methodology includes research design, data collection procedures and research variable and
tools used. This chapter describes research design, population, sampling procedure, sources of
data and analysis of data.
3.1 Research Design
The research design is the conceptual structure within which research is conducted. It
constitutes the blueprint for the collection, measurement and analysis of data. As such the
design includes an outline of what the researcher will do from writing the hypothesis and its
operational implications to the final analysis of data.
This study is an examination and evaluation of budget process in profit planning program of
NIBL, NABIL and SBI. Various functional budgets and other related accounting information and
statement of the banks are materials to analyze and evaluate the profit planning system of
banks. Descriptive as well as analytical approaches have been adopted in this research. This is a
comparative study research of commercial banks.
61
3.2 Population and Sample
As this research aims at studying the profit planning aspect of the commercial bank taking the
reference of NIBL, NABIL and SBI and data have been analyze for several years of its operation.
Here, all the commercial banks are population of the study and NIBL, NABIL and SBI have been
selected as sample for the present study.
3.3 Data Collection Procedures and Sources of Data
This study is mostly based on secondary data. However, primary data and information have been
obtained through informal discussions with the staffs of the bank. Secondary data have been
collected from the annual published accounting and financial statement of the banks. Similarly
other necessary data have collected from website, newspapers and related publications.
3.4 Research Variables
Loans/Advances overdrafts and Bills discounted (LDO), customer deposits, total resources, total
deployment interest expenses, other expenses, interest income, other income etc. of the banks
are the research variables of this study.
3.5 Analysis of Data
Analysis is the careful study of available facts so that one can understand and drew conclusion
from them on the basis of established principles and sound logic (Cottle etal; 1988, 29). This
study mostly based the analysis of secondary data with the help of different statistical tools.
Therefore the data have been collected accordingly and managed, analyzed and presented in
suitable tables, formats, diagrams, graphs and charts. Such presentations have been interpreted
and explained wherever necessary. Financial, mathematical and statistical tools are used to
analyze the presented data, which includes ratio analysis, percentage, regression analysis,
correlation, mean, standard deviation, coefficient of variance, percentile increment, etc.
62
3.6 Statistical Tools
To draw the conclusion by analyzing the collected data simple statistical tool like arithmetic
mean, multiple bar diagram, pie-chart are used and tabulation are used to implicit the
comparative results.
3.6.1 Arithmetic Mean Average
The central values that represent the characteristics of the whole distribution or the values
around which all items of the distribution tend to concentrate are called average. Arithmetic
mean or arithmetic average is one of the important statistical measures of average. The
arithmetic mean of a given set of observation is their sum divided by the number of
observations.
3.6.2 Multiple Bar- Diagrams and Graphs
Diagrams and graphs are visual aids which give a bird’s eye view of a set of numerical data which
show the information in a way that enables us to make comparison between two or more than
two sets of data. Diagrams are in different types. Out of these various types of diagram one of
the most important form of diagrammatic presentation of data is multiple bar diagram which is
used in cases where multiple characteristics of the same set of data have to be presented and
compared.
3.6.3 Percentage
Percentage is one of the most useful tools for the comparison of two quantities or variables.
Simply, the word percentage means per hundred. In other words, the fraction with 100 as its
denominator is known as a percentage and the numerator of this fraction is known as rate of
percent.
3.6.4 Coefficient of correlation(R)
Correlation analysis is the statistical tools use to describe the degree to which one variable is
linearly related to another. The coefficient of correlation measures the direction of relationship

63
between the two sets of figures. It is the square root of the coefficient of determination.
Correlation can either be negative or positive. It always lies between +1 to -1. The degree of
association between the two variables, say X and Y, and is defined by correlation coefficient (R)
R =22 yx
xy
Where,
X = X - X and Y = Y- Y
3.6.5 Regression Analysis
Regression is the statistical tool which is used to determine the statistical relationship between
two (or more) variables and to make estimation (or prediction) of one variable on the basis of
the other variable(s).In other words, regression is that statistical tool with the help of which the
unknown value of one variable can be estimated on the basis of known value of the other
variable.
3.6.6 Standard Deviation (σ)
The standard deviation is the absolute measure of dispersion. It is defined as the positive square
root of the mean of the square of the deviation taken from the arithmetic mean. The greater the
amount of dispersion or variability, the greater the standard deviation, the greater will be the
magnitude of the deviation of the values from their mean. A small standard deviation means a
high degree of uniformity of the observation as well as homogeneity of a series and a large
standard deviation means just the opposite.
3.6.7 Coefficient of Variation (C.V.)
The relative measure of dispersion based on the standard deviation is known as the coefficient
of variation. It is independent of unit. So, two distributions can bitterly be compared with the
help of C.V. for their variability. Less the C.V., more will be the uniformity, consistency, stable
and homogeneous etc. and vice versa.

64
CHAPTER-IV
PRESENTATION AND ANALYSIS OF DATA
This chapter is devoted to the presentation, analysis, interpretation and scoring the empirical
finding out of the study through definite course of research methodology. To achieve the stated
objective of the study researcher has tabulated the available data in different chart, table and
analyzed using the tools where necessary and applicable stated in the research methodology.
4.1 Financial Analysis of Commercial Bank
Financial analysis of the process of identifying the financial strength and weakness of the firm by
properly establishing relationship between the items of the balance sheet. Here relevant ratio is
calculated and appropriate interpretations are made. Analysis of financial ratio shows the
performance of the concern banks.
4.1.1 Liquidity Ratio
Commercial Banks must maintain its satisfactory liquidity position to satisfy the credit needs of
the commercial to meet demands for deposits, withdrawals, pay nation by obligation in time and
convert non-cash assets into cash to fulfill immediate needs without loss of bank and consequent
impact on long run profit.
Current Ratio
It is the relationship of current assets and current liabilities. Current assets can be converted in to
cash with in short period of time normally not exceeding one year. Current liabilities are those
obligation which are payable within short period. Current assets consist of cash and bank
balance, money at call or short terms notice, other interest receivable and other miscellaneous
current assets. Current liabilities consist of bills payable, Tax provision, staff bonus, dividend
payable and miscellaneous current liabilities.

65
Table 4.1Current Ratio
(In %)Bank Fiscal Year Mean S.D C.V
%2003/04 2004/05 2005/06 2006/07 2007/08 2008/09
NIBL 3.14 3.87 5.96 7.17 5.89 6.31 5.39 1.39 25.89
NABIL 2.60 2.29 3.11 2.55 4.43 3.40 3.06 0.71 23.17
SBI 2.66 2.74 6.63 6.07 8.11 7.03 5.54 2.09 37.72
(Source: Annual Report of Bank)
In the table 4.1 current ratio of commercial banks are analyzed. The table reflects that the
current assets of all commercial banks have exceeded the current liabilities during the six years
period. In general it can be said that all the banks have sound ability to meet their short term
obligations in other words bank is capable of discharging the current obligations.
In case of NIBL, the current ratios are in increasing trend from fiscal year 2003/04 to 2006/07 but
it has slightly decreased in the year 2007/08 by 1.28 & in the year 2008/09 Increased by 0.42 .
NABIL has a fluctuating trend ratio. Similarly SBI has increasing trend ratio but in the fiscal Year
2006/07 & 2008/09 decreased by 0.56 & 1.08 respectively. In an average, NABIL has maintained
lower current ratio, which states that liquidity position of NABIL is fair. The value of coefficient of
variation of NIBL is 25.89% which is comparatively lower than SBI and greater than NABIL i.e.
37.72% < 25.89% > 23.17%. Thus it can be said that current ratio of NIBL is less consistence than
NABIL and is slightly consistence than SBI.
Cash and Bank Balance to Total Deposit Ratio
Cash and bank balance are assets that constitute the banks first line of defense and consist of
cash and hand foreign cash on hand cheques and other cash items balance with demotic banks
and balance help aboard. This ratio measures the promotion of most liquid assets i.e. cash and

66
balance among the total current asset of bank. Higher ratio shows the bank ability to meet
demand for cash.
The table below shows cash and bank balance to total deposit ratio of NIBL. NABIL and SBI from
the FY 2003/04 to 2008/09.
Table 4.2Cash and Bank Balance to Total Deposit Ratio
(In %)
Bank
Fiscal Year
Mean S.D C.V2003/04 2004/05 2005/06 2006/07 2007/08 2008/09
NIBL 10.65 9.40 12.34 9.97 10.90 16.96 11.70 2.53 21.62
NABIL 6.87 3.83 3.26 6.00 8.37 9.03 6.23 2.12 34.05
SBI 12.01 8.36 10.16 9.81 9.79 6.81 9.49 1.60 16.86
(Source: Annual Report of Bank)
The table 4.2 shows the percentage of cash and bank balance to total deposit ratio position of
NIBL, NABIL and SBI. The mean standard deviation and coefficient of variation of cash and bank
balance to total deposit ratios of all banks are better. The above table reflects all Banks has
fluctuating trend from the FY 2003/04 to 2007/08 respectively. In average NIBL has higher cash
and bank balance to total deposits ratio than SBI and NABIL. It states that the liquidity position of
NIBL is better in this regard.
The above analysis helps to conclude that, the cash and bank balance position of NABIL with
respect to deposits is not better against the readiness to serve its customers deposits than that
of the NIBL. So NABIL may invest in more productive sectors like short-term marketable
securities, treasury bills etc ensuring enough liquidity which will helps the bank to improve its
profitability.
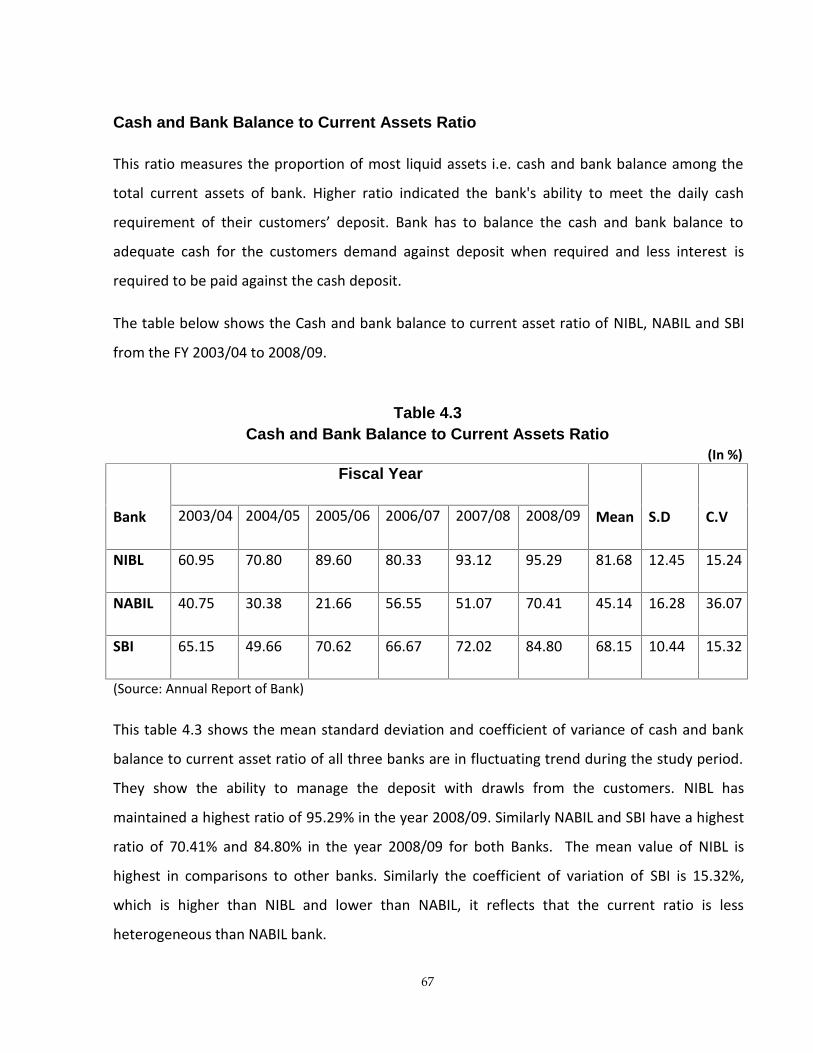
67
Cash and Bank Balance to Current Assets Ratio
This ratio measures the proportion of most liquid assets i.e. cash and bank balance among the
total current assets of bank. Higher ratio indicated the bank's ability to meet the daily cash
requirement of their customers’ deposit. Bank has to balance the cash and bank balance to
adequate cash for the customers demand against deposit when required and less interest is
required to be paid against the cash deposit.
The table below shows the Cash and bank balance to current asset ratio of NIBL, NABIL and SBI
from the FY 2003/04 to 2008/09.
Table 4.3Cash and Bank Balance to Current Assets Ratio
(In %)
Bank
Fiscal Year
Mean S.D C.V2003/04 2004/05 2005/06 2006/07 2007/08 2008/09
NIBL 60.95 70.80 89.60 80.33 93.12 95.29 81.68 12.45 15.24
NABIL 40.75 30.38 21.66 56.55 51.07 70.41 45.14 16.28 36.07
SBI 65.15 49.66 70.62 66.67 72.02 84.80 68.15 10.44 15.32
(Source: Annual Report of Bank)
This table 4.3 shows the mean standard deviation and coefficient of variance of cash and bank
balance to current asset ratio of all three banks are in fluctuating trend during the study period.
They show the ability to manage the deposit with drawls from the customers. NIBL has
maintained a highest ratio of 95.29% in the year 2008/09. Similarly NABIL and SBI have a highest
ratio of 70.41% and 84.80% in the year 2008/09 for both Banks. The mean value of NIBL is
highest in comparisons to other banks. Similarly the coefficient of variation of SBI is 15.32%,
which is higher than NIBL and lower than NABIL, it reflects that the current ratio is less
heterogeneous than NABIL bank.

68
Lastly, the analysis reveals that NIBL is better position during the study period as the bank shows
the ability to manage the deposit with drawl from the customers although it has the fluctuating
trend.
Investment on Government Securities to Current Assets Ratio
The ratio examines portion of a commercial banks current assets which invested in different
government securities i.e. treasury bills and government bonds. Commercial banks are
interested to invest their collected fund on different securities issued by government to utilize
their excess funds. Even governments securities are not so liquid as cash and bank balance of
commercial bank, they can easily be sold in the market or it can also be converted into cash in
other ways. The ratio is computed as:-
Table 4.4Investment on Government Securities to Current Assets Ratio
(In %)
Bank
Fiscal Year
Mean S.D C.V2003/04 2004/05 2005/06 2006/07 2007/08 2008/09
NIBL 99.40 102.92 96.73 107.14 78.24 30.46 85.82 26.35 30.71
NABIL 154.22 131.35 79.09 194.25 88.85 77.37 120.86 43.32 35.84
SBI 261.79 152.84 119.34 153.68 148.17 130.67 161.08 46.73 29.01
(Source: Annual Report of Bank)
The above table 4.4 reflects that investment in government securities to current asset ratio of all
banks are fluctuating trend.
The mean ratio of NABIL is lesser than SBI and higher than NIBL. It means that NABIL has invest
it’s as much as portion of its current assets as government securities as that of NIBL and less than
of SBI. The coefficient of variation of SBI is lower in comparison to the other banks.
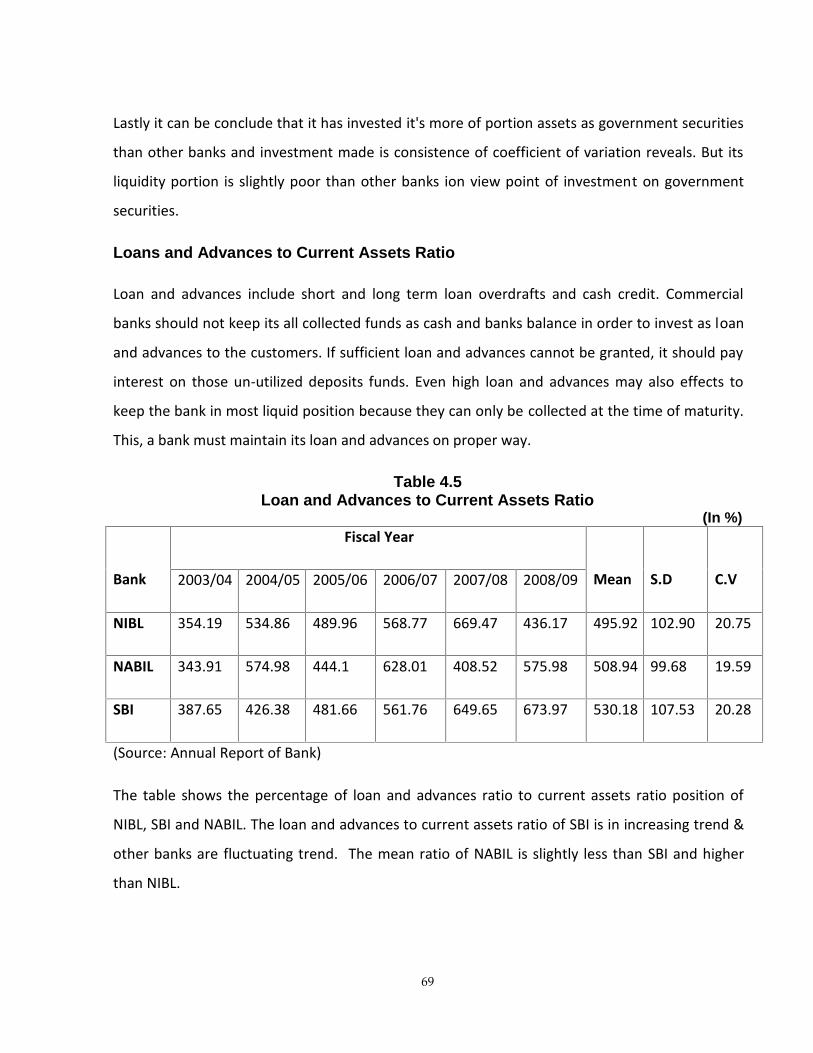
69
Lastly it can be conclude that it has invested it's more of portion assets as government securities
than other banks and investment made is consistence of coefficient of variation reveals. But its
liquidity portion is slightly poor than other banks ion view point of investment on government
securities.
Loans and Advances to Current Assets Ratio
Loan and advances include short and long term loan overdrafts and cash credit. Commercial
banks should not keep its all collected funds as cash and banks balance in order to invest as loan
and advances to the customers. If sufficient loan and advances cannot be granted, it should pay
interest on those un-utilized deposits funds. Even high loan and advances may also effects to
keep the bank in most liquid position because they can only be collected at the time of maturity.
This, a bank must maintain its loan and advances on proper way.
Table 4.5Loan and Advances to Current Assets Ratio
(In %)
Bank
Fiscal Year
Mean S.D C.V2003/04 2004/05 2005/06 2006/07 2007/08 2008/09
NIBL 354.19 534.86 489.96 568.77 669.47 436.17 495.92 102.90 20.75
NABIL 343.91 574.98 444.1 628.01 408.52 575.98 508.94 99.68 19.59
SBI 387.65 426.38 481.66 561.76 649.65 673.97 530.18 107.53 20.28
(Source: Annual Report of Bank)
The table shows the percentage of loan and advances ratio to current assets ratio position of
NIBL, SBI and NABIL. The loan and advances to current assets ratio of SBI is in increasing trend &
other banks are fluctuating trend. The mean ratio of NABIL is slightly less than SBI and higher
than NIBL.

70
It reflects that loan and advances to current asset ratios of the NIBL has maintained a highest
ratio of 669.47 % in the FY 2007/08. Similarly NABIL and SBI have in 628.01% and 673.97% in the
FY 2006/07 & 2007/08 respectively.
The coefficient of variation among ratio is lower in case of NABIL, which indicates uniformity of
NABIL in comparison to other banks. So it can conclude that it is better to mobilize its funds as
loan and advances. On the other hand satisfactory than that of other banks from the view point
of mean ratios.
4.1.2 Asset Management Ratio
Commercial bank must be managed its assets very well to satisfy its customers to earn high
profit and for its own existence. It measures the efficiency of the bank.
a. Loans and Advances to Total Deposits Ratio
This ratio measures how successfully the banks are able to mobilize the total deposit on loan and
advances for profit generating purpose. Higher the ratio indicates the better mobilization of total
deposits, but too high is not be better from its liquidity point of view. This table 4.6 reflects the
percentage of loan and advances to total deposit ratios position of NIBL, NABIL and SBI.
Table 4.6Loan and Advances to Total Deposit Ratio
(In %)
Bank
Fiscal Year
Mean S.D C.V2003/04 2004/05 2005/06 2006/07 2007/08 2008/09
NIBL 61.87 71.04 67.50 70.59 78.36 77.61 71.16 5.70 8.01
NABIL 58.01 72.57 66.79 66.60 66.94 73.87 67.46 5.17 7.66
SBI 71.46 71.80 69.32 82.66 88.32 54.12 72.95 10.79 14.79
(Source: Annual Report of Bank)

71
The ratio of NIBL SBI and NABIL have in fluctuating trend .In the case of NIBL has maintained
higher loan and advances to total deposit i.e. 78.36 % in a year 2007/08, likewise NABIL has
maintained higher ratio73.87 % in a year 2008/09 and SBI is in 88.32% in a year 2007/08
respectively. The mean value of NABIL i.e. 67.46 is less than NIBL and higher than SBI i.e. 71.16 <
67.46 > 54.12. The CV of NABIL is lower than that of the other banks which indicate that loan and
advances of it is stable and consistent.
Lastly it can be concluded that NABIL is in strong position or in better position regarding the
mobilization of total deposits on loan and advances and acquiring higher profit in comparison
with SBI and lower than NIBL. Higher ratio is not good from the view point of liquidity as the loan
and advances are not a liquid as cash and bank balance.
Total Investment to Total Deposit Ratio
The commercial banks must mobilize its deposit fund by investing in different securities issued by
government and other financial, non financial sectors. This ratio measures the extent to which
the banks are capable to mobilize their deposits on investment in various securities. This ratio is
computed by dividing total investment by total deposit ratio. The table 4.8 shows the total
investment to total deposit ratio of the banks NIBL, NABIL & SBI.
Table 4.7Total Investment and Total Deposit Ratio
(In %)
Bank
Fiscal Year
Mean S.D C.V2003/04 2004/05 2005/06 2006/07 2007/08 2008/09
NIBL 33.51 27.60 29.60 26.57 19.95 15.85 25.51 5.94 23.28
NABIL 41.33 29.31 31.93 38.32 31.14 28.99 33.50 4.68 13.97
SBI 60.94 60.06 34.17 23.24 22.52 47.52 30.68 8.52 27.77
(Source: Annual Report of Bank)

72
From the table 4.7, it is found that, total investment to total deposit ratio all three banks are in
increasing and decreasing trend or in fluctuating trend during study period 2003/04 to 2008/09.
The total investment to total deposit ratio of NIBL has highest ratio of 33.51% in FY 2003/04 and
lowest ratio 15.85% in FY 2008/09. Similarly NABIL has highest and lowest ratio of 41.33% and
29.31% in FY 2003/04 and 2004/05. SBI has highest and lowest ratio of 60.94% and 22.52% in FY
2003/04 and 2007/08 respectively.
Loan and Advances to Total Working Fund Ratio
Loan and advances is the major components of the total working fund, which indicate the ability
of banks to utilize its deposits in the form of loan and advances to earn high return. It is an
appropriate level to generate profit. The ratio reflects the extent to which the commercial banks
are able to utilizing their assets loan and advances for the purpose of profit generation.
Total working fund is the total assets. It is composed up of current assets, fixed assets,
miscellaneous assets and investment, loan and advance and interest receivable.
The table 4.8 shows the loan and advance to total working fund ratio of NIBL, NABIL and SBI.
Table 4.8Loan and Advances to Working Fund Ratio
(In %)
Bank
Fiscal Year
Mean S.D C.V2003/04 2004/05 2005/06 2006/07 2007/08 2008/09
NIBL 53.79 62.22 59.90 62.65 69.45 68.37 62.73 5.25 8.37
NABIL 48.91 62.04 57.87 57.04 57.54 62.89 57.72 4.46 7.73
SBI 60.94 60.06 58.51 68.05 70.48 48.94 61.16 7.00 11.44
(Source: Annual Report of Bank)
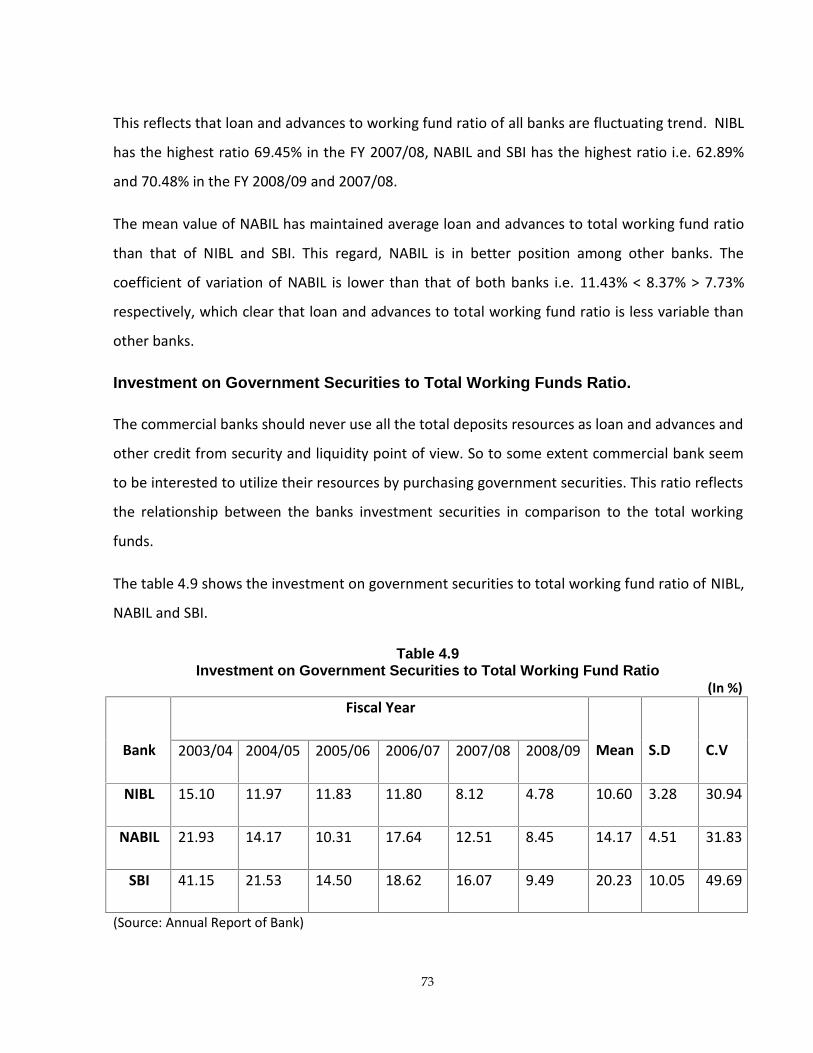
73
This reflects that loan and advances to working fund ratio of all banks are fluctuating trend. NIBL
has the highest ratio 69.45% in the FY 2007/08, NABIL and SBI has the highest ratio i.e. 62.89%
and 70.48% in the FY 2008/09 and 2007/08.
The mean value of NABIL has maintained average loan and advances to total working fund ratio
than that of NIBL and SBI. This regard, NABIL is in better position among other banks. The
coefficient of variation of NABIL is lower than that of both banks i.e. 11.43% < 8.37% > 7.73%
respectively, which clear that loan and advances to total working fund ratio is less variable than
other banks.
Investment on Government Securities to Total Working Funds Ratio.
The commercial banks should never use all the total deposits resources as loan and advances and
other credit from security and liquidity point of view. So to some extent commercial bank seem
to be interested to utilize their resources by purchasing government securities. This ratio reflects
the relationship between the banks investment securities in comparison to the total working
funds.
The table 4.9 shows the investment on government securities to total working fund ratio of NIBL,
NABIL and SBI.
Table 4.9Investment on Government Securities to Total Working Fund Ratio
(In %)
Bank
Fiscal Year
Mean S.D C.V2003/04 2004/05 2005/06 2006/07 2007/08 2008/09
NIBL 15.10 11.97 11.83 11.80 8.12 4.78 10.60 3.28 30.94
NABIL 21.93 14.17 10.31 17.64 12.51 8.45 14.17 4.51 31.83
SBI 41.15 21.53 14.50 18.62 16.07 9.49 20.23 10.05 49.69
(Source: Annual Report of Bank)

74
The comparison of mean ratio of NABIL with other two banks reveal that NABIL is successful; to
mobilize their working fund as investment in government securities. Similarly NABIL is also
variability between ratios during the study period is greater mean value than that of NIBL and
SBI.
The table 4.9 reflects that investment on government securities to total working fund ratio of all
three banks are in fluctuating trend. Likewise the coefficient of variation is higher than that of
other two banks i.e. 30.94% < 31.83% < 49.69%. This means NABIL has invest its more portion of
working funds on government securities as than other banks.
Investment on Shares and Debentures to Total Working Fund Ratio
This ratio shows the banks investment in share and debentures of subsidiary and other
companies. Now a day, commercial banks are interested to invest its fund not on government
securities. They are interested to invest in shares and debenture of different types of companies
and also in most of commercial banks in Nepal have purchased shares of regional development
banks and some of them have purchased the share of other companies too.
This ratio reflects the extent on which the banks are able to mobilize their total assets on
purchase of share and debenture of other companies to generate income and utilize their excess
fund. A higher ratio indicated more portion of investment on shares and debenture out of total
working fund. The table 4.10 shows the investment ob shares and debenture to total working
fund ratio of NIBL, NABIL and SBI from the FY 2003/04 to 2008/09.
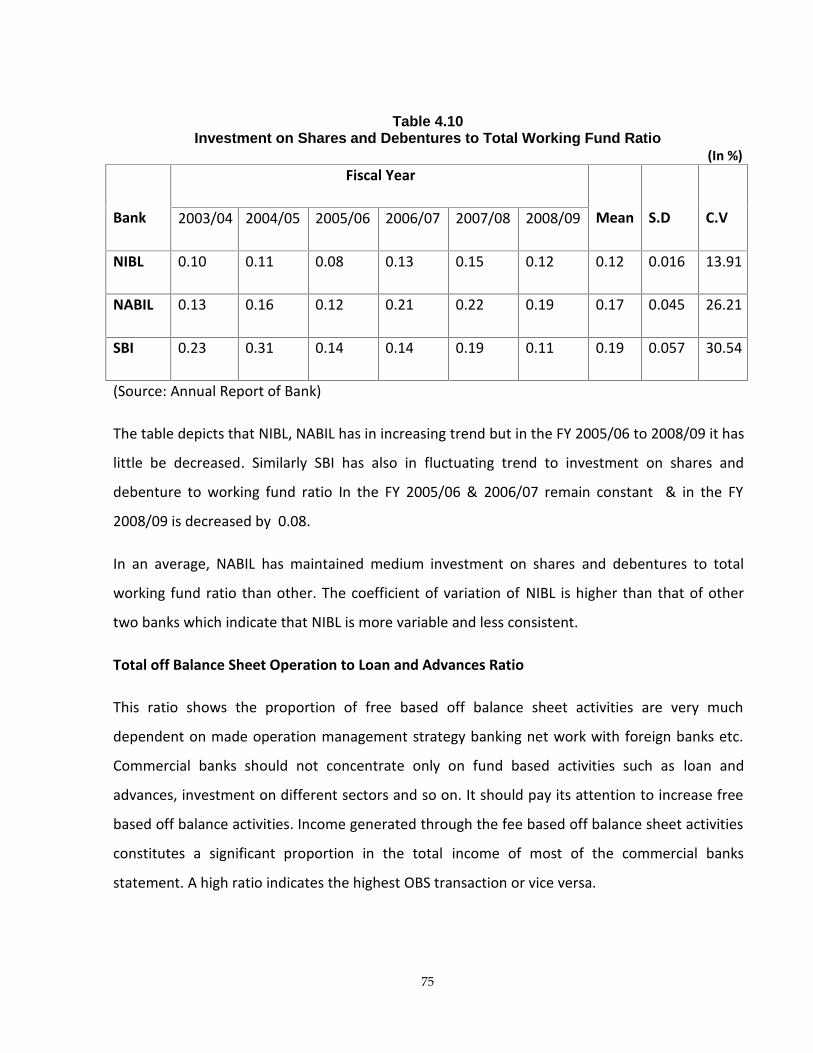
75
Table 4.10Investment on Shares and Debentures to Total Working Fund Ratio
(In %)
Bank
Fiscal Year
Mean S.D C.V2003/04 2004/05 2005/06 2006/07 2007/08 2008/09
NIBL 0.10 0.11 0.08 0.13 0.15 0.12 0.12 0.016 13.91
NABIL 0.13 0.16 0.12 0.21 0.22 0.19 0.17 0.045 26.21
SBI 0.23 0.31 0.14 0.14 0.19 0.11 0.19 0.057 30.54
(Source: Annual Report of Bank)
The table depicts that NIBL, NABIL has in increasing trend but in the FY 2005/06 to 2008/09 it has
little be decreased. Similarly SBI has also in fluctuating trend to investment on shares and
debenture to working fund ratio In the FY 2005/06 & 2006/07 remain constant & in the FY
2008/09 is decreased by 0.08.
In an average, NABIL has maintained medium investment on shares and debentures to total
working fund ratio than other. The coefficient of variation of NIBL is higher than that of other
two banks which indicate that NIBL is more variable and less consistent.
Total off Balance Sheet Operation to Loan and Advances Ratio
This ratio shows the proportion of free based off balance sheet activities are very much
dependent on made operation management strategy banking net work with foreign banks etc.
Commercial banks should not concentrate only on fund based activities such as loan and
advances, investment on different sectors and so on. It should pay its attention to increase free
based off balance activities. Income generated through the fee based off balance sheet activities
constitutes a significant proportion in the total income of most of the commercial banks
statement. A high ratio indicates the highest OBS transaction or vice versa.

76
Table 4.11Total OBS Operation to Loan and Advances Ratio
(In %)
Bank
Fiscal Year
Mean S.D C.V2003/04 2004/05 2005/06 2006/07 2007/08 2008/09
NIBL 46.78 39.46 47.57 48.40 46.87 44.89 45.66 2.99 6.55
NABIL 64.69 44.32 42.55 36.64 36.47 42.15 44.47 9.52 21.41
SBI 19.28 27.61 25.62 29.78 56.31 35.51 32.35 11.76 36.35
(Source: Annual Report of Bank)
The total OBS operation to loan and advances ratio of NABIL is in decreasing trend up to FY
2007/08 from FY2003/04 and increased in FY 2008/09 by 5.68% & reach to 42.15%. Similarly
NIBL and SBI have fluctuating trend. Both have maintained the maximum ratio of 48.40% and
56.31% in the FY 2006/07 and 2007/08 respectively.
The mean if SBI is lower than that of other banks i.e.32.35 < 44.47 < 45.66, which indicates that,
SBI has lowest OBS transaction or vice versa. Has highest mean ratio than NIBL and NABIL The
coefficient of variance of NIBL is lower than that of other banks, which indicated that it is giving
attention to increase free based off balance activities.
Loan Loss Relation
It is occurred when the debtors fail to pay their loan. Loss of the loan is not only the default of
debtors but it is because of the failure of recovery of loan by the bank. Negligence in its part
makes a negative impact on the earning and capital of a bank very badly. Greater loan loss
provision is made in income statement if high loss is expected. But this will lead to low profit and
possible losses and produces low increase or decrease in capital. The loan loss ratio shows how
efficiently the bank manages its loan and advances and makes effort for timely recovery of loan.
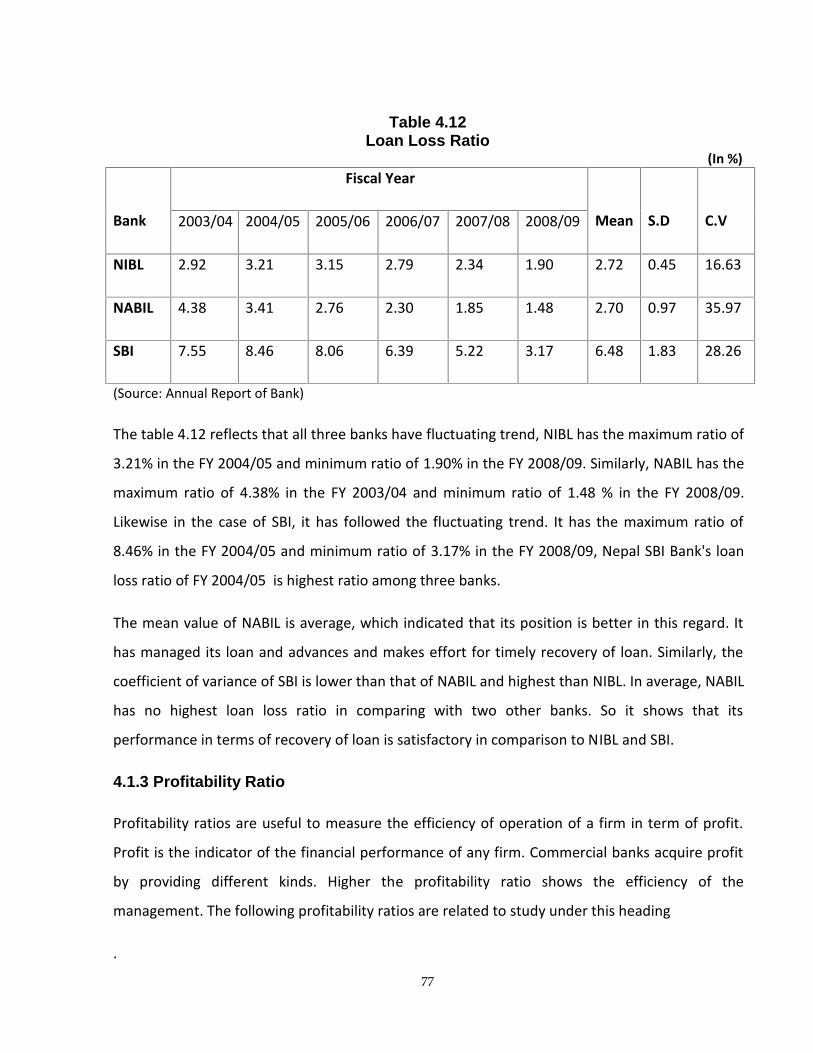
77
Table 4.12Loan Loss Ratio
(In %)
Bank
Fiscal Year
Mean S.D C.V2003/04 2004/05 2005/06 2006/07 2007/08 2008/09
NIBL 2.92 3.21 3.15 2.79 2.34 1.90 2.72 0.45 16.63
NABIL 4.38 3.41 2.76 2.30 1.85 1.48 2.70 0.97 35.97
SBI 7.55 8.46 8.06 6.39 5.22 3.17 6.48 1.83 28.26
(Source: Annual Report of Bank)
The table 4.12 reflects that all three banks have fluctuating trend, NIBL has the maximum ratio of
3.21% in the FY 2004/05 and minimum ratio of 1.90% in the FY 2008/09. Similarly, NABIL has the
maximum ratio of 4.38% in the FY 2003/04 and minimum ratio of 1.48 % in the FY 2008/09.
Likewise in the case of SBI, it has followed the fluctuating trend. It has the maximum ratio of
8.46% in the FY 2004/05 and minimum ratio of 3.17% in the FY 2008/09, Nepal SBI Bank's loan
loss ratio of FY 2004/05 is highest ratio among three banks.
The mean value of NABIL is average, which indicated that its position is better in this regard. It
has managed its loan and advances and makes effort for timely recovery of loan. Similarly, the
coefficient of variance of SBI is lower than that of NABIL and highest than NIBL. In average, NABIL
has no highest loan loss ratio in comparing with two other banks. So it shows that its
performance in terms of recovery of loan is satisfactory in comparison to NIBL and SBI.
4.1.3 Profitability Ratio
Profitability ratios are useful to measure the efficiency of operation of a firm in term of profit.
Profit is the indicator of the financial performance of any firm. Commercial banks acquire profit
by providing different kinds. Higher the profitability ratio shows the efficiency of the
management. The following profitability ratios are related to study under this heading
.

78
Return on Loan and Advances Ratio
Return on loan and advances ratio measures the earning capacity of banks on its total deposits
mobilized on loan and advances. Mostly loan and advances included loan, cash credit, and
overdraft, bills purchased and discounted. In other words return on loan and advances ratio
indicates how efficiently the banks have employed its resources in the firm of loan and advances.
Table 4.13Return on Loan and Advances Ratio
(In %)
Bank
Fiscal Year
Mean S.D C.V2003/04 2004/05 2005/06 2006/07 2007/08 2008/09
NIBL 2.14 2.29 2.74 2.90 2.58 2.49 2.52 0.256 10.15
NABIL 5.56 4.91 4.92 4.34 3.49 3.74 4.39 0.846 19.26
SBI 1.18 0.92 1.53 2.69 2.05 2.09 1.74 0.60 34.42
(Source: Annual Report of Bank)
The table 4.13 reveals that NIBL return on loan and advances ratio has increasing trend in the up
to FY 2006/07 than after fluctuating trend. NABIL has maintained decreasing trend where SBI
has also fluctuating trend.
The mean of NIBL is lesser than NABIL and higher than that of SBI i.e. 2.52 < 4.39 > 1.74
respectively. The standard deviation of NIBL is lesser than both banks. Similarly the coefficient of
variation of NIBL is less than other two banks i.e. 10.15% < 19.26% < 34.42%. NABIL has
maintained average C.V. and SBI are in highest C.V value. Thus it can be concluded that NIBL is in
average position in earning loan and advances in comparison to NABIL and SBI.
Return on Total Working Fund Ratio
It also known as return on asset. This ratio measures the profit earning capacity by mobilizing
available resources (total assets). The bank has to earn satisfactory return on assets or working
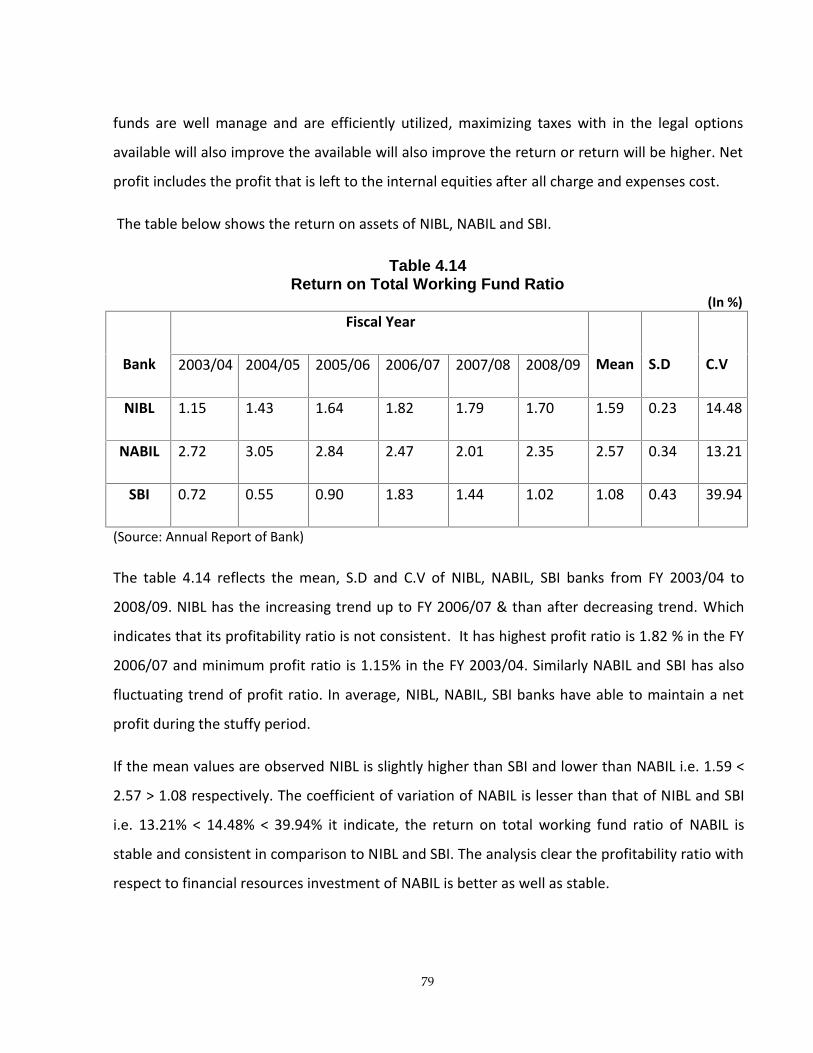
79
funds are well manage and are efficiently utilized, maximizing taxes with in the legal options
available will also improve the available will also improve the return or return will be higher. Net
profit includes the profit that is left to the internal equities after all charge and expenses cost.
The table below shows the return on assets of NIBL, NABIL and SBI.
Table 4.14Return on Total Working Fund Ratio
(In %)
Bank
Fiscal Year
Mean S.D C.V2003/04 2004/05 2005/06 2006/07 2007/08 2008/09
NIBL 1.15 1.43 1.64 1.82 1.79 1.70 1.59 0.23 14.48
NABIL 2.72 3.05 2.84 2.47 2.01 2.35 2.57 0.34 13.21
SBI 0.72 0.55 0.90 1.83 1.44 1.02 1.08 0.43 39.94
(Source: Annual Report of Bank)
The table 4.14 reflects the mean, S.D and C.V of NIBL, NABIL, SBI banks from FY 2003/04 to
2008/09. NIBL has the increasing trend up to FY 2006/07 & than after decreasing trend. Which
indicates that its profitability ratio is not consistent. It has highest profit ratio is 1.82 % in the FY
2006/07 and minimum profit ratio is 1.15% in the FY 2003/04. Similarly NABIL and SBI has also
fluctuating trend of profit ratio. In average, NIBL, NABIL, SBI banks have able to maintain a net
profit during the stuffy period.
If the mean values are observed NIBL is slightly higher than SBI and lower than NABIL i.e. 1.59 <
2.57 > 1.08 respectively. The coefficient of variation of NABIL is lesser than that of NIBL and SBI
i.e. 13.21% < 14.48% < 39.94% it indicate, the return on total working fund ratio of NABIL is
stable and consistent in comparison to NIBL and SBI. The analysis clear the profitability ratio with
respect to financial resources investment of NABIL is better as well as stable.
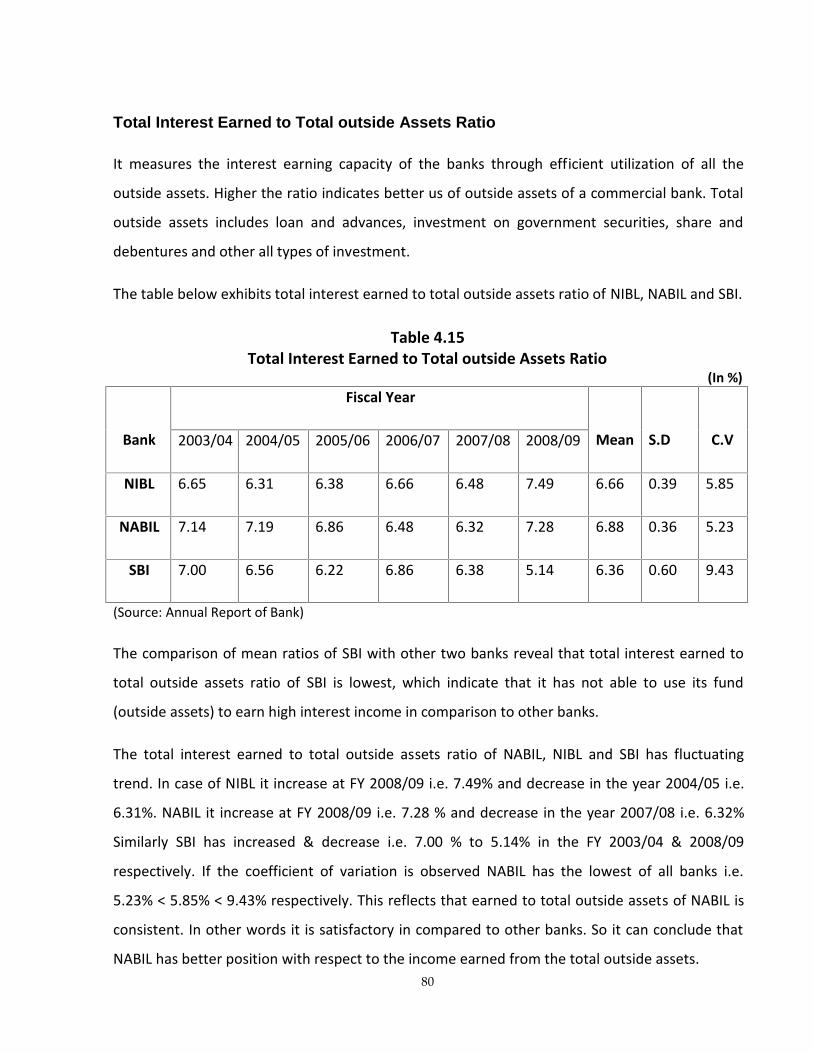
80
Total Interest Earned to Total outside Assets Ratio
It measures the interest earning capacity of the banks through efficient utilization of all the
outside assets. Higher the ratio indicates better us of outside assets of a commercial bank. Total
outside assets includes loan and advances, investment on government securities, share and
debentures and other all types of investment.
The table below exhibits total interest earned to total outside assets ratio of NIBL, NABIL and SBI.
Table 4.15Total Interest Earned to Total outside Assets Ratio
(In %)
Bank
Fiscal Year
Mean S.D C.V2003/04 2004/05 2005/06 2006/07 2007/08 2008/09
NIBL 6.65 6.31 6.38 6.66 6.48 7.49 6.66 0.39 5.85
NABIL 7.14 7.19 6.86 6.48 6.32 7.28 6.88 0.36 5.23
SBI 7.00 6.56 6.22 6.86 6.38 5.14 6.36 0.60 9.43
(Source: Annual Report of Bank)
The comparison of mean ratios of SBI with other two banks reveal that total interest earned to
total outside assets ratio of SBI is lowest, which indicate that it has not able to use its fund
(outside assets) to earn high interest income in comparison to other banks.
The total interest earned to total outside assets ratio of NABIL, NIBL and SBI has fluctuating
trend. In case of NIBL it increase at FY 2008/09 i.e. 7.49% and decrease in the year 2004/05 i.e.
6.31%. NABIL it increase at FY 2008/09 i.e. 7.28 % and decrease in the year 2007/08 i.e. 6.32%
Similarly SBI has increased & decrease i.e. 7.00 % to 5.14% in the FY 2003/04 & 2008/09
respectively. If the coefficient of variation is observed NABIL has the lowest of all banks i.e.
5.23% < 5.85% < 9.43% respectively. This reflects that earned to total outside assets of NABIL is
consistent. In other words it is satisfactory in compared to other banks. So it can conclude that
NABIL has better position with respect to the income earned from the total outside assets.

81
Total Interest Earned to Total Working Fund Ratio
This ratio is calculated to find out the percentages of interest earned to total assets. It reflects
the extent to which the banks are success in mobilizing their to total assets to gain higher income
as interest. Higher ratio indicated higher earning power of the banks of its total working fund.
The table below shows the interest earned to total working fund ratio of NIBL, NABIL and SBI.
Table 4.16Total Interest Earned to Total Working Fund Ratio
(In %)
Bank
Fiscal Year
Mean S.D C.V2003/04 2004/05 2005/06 2006/07 2007/08 2008/09
NIBL 5.52 5.45 5.50 5.74 5.64 6.16 5.67 0.24 4.23
NABIL 5.98 6.26 5.87 5.83 5.33 6.38 5.94 0.34 5.72
SBI 5.85 5.59 5.44 5.98 5.65 4.72 5.54 0.40 7.22
(Source: Annual Report of Bank)
The table 4.16 reveals that the ratio of NIBL is in increasing trend up to FY 2006/07 & than after
decreased at FY 2007/08 & also increase at FY 2008/09. Where the ratio of NABIL is fluctuating
trend at the first two years increases and third year to fifth year decreasing trend & at Last FY
2008/09 at increased. The SBI has maximum ratio is 5.98% in the FY 2006/07 and minimum
ratio is 4.72% in the FY 2008/09. On the other hand the mean value of NIBL has average of other
two banks. It has the mean of 5.67 which is higher than SBI i.e. 5.54 and less than NABIL i.e. 5.94.
Similarly the coefficient of variation of NABIL is 5.72% which is also more than NIBL and less than
SBI.
After analysis it can be concluded that total interest earned to total working fund of NIBL is
satisfactory in compared to other banks. It indicates the total interest earned to total working
fund ratio is stable. SBI has higher coefficient of variation among other two banks. That means it
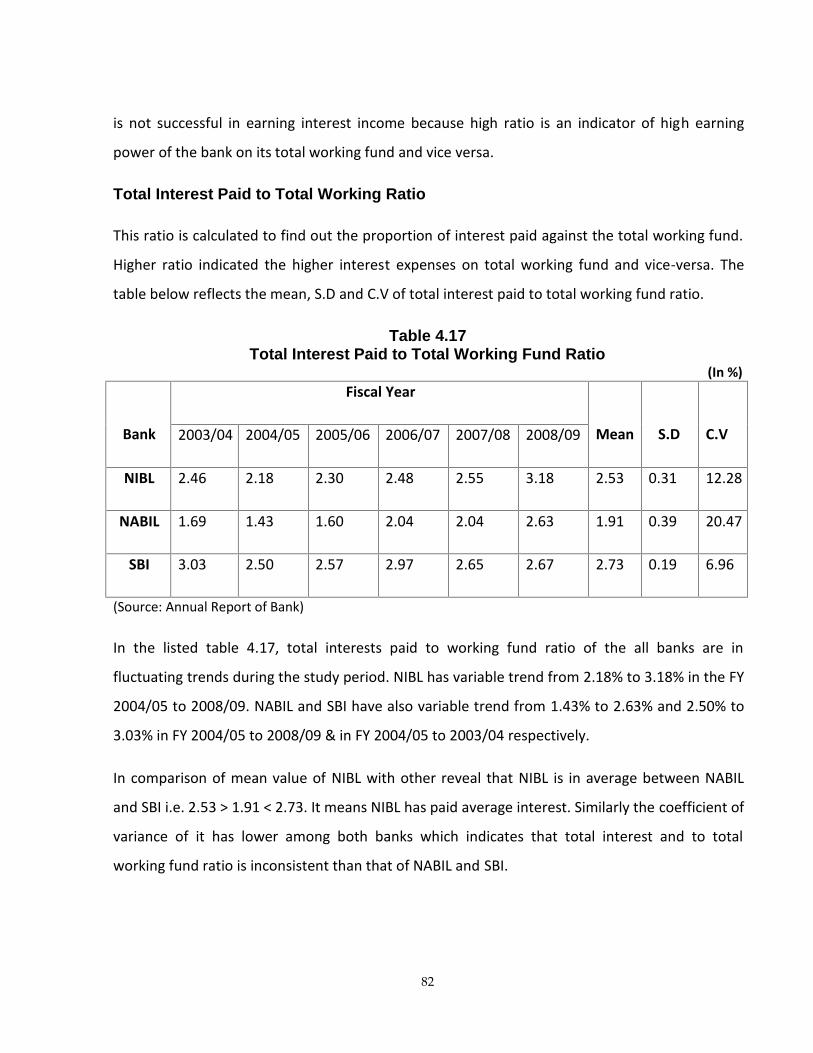
82
is not successful in earning interest income because high ratio is an indicator of high earning
power of the bank on its total working fund and vice versa.
Total Interest Paid to Total Working Ratio
This ratio is calculated to find out the proportion of interest paid against the total working fund.
Higher ratio indicated the higher interest expenses on total working fund and vice-versa. The
table below reflects the mean, S.D and C.V of total interest paid to total working fund ratio.
Table 4.17Total Interest Paid to Total Working Fund Ratio
(In %)
Bank
Fiscal Year
Mean S.D C.V2003/04 2004/05 2005/06 2006/07 2007/08 2008/09
NIBL 2.46 2.18 2.30 2.48 2.55 3.18 2.53 0.31 12.28
NABIL 1.69 1.43 1.60 2.04 2.04 2.63 1.91 0.39 20.47
SBI 3.03 2.50 2.57 2.97 2.65 2.67 2.73 0.19 6.96
(Source: Annual Report of Bank)
In the listed table 4.17, total interests paid to working fund ratio of the all banks are in
fluctuating trends during the study period. NIBL has variable trend from 2.18% to 3.18% in the FY
2004/05 to 2008/09. NABIL and SBI have also variable trend from 1.43% to 2.63% and 2.50% to
3.03% in FY 2004/05 to 2008/09 & in FY 2004/05 to 2003/04 respectively.
In comparison of mean value of NIBL with other reveal that NIBL is in average between NABIL
and SBI i.e. 2.53 > 1.91 < 2.73. It means NIBL has paid average interest. Similarly the coefficient of
variance of it has lower among both banks which indicates that total interest and to total
working fund ratio is inconsistent than that of NABIL and SBI.

83
After analysis it can be concluded that NIBL is in better position from payment of interest point
of view. It seems to be successful to collect its working fund from less expensive sources in
comparison to others.
4.1.5 Risk Ratio
Risk taking is the prime business of banks investment management which increases effectiveness
and profitability of the bank. Bank has to take risk to get return on investment. Risk taken is
compensated by the increase in profit. So a bank has to take higher risk if it expects higher return
on its investment.
Credit Risk Ratio
Bank utilized its collected funds in providing credit to different sectors while making investment.
It is essential for a bank to examine the credit risk involved in the project. This ratio shows the
proportion of non performing assets in total loan and advances of the bank. Due to the
unavailability of the relevant data the ratio is measure with the help of loan and advances to
total assets.
Table 4.18Credit Risk Ratio
(In %)
Bank
Fiscal Year
Mean S.D C.V2003/04 2004/05 2005/06 2006/07 2007/08 2008/09
NIBL 53.79 62.22 59.90 62.65 69.45 68.37 62.73 5.25 8.37
NABIL 48.91 62.04 57.87 57.04 57.54 62.89 57.72 4.54 7.87
SBI 60.94 60.06 58.51 68.05 70.48 48.94 61.16 6.97 11.40
(Source: Annual Report of Bank)
The table 4.18 shows the percentage of credit risk ratio of NIBL, NABIL and SBI. The credit risk
ratio of NIBL is in fluctuating trend during the study period i.e. it has maintained maximum ratio

84
of 69.45% in the FY 2007/08 and it has minimum ratio of 53.79% in the year 2003/04. Similarly
NABIL credit risk ratio is increasing trend up to first two Years & than after fluctuating trend. It
has maintained maximum ratio of 62.89% in the FY 2008/09 & it has minimum ratio of 48.91% at
FY 2003/04. Similarly SBI credit risk ratio is decreasing trend up to FY 2005/06 and then after
increase above two years & also decreased at FY 2008/09. It has maintained maximum ratio of
70.48% in the FY 2007/08 & it has minimum ratio of 58.51% at FY 2005/06.
The mean of SBI is between NABIL and NIBL which mean SBI has average credit in comparison to
both banks. The coefficient of variance of NIBL is 8.37% NABIL has 7.87% and SBI has 11.40%.
Among three banks NABIL has less C.V, it indicates that its credit policy is consistent than other
banks.
Liquidity Risk Ratio
The liquidity risk of the bank defines it liquidity need for deposit. A higher liquidity indicates less
risk and less profitable bank and vice-versa. The ratio of cash and bank balance to total deposits
is the indicator of the bank liquidity needed. The cash and bank balance are the most liquid
assets and they are considered as bank liquidity sources and deposits as the liquidity needs.
Table 4.19Liquidity Risk Ratio
(In %)
Bank
Fiscal Year
Mean S.D C.V2003/04 2004/05 2005/06 2006/07 2007/08 2008/09
NIBL 10.65 9.40 12.34 9.97 10.90 16.96 11.70 2.52 21.53
NABIL 6.87 3.83 3.26 6.00 8.37 9.03 6.23 2.14 34.37
SBI 12.01 8.36 10.16 9.81 9.79 6.81 9.49 1.60 16.86
(Source: Annual Report of Bank)
In the table shows the percentage of liquidity risk ratio of NIBL, NABIL and SBI. This table reflects
the liquidity risk ratio of NIBL is fluctuating trend i.e. it has maintained a maximum ratio of

85
16.96% in the FY 2008/09 and the minimum ratio of 9.40% in the FY 2004/05. Similarly NABIL
liquidity risk ratio is in decreasing trend up to 2005/06 & then after increasing trend up to
FY2008/09. Similarly SBI liquidity risk ratio is in fluctuating trend. It has maintained a maximum
ratio of 12.01% in the FY 2003/04 and the minimum ratio of 6.81% in the FY 2008/09.
While comparing the mean of three banks, NABIL is between NIBL and SBI i.e. 11.70 > 6.23 < 9.49
which indicates that NIBL liquidity risk is average in compare to other banks. The coefficients of
variance of three banks are 21.53%, 34.37%, 16.86% respectively. In comparison them, SBI has
less C.V which indicates that liquidity risk ratio of it’s in consistent. The C.V ratio of NABIL is
slightly lower than that of SBI i.e. 16.86% < 21.53%.
Capital Risk Ratio
The capital risk ratio indicates how much assets value may decline by bank before the position
deposition and other creditors is jeopardized. So a bank needs to maintain adequate capital in
relation to the nature and condition of its assets, its deposits liabilities and other corporate
responsibilities. This ratio measures ability of bank to attract deposits and inter-bank funds. It
also determines the level of profit. A bank can earn if a bank choose to take high capital risk.
Table 4.20Capital Risk Ratio
(In %)
Bank
Fiscal Year
Mean S.D C.V2003/04 2004/05 2005/06 2006/07 2007/08 2008/09
NIBL 7.41 8.66 8.09 5.94 9.44 10.70 8.37 1.50 17.91
NABIL 12.48 11.68 11.04 10.73 9.02 9.63 10.76 1.17 10.87
SBI 9.56 8.76 10.73 10.70 9.71 10.77 10.04 0.76 7.57
(Source: Annual Report of Bank)
86
From the table 4.20, it is clearly seen that the percentage of capital risk ratio of NIBL has
maximum and minimum ratio 10.70% to 5.94% in the FY 2008/09 to 2006/07 respectively during
the study period. NABIL has decreasing trend till FY 2007/08 &increased by 0.61% in FY 2008/09.
Similarly SBI have followed the fluctuating trend. They have maximum ratio of 10.77% and 8.76%
in the FY 2008/09 and 2004/05 respectively.
The mean value of SBI has average capital risk ratio in comparison with other two banks. The
coefficient of variance of a NABIL is 10.87% that is higher than that of SBI’s C.V and lesser than
NABIL i.e. 7.57% < 10.87% > 17.91% respectively. Among three banks SBI has less C.V.
Thus it can be concluded that NABIL is stable and heterogeneous than NIBL but less stable and
less heterogeneous in comparison to the SBI because it has maintained less C.V among three
banks.
4.1.5 Growth Ratio
It represents how well the commercial banks those growth ratios are maintaining their economic
and financial position. Here those growth ratios are analyzed and interpret ate, which are related
to the fund mobilization and investment management of a bank. In this topic, there are four
types of growth ratio and under this section growth ratio of total deposit, total investment, loan
and advances and net profit are calculated.
Growth Ratio of Total Deposit
The comparative table 4.21 shows that the growth ratio of NIBL deposit is higher than that of
NABIL & SBI. NIBL has maintained ratio of 32.30% where as NABIL and SBI 21.47% and 31.18%
respectively. This means the performance of NIBL to collect greater deposit compared to other
banks. NABIL and SBI are improving year by year. Among three banks NABIL has lowest growth
ratio i.e. 21.47%.

87
Table 4.21Growth Ratio of Total Deposit
(In Million)
Bank
Fiscal Year Growth
rate (%)2003/04 2004/05 2005/06 2006/07 2007/08 2008/09
NIBL 11524.68 14254.58 18927.31 24488.86 34451.73 46698.10 32.30
NABIL 14119.03 14586.67 19347.40 23342.29 31915.05 37348.26 21.47
SBI 7198.32 8654.77 11002.04 11445.29 13715.40 27957.22 31.18
(Source: Annual Report of Bank)
Figure No: 4.1
Growth Ratio of total Deposit
The comparative table 4.21 & Figure no 4.1 shows that the growth ratio of NIBL deposit is higher
than that of NABIL & SBI. NIBL has maintained growth ratio of 32.30% where as SBI and NABIL
31.18% and 21.47% respectively. This means the performance of NIBL to collect greater deposit
compared to other banks. SBI and NABIL are improving year by year. Among three banks NABIL
has lowest growth ratio i.e.21.47%. In FY 2008/09 NIBL, NABIL & SBI has collect 46698.10 Million,
37348.26 Million & 27957.22 Million deposit respectively.

88
Growth Ratio of Loan and Advances
The comparative table 4.22 shows that the growth ratio of NIBL loan and advances is higher than
that of other banks. NIBL has able to maintain of 38.43%, where as NABIL and SBI able to have
maintained 27.50% and 24.09% respectively. The performance of NIBL to grant loan and
advances is better in comparison to other banks i.e. NABIL and SBI. The highest growth ratio is
38.43% and lowest growth ratio is 24.09%. The above table clearly has shown that. NIBL in
comparison to other banks is better year by year.
Table 4.22Growth Ratio of Loan and Advances
(In Millions)
Bank
Fiscal Year Growth
Rate (%)2003/04 2004/05 2005/06 2006/07 2007/08 2008/09
NIBL 7130.13 10126.06 12776.21 17286.43 26996.65 36241.21 38.43
NABIL 8189.99 10586.17 12922.54 15545.78 21365.06 27589.93 27.50
SBI 5143.66 6213.88 7626.74 9460.45 12113.70 15131.75 24.09
(Source: Annual Report of Bank)Figure No: 4.2
Growth Ratio of Loans & Advance

89
The comparative table 4.22 & Figure no 4.2 shows that the growth ratio of NIBL loan and
advances is higher than that of other banks. NIBL has able to maintain of 38.43%, whereas NABIL
and SBI able to have maintained 27.50% and 24.09% respectively. The performance of NIBL to
grant loan and advances is better in comparison to other banks i.e. NABIL and SBI. The highest
growth ratio is 38.43% and lowest growth ratio is 24.09%. The above table clearly has shown
that NIBL in comparison to other banks is better year by year and NABIL also maintained the
average performance to grant loan and advance in the study period.
Growth Ratio of Total Investment
The comparative table 4.23 show that the growth ratio of NIBL total investment is lower than SBI
and higher than NABIL i.e. 13.89 > 13.15 < 47.43%. The total investment of NIBL has average
position in comparison to the NABIL and SBI. SBI is higher growth rate due to vast increased in FY
2008/09 by 10197.30 than last FY 2007/08.
Table 4.23Growth Ratio of Total Investment
(In Millions)
Bank
Fiscal Year Growth
Rate(%)2003/04 2004/05 2005/06 2006/07 2007/08 2008/09
NIBL 3862.48 3934.19 5602.87 6505.68 6874.03 7399.81 13.89
NABIL 5835.95 4275.52 6178.53 8945.31 9939.78 10826.38 13.15
SBI 1907.52 2607.68 3758.98 2659.45 3088.89 13286.19 47.43
(Source: Annual Report of Bank)

90
Figure No: 4.3Growth Ratio of Total Investment
The comparative table 4.23 & Figure no 4.3 shows that the growth ratio of SBI Investment is
higher than that of other banks. SBI has able to maintain of 47.43%, whereas NIBL and NABIL
able to have maintained 13.89% and 13.15% respectively. SBI Bank has highest growth ratio due
to grant huge investment in FY 2008/09 otherwise NIBL & NABIL is better performance of year
by year granting Investment.
Growth Ratio of Total Net Profit
The comparative table 4.24 shows that the growth ratio of NIBL total net profit is higher than
two banks. Net profit of NABIL is poor in comparison with NIBL and SBI. NIBL has able to maintain
the growth ratio in average position. So it clear that NIBL has high growth rate in comparison to
other bank.
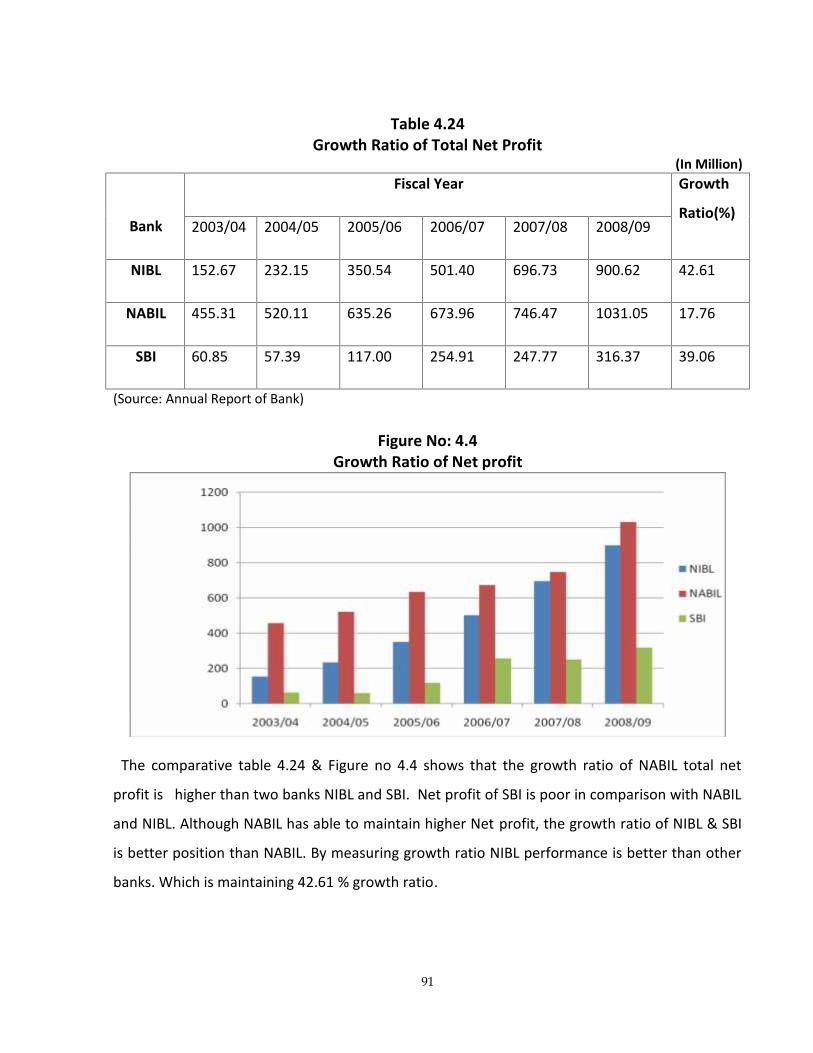
91
Table 4.24Growth Ratio of Total Net Profit
(In Million)
Bank
Fiscal Year Growth
Ratio(%)2003/04 2004/05 2005/06 2006/07 2007/08 2008/09
NIBL 152.67 232.15 350.54 501.40 696.73 900.62 42.61
NABIL 455.31 520.11 635.26 673.96 746.47 1031.05 17.76
SBI 60.85 57.39 117.00 254.91 247.77 316.37 39.06
(Source: Annual Report of Bank)
Figure No: 4.4Growth Ratio of Net profit
The comparative table 4.24 & Figure no 4.4 shows that the growth ratio of NABIL total net
profit is higher than two banks NIBL and SBI. Net profit of SBI is poor in comparison with NABIL
and NIBL. Although NABIL has able to maintain higher Net profit, the growth ratio of NIBL & SBI
is better position than NABIL. By measuring growth ratio NIBL performance is better than other
banks. Which is maintaining 42.61 % growth ratio.

92
From the above analysis of all tables, it can be concluded that NIBL performance regarding the
collection of deposit, granting loan and advances on total investment and net profit is
comparatively better.
4.2 Statistical Tools
4.2.1 Trend Analysis of Total Deposit
Under this topic an efforts has been made to calculate the trend values of deposits of NIBL,
NABIL and SBI for five years from mid July 2003/04 to 2008/09 and forecast for next five years
from the mid July 2008/09 to 2013/14.
Table 4.25Trend Value of Total Deposit of NIBL, NABIL and SBI
(Rs. In Millions)Fiscal Year Trend value of NIBL Trend value of NABIL Trend value of SBI
2004 4406.73 6980.75 2834.49
2005 14732.14 15211.94 8081.66
2006 25057.54 23443.12 13328.84
2007 35382.95 31674.30 18576.02
2008 45708.35 39905.48 23823.19
2009 56033.76 48136.66 29070.37
2010 66359.16 56367.48 34317.54
2011 76684.56 64599.02 39564.72
2012 87009.97 72830.20 44811.89
2013 97335.37 81061.38 50059.07
2014 107660.78 89292.57 55306.25
(Source: Appendix 1)

93
The table 4.25 shows the trend value of total deposit from 2008/09 to 2013/14 of three banks.
The total deposits of NIBL, NABIL and SBI have in the increasing trend. If all other things remain
the same the total deposits of the NIBL will be highest deposit among the three banks, under the
study period. Same as the total deposit of the SBI will be 55306.25 million in the mid July 2014.
The total deposit of NABIL will be 89292.57 million in the mid July 2014. The total deposit of NIBL
will be 107660.78 Million.
By analyzing the above trend value, it is found that the total deposit position collection of NIBL is
better in comparison to SBI & NABIL. The deposit position NABIL, NIBL and SBI are increasing in
the same proportion
Figure 4.5Trend Value of Total Deposit of NIBL, NABIL and SBI

94
The comparative Figure no 4.5 shows that the trend value of Deposit. All three banks have
increasing trend, if all other things remain the same the total deposits of the NIBL will be highest
deposit among the three banks, under the study period.
4.2.2 Trend Analysis of Loan and Advances
Here the trend values of loan and advances of NIBL, NABIL and SBI have been calculated for five
years from mid July 2003/04 to 2008/09. The forecast for next five years up to mid July 2014
have been done.
The table 4.26 reveals that the trend value of loan and advances of the three banks have been in
increasing trend. If other things remain same, total loan and advances of NABIL will be 64066.74
million in FY 2013/014. Similarly the total loan and advances of SBI will be 35631.97 million. Total
loan and advances of NIBL will be 83949.80, which is the highest among the study period.
Table 4.26Trend Values of Loan and Advances of NIBL, NABIL and SBI
(Rs. In Millions)Fiscal Year Trend value of NIBL Trend value of NABIL Trend value of SBI
2004 2045.37 4024.87 2694.13
2005 10235.74 10029.06 5987.91
2006 18426.12 16033.25 9281.70
2007 26616.49 22037.43 12575.48
2008 34806.86 28041.62 15869.27
2009 42997.23 34045.80 19163.05
2010 51187.60 40049.99 22456.83
2011 59377.97 46054.18 25750.62
2012 67568.34 52058.36 29044.40

95
2013 75758.71 58062.55 32338.19
2014 83949.08 64066.74 35631.97
(Source: Appendix 2)
From the above analysis it is found the loan and advances position of NABIL is comparatively
lower than NIBL and is better in comparison to SBI i.e. 83948.08 > 64066.74 < 35631.97 million
respectively. NABIL and SBI may use the skill for the other option of secured loans that is quite
appreciable. NIBL is tilted towards the secured loan because of less risk due to the sufficient
collateral of its clients.
Figure 4.6Trend Values of Loan and Advances of NIBL, NABIL and
SBI

96
The comparative Figure no 4.6 shows that the trend value of Loans & Advance. All three banks
have increasing trend, if all other things remain the same the total lending of the NIBL & SBI will
be highest Lowest respectively among the three banks, under the study period.
4.2.3 Trend Analysis of Total Investment
In this topic, an effort has been made to calculate the trend values of total investment from the
mid July 2003/04 to 2008/09 have been calculated and forecasted from mid July 2009 to mid July
2014. The table 4.27 shows the trend values of total investment from mid July 2003/04 to
2013/14 of the NIBL, NABIL and SBI.
Table 4.27Trend Values of Total Investment of NIBL, NABIL and SBI
(Rs. In Million)Fiscal Year Trend value of NIBL Trend value of NABIL Trend value of SBI
2004 2455.03 2892.53 101.65
2005 4075.77 5279.72 2326.55
2006 5696.51 7666.91 4551.45
2007 7317.25 10054.10 6776.35
2008 8937.99 12441.29 9001.25
2009 10558.72 14828.48 11226.15
2010 12179.46 17215.67 13451.05
2011 13800.20 19602.86 15675.95
2012 15420.94 21990.05 17900.85
2013 17041.68 24377.23 20125.74
2014 18662.41 26764.42 22350.64
(Source: Appendix 3)

97
Total investments of NIBL, NABIL and SBI have the increasing trend value. The total investment of
NIBL will be 18662.41 million in the mid July 2014, which lowest in comparison with SBI and
NABIL i.e. 18662.41 million < 22350.64 million < 26764.42 million.. The total investment trend of
NABIL is satisfactory among the two banks. From the above analysis it can be concluded that
NIBL has not maintained well investment but in case of SBI and NABIL it is predicted to be good
total investment trend up to the 2013/14 years.
Figure 4.7Trend Value of Investment of NIBL, NABIL and SBI
The comparative Figure no 4.7 shows that the trend value of Investment. All three banks have
increasing trend but NIBL investing pattern is decreasing growth rate .NABIL has invest highest
investment in this study period.

98
4.2.4 Trend Analysis of Net Profit
Under this topic, an effort had been made to analyze net profit of NIBL, NABIL and SBI from the
mid July 2003/04 to 2008/09 and forecast from the mid July 2008/09 to 2013/14. The table 4.28
shows the trend values of net profit for eleven years from mid July 2003/04 to 2013/14 of NIBL,
NABIL and SBI.
Table 4.28Trend Value Net Profit of NIBL, NABIL and SBI
(Rs. In Million)Fiscal Year Trend value of NIBL Trend value of NABIL Trend value of SBI
2004 45.06 273.94 15.67
2005 258.71 475.48 95.69
2006 472.35 677.03 175.72
2007 686.00 878.57 255.74
2008 899.64 1080.11 335.76
2009 1113.28 1281.66 415.79
2010 1326.93 1483.20 495.81
2011 1540.57 1684.74 575.84
2012 1754.21 1886.29 655.86
2013 1967.86 2087.83 735.89
2014 2181.50 2289.37 815.91
(Source: Appendix 4)
The above table 4.28 shows the net profit all three banks have the increasing trend value. The
Net profit of NIBL will be 2181.50 million in the mid July 2014. Similarly net profit of NABIL will be

99
2289.37 million, which is the highest amount among the three banks. Net profit of SBI will be
815.91 million, which is lowest value among three banks during the study period. From this trend
analysis it can be said that the net profit of NIBL in the medium among the banks which shows
i.e. 2289.37 > 2181.50 > 815.91 million in the year 2014. The above calculated trend values of all
three banks are fitted in the trend line.
Figure 4.8Trend Value of Net Profit of NIBL, NABIL and SBI
The comparative Figure no 4.8 shows that the trend value of Net profit. All three banks have
increasing trend, if all other things remain the same the total Net of the NABIL will be highest
profit among the three banks, NIBL Growth rate will be higher under the study period.

100
4.2.5 Coefficient of Correlation Analysis
In this heading Karl Pearson coefficient of correlation (Direct Method) is used to find out the
relationship between deposit and loan and advances. Deposit and total investment and outside
assets and net profit and so on.
4.2.6 Coefficient of Correlation Between Outside Asset and Net Profit
It measures the degree of relationship between two variables. Here outside assets (x) are
independent variables and net profit is dependent variable (y). The objective of computing
coefficient of correlation between outside asset and net profit is to find out whether net profit is
significantly correlated with respect to total assets or not.
The table 4.29 shows the value of ‘r’, r2, P.Er, 6P.Er between outside asset and net profit of NIBL,
NABIL and SBI.
Table 4.29Coefficient of Correlation between outside Asset and Net Profit
Banks Evaluation criterions
R r2 P.Er 6P.Er
NIBL 0.99726 0.99453 0.001504 0.0090252
NABIL 0.96425 0.929785 0.019334 0.116007
SBI 0.82669 0.68342 0.087174 0.523047
(Source: Appendix 5,6 &7)
The table 4.29 shows the value of r, r2, P.Er, 6P.Er between deposit and loan and advances of
NIBL with comparison to NABIL and SBI for the study period 2003/04 to 2008/09. From this table,
it has been found that the coefficient of correlation between total outside i.e. independent
variable and net profit dependent variable is 0.99726 in case of NIBL. It shows positive
relationship between these variables. By considering the value of coefficient of determination

101
(r2), is 0.99453 indicated that 99.45% of the variation in the dependent variable has been
explained by the independent variable. Similarly considering the value of r is greater than the
value of 6P.Er, which reveals NIBL is capable to earn net profit by mobilizing in total outside
assets.
Likewise, the coefficient of correlation between total outside assets and net profit in the case of
NABIL and SBI are 0.96425 and 0.82669. Again when we consider the value of coefficient
determination (r2) i.e. 0.929785 and 0.68342, it means 92.97% and 68.34% respectively in the
dependent variable has been explained by the independent variable.
On the basis of comparison between the value of ‘r’ and 6P.Er there is significant correlation
between two variables because the value of ‘r’ i.e. 0.96425 and 0.82669 is greater than that of
the value 6P.Er i.e. 0.116007 and 0.523047. The above analysis clears that; the value of ‘r’ in case
of NIBL, NABIL & SBI all are significant correlation between mobilizations of funds return.
4.2.7 Coefficient of Correlation between Deposit and Net Profit
The coefficient of correlation between deposit and net profit measures the degree of
relationship between these two variables. Here deposit (X) is independent variable and net profit
(Y) is dependent variable. The objectives of computing between these two variables are to justify
whether net profit is significantly correlated with deposits or not. The following table 4.32 shows
the value of ‘r’, r2, P.Er, 6P.Er between deposit and net profit of NIBL, NABIL and SBI during the
stuffy period.

102
Table 4.30Coefficient of Correlation between Deposit and Net Profit
Banks Evaluation criterions
R r2 P.Er 6P.Er
NIBL 0.99446 0.988963 0.003039 0.018234
NABIL 0.95284 0.907909 0.025358 0.152149
SBI 0.79636 0.634204 0.100727 0.604360
(Source: Appendix 8, 9 &10)
From this table 4.30, it has been found that the coefficient of correlation between total deposits
and net profit in the case of NIBL is 0.99446, which indicated the position relationship between
these variables. The coefficient of determination (r2) is 0.988963 which indicates 98.89% of the
variation of the dependent variable has been explained by the independent variable. Similarly,
the value r is greater than the value of 6P.Er, i.e. 0.99446 > 0.018234, which states that there
exists a significant relationship between deposits and net profit.
The coefficient of correlation between deposits and net profit in case of NABIL 0.95284 which
indicated a positive relationship between deposit and net profit. The value of (r2) is 0.907909
indicates that 90.79% of the variation of the dependent variable has been explained by the
independent variable. The value of ‘r’ is greater than that of the value of 6P.Er. This states that
there is significant relationship between these variables.
Similarly the coefficient of correlation between these variables in case of SBI is 0.79636, which
indicated positive relation. The value of 6P.Er are lesser than the value of r i.e. 0.60436 < 0.79636
that means there is significant correlation relationship between two variation.

103
The above analysis clear that, the value of r in case of NIBL is significant relationship between
deposit and net profit. NABIL also shows the positive relationship. The value of (r2) in case of
NABIL shows lower percentages of dependency than NIBL and higher percentage of dependency
than SBI i.e. 0.98896 > 0.907909 > 0.634204. The increase in net profit in case of NIBL is due to
effective mobilization of deposits and other factor have a less or role to play in increase in net
profit. NABIL & SBI has not been more successful as NIBL in mobilization of its deposits.
1.2.8 Coefficient of Correlation between Deposit and Interest Earned
The coefficient of correlation between deposits and interest earned measure the relationship
between these two variables. Deposits are independent variable (X) and an interest earned is
dependent variable (Y). The objectives of calculating r between two variables are to justify
whether deposit is significantly used to earn interest or not. The table 4.31 shows the value of ‘r’,
r2, P.Er and 6P.Er of NIBL, NABIL and SBI during the study period.
Table 4.31Coefficient of Correlation between Deposit and Interest Earned
Banks Evaluation criterions
R r2 P.Er 6P.Er
NIBL 0.99724 0.994499 0.001514 0.0090875
NABIL 0.97714 0.9548184 0.012441 0.074648
SBI 0.97646 0.953485 0.012808 0.076849
(Source: Appendix 11, 12 &13)
The coefficient of correlation ‘r’ between deposit and interest earned in case of NIBL is 0.99724,
which indicates a positive relationship between these variables. When deposits increase the
interest earned subsequently increased but when it fall the interest earned also fell. The
coefficient of determination (r2) is 0.99449 which indicate that 99.45% of the variation of

104
dependent variable has been explained by independent variable. Similarly considering the value
of ‘r’ and comparing with 6P.Er it has been found that the value of r is greater than the value of
6P.Er. This shows that it has significant relationship between deposit and interest earned.The
coefficient of correlation ‘r’ between two variables in case of NABIL and SBI are 0.97714 and
0.97646 which indicates that 97.71% and 97.65% of the variation of dependent variable has been
explained by independent variables. The value of ‘r’ in both bank's have higher than that of
6P.Er. This states that there is a significant relationship between deposit and interest earned.
After above analysis it can be concluded that the relationship between deposit and interest
earned in case of NIBL is highly significant with showing higher dependency. It has effectively
mobilization of deposits which has had a major role to play in its earning; where as other factors
are responsible in the earnings of NABIL & SBI.
4.2.9 Coefficient of Correlation between Loan and Advances and Interest Paid
It measures the relationships between these variables. Here, loan and advances is independent
variables (X) and interest paid in dependent variable (Y). The purpose of calculating ‘r’ between
these variables is to established whether increase in loan and advances has play any role in
decreasing in interest expenses. The table 4.32 shows the values of ‘r’, r2, P.Er and 6P.Er of NIBL,
NABIL and SBI during the study period.
Table 4.32Coefficient of Correlation between Loan and Advances and Interest Paid
Banks Evaluation criterions
R r2 P.Er 6P.Er
NIBL 0.982665 0.965631 0.009464 0.05678
NABIL 0.982794 0.965884 0.009394 0.05636
SBI 0.941697 0.886794 0.031172 0.18703
(Source: Appendix 14, 15 &16)

105
The coefficient of correlation between loan and advances and interest paid in the case of NIBL is
0.982665. It shows the positive relationship between two variables. The coefficient of
determination (r2) in case of NABIL shows a higher degree dependency than NIBL and lower
degree dependency than SBI. The value of r is greater than value of 6P.Er in case of NIBL which
states that there is significant relationship between loan and advances and interest paid.
Similarly the coefficient of correlation between loan and advances and interest paid in the case
of NABIL and SBI are 0.98279 and 0.941697. They show there is significant relationship between
these variables. The values of coefficient of determination (r2) are 0.965884 and 0.886794 it
means 96.58% and 88.68% of the variation in the dependent variable is explained by the
independent variable. Again considering, the value of r and comparing with 6P.Er in both cases it
is greater than 6P.Er which reveals that the value is significant relationship between two
variables.
In conclusion, it can be clear that the relationship between loan and advances and interest in
case of NABIL is highly significant than both other banks. It is successful to utilize the loan and
advances. In case of NIBL and SBI have no relationship could be established between the loan
and advances and interest paid.
4.2.10 Coefficient of Correlation between Total Working Fund and Net Profit
The coefficient of correlation between the total working fund and net profit measures the
degree of relationship between them. Here, total working fund is taken as independent variable
(X) and net profit is taken as dependent variable(Y). The main purpose of calculating ‘r’ is to
justify where total working fund is significantly used to generate earnings or in other words
whether these variables are significantly correlated or not.
The table 4.33 shows the value of ‘r’, r2, P.Er, 6P.Er between these two variables of NIBL, NABIL
and SBI.

106
Table 4.33Coefficient of Correlation between Total Working Fund and Net Profit
Banks Evaluation criterions
R r2 P.Er 6P.Er
NIBL 0.99389 0.98682 0.003628 0.021770
NABIL 0.95388 0.90988 0.024813 0.14888
SBI 0.830872 0.69034 0.085267 0.511599
(Source: Appendix 17, 18 & 19)
The coefficient of correlation ‘r’ between total working fund and net profit in case of NIBL is
0.99389 which indicates positive relationship between these variables. The coefficient of
determination (r2) is 0.98682, which states that 98.68% of the variation of the dependent
variable has been explained by independent variable. Similarly considering the value of ‘r’
0.99389 and comparing it with 6P.Er 0.021770, the value of ‘r’ is greater than the value of 6P.Er,
so it is significant relation between these variables.
Similarly the value of ‘r’ between these variables in case of NABIL is 0.95388, which shows the
positive relationship. In case of SBI its value is 0.83087 that means it has significant relation
between these variable. The coefficient of determination r2 in case of NABIL and SBI are 0.90988
and 0.69034, which shows that only 90.98% and 69.03% of the variation of the dependent
variables have been explained by independent variables. The value of 6P.Er is greater than ‘r’ i.e
0.14888< 0.95388 in case of NABIL. So there is significant relation. In case of SBI the value of ‘r’ is
greater than 6P.Er in case of SBI, so there is significant relationship between these variables.
After analysis the conclusion can be drawn that NIBL, NABIL and SBI are significant relationship
between these variable, which indicated that total working fund is significantly used to generate
earnings. In case of NIBL there is significant relation so fell to generate earnings or in other words
these variables are significant correlated.

107
4. 3 Test of Hypothesis
4.3.1 Test of Hypothesis on Loans and Advances to Total Deposits Ratio.
To test the ratios of loans and advances to total deposits of NIBL, NABIL and SBI are taken under
statistical tools T-test has been done.
Table 4.34Loans and Advances to Total Deposits Ratios between NIBL, NABIL and SBI
(In Million)Fiscal
Year
NIBL NABIL SBI
x1 X1 21X X2 X2 2
2X X3 X3 23X
2003/04 61.87 -9.29 86.35 58.01 -9.46 89.45 71.46 -1.49 2.22
2004/05 71.04 -0.12 0.02 72.57 5.11 26.11 71.80 -1.15 1.32
2005/06 67.50 -3.66 13.39 66.79 -0.67 0.45 69.32 -3.63 13.14
2006/07 70.59 -0.57 0.33 66.60 -0.87 0.75 82.66 9.71 94.31
2007/08 78.36 7.20 51.84 66.94 -0.52 0.27 88.32 15.38 236.40
2008/09 77.61 6.45 41.56 73.87 6.41 41.05 54.12 -18.82 354.26
Total 426.96 0 193.48 404.79 0 158.09 437.68 0 701.66
(Source: Annual Report of Bank)
We have,
n
xX 1
1 n
xX 2
2 n
xX 3
3
= 426.96/6 = 404.79/6 = 437.68/6

108
= 71.16 = 67.46 = 72.59
Again, 111 XxX 222 XxX 333 XxX
Test of Significance of Difference between NIBL and NABIL
To test the significant relationship between NIBL and NABIL under statistical tool, T-test has been
done.
We have
t =
21
21
112
nnSp
XX
Where,
Sp2 =
22
21
21 2
1xx
nn
= 09.15848.193266
1
= 35.15
Now,
Test statistics under H0 is.
t =
6
1
6
135.15
67.46-71.16
= 1.0809
With degree of frequency = n1 + n2 – 2 = 6 + 6 - 2 = 10
The calculated value of (t) = 1.0809

109
The calculated value of t at ∞ = 0.05 of 5% level of significance for one tailed test and for 10
degree of freedom is 1.8125 i.e. t0.05 (10) = 1.8125
Decision, since the calculated value of t i.e. 1.0809 is less than the tabulated value 1.812, the null
hypothesis (H0) is accepted. This mean there is no significant difference between mean ratios of
loans and advances to total deposit of NIBL and NABIL.
Test of Significance Difference between NIBL and SBI
To test the significant relationship between NIBL and SBI under statistical tool, T-test has been
done.
We have
t =
n31
n11
Sp2
X3X1
Where,
Sp2 =
23
21
31 2
1xx
nn
= 66.70148.193266
1
= 89.51
Now,
Test statistics under H0 is
t =
6
1
6
189.51
72.59-71.16
t = -0.261795

110
With degree of frequency = n1 + n3 – 2 = 6 + 6 – 2 = 10
The calculated value of (t) = -0.261795
The tabulated value of at 5% level of significance for one tailed test and for 10 degree of freedom
(D.F) is 1.8125 i.e. t0.05 (10) = 1.8125
Decision, since the calculated value of t is -0.261795 is lesser than the tabulated value 1.8125,
the null hypothesis (H0) is accepted. This means there is no significant difference between mean
ratios of loans and advances to total deposit of NIBL and SBI.
4.3.2 Test of Hypothesis on Total Investment to Total Deposit Ratio.
This ratio of total investment to total deposit of NIBL, NABIL and SBI are taken and carried out
under t- test of significance difference.
Table 4.35Total Investment to Total Deposit Ratio of NIBL, NABIL and SBI
(In Million)Fiscal
Year
NIBL NABIL SBI
x1 X1 21X X2 X2 2
2X X3 X3 23X
2003/04 33.51 8.00 63.95 41.33 7.83 61.26 26.50 -4.18 17.47
2004/05 27.60 2.09 4.35 29.31 -4.19 17.58 30.13 -0.55 0.30
2005/06 29.60 4.09 16.70 31.93 -1.57 2.48 34.17 3.49 12.18
2006/07 26.57 1.06 1.12 38.32 4.82 23.20 23.24 -7.44 55.35
2007/08 19.95 -5.56 30.95 31.14 -2.36 5.59 22.52 -8.16 66.59
2008/09 15.85 -9.66 93.38 28.99 -4.51 20.37 47.52 16.84 283.59
Total 153.08 0 210.45 201.02 0 130.47 184.08 0 435.48
(Source: Annual Report of Bank)

111
We have,
n
xX 1
1 n
xX 2
2 n
xX 3
3
= 153.08/6 = 201.02/6 = 184.08/6
= 25.51 = 33.50 = 30.68
Again, 111 XxX 222 XxX 333 XxX
Test of Significance Difference between NIBL and NABIL
To test the significant relationship between NIBL and NABIL under statistical tool, T-test has been
done.
We have
t =
n2
1
n1
1Sp2
X2X1 with degree of frequency = n1 + n2 - 2
Sp2 =
22
21
21 2
1xx
nn
= 47.13045.210266
1
= 34.09
Now, Test statistics under (H0) is,
t =
6
1
6
134.09
33.50-25.51
t = -2.370

112
With degree of frequency = n1 + n2 – 2 = 6 + 6 - 2 = 10
The calculated value of t = -2.370
The tabulated value of t at ∞ = 0.05 level of significance for one tailed test and for 10 degree of
freedom is 1.8125 i.e. t0.05 (10) = 1.8125
Decision,
Since the calculated value of t i.e. -2.370 is less than the tabulated value i.e. 1.8125. The null
hypothesis is accepted. This means there is no significance difference between mean ratios of
total investment to total deposit of NIBL and NABIL.
Test of Significance Difference between NIBL and SBI
To test the significant relationship between NIBL and SBI under statistical tool, T-test has been
done.
We have
t =
n31
n11
Sp2
X3X1
Where,
Sp2 =
23
21
31 2
1xx
nn
= 48.43545.210266
1
= 64.59
Now, test statistics is,

113
t =
6
1
6
164.59
68.3051.25
= -1.1142
The calculating value of t = -1.1142
With degree of frequency = n1 + n3 – 2 = 6 + 6 - 2 = 10
The tabulating value of at 5% level of significance for (n1 + n3 – 2) degree of freedom in a one
tailed test is 1.8125 i.e. t0.05 (10) = 1.8125
Decision,
Since the calculated value of t i.e. -1.1142 is less than the tabulated value 1.8125 So the null
hypothesis is accepted i.e. there is no significance difference between mean ratio of total
investment to total deposit of NIBL and SBI.
4.3.3 Hypothesis test of Investment of Government Securities to Current Assets Ratio.
To test the significant relationship between NIBL, NABIL and SBI under statistical tool T-test has
been done.
Table 4.36Investment of Government Securities to Current Asset Ratio of NIBL, NABIL & SBI
( In Million)Fiscal
Year
NIBL NABIL SBI
x1 X1 21X X2 X2 2
2X X3 X3 23X
2003/04 99.40 13.59 184.55 154.22 33.37 1113.22 261.79 100.71 10142.17
2004/05 102.92 17.11 292.58 131.35 10.50 110.15 152.84 -8.24 67.93
2005/06 96.73 10.92 119.14 79.09 -41.77 1744.32 119.34 -41.74 1742.37

114
2006/07 107.14 21.33 454.76 194.25 73.40 5386.83 153.68 -7.40 54.78
2007/08 78.24 -7.58 57.38 88.85 -32.01 1024.32 148.17 -12.91 166.71
2008/09 30.46 -55.36 3064.18 77.37 -43.49 1890.95 130.67 -30.41 924.87
Total 514.89 0.00 4172.58 725.13 0.00 11269.77 966.49 0.00 13098.83
(Source: Annual Report of Bank)
We have,
n
xX 1
1 n
xX 2
2 n
xX 3
3
= 514.89/6 = 725.13/6 = 966.49/6
= 85.82 = 120.86 = 161.08
Again, 111 XxX 222 XxX 333 XxX
Test of Significance of Difference between NIBL and NABIL
To test the significant relationship between NIBL and NABIL under statistical tool, T-test has been
done.
We have
t =
21
21
112
nnSp
XXwith degree of freedom = n1 + n2 - 2
Where,
Sp2 =
22
21
21 2
1xx
nn

115
= 77.1126958.4172266
1
= 1544.24
Now,
Test statistics under null hypothesis H0 is,
t =
6
1
6
11544.24
86.12082.85
= -1.5444
The calculated value of t = -1.5444
With degree of frequency = n1 + n2 – 2 = 6 + 6 - 2 = 10
The tabulated value of t at 5% level of significance for (n1 + n2 – 2) degree of freedom on a one
tailed test is 1.8125 i.e. t0.05 (10) = 1.8125
Decision,
Since the tabulated value of i.e. -1.5444 is less than the tabulated value i.e. 1.8125. The null
hypothesis is accepted. This means there is no significance difference between mean ratio if
investment on government securities to current assets ratio of NIBL and NABIL.
Test of significance of difference between NIBL and SBI
To test the significant relationship between NIBL and SBI under statistical tool, T-test has been
done.

116
We have
t =
n31
n11
Sp2
X3X1
Where,
Sp2 =
23
21
31 2
1xx
nn
= 83.1309858.4172266
1
= 1727.14
Now,
Test statistics under H0 is,
t =
6
1
6
11727.14
08.16182.85
t = -3.14
The calculated value of t = -3.14
With degree of frequency = n1 + n3 – 2 = 6 + 6 - 2 = 10
The tabulated value of t at 5% level of significance for (n1 + n2 – 2) degree of freedom on a one
tailed test are 1.8125 i.e. t0.05 (10) = 1.8125
Decision,
Since the tabulated value of t = -3.14 which is less than the tabulated value 1.8125. So the null
hypothesis is accepted i.e. there is no significance difference between mean ratio of investment
on government securities to current assets ratio of NIBL and SBI.
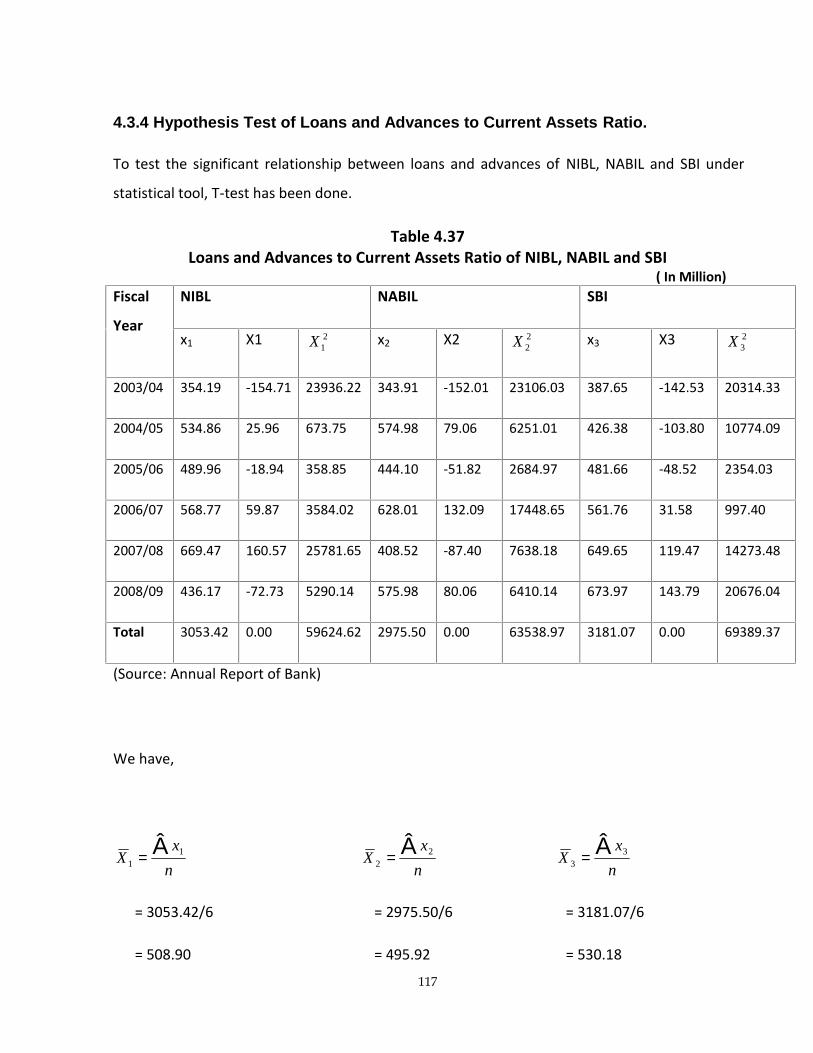
117
4.3.4 Hypothesis Test of Loans and Advances to Current Assets Ratio.
To test the significant relationship between loans and advances of NIBL, NABIL and SBI under
statistical tool, T-test has been done.
Table 4.37Loans and Advances to Current Assets Ratio of NIBL, NABIL and SBI
( In Million)Fiscal
Year
NIBL NABIL SBI
x1 X1 21X x2 X2 2
2X x3 X3 23X
2003/04 354.19 -154.71 23936.22 343.91 -152.01 23106.03 387.65 -142.53 20314.33
2004/05 534.86 25.96 673.75 574.98 79.06 6251.01 426.38 -103.80 10774.09
2005/06 489.96 -18.94 358.85 444.10 -51.82 2684.97 481.66 -48.52 2354.03
2006/07 568.77 59.87 3584.02 628.01 132.09 17448.65 561.76 31.58 997.40
2007/08 669.47 160.57 25781.65 408.52 -87.40 7638.18 649.65 119.47 14273.48
2008/09 436.17 -72.73 5290.14 575.98 80.06 6410.14 673.97 143.79 20676.04
Total 3053.42 0.00 59624.62 2975.50 0.00 63538.97 3181.07 0.00 69389.37
(Source: Annual Report of Bank)
We have,
n
xX 1
1 n
xX 2
2 n
xX 3
3
= 3053.42/6 = 2975.50/6 = 3181.07/6
= 508.90 = 495.92 = 530.18

118
Again, 111 XxX 222 XxX 333 XxX
Test of Significance of Difference between NIBL and NABIL
To test the significant relationship between NIBL and NABIL under statistical tool, T-test has been
done.
We have
t =
21
21
112
nnSp
XXwith degree of freedom = n1 + n2 - 2
Where,
Sp2 =
22
21
21 2
1xx
nn
= 97.6353862.59624266
1
= 12316.36
Now,
Test statistics is
t =
6
1
6
136.12316
92.49590.508

119
The calculated value of t = 0.20257
With degree of frequency = n1 + n2 – 2 = 6 + 6 - 2 = 10
The tabulated value of t at 5% level of significance for (n1 + n2 – 2) degree of freedom on a one
tailed test is 1.8125 i.e. t0.05 (10) = 1.8125
Decision,
Since the tabulated value of t = 0.20257 is less than the tabulated value 1.8125. So the null
hypothesis is accepted i.e. there is no significance difference between mean ratio of loan and
advances to current assets ratio of NIBL and NABIL.
Test of Significance of Difference between NIBL and SBI
To test the significant relationship between NIBL and SBI under statistical tool, T-test has been
done.
We have
t =
n31
n11
Sp2
X3X1 with degree of freedom = n1 + n2 - 2
Where,
Sp2 =
23
21
31 2
1xx
nn
= 37.6938962.59624266
1
= 12901.40

120
Now
Test statistics under (H0) is
t =
6
1
6
112901.40
18.53090.508
t = -0.32454
The calculated value of t = -0.32454
With degree of frequency = n1 + n3 – 2 = 6 + 6 - 2 = 10
The tabulated value of t at 5% level of significance for (n1 + n3 – 2) degree of freedom on a one
tailed test is 1.8125 i.e. t0.05 (10) = 1.8125.
Decision,
Since the tabulated value of t = -0.32454 is less than the tabulated value i.e. 1.8125 So the null
hypothesis is accepted i.e. there is no significance difference between mean ratio of loan and
advances to current assets ratio of NIBL and SBI.
4.3.5 Hypothesis Test of Return on Loans and Advances Ratio of NIBL, NABIL andSBI.
The ratios of return on loans and advances of NIBL, NABIL and SBI are taken and under t- test of
significance difference.

121
Table 4.38Return on Loans and Advances Ratio of NIBL, NABIL and SBI.
( In Million)Fiscal
Year
NIBL NABIL SBI
x1 X1 21X X2 X2 2
2X x3 X3 23X
2003/04 2.14 -0.38 0.15 5.56 1.07 1.14 1.18 -0.56 0.32
2004/05 2.29 -0.23 0.05 4.91 0.42 0.17 0.92 -0.82 0.68
2005/06 2.74 0.22 0.05 4.92 0.43 0.18 1.53 -0.21 0.05
2006/07 2.90 0.38 0.14 4.34 -0.15 0.02 2.69 0.95 0.90
2007/08 2.58 0.06 0.003 3.49 -1.00 1.01 2.05 0.31 0.09
2008/09 2.49 -0.03 0.0011 3.74 -0.75 0.57 2.09 0.35 0.12
Total 15.14 0.00 0.39 26.96 0.00 3.09 10.46 0.00 2.15
(Source: Annual Report of Bank)
We have,
n
xX 1
1 n
xX 2
2 n
xX 3
3
= 15.14/6 = 26.96/6 = 10.46/6
= 2.52 = 4.49 = 1.74
Again, 111 XxX 222 XxX 333 XxX

122
Test of Significance Difference between NIBL and NABIL
To test the significant relationship between NIBL and NABIL under statistical tool, T-test has been
done.
We have
t =
21
21
112
nnSp
XXwith degree of freedom = n1 + n2 - 2
Where,
Sp2 =
22
21
21 2
1xx
nn
= 09.339.0266
1
= -0.27
Now,
Test statistics of (H0) is
t =
6
1
6
10.27-
49.452.2
t = 6.5667
The calculated value of t = 6.5667
With degree of frequency = n1 + n2 – 2 = 6 + 6 - 2 = 10
The tabulated value of t at 5% level of significance for (n1 + n2 – 2) degree of freedom on a one
tailed test is 1.812 i.e. t0.05 (10) = 1.812

123
Decision,
Since the tabulated value of t = 6.5667 is higher than the tabulated value i.e. 1.8125. So the null
hypothesis is rejected. There is significance difference between mean ratio of return on loan and
advances ratio of NIBL and SBI
Test of Significance Difference between NIBL and SBI
To test the significant relationship between NIBL and SBI under statistical tool, T-test has been
done.
We have
t =
n3
1
n1
1Sp2
X3X1 with degree of freedom = n1 + n3 - 2
Where,
Sp2 =
23
21
31 2
1xx
nn
= 15.239.0266
1
= 0.254
T =
6
1
6
10.254
74.152.2
t = 2.6813
The calculated value of t = 2.6813
With degree of frequency = n1 + n3 – 2 = 6 + 6 - 2 = 10
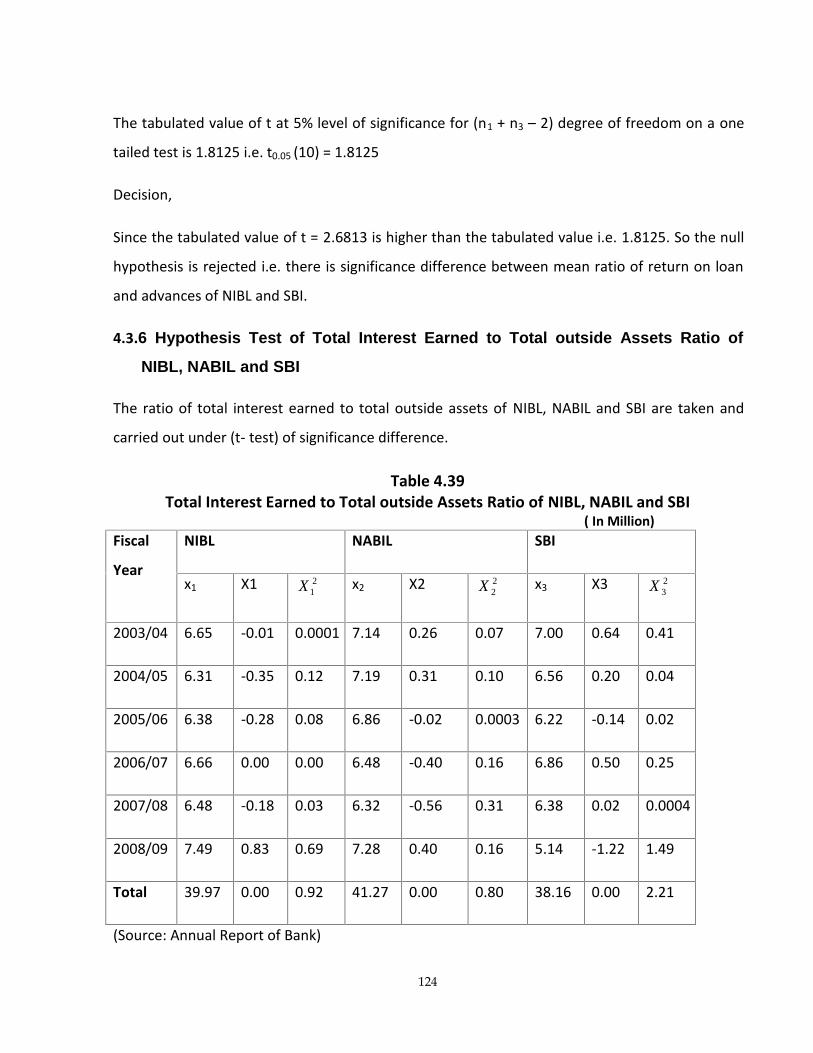
124
The tabulated value of t at 5% level of significance for (n1 + n3 – 2) degree of freedom on a one
tailed test is 1.8125 i.e. t0.05 (10) = 1.8125
Decision,
Since the tabulated value of t = 2.6813 is higher than the tabulated value i.e. 1.8125. So the null
hypothesis is rejected i.e. there is significance difference between mean ratio of return on loan
and advances of NIBL and SBI.
4.3.6 Hypothesis Test of Total Interest Earned to Total outside Assets Ratio of
NIBL, NABIL and SBI
The ratio of total interest earned to total outside assets of NIBL, NABIL and SBI are taken and
carried out under (t- test) of significance difference.
Table 4.39Total Interest Earned to Total outside Assets Ratio of NIBL, NABIL and SBI
( In Million)Fiscal
Year
NIBL NABIL SBI
x1 X1 21X x2 X2 2
2X x3 X3 23X
2003/04 6.65 -0.01 0.0001 7.14 0.26 0.07 7.00 0.64 0.41
2004/05 6.31 -0.35 0.12 7.19 0.31 0.10 6.56 0.20 0.04
2005/06 6.38 -0.28 0.08 6.86 -0.02 0.0003 6.22 -0.14 0.02
2006/07 6.66 0.00 0.00 6.48 -0.40 0.16 6.86 0.50 0.25
2007/08 6.48 -0.18 0.03 6.32 -0.56 0.31 6.38 0.02 0.0004
2008/09 7.49 0.83 0.69 7.28 0.40 0.16 5.14 -1.22 1.49
Total 39.97 0.00 0.92 41.27 0.00 0.80 38.16 0.00 2.21
(Source: Annual Report of Bank)

125
We have,
n
xX 1
1 n
xX 2
2 n
xX 3
3
= 39.97/6 = 41.27/6 = 38.16/6
= 6.66 = 6.88 = 6.36
Again, 111 XxX 222 XxX 333 XxX
Test of Significance Difference between NIBL and NABIL.
To test the significant relationship between NIBL and SBI under statistical tool, T-test has been
done.
We have
t =
n2
1
n1
1Sp2
X2X1 with degree of freedom = n1 + n2 - 2
Where,
Sp2 =
22
21
21 2
1xx
nn
= 80.092.0266
1
= 0.172
Now,
Test statistics under (H0) is

126
t =
6
1
6
1172.0
88.666.6
=-0.9189
The calculated value of t = -0.9189
With degree of frequency = n1 + n2 – 2 = 6 + 6 - 2 = 10
The tabulated value of t at 5% level of significance for (n1 + n2 – 2) degree of freedom in one
tailed test is 1.8125 i.e. t0.05 (10) = 1.8125
Decision,
Since the tabulated value of t = -0.9189 is less than the tabulated value i.e. 1.8125. So the null
hypothesis is accepted i.e. there is no significant difference between mean ratio of total interest
earned to total outside assets ratio of NIBL and SBI
Test of Significance Difference between NIBL and NABIL
To test the significant relationship between NIBL and NABIL under statistical tool, T-test has been
done.
We have
t =
n3
1
n1
1Sp2
X3X1 with degree of freedom = n1 + n3 – 2
Where, Sp2 =
23
21
31 2
1xx
nn
= 21.292.0266
1
= 0.313

127
T =
6
1
6
1313.0
36.666.6
t = 0.92879
The calculated value of t = 0.92879
With degree of frequency = n1 + n3 – 2 = 6 + 6 - 2 = 10
The tabulated value of t at 5% level of significance for (n1 + n3 – 2) degree of freedom on a two
tailed test is 1.8125 i.e. t0.05 (10) = 1.8125
Decision,
Since the tabulated value of t = 0.92879 is less than the tabulated value i.e. 1.8125. So the null
hypothesis is accepted i.e. there is no significance difference between mean ratio of return on
loan and advances of NIBL and SBI.
4.4 Regression Analysis
4.4.1Regression of working fund and Net Profit
Regression is the statistical tool which is used to determine the statistical relationship between
two or more variables and so make estimate of one variable on the basis of the other variable.
Regression is the line which gives the best estimate of one variable for any given value of the
other variable. The regression line of Y on X estimate the most probable values of Y for given
values of X.
X is independent variable
Y in dependent variable
The regression equation of Y on X expressed as Y = a + bx
Where, a and b are parameters of the line.

128
To find out the exact relationship between different variable simple regressions analysis has
been done and results of the analysis have been table.
Table 4.40Calculation of Regression Equation between Net Profits on Total Working Fund
Banks Regression equation Value (a) constant Regression coefficient (b)
NIBL Y= -61.48+0.018804 X a = -61.48 b = 0.018804
NABIL Y =197.903+0.017487X a = 197.903 b = 0.017487
SBI Y = -3.4944+0.01146 X a = -3.4944 b = 0.01146
Source: Appendix 20.
The table shows the regression equation of net profit and net working fund in NIBL, NABIL and
SBI. According to the table regression equation of net profit on net working fund Y= -61.48 +
0.018804X in NIBL is negative. The regression coefficient is positive i.e. 0.018804 which indicates
the positive relationship exists between net profit and net working fund. In other word, one
million increase in net working funds leads to average about 0.018804 million increase in net
profit. The value of constant (a) is relatively low. The value of (a) indicates that if net working
fund is 0 then the value of net profit is -61.48 million. So from analysis it shows that the net
profit will be decrease and net working fund also decrease.
On the other hand, regression coefficient of (b) is positive in case of NABIL which indicates that
one million increase in net working fund lead to an average about Rs. 0.017487 increases in net
profit. According to the above table regression equation of net profit on net working fund
regression coefficient is positive which reveals the positive relationship between net and working
fund.
Similarly regression equation of net profit on net working fund Y= -3.4944 + 0.01146X in SBI is
negative. The regression coefficient is positive i.e. 0.01146 which indicates the positive
relationship exists between net profit and net working fund. In other word, one million increase
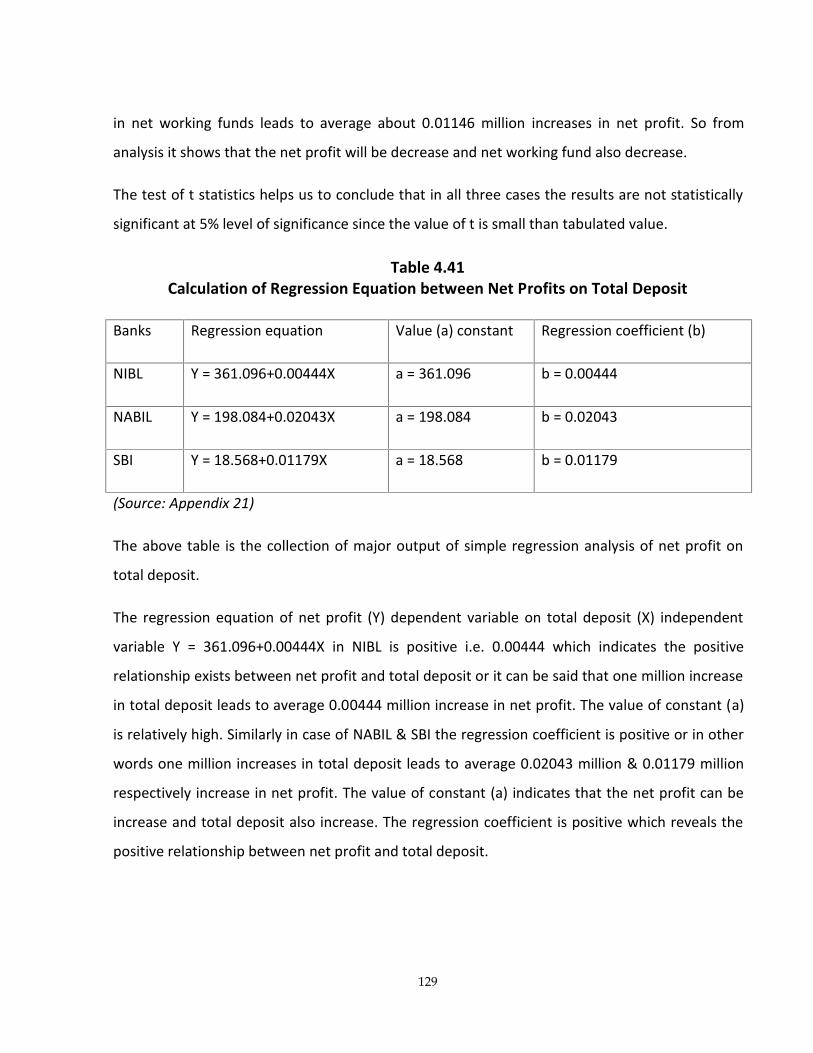
129
in net working funds leads to average about 0.01146 million increases in net profit. So from
analysis it shows that the net profit will be decrease and net working fund also decrease.
The test of t statistics helps us to conclude that in all three cases the results are not statistically
significant at 5% level of significance since the value of t is small than tabulated value.
Table 4.41Calculation of Regression Equation between Net Profits on Total Deposit
Banks Regression equation Value (a) constant Regression coefficient (b)
NIBL Y = 361.096+0.00444X a = 361.096 b = 0.00444
NABIL Y = 198.084+0.02043X a = 198.084 b = 0.02043
SBI Y = 18.568+0.01179X a = 18.568 b = 0.01179
(Source: Appendix 21)
The above table is the collection of major output of simple regression analysis of net profit on
total deposit.
The regression equation of net profit (Y) dependent variable on total deposit (X) independent
variable Y = 361.096+0.00444X in NIBL is positive i.e. 0.00444 which indicates the positive
relationship exists between net profit and total deposit or it can be said that one million increase
in total deposit leads to average 0.00444 million increase in net profit. The value of constant (a)
is relatively high. Similarly in case of NABIL & SBI the regression coefficient is positive or in other
words one million increases in total deposit leads to average 0.02043 million & 0.01179 million
respectively increase in net profit. The value of constant (a) indicates that the net profit can be
increase and total deposit also increase. The regression coefficient is positive which reveals the
positive relationship between net profit and total deposit.
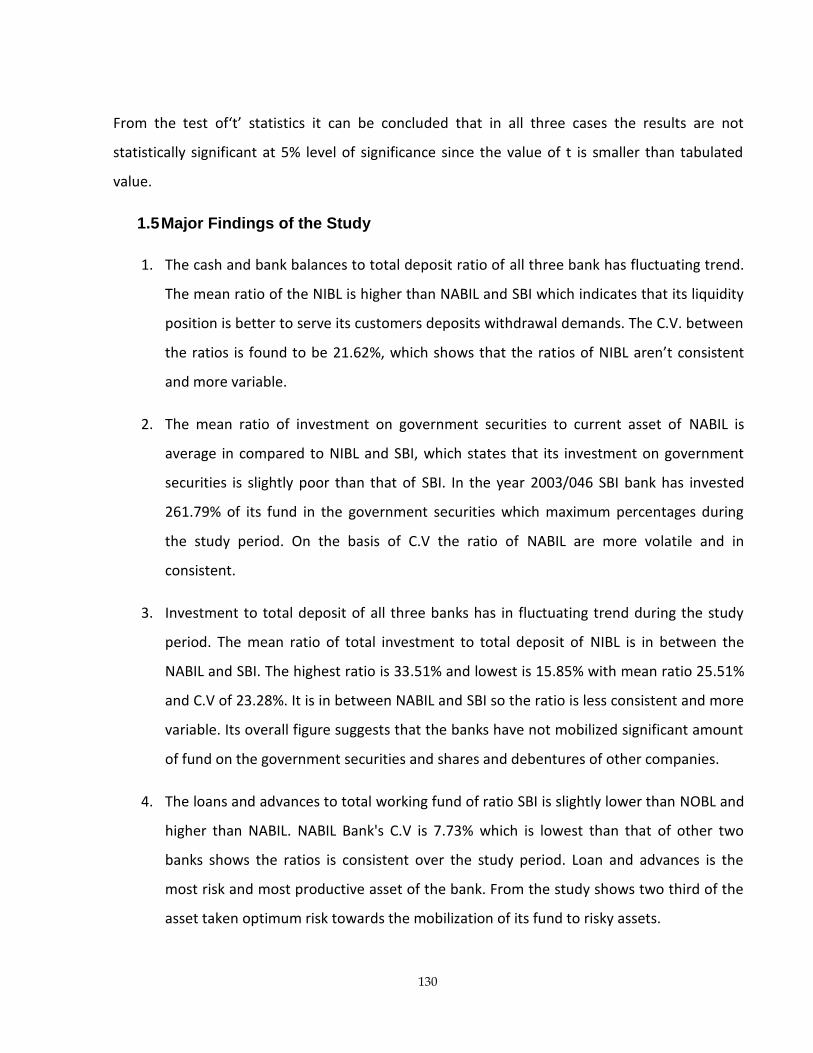
130
From the test of‘t’ statistics it can be concluded that in all three cases the results are not
statistically significant at 5% level of significance since the value of t is smaller than tabulated
value.
1.5Major Findings of the Study
1. The cash and bank balances to total deposit ratio of all three bank has fluctuating trend.
The mean ratio of the NIBL is higher than NABIL and SBI which indicates that its liquidity
position is better to serve its customers deposits withdrawal demands. The C.V. between
the ratios is found to be 21.62%, which shows that the ratios of NIBL aren’t consistent
and more variable.
2. The mean ratio of investment on government securities to current asset of NABIL is
average in compared to NIBL and SBI, which states that its investment on government
securities is slightly poor than that of SBI. In the year 2003/046 SBI bank has invested
261.79% of its fund in the government securities which maximum percentages during
the study period. On the basis of C.V the ratio of NABIL are more volatile and in
consistent.
3. Investment to total deposit of all three banks has in fluctuating trend during the study
period. The mean ratio of total investment to total deposit of NIBL is in between the
NABIL and SBI. The highest ratio is 33.51% and lowest is 15.85% with mean ratio 25.51%
and C.V of 23.28%. It is in between NABIL and SBI so the ratio is less consistent and more
variable. Its overall figure suggests that the banks have not mobilized significant amount
of fund on the government securities and shares and debentures of other companies.
4. The loans and advances to total working fund of ratio SBI is slightly lower than NOBL and
higher than NABIL. NABIL Bank's C.V is 7.73% which is lowest than that of other two
banks shows the ratios is consistent over the study period. Loan and advances is the
most risk and most productive asset of the bank. From the study shows two third of the
asset taken optimum risk towards the mobilization of its fund to risky assets.

131
5. The investment on shares and debenture to total working fund of all three bank's have
fluctuating trend. The mean ratio of NABIL is found to be 0.17 with 26.21% C.V between
the other compared banks. It shows the ratio of NABIL is very stable over the study
period.
6. Total off balance sheet operation to loan and advances ratios of all three banks have
fluctuating trend. The mean of the ratio of SBI is found to be 32.35 with C.V 36.35%. It
has highest C.V. than that of others compared a bank which indicates that the ratio is not
consistent during the study period. The analysis of the ratios shows that OBS operation
of the bank is in decreasing trend. It may be due to competition in the banking sector or
bank is not getting enough attention towards non-funded business.
7. The loan loss ratio of all banks has decreasing trend. The mean ratio of NABIL found to be
2.70% with C.V of 35.97%, which is lowest than that of the other compared banks, It
shows that the bank manages its loan and advances and makes effort for timely
recovered of loan. The variability of the ratio of NABIL is lower than that of other
compared banks. The increasing trend of loan loss provision indicates that the quality of
loans becoming degrading year by year.
8. The mean ratio of return on loans and advances ratio of NIBL is higher than SBI and is
lower than NABIL. The mean of the ratio is found to be 2.52% with C.V of 10.15%, which
indicates that the ratios are less variable. The average ratio of 2.52% suggests that the
earning capacity of the bank's loan and advances is satisfactory.
9. The total interest paid to working fund ratios has fluctuating trend during the study
period. The mean ratio of total interest paid to total working fund of NIBL is average
higher than NABIL lower than SBI, which means it has paid average interest than NABIL
and SBI. The total interests paid to working fund ratios are lesser than to total interest
earned to total fund ratio. This indicates that the bank is in profitability position as it is
earning higher return than it interest cost.

132
10. The analysis of the growth ratio of total deposits of NIBL in comparison with NABIL and
SBI during the study period shows that the total deposits of the bank is in increasing
trend with the net growth rate of 38.43%. It has maintained growth rate highest that
other compared banks. This means the performance of NIBL to collect deposit in
comparison to other banks is better year by year.
11. The total investment of studies banks are fluctuating trend during the study period. The
growth ratio of NIBL total investment is in between the NABIL and SBI. NIBL has
maintained growth ratio of 13.89%, which is lesser than SBI (47.43%) and higher than
NABIL (13.15%). It shows that NIBL has moderate successful in investing.
12. The total net profit of studies banks are also in increasing trends during the study
periods. The growth ratio of NIBL net profit is highest of all. It has the rate of 42.61%
whereas NABIL and NIBL have 17.76% and 39.06% respectively. It means the
performance of SBI to earn profit is better year by year.
13. The trend analyses of total deposit of NIBL, NABIL and SBI have increasing trend. From
the trend analysis it is forecasted that the total deposit of NIBL in 2013/14 will be
forecast Rs. 107660.78 million. Similarly the total deposit of NABIL and SBI will be
89292.57 and 55306.25 million in the third mid July of 2014 respectively. The deposit
collection of NIBL is better than that of NABIL and SBI.
14. The net profits of all three banks have the increasing trend. The net profit of NABIL by
the FY 2013/14 is projected to be 2289.37million, which is the highest value under the
study period. Similarly the total net profit of NIBL and SBI will be 2181.50 and 815.91
million respectively. The Net profit of NABIL id better than NIBL & SBI.

133
CHAPTER –V
SUMMARY, CONCLUSIONS AND RECOMMENDATIONS
5.1 SummaryThe prosperity of every developing country can only be ensured by its economic growth. The
role of Commercial Banks in the economic growth of the nation can be fairly estimated to be
very prominent. By mobilizing the scattered idle resources from the savers, commercial bank
pools the fund in a sizable volume in order to feed to the fund requirement of productive sector
of the economy. Such investments in the productive sector promote trade and industrialization
in the country. Thereby raising the employment opportunities and earning to the labours,
materials and service providers to such industries and trades, which as a chain effect, promotes
saving into the banks and more saving means more funds available in the banks for further
investment. In this way, as the chain moves rolling on, the economy of the nation also grows. To
remain as the major contribution factor to the growth of the nation's economy, the banks also
have to have sustainable existence and growth of themselves. For the sustainable existence and
growth of a bank, it must ensure reasonable profitability. As the banks are formed as joint stock
companies promoted by shareholder's investment, it must give reasonable return on the fund of
the shareholders. Further by the profit made by the bank, it may choose to increase its capital
base to make it stronger and more sustainable for facing nay future threat that may come up. A
profit earning organization can better feed to their employee, thereby enhancing the morale of
the employees and motivate them for better performance. Therefore, profit for commercial
organization has been defined as the life-blood for them. A commercial bank also, being a
commercial institution, has to plan for the reasonable profit earnings. Profit planning, in short, is
the planning of activities in such a way that it helps in increasing the income at a minimum
possible cost or at optimum cost.
The income and profit of the bank depends upon its lending procedure, lending policy and
investment of its fund utilize in different securities. Commercial banks able to utilize its deposits
properly i.e. providing loans and advances or lending for a profitable project, the reason behind

134
it is lack of sound investment policy. The main objective of this study is to evaluate the profit
planning policies adopted by NIBL, NABIL and SBI. The study is totally based on secondary
sources of data and required data have been collected by using various published and
unpublished sources.
There are 27 commercial banks have been operating in Nepal which are considered to be the
population of the study and out of them three commercial banks i.e. NIBL, NABIL, SBI has been
taken as a sample of the study and the collected data have been analyzed by using various
financial tools and statistical tools like ratio analysis, correlation coefficient, regression equation
etc.
Regarding the profit planning policies of commercial banks there are basically five basic
principles of the bank follow while providing the loans i.e. liquidity, profitability, security and
suitability diversification. Various process while making investment decision are applied in the
study i.e. set investment process, security analysis, portfolio construction, revision, performance
evaluation .The data obtained from annual reports of the concerned banks, likewise the financial
statements of six years (from 2003/04 to 2008/09) were selected for the purpose of evaluation.
5.2 Conclusion
The liquidity position of NIBL is comparatively better than that of NABIL and SBI. In spite of the
current ratio is average among the other two banks NIBL has maintained the cash and bank
balance to meet the customers demand. All the three banks have met the normal standard
current assets ratio to meet the short term obligation of its customers. SBI has invested highest
sectors like government securities than NIBL & NABIL. SBI had mobilized lots of its funds in order
to gain the high profit.
From the analysis of assets management ratio it can be found that NIBL is in better position as
compared to that of NABIL and SBI. The loans and advances to total deposit ratio, loan and
advances to total working fund ratio of NIBL lies In between those of NABIL and SBI. SBI has
invested the highest portion of total working fund on government securities as compared to
NABIL and NIBL. Due to more efficient loan policy, NABIL suffers less from loan loss provision. It

135
takes low credit risk and has sufficient deposits of none bearing interest which can be used in a
creation period. Anyhow NIBL has also trying to best in loan loss provision. Investment on shares
and debentures to total working fund ratio is higher in SBI.
The interest earned to total outside assets and return on total working fund ratio of SBI is lowest
of all. But overall analysis of profitability ratios, NIBL is average profitable in comparison to other
compared bank i.e. NABIL and SBI. To make the profit SBI is taking highest risk by providing the
higher portion of its deposit as a loan.
The return on loan and advances ratio and return on assets of SBI is lowest of all. The ratio
suggests that the earning capacity of the bank's loan and advances is satisfactory. The return on
assets of the bank is good in average; it indicates the good earning capacity of the bank assets
and good utilization of its assets.
The total interest paid to working fund ratio is less than the interest earned to total working fund
ratio. So it is profitable position as it is getting higher return that is interest cost.
The degree of risk is average on NIBL. The credit risk ratio is higher than the compared banks.
However the lowest C.V. of credit ratio and average C. V. of liquidity risk ratio and capital ratio
over the study period provides for the assurance of consistency of the degree of risk. NIBL has
showing its good performance by increasing the total deposit, loan and advances and
investment in profitable sectors interested earnings by providing loan to clients. The trend of the
total investment, total deposit, loan and advances and net profit of NIBL shows better position
than that of NABIL and SBI.
5.3 Recommendations
On the basis of the findings of the study, following recommendations can be drawn:-
1. In commercial banks the liquidity position affects external and internal factors such as
saving for investment situations, central banks requirements, the leading policies
management capacity etc. In this study it should try to lower the current liabilities to
improve its liquidity position. Current ratio of all three banks is satisfactory. It is above its

136
standard rate 2:1. So the banks are suggested to maintain this current ratio & invest in
short term obligation of its current assets to gain short term profit. The ratio of cash and
bank balance to total deposit and current assets of NIBL is higher than that of NABIL and
SBI. It means NIBL has higher cash and bank balance which decrease profit of bank, so it
is recommended to mobilize cash and bank balance in profitable as loan and advances.
2. From the study it is found that NIBL has not invested sufficient funds in government
securities than that of other banks. NIBL liquidity position shows that it has kept
relatively funds as cash and bank balance which doesn’t earn any return. This ultimately
affects profitability of bank. Investment in government securities i.e. TBs development
bonds. Saving certificate are free of risk and highly in nature. So NIBL is recommended to
invest its fund in government securities instead of keeping them idle. “Something is
better than nothing”.
3. In practice joint ventured banks are urban based; service quite a few elite, a fluent big
customer are heavily dependent on free based activities. To overcome its situation they
should be accessible to rural areas and possible loan and advances to its deposit. So the
customers is enjoying by getting deposit borrowing and other services.
4. NIBL has invested it's more of the funds that is total investment on total deposit ratio but
the percentages of investment on share and debenture is nominal. So it is suggested to
invest more of its fund in share and debenture of different companies.
5. NABIL loan and advances to total deposit ratio is lowest in compared to other banks. To
overcome from the situation it is recommended to follow liberal lending policy and invest
more and more of total deposit in loan and advances and maintain stability on the
investment policy.
6. NIBL and SBI’s loan loss ratio is higher than NABIL. So these banks are recommended that
before providing the loan make sure that your clients is in good character and able to pay
its loan or may take the collateral which is nearly two times more than that of your
guaranteed.

137
7. Profitability ratios of banks are not satisfactory, if resources held idle bank have to
bearded more cost and result would be lower profit margin. So portfolio condition of a
bank should be regularly revised from time to time. It should always try to maintain the
equilibrium in the portfolio condition of the bank. The bank should use its funds in more
portfolio sectors. It should utilize its risky assets and shareholders' funds and it should
reduce its express and should try to collect cheaper fund being more profitable.
8. It is seen that NABIL has invested much of its fund in total outside assets but it has not
achieved the desired result. So NIBIL should play tactfully while investing its fund keeping
in mind the interest rate.
9. NABIL has taken the low credit risk as NABIL is one of the largest commercial bank in
Nepal. It must also interest as NIBL and SBI do. The risk taken by NIBL from the angle of
credit risk and capital risk are in an average but the consistencies of the same are highly
volatile which may result higher loss. So it should not test such risk on an experiment
basis it should carefully study it so as to achieve higher return from the above risk.
10. In the light of growing competition in the banking sector the business of the bank is
customer oriented. It should strengthen and active its marketing function, as it is an
effective tool of attracting and retaining customers. The bank should develop on
“Innovative approach to bank marketing and formulate new strategies of serving
customers in a more convenient way.
11. The investment policy of NIBL is good in every aspect as studied above but the
consistency in the above investment sectors is in equilibrium states. It is found that at
time bank focuses much of its attention to one sector leaving other sector untouched, so
it is recommended to touch all the sectors and balance it effectively as to have the
optimal performance of the bank.
12. The ‘Global Economic Crisis 2008’ started from banking sector of USA this crisis
may affects to Nepalese financial sectors too so the all banks suggested to make some
policy to be safe from this crises.
138
13. Financial institutions increasing day by day in Nepal it grows the competition with the
banks so banks should make some policy to keep its position as before among the
Nepalese financial institutions.
14. Nepal’s accession to the WTO would permit international banks to operate in Nepal so
banks need to make their business plan and strategy accordingly which can convert
challenges in to opportunities.
15. People in rural area of Nepal still out of banking services so bank is suggested to take
bold steps to expand and upgrade its network to reach such area with their products and
services.
16. Nepali Banks are allowed to expand its services to abroad from 2010 AD. So the banks
need to make their business plan and strategy which to take bold steps to expand and
upgrade its network to reach such area with their products and services.
17. Nepal Rastra Bank are allowed to banks operate Branch Less Banking ( GHAR DAILO
BANKING) in Nepal so banks need to make their business plan and strategy accordingly
which can convert challenges in to opportunities.
The size of Nepali banking market is increasing day by day. The increase in number of financial
institutions indicates the increasing competition in financial market. To monitor 167 with proper
regulation this even more, the government had to bring new strategies. Moreover, foreign banks
are allowed to operate in Nepal from 2010 A.D there will be more challenge for Nepalese
financial institutions. The central bank of Nepal (NRB) should make some policies toward the
banking sector to comfort and able to compete with this ever increasing financial institutions.
The research report is concluded with the above mentioned major findings, summary,
conclusions, and recommendations.