HL-2A Southwestern Institute of Physics 1/15 Experimental Studies of ELMy H-mode on HL-2A Tokamak Y....
33
1/15 HL-2A HL-2A Southwestern Institute of Physics xperimental Studies of ELMy H-mode on HL-2A Tokamak Y. Huang J.Q.Dong, L.W.Yan, X.T.Ding X.R.Duan, HL-2A team Southwestern Institute of Physics P.O.Box 432 P.O.Box 432 Chengdu , , 610041 , P.R.China , P.R.China International West Lake Symposium on Fusion Plasma Physics International West Lake Symposium on Fusion Plasma Physics May 27, 2011 at Zhejiang University May 27, 2011 at Zhejiang University
-
Upload
harold-copeland -
Category
Documents
-
view
219 -
download
1
Transcript of HL-2A Southwestern Institute of Physics 1/15 Experimental Studies of ELMy H-mode on HL-2A Tokamak Y....

1/15
HL-2AHL-2A
Southwestern Institute of Physics
Experimental Studies of ELMy H-mode on HL-2A Tokamak
Y. HuangJ.Q.Dong, L.W.Yan, X.T.Ding
X.R.Duan, HL-2A team
Southwestern Institute of Physics P.O.Box 432 P.O.Box 432 Chengdu , , 610041, P.R.China, P.R.China
International West Lake Symposium on Fusion Plasma PhysicsInternational West Lake Symposium on Fusion Plasma PhysicsMay 27, 2011 at Zhejiang UniversityMay 27, 2011 at Zhejiang University

2/15
HL-2AHL-2A
Southwestern Institute of Physics
• Introduction of HL-2A Divertor Tokamak
•
• Heating system,fuelling system
• Experimental results of ELMy H-mode
• Summary
OutlineOutline

3/15
HL-2AHL-2A
Southwestern Institute of Physics
•R: 1.65 m
•a: 0.40 m
•Configuration:
Limiter, LSN divertor
•BT: 2.7 T
• Ip: 450 kA
•ne: ~ 6.0 x 10¹⁹ m-
3
•Te: ~ 5.0 keV
•Ti: ~ 2.8 keV
•P.d.: ~4.3 secondsAuxiliary heating systems: ECRH/ECCD: 3 MW (60.5 MW/68 GHz/1 s) modulated: 10~50 Hz; 10~100 % NBI: 1 MW/45 keV/2 s LHCD: 1 MW (2 0.5 MW/2.45 GHz/1 s)
Fueling systemsN.Gas puffing (LFS, HFS, divertor) Extruded PI (40 pellets/shot, LFS, HFS) SMBI (LFS, HFS, H2/D2, He/Ne/Ar) LFS: f =10~60 Hz, time width>0.5ms Gas pressure: 0.3-3.0 MPa HFS: f = 1-5 Hz, 0.2-1.0 MPa
NBILHCD
ECRH2
ECRH1
Introduction : HL-2A Divertor Tokamak

4/15
HL-2AHL-2A
Southwestern Institute of Physics
The 68GHz ECRH System
5#
3#4#
6#
2#
1#
6 gyrotrons (4/68GHz/500kW/1s and 2/68GHz/500kW/1.5 s )ECW injected from low field side, O-mode, 2nd harmonic X-mode, from 2 ports
Gyrotrons from GYCOM/Russia outpower Modulation: frequency is 10~50 Hz; duty cycle is 10~100 %
Heating:

5/15
HL-2AHL-2A
Southwestern Institute of Physics
On-axis & off-axis heating
Current drive
Heating: ECW launcher
antenna 2# for two wave beamsSteerable Remote controllable
antenna 1# for four wave beamsA fixed focusing mirror;Port: 350mm in diameter
Injection angle of antenna 2#: 00-300 tor. and pol.
Beam radius: 37mm in the center of plasma

6/15
HL-2AHL-2A
Southwestern Institute of Physics
The NBI SystemHeating:
Particle energy: ~ 35KeV Deuterium atom, 4 ion sources
Injection angle : 580 toroidally.
NBI power achieved: ~ 800kW

7/15
HL-2AHL-2A
Southwestern Institute of Physics
To have a good wall condition:
1: the surface of the shielding plates of MP1 and MP2 has been covered with carbon fibre composite(CFC), which can protect the first wall, and effectively avoid the splash of heavy metal impurity.
Requirements
:
to reduce PLH threshold
D2 as working gas;
LSN divertor configuration;
Ion magnetic gradient drift towards the lower X-point

8/15
HL-2AHL-2A
Southwestern Institute of Physics
Main parameters: Ip=310 kA , Bt=2.35 T ne=1.35×1013 cm-3
After siliconization, the impurity
fluxes released from the first
wall were reduced, especially
the oxygen and high Z
impurities;
The total radiated power was decreased much.
GDC and Siliconization
D2 glow discharge cleaning is applied to remove impurities from the wall, and helium GDC for removing residual H2/D2
Siliconization by DC glow discharge with a gas mixture of 90% He + 10% SiD4
titanium gettering in the divertor region
Requirements
:

9/15
HL-2AHL-2A
Southwestern Institute of Physics
Discharge control
Horizontal displacement presets to be
1 cm inwards, during NBI heating Divertor configuration within 20 ms;
to reduce impurity and radiation
level;
configuration analyses/reconstruction
Requirements
:
The plasma surface interaction is usually strong in HL-2A due to the thin throats( <2 cm) between the dome and the buffer plates.
careful analyses on the MHD equilibrium were performed with the EFIT code before the experiment was conducted, and configuration reconstruction is routinely performed to monitor the variation of the separatrix.

10/15
HL-2AHL-2A
Southwestern Institute of Physics
First H-mode operation is achieved in 2009 spring experiments
NBI and 2nd X-mode ECRH at Bt~1.3T
the cutoff of ECW at ne> 2.21019 m-3
The discharge enters L-mode phase after PECRH=0.6 MW at t = 260 ms with obvious density pumping out
L-H transition occurs after PNBI=0.7 MW soon near t = 350 ms
The H-mode easily appears after power reaches its threshold
H-mode sustains 550ms until auxiliary heating power ended
Results:

11/15
HL-2AHL-2A
Southwestern Institute of Physics
0
200
400
I p(k
A)
0
2
3.5
n e(E
13
)
0
24
48
72
Wdia(k
J)
0
690
1380
PN
BI(k
W)
time (ms)0
690
1380
PE
CW
(kW
)
0
250
500
750
Pra
d(k
W)
0
2.5
5
D-d
iv(a
u)
0
2.5
5
SM
BIc
trl(
V)
time (ms)
0 200 400 600 800 10000
2.5
5
GP
ctr
l(V
)
shot 15464
Results:
NBI and O-mode ECRH at Bt~2.4T
Realized in 2011 spring
the cutoff of ECW at ne> 4.31019 m-3
Density feedback
Plasma parameters are higher than those of NBI and 2nd X-mode ECRH at Bt~1.3T

12/15
HL-2AHL-2A
Southwestern Institute of Physics
Two H-mode phases induced by the SMBI fueling
The ELMs appear at 640 ms with ne=1.81019 m-3, rising for 30 ms.
The ELMs are sustained for 100 ms and then disappear after the SMBI is turned off and due to the cutoff of ECRH power at ne>2.21019 m-3.
The stored energy, the density and radiation power rise again after the SMBI fuelling is added again at t = 770 ms with ne=1.51019 m-3.
The process is repeated by using SMBI fuelling. The clear ELM appears at 793 ms with a density ~1.71019 m-3 and disappears at 851 ms, 8 ms after the NBI heating is turned off.
The overall discharge exhibits a series of L-H-L-H-L transitions induced with SMBI fueling.
155
165
I p (kA
)
1.52.02.5
n e(m-3
)
0400800
P(k
W)
100200300
Pra
d(kW
)
102030
WE (
kJ)
24
SM
BI
400 500 600 700 800 9000
0.5
1
t (ms)
D di
v(a.u
.)
0.050.1
0.15
D
, s (a.
u.)
1019
(g)
(h)
(f)
(e)
(b)
(d)
(a)
shot 11565
ECRH(c) NBI
Results:

13/15
HL-2AHL-2A
Southwestern Institute of Physics
About Type-III ELMs
590 600 610 620 630 640 650 660 670 680 690 700
0.20.40.60.8
11.2
Shot 16125
time/ms
Da
-Div
/a.u
.
590 600 610 620 630 640 650 660 670 680 690 700
1
2
3
4
time/ms
perio
d/m
s
~1ms
~3ms
in this shot, ELM frequency decreases with heating power increasingType III ELMs
Results:
Ptot (MW)
Per
iods
of E
LM
s (m
s)
The time intervals of ELMs tend to increase with total heating power, thus ELM frequency decreases correspondingly, Type III ELMs.
The periods are irregular in the range of 0.6-3.4 ms.
The periods should rely on edge plasma pressure and density profiles even if the heating power and line-averaged density are fixed.
Power step rise

14/15
HL-2AHL-2A
Southwestern Institute of Physics
Psep=Paux+Pohm-Prad-dW/dt
ELM frequency:100-400Hz
ELM frequency increases with Psep increasing, that Type-I ELM
ΔW=2-4J
ELMs crash modulate the electron density and Ip
ELMs cause the energe loss 6-12% of stored energy
About Type-I ELMs(large ELMs)
500 600 700 800 900 1000 1100 12000
200
400
600
800
1000
1200
1400
Psep/kW
f ELM
/Hz
Data in 2010 spring experiments

15/15
HL-2AHL-2A
Southwestern Institute of Physics
Some large ELMs have periods of 10-30 ms with energy loss more than 10 %
large ELMs have obvious perturbation to plasma current, Te and ne at plasma edge as well
680 682 684 686 688 69025
26
27
time(ms)680 682 684 686 688 690
0
0.8
1.6
600 610 620 630 640 65027
31
35
time(ms)600 610 620 630 640 650
0
1.2
2.4
D-divWE(kJ) #11616
D-divWE(kJ) #13723
Results: Comparison of Type-I &Type-III ELMs
0.1
1.3
D-d
iv
25.8
26.5
Wdia(k
J)
161
164
Ip(k
A)
1.7
2
n e(E
13
)
Ne
1(a
u)
600 610 620 630 640 650
EC
E 14(a
u)
time(ms)
shot 11616
r/a~0.6
r/a~0.8
0.2
1.9
D-d
iv
27.5
33.4
Wdia(k
J)
177
181
Ip(k
A)
1.4
1.7
n e(E
13
)
Ne
1(a
u)
600 610 620 630 640 650
EC
E 14(a
u)
time(ms)
shot 13723
r/a~0.6
r/a~0.8

16/15
HL-2AHL-2A
Southwestern Institute of Physics
Density pedestal width
Type-I(large) ELMy H-mode MW reflectometry and Langmuir probes for pedestal widthPedestal density is 1.25×10¹⁹ m-3 with nped/ne = 0.6Density pedestal width is about 2.8 cm
15 20 25 30 35 40 45 500
0.2
0.4
0.6
0.8
1
1.2
1.4
1.6
1.8
Shot#14052
r(cm)
ne(1
019
m-3
)
RLP
MWR, 650msMWR, 350ms
PSep.
HPed
~1.251019m-3
LFS
H-mode
Gradient
WPed
~2.8cm
Ohmic regime
a=38cmResults: Density pedestal width is about 3 cm
0.1
1.9
D-d
iv
26.6
30.7
Wdia(k
J)
172
174
Ip(k
A)
1.8
2.2
n e(E
13
)600 620 640 660 680 700
Ne
1(a
u)
time(ms)
shot 14052
r/a~0.6
r/a~0.8

17/15
HL-2AHL-2A
Southwestern Institute of Physics
Characteristics of ELMy H-mode
1.2 1.4 1.6 1.8 2.00.8
1.2
1.6
Ptot
4 Pth
P (
MW
)ne (1019 m-3)
Results: About PLH power
No large difference in PLH with ECH
PLH-ASDEX is about twice as the prediction of the scaling law;the HL-2A H-mode runs at low density,so needs more power, and ECRH is different from NBI at low density;discharge conditions be optimized

18/15
HL-2AHL-2A
Southwestern Institute of Physics
dwell time of L-H mode transition with total heating power
There is a dwell time between additional heating and the L-H transition
The dwell time tends to drop with power rising
The time is about 200 ms for low power discharge and only needs 20 ms for higher one
Powerful heating can decrease the dwell time
The dwell time also depends on plasma density after heating power is fixed
1.2 1.4 1.60
100
200
300
Dw
ell t
ime
(ms)
Ptot (MW)
Results:

19/15
HL-2AHL-2A
Southwestern Institute of Physics
delay time of H-L transition versus total heating power
No clear power dependence is observed to the delay time.
The transient transition to L-mode is observed in wide range of heating power.
Typical delay time is 10-30 ms, which is the same order as energy confinement time.
1.2 1.4 1.60
20
40
60
Del
ay ti
me
(ms)
Ptot (MW)
Results:

20/15
HL-2AHL-2A
Southwestern Institute of Physics
Energy confinement time versus plasma current
The confinement time is close to linear increase with plasma current, consistent with theoretic prediction.
Most H-mode discharges are conducted at Ip = 160 kA for the last campaign.
The confinement time should change with density and heating power even if the current remains invariant.
120 140 160 180 2000
5
10
15
20
25
30
Ip (kA)
τ E (
ms)
Results:

21/15
HL-2AHL-2A
Southwestern Institute of Physics
Energy confinement time with plasma density at Ip=160 kA
Energy confinement time is close to linear increase with plasma density.
The maximum line-averaged density is 2.31019 m−3 limited by the second harmonic X-mode ECRH, which in turn limits the density to be smaller than 1.71019 m−3 before L-H transition.
Low density may increase L-H power threshold.
No contrast of confinement time for the same density range between the L-mode and H-mode
0.5 1 1.5 2 2.50
5
10
15
20
25
τ E (
ms)
en (1019m-3)
Results:

22/15
HL-2AHL-2A
Southwestern Institute of Physics
Energy confinement time with total heating power at Ip=160 kA
The confinement time of H-mode clearly decreases with total heating power.
The scaling law of confinement time with total heating power has not been verified due to enough experimental data.
The L-mode confinement time tends to decrease with increase of the heating power, consistent with the prediction by the scaling law of ITER89-P
Ptot (MW)
τ E (
ms)
Results:

23/15
HL-2AHL-2A
Southwestern Institute of Physics
H-factor of energy confinement time with Ptot at Ip=160 kA
The H-factor tends to decrease with total heating power.
It is changed from 1.5 at low heating power to 1.1 at higher one.
The L-mode confinement decreases with the heating power too.
The H-factor of L-mode is a little larger than unit at low heating power and lower than unit for higher one.
The H-mode clearly has higher confinement than the L-mode at the same heating power.
1 1.2 1.4 1.60.4
0.6
0.8
1
1.2
1.4
1.6
Ptot (MW)
HIT
ER
89
Results:
24/15
HL-2AHL-2A
Southwestern Institute of Physics
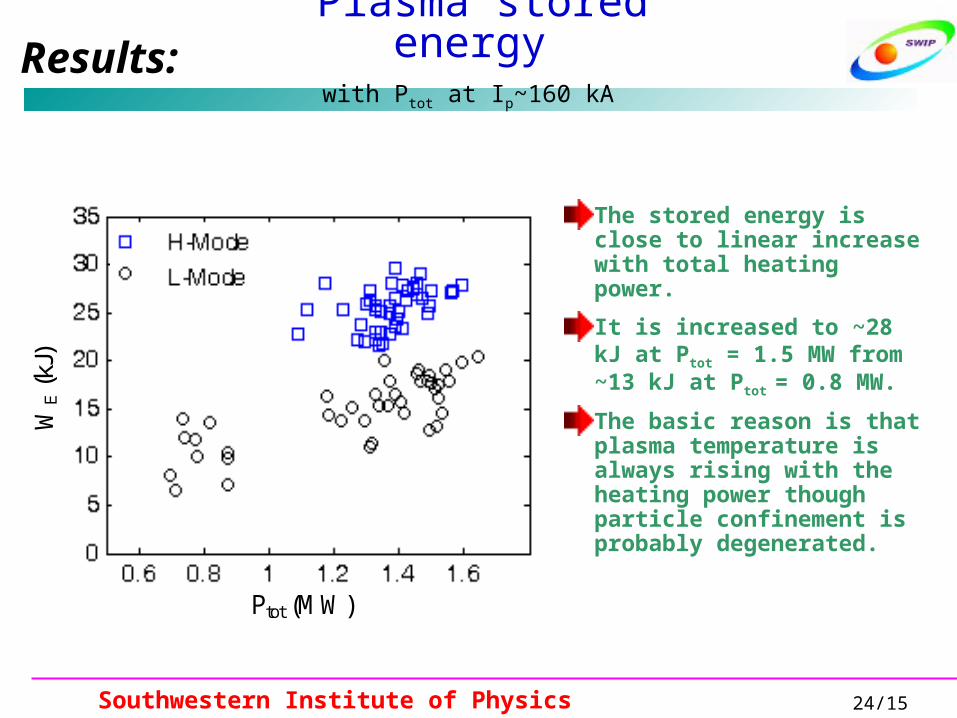
Plasma stored energy with Ptot at Ip~160 kA
The stored energy is close to linear increase with total heating power.
It is increased to ~28 kJ at Ptot = 1.5 MW from ~13 kJ at Ptot = 0.8 MW.
The basic reason is that plasma temperature is always rising with the heating power though particle confinement is probably degenerated.
Ptot (MW)
WE (k
J)
Results:

25/15
HL-2AHL-2A
Southwestern Institute of Physics
SMBI(He gas) mitigation
450 500 550 600 650 700
0.2
0.4
0.6
0.8
Shot 16308
time/ms
Da
-Div
/a.u
.
450 500 550 600 650 700
12345
time/ms
perio
d/m
s
PI monitor
540 560 580 600 620 640 660 680 700 720
0.2
0.4
0.6
0.8
1
Shot 15596
time/ms
Bo
lo-D
iv/a
.u.
540 560 580 600 620 640 660 680 700 720
1
2
3
time/ms
pe
rio
d/m
s
D2-pellet injection
SMBI/PI effect on ELMsProf. Yao talked this mourning
Results:

26/15
HL-2AHL-2A
Southwestern Institute of Physics
Precursors of type-I ELMs
The Spectrogram of the ELM precursors from magnetic probe (LFS) and soft-X ray (edge channel). The divertor Dα indicates the onset of ELM.
(a)
(b)
(c)Time/ms
Fre
quen
cy/k
Hz
shot 15884
1 2 3 4 5 6 7 80
50
100
150
200
250
300
600 610 620 630 640 65010
20
30
600 610 620 630 640 6500
0.02
0.04
I Ha02
600 610 620 630 640 6500
1
2
I Div
Imp2
Results:

27/15
HL-2AHL-2A
Southwestern Institute of Physics
qa effect on ELMs
3
203
403
603
803
1003
1203
1403
3.5 3.7 3.9 4.1 4.3 4.5 4.7
qa
ave
rag
ed
freq
ue
ncy/H
z
in this shot, Ip increased → qa decreased
qa decreasing→ ELMy ampilitude decreasing, ELMy frequency decreasing
Ip, Bt scanning → qa changing(shot by shot)
ELMs frequency is proportional to qa
On JET for type I ELMs, q95↑→ELMy frequency↑, amplitute↓
Results:

28/15
HL-2AHL-2A
Southwestern Institute of Physics
ELMs if He is puffed from divertor
65
130195
I p(k
A)
0.8
1.6
2.4
n e(E
13
)
0
13
26
39
Wdia(k
J)
0
690
1380
PN
BI(k
W)
time (ms)0
690
1380
PEC
W(k
W)
0
190
380
570
Pra
d(k
W)
0
2.5
5
D-d
iv(a
u)
0
2.5
5
SM
BIc
trl(
V)
time (ms)
0 100 200 300 400 500 600 700 800 9000
2.5
5
GP
ctr
l(V
)
shot 16462
Results:
0
1.6
D-d
iv
29.3
36.6
Wdia(k
J)
170
175
Ip(k
A)
1.8
2.1
n e(E
13
)
Ne
1(a
u)
650 660 670 680 690 700 710 720 730
EC
E 14(a
u)
time(ms)
shot 16462
r/a~0.6
r/a~0.8
in experiments of target detachment, He
Type-I ELMs may be easily excited if gas is puffed from divertor chamber

29/15
HL-2AHL-2A
Southwestern Institute of Physics
r/a=0.8
r/a=0.06
r/a=0.75
r/a=0
Quiescent H-mode?
Carbon impurity
Horizontal displacement
ELM-free H-mode Results:
400 500 600 700 8000.4
0.6
0.8
1
1.2
1.4
time / ms
H fa
ctor
H98y2
H89
400 500 600 700 80019
19.5
20
20.5
21
21.5
22
22.5
time / ms
/ m
s
tau 98y2
tau 89L
H-factor
Energy confinement time

30/15
HL-2AHL-2A
Southwestern Institute of Physics
Edge Harmonic Oscillation (EHO)
m/n=3/1
Mirnov Coil
EHO?
m/n=3/1EHO?
m/n=2/1
m/n=3/2
NTM
Soft X-ray
ECE
m/n=2/1
Results:

31/15
HL-2AHL-2A
Southwestern Institute of Physics
Summary
ELMy H-modes have been achieved by combination of
NBI and ECRH with 2nd harmonic X-mode at Bt~1.3T
NBI and ECRH with O-mode at Bt~2.4T
The minimum power threshold is about 1.0 MW.
The energy loss is smaller than 3 % by a type-III ELM
type-I ELMs result in more energy loss and obvious drop of Ip
There is a dwell time of L-H transition in 20-200 ms, which tends to decrease with power increasing.
Typical delay time of H-L transition is comparable with the energy confinement time, such as 10-30 ms.
The confinement time of H-mode discharges increases with Ip and density, but it decreases with total heating power.
ELM control/mitigation experiments by using SMBI/PI

32/15
HL-2AHL-2A
Southwestern Institute of Physics
Plans in near future years1 MW ECRH at 140GHz
Another NBI beamline with 2MW power
LHCD
Wall conditioning by Lithium vaporization
L-H transition physics
Energetic particle phenomena and MHD in H-mode phase
L-H transition by sole Paux of NBI/ECRH/LHCD
Type-I ELM control/mitigation by
SMBI, PI, RMP coil
Steady state ELM-free H-mode/QH-mode exploration
Construction of the new device: HL-2M
33/15
HL-2AHL-2A
Southwestern Institute of Physics
Thanks for you attention !