HJK CONSULTING ENGINEERS
17
HJK CONSULTING ENGINEERS Project Management – Technology – Operating – Consulting Excellence
Transcript of HJK CONSULTING ENGINEERS

HJK CONSULTING ENGINEERSProject Management – Technology – Operating – Consulting Excellence
IRON & STEEL MAKING INDUSTRIESENERGY SAVING POTENTIALSTypical Energy Balance Electric Arc Furnace
HJK Consulting Engineers ©®2018 2
EAF 120 ton(C‐steel scrap)
720 kWh/t Off gas: 220 kWh/t
Slag: 50 kWh/t
Furnace Shell CW: 60 kWh/t
Steel: 385 kWh/t
Radiation loss: 5 kWh/t
Electric Energy: 390 kWh/t
Coal injection: 90 kWh/t
Natural gas: 80 kWh/t
Fossil energy
Combustibles in scrap: 35 kWh/tElectrode combustion: 15 kWh/t
Iron combustion: 70 kWh/t
Al, Si combustion: 40 kWh/t
Additio
nal
energy inpu
t
54.2%
12.5%
11.1%
5.6%
9.7%
2.1%
4.9%
30.6%
53.5%
6.9%
8.3%
0.7%
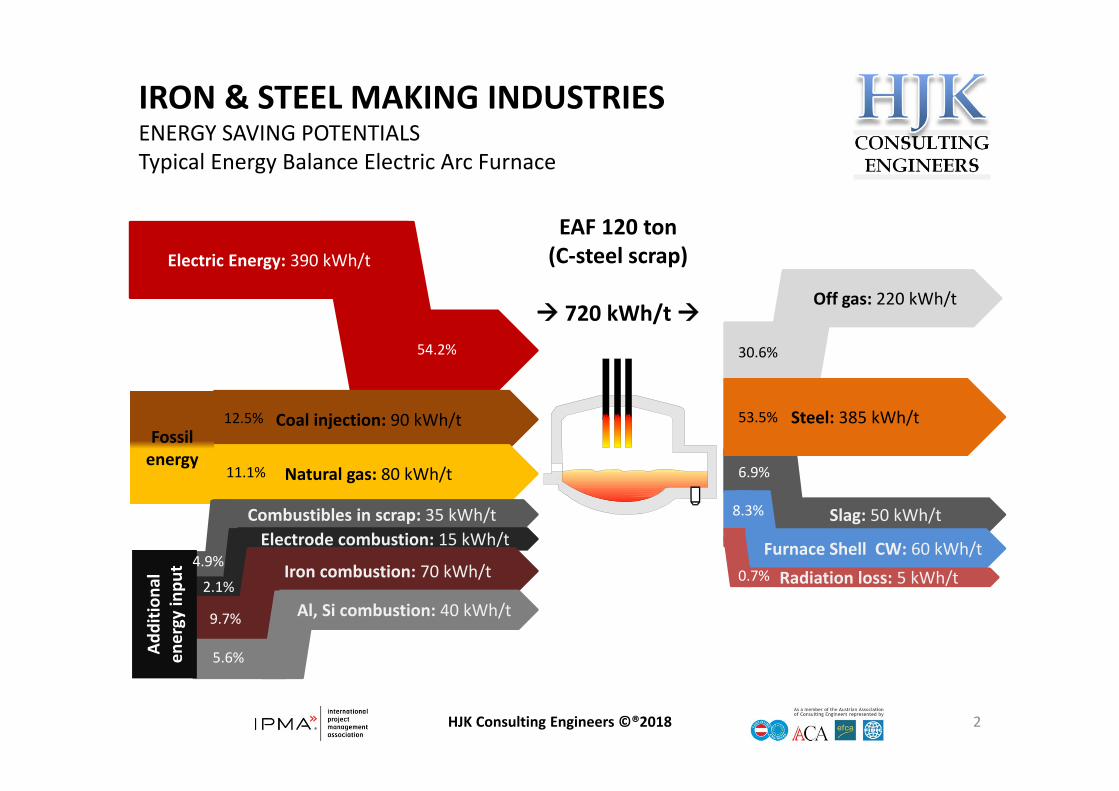
IRON & STEEL MAKING INDUSTRIESENERGY SAVING POTENTIALSTypical Energy Balance Billet/Bloom/Beam Blank CCM
HJK Consulting Engineers ©®2018 3
Heat content of liquid steel: 365 kWh/t
54.2%Spray cooling & exhaust
stem: 139 kWh/t
Radiation heat slab cooling channel: 91 kWh/t
Further heat losses: 26 kWh/t
Residual heat of slabs: 91 kWh/t
Mould cooling: 18 kWh/t

IRON & STEEL MAKING INDUSTRIESENERGY SAVING POTENTIALS ‐ Technologies & Measures (samples), Typical Energy Balance Reheating Furnace
HJK Consulting Engineers ©®2018 4
Heat form fuel (100%) Net heat from steel (46%)
Oxidation heat (3%)
Recupe
rator
Waste gas losses (24%)
Exhaust gas (38%

IRON & STEEL MAKING INDUSTRIESENERGY SAVING POTENTIALS ‐ Technologies & Measures (samples), to adjust according to individual plant findings
HJK Consulting Engineers ©®2018 5
Technology or Measure
Potential Energy Saving Increase in productivity
Potential CO2emission reduction
Cost (estimate)
EAF controls Electric energy consumption ≤ 14%Natural gas consumption ≤ 6%
≤ 34 Kton Co2 p.a.
Improved process control
Electricity savings ≤ 30 kWh/t‐steel Increase ≤ 12%Electrode consumption ‐ ≤ 25%
≤ 18 kg Co2/t‐steel
Oxyfuel burner / lancing
Energy savings 2‐3 kWh/t‐steel per minute heating time reduction
≤ 24 kg Co2/t‐steel Retrofit CAPEX ≤ 5 USD/t
Hot DRI/HBI charging
Melting energy savings ≤ 150 kWh/t‐steel (DRI/HBI ≤ 600 oC)
Foamy slag practices
Net energy savings ≤ 8 kWh/t‐steel ≤ 11 kg Co2/t‐steel Retrofit CAPEX ≤ 16 USD/t
Bottom stirring, gas injection
Electricity savings from 12 – 24 kWh/t‐steel
≤ 12 kg Co2/t‐steel Retrofit CAPEX ≤ 1 USD/t
CONSTEEL Electricity savings ≤ 60 kWh/t‐steel Increase ≤ 33% ≤ 36 kg Co2/t‐steel Retrofit CAPEX ≤ 8 USD/t
Shaft Furnace (QUANTUM)
Electricity savings ≤ 280 kWh/t‐steel
Increase ≤ 35%Electrode consumption ‐ ≤ 30%
Retrofit CAPEX ≤ 10 USD/t

IRON & STEEL MAKING INDUSTRIESWHP (Waste Heat to Power) ZERO‐EMISSION ELECTRICITY
HJK Consulting Engineers ©®2018 6
Temperature Classification Waste Heat Source Characteristics Commercial Waste Heat to Power Technologies
HIGH>650 oC / 1200 oF
Furnaces Steel electric arc Steel heating Basic oxygen Aluminium reverberators Copper reverberators Nickel refining Copper refining Glass melting
Iron cupolas Coke ovens Fume incinerators Hydrogen plants
High quality heat High heat transfer High power‐generation
efficiencies Chemical and mechanical
contaminants
Waste heat boilers and steam turbines
MEDIUM350 ‐ 650 oC / 500 ‐ 1200 oF
Prime mover exhaust streams Gas turbine Reciprocating engine
Heat‐treating furnaces Ovens Drying Baking Curing
Cement kilns
Medium power‐generation efficiencies
Chemical and mechanical contaminants (some streams such as cement kilns)
Waste heat boilers and steam turbines (>260 oC / 500 oF)
Organic Rankine cycle (<430 oC / 800 oF)
Kalina cycle (<540 oC / 1,000 oF)
LOW<260 oC / 500 oF
Boilers Ethylene furnaces Steam condensate Cooling Water Furnace doors Annealing furnaces Air compressors IC engines Refrigeration condensers
Low‐temperature ovens Hot process liquids or solids
Energy contained in numerous small sources
Low power‐generation efficiencies
Recovery of combustion streams limited due to acid concentration if temperatures reduced below 120 oC / 250 oF
Organic Rankine cycle (>150 oC / 300 oF gaseous streams, 80 oC / 175 oF liquid streams)
Kalina cycle (95 oC / 200 oF)

IRON & STEEL MAKING INDUSTRIESWTE (Waste to Energy) Application Fields
HJK Consulting Engineers ©®2018 7
Field of Application Temperature Range
Low (>100 oC / 212 oF) Medium (<200 oC / 392 oF) High (>2100 oC / 392 oF)
01 – 20 MW
0.2 – 20 MW
0.2 – 15 MW
0.2 – 15 MW
Geothermal
Waste Heat
Biomass &Waste to Energy
CSP Solar
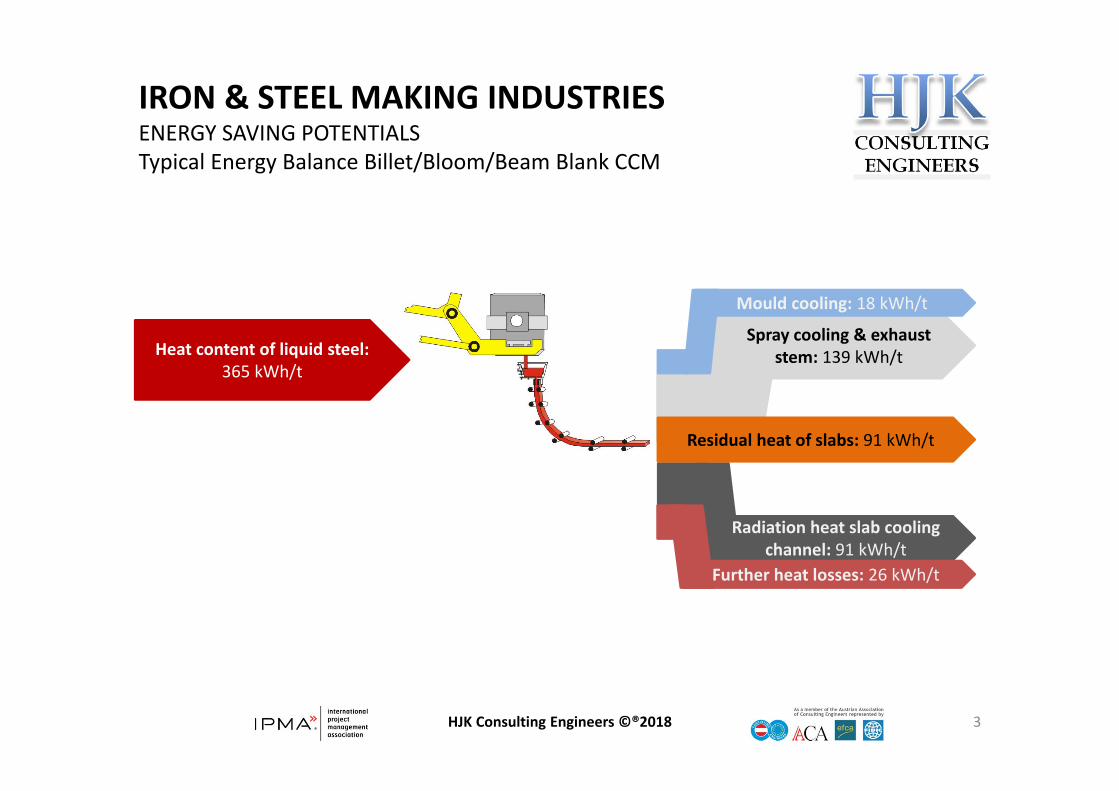
IRON & STEEL MAKING INDUSTRIESENERGY SAVING POTENTIALS ‐ Technologies & Measures (samples), SAMPLE DISTRICT HEATING & COOLING SYSTEM
HJK Consulting Engineers ©®2018 8

IRON & STEEL MAKING INDUSTRIESENERGY SAVING POTENTIALS ‐ Technologies & Measures (samples), SAMPLE Organic Rankine Cycle (ORC) power system
HJK Consulting Engineers ©®2018 9
Steam Turbine
Organic Rankine Cycle (ORC)
generally in the range 200 kW – 10 MW electrical outpute.g. recovery at Elbe – Feralpi ≤720 kWh/tls / pay‐back 5‐6 yearsAverage consumption EAF:‐ 360 – 400 kWh/tls (hot DRI)‐ <400 – 550 kWh/tls (cold DRI, scrap)

IRON & STEEL MAKING INDUSTRIESENERGY SAVING POTENTIALS ‐ Technologies & Measures (samples), SAMPLE STEAM GENERATION (simplified scheme)
HJK Consulting Engineers ©®2018 10

IRON & STEEL MAKING INDUSTRIESENERGY SAVING POTENTIALS ‐ Technologies & Measures (samples), HRSG (heat recovery steam generator)
HJK Consulting Engineers ©®2018 11
Source: http://www.wikipedia.org

IRON & STEEL MAKING INDUSTRIESENERGY SAVING POTENTIALS ‐ Technologies & Measures (samples), Iron & Steel Production life cycle (simplified)
HJK Consulting Engineers ©®2018 12
Basic Oxygen Furnace (BOF)
Blast Furnace (BF)
Electric Arc Furnace (EAF)
Sinter PlantCoking Plant
Ladle Treatment
(Continuous) Casting
Hot Rolling / Plate Mill
Pickling
Cold Rolling Mill
Finishing Mill
Cold Rolled Sheet, Strip, Plate, Pipe & Tube
Hot Rolled Sheet,Strip & Plate
Bar, Rod, Wire, Structural Shapes,Pipe & Tube, Rail, Billet & Bloom
Internal Scrap, Residuals
DRI/HBI
Oxygen
Electricity, Fuels
Bar, Rod, Tubing, Structural Mill
Scrap
Scrap
Scrap
Scrap
Scrap Mill Scale
Mill Scale
Mill Scale
Mill Scale
Mill Scale
Molten IronOxygen
ScrapWaste Oxides
Fluxes, Residuals
CoalCoke Breeze
Molten SteelMolten Steel
Scrap, Slag, Dust, Refractoriesto Recycle
Slag to Reclaim
Iron Ore, Pellets
Coke
ScrapWaste Oxides
Sinter
Dolomite, Limestone
Injectants: Coal, Oil, Oxygen, Natural Gas
External Scrap
Goo
ds m
ade from
steel
Scrap, Slag, Dust,Refractoriesto Recycle

IRON & STEEL MAKING INDUSTRIESENERGY SAVING POTENTIALS ‐ Technologies & Measures (samples), Iron & Steel Production life cycle (simplified)
HJK Consulting Engineers ©®2018 13
road construction and building industries (ballast/fill materials, steel slag asphalt),
binder material and production of cement, agriculture and animal husbandry (soil improvers and horse riding surfaces),
electronics industry (ferrites),
chemical industries (different kinds of raw materials and fertilizer products);
Possibilities of by‐products usage in the metals industry (different kinds of raw material),

IRON & STEEL MAKING INDUSTRIESENERGY SAVING POTENTIALS ‐ Technologies & Measures (samples), Samples on implemented Energy Savings ‐ Excerpt
HJK Consulting Engineers ©®2018 14
Enterprise Investment Savings Source
Tenaris Dalmine Plant EUR 3.8 mill. (2007‐2008) – e.g. high efficiency & frequency controlled motors, energy waste, heat recovery, CHP power plant, etc.
14% reduction in electricity 6% reduction in natural gas(JUN08‐JUL09 vs JUN05‐JUL06)
www.worldsteel.org
Essar Hazira Plant Investment in HBI Cooling system
Water consumption reduction 0.68 m3/ton MAY08 compared to 0.92 3/ton FEB08, savings: 250,000 USD
www.worldsteel.org
HADEED Upgrading natural gas quality Specific consumption savings: 0.97 MBTU/MT equivalent to 8.48% of original gas consumption
www.worldsteel.org
ThyssenKrupp German HRM Advanced burner technology, secondary de‐dusting systems
Specific dust & NOx emission reduction from 1985 to 2005 (2 kg/ton 0.5 kg/ton crude steel produced)
www.worldsteel.org
Usage of slag in different industries like road making, cement, etc.
Production cost of 01 ton Portland Cement generates about 1.2 ton CO2, usage of BF slag containing 50 wt.‐% GGBS generates 0.54 ton CO2Market price BF granulated slag: 75‐79USD/ton; 65 EUR/m3, BOF 38‐40 EUR/ton
www.euroslag.com

IRON & STEEL MAKING INDUSTRIESENERGY SAVING POTENTIALS ‐ Technologies & Measures, ISO 50001 Energy Management System Model (Plan – Do – Check – Act)
HJK Consulting Engineers ©®2018 15
CheckingChecking
Monitoring, measurement & analysis
Monitoring, measurement & analysis
Nonconformities, correction, corrective &
preventive action
Nonconformities, correction, corrective &
preventive actionInternal audit of the EnMSINTERNAL ENERGY MANAGEMENT SYSTEMS Internal audit of the EnMSINTERNAL ENERGY MANAGEMENT SYSTEMS
Management reviewManagement review
Energy policyEnergy policy
Energy planningEnergy planning
Implementation & operation
Implementation & operation
Continuous improvement
Source: www.iso.org

IRON & STEEL MAKING INDUSTRIESENERGY SAVING POTENTIALS ‐ Technologies & Measures, Basic program energy saving audit & implementation
HJK Consulting Engineers ©®2018 16
Information collection
Preliminary Energy Audit
Detailed Energy Audit
Energy Audit Report
Implementation of Energy Conservation
Measures
Agreement to proceed
Energy Services
Agreement
In cooperation with
IRON & STEEL MAKING INDUSTRIESENERGY SAVING POTENTIALS ‐ Technologies & Measures
HJK Consulting Engineers ©®2018 17
Independent, reliable & trustable consultancy service for
YOUR
long‐term success