HIV and Its Impact on the Infant Immune System - MTBI · HIV and Its Impact on the Infant Immune...
19
HIV and Its Impact on the Infant Immune System Antonio Buenrostro * , Katie Diaz † , C. P. Gonz´ ales ‡ , Magdaliz Gorritz § Abstract Many models have been developed which illustrate the interaction between the HIV virus and an adult’s immune system. However, limited work has attempted to explain the interaction between HIV and an infant’s immune system. In this study, we introduce a model that considers the dynamics between CD4 + T cells, CD8 + T cells, and the HIV virus. Analysis of the model gives rise to a threshold parameter, N crit , which is the critical number of new viruses produced by an actively infected CD4 + T cell. Numerical simulations are carried out, and sensitivity analysis is performed on N crit to illustrate the differences between the progression of HIV in infants as compared to that in adults. Keywords: HIV, immunology, CD8 + , CD4 + . 1 Introduction Since the Human Immunodeficiency Virus was discovered in 1983, there have been about 60 million people infected worldwide, and over 4 million children have been infected under the age of 15. In 2003, there were about 5 million newly infected individuals, of which 700,000 were children under the age of 15. There are an estimated 40,000 new HIV infections per year [4], and women consist of 47% of the HIV positive adults [5]. HIV continues to be a threat to the world population, in part because of its harmful effect on the immune system. The immune system is our body’s defense against pathogens (bacteria or viruses), which constantly invade the human body. Some components of the immune system are the bone marrow, thymus, and red and white * San Diego State University † Columbia University ‡ Arizona State University § University of Texas San Antonio 205
Transcript of HIV and Its Impact on the Infant Immune System - MTBI · HIV and Its Impact on the Infant Immune...

HIV and Its Impact on the InfantImmune System
Antonio Buenrostro∗, Katie Diaz†, C. P. Gonzales‡, Magdaliz Gorritz§
Abstract
Many models have been developed which illustrate the interactionbetween the HIV virus and an adult’s immune system. However,limited work has attempted to explain the interaction between HIVand an infant’s immune system. In this study, we introduce a modelthat considers the dynamics between CD4+ T cells, CD8+ T cells,and the HIV virus. Analysis of the model gives rise to a thresholdparameter, Ncrit, which is the critical number of new viruses producedby an actively infected CD4+ T cell. Numerical simulations arecarried out, and sensitivity analysis is performed on Ncrit to illustratethe differences between the progression of HIV in infants as comparedto that in adults.
Keywords: HIV, immunology, CD8+, CD4+.
1 Introduction
Since the Human Immunodeficiency Virus was discovered in 1983, therehave been about 60 million people infected worldwide, and over 4 millionchildren have been infected under the age of 15. In 2003, there were about5 million newly infected individuals, of which 700,000 were children underthe age of 15. There are an estimated 40,000 new HIV infections per year[4], and women consist of 47% of the HIV positive adults [5]. HIV continuesto be a threat to the world population, in part because of its harmful effecton the immune system.
The immune system is our body’s defense against pathogens (bacteriaor viruses), which constantly invade the human body. Some componentsof the immune system are the bone marrow, thymus, and red and white
∗San Diego State University†Columbia University‡Arizona State University§University of Texas San Antonio
205
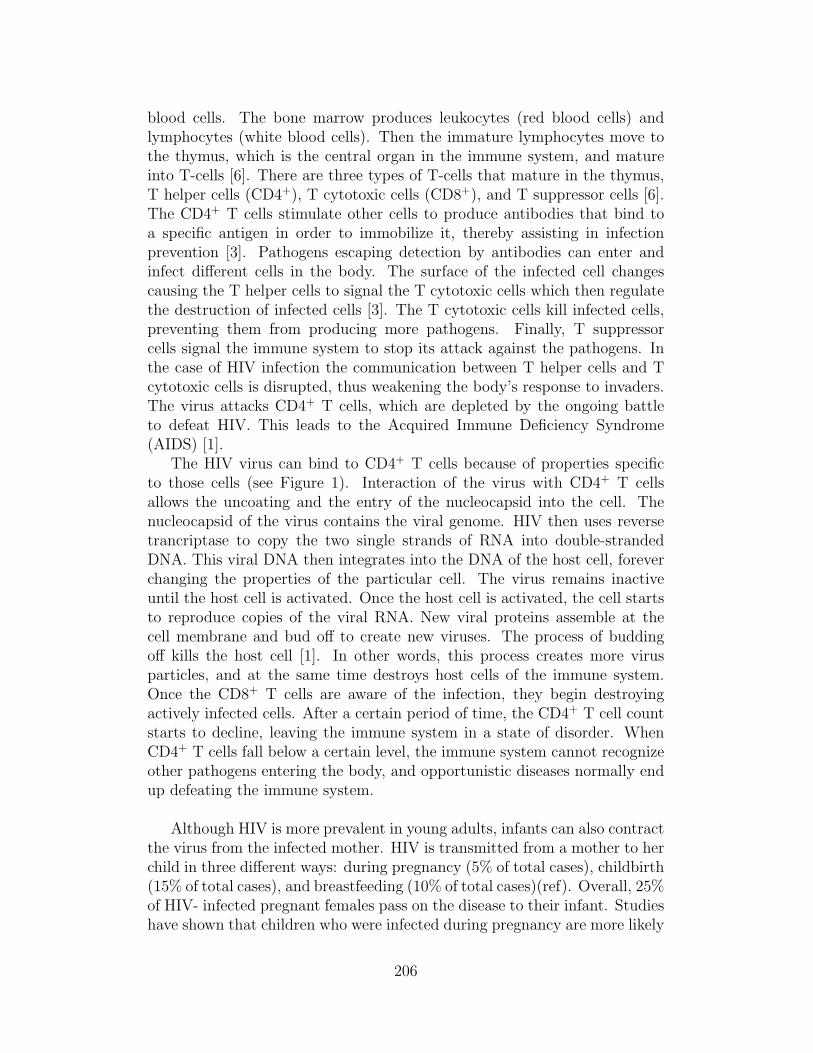
blood cells. The bone marrow produces leukocytes (red blood cells) andlymphocytes (white blood cells). Then the immature lymphocytes move tothe thymus, which is the central organ in the immune system, and matureinto T-cells [6]. There are three types of T-cells that mature in the thymus,T helper cells (CD4+), T cytotoxic cells (CD8+), and T suppressor cells [6].The CD4+ T cells stimulate other cells to produce antibodies that bind toa specific antigen in order to immobilize it, thereby assisting in infectionprevention [3]. Pathogens escaping detection by antibodies can enter andinfect different cells in the body. The surface of the infected cell changescausing the T helper cells to signal the T cytotoxic cells which then regulatethe destruction of infected cells [3]. The T cytotoxic cells kill infected cells,preventing them from producing more pathogens. Finally, T suppressorcells signal the immune system to stop its attack against the pathogens. Inthe case of HIV infection the communication between T helper cells and Tcytotoxic cells is disrupted, thus weakening the body’s response to invaders.The virus attacks CD4+ T cells, which are depleted by the ongoing battleto defeat HIV. This leads to the Acquired Immune Deficiency Syndrome(AIDS) [1].
The HIV virus can bind to CD4+ T cells because of properties specificto those cells (see Figure 1). Interaction of the virus with CD4+ T cellsallows the uncoating and the entry of the nucleocapsid into the cell. Thenucleocapsid of the virus contains the viral genome. HIV then uses reversetrancriptase to copy the two single strands of RNA into double-strandedDNA. This viral DNA then integrates into the DNA of the host cell, foreverchanging the properties of the particular cell. The virus remains inactiveuntil the host cell is activated. Once the host cell is activated, the cell startsto reproduce copies of the viral RNA. New viral proteins assemble at thecell membrane and bud off to create new viruses. The process of buddingoff kills the host cell [1]. In other words, this process creates more virusparticles, and at the same time destroys host cells of the immune system.Once the CD8+ T cells are aware of the infection, they begin destroyingactively infected cells. After a certain period of time, the CD4+ T cell countstarts to decline, leaving the immune system in a state of disorder. WhenCD4+ T cells fall below a certain level, the immune system cannot recognizeother pathogens entering the body, and opportunistic diseases normally endup defeating the immune system.
Although HIV is more prevalent in young adults, infants can also contractthe virus from the infected mother. HIV is transmitted from a mother to herchild in three different ways: during pregnancy (5% of total cases), childbirth(15% of total cases), and breastfeeding (10% of total cases)(ref). Overall, 25%of HIV- infected pregnant females pass on the disease to their infant. Studieshave shown that children who were infected during pregnancy are more likely
206

Figure 1: Life Cycle of the HIV virus
to progress faster to AIDS than children who were infected during childbirthand breastfeeding. Women are the fastest growing population of new HIVcases thus making more newborns vulnerable to the disease. However, theprogression of HIV in infants has not been the focus for mathematical models.
There are numerous mathematical models which study the behavior of theHIV virus at a cellular level in an adult’s immune system. These models ([11,13]) focus on the interaction of HIV and the immune system in adults Bothmodels use a deterministic approach to help understand how HIV progressesin the human body.
In our model, we compare the invasion of HIV in an adult’s immunesystem to an infant’s immune system. In order to gain insight into thedifference between systems, we rely on numerical simulations and analysis ofthe threshold parameter.
2 The Model
There are numerous features of the HIV life cycle, and its interaction withCD4+ and CD8+ T cells we wish to account for in our model. To modelthese events, we consider CD8+ T cells, uninfected CD4+ T cells, latentlyinfected CD4+ cells, actively infected CD4+ T cells, and the free HIV virusparticles. One should note that we are using a deterministic model, whichdoes not account for the very early stages of infection. The dynamics of theearly stages of the disease can be captured more accurately through the useof a stochastic model.
207

Figure 2: The Model
Let TK denote the concentration of CD8+ T cells, TH denote the concen-tration of uninfected CD4+ T cells, TL denote the concentration of latentlyinfected CD4+ T cells, TI denote the concentration of actively infected CD4+
T cells, and V denote the concentration of free infectious virus particles. Wehave derived the following system of nonlinear ODE’s to describe the dynam-ics of our model.
TK = s1 − µKTK + rKTK
(1− TK
TKmax
)(1)
TH = s2 − µHTH − kV TH + rHTH
(1− TH + TL + TI
THmax
)(2)
TL = kV TH − µHTL − aTL (3)
TI = aTL − µITI − δTITK (4)
V = NµHTI − kV TH − µV V (5)
In equations (1) and (2), s1 and s2 are source terms and represent the rateof generation of new CD8+ and CD4+ T cells respectively, from precursorsin the thymus.
Furthermore, other terms in equations (2) and (3) deal with the dynamicsof HIV. For instance, the term kV TH is the rate at which free virus infectsCD4+ T cells. When a T cell is infected, it becomes latently infected, meaningthe T cell is not actively producing more virus particles or harming other
208

Variables and Parameters DescriptionTH Uninfected CD4+ T cellsTK Uninfected CD8+ T cellsTL Latently infected CD4+ T cellsTI Actively infected CD4+ T cellsV Free viruss1 Number of CD8+ T cells supplied by the thymuss2 Number of CD4+ T cells supplied by the thymusrK Replication rate of CD8+ T cellsrH Replication rate of CD4+ T cells
TKmax Maximum number of CD8+ T cellsTHmax Maximum number of CD4+ T cells
µK Natural death rate of CD8+ T cellsµH Natural death rate of CD4+ T cellsµV Natural death rate of virus cellsk Rate at which CD4+ T cells become latently infecteda Rate at which latently infected CD4+ T cells become actively infectedN Average number of free virus produced by the death CD4+ T cellsδ Rate at which CD8+ T cells kill the actively infected CD4+ T cells
Table 1: Variables and Parameters.
cells. Therefore, kV TH is subtracted from equation (2) because equation(2) corresponds to the dynamics of the CD4+ T cells, and added to (3),which describes the behavior of the latently infected T cells. Equation (4)models the actively infected T cells. This considers the term aTL whichis the rate that latently infected cells are becoming actively infected. Onthe other hand, δ is the rate at which CD8+ T cells kill actively infectedCD4+ T cells. Equation (5) models the free infectious virus population. Anactively infected CD4+ T cell produces an average of N virus particles whenit dies from infection. In the absence of virus, the T-cell population hasthe steady state value T0. Initial conditions for this system of equations areTK(0) = TK0, TH(0) = TH0, TL(0) = 0, TI(0) = 0, and V (0) = V0 for virusfree infection.
Also, it is known that there is a bound on the total number of T cellsin the body. The logistic type terms in (1) and (2) ’shut off’ the growthof T cells as the maximum population level is approached. We assume therate at which CD8+ and CD4+ T cells replicate is larger than their deathrate, meaning rK > µK , and rH > µH . We also assume that every cell thatbecomes infected must be latently infected before becoming actively infected.The last assumption is the death, the replication, and the infection rates ofthe cells whether they are CD8+ or CD4+ T cells are the same in the infantpopulation and in the adult population. The definitions of parameters and
209

Variables and Parameters Infants Adults UnitsTH 1500 1200 mm−3
TK 600 600 mm−3TL 0 0 mm−3
TI 0 0 mm−3
V 0 0 mm−3
s1 0.05 0.02 day−1mm−1
s2 0.03 0.01 day−1mm−1
rK 0.228 0.228 day−1
rH 0.456 0.456 day−1
TKmax 1200 800 mm−3
THmax 2000 1600 mm−3
µK 0.03 0.03 day−1
µH 0.01 0.01 day−1
µV 0.05 0.05 day−1
k 0.0095 0.0095 mm3
a 0.06 0.06 mm3
N 100 500 Variesδ 0.000095 0.000095 mm3
Table 2: Default Parameter and Initial Conditions
values are given in Table 1.First, we wish to remark that our model is well posed in the sense that
the populations do not become negative, and the populations are bounded.Also, the nonnegative orthant is positively invariant, that is, any trajectorythat starts in the nonnegative orthant remains there for all time. This resultstates that on each hyperbolic plane bounding the nonnegative orthant thevector fields point into R5
+ = {x ∈ R5|x ≥ 0}. For our model we have:
dTK
dt
∣∣∣TK=0
= s1 ≥ 0
dTH
dt
∣∣∣TH=0
= s2 ≥ 0
dTL
dt
∣∣∣TL=0
= kV ∗T ∗H ≥ 0
dTI
dt
∣∣∣TI=0
= aT ∗L ≥ 0
dV
dt
∣∣∣V =0
= NµhT∗I ≥ 0
210

Within the nonegative orthant, there exists two steady states. One whenthere is no virus present, a virus free steady state, and another with a constantlevel of virus, an endemically infected steady state.
The virus free steady state occurs at V ∗ = T ∗L = T ∗
I = 0 and
T ∗K =
1
2
(1− µk
rk
)Tkmax
[1 +
√1 + 4
s1rk
(rk − µk)2Tkmax
](6)
T ∗H =
1
2
(1− µh
rh
)Thmax
[1 +
√1 + 4
s2rh
(rh − µh)2Thmax
](7)
If V %= 0 then we have an endemically infected steady state with the followingcoordinates:
T ∗K =
θ1 +√
θ21 + 4s1p1
2p1(8)
T ∗H =
µvψπ
kη(9)
T ∗L =
µvπV ∗
η(10)
T ∗I =
aµvV ∗
η(11)
V ∗ =s2(kη)2 + µvψπ[θ2kη − p2ψπµv]
kµvψπ[kη + (π + a)µv](12)
with
θ1,2 = rk,h − µk,h
p1,2 =rk,h
Tkmax,hmax
ψ = a + µh
π = µh + δT ∗K
ρ = µv + kT ∗H
η = aµh(N − ξ)
and where
ξ =ψπ
aµh
211

2.1 Stability of Virus Free Steady State
Linearizing our system around the virus free steady state gives the followingJacobian matrix
J(V F ) =
θ1 − 2p1T ∗
K 0 0 0 00 θ2 − 2p2T ∗
H −p2T ∗H −p2T ∗
H −kT ∗H
0 0 −ψ 0 kT ∗H
0 0 a −π 00 0 0 NµH −ρ
where the analysis only relies on the fact that T ∗
K , T ∗H > 0. It follows
that the virus free steady state is asymptotically stable if and only if all ofthe eigenvalues of J have negative real part. The eigenvalues are determinedwith the characteristic equation p(λ) = det(λI−A) = 0. For J we have
p(λ) = (λ + d1)(λ + d2)(λ3 + a1λ
2 + a2λ + a3) = 0 (13)
The first two solutions are
λ1 = −d1 = −√
(rK − µK)2 + 44s1rK
TKmax< 0
and
λ2 = −d2 = −√
(rH − µH)2 + 44s2rH
THmax< 0
It is clear that λ1 and λ2 have negative real part. Finally, we are left to verifythat
λ3 + a1λ2 + a2λ + a3 (14)
has roots whose real portion is negative, where
a1 = 2µH + a + µV + δT ∗K + kT ∗
H (15)
a2 = T ∗Kδ(µH + KT ∗
H + a + µV ) + µH(a+
2µV + 2KT ∗H + µH) + akT ∗
H + aµV(16)
a3 =(a + µH)(µV + kT ∗
H)(µH + δT ∗K)
aµHkT ∗H
−N (17)
To verify that the real parts of the roots of (14) are negative, we use theRouth-Hurwitz criteria. which states that if (18)-(20) hold then (14) has
212

roots with negative real parts.
a1 > 0 (18)
a3 > 0 (19)
a1a2 > a3 (20)
Clearly, (18) holds since all of the parameters are positive. Also, it is easilyshown that (20) holds, but the resulting equation is long (see appendix).Hence, we are left to verify (19), which holds when
N <(a + µH)(µV + kT ∗
H)(µH + δT ∗K)
aµHkT ∗H
= Ncrit (21)
Thus, the virus free steady state is locally asymptotically stable when N <Ncrit.
2.2 Global Stability of Virus Free Steady State
The above analysis only deals with the local stability of the virus free steadystate. When N < Ncrit there exists only one steady state in the nonnegativeorthant and, through the method of Lyapunov, we will show that this steadystate is globally stable. To do this, we construct a scalar function L(t), suchthat
L(x∗) = 0dL
dt< 0
and for x %= x∗
L(x) > 0
where x∗ is the equilibrium in question.Let us consider the following function, which we will see is a Lyapunov
function
L(t) = TL + NTI + V (22)
Observe, in the nonnegative orthant L(t) ≥ 0
By substituting equations (3) and (4) into L(t) we obtain,
dL
dt= TL[a(N − 1)− µH ]−NδTITK − µV V (23)
we can clearly see that if the term in brackets is negative, then dLdt will be
negative definite.
213

Thus, when
N <µH
a+ 1
dLdt < 0. Furthermore, as t→ ∞, L(t) → 0, TL, TI and V all approach 0.Hence, the solution is globally stable.
2.3 Existence and Stability of Endemically InfectedSteady State
At N = Ncrit, the virus free steady state and the infected steady statecoincide. Furthermore, there is a transcritical bifurcation at N = Ncrit,and the infected state emerges when N > Ncrit as a new steady state in R5
+.When N < Ncrit the infected steady state does not lie in R5
+ and hencedoes not make sense biologically. Thus, it is only necessary to analyze thestability of the infected steady state for
N > Ncrit > ξ
Linearizing our system around the infected steady state gives the followingJacobian Matrix, where the first row is zeros except for the one of theeigenvalues
J(EI) =
−β −p2T ∗
H −p2T ∗H −kT ∗
H
kV ∗ −ψ 0 kT ∗H
0 a −α 0−kV ∗ 0 Nµh −ρ
(24)
where
β = φ2 + rh
(1− T ∗
H + T ∗L + T ∗
I
THmax
)ρ = µv + kT ∗
H
and T ∗K , T ∗
H , T ∗L, T ∗
I and V ∗ are given in (8)-(12).Once more, we wish to determine the eigenvalues of (24). Examining the
characteristic polynomial det(A− λI), we find it has the form:
p(λ) = (λ + d1)(λ4 + a1λ
3 + a2λ2 + a3λ + a4)
where the first root is
λ1 = −d1 = −√
(rK − µK)2 + 4s1rK
TKmax< 0
214

whose real part is clearly negative. For
(λ4 + a1λ3 + a2λ
2 + a3λ + a4) (25)
we have
a1 = ρ + ψ + β + α (26)
a2 = KV ∗T ∗H(p2 −K) + ψ(a + ρ + β) + α(β + ρ) (27)
a3 = KV p2T∗H(α + ρ + a− T ∗
HK)−K2V ∗T ∗H(α + ψ)−
KT ∗H(aNµh + KV ∗α + KV ∗ψ) + βρ(α + ψ) + ψαρ
(28)
a4 = KV T ∗H(ap2ρ + KaNµH − p2T
∗Hkψα− ap2T
∗HK)+
KT ∗H(V ∗p2αρ− βµHaN) + βψαρ
(29)
To establish the stability of the infected steady state it is necessary to verifythat all of the roots of (25) have negative real part. To this end, we use theRouth-Hurwitz criteria, which in this case states that if
a1 > 0 (30)
a2 > 0 (31)
a1a2 > a3 > 0 (32)
a1a2a3 − a23
a21
> a4 > 0 (33)
hold then the real parts of the roots are negative. Analyzing the coefficients,it is clear that (30) holds. For N > Ncrit, a4 > 0. However, we are still leftto verify (31)-(33). For certain parameter regimes all the conditions are metand the infected steady state is stable. On the other hand, there are certainparameter regimes where the infected steady state is unstable (Table 5).
2.4 Sensitivity Analysis
Next, a local sensitivity analysis is performed on the parameters relevant tothe critical number of viruses produced by each dying CD4+ T cell, that is,a, µh,k, µv, k, δ, rh,k, and Thmax,kmax. The parameter with the sensitivityindex of the greatest magnitude is the most effective in increasing Ncrit whenparameters are varied locally, where the sensitivity index is given by
S =λ
Ncrit
∂Ncrit
∂λ
where λ represents a parameter. For our model we take into considerationtwo critical values for N , one calculated for infants and one calculated for
215

Parameter Sensitivity Indexδ 0.9900
TKmax 0.9898µV 0.9267K −0.9267
Table 3: Parameters with Greatest Sensitivity Index(Infants)
Parameter Sensitivity IndexµK −1.0908µV 0.98864K −0.98864δ 0.95162
Table 4: Parameters with Greatest Sensitivity Index (Adults)
adults. In other words, we calculate one Ncrit using the parameters used forinfants and another using the parameter values for adults (Table 2) Fromthis we obtain the sensitivity indices contained in Table 3 and 4For infants the greatest sensitivity index is obtained by the parameter δ. Inbiological terms, this implies that by increasing the rate at which CD8+ Tcells kill off the infected CD4+ T cells, Ncrit will increase most efficientlycompared to changes in other parameters. In adults, increasing the deathrate of the virus µv most effectively increases Ncrit compared to the otherparameters [10] [22].
3 Numerical Simulations
Numerical simulations were carried out to gain a better understanding of thedynamics of our system and to verify the results from our analysis. Also,simulations were used to differentiate between dynamics of HIV in an adult’simmune system and an infant’s immune system.
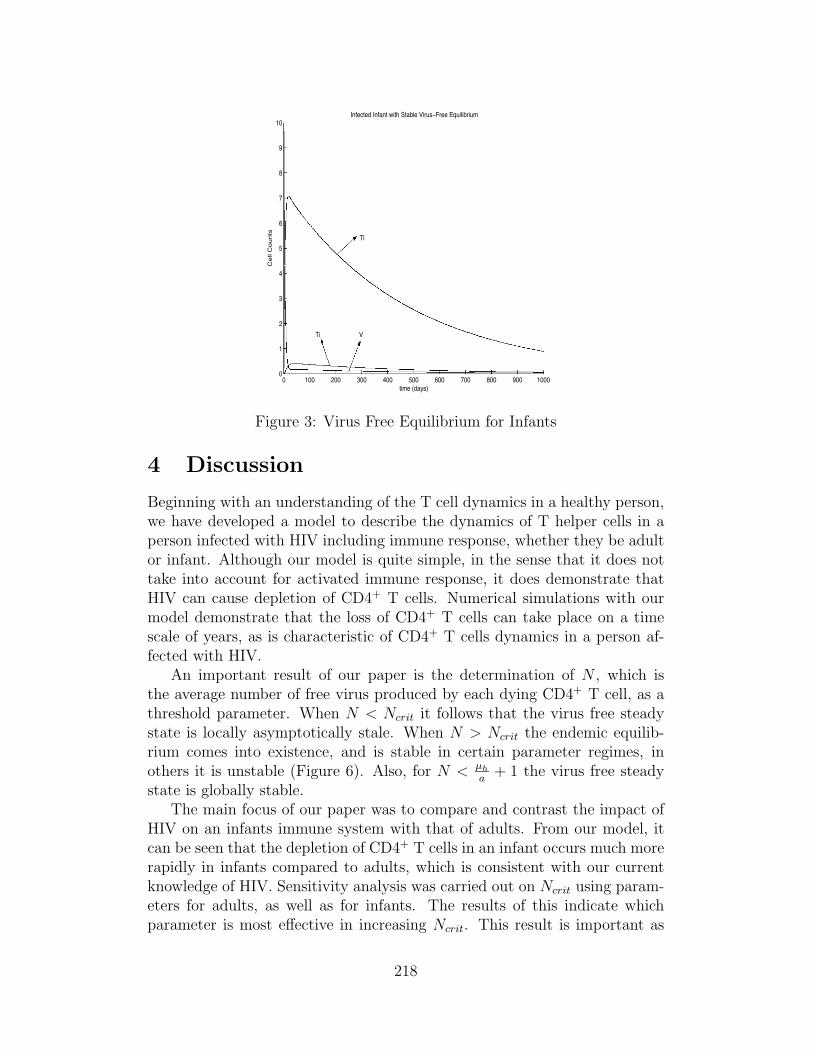
The parameters for the first simulation are chosen to model an HIV in-fected infant with N < Ncrit. The virus-free equilibrium is reached in about3500 days (∼10 years) after infection (Figure 3). A CD4+ T cell count ofalmost 1996 is reached after 20 days of infection, while a CD8+ T cell countof 1042 is reached after 30 days of infection. The viral count rapidly declinesto 0 free virions after only 20 days, but the latently and actively infectedCD4+ T cells take over 3000 days to clear out of the body.
The second simulation parameter values are for an infected infant with
216
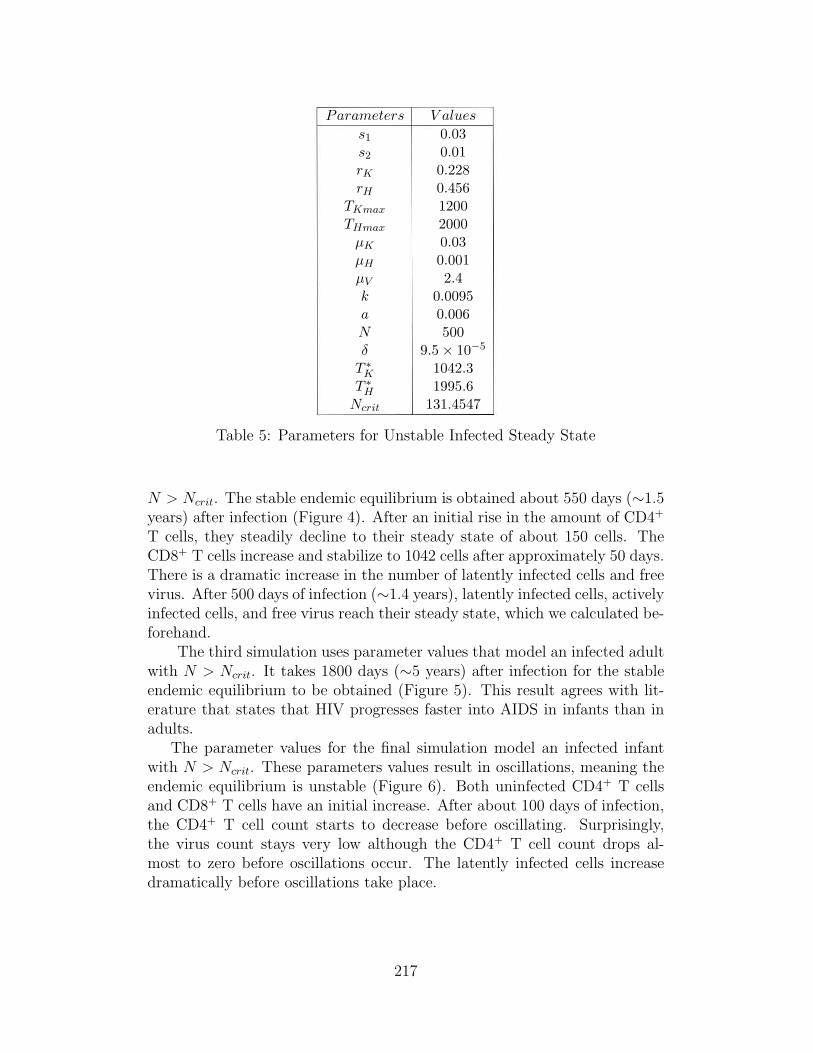
Parameters V aluess1 0.03s2 0.01rK 0.228rH 0.456
TKmax 1200THmax 2000
µK 0.03µH 0.001µV 2.4k 0.0095a 0.006N 500δ 9.5× 10⁻⁵
T ∗K 1042.3
T ∗H 1995.6
Ncrit 131.4547
Table 5: Parameters for Unstable Infected Steady State
N > Ncrit. The stable endemic equilibrium is obtained about 550 days (∼1.5years) after infection (Figure 4). After an initial rise in the amount of CD4+
T cells, they steadily decline to their steady state of about 150 cells. TheCD8+ T cells increase and stabilize to 1042 cells after approximately 50 days.There is a dramatic increase in the number of latently infected cells and freevirus. After 500 days of infection (∼1.4 years), latently infected cells, activelyinfected cells, and free virus reach their steady state, which we calculated be-forehand.
The third simulation uses parameter values that model an infected adultwith N > Ncrit. It takes 1800 days (∼5 years) after infection for the stableendemic equilibrium to be obtained (Figure 5). This result agrees with lit-erature that states that HIV progresses faster into AIDS in infants than inadults.
The parameter values for the final simulation model an infected infantwith N > Ncrit. These parameters values result in oscillations, meaning theendemic equilibrium is unstable (Figure 6). Both uninfected CD4+ T cellsand CD8+ T cells have an initial increase. After about 100 days of infection,the CD4+ T cell count starts to decrease before oscillating. Surprisingly,the virus count stays very low although the CD4+ T cell count drops al-most to zero before oscillations occur. The latently infected cells increasedramatically before oscillations take place.
217
0 100 200 300 400 500 600 700 800 900 10000
1
2
3
4
5
6
7
8
9
10
time (days)
Cel
l Cou
nts
Infected Infant with Stable Virus!Free Equilibrium
Tl
Ti V
Figure 3: Virus Free Equilibrium for Infants
4 Discussion
Beginning with an understanding of the T cell dynamics in a healthy person,we have developed a model to describe the dynamics of T helper cells in aperson infected with HIV including immune response, whether they be adultor infant. Although our model is quite simple, in the sense that it does nottake into account for activated immune response, it does demonstrate thatHIV can cause depletion of CD4+ T cells. Numerical simulations with ourmodel demonstrate that the loss of CD4+ T cells can take place on a timescale of years, as is characteristic of CD4+ T cells dynamics in a person af-fected with HIV.
An important result of our paper is the determination of N , which isthe average number of free virus produced by each dying CD4+ T cell, as athreshold parameter. When N < Ncrit it follows that the virus free steadystate is locally asymptotically stale. When N > Ncrit the endemic equilib-rium comes into existence, and is stable in certain parameter regimes, inothers it is unstable (Figure 6). Also, for N < µh
a + 1 the virus free steadystate is globally stable.
The main focus of our paper was to compare and contrast the impact ofHIV on an infants immune system with that of adults. From our model, itcan be seen that the depletion of CD4+ T cells in an infant occurs much morerapidly in infants compared to adults, which is consistent with our currentknowledge of HIV. Sensitivity analysis was carried out on Ncrit using param-eters for adults, as well as for infants. The results of this indicate whichparameter is most effective in increasing Ncrit. This result is important as
218

0 200 400 600 800 1000 1200 1400 1600 1800 20000
200
400
600
800
1000
1200
1400
1600
1800
2000
time (days)
Cel
l Cou
nts
Infected Infant with Stable Endemic Equilibrium
Tl
Th
Tk
V
Ti
Figure 4: Stable Endemic for Infants
well. Increasing the value of Ncrit allows the virus to reproduce more effec-tively, while still maintaining N < Ncrit, meaning the virus will die out (thevirus free steady state will be locally asymptotically stable).
In the case of adults, the parameter with the greatest sensitivity index isµk, which is the death rate of the CD8+ T cells. For children, the parameterwith the greatest sensitivity index is δ the rate at which the CD8+ T cellskill off the actively infected CD4+ T cells. Biologically, this implies that ifone were treating an adult infected with HIV one would prescribe a drug ortreatment that decreases the death rate of the CD8+ T cells. However, ifone were treating an infant infected with HIV one would prescribe a drugor treatment that increases the ability of CD8+ T cells to kill of activelyinfected CD4+ T cells. From our model, we can better understand why theprogression of HIV to AIDS occurs more rapidly in infants than in adults.The way to combat this progression in children is to target and increase therate at which the CD8+ T cells kill of the HIV virus.
5 Future Work
The way we captured the effects of HIV on an infant’s immune system was byfinding parameter values specific for infants and using that in our numericalsimulations. However, our long-term goal is to develop an age structuredmodel which would be a more accurate tool to measure the differences be-tween an HIV infected adult and an HIV infected infant. We would alsoincorporate an active immune response, meaning we would include a term
219
(Iv I
I I\v-----~/----

0 200 400 600 800 1000 1200 1400 1600 1800 20000
200
400
600
800
1000
1200
1400
time (days)
Cel
l Cou
nts
Infected Adult with Stable Endemic Equilibrium
Th
Tk Tl
V
Ti
Figure 5: Stable Endemic for Adults
for CD8+ T cells that would stimulate them to grow depending on how muchvirus is present.
6 Acknowledgements
First off we would like to thank Dr. Carlos Castillo-Chavez, Dr. Linda Gao,Dr. Armando Arciniega, Dr. Alan Perelson, and Dr. Denise Kirschner forhelping us develop our idea and giving us the opportunity to carry out ourresearch. We would like to thank Dr. Luis Gordillo and Dr. ChristopherKribs for all their support. Finally, we would like to thank Anuj Mubayi forstaying up late with us so many times and helping us through some of thedifficult times.
References
[1] Janeway, C.A., Travers, P., Walport, M., Shlomchik, M., Immuno Biol-ogy 5, 693, Garland Publishing, New York 2001.
[2] Greenberg, L., AIDS: How It Works In the Body, 35, Franklin Watts,New York 1992.
[3] Immune Response - Overview, The University of Arizona, July 15, 2004,http://www.biology.arizona.edu/immunology/tutorials/AIDS/response.html.
220

0 100 200 300 400 500 600 700 800 900 10000
200
400
600
800
1000
1200
1400
1600
1800
2000
time (days)
Cel
l Cou
nts
Infected Infant with Unstable Endemic Equilibrium
Th
Tl
Tk
Ti V
Figure 6: Unstable Endemic Equilibrium for Infants
[4] Pavia, A.T., Primary Care of Infants and Childrenwith HIV, HIV InSite Base Chapter, July 16, 2004,http://hivinsite.ucsf.edu/InSite.jsp?page=home-00-00doc=kb-03-01-14.
[5] HIV Impacts, The University of Arizona, July 15, 2004,http://www.biology.arizona.edu/immunology/tutorials/AIDS/impacts.html.
[6] Your Immune System, Wellness Directory of Minnesota, July 16, 2004,http://www.mnwelldir.org/docs/immune1.htm.
[7] Linnemeyer, P.A., The Immune System-An Overview,Seattle Treatment Education Project, July 15, 2004,http://www.thebody.com/step/immune.html.
[8] Immunology and HIV: Immune system’s response toHIV, The University of Arizona, July 15, 2004,http:/www.biology.arizona.edu/immunology/tutorials/AIDS/HIVimmune.html.
[9] Brauer, F., Castillo-Chavez, C., Mathematical Models in Population Bi-ology and Epidemiology, Texts in Applied Mathematics, 40, Springer-Verlag, New York 2001.
[10] Caswell, H. Matrix Population Models: Construction, Analysis, and In-terpretations. Sinauer, 2001. Ch 9.
221

[11] Alan S. Perelson, Denise Kirschner, and Rob De Boer. Dynamics ofHIV Infection of CD4+ T cells. Mathematical Biosciences, 114:81-125(1993) July 1993.
[12] Andrew J. McMichael, and Sarah L. Rowland-Jones. Cellular ImmuneResponses to HIV. Nature 410:980-987, April 2001.
[13] Denise Kirschner. Using Mathematics to Understanding HIV ImmuneDynamics. Notices of the AMS 43(2):191-202, February 1996.
[14] World Health Organization: HIV/AIDS in Asia and the Pacific Region2001. Mother-to-Infant Transmission of HIV World Health OrganizationAnnex 2, 2001.
Data taken from the following:
[15] Norman J. Waecker, David P.Ascher, Merlin L. Robb, Richard Moriarty,Marvin Krober, William J. Rickman, Cliff A. Butzin, Gerald W. Fischer,and the Military Pediatric HIV Consortium. Age-Adjusted CD4+ Lym-phocyte Parameters in Healthy Children at Risk for Infection with theHuman Immunodeficiency Virus. Clinical Infectious Diseases 17:123-5,July 1993.
[16] Ping Ye and Denise E, Kirschner. Reevaluation of T cell Receptor Ex-cision Circles as a Measure of Human Recent Thymic Emigrants. TheJournal of Immunology 169:4968-4979, March 2002.
[17] Lynne M. Mofenson, James Korelitz, William A. Meyer III, JamesBethel, Kenneth Rich,, Savita Pahwa, John Moye, Jr., Robert Nugent,and Jennifer Read. The Relationship between Serum Human Immunod-eficiency Virus Type I (HIV-1) RNA Level, CD4 Lymphocyte Percent,and Long-Term Mortality Risk in HIV-1- Infected Children. The Journalof Infectious Diseases 175:1029-1038, January 1997.
[18] William T. Shearer, Thomas C. Quinn, Philip LaRussa, Judy F. Lew,Lynne Mofenson, Susan Almy, Kenneth Rick, Edward Handelsman,Clemente Diaz, Marcello Pagano, Vincent Smeriglio, and Leslie A.Kalish. Viral Load and Disease Progression in Infants Infected with Hu-man Immunodeficiency Virus Type I. New England Journal of Medicine336: 1337-1342, May 1997.
[19] Andre J. Nahmias, W. Scott Clark, Athena P. Kourtis, Francis K. Lee,George Cotsonis, Christian Ibegbu, Donald Thea, Paul Palumbo, Pe-ter Vink, R. J. Simonds, Steven R. Nesheim. Thymic Dysfunctionand Time of Infection Predict Mortality in Human ImmunodefienciencyVirus-Infected Infants. The Journal of Infectious Diseases 178: 680-685,September 1998.
222
[20] Johan K. Sandberg, Noam M. Fast, Kimberly A. Jordan, Scott N.Furlan, Jason D. Barbour, Glenn Fennelly, Joanna Dobroszycki, HansM. L. Spiegel, Andrew Wiznia, Michael G. Rosenberg, and Douglas F.Nixon. HIV-Specific CD8+ T Cell Function in Children with VerticallyAcquired HIV-1 Infection Is Critically Influenced by Age and the Stateof the CD4+ T Cell Compartment. The Journal of Immunology 170:4403-4410, February 2003.
[21] Seema H. Bajaria, Glenn Webb, Miles Cloyd, and Denise Kirschner.Dynamics of Nave and Memory CD4+ T Lymphocytes in HIV-1 DiseaseProgression. Journal of Acquired Immune Deficiency Syndrome 30:41-58, January 2002.
[22] Leon Arriola Forward Sensitivity Analysis: Adjoint and Non-AdjointProblems
[23] Paul Krogstad, Christel H. Uittenbogaart, Ruth Dickover, Yvonne J.Bryson, Susan Plaeger, and Alan Garfinkel. Primary HIV Infectionof Infants: The Effects of Somatic Growth on Lymphocyte and VirusDynamics. Clinical Immunology 92(1): 25-33, 1999.
[24] Barton F. Haynes, and Laura P. Hale. The Human Thymus: A ChimericOrgan Comprised of Central and Peripheral Lymphoid Components. Im-munologic Research 18(2):61-78, 1998.
[25] Paediatric European Network for Treatment of AIDS (PENTA). HIV-1Viral Load and CD4 Cell Count in Untreated Children with VerticallyAcquired Asymptotic or Mild Disease. AIDS 12(4): F1-F8, 1998.
[26] K. Renee Fister, Suzanne Lenhart, and Joseph S. McNally. Optimiz-ing Chemotherapy in an HIV Model. Electronic Journal of DifferentialEquations 32:1-12, December 1998.
[27] H.R. Hegde and S.M. Robbins. Anergy and Human ImmunodeficiencyVirus Infection. Medical Hypotheses 56(3): 376-380, 2001.
223