HIV and Inflammation: A Paradigm Shift
39
HIV and Inflammation: A Paradigm Shift Wafaa El-Sadr, MD, MPH Columbia University & Harlem Hospital New York
-
Upload
jasper-browning -
Category
Documents
-
view
27 -
download
1
description
HIV and Inflammation: A Paradigm Shift. Wafaa El-Sadr, MD, MPH Columbia University & Harlem Hospital New York. XI International Conference on AIDS Vancouver 1996. Effect of Protease Inhibitor-Containing Regimens on Mortality in Patients with
Transcript of HIV and Inflammation: A Paradigm Shift

HIV and Inflammation:A Paradigm Shift
Wafaa El-Sadr, MD, MPHColumbia University & Harlem Hospital
New York

XI International Conference on AIDSVancouver 1996

Effect of Protease Inhibitor-Containing Regimens on Mortality in Patients with <100 CD4+ cells
Palella F, et al. N Engl J Med, 1998.
1994 1995 1996 1997
Antiretroviral Therapy
Deaths
0
10
20
30
40
0
20
40
60
80
100
Therapy with a Protease Inhibitor
(% of patient-days)
Dea
ths
per 1
00 P
erso
n-Ye
ars

Survival from SeroconversionCompared to Pre 1996
Ewings et al, 2008
Haz
ard
Ratio
of D
eath
1 0.63 0.24 0.14 0.08 0.03

Change in Mortality over Time
Lau et al, JAIDS 2007
HAART
AIDS
Non-AIDS
Mor
talit
y (p
er 1
000
pers
on-y
ears
)
Calendar Year
Perc
ent R
ecei
ving
The
rapyAll cause

Causes of Death in HIV: France 2005
Lewden et al, CROI 20070 5 10 15 20 25 30 35 40
AIDS Cancer Hepatitis C CVD Suicide Non-AIDS infection Accident Hepatitis B Liver disease OD / drug abuse neurologic renal pulmonary digestive iatrogenic metabolic psychiatric other unknown
Percent
N = 937 deaths


8
Optimization of Use of Antiretroviral Therapy
RisksBenefits

SMART Study
Drug Conservation (DC)
Defer use of ART until CD4+ < 250; episodic ART based on CD4+ cell
count to increase counts to > 350
Viral Suppression (VS)
Continuous use of ART to maintain viral load as low as
possible
CD4+ cell count >350 cells/mm3 N= 5,472
n = 2,752 n = 2,720
Primary Endpoint: Opportunistic Disease or Death

Increased Risk Opportunistic Disease or Death with DC versus VS Strategy
Logrank = 31.1 p < 0.0001
DC 2720 1170 589 322 VS 2752 1167 625 334
Months from randomization
DC Group
VS Group
Perc
ent w
ith E
vent
0 4 8 12 16 20 24 28 32 36 40 440
5
10
15
20

Drug Conservation (DC) Strategy Associated with Increased Risk of Serious AIDS and Non-AIDS Events
No. of Patients with EventsEndpoint
Serious AIDS 59 1.3 0.4
Favors VS ►►Favors DC
Hazard Ratio (DC/VS) (95% CI)
Rate**DC VS
3.6
1.9
Serious non-AIDS* 186 3.2 2.01.6
•Cardiovascular, renal, hepatic, non-AIDS malignancy, others** Per 100 person-years
Serious AIDS or 239 4.4 2.4non-AIDS
Curr Opin HIV AIDS 2008;3:112-117
0.1 1 10

Unifying FrameworkHIV-Associated Immune Activation
• HIV replication• T cell apoptosis immunosuppression• Coagulation cascade• Inflammation
– Atherosclerosis - Liver disease– Osteoporosis - Neurocognitive decline– Renal disease
Ross, NEJM 1999
Michael Ross Russell Ross, NEJM 1999

Inflammatory and Coagulation Markers in SMART
• Inflammatory– hs C-reactive protein (hs-CRP)– IL-6– Serum amyloid A– Serum amyloid P
• Coagulation– D-dimer– Prothrombin fragment 1+2 (F1.2)

Baseline Biomarker Levels Associated with All Cause Mortality – SMART Study
BiomarkerBaseline Level
DC arm OR (95% CI) P value
VS Arm OR (95%CI) P value
Hs CRP (Ug/ml) 2.3 (1.2-4.4) 0.01 2.7 (0.9-7.9) 0.08
IL-6 (Ug/ml) 3.8 (2.1-7.2) 0.0002 2.4 (1.1-5.2) 0.03
Amyloid A (mg/l) 1.6 (0.9-2.8) 0.11 1.5 (0.6-3.8) 0.40
Amyloid P (Ug/ml 0.8 (0.5-1.3) 0.40 0.7 (0.3-1.6) 0.46
D-dimer (ug/ml) 5.9 (1.9-18.7) 0.002 7.1 (0.8-63.2) 0.08
F1.2 (pmol/l) 0.8 (0.4-1.5) 0.47 0.7 (0.2-2.2) 0.55
Kuller et al. Plos Medicine 2008

Association of C Reactive Protein and HIV with Myocardial Infarction
Marker CRP High vs Not High OR (95%CI) P value
HIV vs no HIVOR (95%CI) P value
CRP 2.5 (2.4-2.8)
<0.0001
HIV 2.1 (1.3-3.1)
0.0009
CRP, HIV 2.5 (2.3-2.8)
<0.0001 1.74 (1.1-2.6)
0.01
CRP, HIV, age, sex, race, HPN, diabetes, dyslipidemia
2.1 (1.9-2.4)
<0.0001 1.9 (1.2-2.9)
0.0035
Triant et al, J Acquir Immune Defiic Syndr, 2009 (adapted)

C-Reactive Protein Level is Associated with AIDS-Free Survival
Lau et al, Arch Intern Med 2006
Prop
ortio
n A
IDS
Free
Time from Baseline, years

C Reactive Protein Level is Associated with AIDS –Free Survival
Variable Relative Time(95% CI)
P Value
CRP, mg/L <1.2 1.3-2.3 >2.3
1.00.86 (0.68-1.09)0.63 (0.51-0.79)
0.21<0.001
CD4+ cell count 1.12 (1.08-1.16) <0.001
HIV RNA (log10) 0.34 (0.29-0.39) <0.001
Hemoglobin (g/dL) 1.14 (1.06-1.23) <0.001
Lau et al, Arch Intern Med 2006

C Reactive Protein Levels Increase over Time prior to AIDS Diagnosis
C re
activ
e pr
otei
n, g
eom
etric
mea
n ug
/L
Months from AIDS DiagnosisLau et al, Arch Intern Med 2006
AIDS

The Natural History of HIV InfectionClinical Latency?
Pantaleo G, et al. N Engl J Med 1993

Opportunistic Infections Occur at Higher CD4+ Cell Count Strata
0.01
0.1
1
10
100
<100
100-
199
200-
299
300-
399
400-
499
>=50
0<1
00
100-
199
200-
299
300-
399
400-
499
>=50
0<1
00
100-
199
200-
299
300-
399
400-
499
>=50
0
Latest CD4 count
Inci
denc
e pe
r 100
0 PY
FU (9
5%CI
)
CMV / MAC / TOXO PCP /EC TB
N events 134 45 13 9 2 2 89 55 61 35 13 16 12 9 10 11 11 14
Podlekareva et al. J Infect Dis 2006

Non-AIDS-Related Deaths Occur at Higher CD4+ Cell Counts
CASCADE
DAD
CD4+ Cell Count
Rate
per
100
per
son/
yrs
Phillips et al, AIDS 2008

Deaths due to Non-AIDS Exceed AIDS Causes in Patients enrolled with CD4+ Count >200 cell/mL—
Post 1999
CD4<200 CD4+ 201-350 CD4+ 351-500 CD4+>500
Adapted, Lau et al, JAIDS 2007
AIDS
AIDS AIDS AIDSNon-AIDS
Non-AIDS
Non-AIDS Non-AIDS
0
0.4
0.8
Cum
ulati
ve m
orta
lity

A New Paradigm
Time in YearsInfection
CD4+
cel
ls C
ount
1000
800
600
400
200
0
Opportunistic Diseases
1 2 3 4 5 6 7 8 9 10 11 12 13 14
Ongoing Morbidity from HIV

Timing of Initiation of ART
Sterne et al, Lancet 2009
Haz
ard
Ratio
for A
IDS
or D
eath
CD4+ cell count threshold

Earlier Initiation of ART andRisk of Death
Variable CD4+ count 351-500 cells/ml
CD4+ count >500 cells/ml
Relative Risk P Value
Relative Risk P Value
ART deferral 1.6 (1.2-2.2)
0.002 1.9 (1.2-2.9)
0.006
Female sex 1.9 (1.7-2.1)
0.04 1.4 (0.9-2.1)
0.20
Older age (10yr) 1.9 (1.7-2.1
<0.001 1.8 (1.6-2.1)
<0.001
Baseline CD4+ (100 cell increment)
0.7 (0.6-1.0)
0.06 1.0 (0.4-1.0)
0.45
Baseline HIV RNA (log 10 increment)
1.1 (1.0-1.3)
0.15 1.1 (1.0-1.3)
0.14
Kitahata et al, New Eng J Med 2009 (adapted)

Effect of ART on C Reactive Protein
Henry et al, AIDS, 2004
C Re
activ
e Pr
otei
n Le
vel
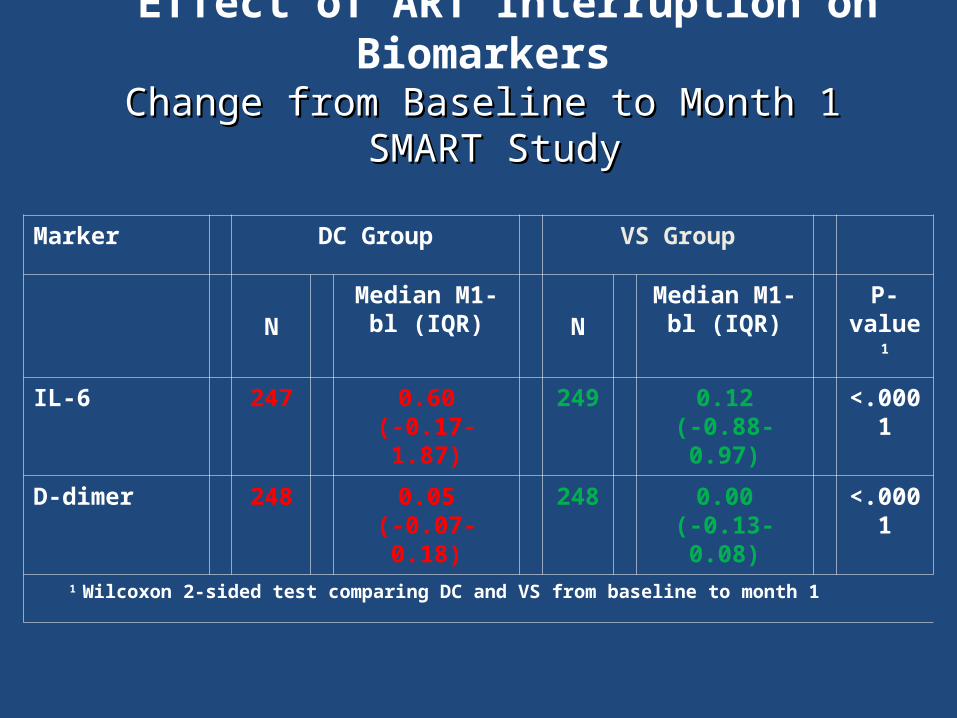
Effect of ART Interruption on Biomarkers Change from Baseline to Month 1 Change from Baseline to Month 1
SMART StudySMART Study
Marker DC Group VS Group
NMedian M1-bl
(IQR) NMedian M1-bl
(IQR)P-
value1
IL-6 247 0.60(-0.17-1.87)
249 0.12(-0.88-0.97)
<.0001
D-dimer 248 0.05(-0.07-0.18)
248 0.00(-0.13-0.08)
<.0001
1 Wilcoxon 2-sided test comparing DC and VS from baseline to month 1

START Study
HIV-infected, ART-naïve CD4+ count > 500 cells/mm3
Early ART GroupInitiate ART immediately
Deferred ART GroupDefer ART until CD4+ count < 350 cells/mm3 or AIDS
Primary OutcomeSerious AIDS, Serious non-AIDS Events or Death
Measurement of biomarkers
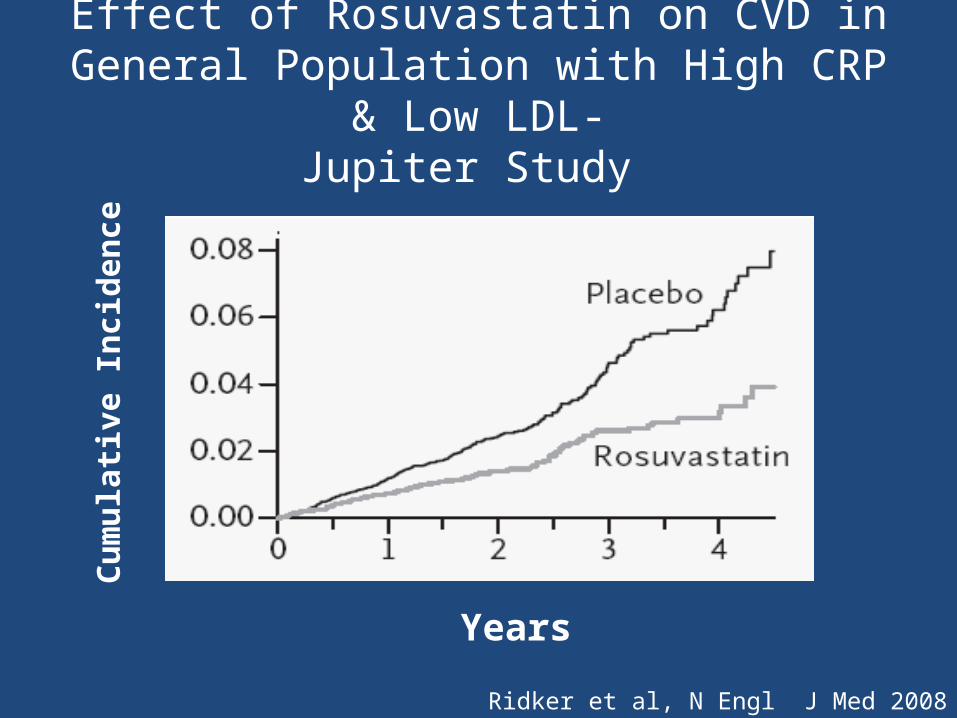
Effect of Rosuvastatin on CVD in General Population with High CRP & Low LDL-
Jupiter Study
Ridker et al, N Engl J Med 2008
Cum
ulati
ve In
cide
nce
Years

Atorvastatin
Placebo Atorvastatin
Placebo
Week 0 20 48
Arm A
Arm B
28
A5275A5275 – – Pilot Study of Effects of Pilot Study of Effects of Atorvastatin on Biomarkers in HIVAtorvastatin on Biomarkers in HIV
WASHOUT
Biomarkers of Inflammation, Coagulopathy, Angiogenesis, Biomarkers of Inflammation, Coagulopathy, Angiogenesis, and T-lymphocyte Activationand T-lymphocyte Activation
• HIV infected
• On boosted-PI regimen with HIV RNA <50 copies/ml
• LDL < 130 mg/dl • D-dimer >0.34

A World Apart?

Mortality in HIV-infected Persons after Seroconversion Compared to
General Population
Bhaskaran et al, Lancet 2008
Cum
ulati
ve M
orta
lity,
Pro
porti
on
Time from Seroconversion, Years Time from Seroconversion, Years
Age <45 yrs at seroconversion Age >45 yrs at seroconversion
Cum
ulati
ve M
orta
lity,
Pro
porti
on
HIV Pre -1996
HIV 2004-2006
HIV Pre -1996
HIV 2004-2006
General 2004-2006 General 2004-2006

Dramatic Increase in Access to ART;Low & Middle Income Countries
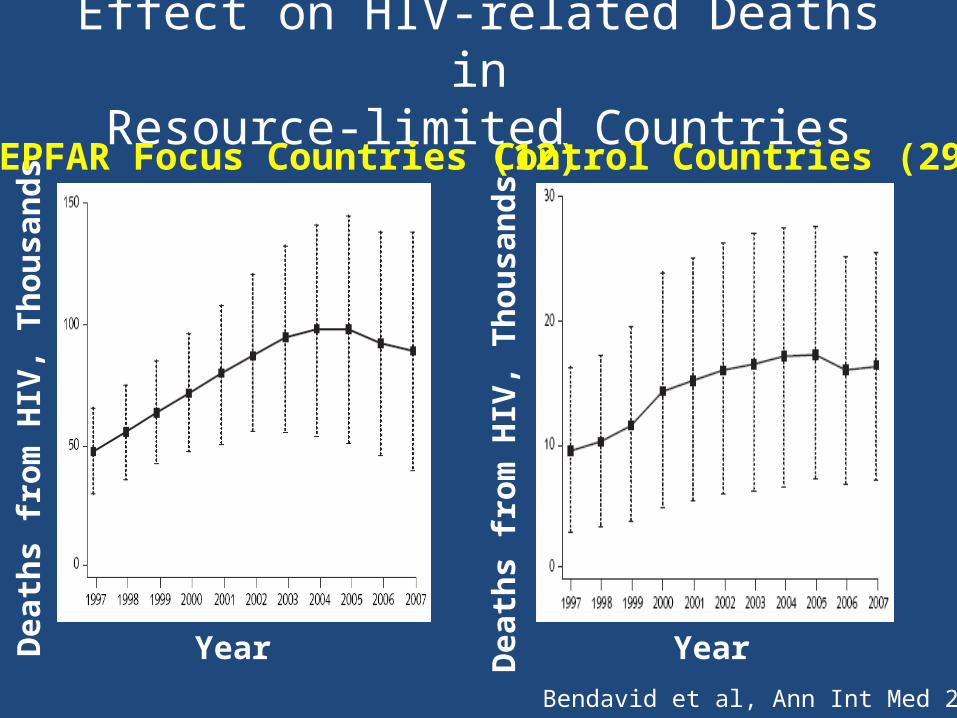
Effect on HIV-related Deaths inResource-limited Countries
Bendavid et al, Ann Int Med 2009
Dea
ths
from
HIV
, Tho
usan
ds
Dea
ths
from
HIV
, Tho
usan
ds
Year Year
PEPFAR Focus Countries (12) Control Countries (29)
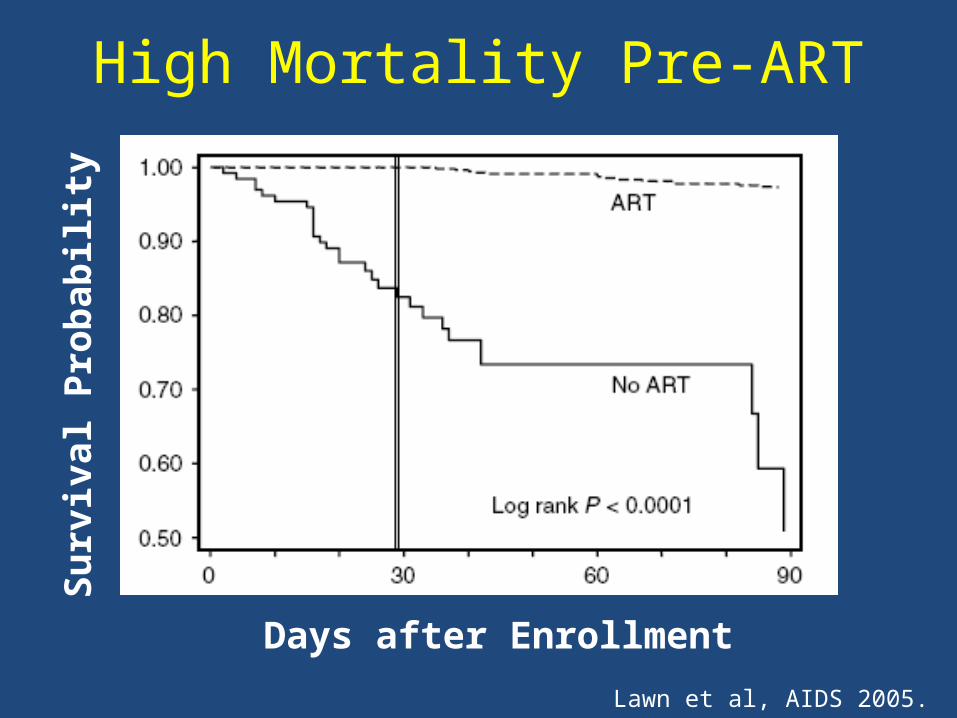
High Mortality Pre-ART
Lawn et al, AIDS 2005.
Surv
ival
Pro
babi
lity
Days after Enrollment

High Risk of Early Mortality after ART Initiation:High Risk of Early Mortality after ART Initiation:Resource Poor/Resource SettingsResource Poor/Resource Settings
HR unadjusted HR adjusted for cohort, age, sex, baseline CD4, ART-regimen, disease stage
Haz
ard
Ratio
(95%
CI)
Months from Starting HAART

Summary• Remarkable progress achieved with use of ART • The spectrum of HIV-related complications evolved with a
predominance of non-AIDS related events, particularly in patients with higher CD4+ cell counts
• Inflammatory and coagulation markers associated with serious complications, AIDS and death
• A survival gap exists:– for those with HIV versus general population in resource-rich
settings – and an even more pronounced gap in outcomes in HIV infected
individuals in resource –rich versus limited settings
Conclusions
• A re-conceptualization of the pathogenesis of HIV disease is necessary-- clinical latency is a misperception
• Inflammation and coagulopathy are important causes of end-organ damage, disease progression and death
• Role of ART and of other interventions in averting and suppressing these processes and their consequences needs urgent definition

One World-One Hope