Hitting a plateau
24
www.pwc.co.za/sustainability Hitting a plateau Resilient companies survey • Second edition • October 2013
Transcript of Hitting a plateau

www.pwc.co.za/sustainability
Hitting a plateau
Resilient companies survey • Second edition • October 2013


1PwC
We live in a world in which sustainable development can no longer be viewed as a peripheral issue managed by an isolated unit within a business. Rather, sustainable development – which involves managing risks and opportunities affecting long-term viability and value creation – needs to be integrated into every facet of an organisation and its approach to doing business.
In a recent report issued by PwC1, the majority of CEOs believe that measuring their organisation’s total impact could enable better business decisions about business risk, and build stronger reputation with employees, investors and regulators, than using financial measures alone. In addition, while focus is traditionally placed on annual reporting, this can only be as good as the everyday doing and addressing this remains a challenge for companies today.
In this survey, we assess how well sustainable development is being embedded in the strategy, risk management and daily operations of the top 100 companies listed on the JSE. The results provide a point of reference for comparison to the results of last year’s survey as well as for subsequent research in years to come.
Key objectives of the survey
• Raise awareness of emerging trends and issues in approaches to integrated management in South Africa;
• Understand the strategic thinking and challenges faced by the key drivers and actors responsible for embedding integrated management in business;
• Provide insight into how the mainstreaming of material issues might evolve over the next few years; and
• Highlight best practice regarding the integrated management of material risks and opportunities affecting long-term viability.
Our 2012 survey was the first in a series of annual surveys aimed at exploring these issues. In this year’s survey, we kept the questionnaire the same so that progress in the areas of driving, measuring and communicating integrated management could be benchmarked and explored.
1 “Measuring and monitoring total impact: a new language for
business decisions,” PwC, 2013. www.pwc.com/totalimpact

2 Resilient companies survey
Profile of respondents
The survey was sent to the 100 largest JSE-listed companies by market capitalisation and 24 (2012: 20) of these companies completed the survey in the designated time frame. This report is based on the responses of these 24 companies.The majority (87.5 %) of respondent companies are included in the JSE Socially Responsible Investment (SRI) index. The SRI continues to play a positive role in encouraging companies to proactively understand and address material sustainable development risks and opportunities.
Figure 1. Respondent’s industry
Base: 2013: 24
Source: PwC analysis
As in in our previous survey, responses were received from companies across a broad range of industries. The greatest number of respondents was from the energy, utilities and mining sector followed by the retail and consumer sector.
Each year, survey participants are determined by market capitalisation on the JSE. It is important to note, therefore, that the survey sample between 2012 and 2013 differs, although 8 respondents (33% of 2013 respondents) also participated in last year’s survey. The results presented here should be interpreted with this in mind.
General industrialForest, paper and packaging
Telecommunications/ IT
Banking andcapital markets
FishingRetail andconsumer
Insurance
Diversifiedtrading anddistribution
Energy, utilitiesand mining1
2
2
2
5
1
1
2
1
5
11
Agriculture
Food andbeveragemanufacturing
Financial services

3PwC
We’ve reached a plateau
While it is clear that progress is being made by a number of companies and that other companies are now also embarking on the process, there is still much to be done to reach the point where integrated management can be considered business as usual. Through our involvement with clients, we have observed that while there is no shortage of innovative projects and initiatives being piloted, much is still spoken about in qualitative terms and is case-study driven.
In short, not enough initiatives are moving to scale. Two recent studies – one global and one local – highlight some possible reasons for this, which are also echoed in the feedback we received from respondents in this year’s survey.
The first, the UN Global Compact-Accenture ‘CEO Study on Sustainability 2013’2 finds that many international business leaders are unsatisfied with their progress, as their drive for integrating sustainable development is limited by the way in which nations and economies are governed.
The report notes that many business leaders believe their businesses have reached a plateau beyond which they cannot progress without radical changes being made to market structures and systems, driven by a common understanding of global priorities.
These leaders are calling for the development of a ‘global architecture’ and a consistent mandate from stakeholders to enable businesses to scale sustainable development efforts from individual, incremental achievements to collaborative initiatives of innovation and growth.
Evidence of a ‘plateau’ being reached in the South African context can be found in the fact that responses to our 2012 and 2013 surveys have not differed significantly. Other initiatives within South Africa, including the Network for Business Sustainability, share a similar perception.
The data collected in our 2012 and 2013 surveys have allowed us to assess progress in the approaches and achievements of respondent’s companies. They also highlight the challenges being faced by businesses on their integrated management and reporting journey.
2 “The UN Global Compact-Accenture CEO Study on Sustainability 2013”, UNGC, Accenture, 2013 www.accenture.com/Microsites/ungc-
ceo-study/Documents/pdf/13-1739_UNGC%20report_Final_FSC3.pdf
3 “Sustainability Challenges for South African Businesses in 2013”, Network for Business Sustainability, 2013. http://nbs.net/wp-content/
uploads/SA-Challenges-Report-2013.pdf

4 Resilient companies survey
In 2013 the Network for Business Sustainability released a summary3 of a one-day roundtable at which South African business leaders identified eight sustainable development issues associated with important knowledge gaps. The eight challenges identified at the roundtable are recognised as key challenges that will hinder South African companies’ progress with integrated management until they are effectively understood and addressed.
These challenges include:
• Engagement with other role-players in defining a shared vision and strategic plan for a sustainable future in South Africa;
• Understanding the dynamics of integrated decision making and how to integrate sustainable development into strategies and business models, supply chains and customer relationships; and
• Establishing effective and legitimate business collaboration to drive action for sustainable development.
Considering the concerns expressed by business leaders, the lack of progress made by businesses between our 2012 and 2013 surveys is perhaps not surprising. However, as PwC’s ‘Measuring and monitoring total impact’ report4 observes, there is growing agreement that the era of growth at any cost is over. Businesses now need to look beyond financial metrics to their wider outcomes and impacts to understand their total footprint on society in terms of economic, environmental, tax and social impacts and use what they find to guide their strategic decision making.
The greatest opportunity for business leaders in South Africa is to collectively work towards addressing knowledge gaps regarding how to implement integrated management and participate in initiatives that may further the establishment of a supportive system for larger-scale progress in long-term value creation and ‘good growth’.
4 “Measuring and monitoring total impact: a new language for business decisions,” PwC,
2013. www.pwc.com/totalimpact

5PwC
Driving integrated management
Key motivations for addressing sustainable development
Figure 2. Key motivations for addressing sustainable development
Base: 2012: 20, 2013: 24
Source: PwC analysis
As in last year’s survey, good corporate citizenship and a social licence to operate were considered one of the most important motivations for driving sustainable development in companies. This reflects the demand for meeting legal, ethical and economic responsibilities placed on companies by stakeholders.
A growing number of companies appear to view strategic risk as an important factor, enabling companies to better anticipate and respond to issues as they arise. Innovation and new revenue opportunities are the least important of the options presented, which indicates that these opportunities continue to be less well recognised and their benefits under-realised by the majority of companies surveyed.
Most importantSignificantly important
Neither important nor unimportantMinimally importantLeast important
New revenueopportunities
Innovation
Cost savingsand efficiencies
Reputation
Compliance
Good corporatecitizenship/ sociallicence to operate
Strategic risk2013
2012
2013
2012
2013
2012
2013
2012
2013
2012
2013
2012
2013
2012
8% 4% 25% 63%
20% 45% 35%
13% 29% 58%
5% 35% 60%
4% 8% 13% 17% 58%
5% 5% 25% 30% 35%
21% 33% 46%
5% 15% 25% 55%
13% 29% 21% 38%
10% 30% 30% 30%
8% 13% 25% 29% 25%
15% 25% 35% 25%
4% 29% 25% 21% 21%
25% 30% 25% 20%

6 Resilient companies survey
Sponsorship/ownership of sustainable development matters
Figure 3. Level of sponsorship/ownership of sustainability matters in the company
Base: 2012: 20, 2013: 24
Source: PwC analysis
It is clear that the majority of company boards have a responsibility to oversee their organisation’s sustainable development activities. This is a positive sign as it shows such companies take sustainable development matters seriously. However, the proportion of companies with board sponsorship of sustainable development declined to 63% in 2013 from 70% in 2012. Nevertheless, the ‘tone at the top’ remains central to determining the actions and options implemented within the company concerned.
2012
2013
70%
63%
20%
21%
5%
0%Operational departmental head
17%
Board
Exco
Head office/ group managers
5%
Role of sustainable development issues in strategic discussions and direction
Figure 4. Role of sustainability in strategic discussions and direction
Base: 2012: 20, 2013:24
Source: PwC analysis
4%
21% 10%
25%0%
No role
21%
Central roleSome role
Minimal role
65%
Major role
2012
2013
54%
0%

7PwC
Sustainable development continues to play a major role in strategic discussions. However, compared to 2012, more companies are now saying it plays a central role.
This is a positive trend as companies are realising how sustainable development can be beneficial in areas such as enhancing revenue, building brand value, facilitating better engagement with key stakeholders and increasing operational efficiencies.
By embedding sustainable development into their business strategies, companies can better identify opportunities and manage risks that fall outside of normal financial and operating risks.
Incorporation of sustainable development issues into risk management
Figure 5. Extent to which sustainability issues are incorporated into company’s risk management process
Base: 2012: 20, 2013: 24
Source: PwC analysis
A greater proportion of companies are incorporating sustainable development into their risk management processes than in 2012. This valuable exercise enables companies to gain insights for anticipating and responding to issues as they arise. The ability to manage risks has become a key driver of high performance, as companies balance the need to generate profits with the need to create broader value. Companies can create a competitive advantage by effective risk management, which should ultimately improve business performance.
30%50%
40%
15%
0%No role
17%
Fully intergrated
Some high-levelinclusion
Significant risks included
21%
All risks included
13%
2012
2013
15%

8 Resilient companies survey
Changing the way sustainable development is approached and embedded in business
Figure 6. Changes needed to transform the way companies approach sustainability
Base: 2012: 20, 2013:24
Source: PwC analysis
A business’ ability to respond to the challenge addressing sustainable development risks and opportunities is linked to the factors that support and facilitate changes necessary within society and the broader economy. In order of priority, the following factors were highlighted as most important for encouraging further mainstreaming of sustainable development:
• Informed investors and analysts;
• Informed customers;
• Access to a skilled talent base;
• Access to green technology;
• R&D/innovation capability; and
• Access to the green economy.
As in the 2012 survey, informed investors and analysts are recorded as the most critical factor for embedding sustainable development into business, followed by informed customers and skilled employees.
Most importantSignificantly important
Neither important nor unimportantMinimally importantLeast important
Access to greeneconomy
Access to greentechnology
Access to skilledtalent base
R&D/innovationcapability
Informed customers
Informed investorsand analysts
2013
2012
2013
2012
2013
2012
2013
2012
2013
2012
2013
2012
4% 17% 79%
5% 35% 60%
4% 21% 38%
15% 40% 30%
17% 33% 21%
5% 45% 30%
4% 29% 50% 17%
5% 25% 50% 20%
4% 29% 42% 17%
8% 13% 25% 29% 25%
15% 35% 35% 15%
4% 25% 25% 29% 17%
15% 35% 40% 10%
38%
15%
29%
10% 10%
8%

9PwC
The top-ranking categories confirm a suggestion made in the 2012 survey that the advancement of a green economy in South Africa will occur as a by-product of the actions taken in response to well-informed investors, employees and customers, rather than being the foundation for driving integrated management and reporting.
Education and raising stakeholders’ awareness to provide companies with a clear mandate to embed integrated management within their business is therefore crucial to effective, long-term progress.
Systems to drive mainstreaming of sustainable development
Figure 7. Requirements for driving mainstreaming of sustainability
Base: 2012: 20, 2013: 24
Source: PwC analysis
An increasing number of companies are realising that responsible people and an appropriate budget must be in place in order to mainstream sustainable development in their businesses.
A final step to implementing robust systems for driving integrated management is to allocate incentives and performance measurement throughout the organisation to individuals responsible for the process of mainstreaming. All three of these areas show an improving trend on last year’s findings.
YesPartiallyNo
2013
2012
2013
2012
2013
2012
Incentives andperformancemeasurement
Budget
Responsible people
5% 25% 70%
8% 88%
4% 29% 67%
4%
55%45%
17% 50% 33%
20% 40% 40%
10 Resilient companies survey
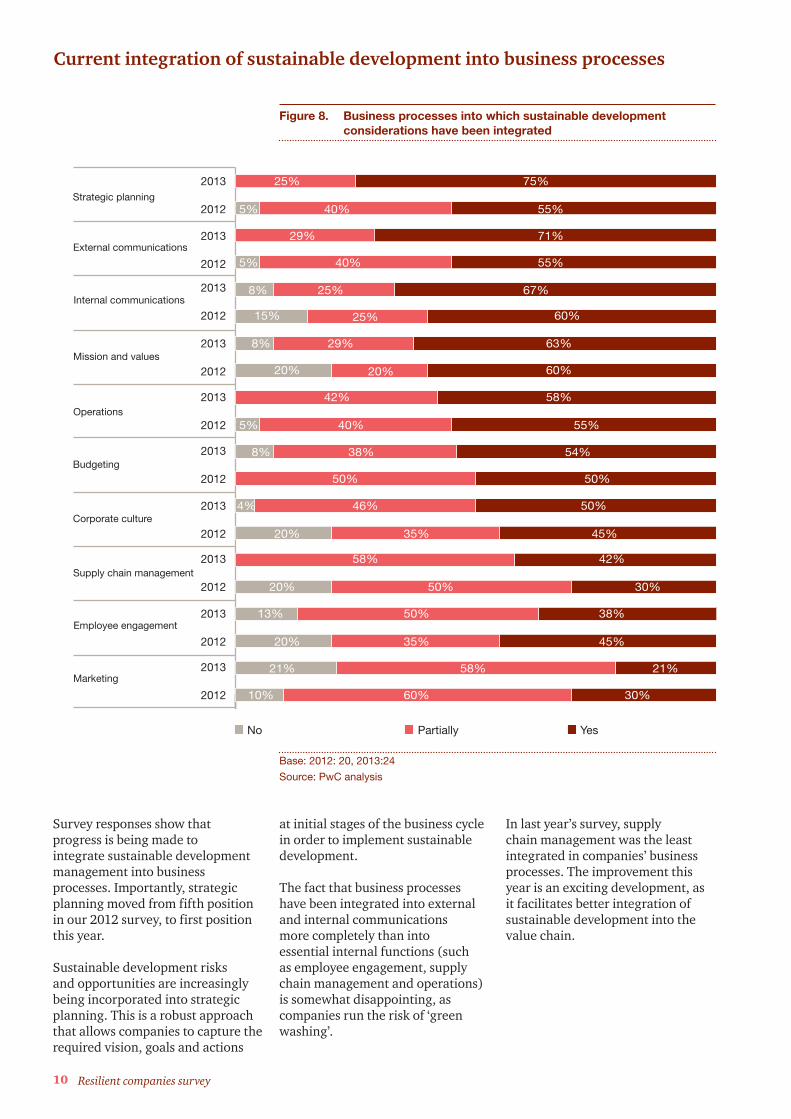
Current integration of sustainable development into business processes
Figure 8. Business processes into which sustainable development considerations have been integrated
Base: 2012: 20, 2013:24
Source: PwC analysis
Marketing
Employee engagement
Supply chain management
Corporate culture
Budgeting
Operations
Mission and values
Internal communications
External communications
Strategic planning
YesPartiallyNo
25%2013
2012
2013
2012
2013
2012
2013
2012
2013
2012
2013
2012
2013
2012
2013
2012
2013
2012
2013
2012
75%
5% 40% 55%
29% 71%
5% 40% 55%
25%8% 67%
25%15% 60%
8% 29% 63%
20% 20% 60%
42% 58%
5% 40% 55%
8% 38% 54%
50% 50%
4% 46% 50%
20% 35% 45%
58% 42%
20% 50% 30%
13% 50% 38%
20% 35% 45%
21% 58% 21%
10% 60% 30%
Survey responses show that progress is being made to integrate sustainable development management into business processes. Importantly, strategic planning moved from fifth position in our 2012 survey, to first position this year.
Sustainable development risks and opportunities are increasingly being incorporated into strategic planning. This is a robust approach that allows companies to capture the required vision, goals and actions
at initial stages of the business cycle in order to implement sustainable development.
The fact that business processes have been integrated into external and internal communications more completely than into essential internal functions (such as employee engagement, supply chain management and operations) is somewhat disappointing, as companies run the risk of ‘green washing’.
In last year’s survey, supply chain management was the least integrated in companies’ business processes. The improvement this year is an exciting development, as it facilitates better integration of sustainable development into the value chain.

11PwC
Measuring integrated management
Key performance indicators (KPIs) required to improve sustainable development efforts
Figure 9. Extent to which KPIs have been developed to measure, monitor and implement improvements for material sustainability issues
Base: 2012: 20, 2013: 24
Source: PwC analysis
Only two of the 24 companies surveyed have no performance measures in place to manage their material non-financial issues. Of the 22 that do, 46% indicate that their monitoring and improvement programmes are showing results and are of benefit to the organisation.
For the remaining 11 respondents, further effort may need to be focussed on the development of improvement programmes to track and reward progress. Improvement programmes are essential to meet targets established and are critical to benchmarking – without anything to measure against, it is very difficult for the company to realise its goals and achieve best practice performance levels.
20122013
No KPIs or monitoring andimprovement programme
KPIs, but no monitoring andimprovement programme
KPIs and monitoring,but no improvement programme
KPIs, monitoring and improvementprogramme in place, but not showing results
KPIs, monitoring and improvementprogramme in place and showing results
13%
10%
60%
29%
10%
46%
4%
15%
5%
8%

12 Resilient companies survey
Responsibility for material sustainable development KPIs
Figure 10. Levels at which material sustainability KPIs are monitored and managed
Base: 2012: 20, 2013:24
Source: PwC analysis
This year, a greater proportion of companies are allocating responsibility for performance to a senior level, which is in line with best practice. However, 20% of respondents confirm that this responsibility is still held by management at the operational level.
The King Report on Governance, 2009 (King III) strongly recommends ensuring board and board committee oversight for integrated management of material sustainable development risks and opportunities.
20122013
Operational departmental head
Operational environmental manager
Head office/group managers
Exco
Board
38%
35%
35%
8%
15%
42%
8%
5%
10%
4%

13PwC
Documentation for managing material sustainable development KPIs
Figure 11. Extent to which definitions, policies and detailed procedures for recording, analysing and managing material sustainability KPIs have been documented
Base: 2012: 20, 2013:24
Source: PwC analysis
Companies have not made significant progress in developing and implementing detailed procedures. This is concerning as in such cases KPI definitions and policies have not been translated into a plan for monitoring, reporting and reviewing KPI data.
Detailed procedures are also important as they guide operations with regard to managing material sustainable development issues in a proactive manner.
20122013
Not documented
Some high-level documentation
Draft definitions and policieshave been documented butnot implemented
Definitions and policies havebeen documented and implemented
Definitions and policies anddetailed procedures have beendocumented and implemented
46%
35%
40%
13%
5%
25%
13%
5%
20%
4%

14 Resilient companies survey
Level of maturity of sustainable development performance management
Figure 12. Current level of maturity of sustainability performance management
Base: 2012: 20, 2013: 24
Source: PwC analysis
A comparison of 2012 and 2013 survey results shows that a greater number of companies are beginning to mature in their sustainable development performance management processes through the experience of implementing their systems.
This year, more respondents have had their systems in place for one to two years, and the majority for more than two years. There is also a reported maturing in data review and sign-off processes when compared to our previous survey.
A smaller proportion of respondent’s companies are still at the early stages of sustainable development performance management, particularly regarding experience with data storage and back-up processes. This is an important aspect, as it protects the integrity of the data reported and meets data retention expectations.
Not in place Operational for 1-2 yearsJust established Operational for more than 2 years
Corrective actionprocedures
Data storage andback-up process
Data analysis/interpretation process
Data review andsign-off process
Data collectionprocess
Data reportingprocess
2013
2012
4% 13% 25% 58%
5% 35% 60%
20% 15% 25% 40%
13% 13% 29% 46%
8% 8% 33% 50%
5% 20% 15% 60%
4% 13% 29% 54%
8% 13% 25% 29% 25%
4% 13% 25% 58%
5% 20% 15% 60%
2013
2012
2013
2012
2013
2012
2013
2012
2013
2012 15% 30% 45%10%
21% 13% 42%25%
10% 15% 55%20%
5% 5% 70%20%
15PwC
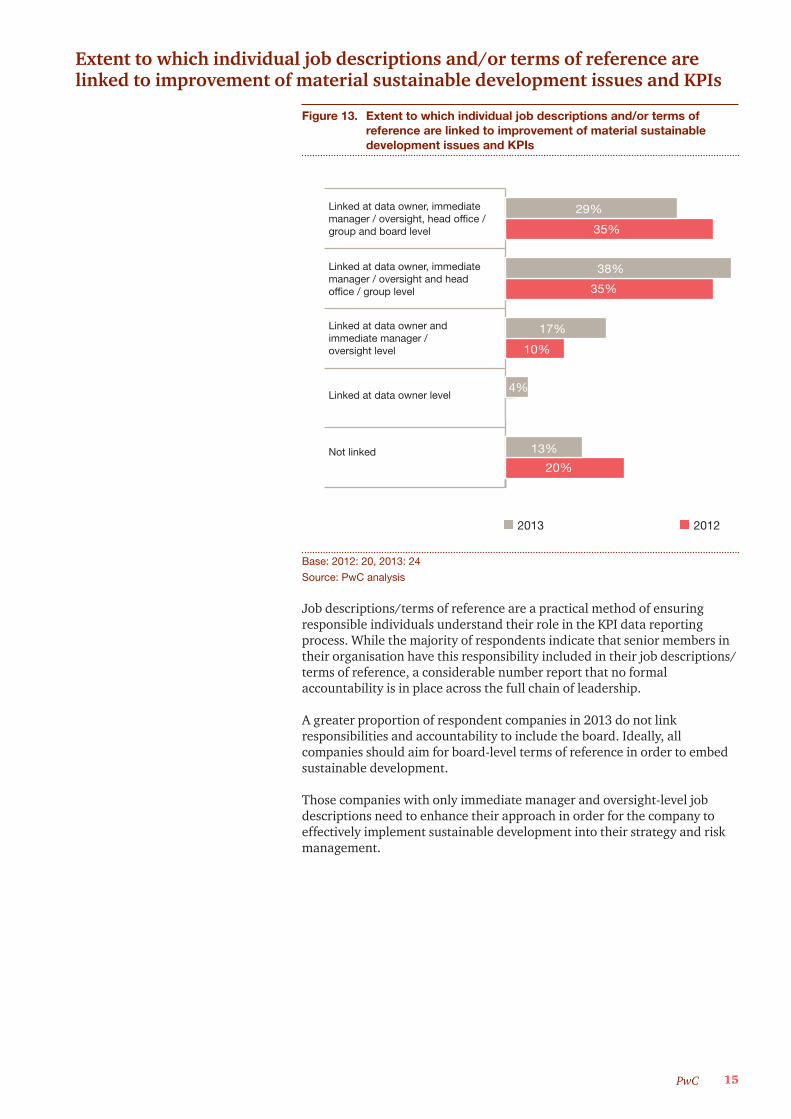
Extent to which individual job descriptions and/or terms of reference are linked to improvement of material sustainable development issues and KPIs
Figure 13. Extent to which individual job descriptions and/or terms of reference are linked to improvement of material sustainable development issues and KPIs
Base: 2012: 20, 2013: 24
Source: PwC analysis
Job descriptions/terms of reference are a practical method of ensuring responsible individuals understand their role in the KPI data reporting process. While the majority of respondents indicate that senior members in their organisation have this responsibility included in their job descriptions/terms of reference, a considerable number report that no formal accountability is in place across the full chain of leadership.
A greater proportion of respondent companies in 2013 do not link responsibilities and accountability to include the board. Ideally, all companies should aim for board-level terms of reference in order to embed sustainable development.
Those companies with only immediate manager and oversight-level job descriptions need to enhance their approach in order for the company to effectively implement sustainable development into their strategy and risk management.
Not linked
Linked at data owner level
Linked at data owner andimmediate manager /oversight level
Linked at data owner, immediatemanager / oversight and headoffice / group level
Linked at data owner, immediatemanager / oversight, head office /group and board level
20122013
29%
35%
38%
35%
17%
10%
4%
13%
20%

16 Resilient companies survey
Linking performance management systems and accountability for material sustainable development issues and KPIs
Figure 14. Extent to which balanced scorecard or other performance management systems are linked with responsibilities and accountability for measurement, monitoring and improvement of material sustainability issues and KPIs
Base: 2012: 20, 2013:24
Source: PwC analysis
We advocate that progress on material KPIs should be incentivised to ensure that positive progress and action is rewarded. Individuals act on what they are measured against, so linking individuals’ job descriptions and performance scorecards to material sustainable development issues should be seen as best practice.
There were similar results for this question in the 2012 and 2013 surveys, with 2013 showing a slightly lower percentage of sustainable development performance metrics at the board level.
A lack of incentives across all levels is unlikely to encourage behaviour that drives and improves innovation and integrated management.
Not linked
Linked at data owner level
Linked at data owner andimmediate manager /oversight level
Linked at data owner, immediatemanager / oversight and headoffice / group level
Linked at data owner, immediatemanager / oversight, head office /group and board level
20122013
29%
35%
33%
30%
21%
20%
4%
15%
13%

17PwC
Communicating integrated management
Formal identification and categorisation of stakeholders
Figure 15. Formal identification and categorisation of stakeholders
Base: 2012: 20, 2013: 24
Source: PwC analysis
The majority of respondents have undertaken a formal process of stakeholder identification and categorisation. This is a positive trend, confirming the increasing importance of dialogue regarding material sustainable development issues.
Without inclusive dialogue, a company will not be aware of all potential risks facing it. This exposure to risk may have a negative impact when stakeholders are not understood and their expectations and requirements are not effectively addressed.
71%
80%
20%
0%No
29%
Yes
Partially
2012
2013

18 Resilient companies survey
Extent to which stakeholder issues, concerns and/or expectations are taken into account in business processes
Figure 16. Extent to which stakeholder issues, concerns and/or expectations are taken into account in business processes
Base: 2012: 20, 2013:24
Source: PwC analysis
In 2012, it appeared that external reporting was driving business behaviour and therefore less focus was being placed on enhancing stakeholder inputs and improving such feedback within business processes, including human resources, products and suppliers.
This year, stakeholder feedback in the risk management and regulatory and compliance processes is reported as having increased. This is encouraging, as the resilience of businesses and the societies in which they operate depends on embedding stakeholder interests within core business processes and activities.
Other
Human resources
Supply chain andprocurement
Product development
Strategy
Regulatory and compliance
Risk management
External reporting33%2013
2012
2013
2012
2013
2012
2013
2012
2013
2012
2013
2012
2013
2012
2013
2012
4%4% 58%
5% 5% 30% 60%
4% 8% 38% 50%
5% 20% 25% 50%
4% 13% 33% 50%
5% 25% 30%40%
4% 38%33%25%
5% 40%30%20%5%
4% 33%21%21%21%
5% 30%15%30%20%
8% 4% 21% 46% 21%
10% 15%20%45%10%
4% 17%38%29%13%
5% 15%20%45%10%
5%
4%
Least consideration Little consideration Some consideration Significant consideration
Most consideration

19PwC
Engagement with suppliers regarding sustainable development initiatives
Figure 17. Engagement with suppliers regarding sustainable development initiatives
Base: 2012: 20, 2013:24
Source: PwC analysis
As was the case last year, most respondents appear to be in an early stage of collaboration with their suppliers. There remains a high proportion of companies that are not working directly with suppliers on material sustainable development risks and issues. This is a concern as such issues in the supply chain are increasingly recognised to either deliver on or hamper long-term value creation.
Not managing or responding to material sustainable development issues in the supply chain is recognised as a risk to business as it could have cost, supply interruption and reputational repercussions.
Don’t know
We are not concerned with oursuppliers’ sustainability initiatives
We are not working directly withour suppliers on their sustainability
We have started discussingsustainability initiatives withour suppliers
We are working directly with oursupplier and are measuringtheir performance
20122013
25%
25%
46%
45%
25%
30%
0%
4%
20 Resilient companies survey
Contacts
Alison Ramsden
Director Sustainability and Integrated Reporting +27 (0)11 797 4658 [email protected]
Jayne Mammatt
Director Sustainability and Integrated Reporting +27 (0)11 797 4128 [email protected]


Resilient companies survey | 22
© 2013 PwC. All rights reserved. PwC refers to the PwC network and/or one or more of its member firms, each of which is a separate legal entity. Please see www.pwc.com/structure for further details. This content is for general information purposes only, and should not be used as a substitute for consultation with professional advisors. PwC firms help organisations and individuals create the value they’re looking for. We’re a network of firms in 158 countries with more than 180 000 people who are committed to delivering quality in assurance, tax and advisory services. Tell us what matters to you and find out more by visiting us at www.pwc.com. (13-14030)