Hitchhiker’s Guide to Inflation in Libya - imf.org€™s Guide to Inflation in Libya ......
28
Hitchhiker’s Guide to Inflation in Libya Serhan Cevik and Katerina Teksoz WP/13/78
Transcript of Hitchhiker’s Guide to Inflation in Libya - imf.org€™s Guide to Inflation in Libya ......

Hitchhiker’s Guide to Inflation in Libya
Serhan Cevik and Katerina Teksoz
WP/13/78

© 2013 International Monetary Fund WP/13/78
IMF Working Paper
Middle East and Central Asia Department
Hitchhiker’s Guide to Inflation in Libya
Prepared by Serhan Cevik and Katerina Teksoz
Authorized for distribution by Ralph Chami
March 2013
Abstract
This paper presents an empirical investigation of inflation dynamics in Libya over the period 1964–2010, using cointegration and error correction models. While inflation inertia is found to be a key determinant of consumer price inflation, the econometric results indicate that government spending, money supply growth, global inflation, and exchange rate pass-through play central roles in the inflation process. These findings are broadly consistent with the experience of other countries that are natural resource dependent. We also find evidence that the imposition and subsequent removal of international sanctions on Libya had a noteworthy impact on consumer price inflation. Collectively, our estimates indicate that the deviations from an equilibrium path initiate significant adjustments in inflation dynamics, and that closer coordination between monetary and fiscal policies would improve the balance between economic growth and price stability.
JEL Classification Numbers: E31, E32, E58, F15, O10
Keywords: Inflation, money supply, exchange rate pass-through, international sanctions
Authors’ E-Mail Addresses: [email protected]; [email protected]
The authors would like to thank Abdul Abiad, Ramdane Abdoun, Abdullah Al-Hassan, Alberto Behar, Ralph Chami, Jemma Dridi, Selim Elekdag, Simon Gray, Tomas Mondino, Kia Penso, Mohammad Rahmati, Hossein Samiei, Fatih Yilmaz, and participants of the MCD Discussion Forum for their insightful comments and suggestions. Ashwaq Maseeh provided excellent research assistance.
This Working Paper should not be reported as representing the views of the IMF. The views expressed in this Working Paper are those of the author(s) and do not necessarily represent those of the IMF or IMF policy. Working Papers describe research in progress by the author(s) and are published to elicit comments and to further debate.

2
Contents Page
I. Introduction ............................................................................................................................3
II. A Brief Overview of Inflation Developments .......................................................................5
III. Theoretical Background and Empirical Methodology .........................................................8
IV. Data ....................................................................................................................................11
V. Estimating the Econometric Model .....................................................................................13
VI. Empirical Results ...............................................................................................................14
VII. Conclusion ........................................................................................................................19 Tables 1. Unit Root Test Results .......................................................................................................13 2. Determinants of Consumer Prices .....................................................................................16 3. Long-Run Equation and Short-Run Dynamics ..................................................................18 Figures 1. Money, Output Growth and Consumer Price Inflation ........................................................6 2. Composition and Structure of CPI .......................................................................................7 Appendix Tables A1. Pairwise Correlations ........................................................................................................24 A2. Cointegration Analysis ......................................................................................................24 A3. Vector Error Correction Estimates ....................................................................................25 A4. Variance Decomposition ...................................................................................................25 A5. Exchange Rate Chronology ..............................................................................................26 Appendix Figure A1: Impulse Responses ............................................................................................................27

3
I. INTRODUCTION
A methodical understanding of the underlying determinants of inflation reveals valuable insights for Libya’s post-revolution policymakers. The vast literature on inflation dynamics covers a wide range of theoretical and empirical issues in advanced and developing economies, but Libya presents a unique opportunity to look beyond the usual suspects. While demand pressures and supply constraints are undoubtedly important, analyzing inflation in a centrally-planned economy becomes more complicated because of a pricing system with administered measures and subsidies that keep consumer prices detached from the level implied by supply and demand conditions at home and abroad.1 Furthermore, international sanctions imposed on Libya further obscure the analysis of inflation dynamics by causing distortions in trade and distribution of goods and services. Accordingly, this paper investigates empirically the underlying determinants of consumer price inflation in Libya during the period 1964–2010, focusing on the role of monetary aggregates, the exchange rate, the output gap, government spending, and international sanctions. While the empirical results presented in this paper should be viewed with caution because of data limitations, the analysis not only presents an interesting case study about the forces driving—and propagating—the inflation process in a state-dominated economy, but it is also important for assessing the appropriate macroeconomic policy mix in post-revolution Libya. There has been no systematic empirical analysis of inflation dynamics in Libya, aside from a dated exception. Friedman (1963) famously argued that “inflation is always and everywhere a monetary phenomenon in the sense that it is and can be produced only by a more rapid increase in the quantity of money than in output.” Although many scholars and policymakers have questioned the role of money supply, others, including the European Central Bank, have continued to emphasize the evolution of monetary aggregates as an important indicator of inflation over the medium term. A plethora of empirical studies has shown that money is indeed a significant variable in determining the behavior of consumer prices and a critical channel for monetary policy transmission in advanced and developing economies (see, for example, Wang and Wen, 2005; Sims and Zha, 2006; Hill, 2007). But there has been little empirical analysis of inflation dynamics in Libya specifically, with the single exception of Darrat (1985) who showed that higher money supply growth tends to raise consumer price inflation. This paper’s objective, therefore, is to fill the gap by developing a model of inflation dynamics—based on a conceptual framework inspired by the New Keynesian Phillips Curve (NKPC)—and to shed light on the determinants of consumer price inflation in a centrally-planned economy dominated by an ubiquitous public sector.
1 Nonmarket economies have long showcased the absence of inflation along with full employment as evidence of the superiority of the centrally-planned system (see, for example, Sahay and Vegh, 1995). Libya’s economic model, however, lacked effective control over the money supply, which, along with specific domestic and external factors led to periods of repressed inflation followed by price overshooting.

4
Empirical results confirm a statistically significant relationship between an array of factors and the behavior of consumer price inflation. We build a model of inflation dynamics in Libya, applying cointegration analysis and error-correction modeling (ECM) to examine the long-run and short-run interactions between inflation and its determinants. We also estimate a vector error correction model (VECM), using the same set of variables, to complement the robustness of the analysis. The results indicate that deviations from the equilibrium initiate fast and substantial dynamical adjustments in inflation as measured by the consumer price index (CPI). The analysis shows that inflation inertia, money supply growth, and government spending are the major determinants of consumer prices over the long run. While innovations in monetary growth account for about 1 percent of the forecast error variance of inflation, fiscal innovations account for 7 percent of the forecast error variance of inflation, which is consistent with the impact of procyclical fiscal policy on domestic monetary liquidity. This is not a surprising result, because the Libyan economy is heavily dependent on the state-owned hydrocarbon sector that accounts for over 70 percent of GDP and 90 percent of total fiscal revenue. Accordingly, in Libya as in most resource-dependent economies, the fiscal policy stance has a ubiquitous influence on the economic cycle and inflation dynamics. As expected, we also find evidence that global inflation and the exchange rate pass-through effect have statistically significant effects on domestic inflation in Libya. On the other hand, the output gap, as measured by the deviation of real GDP (or nonhydrocarbon GDP) from its potential level, does not appear to have a permanent effect on the general level of consumer prices over the long term. Our econometric model of inflation also takes into account the impact of the international sanctions that were imposed on Libya. Libya was subject to international sanctions and embargoes during the period 1983–99, triggering shocks throughout the economy. As outlined by Bahgat (2004) in an extensive review, economic restrictions were imposed by the United States in 1983 with further re-enforcement in the 1990s, by the United Kingdom in 1984, and the United Nations Security Council in 1992; these caused acute distortions in trade and distribution of goods and services until their suspension in 1999 and lifting altogether in 2003. Accordingly, we measure the impact of sanctions by using a binary variable that captures unobserved effects on domestic prices, which turns out to be highly significant with an economically large effect on the behavior of the CPI. Although the relationships between consumer price inflation and the variables included in our model have likely changed over a long time span, the empirical results are robust and show that deviations from the equilibrium path prompt fast and significant dynamic adjustments. Ensuring an appropriate balance between economic growth and price stability requires closer coordination between monetary policy and fiscal policy. Given Libya’s longstanding commitment to the pegged exchange rate regime, closer coordination between monetary policy and fiscal policy is necessary to maintain an appropriate balance between economic growth and price stability, and to alleviate inflationary pressures in the post-revolution period. In this context, the Central Bank of Libya (CBL) needs to improve its

5
liquidity management and monetary operations as well as lobby for fiscal restraint in support of macro-financial stability. Prior to the revolution, the CBL was facing difficulties in reducing persistent excess liquidity in the banking system, partly because of structural constraints that, to date, limit domestic financial intermediation and encourage banks to accumulate a growing amount of deposits at the central bank. By strengthening the interbank money market infrastructure, the CBL can allow commercial banks to better manage their balance sheets and help improve the distribution of liquidity among large national and small regional banks, which would in turn support domestic capital market deepening and improve the effectiveness of monetary policy under a pegged exchange rate regime. The remainder of this paper is organized as follows. Section II provides an overview of inflation dynamics in Libya, followed by an outline of the theoretical background in Section III. Sections IV and V describe data sources and the salient features of our empirical methodology, respectively. The econometric results are presented in Section VI; and we offer concluding remarks in Section VII with a focus on implications for monetary policy after the revolution.
II. A BRIEF OVERVIEW OF INFLATION DEVELOPMENTS
Consumer price inflation was historically moderate, but has also shown considerable volatility due to policy changes and exogenous shocks. Inflation averaged 5.0 percent a year during the period 1964–2010, but the behavior of consumer prices has been volatile, with periods of low and stable inflation followed by sudden bursts (Figure 1).2 After increasing by 82 percent in the 1990s, the CPI fell by 21 percent in the space of five years until 2004. Deflation was continuous and broad-based, affecting all subcategories of the CPI, with the exception of healthcare and transportation, which remained constant over this period. More recently, consumer price inflation accelerated from 6.3 percent in 2007 to 10.4 percent in 2008 and then subsided considerably to 2.4 percent in 2009–10. Other factors, including policy changes regarding subsidies and price controls, as well as international sanctions and exogenous price shocks, have contributed to the rise and fall of inflation over the period 1964–2010. The main stylized facts appear to be monetary disequilibria (i.e., rapid increases in the money supply) driven by significant changes in government spending as a share of GDP and external disequilibria (i.e., international sanctions and the volatility of commodity prices). Although the CBL has maintained an exchange rate regime pegged to the Special Drawing Rights (SDR) since 2003, occasional adjustments in the level of the exchange rate led to an increase in the cost of imported goods that account for about 75
2 The current version of the CPI, published since 2004, is based on the 2003 Economic and Social Survey for Households and covers Benghazi, Sabha, and Tripoli, whereas previous versions of the CPI were based on outdated household surveys and biased towards urban consumers living in Tripoli.

6
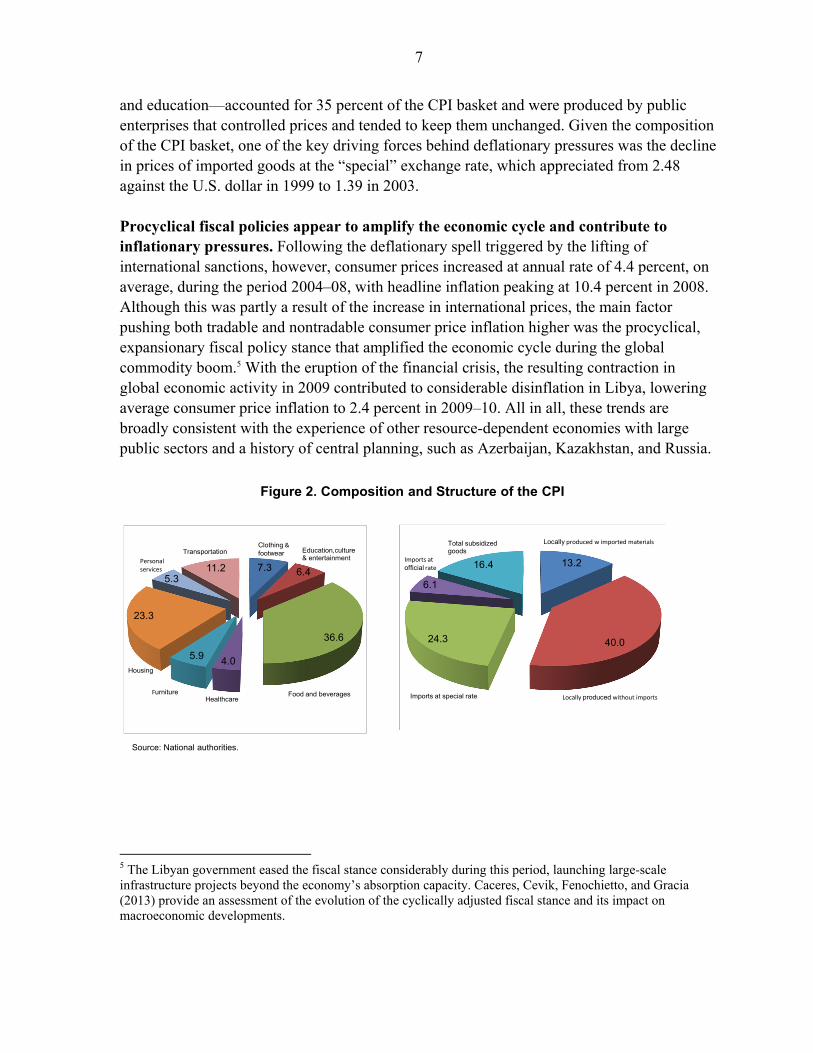
percent of the CPI basket.3 The volatility of food prices is particularly important, because the food component represents 37 percent of the CPI basket, even though the government subsidizes a cluster of goods.4 The relationship between money supply and inflation broke down in the early 2000s, mainly because of the unification of exchange rates. Money supply growth and consumer price inflation exhibited a high degree of contemporaneous correlation between the mid-1980s and 2000, although this relationship broke down in the early 2000s. With an average increase of 9.2 percent a year in money supply, Libya experienced a bout of deflation with consumer prices declining at an annual rate of 7.2 percent. The main factors behind this deflationary spell during a period of sustained monetary expansion were the lifting of international trade sanctions, the unification of various exchange rates, and the one-off exemption of public enterprises from all taxes and customs duties as well as an episode of trade liberalization that reduced import tariffs by 50 percent. First, by limiting trade, international sanctions imposed on Libya in the early 1980s resulted in scarcity and higher domestic prices; these subsided after the suspension of the sanctions in 1999. Second, imports at the “special” exchange rate accounted for about 36 percent of the CPI basket, in addition to subsidized items that accounted for about 23 percent of the basket (Figure 2). Third, locally produced commodities and services—mainly utilities, healthcare,
3 The Libyan dinar (LD) has been officially pegged to the SDR at LD1 = SDR 0.5175 since June 14, 2003. The chronology of Libya’s exchange rate regimes is presented in Appendix Table A5.
4 The subsidy system includes both implicit subsidies in the form of fixed low prices for petroleum products, natural gas, electricity, and water; and explicit subsidies, mainly for food items, which consist of dry yeast, flour, milk, pasta, rice, semolina, sugar, tea, tomato paste, and vegetable oil. These subsidized food items represent about 17 percent of the CPI basket.
Figure 1. Money, Output Growth, and Consumer Price Inflation, 1964–2010
-20
-10
0
10
20
30
40
50
60
70
1965 1970 1975 1980 1985 1990 1995 2000 2005 2010
Broad Money
Inflation
Money Supply Growth and Inflation(In percent)
-30
-20
-10
0
10
20
30
40
1965 1970 1975 1980 1985 1990 1995 2000 2005 2010
Real GDP GrowthInflation
Real GDP Growth and Inflation (In percent)
Source: Central Bank of Libya; and IMF staff.
7
and education—accounted for 35 percent of the CPI basket and were produced by public enterprises that controlled prices and tended to keep them unchanged. Given the composition of the CPI basket, one of the key driving forces behind deflationary pressures was the decline in prices of imported goods at the “special” exchange rate, which appreciated from 2.48 against the U.S. dollar in 1999 to 1.39 in 2003. Procyclical fiscal policies appear to amplify the economic cycle and contribute to inflationary pressures. Following the deflationary spell triggered by the lifting of international sanctions, however, consumer prices increased at annual rate of 4.4 percent, on average, during the period 2004–08, with headline inflation peaking at 10.4 percent in 2008. Although this was partly a result of the increase in international prices, the main factor pushing both tradable and nontradable consumer price inflation higher was the procyclical, expansionary fiscal policy stance that amplified the economic cycle during the global commodity boom.5 With the eruption of the financial crisis, the resulting contraction in global economic activity in 2009 contributed to considerable disinflation in Libya, lowering average consumer price inflation to 2.4 percent in 2009–10. All in all, these trends are broadly consistent with the experience of other resource-dependent economies with large public sectors and a history of central planning, such as Azerbaijan, Kazakhstan, and Russia.
5 The Libyan government eased the fiscal stance considerably during this period, launching large-scale infrastructure projects beyond the economy’s absorption capacity. Caceres, Cevik, Fenochietto, and Gracia (2013) provide an assessment of the evolution of the cyclically adjusted fiscal stance and its impact on macroeconomic developments.
Figure 2. Composition and Structure of the CPI
7.3 6.4
36.6
4.05.9
23.3
5.311.2
Housing
Personal services
TransportationClothing & footwear Education,culture
& entertainment
Food and beveragesHealthcare
Furniture
13.2
40.024.3
6.1
16.4
Imports at special rate
Imports at official rate
Total subsidized goods
Locally produced w imported materials
Locally produced without imports
Source: National authorities.

8
III. THEORETICAL BACKGROUND AND EMPIRICAL METHODOLOGY
There is a vast body of theoretical and empirical evidence on inflation dynamics in both developed and developing countries. Inflation is usually modeled as an interaction of supply and demand for money, a mechanism of mark-up pricing, or in terms of external and domestic factors leading to disequilibria. We incorporate various macroeconomic factors, including the widely debated monetary aggregates, to provide a thorough empirical evaluation of the behavior of consumer price inflation in Libya. Under normal circumstances, inflation in the long run should be positively related to money supply growth, as long as economic growth is included in the regression and there is no reason to expect significant changes in the velocity of money. The impact of money supply growth on the behavior of domestic prices comes through the changes in aggregate demand, which in turn are influenced by interest rates or other measures of the availability of credit. Building upon the classical quantity theory of money, changes in the CPI are predominantly related to changes in the quantity of money. The key link between monetary developments and consumer prices is the connection between actual and preferred real money balances, which in turn is related to real income and a measure of the opportunity cost of holding money.6 Using the logarithm of the variables, except for interest rates, and assuming a unitary price and income elasticity, the (real) money demand relationship can be asserted as: (1) m – p = β0 + y – βr (R – r) – v, While prices, money supply, and real income contain stochastic trends, the evidence for stochastic trend in interest rates is typically vague. Accordingly, to obtain a consistent estimate of the money demand function, the linear combination, as expressed in Equation (1), should define a stationary process. That is, assuming a stationary spread and constant velocity, the real stock of money should be cointegrated with real income.7 Accordingly, taking the first differences of Equation (1), we obtain the following long-run equilibrium relationship: (2) (mt – mt-1) – (pt – pt-1) = (yt – yt-1) – (vt – vt-1),
6 The opportunity cost is related to the lost return on assets bearing higher interest than the interest-bearing components of the monetary aggregate taken into consideration.
7 The velocity of money is usually assumed to follow a stationary process over time, such as mean or trend reversion, which allows money supply growth to have a predictable effect on income growth. Although this is not a controversial assumption in the literature, it is a strong hypothesis even for advanced economies; it may possibly be unrealistic in developing countries, where the changes in financial technologies and in patterns of spending may occur more quickly, and where discretionary approaches rather than rule-based monetary policy tend to be the norm, leading to an inflation bias, as described by Kydland and Prescott (1977).

9
which relates real money growth to real income growth and the changes in velocity. Excluding the changes in the spread, because an equilibrium change in inflation only affects the level of interest rates but not the spread, Equation (2) is simply a restatement of the quantity theory of money in growth rates. Accordingly, a one-time increase in money supply growth leads to an increase of equal magnitude in the rate of consumer price inflation over the long run, such that real money growth, after all dynamical adjustments, moves toward a par with real income growth and the changes in velocity (Friedman, 1971).8 The impact of money supply growth on consumer prices is not always and everywhere easy to identify. While Nicoletti and Altimari (2001) and Gerlach and Svensson (2003) find that the predictive power of money growth for inflation is only minor relative to real variables like the output gap and the real money gap, Neumann (2003) and Neumann and Greiber (2004) show the relevance of trend money growth for core inflation. DeGrauwe and Polan (2001), on the other hand, argue that the long-run relationship between nominal money growth and inflation in countries with low inflation is not as strong as commonly assumed, implying that the transmission process from money supply growth to consumer prices tends to be erratic. Additionally, empirical studies do not provide conclusive evidence on the time horizon over which changes in money supply affect the inflation process (Shapiro and Watson, 1988; Christiano, Eichenbaum, and Evans, 1999). These empirical irregularities observed in advanced economies, however, may not necessarily be relevant to an underdeveloped and resource-dependent economy like Libya with a dominant public sector and assorted price controls. Indeed, empirical studies focusing on emerging markets have confirmed that the correlation between inflation and money growth is negative for half of the sample (Mohanty and Klau, 2008).9 Furthermore, even when the changes in money supply appear to be correlated with the changes in consumer prices, an empirical model of inflation based exclusively on monetary variables may still fail to capture the underlying dynamics, especially working though the impact of government spending on domestic liquidity and aggregate demand in a hydrocarbon-exporting economy. A model that relates consumer price inflation to output and production costs could be a useful conceptual framework. The NKPC model is extensively used in the macroeconomic literature to describe a simple relationship between inflation, expectations for future inflation, and the real marginal cost of production. Accordingly, the rate of inflation will tend to increase when real marginal costs increase and when economic agents expect higher prices in 8 The direction and the strength of the dynamical adjustments, in particular the transitional division of the effect between income growth and consumer price inflation and the effects on interest rates, are ultimately characterized by the transmission mechanism.
9 With a sample of countries that includes Taiwan, Thailand, Brazil, Chile, the Czech Republic, Hungary, India, Korea, Malaysia, Mexico, Peru, the Philippines, Poland, and South Africa, this study finds that excess money supply was related to inflation in only some countries and argues that money supply may have lost relevance for predicting inflation under the impact of financial liberalization and innovation.

10
the future. In a pioneering approach, Calvo (1983) described the behavior of consumer price inflation as a function of:
(3) pt – pt-1 = πt = αEt πt+1 + θ θ
θ m ,
where Et πt+1 is expected inflation at time t+1 and m is the deviation of real marginal cost from its frictionless level.10 However, the lack of data on inflation expectations and real marginal cost makes it problematic to implement the Calvo model empirically. Furthermore, even with no data constraints on future inflation expectations, the NKPC framework fails empirically to take into account inflation persistency. As argued by Fuhrer and Moore (1995) and Gali and Gertler (1999), the inclusion of lagged inflation tends to improve the fit of empirical estimations. Since survey data on inflation expectations are not available and national accounts do not contain information on the marginal cost of production, we use past values of inflation and monetary aggregates as a proxy for inflation expectations—a reasonable assumption when agents tend to formulate inflation expectations in a backward-looking manner. Similarly, assuming that a high (low) level of production relative to potential output would lead to an increase (decrease) in factor costs, we use a measure of the output gap as a proxy for the unobservable real marginal cost of production. This hybrid model of consumer price inflation can be expressed as: (4) πt = απt-1 + βmt-1 + γ(yt – ӯ), where πt-1 is lagged inflation, mt-1 is lagged money supply growth, and (yt – ӯ) represents the output gap as measured by the deviation of output from its potential level. Despite difficulties in measuring potential output, the deviation contains valuable information for predicting short-run inflationary pressures. Although this is a reasonable representation of a closed economy, it would not capture the full spectrum of inflation dynamics in an open economy where the prices of imported consumption and intermediate goods, as well as the exchange rate pass-through effect, matter for the behavior of domestic prices. Global inflation and the exchange rate should be taken into account when imports represent a substantial part of consumption and intermediate goods. In an open economy, international prices and the exchange rate channel are among the important factors influencing the marginal cost of production and domestic prices through import prices and the changes in aggregate demand. Hence, given that imports account for a substantial share of consumption and intermediate goods in Libya, global inflation and the exchange rate need to be incorporated into the model. Furthermore, international sanctions imposed on Libya are taken into account in the modeling of inflation dynamics as a cause of supply bottlenecks and 10 Gali and Gertler (1999) provide a seminal exploration of the closed-economy version of the NKPC model, Balakrishnan and Lopez-Salido (2002) present an open-economy variation on the model.

11
other distortions. For example, while higher cost of imports, because of trade restrictions and additional transportation costs, would escalate the extent of changes in factor costs and lead to higher consumer price inflation, international sanctions could also lower a country’s export earnings and thereby lower aggregate demand, which in turn may have a dampening effect on domestic prices.11 Likewise, by creating a closed economy, international sanctions and embargoes can alter various relationships affecting the inflation process. For example, as mentioned earlier and as shown in Figure 1, the relationship between money supply growth and changes in the CPI became closer during the period of sanctions, but broke down following the removal of sanctions in 1999.12 Higher government spending, financed by hydrocarbon earnings in the case of Libya, tends to exert inflationary pressures. Although the canonical NKPC models do not include fiscal variables, government spending could be an important driving force of inflation dynamics in a resource-dependent economy dominated by a public sector that employs the great majority of the workforce. The fiscal theory underlines that such an economy is more likely to use seigniorage to finance public expenditure beyond tax revenue. Although the empirical literature tends to look at the impact of large and persistent government budget deficits on inflation, changes in the magnitude and pattern of government spending, even without running into a deficit, may influence inflation. In the case of Libya, an increase in hydrocarbon revenues creates fiscal space for higher government spending as a share of GDP on goods and services, as well as wages and salaries, and is expected to result in an expansion of domestic demand and exert persistent inflationary pressures. Therefore, our conceptual model of consumer price inflation can be stated as a function of: (5) πt = απt-1 + βmt-1 + γ(yt – ӯ) + δπwp + θexrt + λsanct + φgovt where domestic inflation (πt) is modeled as a function of its lag (πt-1), lagged money supply growth (mt-1), and the output gap (yt – ӯ) as measured by the deviation of output from its potential level, world inflation (πwp), the nominal exchange rate against the U.S. dollar (exrt), international sanctions (sanct), and government spending as a share of GDP (govt).
IV. DATA
A long span of annual data, covering the period 1964–2010, allows an in-depth analysis of inflation dynamics. The dataset, which includes the CPI, broad money supply, the nominal exchange rate against the U.S. dollar, GDP, and government spending, consists of
11 Economic sanctions imposed against the South African government in the 1980s had similar effects on inflation dynamics, although South Africa was in a position to pursue a policy of import substitution industrialization. 12 A similar pattern emerged in South Africa following the end of the apartheid regime, when the lifting of sanctions led to greater openness to international trade.

12
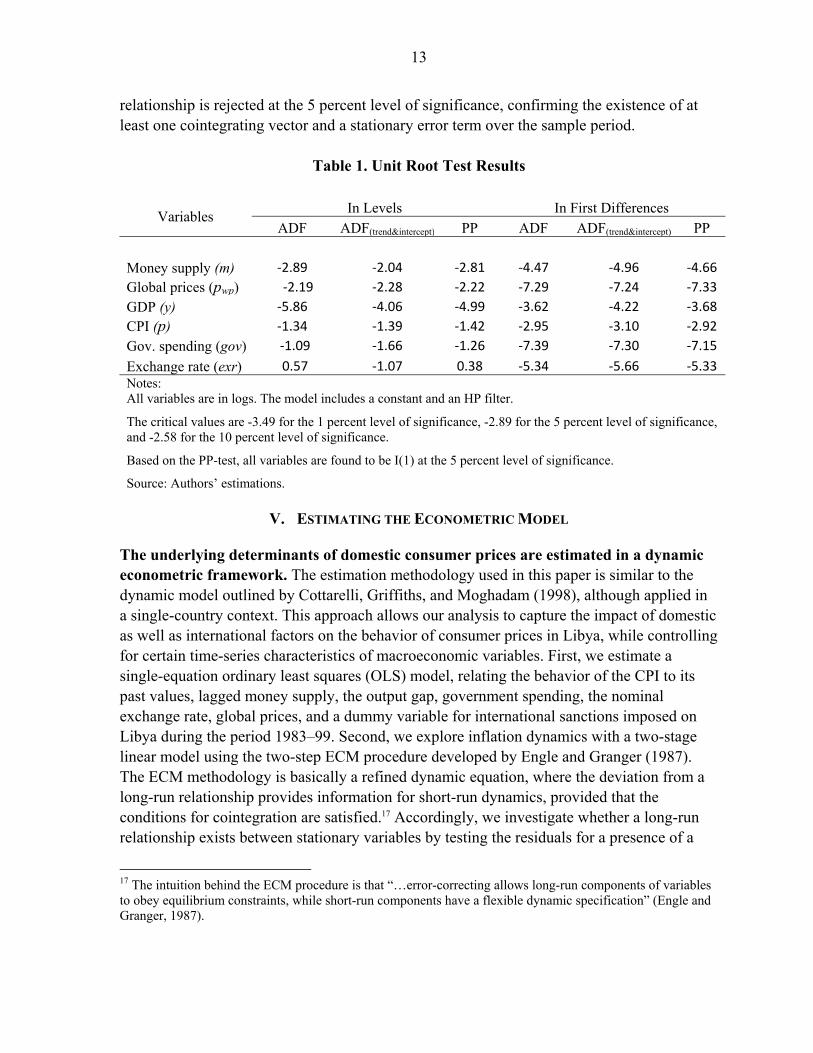
annual observations from 1964 to 2010, compiled from the IMF’s International Financial Statistics and World Economic Outlook databases and from the CBL. We estimate the output gap by applying the Hodrick-Prescott (HP) filter to decompose real GDP into trend and cyclical components.13 Although the HP filter provides a reasonable approximation, it ignores potential information from other macroeconomic variables, which may be informative about the size of the output gap, and it suffers from the end-point problem. Since the trend follows actual GDP more closely at the beginning and end of the estimation period than in the middle, we mitigate the end-point problem, to a certain extent, by extending the output series with forecasts. We also take into account the impact of international sanctions imposed on Libya by utilizing a binary dummy variable as an exogenous regressor, which has the value of 1 for each observation during the sanction period 1983–99. The results indicate the existence of at least one cointegrating vector for all variables and a stationary error term over the sample period. Before estimating the model, we conduct a pairwise correlation analysis, presented in Appendix Table A1, which shows strong association between global and domestic inflation, between money supply growth and domestic inflation, and between government spending and money supply growth. However, since regressing non-stationary time series can lead to biased coefficients and seemingly significant results while there is actually no underlying association between variables (i.e. spurious regressions), we use the Augmented Dickey-Fuller (ADF) and Phillips–Perron (PP) tests to stationarity properties of the variables, and determine the optimal lag order for the model used in this study according to the Akaike Information Criterion (AIC).14 The results, presented in Table 1, confirm the existence of a cointegrating vector with an optimal lag length of four.15 We also apply the maximum likelihood cointegration methodology developed by Johansen (1988) and Johansen and Juselius (1990), as it allows for testing cointegration in a system of equations in one step and also avoids a priori assumptions of endogeneity or exogeneity of variables. The Johansen cointegration procedure evaluates whether a long-run linear combination of variables is stationary, with a null hypothesis that the number of cointegrating vectors is less than or equal to the cointegrating rank.16 The results, presented in Appendix Table A2, indicate that the null hypothesis of no cointegrating
13 The HP filter is essentially an algorithm that removes low frequency variations—cycle—and smoothes the original time series to its stochastic trend (Hodrick and Prescott, 1997). In this paper, we use a smoothing parameter value of 6.5 for annual data as suggested by Ravn and Uligh (2002). 14 The objective of the unit root tests is to validate the null hypothesis that a series contains a unit root. If the null hypothesis can be rejected then the variable is stationary. If not, the series should be transformed through differencing until stationarity is established. The most common occurrence in macro-financial variables is that the first-differenced values are stationary, in which case the variable is integrated of order one. 15 Both test results indicate that the variables are stationary upon first differencing (integrated of order one) and some linear combination of the variables is stationary in levels (integrated of order zero). The unit root tests are based on specifications with a constant term included, although alternative specifications, including both a constant and a deterministic trend, also produce similar results. 16 Hamilton (1994) provides a comprehensive presentation of the cointegration framework and alternative tests.
13
relationship is rejected at the 5 percent level of significance, confirming the existence of at least one cointegrating vector and a stationary error term over the sample period.
Table 1. Unit Root Test Results
Variables In Levels In First Differences
ADF ADF(trend&intercept) PP ADF ADF(trend&intercept) PP
Money supply (m) -2.89 -2.04 -2.81 -4.47 -4.96 -4.66
Global prices (pwp) -2.19 -2.28 -2.22 -7.29 -7.24 -7.33
GDP (y) -5.86 -4.06 -4.99 -3.62 -4.22 -3.68
CPI (p) -1.34 -1.39 -1.42 -2.95 -3.10 -2.92
Gov. spending (gov) -1.09 -1.66 -1.26 -7.39 -7.30 -7.15
Exchange rate (exr) 0.57 -1.07 0.38 -5.34 -5.66 -5.33 Notes: All variables are in logs. The model includes a constant and an HP filter.
The critical values are -3.49 for the 1 percent level of significance, -2.89 for the 5 percent level of significance, and -2.58 for the 10 percent level of significance.
Based on the PP-test, all variables are found to be I(1) at the 5 percent level of significance.
Source: Authors’ estimations.
V. ESTIMATING THE ECONOMETRIC MODEL
The underlying determinants of domestic consumer prices are estimated in a dynamic econometric framework. The estimation methodology used in this paper is similar to the dynamic model outlined by Cottarelli, Griffiths, and Moghadam (1998), although applied in a single-country context. This approach allows our analysis to capture the impact of domestic as well as international factors on the behavior of consumer prices in Libya, while controlling for certain time-series characteristics of macroeconomic variables. First, we estimate a single-equation ordinary least squares (OLS) model, relating the behavior of the CPI to its past values, lagged money supply, the output gap, government spending, the nominal exchange rate, global prices, and a dummy variable for international sanctions imposed on Libya during the period 1983–99. Second, we explore inflation dynamics with a two-stage linear model using the two-step ECM procedure developed by Engle and Granger (1987). The ECM methodology is basically a refined dynamic equation, where the deviation from a long-run relationship provides information for short-run dynamics, provided that the conditions for cointegration are satisfied.17 Accordingly, we investigate whether a long-run relationship exists between stationary variables by testing the residuals for a presence of a
17 The intuition behind the ECM procedure is that “…error-correcting allows long-run components of variables to obey equilibrium constraints, while short-run components have a flexible dynamic specification” (Engle and Granger, 1987).

14
unit root. In the first step, Equation (6) is considered to represent a long-run cointegration relationship as long as variables follow similar stochastic trends and the residuals are stationary: 6
where is the logarithm of the CPI; is a vector of explanatory variables; and is the error term. The model is estimated by the OLS approach to obtain coefficients as well as to test the stationarity properties of the residuals, from which follows cointegration. In the second step, the model describes how these parameters behave in the short-run consistent with a long-run cointegrating relationship. Given that cointegrated series exhibit a stochastic component and share a long-term equilibrium relationship, if a set of variables are cointegrated, then there exists a valid error correction representation as expressed in Equation (7):
7 ∆ β0
1
0
β
1
11
where ∆ is the rate of inflation derived from the first difference of the logarithm of the CPI; X is a vector of explanatory variables; s and q are number of lags defining short-run dynamics, and is the lagged residual variable, which is the error-correction term. This model links the change in the CPI to past equilibrium errors, as well as to past values of inflation and other determinants. The weight of the error correction term called “loading coefficient” measures the speed at which prior deviations from the equilibrium are corrected.
VI. EMPIRICAL RESULTS
The significance of lagged inflation indicates that the inflation process has been largely influenced by its past behavior. The results, presented in Table 2, are based on four different specifications of the model and show that the relationships between the logarithm of the CPI and explanatory variables are statistically significant in most specifications. We also find that the estimated coefficients are fairly robust to the inclusion of a constant, which is not statistically significant. Inflation inertia, as measured by the estimated coefficient on lagged inflation, is statistically significant with an economically large positive impact. Over the long run, higher past inflation appears to be the major determinant of the current value of the CPI, with a coefficient ranging from 0.70 to 0.90 according to various specifications of the model. Such a high degree of inflation inertia may reflect backward-looking adjustments in wages as well as gradual adjustments in administered prices and subsidies.

15
Table 2. Determinants of Consumer Prices, 1964–2010
Variables (1) (2) (3) (4)
Constant 0.31 - - -
[1.218]
Lagged money supply (mt-1) 0.04 0.04 0.04 0.003 [1.749] [4.370] [4.046] [0.269]
Lagged CPI (pt-1) 0.74 0.89 0.89 0.70 [13.073] [58.443] [54.381] [16.030]
Output gap (yt – ӯ) - - -0.03 0.20 [-0.436] [3.062]
Government spending (govt) 0.04 0.04 0.05 0.01 [2.439] [5.589] [2.354] [0.700]
Global prices (pwp) 0.07 - - 0.12 [3.476] [4.732]
Nominal exchange rate (exrt) -0.10 -0.06 -0.08 -0.06
[-4.410] [-3.677] [-2.447] [-2.504]
International sanctions (sanct) 0.07 0.05 0.05 0.06
[3.355] [2.410] [2.397] [3.725]
Observations 41 41 41 41
Adjusted R2 0.998 0.997 0.998 0.998
Breusch-Godfrey LM Test 0.81 0.11 0.14 0.33
Jarque-Berra Normality Test 0.54 0.62 0.66 0.83
Heteroskedasticity Test (p-value) 0.62 0.79 0.86 0.79
AIC -4.08 -3.86 -3.81 -4.27
SIC -3.83 -3.65 -3.56 -3.98
Log Likelihood 89.55 84.06 84.17 94.55 Notes: The estimation method is OLS; the dependent variable is the logarithm of the CPI.
t-statistics are reported in square brackets, with bold coefficients indicating significance at the 5 percent level.
Residual tests p-values. LM test indicates no serial correlation. Residuals are normally distributed. No evidence of heteroskedasticity is found, and the estimates are robust to the inclusion of a constant.
Source: Authors’ estimations.
Money supply has a stable long-run relationship with consumer prices, with a tendency to exert inflationary pressures. Monetary growth appears to be associated with an increase in consumer prices over the long run, with the estimated coefficient on lagged money supply remaining statistically significant across various specifications of the model, except when the output gap is included in the regression. Moreover, innovations in money supply account for about 1 percent of the forecast error variance of the changes in the CPI. Although price shocks may also affect money supply over the long run, we find that the importance of price

16
shocks is negligible, as the largest share in the forecast error variance of money supply is accounted for by its own shocks. This unidirectional causality from money supply to consumer prices is statistically significant and consistent with the quantity theory of money that inflation is a monetary phenomenon. Furthermore, the results indicate that this hypothesis is also supported by the statistically significant coefficient on money supply estimated by the Johansen procedure. As presented in Appendix Table A3, the estimated cointegrating vector, including inflation as a dependent variable, suggests that the inflation path has been affected by the changes in money supply. We find evidence that global inflation and the exchange rate pass-through effect are statistically significant. The estimated coefficient on international prices is statistically significant and ranges between 0.07 and 0.12, depending on the model specification. This result indicates that changes in global prices affect the behavior of consumer prices in Libya. Likewise, the coefficient on the nominal exchange rate against the U.S. dollar is negative and statistically significant, ranging from 0.06 to 0.10, while the coefficients in the auxiliary regression are also statistically significant in the short run. The role of the exchange rate in the inflation process appears to have diminished somewhat over time. Though Libya has maintained a fixed exchange rate regime, occasional exchange rate adjustments exhibited a propensity to reinforce the impact of changes in import prices and, consequently, the inflationary impact of external shocks in the long run. Government spending strongly influences inflation dynamics, while the output gap does not appear to have a meaningful effect. The estimated coefficient on government spending ranges between 0.01 and 0.05, and is statistically significant across all specifications of the model, except when the output gap is included in the regression. This result provides strong evidence that a sustained increase in government spending leads to higher consumer prices. Innovations in government spending account for 7 percent of the forecast error variance, which is not unexpected when the volatility of hydrocarbon revenues and the economy’s limited absorptive capacity are taken into consideration. This is consistent with the influx of petrodollars and the resulting increase in domestic liquidity, which are found to be important determinants of the behavior of consumer prices in Libya over the long run. On the other hand, the empirical analysis shows that the output gap, as measured by the deviations of real GDP from its de-trended value, appears to have no significant effect on the behavior of consumer price inflation during the sample period. This result is also confirmed by using real nonhydrocarbon GDP, instead of overall output, in estimating the output gap. In our view, although nonhydrocarbon GDP is a better indicator of domestic economic activity, the measurement of the potential level of output—and thereby of the output gap—in a natural resource–based economy inevitably reflects the volatility of resource production and prices. These results are broadly consistent with the findings of Klein and Kyei (2009) that show for a sample of 23 hydrocarbon-exporting countries including Libya that those with higher inflation, compared to the sample average, have higher money supply growth, less exchange rate appreciation, and higher increase in the nonhydrocarbon fiscal deficit compared to those

17
with lower inflation. Furthermore, consumer price inflation in these countries appears to be dominated by a greater degree of inertia and excess domestic liquidity. The results show that international sanctions had a statistically significant and economically large effect on domestic prices. Libya was subject to international sanctions during the period 1983–99; our empirical findings demonstrate that the availability of imported goods and services during and after the period of sanctions had been a significant factor in explaining the behavior of consumer prices over time, while inducing some short-term adjustment costs. The estimated coefficient on the sanctions dummy is positive and ranges between 0.05 and 0.07, remaining statistically and economically significant across all specifications of the model. This is consistent with the finding of Bayard, Pelzman, and Perez-Lopez (1983) that international sanctions and embargoes limit supply and raise import prices in the importing country, resulting in an increase in the scarcity premium paid by consumers, depending on how oligopolistic the markets are. Moreover, the impact of international sanctions may also go beyond targeted sectors and influence the aggregate behavior of the economy. In other words, the statistical and economic significance of international sanctions, as shown in our empirical results, is likely to capture the effects of dislocation of resources throughout the domestic economy, although such effects may be offset, to an extent, by the domestic policy response contributing to fluctuations in the CPI. The empirical model also combines a long-run equation of the determinants of inflation with short-run dynamics. Table 3 shows the results of fitting an ECM for the inflation function using the Engle-Granger two-step procedure described in Section V18. After estimating the relationships in Table 2 and obtaining the residuals, we check whether the OLS residuals are stationary.19 The tests reject the null hypothesis that the residuals have unit root, which implies that the residuals are stationary and the variables are assumed to be cointegrated. Provided that the conditions for cointegration are satisfied, following the second step in the Engle-Granger procedure, a short-run ECM could be estimated using the residuals from the long-term equation. Accordingly, we include the OLS residuals of the most robust specification of the model—presented in the second column of Table 2—into the ECM to determine the short-run dynamics. All properties of the final model remain statistically well-behaved, and the adjustment coefficient indicates that a large part of the disequilibrium tends to be eliminated in one year. The estimated coefficient is statistically significant and negative, ensuring convergence toward equilibrium, as a negative 18 In the Engle-Granger procedure the cointegrating vector is measured by obtaining the residuals of a static equation. However, the results of Banerjee et al. (1986) show that in small samples ignoring the lagged terms is likely to create a bias in the estimated parameters, which is corrected by including the dynamic components.
19 The unit root tests for cointegration analysis includes (1) testing individual variables for unit roots to determine that all series are integrated in the same order; (2) running cointegrating regression and obtaining the residuals; (3) testing for a unit root in the residuals via ADF test to determine cointegration; and (4) if cointegration is not rejected, estimating a dynamic (ECM) model using the lagged residuals.

18
(downward) correction of the “error” when inflation is above its equilibrium level brings inflation back to equilibrium.
Table 3. Long-Run Equation and Short-Run Dynamics, 1964–2010
Long-Run Equation mt-1 pt-1 govt exrt sanct
Coefficient 0.043 0.892 0.040 -0.064 0.052
Standard error [0.010]*** [0.015]*** [0.007]*** [0.018]*** [0.021]**
Short -Run Dynamics1/ ∆ mt-1 ∆ pt-1 ∆ govt ∆ exrt sanct
Coefficient -0.015 1.164 0.034 -0.103 0.006
Standard error [0.045] [0.216]*** [0.021] [0.043]*** [0.011]
Adjustment Coefficient -0.80
[0.233]*** Notes: The estimation method is based on the Engle-Granger two-step cointegration approach by regressing inflation on lagged changes in other variables, as well as the equilibrium errors derived from the OLS regression. The dependent variable is the first difference of the logarithm of the CPI; all variables including inflation are stationary.
Robust standard errors are reported in square brackets, with ***, **, and * indicating statistical
significance at the 1 percent, 5 percent, and 10 percent levels, respectively. 1/ 39 observations are included after adjustment.
Source: Authors’ estimations.
We also find empirical evidence that short-run price volatility is a significant determinant of the inflation path. The estimated adjustment coefficient measures the rate of adjustment per period required to correct a temporary disequilibrium and move toward the long-run equilibrium relationship in the cointegrating vector. With the first difference of the logarithm of the CPI as the dependent variable, the adjustment coefficient in the ECM indicates that if inflation is above the equilibrium level, prices tend to adjust each year to restore the equilibrium relationship. In particular, the estimations based on the Engle-Granger procedure produce a significant—and surprisingly large—adjustment coefficient (-0.80), suggesting that there is rapid convergence to the equilibrium level when the economy is subject to shocks. However, this effect might be due to the small size of the economy and a possible sample size bias. The Johansen procedure also offers a statistically significant coefficient (-0.32), which is in line with similar estimations for the GCC countries (Kandil and Morsy, 2009). Though quantitatively different, both adjustment coefficients are significant and negative, assuring convergence towards the equilibrium. Inflation dynamics show considerable fluctuations in the short run due to policy changes and exogenous shocks. Despite the limitations of estimating a long-run relationship, our baseline equation remains economically intuitive and robust. As

19
summarized in Table 2, all diagnostic tests are satisfactory and residuals are well-behaved, with no evidence of serial correlation, non-normality, or heteroskedasticity. While Breusch-Godfrey Serial Correlation LM identifies weak serial correlation in one of the specifications (presented in the third column of Table 2), data across all specifications are consistent with a normal distribution. In addition, the variance of the error term in the regression models remains constant between observations based on the heteroskedasticity test, while the Chow breakpoint test shows no evidence of significant structural breaks in the inflation equation. The empirical evidence presented in this paper indicates the strong influence of lagged inflation and changes in the nominal exchange rate, which are both statistically significant in the short term. The VECM approach confirms that inflation inertia is the predominant source of variation in the short run. Although these two methods—single-equation and system-based—cannot be compared directly, the VECM is used to check the robustness of the results obtained by the ECM, and yields qualitatively similar results (Appendix Table A3).20 Both methods support the existence of a theoretically meaningful cointegrating vector with economically plausible signs and adjustment coefficients. In addition, we conduct an analysis of impulse response functions and variance decomposition over time. The results, presented in Appendix Figure A1 and Appendix Table A4, show that inflation inertia is the predominant source of variation in the short run, followed by those changes in government spending that appear to reinforce inflationary pressures over the long run. At the same time, the variance decomposition indicates that money supply growth is the least likely factor contributing to the variance of consumer price inflation in the long run.
VII. CONCLUSION
The empirical model—incorporating both macroeconomic variables and international sanctions—identifies the determinants of inflation in Libya. Estimating the regression equation relating the behavior of consumer prices to past inflation, lagged money supply, the output gap, government spending, international prices, the nominal exchange rate against the U.S. dollar, and a dummy variable for international sanctions imposed on Libya, we find fairly robust and statistically significant coefficients over the sample period 1963–2010. The econometric results should be viewed with caution, because of data limitations; nonetheless, inflation inertia, monetary factors, government spending, and the exchange rate pass-through appear to have been the main determinants of the inflation process. While the evidence of a robust cointegrating relationship between money supply and the CPI might well suggest that inflation had been a monetary phenomenon, the results indicate that fiscal stimulus is the underlying source of domestic liquidity, financed by the country’s hydrocarbon earnings. In
20 The Johansen procedure has a number of advantages and is more powerful in smaller samples, but we prefer the Engel-Granger procedure to avoid superfluous computations and also to account for data quality problems.

20
other words, higher government spending tends to exacerbate inflationary pressures, given the economy’s limited absorptive capacity. We also find evidence of the importance of the exchange rate channel through which changes in international prices and the nominal exchange rate affect domestic consumer prices. On the other hand, the estimations suggest that the output gap has no permanent effect on the inflation process. Finally, international sanctions imposed on Libya during the period 1983–99 exhibit a high degree of statistical significance as a determinant of consumer price inflation. Closer coordination between monetary policy and fiscal policy is essential for ensuring an appropriate balance between economic growth and price stability. During the conflict that accompanied the revolution, consumer price inflation reached 16 percent in 2011, up from an annual average of 2.4 percent in 2009–10. Although it has shown a marked decline with the lifting of international sanctions, the outlook remains challenging. First, the doubling of currency in circulation during the conflict is a source of upside risks to inflation, especially considering the extent of the country’s urgent reconstruction needs and pent-up private demand. Second, along with the monetization of the government budget deficit during the conflict, large increases in public-sector wages have added to underlying price pressures. Beyond short-term considerations, however, given the CBL’s commitment to the pegged exchange rate regime, fiscal policy remains the main instrument for maintaining macroeconomic stability. Therefore, closer coordination between monetary policy and fiscal policy is necessary improve the effectiveness of monetary operations and to enable an appropriate balance between economic growth and price stability. Normalizing liquidity conditions and monetary operations is necessary for economic and financial stability. Prior to the revolution, the CBL was facing difficulties in reducing persistent excess liquidity in the banking system, partly because of structural constraints that limit domestic financial intermediation and encourage banks to accumulate a growing amount of deposits at the central bank.21 By introducing new monetary instruments and strengthening the interbank money market infrastructure, the CBL can allow commercial banks to better manage their balance sheets and help improve the distribution of liquidity among large national and small regional banks.22 For example, establishing an effective auction system to issue bills that can be traded in a secondary market for liquidity purposes would support domestic capital market deepening and improve the efficacy of monetary policy. These measures would help the CBL in containing inflationary pressures as the Libyan economy continues to grow rapidly in the post-revolution era.
21 Although the Libyan financial sector expanded significantly over the past four decades, financial intermediation remains shallow, even by the low standards of the Middle East and North Africa, and it is unclear whether it makes a meaningful contribution to growth in nonhydrocarbon sectors of the economy.
22 To provide or withdraw liquidity, most central banks tend to rely on a range of open market operations including outright transactions, certificates of deposit, repos, fixed-term deposits, and foreign exchange swaps.

21
References Bahgat, G., 2004, “Oil Terrorism and Weapons of Mass Destruction: The Libyan Diplomatic Coup,” The Journal of Social, Political, and Economic Studies, Vol. 29, pp. 373–94. Banerjee, A., J. Dolado, D. Hendry, and G. Smith, 1986, “Exploring Equilibrium Relationships in Econometrics through Static Models: Some Monte Carlo Evidence”, Oxford Bulletin of Economics and Statistics, Vol. 48, pp. 253–77. Balakrishnan, R., and J. Lopez-Salido, 2002, “Understanding UK Inflation: The Role of Openness,” Bank of England Working Paper, No. 164 (London: Bank of England). Bayard, T., J. Pelzman, and J. Perez-Lopez, 1983, “Stakes and Risks in Economic Sanctions,” World Economy, Vol. 6, pp. 73–87. Caceres, C., S. Cevik, R. Fenochietto, and B. Gracia, 2013, “The Day After Tomorrow: Designing an Optimal Fiscal Strategy for Libya,” IMF Working Paper, forthcoming (Washington: International Monetary Fund). Calvo, G., 1983, “Staggered prices in a Utility-Maximizing Framework,” Journal of Monetary Economics, Vol. 12, pp. 383–398. Christiano, L., M. Eichenbaum, and C. Evans, 1999, “Monetary Policy Shocks: What Have We Learned and to What End?” in Handbook of Macroeconomics, edited by B. Taylor and M. Woodford (New York: Elsevier). Cottarelli, C., M. Griffiths, and R. Moghadam, 1998, “The Nonmonetary Determinants of Inflation: A Panel Data Study,” IMF Working Paper, No. 98/23 (Washington: International Monetary Fund). Darrat, A., 1985, “The Monetary Explanation of Inflation: The Experience of Three Major OPEC Economies,” Journal of Economics and Business, Vol. 37, pp. 209–221. DeGrauwe, P., and M. Polan, 2001, “Is Inflation Always and Everywhere a Monetary Phenomenon,” American Economic Review, Vol. 79, pp. 655–673. Engle, R., and C. Granger, 1987, “Co-Integration and Error Correction: Representation, Estimation, and Testing,” Econometrica, Vol. 55, pp. 251–276
Friedman, M., 1963, Inflation: Causes and Consequence (New York: Asia Publishing House).

22
Fuhrer, J., and G. Moore, 1995, “Inflation Persistence,” Quarterly Journal of Economics, Vol. 110, pp. 127–159.
Gali, J., and M. Gertler, 1999, “Inflation Dynamics: A Structural Econometrics Analysis,” Journal of Monetary Economics, Vol. 44, pp. 195–222.
Gerlach, S., and L. Svensson, 2003, “Money and Inflation in the Euro Area: A Case for Monetary Indicators?” Journal of Monetary Economics, Vol. 50, pp. 1649–1672. Habib, M., and J. Strasky, 2008, “Oil Exporters: In Search of an External Anchor,” ECB Working Paper, No. 958 (Frankfurt: European Central Bank). Hill, J., 2007, “Efficient Tests of Long-Run Causation in Trivariate VAR Processes with a Rolling Window Study of the Money-Income Relationship,” Journal of Applied Econometrics, Vol. 22, pp. 747–765. Hodrick, R., and E. Prescott, 1997, “Post-war Business Cycles: An Empirical Investigation,” Journal of Money, Credit, and Banking, Vol. 29, pp. 1–16. Ilzetzki, E., C. Reinhart, and K. Rogoff, 2011, “The Country Chronologies and Background Material to Exchange Rate Arrangements into the 21st Century: Will the Anchor Currency Hold?” Johansen, S., 1988, “Statistical Analysis of Cointegrating Vectors,” Journal of Economic Dynamics and Control, Vol. 12, pp. 231–254. Johansen, S., and K. Juselius, 1990, “Maximum Likelihood Estimation and Inference on Cointegration—with Applications to the Demand for Money,” Oxford Bulletin of Economics and Statistics, Vol. 52, pp. 169–210. Johansen, S., 1991, “Estimation and Hypothesis Testing of Cointegration Vectors in Gaussian Vector Autoregressive Models,” Econometrica, Vol. 59, pp. 1551–1580. Kandil, M., and H. Morsy, 2009 “Determinants of Inflation in GCC,” IMF Working Paper, No. 09/82 (Washington: International Monetary Fund). Klein, N and A. Kyei, 2009, “Understanding Inflation Inertia in Angola,” IMF Working Paper, No. 09/98 (Washington: International Monetary Fund). Kydland, F., and E. Prescott, 1977, “Rules Rather than Discretion: The Inconsistency of Optimal Plans,” Journal of Political Economy, Vol. 85, pp. 473–492.

23
Mohanty, M., and M. Klau, 2008, “What determines inflation in emerging market economies,” BIS Papers, No. 8 (Basel: Bank for International Settlements). Ravn, M., and H. Uhlig, 2002, “On Adjusting the Hodrick-Prescott Filter for the Frequency of Observations,” Review of Economics and Statistics, Vol. 85, pp. 235–243.
Rosser, A., 2006, “The Political Economy of the Resource Curse: A Literature Survey,” Institute of Development Studies Working Paper, No. 268 (Brighton: Institute of Development Studies).
Sahay, R., and C. Vegh, 1995, “Inflation and Stabilization in Transition Economies: A Comparison with Market Economies,” IMF Working Paper, No 95/8, (Washington: International Monetary Fund).
Shapiro, M., and M. Watson, 1988, “Sources of Business Cycle Fluctuations,” NBER Macroeconomics Annual, Vol. 3, pp. 111–148 (Cambridge, MA: National Bureau of Economic Research).
Sims, C., and T. Zha, 2006, “Were There Regime Switches in U.S. Monetary Policy?” American Economic Review, Vol. 96, pp. 54–81. Wang, P., and Y. Wen, 2005, “Endogenous Money or Sticky Prices? Comment on Monetary Neutrality and Inflation Dynamics,” Journal of Economic Dynamics and Control, Vol. 29, pp. 1361–1383.

24
Appendix Tables and Figures
Table A1. Pairwise Correlations
(m) (pwp) (y) (p) (gov) (exr)
Money supply (m) 1.00 0.81 0.00 0.68 0.96 0.78
Global CPI (pwp ) 0.81 1.00 0.03 0.90 0.72 0.85
GDP (y) 0.00 0.03 1.00 -0.14 0.06 0.16
CPI (p) 0.68 0.90 -0.14 1.00 0.52 0.58
Gov. spending (gov) 0.96 0.72 0.06 0.52 1.00 0.79
Exchange rate (exr) 0.78 0.85 0.16 0.58 0.79 1.00
Source: Authors’ estimations.
Table A2. Cointegration Analysis (Eugenvalues for the period 1964–2010)
Ho: rank = ρ λ λ max 95% λ trace 95%
ρ = 0 0.74 49.04 27.58 84.81 47.86
ρ≤ 1 0.48 23.30 21.13 35.78 29.80
ρ≤ 2 0.29 12.45 14.26 12.48 15.49
ρ≤ 3 0.00 0.03 3.84 0.03 3.84
Notes: The test indicates at least two cointegrating vectors at the 5 percent significance level. Source: Authors’ estimations.

Table A3. Vector Error Correction Estimates
Long -Run Equation Short-Run Dynamics
Lagged CPI (pt-1) 1 ∆ pt-1 0.61
[ 4.358]
Lagged money supply (mt-1) -0.80 ∆ mt-1 -0.31
[-18.851] [-4.381]
Gov. spending (govt) 0.49 ∆ govt-1 0.20
[ 4.756] [ 6.283]
Exchange rate (exrt) -0.39 ∆ exrt-1 -0.10
[-2.019] [-2.337]
Adjustment coefficient -0.32 sanct 0.03
[-6.924] [1.934]
R-squared 0.93 Log likelihood 99.31
Adj. R-squared 0.85 Akaike AIC -4.46
Sum sq. resids 0.01 Schwarz SC -3.63
S.E. equation 0.02 Mean dependent 0.05
F-statistic 12.02 S.D. dependent 0.06
Notes: The estimation method is a vector error correction model (VECM).
t-statistics are reported in square brackets.
The adjusted sample spans from 1975 to 2010 with 36 observations.
The estimations include four lags, a constant, and a dummy variable for international sanctions during the period 1983-99.
Source: Authors’ estimations.
Table A4. Variance Decomposition
Period pt mt govt exrt
1 100.00 0.00 0.00 0.00
2 91.95 0.55 6.98 0.52
3 84.81 0.68 5.08 9.43
4 75.02 0.49 3.71 20.78
5 67.59 0.45 7.02 24.94
6 46.10 2.55 25.71 25.64
7 26.81 6.47 43.99 22.74
8 16.16 10.82 55.87 17.14
9 10.54 12.14 65.37 11.96
10 7.32 11.41 72.81 8.46
Source: Authors’ estimations.

26
DateClassification: Primary/Secondary/Tertiary Comments
Dec 1927–42 Peg to U.S. dollarThe French franc and UK pound also circulate. On October 1, 1930 foreign exchange controls are introduced.
1942–Mar 24, 1952Exchange rate arrangement with no separate legal tender.
The Algerian Franc, Egyptian Pound, and British Military authority Lira cocirculate.
Mar 24, 1952–Nov 1955 Managed floating/Parallel Market The Syrian pound is introduced. Official rate is pegged to UK pound.
Dec 1955–Dec 15, 1971 Peg to UK pound/Dual Market
Dec 15, 1971–Apr 18, 1981 Managed floating/Parallel MarketLibya ceases to be a member of the Sterling Area. The official rate is pegged to the U.S. dollar.
Apr 18, 1981–Mar 18, 1986 Managed floating/Parallel Market
Mar 18, 1986–May 1, 1986 Managed floating/Parallel Market +/- 5% band. The Syrian Pound is Officially pegged to the SDR.
May 1, 1986–Mar 1992De facto crawling band around U.S. dollar/Parallel Market
+/- 5% band. There is a pre-announced +/–3.75% band around a central SDR parity.
Mar 1992–Jul 1992De facto crawling band around U.S. dollar/Parallel Market
+/- 5% band. There is a pre-announced +/–5.5% band around a central SDR parity.
Jul 1992–Aug 1992De facto crawling band around U.S. dollar/Parallel Market
+/- 5% band. The official regime is a pre announced +/- 6.75% band around a central SDR parity. The parallel market premium is consistently above 400%.
Aug 1992–Aug 19, 1993De facto crawling band around U.S. dollar/Parallel Market
+/- 5% band. The official pre announced band widens to +/-8%. The parallel market premium is consistently above 400%.
Aug 19, 1993–Nov 1, 1994De facto crawling band around U.S. dollar/Parallel Market
+/- 5% band. The official band widens to +/-12.5%. The parallel market premium is consistently above 400%.
Nov 1, 1994–Oct 31, 1998De facto crawling band around U.S. dollar/Parallel Market
+/- 5% band. There is a pre-announced+/-21.5% band around a central SDR parity. The parallel market premium is consistently above 400%.
Oct 31, 1998–Feb 14, 1999De facto crawling band around U.S. dollar/Parallel Market
+/- 5% band. The official band widens to +/-38.75%.
Feb 14, 1999–Dec 2010 Dual Market+/- 5% band. The official regime is a pre announced +/- 38.75%. band around a central SDR parity. The parallel market was legalized.
Notes:
Reference currency is the U.S. dollar. Data availability:Official rate, 1927:12-2010:12Parallel rate, 1955:1-1998:12
Source: Ilzetzki, Reinhart, and Rogoff (2011).
Table A5. Chronology of Exchange Rate Regimes

27
Figure A1. Impulse Responses
Source: Authors’ estimations.
-.12
-.08
-.04
.00
.04
.08
1 2 3 4 5 6 7 8 9 10
Response of CPI to CPI
-.12
-.08
-.04
.00
.04
.08
1 2 3 4 5 6 7 8 9 10
Response of CPI to MS
-.12
-.08
-.04
.00
.04
.08
1 2 3 4 5 6 7 8 9 10
Response of CPI to GOV
-.12
-.08
-.04
.00
.04
.08
1 2 3 4 5 6 7 8 9 10
Response of CPI to FX