History of Selection From Phenotypes to Economic Indexes
29
History of Selection From Phenotypes to Economic Indexes NBCEC Brown Bagger 2012 October 3, 2012 Darrh Bullock, University of Kentucky
description
History of Selection From Phenotypes to Economic Indexes. NBCEC Brown Bagger 2012 October 3, 2012 Darrh Bullock, University of Kentucky. Assumptions of Selection. Measurable Qualitative Quantitative Heritable Is there a resemblance between parents and offspring for the trait of interest. - PowerPoint PPT Presentation
Transcript of History of Selection From Phenotypes to Economic Indexes

History of Selection From Phenotypes to
Economic IndexesNBCEC Brown Bagger 2012October 3, 2012Darrh Bullock,
University of Kentucky
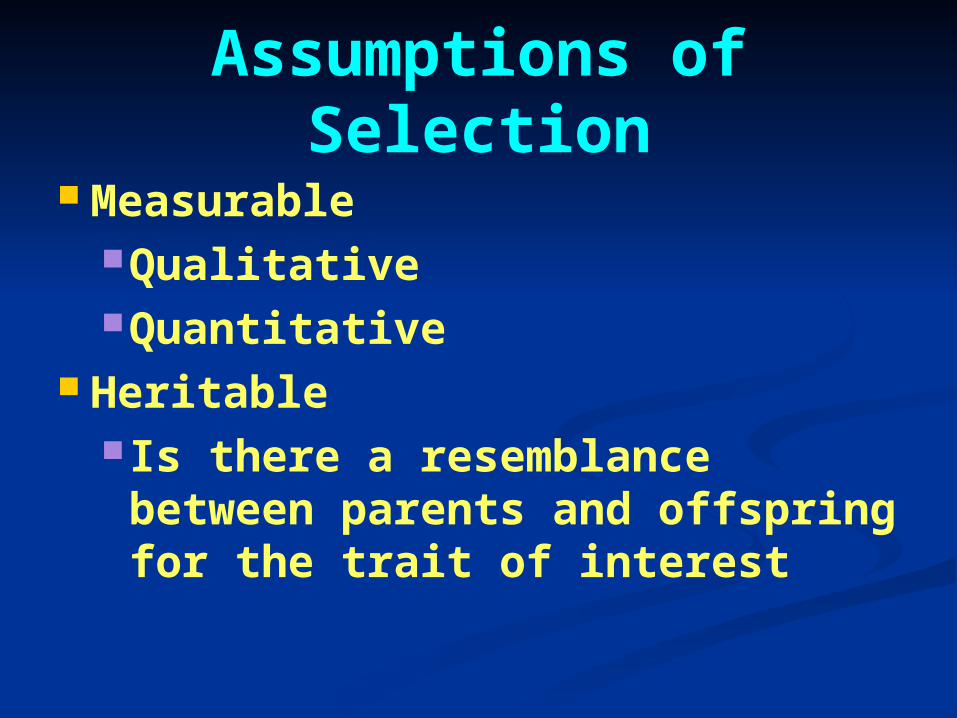
Assumptions of Selection
MeasurableQualitativeQuantitative
HeritableIs there a resemblance between
parents and offspring for the trait of interest

History of Selection Appearance

Appearance
People’s Sexiest Man Alive 2010People’s Sexiest Man Alive 2010


History of Selection Appearance Pedigree Information
Shorthorn 1846Hereford 1880Angus 1886

History of Selection Appearance Pedigree Information Data Collection

Body Composition
DrugsDrugsSexSex
Rock and RollRock and Roll
MeatMeatPotatoesPotatoes
SushiSushiRiceRice

HeritabilityTraitTrait hh22
ReproductionReproduction
ProductionProduction
ProductProduct
LowLow
ModerateModerate
HighHigh

History of Selection Appearance Pedigree Information Data Collection Ratios

Ratios
100 is average100 is average
Individual Measurement Individual Measurement Contemporary Group AverageContemporary Group Average X 100X 100

Contemporary Group 1Physics Test Score
Ratio = 86Ratio = 86

History of Selection Appearance Pedigree Information Measurable Trait Ratios Breeding Values – C.R. Henderson
Pedigree and PhenotypeDevelopment of EPDs

EPDs A prediction of the genetics a bull will
pass on to his calves, when compared to other bulls within the breed
Take into account the actual measurement on the bull, all ancestral measurements and environment
Not a perfect science, so use as risk management tool

Expected Progeny DifferencesPhysics Score EPDsPhysics Score EPDs
25 Points25 Points
15 Points15 Points
-5 Points-5 Points

Expected Progeny Differences
9595
85856565

EPD
+35 lbs+35 lbs +20 lbs+20 lbs
Expect the average difference inExpect the average difference in offspring to be 15 pounds.offspring to be 15 pounds.
DirectDirect

EPD
+25 lbs+25 lbs +15 lbs+15 lbs
Expect the average difference inExpect the average difference in offspring of the sires daughters to offspring of the sires daughters to
be 10 pounds.be 10 pounds.
MaternalMaternal

Has Selection Worked? Genetic Trends
All breeds show drastic changes in genetic merit of most traits.
Indicate that simultaneous selection for antagonistic traits is possible.

Angus Genetic Trends

Genomics (in the beginning)
Physics Score MBV = 25 PointsPhysics Score MBV = 25 Points
Physics Score EPD = 15 PointsPhysics Score EPD = 15 Points

Genomics (now)
Physics Score EPD = 15 PointsPhysics Score EPD = 15 PointsPhenotypePhenotype Acc .15 Acc .15
Physics Score EPD = 20 PointsPhysics Score EPD = 20 PointsPhenotype + Genomics Phenotype + Genomics Acc .30Acc .30

Selection Index Allows comparison on single value Weights traits according to economic
importance Selection index = a1EPD1 + a2EPD2 + . . . + akEPDk
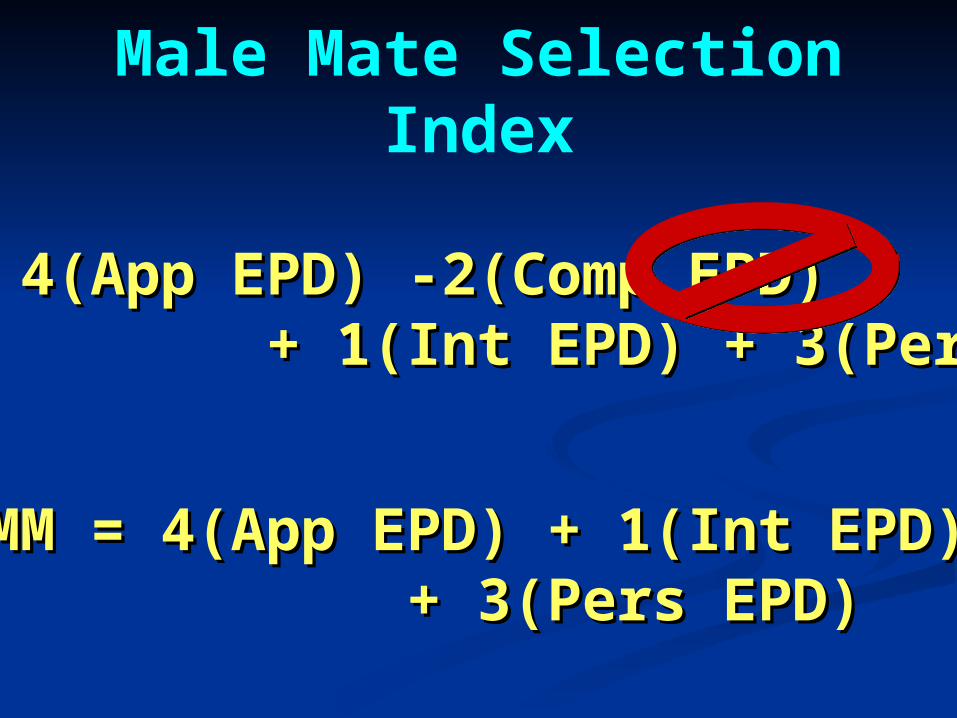
Male Mate Selection Index
$MM = 4(App EPD) -2(Comp EPD)$MM = 4(App EPD) -2(Comp EPD) + 1(Int EPD) + 3(Pers EPD)+ 1(Int EPD) + 3(Pers EPD)
$MM = 4(App EPD) + 1(Int EPD) $MM = 4(App EPD) + 1(Int EPD) + 3(Pers EPD)+ 3(Pers EPD)
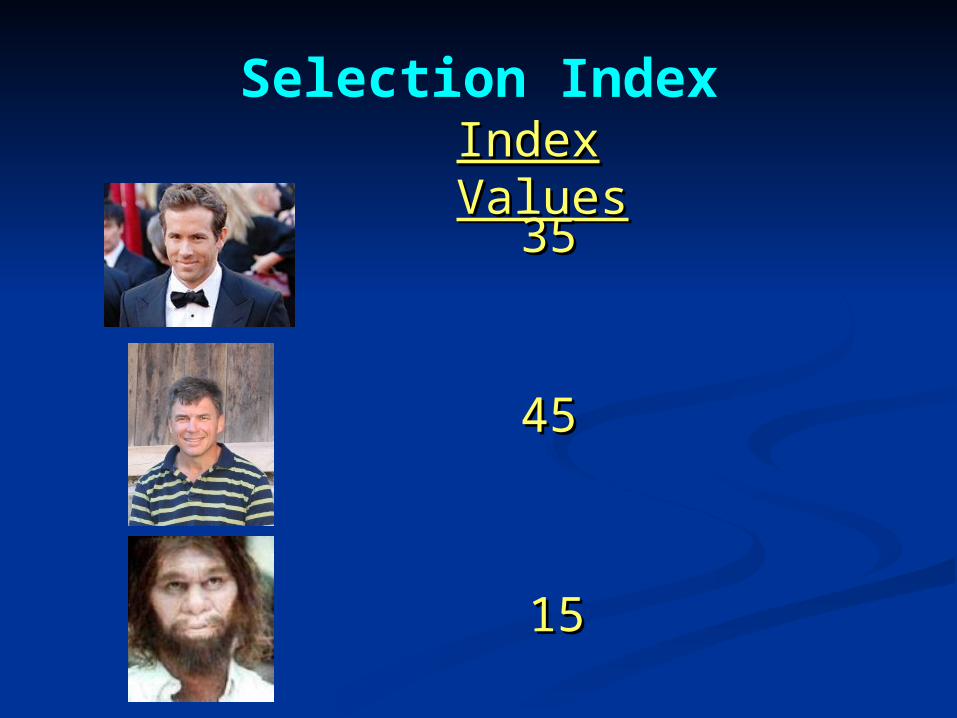
Selection IndexIndex ValuesIndex Values
3535
4545
15 15

Summary
I I Win !Win !