History of radiation detriment and its calculation ...
21
HAL Id: hal-02527490 https://hal.archives-ouvertes.fr/hal-02527490 Submitted on 27 May 2020 HAL is a multi-disciplinary open access archive for the deposit and dissemination of sci- entific research documents, whether they are pub- lished or not. The documents may come from teaching and research institutions in France or abroad, or from public or private research centers. L’archive ouverte pluridisciplinaire HAL, est destinée au dépôt et à la diffusion de documents scientifiques de niveau recherche, publiés ou non, émanant des établissements d’enseignement et de recherche français ou étrangers, des laboratoires publics ou privés. Distributed under a Creative Commons Attribution - NonCommercial - NoDerivatives| 4.0 International License History of radiation detriment and its calculation methodology used in ICRP Publication 103 E. Cléro, L. Vaillant, N. Hamada, W. Zhang, D. Preston, D. Laurier, N. Ban To cite this version: E. Cléro, L. Vaillant, N. Hamada, W. Zhang, D. Preston, et al.. History of radiation detriment and its calculation methodology used in ICRP Publication 103. Journal of Radiological Protection, IOP Publishing, 2019, 39 (3), pp.R19-R35. 10.1088/1361-6498/ab294a. hal-02527490
Transcript of History of radiation detriment and its calculation ...
HAL Id: hal-02527490https://hal.archives-ouvertes.fr/hal-02527490
Submitted on 27 May 2020
HAL is a multi-disciplinary open accessarchive for the deposit and dissemination of sci-entific research documents, whether they are pub-lished or not. The documents may come fromteaching and research institutions in France orabroad, or from public or private research centers.
L’archive ouverte pluridisciplinaire HAL, estdestinée au dépôt et à la diffusion de documentsscientifiques de niveau recherche, publiés ou non,émanant des établissements d’enseignement et derecherche français ou étrangers, des laboratoirespublics ou privés.
Distributed under a Creative Commons Attribution - NonCommercial - NoDerivatives| 4.0International License
History of radiation detriment and its calculationmethodology used in ICRP Publication 103
E. Cléro, L. Vaillant, N. Hamada, W. Zhang, D. Preston, D. Laurier, N. Ban
To cite this version:E. Cléro, L. Vaillant, N. Hamada, W. Zhang, D. Preston, et al.. History of radiation detriment andits calculation methodology used in ICRP Publication 103. Journal of Radiological Protection, IOPPublishing, 2019, 39 (3), pp.R19-R35. �10.1088/1361-6498/ab294a�. �hal-02527490�
123456789101112131415161718192021222324252627282930313233343536373839404142434445464748495051525354555657585960
AUTHOR SUBMITTED MANUSCRIPT - JRP-101574
History of radiation détriment and its calculation methodology used in
ICRP Publication 103
Enora Cléro Ludovic Vaillant 2, Nobuyuki Hamada 3, Wei Zhang 4, Dale Preston 5,
Dominique Laurier \ Nobuhiko Ban 6
1 Institute for Radiological Protection and Nuclear Safety, Health and Environment Division,
Fontenay-aux-Roses, France2 Centre d’étude sur l’Evaluation de la Protection dans le domaine Nucléaire, Fontenay-aux-
Roses, France3 Radiation Safety Research Center, Central Research Institute of Electric Power Industry,
Tokyo, Japan
4 Public Health England, Centre for Radiation, Chemical and Environmental Hazards, Chilton,
Didcot, Oxon, United Kingdom
5 Hirosoft International Corporation, Eureka, CA, United States of America
6 Nuclear Regulation Authority, Tokyo, Japan
Corresponding author: Nobuyuki Hamada, RT, PhD
Radiation Safety Research Center,
Nuclear Technology Research Laboratory,
Central Research Institute of Electric Power Industry (CRIEPI),
2-11-1 Iwado-kita, Komae, Tokyo 201-8511, Japan
Mail: [email protected]
Short title: Radiation detriment calculation in ICRP Publication 103
Classification of the article: Review
1
123456789101112131415161718192021222324252627282930313233343536373839404142434445464748495051525354555657585960
AUTHOR SUBMITTED MANUSCRIPT - JRP-101574 Page 2 of 20
Abstract
Over the past decades, the International Commission on Radiological Protection (ICRP) has
used radiation detriment, which is a multidimensional concept to quantify the overall harm to
health from stochastic effects of low-level radiation exposure of different parts of the body.
The tissue-specific detriment is determined from the nominal tissue-specific risk coefficient,
weighted by the severity of the disease in terms of lethality, impact on quality of life and
years of life lost. Total detriment is the sum of the detriments for separate tissues and organs.
Tissue specific detriment values are used to determine tissue weighting factors for the
calculation of effective dose. Calculating radiation detriment is a complex process that
requires information from various sources and judgements on how to achieve calculations. As
such, it is important to document its calculation methodology. To improve the traceability of
calculations and form a solid basis for future recommendations, the ICRP Task Group 102 on
detriment calculation methodology was established in 2016. It has reviewed the history of
radiation detriment and the process of detriment calculation. This article summarizes the work
of this Task Group and aims at clarifying the process of detriment calculation currently used
by the ICRP.
Keywords: detriment; radiation; health effect; cancer.
Highlights
1. The methodology of radiation detriment has been developed to quantify the harmful
health effects of radiation exposure at low doses and low dose rates.
2. Radiation detriment takes into account the radiation induced lifetime risk for 14 cancer
sites.
3. The radiation-associated cancer risk models were mostly derived from the Life Span
Study of Hiroshima and Nagasaki atomic bomb survivors.
4. The age-averaged lifetime risk was calculated as a weighted mean of the lifetime risk
estimated for each age at exposure, using the age distribution from four reference
populations (males and females of Asian and Euro-American populations).
Acknowledgments: The authors thank members of the ICRP who contributed or participated
to the review of the work of Task Group 102 “Detriment Calculation Methodology”: Tamara
Azizova, John D Boice Jr, Simon Bouffler, Donald A Cool, Wolfgang Dorr, John D Harrison,
Michael Hauptmann, Michiaki Kai, Jacques Lochard, Sergei Romanov, Werner Rühm, Sisko
Salomaa and Richard Wakeford.
2
123456789101112131415161718192021222324252627282930313233343536373839404142434445464748495051525354555657585960
AUTHOR SUBMITTED MANUSCRIPT - JRP-101574
1. Introduction
Exposure to ionising radiation may cause cancer and other health effects, each of which
varies greatly in the shape of the dose-response curve, latency, persistency, recurrence,
curability, fatality and impact on quality of life (Hamada & Fujimichi 2014). Over the past
decades, for radiation protection purposes, the International Commission on Radiological
Protection (ICRP) has divided all such diverse radiation effects into either stochastic effects
(with no dose threshold) or tissue reactions (formerly termed deterministic effects, which are
considered to have a dose threshold). Safety standards aiming to reduce risks of stochastic
effects (cancer and heritable effects) are partly based on detriment-adjusted nominal risk
coefficients, assuming a linear-non-threshold (LNT) dose response and a dose and dose-rate
effectiveness factor (DDREF) of 2 which applies to absorbed doses <0.2 Gy and to higher
absorbed doses at <0.1 Gy per hour for low linear energy transfer (LET) radiation (ICRP
1991). The detriment is a quantitative scale of the total harm to health among a group of the
population and its descendants as a result of the group’s exposure to ionising radiation, and
allows for the variations in radiosensitivity of different organs and tissues to the induction of
stochastic effects. The tissue weighting factors (wT) are derived from the relative contribution
of a tissue or organ to the total detriment following whole body exposure.
Calculating radiation detriment is a complex process that requires information from
various sources and judgments on how the calculations are best performed. The current
methodology is outlined in Annex A of ICRP Publication 103 (ICRP 2007), but it is possible
that accumulation of scientific evidence for radiation induced effects and evolution of
knowledge about cancer may need revised methodology and different judgments in the future.
To secure a solid basis for future recommendations, it is important to review the current
process of detriment calculation and document it in a reproducible manner, considering ways
in which different approaches might be applied when new data become available. In 2016,
ICRP therefore established Task Group 102 on detriment calculation methodology to identify
sources for the necessary information, to reproduce the calculation in Publication 103 with
documentation of the detailed procedure, and to find room for future improvement.
This paper summarizes some of the work of Task Group 102 with a focus on the history of
radiation detriment and the calculation methodology used in Publication 103. 2
2. History of radiation detriment calculation
The multidimensional concept of detriment was introduced in ICRP Publication 26 (ICRP
1977) and defined as follows: ‘The Commission has introduced the concept of detriment to
3
123456789101112131415161718192021222324252627282930313233343536373839404142434445464748495051525354555657585960
AUTHOR SUBMITTED MANUSCRIPT - JRP-101574 Page 4 of 20
identify, and where possible to quantify, all these deleterious effects. In general, the détriment in
a population is defined as the mathematical “expectation” of the harm incurred from an exposure
to radiation, taking into account not only the probability of each type of deleterious effect, but
also the severity of the effect’. Quantitative values assessed for the radiation detriment for low
dose and low dose rate relied on the assumption of a linear relationship between dose and risk.
Recognizing that this linear extrapolation may lead to an overestimate of the radiation risks at
low doses and low dose rates, the Commission nevertheless endorsed its view described in ICRP
Publication 9 (ICRP 1966)1. Additionally, the Commission indicated that even if some of the
quantitative risk factors were age or sex dependent, it was judged that for radiological protection
purposes, sufficient accuracy could be obtained by using dose limits regardless of age or sex for
both workers and the general public. Detriment, expressed as the likelihood of fatal cancers and
serious hereditary abnormalities, was then used to set up dose limits for workers and the public,
as well as tissue weighting factors (wT) as part of the effective dose concept.
In its Publication 60 (ICRP 1991), ICRP outlined that new information on the risk of
radiation-induced cancer in human populations had emerged since 1977 as well as new data in
laboratory animals and cultured cells experiments, leading to the need for a reassessment of
Publication 26 (ICRP 1977) estimates of the probability of the carcinogenic fatal effects of
radiation. In addition to nominal estimates of fatal cancer, the detriment calculated in
Publication 60 included also additional components in order to take into account cancer
lethality and morbidity resulting from induced non-lethal cancer. ICRP introduced the concept
of risk tolerability and proposed new dose limits based on this concept and detriment
calculations.
Most recently, in its Publication 103 (ICRP 2007), ICRP provided a new methodology for
the calculation of the detriment based on cancer incidence. While the methods used were
broadly similar to those used in Publication 60 (ICRP 1991), modifications were made in
several aspects of the computations. Annex A of ICRP Publication 103 describes detriment
calculation methodology, but not to a degree with which calculations can be fully reproduced.
The next section describes details of the calculation methodology used in ICRP Publication
103.
1 ‘As the existence of a threshold dose is unknown, it has been assumed that even the smallest doses involve a proportionately small risk of induction of malignancies. Also, because of the lack of knowledge of the nature of the dose-effect relationship in the induction of malignancies in man particularly at those dose levels which are relevant in radiological protection, the Commission sees no practical alternative, for the purposes of radiological protection, to assuming a linear relationship between dose and effect, and that doses act cumulatively. The Commission is aware that the assumptions of no threshold and of complete additivity of all doses may be incorrect but is satisfied that they are unlikely to lead to the underestimation of risks’.
4
123456789101112131415161718192021222324252627282930313233343536373839404142434445464748495051525354555657585960
AUTHOR SUBMITTED MANUSCRIPT - JRP-101574
3. Steps in the calculation of radiation détriment used in ICRP Publication 103
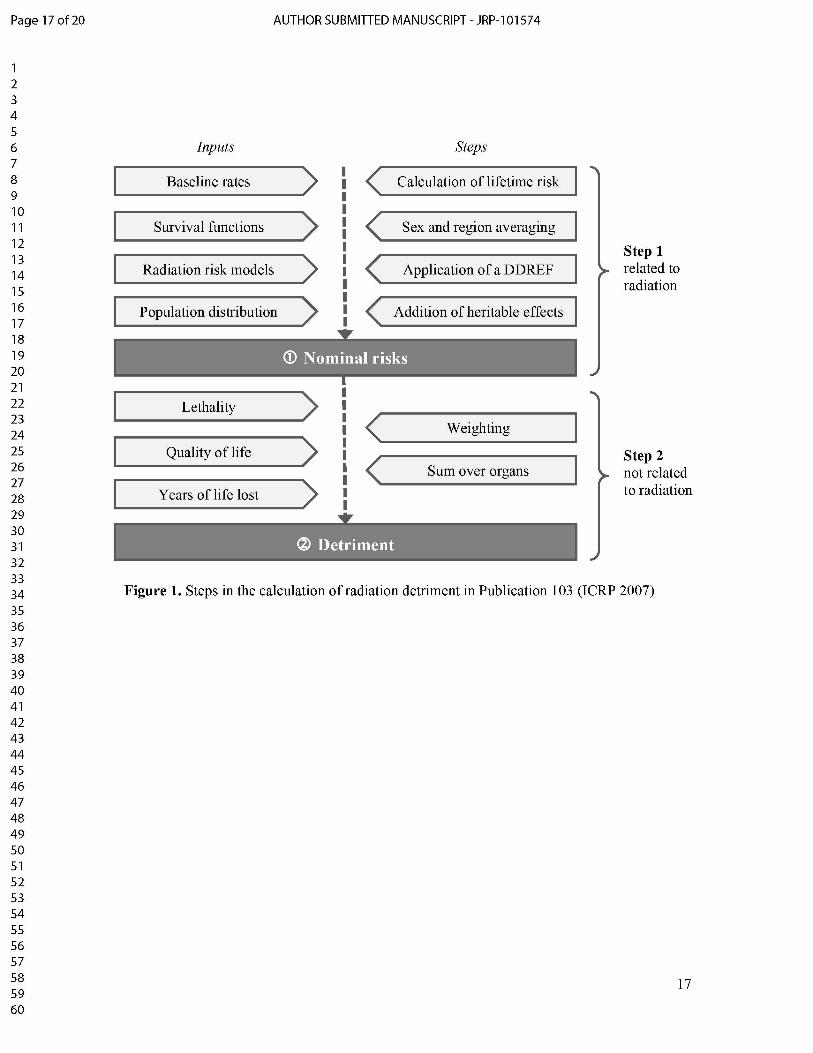
The calculation of radiation détriment for the ICRP System of radiological protection relies
on a sequential procedure presented in Figure 1 (ICRP 1991, ICRP 2007). The first step is the
calculation of the nominal risk, which is an estimate of the lifetime risk associated with
radiation exposure, averaged over sex, age and region for different types of cancer and
combined with the risk of heritable effects. The second step is the calculation of the detriment,
which is a global risk indicator based on nominal risk, averaged over sex, and adjusted for
lethality, quality of life and years of life lost. This step does not depend on the radiation dose,
but reflects aspects of severity inherent to each cancer site.
3.1. Calculation of nominal risks
3.1.1. Health data
Population-based cancer incidence rates were obtained from the 8th edition of Cancer
Incidence in Five Continents (cancer rates measured by registries during the period 1993
1997; Parkin et al. 2002) and population size data by 5-year age categories were obtained
from the World Health Organization (WHO) international mortality statistics database (WHO
2003). Incidence rates came from selected Asian (Shanghai in China; Osaka, Hiroshima and
Nagasaki in Japan) and Euro-American (Sweden; United Kingdom; the Surveillance,
Epidemiology, and End Results (SEER) program of the US National Cancer Institute)
populations with long-running cancer registries. An unweighted average of the Asian and the
Euro-American data was calculated to form a composite population. The aim was to compile
rates for representative populations in different parts of the world. Incidence data are available
for all cancer sites, except for bone and skin. Average incidence rates were compiled for the
Asian and Euro-American populations, separately for males and females and by 5-year age
categories (from 0-4 to 90+), for the oesophagus, stomach, colon, liver, lung, female breast,
ovary, bladder, thyroid, all solid cancers, leukaemia excluding chronic lymphocytic leukaemia
(CLL), all leukaemia and all cancers combined.
The survival functions were derived from the mortality rates estimated for the four
reference populations (i.e. Asian males and females, Euro-American males and females).
3.1.2. Lifetime baseline risk
5
123456789101112131415161718192021222324252627282930313233343536373839404142434445464748495051525354555657585960
AUTHOR SUBMITTED MANUSCRIPT - JRP-101574 Page 6 of 20
The lifetime baseline risk (LBR) corresponds to the cumulative cancer risk in the absence
of radiation exposure. LBR is computed by summing cumulative baseline risks up to the age
90 years (i.e. from 0 to 89 years) as follows:ramax
LBR(amin, s) = m(a, s)S(a|amin, s)da!min
where s is the sex, amin is the age at the beginning of risk, amax is the maximum age (i.e. 89
years), m(a, s) is the age- and sex-specific baseline cancer incidence rates, and S(a|amin, s)
is the survival function.
3.1.3. Risk models for spécifie cancer sites
For solid cancers, risk models were developed for 10 organs or tissues: oesophagus,
stomach, colon, liver, lung, female breast, ovary, bladder, thyroid, and other solid cancers. No
specific risk models were derived for brain and salivary glands. The specific models for these
10 solid cancers come from the analyses of solid cancer incidence risk of the Life Span Study
(LSS) of Japanese atomic bomb (A-bomb) survivors of Hiroshima and Nagasaki, with follow-
up from 1958 through 1998 (Preston et al. 2007). Risk models considered a linear dose
response allowing for modifying effects of sex (s), age at exposure (e), and attained age (a).
Risk estimates were adjusted to reduce the bias in risk estimates arising from uncertainty in
individual dose estimates derived from the dosimetry system 2002 (DS02). For each cancer
site, modelling of the radiation-associated risk has been made using an excess relative risk
(ERR) model and/or excess absolute risk (EAR) model with the general forms:
!(s, a, e, d) = !0(s, a, e) [ 1 + ERR(s, a, e, d)]
!(s, a, e, d) = !0(s, a, e) + EAR (s, a, e, d)
with ER(s, a, e, d) = fd exp[a1(^(e — 30)/10) + a2Zn(a/70)]
where e is the age at exposure (in years), a is the attained age (in years), d is the dose (in Gy),
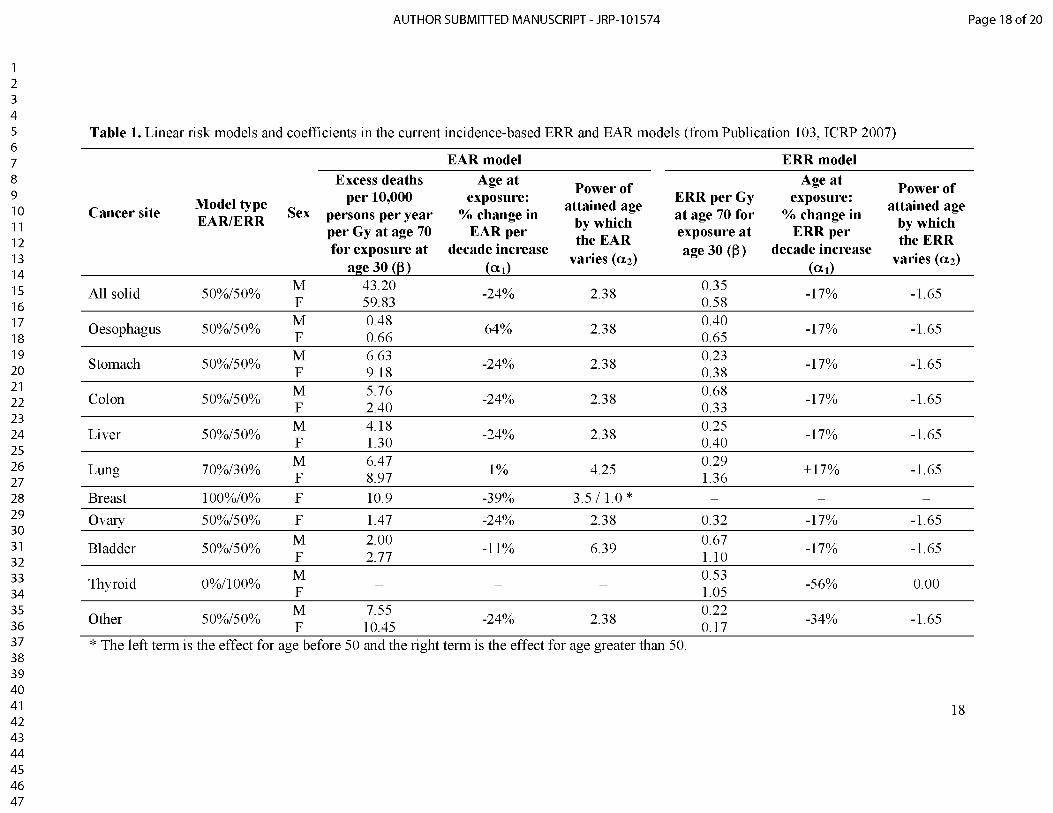
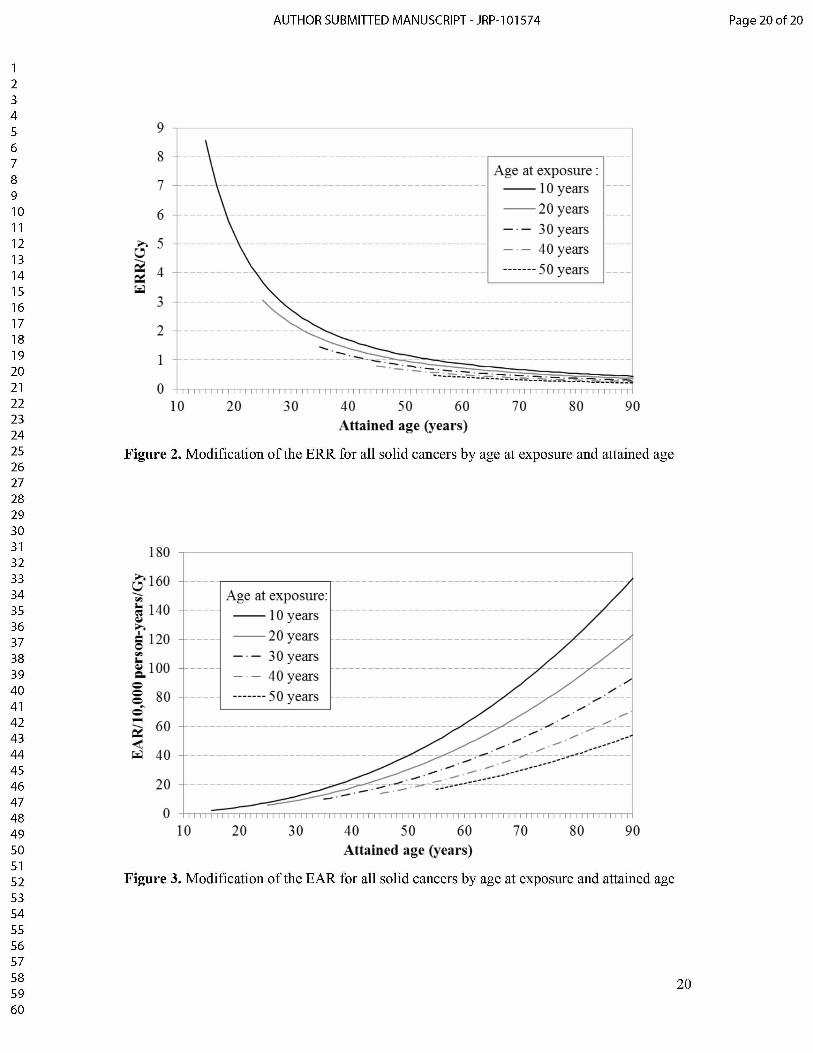
and !0 is the baseline cancer rate. Parameter values for ! and a used for the calculation of
nominal risks are summarised in Table 1, for ERR and EAR models (ICRP 2007). The
modifications of the ERR and the EAR for all solid cancers by age at exposure and attained
age are presented in Figure 2 and Figure 3, respectively. The minimum latency period (the
shortest time where a specified radiation-induced tumour is known or believed to occur after
exposure) was assumed to be five years for solid cancers.
6
123456789101112131415161718192021222324252627282930313233343536373839404142434445464748495051525354555657585960
AUTHOR SUBMITTED MANUSCRIPT - JRP-101574
For leukaemia, the LSS incidence data were used, with a follow-up from 1950 through
Preston et al. (1994), with a linear-quadratic dose response that allows for effect modification
by sex, age at exposure, and time since exposure. The ERR estimate was computed from the
leukaemia EAR model and from the LSS background rate, taking into account sex, age at
exposure and attained age. However, there is no published information about these models
and further details are not available. Leukaemia excess risk was estimated for all leukaemia
cases (including chronic lymphocytic leukaemia, CLL), but was applied to the Asian and
Euro-American populations using non-CLL leukaemia rates. The minimum latency period for
leukaemia was considered to be two years.
3.1.4. Lifetime excess risk
Several methods can be used to calculate the lifetime risk of developing (or dying from) a
specific disease caused by a radiation exposure. In Publication 103, lifetime risk estimates
were calculated using the risk of exposure-induced cancer (REIC) method (Thomas et al.
1992).
REIC refers to the cumulated excess disease cases in an exposed population over a follow-
up period. In Publication 103, REIC was calculated for 10 solid cancer sites and leukaemia.
where e is the age at exposure (in years), d is the dose (in Gy), a is the attained age (in years),
L is the latency period (in years), pi is the annual risk of cancer incidence and S(a\e, d) is the
probability of the individual cancer-free surviving to age a (i.e. alive and without cancer)
given exposure d at age e. The risk models and survival functions were used to compute sex-
specific lifetime risk estimates in the Asian and Euro-American composite populations, for
each cancer site.
Considered exposure scenario was acute exposure to 0.1 Gy of low-LET radiation. REIC
was calculated for each year of age at exposure from 0 to 84 years for the whole population
(estimated 85 times) and from 18 to 64 years for workers (estimated 47 times). The risk was
cumulated up to the day each individual turns 90 years old, that is over age range 0-89 years
(90 years of life) for the whole population and 18-89 years (72 years of life) for workers. The
age-averaged lifetime risk was calculated as a weighted mean of the lifetime risk estimated
for each age at exposure, the weight being derived from the age distribution of the four
reference populations. REIC at 1 Gy was computed as 10 times the REIC at 0.1 Gy.
1998 and DS02. The risk estimates were based on an EAR model similar to that derived by
REICÇe, d) = [n(a\e, d — !(a)]S(a\e, d !"a=e+L
7
123456789101112131415161718192021222324252627282930313233343536373839404142434445464748495051525354555657585960
AUTHOR SUBMITTED MANUSCRIPT - JRP-101574 Page 8 of 20
3.1.5. Transfer of risk estimâtes across populations
To provide a reasonable basis for transferring risk across populations with different
baseline rates, weighted average of the ERR and EAR lifetime risk estimates was used for
each cancer site. As indicated in Table 1, ERR:EAR weights of 0:100% were assigned for
breast, 100:0% for thyroid and skin, 30:70% for lung, and 50:50% for all others including
leukaemia.
For lung cancer, the ERR model was given a weight of 0.3 because A-bomb survivors data
suggested that the EAR was more comparable across sexes than the ERR and that radiation
dose and smoking history interacted additively as lung cancer risk factors (Pierce et al. 2003).
For female breast cancer, risks were based solely on an EAR model derived from the LSS
incidence data (Preston et al. 2007) because a pooled analysis of radiation effects provided
strong evidence against the use of common ERR models (Preston et al. 2002).
For thyroid cancer, risks were based solely on an ERR model derived from the LSS
incidence data (Preston et al. 2007), according to an analysis of radiation associated thyroid
cancer risks (Ron et al. 1995). This is because variation in screening intensity was thought to
have a marked effect on the rate of radiation-associated thyroid cancers, making it
problematic to use EAR models.
3.1.6. Application of a Dose and Dose-Rate Effectiveness Factor
Experimental studies generally show that fractionation or protraction of dose is associated
with reduced risk per unit dose compared to acute high dose of low-LET radiation. For
radiological protection purposes, a dose and dose-rate effectiveness factor (DDREF) of 2 was
introduced in Publication 60 (ICRP 1991) to be applied to low-dose, continuous or
fractionated exposures. The lifetime risk estimates were adjusted downward by a factor of 2,
except for leukaemia for which variation in the risk per unit dose was built into the linear-
quadratic model. The same DDREF was applied for males and females, general population
and workers.
3.1.7. Integration of heritable effects
To estimate the risk of heritable effects, the relative importance of genetic components as
well as the frequency of transmissible mutations needs to be taken into account. ICRP risk
estimates for all classes of genetic diseases (Mendelian diseases, chronic diseases and
congenital abnormalities) were derived from the UNSCEAR 2001 Report (UNSCEAR 2001),
8
123456789101112131415161718192021222324252627282930313233343536373839404142434445464748495051525354555657585960
AUTHOR SUBMITTED MANUSCRIPT - JRP-101574
based mainly on results from animal experiments (in rodents). Risks were expressed as the
predicted number of additional cases (i.e. over the baseline) of different classes of genetic
disease per million live births per Gy for a population exposed to low-LET, low-dose or
chronic irradiation, generation after generation. In ICRP Publication 103, risk estimates were
based on results observed on the first two generations (ICRP 2007). The risk of heritable
effects in the general population associated with gonadal dose was estimated to be around 20
cases per 10,000 persons per Gy. The risk in workers was estimated to be 60% of that for the
general population, leading to an estimated nominal risk of 12 per 10,000 per Gy.
3.1.8. Final calculation of nominal risks
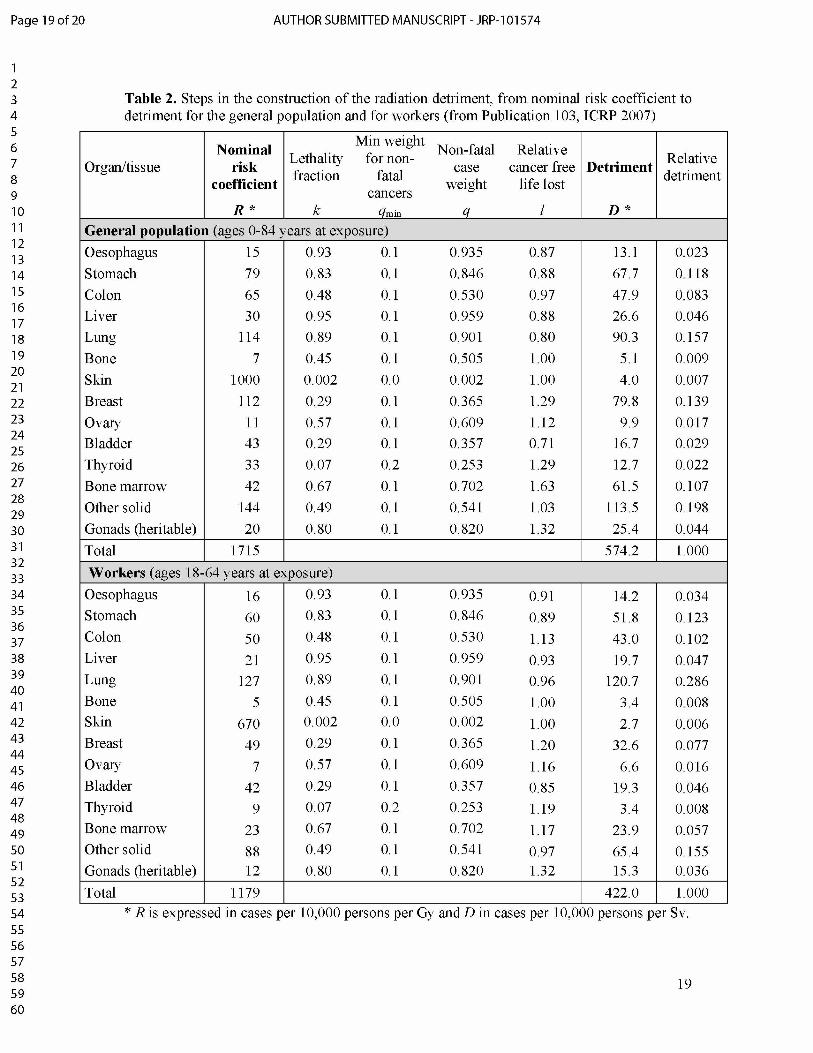
The nominal risk coefficients R are presented in Table 2, for the general population and for
workers of both sexes (ICRP 2007). The nominal risk estimate for bone cancer was taken
from Publication 60 (ICRP 1991) because data sources were extremely limited and the LSS
provided no usable data to derive a specific risk model. Regarding non-melanoma skin cancer,
the nominal risk estimate was taken from Publication 59 (ICRP 1992) because models derived
from LSS were judged to be not adequate for a general population due to differences between
countries in risk related to skin pigmentation. The risks of skin cancer have been estimated
using a constant relative risk model, with no modifying effects of age or time since exposure,
using both mortality and incidence data, based on the epidemiological and experimental
results published before 1990.
As shown in Table 2, the global nominal risk coefficient is 1715 cancer cases per 10,000
persons per Gy in the general population and 1179 cancer cases per 10,000 persons per Gy in
workers.
3.2. Calculation of radiation détriment
3.2.1. Adjustment for lethality
Nominal risk coefficients based on the excess incidence of cancer were converted to fatal
cancer risks by multiplying by their lethality fractions (factor k in Table 2). The lethality
fraction has been derived as judgment-based values reflecting the impact of medical treatment
for some types of cancer, based on the analysis of 5-year survival rates by cancer site for the
1980-1985 and 1950-1970 periods (US DHHS 1989), which were obtained from the SEER
program providing information on cancer statistics in the US population. The same lethality
fraction values were applied to males and females, general population and workers. As shown
9
123456789101112131415161718192021222324252627282930313233343536373839404142434445464748495051525354555657585960
AUTHOR SUBMITTED MANUSCRIPT - JRP-101574 Page 10 of 20
in Table 2, highly lethal cancers received a relatively greater weight (e.g. liver or lung cancer)
than those that seldom cause death (e.g. skin or thyroid cancer).
3.2.2. Adjustment for quality of life
Because cancer survivors generally experience adverse effects on their quality of life,
ICRP judged that cancers should be weighted not only for lethality, but also for pain,
suffering and any adverse effects of cancer treatment. To achieve this, a factor termed qmin
was applied to the non-lethal fractions of cancers to produce an adjusted lethality fraction
termed q, which is defined by:
! (! Rmin)!! ! Rmin
where k is the lethality faction and qmin is the minimum weight for non-fatal cancers
(judgment-based values). Table 2 presents the values of q and qmin. qmn was set equal to 0.1
for all cancer sites, except for thyroid (0.2) and skin (0). No qmin adjustment was used for skin
cancer because radiogenic skin cancers are non-melanoma skin cancers and are almost
exclusively of the basal cell type which is usually associated with very little pain, suffering or
treatment sequelae. The same values of qmin and thus q were applied to males and females,
general population and workers. The q adjustment has an impact upon detriment calculations
in proportion to the fraction of cancers that are non-lethal. Accordingly, highly lethal cancers
such as lung and stomach cancer are little affected by qmjn, whereas relatively non-lethal
cancers such as breast or thyroid are much affected.
3.2.3. Adjustment for the duration of life lost
The distribution of age at diagnosis differs among cancer types. For each type of cancer,
the average number of years of life lost was computed for each sex in each composite
population as the average over ages at exposure and subsequent attained ages of the residual
lifetime. The relative duration of life lost, factor l in Table 2, was calculated with the average
number of years of life lost for the specific cancer dividing by the average number of years of
life lost for all cancers which was equal to 15 years in Publication 60 (ICRP 1991). Factor l
reflects the relative cancer free life lost varying from <1 for cancers occurring late in life (e.g.
0.71 for bladder cancer and 0.80 for lung cancer in the general population) to >1 for cancers
occurring early in life (e.g. 1.63 for leukaemia and 1.29 for thyroid or breast cancer in the
general population). For bone and skin cancers, the years of life lost cannot be obtained in the
same way and therefore were arbitrarily set at the average years of life lost for all cancers (i.e.
10
123456789101112131415161718192021222324252627282930313233343536373839404142434445464748495051525354555657585960
AUTHOR SUBMITTED MANUSCRIPT - JRP-101574
equal to 1). For gonads, a number of 20 years of life lost was assigned for severe genetic
disorders (i.e. a factor l of 1.32).
3.2.4. Final calculation of radiation détriment
Based on the nominal risk coefficient R, the lethality fraction k, the quality of life factor q
and the relative life lost factor l, radiation detriment D associated with each type of cancer
was calculated as follows:
! = [(!x!) + (!x( 1 - !xq)]xl
The global radiation detriment was calculated as the unweighted sum of the 14 site-specific
detriments. The detriment D is expressed in terms of numbers of cases per 10,000 persons per
Sv of low dose radiation. As shown in Table 2, the global radiation detriment is 574 cases per
10,000 persons per Sv in the general population and 422 cases per 10,000 persons per Sv in
workers. Lung cancer is the major contributor to the global detriment for workers (relative
detriment of 0.286), whereas it is the other solid cancers in the general population (relative
detriment of 0.198).
The site-specific relative radiation detriments for the whole population form the basis of
the tissue weighting factors wT.
4. Discussion and perspectives
Radiation detriment is an indicator used to quantify the harmful effects of low-dose
exposure. Based on scientific evidence, it quantifies the risk of stochastic effects of low-level
radiation exposure, taking into account variability among sexes, ages and populations.
Resultant nominal risk coefficients, reflecting the radiation induced lifetime risk for more than
10 cancer sites, are adjusted for the severity of the disease in terms of lethality, quality of life
and years of life lost. Total detriment is the sum of the detriment for each part of the body
(tissues and/or organs) and of potential heritable effects.
The current scheme of detriment calculation is carefully designed to quantify and integrate
key aspects of health effects related to low-dose radiation exposure. This scheme has been
updated several times in the past (ICRP 1977, ICRP 1991, ICRP 2007) to reflect the evolution
of scientific knowledge and integrate new findings. It is expected to evolve in the future in
accordance with changes in baseline cancer incidence rates, improvement in cancer treatment
and progress in scientific understanding of radiation-induced health effects.
In Publication 103 (ICRP 2007), baseline rates correspond to the period 1993-1997.
However cancer incidence rates and all-cause mortality rates have changed significantly since
11
123456789101112131415161718192021222324252627282930313233343536373839404142434445464748495051525354555657585960
AUTHOR SUBMITTED MANUSCRIPT - JRP-101574 Page 12 of 20
then, due to changes in lifestyle, advances in diagnostic methods and improvement in cancer
treatment, especially for certain cancer types such as thyroid cancer or breast cancer.
Updating these reference rates will provide a more realistic basis for the system of
radiological protection in the future (Breckow et al. 2018). Furthermore, incidence and
mortality vary considerably around the world reflecting genetic difference and differences in
lifestyle and healthcare provision. Integration of other reference populations in addition to
those currently considered could provide an improved representation of the world population.
In Publication 103 (ICRP 2007), radiation-associated cancer risk models were derived
from the LSS for 11 organs or tissues, based on a follow-up from 1958 through 1998 (Preston
et al. 2007). Since then, new models with longer duration of follow-up have been published
and could be used to update risk models. Risk models derived from studies other than the LSS
(e.g. Chernobyl clean-up workers, nuclear workers (including Mayak workers) and residents
along the Techa river, etc.) should be considered, based on a detailed analysis of their
respective limitations and advantages, and discussion of the consistency of their results with
those from the LSS. For bone marrow, it would be desirable to extend this category to
multiple myeloma, because the only hematologic malignancies currently included are non-
CLL leukaemia. For bone cancer and non-melanoma skin cancer, nominal risk estimates
come from Publications 60 and 59 (ICRP 1991, ICRP 1992), respectively. It would be
worthwhile to investigate if specific risk models are available for these cancer types.
Furthermore, it is desirable to explore the possibility of developing risk models for the brain
and salivary glands, because no specific risk models are considered for these two organs in
the current procedure for detriment calculation, whereas values of tissue weighting factors are
assigned specifically to them.
The construction of the radiation detriment relies on the LNT model, which has been a
basis of radiation protection since Publication 9 (ICRP 1966). Relevance of this model was
reinforced by the recent epidemiological literature (NCRP 2018). A DDREF of 2 is used in
the calculation of the detriment. The validity of this factor is under examination with
reference to current biological and epidemiological findings under the ICRP Task Group 91
on radiation risk inference at low-dose and low-dose rate exposure for radiological protection
purposes (Rühm et al. 2015, Rühm et al. 2016, Rühm et al. 2017, Shore et al. 2017, Tran et al.
2017, Rühm et al. 2018, Wakeford et al. 2019). It is also desirable to validate the current
scheme of risk transfer between populations, which is a weighted average between an ERR
and an EAR transfer, based on the recent epidemiological data.
12
123456789101112131415161718192021222324252627282930313233343536373839404142434445464748495051525354555657585960
AUTHOR SUBMITTED MANUSCRIPT - JRP-101574
Considération of possible heritable effects is based on the estimate of UNSCEAR 2001
report (UNSCEAR 2001). Scientific developments have been made since then, and an up-to-
date review of recent findings is desirable.
In the current calculation scheme of detriment calculation, cancer lethality fractions are
derived from US data in the 1980s (US DHHS 1989), and are applied without distinction
between males and females, general population and workers. The same applies to relative
duration of life lost, which was derived in from the data of 1980s (ICRP 1991). More recent
data are available today and they will provide a basis for more realistic estimates for each
cancer site, with due consideration of variation with age and sex and between populations.
Moreover, adjustment for quality of life is judgment-based in the current methodology, but
there are attempts to determine the weights in more reasonable way. For example, elaborated
approaches have been developed to obtain parameter values for disability-adjusted life years
(DALY) (Chen et al. 2015, Shimada & Kai 2015). A review of these methods and available
data could be considered, taking into account variation with cancer type, age, sex and
population, to improve the assessment of radiation detriment.
To conclude, the global radiation detriment in Publication 103 is 574 cases per 10,000
persons per Sv in the general population and 422 cases per 10,000 persons per Sv in workers
(ICRP 2007). Detriment is constructed as an integrated indicator of the stochastic risks and
health impact associated with low dose radiation exposure, which constitutes an easy to use
and robust parameter for the practical application of radiation protection. Nevertheless,
calculation of detriment consists of many steps, in which a wide range of information is
processed, including risk models and health statistics along with other parameters related to
cancer severity. Over time, the methodology has become increasingly elaborated, and it
appears more and more important to accurately document and publish the calculation
procedure for ensuring transparency and traceability.
13
123456789101112131415161718192021222324252627282930313233343536373839404142434445464748495051525354555657585960
AUTHOR SUBMITTED MANUSCRIPT - JRP-101574 Page 14 of 20
References
Baselet B, Rombouts C, Benotmane A M, Baatout S, Aerts A 2016 Cardiovascular diseases
related to ionizing radiation: The risk of low-dose exposure (Review). Int J Mol Med. 38
(6) 1623-41
Breckow J, Emami S, Amalhaf S, Beshgard A, Buermeyer J, Spruck K 2018 Impact of
updating the non-radiation parameters in the ICRP 103 detriment model. Radiat Environ
Biophys. 57 (2) 89-98
Chen A, Jacobsen KH, Deshmukh AA, Cantor SB 2015 The evolution of the disability-
adjusted life year (DALY). Socioecon Plann Sci. 49 (C) 10-5
Hamada N, Fujimichi Y 2014 Classification of radiation effects for dose limitation purposes:
history, current situation and future prospects. J Radiat Res. 55 (4) 629-40
ICRP 1959 Recommendations of the International Commission on Radiological Protection.
ICRP Publication 1
ICRP 1966 Recommendations of the International Commission on Radiological Protection.
ICRP Publication 9
ICRP 1977 Recommendations of the International Commission on Radiological Protection.
ICRP Publication 26 Ann. ICRP 1 (3)
ICRP 1991 The 1990 Recommendations of the International Commission on Radiological
Protection. ICRP Publication 60 Ann. ICRP 21 (1-3)
ICRP 1992 The Biological Basis for Dose Limitation in the Skin. ICRP Publication 59 Ann.
ICRP 22 (2)
ICRP 2007 The 2007 Recommendations of the International Commission on Radiological
Protection. ICRP Publication 103 Ann. ICRP 37 (2-4)
ICRP 2012 ICRP Statement on Tissue Reactions / Early and Late Effects of Radiation in
Normal Tissues and Organs - Threshold Doses for Tissue Reactions in a Radiation
Protection Context. ICRP Publication 118 Ann. ICRP 41 (1-2)
Kreuzer M, Auvinen A, Cardis E, Hall J, Jourdain JR, Laurier D, Little MP, Peters A, Raj K,
Russell NS, Tapio S, Zhang W, Gomolka M 2015 Low-dose ionizing radiation and
cardiovascular diseases--Strategies for molecular epidemiological studies in Europe. Mutat
Res Rev Mutat Res. 764 90-100
Little MP, Azizova TV, Bazyka D, Bouffler SD, Cardis E, Chekin S, Chumak VV, Cucinotta
FA, de Vathaire F, Hall P, Harrison JD, Hildebrandt G, Ivanov V, Kashcheev VV,
Klymenko SV, Kreuzer M, Laurent O, Ozasa K, Schneider T, Tapio S, Taylor AM,
Tzoulaki I, Vandoolaeghe WL, Wakeford R, Zablotska LB, Zhang W, Lipshultz SE 2012
14
123456789101112131415161718192021222324252627282930313233343536373839404142434445464748495051525354555657585960
AUTHOR SUBMITTED MANUSCRIPT - JRP-101574
Systematic review and meta-analysis of circulatory disease from exposure to low-level
ionizing radiation and estimates of potential population mortality risks. Environ Health
Perspect. 120 (11) 1503-11
NCRP 2016 Guidance on Radiation Dose Limits for the Lens of the Eye. NCRP Commentary
No. 26 National Council on Radiation Protection and Measurements, Bethesda: Maryland,
USA
NCRP 2018 Implications of Recent Epidemiologic Studies for the Linear-Nonthreshold
Model and Radiation Protection. NCRP Commentary No. 27 National Council on
Radiation Protection and Measurements, Bethesda: Maryland, USA
Parkin D M, Whelan S L, Ferlay J, Teppo L, and Thomas D B 2002 Cancer Incidence in Five
Continents. Volume VIII IARC Scientific Publications No. 155 Lyon: France
Pierce D A, Sharp G B, and Mabuchi K 2003 Joint effects of radiation and smoking on lung
cancer risk among atomic bomb survivors Radiat. Res. 159 (4) 511-20
Preston D L, Kusumi S, Tomonaga M, Izumi S, Ron E, Kuramoto A, Kamada N, Dohy H,
Matsui T, Nonaka H, Thompson D E, Sodak M, and Mabuchi K 1994 Cancer incidence in
atomic bomb survivors. Part III. Leukaemia, lymphoma and multiple myeloma, 1950-1987.
Radiat. Res. 137 (2 Suppl) S68-97
Preston D L, Mattsson A, Holmberg E, Shore R, Hildreth N G, Boice J D Jr 2002 Radiation
effects on breast cancer risk: a pooled analysis of eight cohorts. Radiat. Res. 158 (2) 220
35
Preston D L, Ron E, Tokuoka S, Funamoto S, Nishi N, Soda M, Mabuchi K, and Kodama K
2007 Solid cancer incidence in atomic bomb survivors: 1958-1998. Radiat. Res. 168 (1) 1
64
Rühm W, Woloschak GE, Shore RE, Azizova TV, Grosche B, Niwa O, Akiba S, Ono T,
Suzuki K, Iwasaki T, Ban N, Kai M, Clement CH, Bouffler S, Toma H, Hamada N 2015
Dose and dose-rate effects of ionizing radiation: a discussion in the light of radiological
protection. Radiat Environ Biophys. 54 (4) 379-401
Rühm W, Azizova TV, Bouffler SD, Little MP, Shore RE, Walsh L, Woloschak GE 2016
Dose-rate effects in radiation biology and radiation protection. Ann ICRP. 45 (1_suppl)
262-79
Rühm W, Eidemüller M, Kaiser JC 2017 Biologically-based mechanistic models of radiation-
related carcinogenesis applied to epidemiological data. Int J Radiat Biol. 93 (10) 1093-117
15
123456789101112131415161718192021222324252627282930313233343536373839404142434445464748495051525354555657585960
AUTHOR SUBMITTED MANUSCRIPT - JRP-101574 Page 16 of 20
Rühm W, Azizova T, Bouffler S, Cullings HM, Grosche B, Little MP, Shore RS, Walsh L,
Woloschak GE 2018 Typical doses and dose rates in studies pertinent to radiation risk
inference at low doses and low dose rates. JRadiat Res. 59 (suppl_2) ii1-10
Ron E, Lubin J H, Shore R E, Mabuchi K, Modan B, Pottern L M, Schneider A B, Tucker M
A, Boice J D Jr 1995 Thyroid cancer after exposure to external radiation: a pooled analysis
of seven studies. Radiat. Res. 141 (1) 259-77
Shimada K, Kai M 2015 Calculating disability-adjusted life years (DALY) as a measure of
excess cancer risk following radiation exposure. J Radiol Prot. 35 (4) 763-775
Shore R, Walsh L, Azizova T, Rühm W 2017 Risk of solid cancer in low dose-rate radiation
epidemiological studies and the dose-rate effectiveness factor. Int J Radiat Biol. 93 (10)
1064-78
Thomas D, Darby S, Fagnani F, Hubert P, Vaeth M, Weiss K 1992 Definition and estimation
of lifetime detriment from radiation exposures: principles and methods. Health Phys. 63
(3) 259-72
Tran V, Little MP 2017 Dose and dose rate extrapolation factors for malignant and non-
malignant health endpoints after exposure to gamma and neutron radiation. Radiat Environ
Biophys. 56 (4) 299-328
UNSCEAR 2001 Heritable Effects of Radiation, United Nations Scientific Committee on the
Effects of Atomic Radiation 2001 Report to the General Assembly with Scientific Annex.
New York: United Nations
US DHHS 1989 Cancer Statistics Review 1973-86 including a report on the status of cancer
control. NIH Publication No. 89-2789 US Department of Health and Human Services,
PHS, NIH, NCI, Bethesda: Maryland, USA
Wakeford R, Azizova T, Dorr W, Garnier-Laplace J, Hauptmann M, Ozasa K, Rajaraman P,
Sakai K, Salomaa S, Sokolnikov M, Stram D, Sun Q, Wojcik A, Woloschak G, Bouffler S,
Grosche B, Kai M, Little MP, Shore RE, Walsh L, Rühm W 2019 The Dose and Dose-
Rate Effectiveness Factor (DDREF). Health Phys. 116 (1) 96-9
WHO 2003 World Health Organization Mortality Database, Health statistics and information
systems. Data file downloaded April 22, 2003:
http://www.who.int/healthinfo/mortality data/en/
16
123456789101112131415161718192021222324252627282930313233343536373839404142434445464748495051525354555657585960
AUTHOR SUBMITTED MANUSCRIPT - JRP-101574
Inputs Steps
Baseline rates
Survival fonctions
Radiation risk models
Population distribution
>>>>
< Calculation of lifetime risk
^ Sex and région averaging
^ Application of a DDREF
< Addition of heritable effects
® Nominal risks
Lethality
Quality of life
Years of life lost
>>>
<<
Weighting
Sum over organs
(D Détriment
Step 1>. related to
radiation
Step 2>. not related
to radiation
Figure 1. Steps in the calculation of radiation détriment in Publication 103 (ICRP 2007)
17
1234567891011121314151617181920212223242526272829303132333435363738394041424344454647
AUTHOR SUBMITTED MANUSCRIPT - JRP-101574 Page 18 of 20
Table 1. Linear risk models and coefficients in the current incidence-based ERR and EAR models (from Publication 103, ICRP 2007)
EAR model ERR model
Cancer site Model type EAR/ERR Sex
Excess deaths per 10,000
persons per year per Gy at age 70 for exposure at
age 30 (! )
Age at exposure:
% change in EAR per
decade increase (a 1)
Power of attained age
by which the EAR
varies (a 2)
ERR per Gy at age 70 for exposure at age 30 (! )
Age at exposure:
% change in ERR per
decade increase (a 1)
Power of attained age
by which the ERR
varies (a2)
All solid 50%/50% MF
43.2059.83
-24% 2.38 0.350.58
-17% -1.65
Oesophagus 50%/50% MF
0.480.66
64% 2.38 0.400.65
-17% -1.65
Stomach 50%/50% MF
6.639.18
-24% 2.38 0.230.38
-17% -1.65
Colon 50%/50% MF
5.762.40
-24% 2.38 0.680.33
-17% -1.65
Liver 50%/50% MF
4.181.30 -24% 2.38 0.25
0.40 -17% -1.65
Lung 70%/30% MF
6.478.97 1% 4.25 0.29
1.36 +17% -1.65
Breast 100%/0% F 10.9 -39% 3.5 / 1.0 * - - -Ovary 50%/50% F 1.47 -24% 2.38 0.32 -17% -1.65
Bladder 50%/50% MF
2.002.77
-11% 6.39 0.671.10
-17% -1.65
Thyroid 0%/100% MF - - -
0.531.05 -56% 0.00
Other 50%/50% MF
7.5510.45 -24% 2.38
0.220.17 -34% -1.65
* The left term is the effect for age before 50 and the right term is the effect for age greater than 50.
18
Page 19 of 20 AUTHOR SUBMITTED MANUSCRIPT - JRP-101574
12345678910 11 121314151617181920 21 222324252627282930313233343536373839404142434445464748495051525354555657585960
Table 2. Steps in the construction of the radiation détriment, from nominal risk coefficient to détriment for the general population and for workers (from Publication 103, ICRP 2007)
Organ/tissueNominal
riskcoefficient
Lethalityfraction
Min weight for non-
fatalcancers
Non-fatalcase
weight
Relative cancer free
life lostDetriment
Relativedetriment
R * k qmin ____ q____ l D *General population (ages 0-84 years at exposure)Oesophagus 15 0.93 0.1 0.935 0.87 13.1 0.023Stomach 79 0.83 0.1 0.846 0.88 67.7 0.118Colon 65 0.48 0.1 0.530 0.97 47.9 0.083Liver 30 0.95 0.1 0.959 0.88 26.6 0.046Lung 114 0.89 0.1 0.901 0.80 90.3 0.157Bone 7 0.45 0.1 0.505 1.00 5.1 0.009Skin 1000 0.002 0.0 0.002 1.00 4.0 0.007Breast 112 0.29 0.1 0.365 1.29 79.8 0.139Ovary 11 0.57 0.1 0.609 1.12 9.9 0.017Bladder 43 0.29 0.1 0.357 0.71 16.7 0.029Thyroid 33 0.07 0.2 0.253 1.29 12.7 0.022Bone marrow 42 0.67 0.1 0.702 1.63 61.5 0.107Other solid 144 0.49 0.1 0.541 1.03 113.5 0.198Gonads (heritable) 20 0.80 0.1 0.820 1.32 25.4 0.044Total 1715 574.2 1.000
Workers (ages 18-64 years at exposure)Oesophagus 16 0.93 0.1 0.935 0.91 14.2 0.034Stomach 60 0.83 0.1 0.846 0.89 51.8 0.123Colon 50 0.48 0.1 0.530 1.13 43.0 0.102Liver 21 0.95 0.1 0.959 0.93 19.7 0.047Lung 127 0.89 0.1 0.901 0.96 120.7 0.286Bone 5 0.45 0.1 0.505 1.00 3.4 0.008Skin 670 0.002 0.0 0.002 1.00 2.7 0.006Breast 49 0.29 0.1 0.365 1.20 32.6 0.077Ovary 7 0.57 0.1 0.609 1.16 6.6 0.016Bladder 42 0.29 0.1 0.357 0.85 19.3 0.046Thyroid 9 0.07 0.2 0.253 1.19 3.4 0.008Bone marrow 23 0.67 0.1 0.702 1.17 23.9 0.057Other solid 88 0.49 0.1 0.541 0.97 65.4 0.155Gonads (heritable) 12 0.80 0.1 0.820 1.32 15.3 0.036Total 1179 422.0 1.000
* R is expressed in cases per 10,000 persons per Gy and D in cases per 10,000 persons per Sv.
19
123456789101112131415161718192021222324252627282930313233343536373839404142434445464748495051525354555657585960
AUTHOR SUBMITTED MANUSCRIPT - JRP-101574 Page 20 of 20
20