History of life on earth
371
-
Upload
rizwanamin -
Category
Documents
-
view
310 -
download
1
Transcript of History of life on earth

FROM SUNS TO LIFE: A CHRONOLOGICAL APPROACH TO
THE HISTORY OF LIFE ON EARTH

From Suns to Life: A Chronological Approachto the History of Life on Earth
Edited by
MURIEL GARGAUDPHILIPPE CLAEYS
PURIFICACION LOPEZ-GARCIAHERVE MARTIN
THIERRY MONTMERLEROBERT PASCALJACQUES REISSE
Reprinted from Earth Moon, and Planets
Volume 98, Nos. 1–4, 2006
123

A C.I.P catalogue record for this book is available from the library of Congress
ISBN 0-387-45082-7ISBN 978-0-387-45082-7
Published by Springer,
P.O. Box 17, 3300 AA, Dordrecht, The Netherlands
www.springer.com
Printed on acid-free paper
Cover image: Persistence of Memory, 1931, � Salvadore Dali, Fundaction Gala-Salvador
Dali, c/o Beeldrecht Amsterdam 2006
All Rights Reserved� 2006 SpringerNo part of this work may be reproduced, stored in a retrieval system, or transmitted in any
form or by any means, electronic, mechanical, photocopying, microfilming, recording orotherwise, without written permission from the Publisher, with the exception of any materialsupplied specifically for the purpose of being entered and executed on a computer system, for
exclusive use by the purchaser of the work.
Printed in the Netherlands
Table of Contents
1 From the Arrow of Time to the Arrow of Life /M. GARGAUD and J. REISSE ......... 1–9
1.1 The Notion of Time in Astrobiology...................................................................... 1
1.2 Why,Where, When andHow: Here are the Questions ........................................... 3
1.2.1 WHY? .................................................................................................... 3
1.2.2 WHERE? ............................................................................................... 4
1.2.3 WHEN (ANDHOW)? ........................................................................... 4
1.3 OurModest Contributions to the ‘‘When’’ (and ‘‘How’’?) Answers ....................... 5
1.3.1 THE ‘‘WHENANDWHERE’’MAKING-OF ..................................... 5
1.3.2 THE ‘‘WHY’’ MAKING-OF................................................................. 5
1.3.3 THE ‘‘HOW’’MAKING-OF................................................................. 6
2 DatingMethods and Corresponding Chronometers in Astrobiology /M. GARGAUD,
F. ALBAREDE, L. BOITEAU,M. CHAUSSIDON, E. DOUZERY and
T.MONTMERLE................................................................................................... 11–38
2.1 Astronomy: Dating Stellar Ages with the ‘‘Herzsprung–Russell Diagram’’ ........... 11
2.2 Geochemistry: Principles of Radioactive Dating.................................................... 16
2.2.1 LONG-LIVEDCHRONOMETERS..................................................... 19
2.2.2 SHORT-LIVEDCHRONOMETERS: EXTINCT
RADIOACTIVITIES ............................................................................ 20
2.2.3 THELIMITSOF THEMETHOD........................................................ 22
2.3 Chemistry: The Impossible use of Chemical Clocks in a Prebiotic Scope................ 23
2.3.1 SOMECHEMICALCLOCKSANDTHEIR LIMITS ......................... 25
2.3.2 CONCLUSIONS ................................................................................... 26
2.4 Biology: TheMolecular Clocks ............................................................................. 27
2.4.1 HISTORICAL PERSPECTIVEONTHEMOLECULARCLOCK..... 27
2.4.2 THEGLOBALMOLECULARCLOCK: A SINGLERATE
APPROACH.......................................................................................... 29
2.4.3 THELOCALMOLECULARCLOCKS: A FEWRATEAPPROACH 30
2.4.4 THE RELAXED MOLECULAR CLOCKS: A MULTIPLE RATEAPPROACH.......................................................................................... 31
2.4.5 THE FUTURE MOLECULAR CLOCKS: ACCURACY AND
PRECISION .......................................................................................... 32
2.5 The Triple Clock of Life in the Solar System .......................................................... 32
2.5.1 IS THEREABEGINING? THEPROBLEMOF ‘‘TIMEZERO’’ ANDTHELOGARITHMICCLOCK ............................................................. 32
2.5.2 ASTRONOMY VS. GEOLOGICAL AND BIOLOGICALCHRONOLOGIES: THE LINEAR CLOCKS..................................... 35
3 Solar System Formation and Early Evolution: the First 100Million Years /
T.MONTMERLE, J.-C. AUGEREAU,M. CHAUSSIDON,
M. GOUNELLE, B.MARTY and A.MORBIDELLI.............................................. 39–95
3.1 The First Million Years: The ‘‘Stellar Era’’ ............................................................ 40
3.1.1 THE SUN’S BIRTHPLACE.................................................................. 40
3.1.2 THE SUNASAFORMING STAR ...................................................... 46
3.1.3 A STELLARVIEWOFTHE ‘‘PRIMITIVE SOLARNEBULA’’ ........ 50
3.2 The First 10Million Years: The ‘‘Disk Era’’ .......................................................... 54
3.2.1 THEEVOLUTIONOFCIRCUMSTELLARDISKSAROUND
YOUNGSTARSAND IMPLICATIONS FORTHEEARLY SOLARSYSTEM................................................................................................ 54
3.2.2 THEFIRST FEWMILLIONYEARSASRECORDEDBY
METEORITEDATA ............................................................................ 63
3.2.3 INTERMEZZO ..................................................................................... 73
3.2.4 THEFIRST STAGESOF PLANETARYFORMATION INTHESOLAR SYSTEM.................................................................................. 74
3.3 The First 100Million Years: The ‘‘Telluric Era’’.................................................... 83
3.3.1 FORMATIONOFTHETERRESTRIAL PLANETSANDPRIMORDIAL SCULPTINGOFTHEASTEROID BELT ................ 83
3.3.2 THEFORMATIONOFTHEMOON .................................................. 85
3.3.3 TOWARDS 1GYR: THE EARLYEVOLUTIONOF
THEEARTH......................................................................................... 87
4 Building of a Habitable Planet / H.MARTIN, F. ALBAREDE, P. CLAEYS,
M. GARGAUD, B.MARTY, A.MORBIDELLI and D.L. PINTI ........................... 97–151
4.1 Terrestrial Differentiation ..................................................................................... 98
4.1.1 BULKCOMPOSITIONOFTHEEARTH (�4.568GA)...................... 99
4.1.2 ENERGETICOF PLANETARYDIFFERENTIATIONPROCESSES.......................................................................................... 100
4.1.3 THECHRONOMETERSOFACCRETIONANDDIFFERENTIATION........................................................................... 102
4.1.4 PETROLOGYOF PLANETARYDIFFERENTIATION................... 103
4.1.5 PLANETARYMAGMAOCEANSANDTHE SURFACEOFTHEPLANETSATTHEENDOFACCRETION (�4.56 TO�4.45 GA) .... 105
4.1.6 THEEARLYCRUST: TOWARDPLATETECTONICSANDCONTINENTS(4.5-4.4 GA) .................................................................. 106
4.2 Late Contributions................................................................................................ 107
4.2.1 ATMOSPHERE .................................................................................... 107
4.2.2 OCEAN ................................................................................................. 119
4.3 The First Continents.............................................................................................. 128
4.3.1 THE 3.8–3.9 GAARCHAEANCRUST................................................ 129
4.3.2 THE 4.0 GAARCHAEANCRUST ...................................................... 132
4.3.3 THE PRE-4. GAHADEANCRUST .................................................... 132
4.4 Late Heavy Bombardment (LHB) ......................................................................... 137
4.4.1 THELATEHEAVYBOMBARDMENT (LHB) .................................. 137
4.4.2 ORIGINOFTHELHB ......................................................................... 143
5 Prebiotic Chemistry – Biochemistry – Emergence of Life (4.4-2 Ga) / R. PASCAL,
L. BOITEAU, P. FORTERRE,M. GARGAUD, A. LAZCANO, P. LOPEZ-
GARCIA, D.MOREIRA,M.-C.MAUREL, J. PERETO, D. PRIEUR and
J. REISSE................................................................................................................ 153–203
5.1 AWord of Caution About Chronology ................................................................. 154
5.2 A Scenario Starting From the First Chemical Building Blocks............................... 157
5.2.1 AVAILABILITYOFORGANICMATTERANDENERGY............. 158
5.2.2 FAVOURABLEAREAS FOR PREBIOTIC CHEMICAL
PROCESSES.......................................................................................... 159

5.2.3 CHEMICALEVOLUTIONTHROUGHASTEPWISE PROCESS .... 159
5.2.4 CHEMICALEVOLUTIONTHROUGHADYNAMIC PROCESS ... 160
5.2.5 CATALYTICACTIVITYAND INFORMATION STORAGE .......... 161
5.3 Hypothesis about EarlyMetabolisms .................................................................... 167
5.3.1 PRELIMINARYDEFINITIONS......................................................... 168
5.3.2 HOWTHEFIRST ENTITIES PRESUMABLYGAINEDTHEIR
ENERGYANDCARBON? .................................................................. 168
5.4 Origin and Evolution of Compartments ................................................................ 171
5.4.1 AMPHIPHILIC VERSUSNON-AMPHIPHILICCOMPARTMENTS .............................................................................. 171
5.4.2 SELF-ASSEMBLYANDEARLYEVOLUTIONOF
COMPARTMENTS .............................................................................. 173
5.5 The Hypothesis of an RNAWorld ........................................................................ 174
5.5.1 THERNAWORLD SCRIPT................................................................ 175
5.5.2 THECASEOFADENINE ................................................................... 178
5.5.3 PROVISIONALCONCLUSIONS........................................................ 179
5.6 The RNA/DNATransition and the Origin of the Genetic Code ............................ 180
5.6.1 THEORIGINOFTHEGENETIC CODE ........................................... 180
5.6.2 DATINGGENETIC TAKEOVERS: HOWOLDARECELLULAR
DNAGENOMES?................................................................................. 184
5.7 The Last CommonAncestor.................................................................................. 187
5.7.1 PROTEIN SYNTHESIS IN THECENANCESTOR............................ 189
5.7.2 THECENANCESTOR’S GENOME: DNAORRNA?........................ 189
5.7.3 ENERGYANDCARBONMETABOLISM INTHECENANCESTOR.................................................................................. 190
5.7.4 THEMEMBRANEOFTHECENANCESTOR .................................. 191
5.7.5 OTHERUNRESOLVEDQUESTIONS ............................................... 192
5.8 The Origin of Viruses............................................................................................. 193
5.8.1 VIRAL PROPERTIES .......................................................................... 194
5.8.2 HYPOTHESESONTHEORIGINOFVIRUSES................................ 195
6 Environmental Context / H.MARTIN, P. CLAEYS,M. GARGAUD, D.L. PINTI
and F. SELSIS.......................................................................................................... 205–245
6.1 Evolution of Geological Mechanisms: The 2.5 Ga Transition................................ 206
6.1.1 EPISODICCRUSTALGROWTH ....................................................... 206
6.1.2 GLOBAL EVOLUTIONANDCHANGES (�2.5 GAAGO)............... 208
6.1.3 CONCLUSION ..................................................................................... 213
6.2 Atmosphere and Ocean Physico-chemical Evolution ............................................. 214
6.2.1 ATMOSPHERE EVOLUTION ............................................................ 214
6.2.2 CHEMICALEVOLUTIONOFTHEOCEANS................................... 223
6.3 Disturbing Events.................................................................................................. 232
6.3.1 SPHERULE LAYERS: THERECORDOFARCHAEANANDPROTEROZOIC IMPACT EVENTS. .................................................. 233
6.3.2 THE PALEOPROTEROZOICGLACIATIONS, THE FIRST SNOW-
BALL EARTH....................................................................................... 238
7 Ancient Fossil Record and Early Evolution (ca. 3.8 to 0.5 Ga) / P. LOPEZ-GARCIA,
P. CLAEYS, E. DOUZERY, P. FORTERRE, D.MOREIRA, D. PRIEUR
andM. VANZUILEN.............................................................................................. 247–290
7.1 The First Traces of Life ......................................................................................... 248
7.1.1 THETRACERS .................................................................................... 250
7.1.2 EXAMPLES FROMTHEFIELD ........................................................ 255
7.1.3 THECHALLENGESAHEAD............................................................. 264
7.2 Microbial andMetabolic Diversification............................................................... 265
7.2.1 HOWDOCONTEMPORARYCELLSGAIN THEIR ENERGY? ..... 265
7.2.2 WHATWERETHEMOST PROBABLEMILESTONES? .................. 267
7.3 The Origin of Eukaryotes ...................................................................................... 269
7.3.1 DIFFERENTHYPOTHESES FORTHEORIGINOFEUKARYOTES .................................................................................... 270
7.3.2 THELASTCOMMONANCESTOROFCONTEMPORARYEUKARYOTES .................................................................................... 274
7.3.3 WHENDIDEUKARYOTESAPPEARANDDIVERSIFY? .............. 275
7.4 The Neoproterozoic–Cambrian Transition (�1000 to 542Ma)............................... 279
8 A Synthetic Interdisciplinary ‘‘Chronological Frieze’’: an Attempt / D. DESPOIS
andM. GARGAUD.................................................................................................. 291–297
8.1 General Description .............................................................................................. 291
8.2 How to Interpret the Data of the ‘‘Chronological Frieze’’? .................................... 293
8.2.1 EONANDPHASE................................................................................ 293
8.2.2 AGE, ERRORBARS, TIMEANDDURATION................................. 293
8.2.3 REFERENCETIMES........................................................................... 293
8.2.4 EVENTS ................................................................................................ 293
8.2.5 DATINGMETHODS ........................................................................... 294
8.2.6 RELEVANTOBSERVATIONS ........................................................... 294
8.2.7 RELIABILITY ...................................................................................... 294
8.2.8 CONSEQUENCES FORLIFE’S ORIGINANDEVOLUTION ......... 294
8.2.9 REFERENCES ..................................................................................... 294
8.2.10 NOTES.................................................................................................. 294
9 Life On Earth... And Elsewhere? / T.MONTMERLE, P. CLAEYS,M. GARGAUD,
P. LOPEZ-GARCIA, H.MARTIN, R. PASCAL, J. REISSE and F. SELSIS ......... 299–312
9.1 The Chronology of Life in the Solar System: Highlights ........................................ 300
9.1.1 FROMTHEBIRTHOFTHE SUNTOTHEBIRTHOFTHEEARTH.................................................................................................. 300
9.1.2 THEHISTORYOFTHEEARLYEARTHANDGEOLOGICALCONSTRAINTSONTHEORIGINOFLIFE ..................................... 302
9.1.3 FACTSOF LIFE ................................................................................... 304
9.2 OurWorld in Perspective: Is Life Universal?.......................................................... 306
10 Authors’ CVs .......................................................................................................... 313–317
11 Glossary ................................................................................................................. 319–370

1. From the Arrow of Time to the Arrow of Life
MURIEL GARGAUDObservatoire Aquitain des Sciences de l’Univers, Universite Bordeaux1, Bordeaux, France
(E-mail: [email protected])
JACQUES REISSEFaculte des Sciences Appliquees (CP 165/64), Universite Libre de Bruxelles, Brussels, Belgium
(E-mail: [email protected])
(Accepted 4 April 2006)
Abstract. Astrobiology, like many (but not all) sciences, must take into account questions of the
‘‘Why?’’, ‘‘Where?’’, ‘‘How?’’ and ‘‘When?’’ type. In this introductory chapter, we explain why, in this
book, we will only consider two of these questions that are, moreover, deeply interrelated. Chronology is
by definition related to the ‘‘when?’’ question but as soon as we are interested in the history of Earth or the
history of life, it is impossible to treat these questions and their answers without explicit references to the
‘‘how?’’ questions. We also present in this chapter the genesis and the aim of the book.
Keywords: Time, dating
1.1. The Notion of Time in Astrobiology
Scientists are trained to ask questions about Nature. As is well known indialectics, the quality of the question determines the quality of the answer.Questions that remain unanswered for a long time are probably questionsthat must be formulated in a different way.
Each chapter (from the ‘‘Dating methods and corresponding chronometers in astro-biology’’ chapter 2 to the final ‘‘Life on Earth and elsewhere’’ chapter 9) has been submitted to avery severe internal refereeing, each author having read many, if not all, contributions to makecomments, criticisms and advice. As a general rule these comments/remarks were discussed
amongst the authors and were included in the original text. Ideally, all the authors could havesigned together all the contributions but we have preferred to ‘‘render to Caesar the thingswhich are Caesar’s’’ and the specialist who first wrote it signed each subchapter. For further
information on the contributing authors, please refer to CVs’, included at the end of thisvolume. All subchapters devoted to the same general field have been gathered together as achapter under a general title. Consequently, each chapter is alphabetically co-signed by all the
authors of the subchapters, and the first author is the coordinator who supervised its homo-geneity and completeness. In all cases, each author did his (or her) best to give to the reader themost accurate and recent data, along with the evidence, but also assumptions, on which the
data is founded and, when necessary, the caution required for its interpretation. A glossary ofterminology used in all chapters is available at the end of this volume.
Earth, Moon, and Planets (2006) 98: 1–9 � Springer 2006
DOI 10.1007/s11038-006-9085-7
Among the numerous questions scientists are interested in, those relatedto time are probably the most fascinating because time is a very peculiardimension. From Einstein’s work, we learnt that, for physics, time is ‘‘just’’the fourth dimension but, on the other hand, we are also aware that the timedimension, as we perceive it, is qualitatively different from the spacedimensions. Time ‘‘flows’’; time is irreversible and associated with past,present and future.
‘‘Why is time different from the other dimensions?’’ remains an openquestion, and this is one major reason why many scientists are fascinated byproblems related to time. Of course, not all sciences are historical, i.e. not allsciences focus their study on similarities or differences occurring betweenpast, present and future events. For example, a chemist studying the evolu-tion of a reaction as a function of time certainly knows that if pressure,temperature and all other experimental conditions are kept the same, thereaction will evolve tomorrow in a deterministic way, exactly as it does today.For this chemist, time is a parameter easily measurable with a chronometer.Even if the reaction under study is irreversible, chemists (as all scientists)know that the physical laws do not change with time. As Noether showed,this time translation independence is related to the energy conservation law(Zee, 1986)
The situation is completely different for a geologist or a biologist inter-ested in evolutionary problems. They must take into account the historicaltime and, therefore, the irreversible flow of time, the so-called ‘‘arrow oftime’’ (e.g. Klein and Spiro, 1997). For these scientists, a chronometer isuseless: they need to measure time with respect to a conventional referencetime. Their situation can be compared to that of a historian who, in Westerncountries, uses as reference time the birth of Christ, even though its date isstill debated among historians, being uncertain by several years. All of them,historians, geologists or biologists have in common their need to apply to atime reference chosen by convention.
Cosmologists are the only scientists who could claim to use a time scalebased on an absolute zero even if, today, it is discussed whether the Big Bangitself could be considered as the origin of our time. Planetologists and geol-ogists use different reference times depending on the problem they are inter-ested in. They know from cosmologists and astronomers that the Universe isprobably 13.7 billion years old, but they do not use the Big Bang as referencetime: they use the age of the oldest meteorites instead. Frequently, but notalways, they use a time scale that takes as reference time the ‘‘present time’’defined as 1950 AD1, which is the reference used for 14C dating. Any time isthus expressed in ‘‘years before present’’ (yr BP). On this scale and just asexamples, the accretion of the solar system took place approximately
1 AD = Anno Domini = After Jesus-Christ.
2 MURIEL GARGAUD AND JACQUES REISSE
4.6·109 yrs BP while the extinction of dinosaurs took place approximately65·106 yrs BP. As explained in Chapter 2 on chronometers, for various rea-sons different communities have to use different time scales, both forward andbackwards, even for events that are a common subject of study.
As mentioned above, not all sciences are historical. Yet many scientists,if not all of them, are concerned by the history of the solar system, of theEarth, and of life on it. Naturally, many of them also wonder about theexistence of extraterrestrial living systems, whose emergence and survivalwould depend on various physico-chemical parameters, including time.Some of these scientists investigate specific aspects of these broad topicsand, from their collaboration, a new scientific field, called Astrobiology,has emerged. Interestingly enough, although Astrobiology is a scientificfield in itself, scientists tend to avoid describing themselves as astrobiol-ogists. In any case, Astrobiology (exobiology or bioastronomy are alsoused as synonyms) is probably one of the best examples of a trulyinterdisciplinary field. By putting together pieces of a huge puzzle,astronomers, geologists, physicists, chemists, and biologists try to bring tothe fore scenarios that led to the emergence of life on Earth and, even-tually, to see if these scenarios could apply to other planets. The collab-oration between these scientists from different horizons does certainlycontribute to our understanding of the Earth’s remote past and to betterapprehend the conditions that allowed the emergence of life. Astrobiologyis, today, a well-identified science. Of course, we are still far from havingdefinitive answers to the countless questions related to events that tookplace billions of years ago. We should even consider the possibility thatsome of these answers will never be found. This may be perturbing for anexperimental scientist who is able to test his hypotheses by performingexperiments in his laboratory. However, this situation is absolutely normalif we consider the nature of all the historical sciences, including historyitself. Nobody knows with absolute certainty how and when language didoriginate in human populations. A few hypotheses exist, but compellingevidence proving one of them while disproving the others is still missing.It might be found tomorrow, in one century or never!
If one considers Astrobiology as a good example of a historical naturalscience, the types of questions that can be formulated may then be classifiedinto four families: ‘‘why’’, ‘‘when’’, ‘‘where’’ and ‘‘how’’
1.2. Why, Where, When and How: Here are the Questions
1.2.1. WHY?
Although we will not discuss here the qualitative differences between all thesefamilies, we would like to highlight the peculiarity of any question of the
3THE ARROW OF LIFE
‘‘why’’ family. Whatever the answer to a question of this type may be, an-other ‘‘why’’ question immediately arises. We can argue that this is a never-ending course, even if science reaches some day the ‘‘theory of everything’’that some theoretical physicists are looking for. Even if that is the case andthe four forces of physics eventually become unified, someone might ask:‘‘Why four forces and not five or seven?’’ ‘‘ Why the Planck constant is whatit is and not 1’’, etc.? The series of ‘‘why?’’ is thus infinite. It is interesting toobserve how difficult it is for many people to accept this situation. This isprobably one of the reasons why some people are searching, outside the fieldof science, what they consider as the ultimate response.
In this review dedicated to chronology (and for obvious scientific reasons)we have kept away the ‘‘why’’ questions.
1.2.2. WHERE?
‘‘Where’’ questions are sometimes asked in Astrobiology. Did life arisesomewhere else in the Universe? Does it exist on other planets? Was it born inanother planet and did the young Earth seed in some way, as postulates thepanspermia theory? From Kelvin to Arrhenius, from Hoyle to Crick, thepanspermia theory finds advocates. Nevertheless, this hypothesis, lacking anykind of observational support, will not be discussed in this review. Today, theexpression ‘‘molecular panspermia’’ is sometimes used to describe post-accretion processes during which pre-formed organic and water moleculeswere brought onto the young Earth. This kind of panspermia, on the con-trary, may have played an important role in the transition from non-living toliving matter and, as such, will be obviously discussed.
1.2.3. WHEN (AND HOW)?
In any historical science, determining a date requires a clear-cut definition ofthe event for which we want to get a dating, i.e. it must correspond to a pointon a continuous time scale. It usually corresponds to a singularity, i.e. atransition from a previous state to a new one that took place within a veryshort time. However, this condition is seldom fulfilled. In most cases, con-ventional, somehow, arbitrary discontinuities are defined just because thesediscontinuities are used to obtain a dating. A most paradigmatic exampleconcerns the origin of life itself. It is hard to believe that the transition from‘‘non-living’’ to ‘‘living’’ took place in a very short period of time. Further-more, any attempt to date this transition requires an agreement about thenature of ‘‘living’’ and ‘‘pre-living’’ systems. A microfossil may be unam-biguous evidence that life was present when the sedimentary process started,
4 MURIEL GARGAUD AND JACQUES REISSE

but its occurrence at a given time point does not preclude the existence of lifehundreds, thousands or millions of years before. Strictly speaking, it ispossible to determine the age of the oldest sediment containing microor-ganisms but it is impossible to ascertain the age of the first microorganisms.A similar situation applies to the age of the Earth or that of the first oceans.We can establish the age of the oldest refractory inclusions in a particulartype of chondrite or the age of the oldest zircons, but we are unable tomeasure directly the age of the Earth or that of the first oceans. Nevertheless,by fascinating ‘‘language shifts’’, we tend to speak about the age of the Earthor about the age of the first oceans. Moreover, these ages are considered to beknown with great accuracy whereas, in fact, what we know accurately is theage of what was measured i.e. the age of pieces of rocks or even of singleminerals within rocks (e.g. Jack Hills zircons are 4.4 billion years old, but therocks they were extracted from are much younger). All these ages arestrongly dependent on the validity of theoretical models describing theaccretion of the solar system or the formation of a hydrosphere on the sur-face of the young Earth as very rapid processes. Therefore, ‘‘when’’ questionsare often dependent on answers to ‘‘how’’ questions.
1.3. Our Modest Contributions to the ‘‘When’’ (and ‘‘How’’?) Answers
1.3.1. THE ‘‘WHEN AND WHERE’’ MAKING-OF
This project started in September 2003 during an exobiology summer school(Exobio’03) we (M. Gargaud and D. Despois) organise in Propriano (Cor-sica) every two years since 1999 and where 80 researchers working inastronomy, geology, chemistry and biology try, year after year, to reconsti-tute the story of the emergence and evolution of life on Earth and its possibledistribution elsewhere in the Universe.
1.3.2. THE ‘‘WHY’’ MAKING-OF
At that time, two of us (M. Gargaud and D. Despois) had the modestambition to put on a sheet of paper some chronological data relevant to theorigins of life and to understand what was the exact meaning of numbers insentences like ‘‘the solar system is 4.569 Ga old’’, ‘‘the first proto-oceanappeared around 4.4 Ga’’, ‘‘the first undisputable evidence of life is datedaround 2.7 Ga, but oldest traces of life could be dated as soon as 3.5 Ga’’. Inbrief, their goal was simply to understand:
5THE ARROW OF LIFE
– What is the exact meaning of data read in the literature?
This aspect is particularly important for people, even scientist, who arenot specialists of the field and have no other choice than to take for grantedwhat specialists say. If specialists all agree, it’s not really a problem but ofcourse it’s not often the case. The important secondary questions are then:
– What are the error bars associated with these numbers?– What sort of chronometer each scientific field uses and what is thereliability of each of them?
– Which hypotheses (models, observations, experiments) are assumed ortaken for granted to validate these data?
On the other hand, a number, as precise as could be, can rarely reflect asudden event (the transition from ‘‘non-living’’ to ‘‘living’’ can certainly notbe represented by a Dirac function) and some questions relative so thesenumbers are even more important. For instance:
– What has been exactly the duration of that event and how rigorous is it tospeak about a ‘‘beginning’’ and an ‘‘end’’ of a given one (planetary diskformation, Moon formation, ocean formation, late heavy bombardment,etc... but also and much more difficult, prebiotic chemistry, earlybiochemistry, etc...)
– What is the time reference used by astronomers, chemists, geologists orbiologists?
1.3.3. THE ‘‘HOW’’ MAKING-OF
Of course the questions previously listed were not obvious ones, but we wereenthusiastic enough to hope that one day of brainstorming with the wholecommunity would allow us to order, at least sequentially if not absolutely,the main events having led to the emergence of life. At the time of Exobio’03(September 2003), we didn’t even think to publish anything on these topics;we just wanted to clarify our own ideas.
In fact, we rapidly realized that we wouldn’t leave Propriano with theanswers we were looking for, but we were far from thinking that we had put afinger in a terrible set of gear – wheels from which we could only escape morethan two years later (and the story is probably not finished...), after twoothers specialized workshops on the subject and hours and hours of vivid andpassionate discussions...
Of course we were aware of the difficulties for an astronomer (geologist,chemist, biologist) to think like a biologist (astronomer, geologist, chemist)but having organised several conferences and summer schools devoted to
6 MURIEL GARGAUD AND JACQUES REISSE

various aspects of astrobiology, we thought that a common language wasnow more or less acquired. In a sense, we were right: the language wascommon, but the culture and the ways of thinking were (still are?) completelydifferent. Indeed, the nature of the problem each discipline can solve, thedifficulties encountered, the tools used to solve them, the interpretation oftheory/modelling/observations/experiments are by nature absolutely differ-ent. For example, physicists, and even more so astrophysicists, are used toextensive logical and deterministic constructions (mathematical models)spanning a bridge between facts and deduction. Indeed, and just as anexample, many details of the nuclear reactions inside stars rely, in fine, on themeasurements of only T and L on their surface, many thousands kilometresaway from the centre. ...Of course it’s far from being intellectually satisfying,but as nobody will never go inside a star nucleus to measure physicalparameters, (even though, in the case of the Sun, which is the only star weknow with great precision, we have access to deep layers via neutrinos andhelioseismology), the only choice astrophysicists have is to built models notat variance with observations.
Concerning the chronometers each discipline can rely on, here again thesituation is completely different from one field to another. For example,astronomers can collect a lot of information but the chronometers they havein hand are indirect and only of statistical nature (chapter 2.1). Geochemistshave very efficient radioactivity chronometers (chapters 2.2 and 3.2) but thedifficulty for them is to determine what is exactly dated and what they caninfer from these data (the latest measurements of Calcium AluminiumInclusion in Allende meteorite gives a very precise age of 4.5685±0.0004 ·109 yrs, but on what reliable hypotheses can we deduct that this gives also theage of the solar system with an error bar of less than 106 yrs?). Chemists haveno chronometers (chapters 2.3 and 5.1) and it’s even an impossible missionfor them to reconstruct the prebiotic chemistry and biochemistry period(between 4.4 and 2.7 billion years) when absolute and even to some extentsrelative chronology remains totally unknown. Hopefully the situation getsbetter in biology where molecular clocks are invaluable tools for recon-structing evolutionary timescales (chapter 2.4), but biochemical and biolog-ical problems are so complex that of course the reliability of chronometershelps but doesn’t solve everything in a definitive way...
Another problem we had to face was the relevance of an absolute t0 timeof reference. Of course it does not really matter to know that Ramses II lived1250 years BC or 3200 years BP, but if historians want to compare the reignof Ramses II with those of Amenophys III or Cleopatra, they have first toagree on a unique reference time. And what is important in fact for Egyptianhistory is not so much that Ramses II reigned 1250 years C, but that hereigned during 66 years, after Amenophys III and before Cleopatra. Once
7THE ARROW OF LIFE
again, duration is a very important parameter, and duration of course imply‘‘a’’ beginning and ‘‘an’’ end.
As indicated in the previous paragraph we could have decided to choosethe Big Bang as an absolute reference time. Nevertheless as we were inter-ested in the history of life on Earth, we started our study from the formationof the solar system (we could have started from the formation of the Earth aswell) and we defined an absolute and arbitrary time t0* which corresponds tothe start of the collapse of the molecular core cloud which precedes a timet0=4568.5·106 yrs corresponding to the oldest dated solids formed in theproto-solar nebula. This allowed us to describe the first million years byreference to t0* (see section 2.5) and to introduce the different stages ofprotostar and T-Tauri star, necessary to form the Sun, which occurred beforet0. But, as explained in chapter 2, t0 is the age of calcium aluminium inclu-sions in Allende meteorite, not the age of the solar system for which we’llnever know ‘‘exactly’’ when it started to form. We could also have chosendifferent relative times (t1 = impact of Theia on Earth, t2 = formation ofproto-ocean, t3 = end of the Late Heavy Bombardment, etc...) and de-scribed the different following events by reference to these relative times. Forpractical reasons we finally agreed to take by convention a unique t0(whatever could it be) and to introduce sometimes time elapsed since t0.Indeed it’s by far easier to remember that Moon formed between 10 and 70million years after the formation of the first solid in the solar system thanremembering that Moon formed between 4.558 and 4.498 billion years ago.
After some very enriching discussions on the determination of t0 (which westress again is without real importance but is somewhere the emerged part ofthe time-iceberg problem), we had to choose ‘‘when’’ to stop this reconstitu-tion of the history of life on Earth. Here again, and depending on the field ofcompetence of each of us, opinions were different. We decided finally to stopapproximately 0.5 billion years BP and we all agreed that between 100 millionsyears before the accretion of the Earth and 0.5 Ga BP, when multicellular lifeexploded at the beginning of the Cambrian, all kind of processes involved inthe evolution of our planet took place. Of course macroscopic life diversifiedspectacularly during the last 0.5 billion years (and the literature on this periodis very abundant) and the Earth itself continued to evolve, but the mostimportant steps for the emergence of life had already occurred.
In the following six chapters astronomers, geologists, chemists and biol-ogists will review what is known about the chronology of some key events(formation of the solar system, accretion and differentiation of the Earth,formation of the first oceans, late heavy bombardment, plate tectonics,appearance of prokaryotic life, evolution of the Earth atmosphere, origin ofeukaryotic life) and how this chronology has been established. A generalchronological frieze bringing to the fore the most important events relevant(at least to our opinion) to the emergence of life is presented in chapter 8, and
8 MURIEL GARGAUD AND JACQUES REISSE

final conclusions (chapter highlights and questions about the ubiquity of lifein the Universe) are presented in Chapter 9.
Acknowledgements
Writing a collegial paper with 25 researchers belonging to very differentscientific fields is a challenge comparable to a ‘‘frog race’’2. As we finally, alltogether, reach the finish, the editors would really like to thank all the au-thors who accepted to participate in this adventure and who accepted to stayon the ‘‘chronology wheelbarrow’’ whatever the difficulties could have beenand the time needed to reach the goal. We would also like to warmly thankthe «Chateau Monlot Capet», St Emilion, France http://www.belair-mon-lot.com/anglais/bienvenue.htm and the «Fondation Antoine d’Abbadie» ofthe French Academy of Sciences, Hendaye, France http://www.academie-sciences.fr/Abbadia.htm for their kind hospitality during the May andDecember 2004 «chronology workshops». The vivid and controversial ideasdiscussed during these workshops were at the origin of this review. Finally weare very grateful to Centre National de la Recherche Scientifique (CNRS),and especially to the Aquitaine and Limousin Delegation, to Centre Nationald’Etude Spatiale (CNES), to the GDR (Groupement de Recherche) Exobio,to the Conseil Regional d’Aquitaine, to the Universite Bordeaux 1 and to theObservatoire Aquitain des Sciences de l’Univers, near Bordeaux, for theirfinancial support in the course of this project.
References
Klein, E. and Spiro, M.: 1996, Le temps et sa fleche. Champs-Flammarion (Paris).Mayr, E.: 2004. What makes Biology Unique: Consideration on the Autonomy of a Scientific
Discipline, Cambridge University Press, Cambridge, USA.Zee, A.: 1986. Fearful Symmetry: the Search for Beauty in Modern Physics, Princeton Uni-
versity Press, Princeton, USA.
2 The game consists in starting from a point A with N frogs you have to put on a wheelbarrow,and to reach a point B as quickly as possible with all the frogs still on the wheelbarrow. Thestory goes that you never reach the finish of the race because you spend all your time looking
for frogs which, one after one, (and sometimes all together), jump outside the wheelbarrow.
9THE ARROW OF LIFE
2. Dating Methods and Corresponding Chronometers in Astrobiology
MURIEL GARGAUDObservatoire Aquitain des Sciences de l’Univers, Universite Bordeaux 1, Bordeaux, France
(E-mail: [email protected])
FRANCIS ALBAREDEEcole Normale Superieure, Lyon, France
(E-mail: [email protected])
LAURENT BOITEAUDepartment de Chimie, Universite Montpellier II, Montpellier, France
(E-mail: [email protected])
MARC CHAUSSIDONCentre de Recherches Petrographiques et Geochimiques (CRPG), Nancy, France
(E-mail: [email protected])
EMMANUEL DOUZERYInstitut des Sciences de l’Evolution, Universite Montpellier II, Montpellier, France
(E-mail: [email protected])
THIERRY MONTMERLELaboratoire d’Astrophysique de Grenoble, Universite Joseph Fourier, Grenoble, France
(E-mail: [email protected])
(Received 1 February 2006; Accepted 4 April 2006)
Abstract. This chapter concerns the tools with which time or durations are measured in the various
disciplines contributing to the chronology of the solar system until the emergence of life. These disciplines
and their tools are successively: astronomy (use of the Herzsprung–Russell diagram), geochemistry
(radioactive dating), chemistry (no clocks!), and biology (molecular clocks, based on rates of molecular
evolution over phylogenetic trees). A final section puts these tools in perspective, showing the impossibility
of using a unique clock to describe the evolution of the solar system and of life until today.
Keywords: Datingmethods, chronometers,Herzsprung-Russel diagram, radioactive dating,molecular clocks
2.1. Astronomy: Dating Stellar Ages with the ‘‘Herzsprung–Russell Diagram’’
THIERRY MONTMERLE
Since the beginning of the 20th century, astronomers have been using the‘‘Herzsprung–Russell Diagram’’ (after the name of its discoverers; ‘‘HRD’’for short) to classify stars and understand their evolution.
Earth, Moon, and Planets (2006) 98: 11–38 � Springer 2006
DOI 10.1007/s11038-006-9086-6

Observationally, astronomers first determine the magnitude and spectraltype of the stars. These numbers are then transformed into luminosity L* andtemperature Teff, which are physical quantities that can be compared withmodels. This assumes (i) knowing the distance (to convert magnitudes intoluminosities), which is determined by various methods (to an accuracy of~20–30% in the case of young stars), and (ii) converting from spectral typesto temperatures, which can be done with models of stellar photospheres. For‘‘simple’’ stars like the Sun, the temperature determination is very precise(<1%), but for more complex spectra, like Young stars (T Tauri stars) whichhave a circumstellar disk, the uncertainty may reach 10–20% or more.
In the course of their evolution, stars live two fundamentally differentlives. As is now well understood, stars like the Sun are in a quiet stage, lastingbillions of years, in which hydrogen is slowly converted into helium: this isknown as the ‘‘main sequence’’. The evolution continues after the main se-quence in a more complex way, but the energy output is always thermonu-clear in origin, with successive nuclear reaction networks driving importantchanges in the overall stellar structure (like the formidable expansion phaseof solar-type stars, known as ‘‘red giants’’, in which the stellar radius be-comes larger than the size of the solar system, ending in spectacular ‘‘plan-etary nebulae’’). This evolution is strongly dependent on mass: the mostmassive stars (>10 Mx
1 end their lives in catastrophic explosive eventsknown as supernovae that entirely disrupt them. At the other end of the massspectrum, low-mass stars (<0.7 Mx) are essentially eternal: their lifetimes arelonger than the age of the universe!
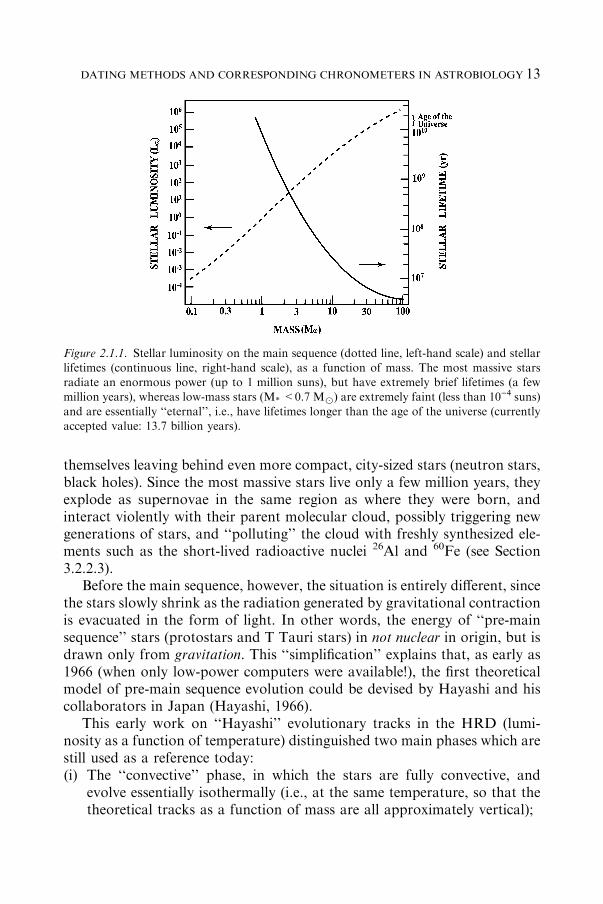
Figure 2.1.1 summarizes two important factors that crucially depend onstellar mass (adapted from Montmerle and Prantzos, 1988): the stellarluminosity (left) and the stellar lifetime (right). One can see that stellarluminosities (on the main sequence) span 9 orders of magnitude (L* from 10)3
Lx2 to 106 Lx), for masses M* between 0.1 and 100 Mx. This is an
expression of the well-known law L*�M*3, which can be demonstrated when
the stellar energy is derived only from the conversion of hydrogen intohelium. Correspondingly, massive stars burn more hydrogen per unit timethan lower-mass stars, and above 20 Mx live only a few million years.
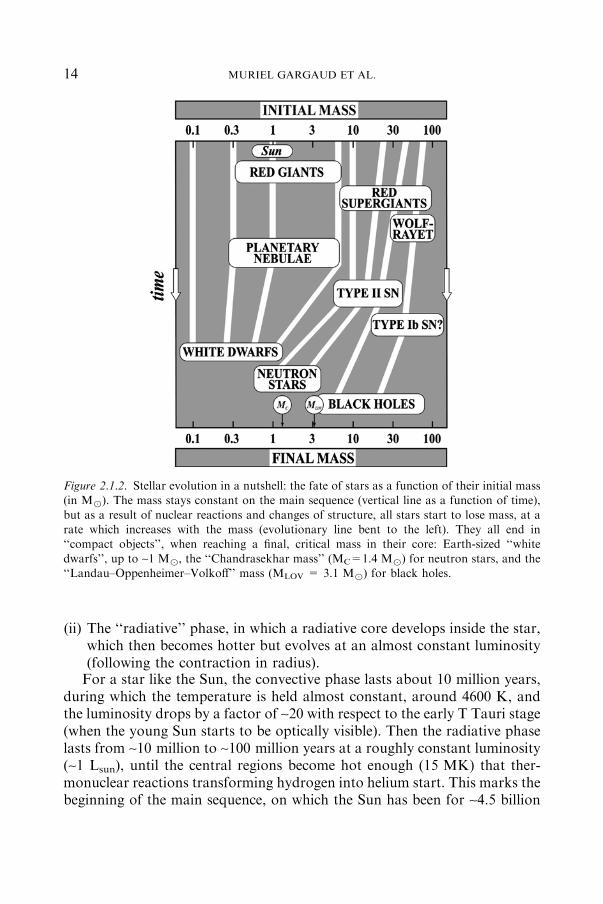
Figure 2.1.2 (also adapted from Montmerle and Prantzos, 1988) sum-marizes the fate of stars, depending on their mass. In brief, low-mass stars,including the Sun (M*<6–7 Mx), become ‘‘red giants’’ and lose mass toexpand as ‘‘planetary nebulae’’ after 108–109 yrs, leaving behind an Earth-sized, very hot (105 K) compact star: a ‘‘white dwarf’’. More massive starsevolve faster (Figure 2.1.1) and end their lives exploding as supernovae,
1 Mx ¼ 1 Solar mass ¼ 1.989·1030kg2 Lx ¼ 1 Solar luminosity ¼ 3.826·1026w
12 MURIEL GARGAUD ET AL.
themselves leaving behind even more compact, city-sized stars (neutron stars,black holes). Since the most massive stars live only a few million years, theyexplode as supernovae in the same region as where they were born, andinteract violently with their parent molecular cloud, possibly triggering newgenerations of stars, and ‘‘polluting’’ the cloud with freshly synthesized ele-ments such as the short-lived radioactive nuclei 26Al and 60Fe (see Section3.2.2.3).
Before the main sequence, however, the situation is entirely different, sincethe stars slowly shrink as the radiation generated by gravitational contractionis evacuated in the form of light. In other words, the energy of ‘‘pre-mainsequence’’ stars (protostars and T Tauri stars) in not nuclear in origin, but isdrawn only from gravitation. This ‘‘simplification’’ explains that, as early as1966 (when only low-power computers were available!), the first theoreticalmodel of pre-main sequence evolution could be devised by Hayashi and hiscollaborators in Japan (Hayashi, 1966).
This early work on ‘‘Hayashi’’ evolutionary tracks in the HRD (lumi-nosity as a function of temperature) distinguished two main phases which arestill used as a reference today:(i) The ‘‘convective’’ phase, in which the stars are fully convective, and
evolve essentially isothermally (i.e., at the same temperature, so that thetheoretical tracks as a function of mass are all approximately vertical);
Figure 2.1.1. Stellar luminosity on the main sequence (dotted line, left-hand scale) and stellarlifetimes (continuous line, right-hand scale), as a function of mass. The most massive starsradiate an enormous power (up to 1 million suns), but have extremely brief lifetimes (a fewmillion years), whereas low-mass stars (M* <0.7 Mx) are extremely faint (less than 10)4 suns)
and are essentially ‘‘eternal’’, i.e., have lifetimes longer than the age of the universe (currentlyaccepted value: 13.7 billion years).
13DATING METHODS AND CORRESPONDING CHRONOMETERS IN ASTROBIOLOGY
(ii) The ‘‘radiative’’ phase, in which a radiative core develops inside the star,which then becomes hotter but evolves at an almost constant luminosity(following the contraction in radius).For a star like the Sun, the convective phase lasts about 10 million years,
during which the temperature is held almost constant, around 4600 K, andthe luminosity drops by a factor of ~20 with respect to the early T Tauri stage(when the young Sun starts to be optically visible). Then the radiative phaselasts from ~10 million to ~100 million years at a roughly constant luminosity(~1 Lsun), until the central regions become hot enough (15 MK) that ther-monuclear reactions transforming hydrogen into helium start. This marks thebeginning of the main sequence, on which the Sun has been for ~4.5 billion
Figure 2.1.2. Stellar evolution in a nutshell: the fate of stars as a function of their initial mass(in Mx). The mass stays constant on the main sequence (vertical line as a function of time),
but as a result of nuclear reactions and changes of structure, all stars start to lose mass, at arate which increases with the mass (evolutionary line bent to the left). They all end in‘‘compact objects’’, when reaching a final, critical mass in their core: Earth-sized ‘‘white
dwarfs’’, up to ~1 Mx, the ‘‘Chandrasekhar mass’’ (MC=1.4 Mx) for neutron stars, and the‘‘Landau–Oppenheimer–Volkoff’’ mass (MLOV = 3.1 Mx) for black holes.
14 MURIEL GARGAUD ET AL.

years and will be for the next ~5 billion years, before it becomes, as men-tioned above, a solar-system-sized red giant and then a planetary nebula.
The pre-main sequence phase is illustrated more generally in Figure 2.1.3by the HRD of the Orion Nebula Cluster (‘‘ONC’’), the classic clusterassociated with the Orion nebula M42, adapted from Hillenbrand (1997).The reason for this choice is far from arbitrary: we now believe (see Chapter3) that the Sun was probably formed in a similar star cluster. The ONC itselfcomprises about 2000 stars, of which the best characterized 934 low-massstars are plotted in the diagram (dots). The observational points lie in a gridof theoretical lines: (i) the dotted lines label stellar masses, from 0.02 Mx, to5 Mx, with a thick dotted line marking the mass boundary below which starsnever ignite thermonuclear reactions (the so-called ‘‘brown dwarfs’’); (ii) theoblique dashed lines correspond to stellar ages, labelled by factors of 10, from
Figure 2.1.3. Herzsprung–Russell diagram of 934 low-mass members of the Orion NebulaCluster (adapted from Hillenbrand, 1997). The spectral types corresponding to surface tem-peratures (Teff) are also indicated at the top of the diagram. The theoretical grid is labeled in
masses, from 0.02 to 5 Mx (dotted lines; the upper left-hand dotted lines for higher masses arehighly uncertain) and ages, from 105 to 108 yrs (dashed lines). The main sequence is alsoindicated. The thick dotted line to the right indicates the theoretical evolution of stars of mass
<0.08 Mx (brown dwarfs), which never ignite nuclear reactions, hence never reach the mainsequence.
15DATING METHODS AND CORRESPONDING CHRONOMETERS IN ASTROBIOLOGY

105 yr (top) to 108 yr (bottom, main sequence). As they evolve, the starsfollow the ‘‘Hayashi evolutionary tracks’’ (dotted lines), successively con-vective and radiative as explained above for the Sun (1 Mx by definition),until they reach the main sequence.
Then in such a diagram each (L*, Teff) observational point is converted,via theoretical model grids, into (mass, age) estimates (see Hillenbrand, 1997for details and references; new theoretical models have been constructed sincethat paper, especially covering the high-mass and very low-mass ends: e.g.,Chabrier and Baraffe, 2000; Palla and Stahler, 2001). For the ONC, one seesthat the observed masses for the majority of stars run from ~0.1 Mx to5 Mx and above, and the ages from less than (i.e., younger than) 105 yrs to afew million years. Ages smaller than 105 yrs are very uncertain, and all thestars shown should be understood as being ‘‘very young’’ only. The age ofolder stars (>106 yrs) is more reliable (uncertainty ~20–30%). One majorconclusion from this diagram is that star formation in Orion has not beeninstantaneous, but is spread over a few million years and still continues today(see Section 3.2.2.3).
2.2. Geochemistry: Principles of Radioactive Dating
FRANCIS ALBAREDE AND MARC CHAUSSIDON
A number of radioactive elements were present in the solar system when itformed. As a consequence, geochemical ages can be obtained for a given rockfrom the amount of daughter isotopes that have been accumulated in itsdifferent minerals via radioactive decay of the parent isotopes. It must benoted that the proportions of parent isotopes remaining in rocks have norelationship with the age of the rock, but are a direct function of the age ofthe considered chemical element, i.e., the average time elapsed since thenucleosynthesis of this element. The strength of isotopic dating is thatradioactive decay is a nuclear process so that the rate of decay is constant andthus independent of the history of a rock.
Radioactivity is a memoryless process (atoms do not age) and is thereforea nuclear event whose probability of occurrence per unit of time, noted k, isindependent of time. This probability, termed the decay constant, is specific toeach radioactive nuclide. Radioactive decay is a Poisson process, where thenumber of events is proportional to the time over which the observation ismade. In the absence of any other loss or gain, the proportion of parentatoms (or radioactive nuclides) disappearing per unit of time t is constant:
dP
Pdt¼ �k: (1)
16 MURIEL GARGAUD ET AL.
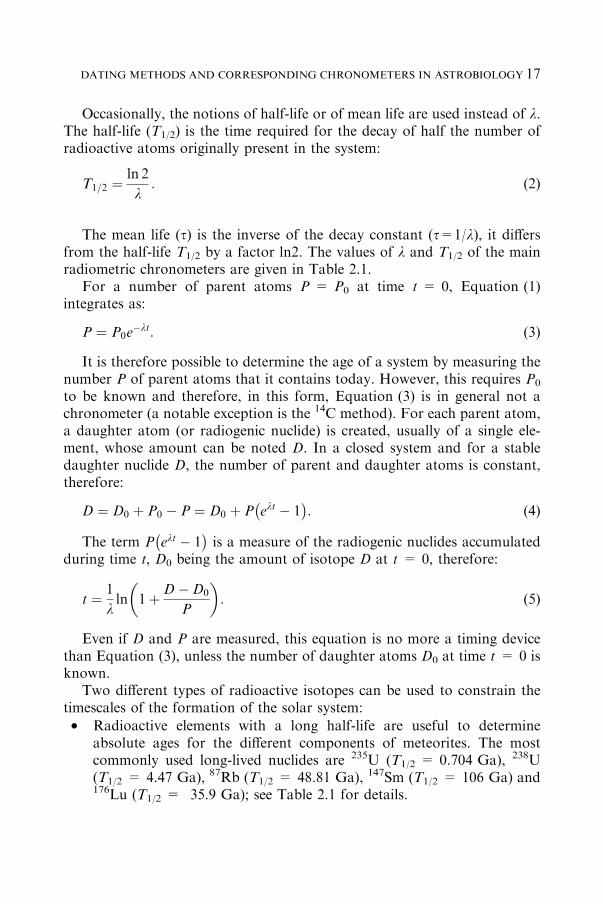
Occasionally, the notions of half-life or of mean life are used instead of k.The half-life (T1/2) is the time required for the decay of half the number ofradioactive atoms originally present in the system:
T1=2 ¼ ln 2
k: (2)
The mean life (s) is the inverse of the decay constant (s=1/k), it differsfrom the half-life T1/2 by a factor ln2. The values of k and T1/2 of the mainradiometric chronometers are given in Table 2.1.
For a number of parent atoms P = P0 at time t = 0, Equation (1)integrates as:
P ¼ P0e�kt: (3)
It is therefore possible to determine the age of a system by measuring thenumber P of parent atoms that it contains today. However, this requires P0
to be known and therefore, in this form, Equation (3) is in general not achronometer (a notable exception is the 14C method). For each parent atom,a daughter atom (or radiogenic nuclide) is created, usually of a single ele-ment, whose amount can be noted D. In a closed system and for a stabledaughter nuclide D, the number of parent and daughter atoms is constant,therefore:
D ¼ D0 þ P0 � P ¼ D0 þ P ekt � 1� �
: (4)
The term P ekt � 1� �
is a measure of the radiogenic nuclides accumulatedduring time t, D0 being the amount of isotope D at t = 0, therefore:
t ¼ 1
kln 1þD�D0
P
� �: (5)
Even if D and P are measured, this equation is no more a timing devicethan Equation (3), unless the number of daughter atoms D0 at time t = 0 isknown.
Two different types of radioactive isotopes can be used to constrain thetimescales of the formation of the solar system:
• Radioactive elements with a long half-life are useful to determineabsolute ages for the different components of meteorites. The mostcommonly used long-lived nuclides are 235U (T1/2 = 0.704 Ga), 238U(T1/2 = 4.47 Ga), 87Rb (T1/2 = 48.81 Ga), 147Sm (T1/2 = 106 Ga) and176Lu (T1/2 = 35.9 Ga); see Table 2.1 for details.
17DATING METHODS AND CORRESPONDING CHRONOMETERS IN ASTROBIOLOGY

TABLE 2.1Decay constant k and half life (T(1/2)) for main radiometric chronometer
Parent nuclide Daughter nuclide k = Decay constant T1/2 = Half life
7Be 7Li 4,7735 yr)1 53 d228Th 224Ra 3.63 · 10)1 yr)1 1.91 yr210Pb 210Bi 3.11 · 10)2 yr)1 22.3 yr32Si 32P 2.1 · 10)3 yr)1 330 yr226Ra 222Rn 4.33 · 10)4 yr)1 1.60 · 103 yr14C 14N 1.245 · 10)4 yr)1 5.59 · 103 yr231Pa 227Ac 2.11 · 10)5 yr)1 3.29 · 104 yr230Th 226Ra 9.21 · 10)6 yr)1 7.53 · 104 yr59Ni 59Co 9.12 · 10)6 yr)1 7.60 · 104 yr41Ca 41K 6.93 · 10)6 yr)1 1.00 · 105 yr81Kr 81Br 3.03 · 10)6 yr)1 2.29 · 105 yr234U 230Th 2.83 · 10)6 yr)1 2.45 · 105 yr36Cl 36Ar 2.30 · 10)6 yr)1 3.01 · 105 yr26Al 26Mg 9.80 · 10)7 yr)1 7.07 · 105 yr107Pd 107Ag 6.5 · 10)7 yr)1 1.07 · 106 yr60Fe 60Ni 4.62 · 10)7 yr)1 1.50 · 106 yr10Be 10B 4.59 · 10)7 yr)1 1.51 · 106 yr53Mn 53Cr 1.87 · 10)7 yr)1 3.71 · 106 yr182Hf 182W 7.7 · 10)8 yr)1 9.00 · 106 yr129I 129Xe 4.3 · 10)8 yr)1 1.61 · 107 yr92Nb 92Zr 1.93 · 10)8 yr)1 3.59 · 107 yr244Pu 131-136Xe 8.66 · 10)9 yr)1 8.00 · 107 yr235U 207Pb 9.849 · 10)10 yr)1 7.04 · 108 yr146Sm 142Nd 6.73 · 10)10 yr)1 1.03 · 109 yr40K 40Ar 5.50 · 10)10 yr)1 1.26 · 109 yr40K 40Ca 4.96 · 10)10 yr)1 1.40 · 109 yr187Re 187Os 1.64 · 10)11 yr)1 4.23 · 1010 yr238U 206Pb 1.551 · 10)10 yr)1 4.47 · 109 yr87Rb 87Sr 1.42 · 10)11 yr)1 4.88 · 1010 yr40K 40Ar 5.81 · 10)11 yr)1 1.19 · 1010 yr232Th 208Pb 4.95 · 10)11 yr)1 1.40 · 1010 yr176Lu 176Hf 1.93 · 10)11 yr)1 3.59 · 1010 yr147Sm 143Nd 6.54 · 10)12 yr)1 1.06 · 1011 yr138La 138Ce 2.24 · 10)12 yr)1 3.09 · 1011 yr130Te 130Xe 8.66 · 10)23 yr)1 8.00 · 1021 yr
18 MURIEL GARGAUD ET AL.
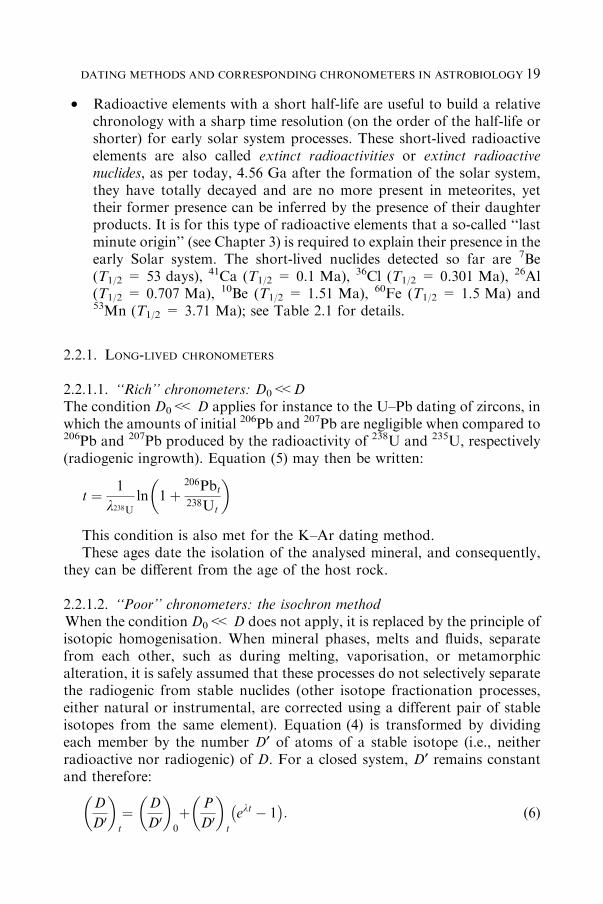
• Radioactive elements with a short half-life are useful to build a relativechronology with a sharp time resolution (on the order of the half-life orshorter) for early solar system processes. These short-lived radioactiveelements are also called extinct radioactivities or extinct radioactivenuclides, as per today, 4.56 Ga after the formation of the solar system,they have totally decayed and are no more present in meteorites, yettheir former presence can be inferred by the presence of their daughterproducts. It is for this type of radioactive elements that a so-called ‘‘lastminute origin’’ (see Chapter 3) is required to explain their presence in theearly Solar system. The short-lived nuclides detected so far are 7Be(T1/2 = 53 days), 41Ca (T1/2 = 0.1 Ma), 36Cl (T1/2 = 0.301 Ma), 26Al(T1/2 = 0.707 Ma), 10Be (T1/2 = 1.51 Ma), 60Fe (T1/2 = 1.5 Ma) and53Mn (T1/2 = 3.71 Ma); see Table 2.1 for details.
2.2.1. LONG-LIVED CHRONOMETERS
2.2.1.1. ‘‘Rich’’ chronometers: D0<<DThe condition D0<< D applies for instance to the U–Pb dating of zircons, inwhich the amounts of initial 206Pb and 207Pb are negligible when compared to206Pb and 207Pb produced by the radioactivity of 238U and 235U, respectively(radiogenic ingrowth). Equation (5) may then be written:
t ¼ 1
k238U
ln 1þ206Pbt238Ut
� �
This condition is also met for the K–Ar dating method.These ages date the isolation of the analysed mineral, and consequently,
they can be different from the age of the host rock.
2.2.1.2. ‘‘Poor’’ chronometers: the isochron methodWhen the condition D0<< D does not apply, it is replaced by the principle ofisotopic homogenisation. When mineral phases, melts and fluids, separatefrom each other, such as during melting, vaporisation, or metamorphicalteration, it is safely assumed that these processes do not selectively separatethe radiogenic from stable nuclides (other isotope fractionation processes,either natural or instrumental, are corrected using a different pair of stableisotopes from the same element). Equation (4) is transformed by dividingeach member by the number D¢ of atoms of a stable isotope (i.e., neitherradioactive nor radiogenic) of D. For a closed system, D¢ remains constantand therefore:
D
D0
� �t
¼ D
D0
� �0
þ P
D0
� �t
ekt � 1� �
: (6)
19DATING METHODS AND CORRESPONDING CHRONOMETERS IN ASTROBIOLOGY
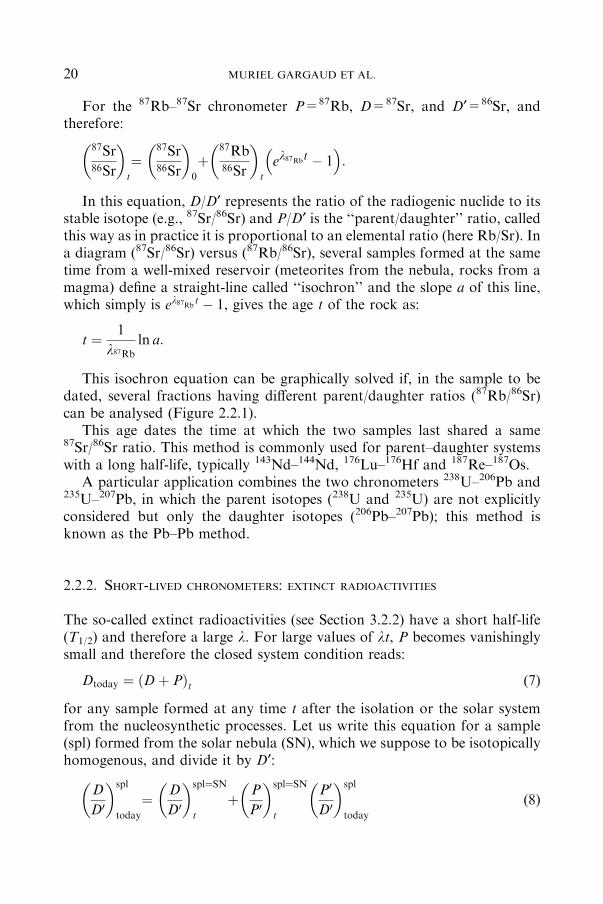
For the 87Rb–87Sr chronometer P=87Rb, D=87Sr, and D¢=86Sr, andtherefore:
87Sr86Sr
� �t
¼87Sr86Sr
� �0
þ87Rb86Sr
� �t
ek87Rbt � 1
� �:
In this equation, D/D¢ represents the ratio of the radiogenic nuclide to itsstable isotope (e.g., 87Sr/86Sr) and P/D¢ is the ‘‘parent/daughter’’ ratio, calledthis way as in practice it is proportional to an elemental ratio (here Rb/Sr). Ina diagram (87Sr/86Sr) versus (87Rb/86Sr), several samples formed at the sametime from a well-mixed reservoir (meteorites from the nebula, rocks from amagma) define a straight-line called ‘‘isochron’’ and the slope a of this line,which simply is ek87Rb
t � 1, gives the age t of the rock as:
t ¼ 1
k87Rb
ln a:
This isochron equation can be graphically solved if, in the sample to bedated, several fractions having different parent/daughter ratios (87Rb/86Sr)can be analysed (Figure 2.2.1).
This age dates the time at which the two samples last shared a same87Sr/86Sr ratio. This method is commonly used for parent–daughter systemswith a long half-life, typically 143Nd–144Nd, 176Lu–176Hf and 187Re–187Os.
A particular application combines the two chronometers 238U–206Pb and235U–207Pb, in which the parent isotopes (238U and 235U) are not explicitlyconsidered but only the daughter isotopes (206Pb–207Pb); this method isknown as the Pb–Pb method.
2.2.2. SHORT-LIVED CHRONOMETERS: EXTINCT RADIOACTIVITIES
The so-called extinct radioactivities (see Section 3.2.2) have a short half-life(T1/2) and therefore a large k. For large values of kt, P becomes vanishinglysmall and therefore the closed system condition reads:
Dtoday ¼ Dþ Pð Þt (7)
for any sample formed at any time t after the isolation or the solar systemfrom the nucleosynthetic processes. Let us write this equation for a sample(spl) formed from the solar nebula (SN), which we suppose to be isotopicallyhomogenous, and divide it by D¢:
D
D0
� �spl
today
¼ D
D0
� �spl¼SN
t
þ P
P0
� �spl¼SN
t
P0
D0
� �spl
today
(8)
20 MURIEL GARGAUD ET AL.

in which, as above, P¢ is an isotope of the parent nuclide P, and the closedsystem assumption (P¢)t=(P¢)0 holds. This equation is equivalent to:
D
D0
� �spl
today
¼ D
D0
� �SN
today
þ P
P0
� �sple¼SN
t
P0
D0
� �spl
today
� P0
D0
� �SN
today
" #(9)
in which we used a transformation of Equation (7) as:
D
D0
� �SN
t
¼ D
D0
� �SN
today
� P
D0
� �SN
t
¼ D
D0
� �SN
today
� P
P0
� �SN
t
P0
D0
� �SN
today
(10)
with the usual closed-system constraint on both D¢ and P¢.In the case of the 26Al–26Mg chronometer, Equation (8) reads:
26Mg24Mg
� �spl
today
¼26Mg24Mg
� �spl¼SN
t
þ26Al27Al
� �spl¼SN
t
27Al24Mg
� �spl
today
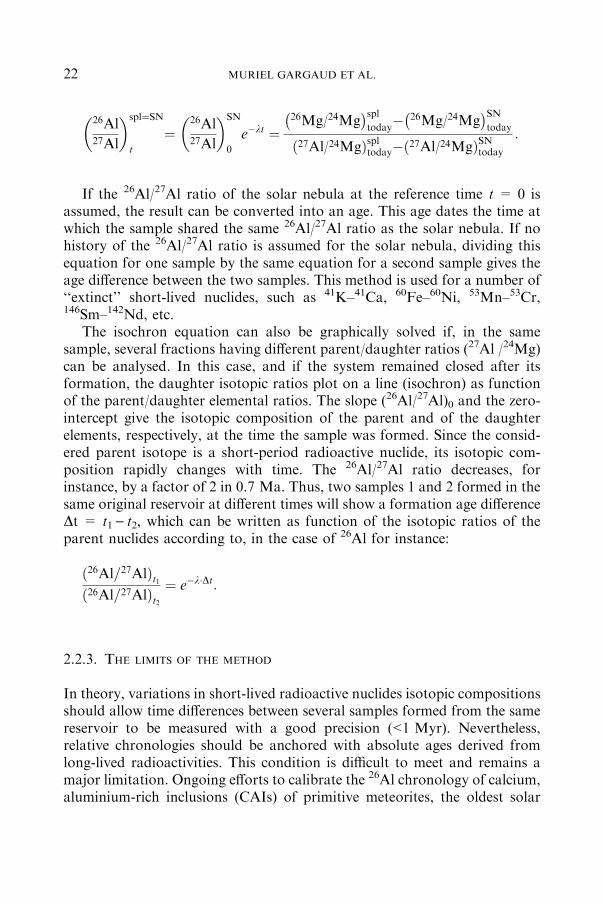
which, for a set of samples formed at time t from a homogeneous nebula, isthe equation of an isochron in a 26Mg/24Mg vs. 27Al/24Mg plot. Both theslope and the intercept of the isochron (which revolves around the pointrepresenting the solar nebula) are time-dependent.
The 26Al/27Al ratio of the solar nebula at the time a particular sampleformed is obtained by isolating the (P/P¢)t ratio from equation (9), here for26Al:
Figure 2.2.1. D/D¢ vs. P/D¢ isochron diagram showing how the slope a of the ‘‘isochron’’ is atime dependent parameter, whose knowledge allows to calculate time t. See other examples in
Chapter 3.2: Figures 3.2.7, 3.2.8.
21DATING METHODS AND CORRESPONDING CHRONOMETERS IN ASTROBIOLOGY
26Al27Al
� �spl¼SN
t
¼26Al27Al
� �SN
0
e�kt ¼26Mg/24Mg� �spl
today� 26Mg/24Mg� �SN
today
27Al/24Mgð Þspltoday� 27Al/24Mgð ÞSNtoday:
If the 26Al/27Al ratio of the solar nebula at the reference time t = 0 isassumed, the result can be converted into an age. This age dates the time atwhich the sample shared the same 26Al/27Al ratio as the solar nebula. If nohistory of the 26Al/27Al ratio is assumed for the solar nebula, dividing thisequation for one sample by the same equation for a second sample gives theage difference between the two samples. This method is used for a number of‘‘extinct’’ short-lived nuclides, such as 41K–41Ca, 60Fe–60Ni, 53Mn–53Cr,146Sm–142Nd, etc.
The isochron equation can also be graphically solved if, in the samesample, several fractions having different parent/daughter ratios (27Al /24Mg)can be analysed. In this case, and if the system remained closed after itsformation, the daughter isotopic ratios plot on a line (isochron) as functionof the parent/daughter elemental ratios. The slope (26Al/27Al)0 and the zero-intercept give the isotopic composition of the parent and of the daughterelements, respectively, at the time the sample was formed. Since the consid-ered parent isotope is a short-period radioactive nuclide, its isotopic com-position rapidly changes with time. The 26Al/27Al ratio decreases, forinstance, by a factor of 2 in 0.7 Ma. Thus, two samples 1 and 2 formed in thesame original reservoir at different times will show a formation age differenceDt = t1) t2, which can be written as function of the isotopic ratios of theparent nuclides according to, in the case of 26Al for instance:
ð26Al=27AlÞt1ð26Al=27AlÞt2
¼ e�k�Dt:
2.2.3. THE LIMITS OF THE METHOD
In theory, variations in short-lived radioactive nuclides isotopic compositionsshould allow time differences between several samples formed from the samereservoir to be measured with a good precision (<1 Myr). Nevertheless,relative chronologies should be anchored with absolute ages derived fromlong-lived radioactivities. This condition is difficult to meet and remains amajor limitation. Ongoing efforts to calibrate the 26Al chronology of calcium,aluminium-rich inclusions (CAIs) of primitive meteorites, the oldest solar
22 MURIEL GARGAUD ET AL.
system condensates against the U/Pb age are very promising (U/Pb age of4567.2±0.6 Ga; see discussion and references in Section 3.2.2.2).
Other limitations exist in using radioactive isotopes to date rocks. Thesystem to be dated is assumed to have formed very quickly and to havesubsequently remained closed to exchanges with gases, fluid phases, andadjacent minerals for both the parent and daughter isotopes. For shockedmeteorites, this condition is usually not met and perturbations of the isotopicsystems are often clearly visible. In addition, minerals do not cool instanta-neously, simply because of the thermal inertia of the host planetary body.Most meteorite dates therefore reflect a cooling age, i.e., the time at which thehost rock in the parent planetesimal cooled down below the so-calledblocking temperature. This temperature marks the point when solid statediffusion becomes too slow to allow a redistribution of the parent anddaughter isotopes. Cooling rates are not an issue for CAIs and chondrulesthat rapidly cooled in the nebular gas. However, the chondrite parent bodieskept accreting long after the formation of the CAIs and chondrules they host,and a protracted thermal history of the parent planetesimals heated by thedecay of 26Al and 60Fe is expected.
Dating minerals and rocks in meteorites therefore entails more thanproducing isotopic ‘‘ages’’. It requires a deep understanding of what theseages mean with respect to the processes that lead to the isolation of thechronometers, the cooling history of their carrier, and any perturbationinvalidating the basic dating premises.
Additional material about the principles of isotopic rock dating can befound in Albarede, 2001, 2003; Allegre, 2005; Faure, 1986; Vidal, 1998.
2.3. Chemistry: The Impossible use of Chemical Clocks in a Prebiotic Scope
LAURENT BOITEAU
The use of chemistry as a clock (‘‘chemical chronology’’) basically relies on thequantification of molecular compounds involved in known chemical reactions(either as reactants or as products). Although in most astrophysical contextsthe term ‘‘chemistry’’ strictly refers to element/isotope quantification, we shallnot deal with these latter items since they are rather relevant to nucleosynthesisand/or radioactivity (nuclear physics). This also excludes the quantification ofgiven chemical elements as time markers in e.g. geological stratigraphy, sincethe dating is not provided by chemistry itself, but rather by other physicalmethods. The most popular example is the anomalously high abundance ofiridium and other siderophilic elements in the K/T layer, mostly considered tobe directly connected to the fall of an asteroid ca. 65 Myr ago.
23DATING METHODS AND CORRESPONDING CHRONOMETERS IN ASTROBIOLOGY

A preliminary requisite for using chemistry as a clock is a concern ofanalytical chemistry. Indeed it is necessary to be able to quantify – bothaccurately and precisely – the targeted molecular compound(s) from its –usually solid – matrix. Considering we have to deal with ‘‘natural’’ samples(geological or archaeological), such a problem is far from trivial: targetedorganic analytes are likely to be present at trace level, in mixture with manyother compounds (either similar or different), often included in a mineralizedmatrix, which complicates the extraction and analysis process (for a review ofthe complexity of this issue see Vandenabeele et al., 2005).
However it would be misleading to consider ‘‘chemical chronology’’ as justa concern of analytical chemistry, although far from negligible. The mostfundamental element is chemical kinetics. In theory any set of chemical reac-tions could be considered, provided that the following elements are known:
• The set of reactions involving the given analyte (including catalyticprocesses);
• The kinetic law of these reactions;• The boundary conditions: amount of reactants and products at time
t = 0, as well as temperature, pressure etc.It must be mentioned in addition that conversely to radioisotope decay
(which is strictly first-order) the kinetics of most chemical reactions aredependent on pressure and – especially – on temperature (a temperatureincrease of 10 �C often involves a doubling of the reaction rate and probablymuch more for many slow reactions that may be useful for dating, see Wol-fenden et al., 1999). Therefore, when these parameters are not constant theknowledge of their historicity is also necessary.An implicit condition is that thesystem is closed (no exchange of matter with the surrounding environment),otherwise the historicity of input/output of reactants/products must also beknown. With the knowledge of the above elements, the building of a kineticmodel (predicting the time-dependence of involved compounds) for givenboundary conditions is possible through (numerically) solving a set of differ-ential equations. In many cases the inverse problem can also be solved, i.e.retrieving the set of kinetic equations from monitoring the involved analytes,mostly through numerical simulations and fitting with experimental data.
In most cases however – especially in a geological/archaeological context –the problem is too open, with lack of information for instance about thehistoricity of temperature or the boundary conditions. Moreover, in manycases a given set of (analyte) measured values can correspond to severalpossible sets of boundary conditions, especially when reactions other thanfirst-order are involved. Thus practically almost only first-order reactions canefficiently serve as clocks, what mostly means unimolecular reactions, forinstance degradation of macromolecules or epimerisation of asymmetriccentres.
24 MURIEL GARGAUD ET AL.
2.3.1. SOME CHEMICAL CLOCKS AND THEIR LIMITS
2.3.1.1. Temperature dependenceWhile the variations of pressure have usually a slow influence on reactionkinetics in condensed phase (unless reaching very high values), temperaturevariations strongly affect chemical kinetics (according to Arrhenius’ orEyring’s laws). Since the historicity of temperature is mostly unknown overgeological timescales, it must be assumed to be constant, a condition veryrarely fulfilled over long extents of time. This is a major drawback against theuse of chemical reactions as geochronometers. Conversely however, mea-surement of the extent of given chemical degradations for otherwise well-dated samples can provide useful information on temperature historicity(Schroeder and Bada, 1976).
2.3.1.2. Epimerisation of amino acidsAn example is given with the most documented reaction so far in this field,namely acid epimerisation through diagenesis of remains of dead organisms(Schoeder and Bada, 1976; Section 8.1 in Geyh and Schleicher, 1990). Thevalidity range of such a method (on the condition of additional informationon temperature historicity) has been estimated to be of the order of 106 yrs.Moreover, the use of this reaction as a clock entirely relies on the homo-chirality of protein residues in alive organic matter, thus being probablyuseless in a prebiotic context where the boundary conditions (initial enan-tiomeric excess) are unknown.
2.3.1.3. Hydration of obsidian and silicate glassThe adsorption of water at the surface of glass induces a diffusion-controlledhydration reaction, resulting into the slow growth of a hydrated layer. Due tothe compactness of the glass material, the reaction front can remain verysharp over ages, being detectable through quite simple optical observations.Modelling of glass hydration kinetics allowed to make it a reliable chrono-metric method for samples aged up to 106 yr (Section 8.6 in Geyh andSchleicher, 1990).
Other chemically-based chronometric methods are mentioned in the lit-erature (Sections 8.2–8.3 in Geyh and Schleicher, 1990), not suitable to datesearlier than the quaternary era: the degradation of amino acids (from pro-teins) in fossilised shells (ca. 2 · 106 yr); the measurement of nitrogen and/orcollagen content in bones (ca. 105 yr). In addition, so-called ‘‘molecularclocks’’ actually based on the comparison of protein or DNA sequences ofliving organisms (in order to determine their ‘‘evolutive’’ age), are not reallyrelevant to chemistry, but rather to molecular biology and will thus be dis-cussed in part 2.4.
25DATING METHODS AND CORRESPONDING CHRONOMETERS IN ASTROBIOLOGY

2.3.1.4. Stable isotope fractionationTo a certain extent, stable isotope fractionation used as a chronologicalmarker can be relevant to chemistry, since in many cases the fractionationis the consequence of slight differences in stability and/or reactivity ofisotopomers (compounds of same molecular structure varying only by theirisotope composition). However in such a case chemical factors are almostindissociable from physical factors such as specific gravity and/or vapourpressure. An example is oxygen isotopic fractionation (18O/16O) duringseawater evaporation (measured through oxygen isotopic ratio deviation inAntarctic ice mantle or in sediments), used as a marker of Earth temper-ature historicity in tertiary/quaternary eras (Gat, 1996; Section 7.2 in Geyhand Schleicher, 1990). Another chronostratigraphic time scale covering thecomplete phanerozoic era (0–650 Ma) relies on isotopic ratio deviation ofsulphur (d34S), carbon (d13C) and/or strontium (87Sr/86Sr ratio), and oncorrelations between theses values, such isotope fractionation having oc-curred upon biochemical or geochemical processes (Section 7.3 in Geyh andSchleicher, 1990).
2.3.1.5. Time scales extentEven considering that the above-mentioned limitations could be overcome,the time scales of chemical processes are far from adequate for prebioticchemistry. For instance the epimerisation of a-hydrogenated amino acids isestimated to be complete within at most 109 yrs (Schroeder and Bada, 1976).Polypeptide (protein) degradation is likely to be faster, while the survivabilityof fossil DNA (much more stable than RNA) is of the order of 107 yrs undergeological conditions (Paabo and Wilson, 1991). Time scales based on stableisotope fractionation do not extend beyond the phanerozoic era. Applica-tions would thus be mostly limited to ‘‘recent’’ palaeontology or archaeology,while time scales concerned by prebiotic events are several orders of mag-nitude older.
2.3.2. CONCLUSIONS
The chemical clocks mentioned above, are far from applicable to the prebi-otic scope mostly because of too-short operative time scales, and because ofthe lack of information on boundary and environment conditions. In spite ofgood expectations expressed a few decades ago, long-period chemical clockshave been quite overwhelmed by the important progress meanwhile accom-plished in the sensitivity of (either stable or radioactive) isotope analysis, seepart 2.2.
26 MURIEL GARGAUD ET AL.
2.4. Biology: The Molecular Clocks
EMMANUEL DOUZERY
With the mining of eukaryotic genome sequences, it is possible to assemblevarious sets of homologous genes or proteins, i.e., nucleotide or amino acidsequences that share common ancestry. From aligned homologous se-quences, phylogenetic, evolutionary trees are reconstructed and provide twokinds of information. First, the topology of trees depicts the sisterhood ofspecies. For example, Fungi are phylogenetically closer to animals than theyare to plants (Philippe et al., 2004). Second, the branch lengths of trees depictthe amount of evolution elapsed between two nodes (i.e., bifurcations, orspeciation events), or between one node and a terminal taxon. On the Fig-ure 2.4-1, taxon F did accumulate more molecular divergence than E sinceboth last shared a common ancestor. To estimate phylogenies from molec-ular characters, probabilistic approaches are commonly used. For example,the maximum likelihood criterion identifies the topology and the intercon-nected branches that maximize the probability of exactly retrieving the inputsequences under a given model of DNA or protein evolution. Each branch ofa topology is characterized by a length that is the product of two quantities:the evolutionary rate of DNA or protein along that branch, and its timeduration. Provided that there is one way to know the rates, and keeping inmind that branch lengths are estimated by probabilistic methods, thendivergence times of species may be deduced. In the following section, dif-ferent biological chronometers – the molecular evolutionary clocks – arebriefly described to illustrate how it is possible to measure evolutionary ratesof genomes in order to deduce species divergence times.
2.4.1. HISTORICAL PERSPECTIVE ON THE MOLECULAR CLOCK
Forty years ago, a linear, increasing relationship between the number ofamino acid differences among proteins of vertebrate species, e.g. globins, andthe age of the common ancestor of these species as measured by paleontologywas evidenced (Zuckerkandl and Pauling, 1965). Molecular evolutionaryclocks were born. Protein and DNA clocks were unexpected, and questioned,as researchers thought that morphological and molecular evolution pro-ceeded in the same way, i.e., with large rate variations over time and amongspecies. However, even if each protein seemed to exhibit a constant ratethrough time, different proteins had different absolute rates, e.g., exceedinglyslow for histones, slow for cytochrome c, intermediate for globins, and fasterfor fibrinopeptides (Dickerson, 1971).
27DATING METHODS AND CORRESPONDING CHRONOMETERS IN ASTROBIOLOGY

The neutral theory of molecular evolution provided an explanation to thequite regular ticking of the molecular chronometers (Kimura and Ohta,1971). Mutations in genomes are either neutral (or quasi-neutral) – i.e.,without effect (or nearly so) on the fitness of organisms – or under naturalselection (positively or negatively selected). In natural populations, neutralsubstitutions accumulate at a rate that is only influenced by the mutationrate. As long as a gene contains significantly more neutral positions thanselected, and as the mutation rate remains unchanged, then the evolution ofDNA will be clocklike (Bromham and Penny, 2003).
The behaviour of biological chronometers, DNA and protein clocks, is adiscrete, probabilistic process. In molecular evolution, a Poisson distributionis commonly used to model the time intervals between independent nucleotideor amino acid substitution events – the ‘‘ticks’’ of the clock. This distributionis characterized by the fact that its variance is equal to its mean, indicatingthat the ticks of the molecular clock are regular and random. Biological
Figure 2.4-1 to )4. Phylogenetic tree reconstructed from homologous molecular sequencesand depicting the evolutionary relationships among the six taxa A–F. The time line is hori-
zontal, and branch lengths are proportional to the amount of accumulated molecular diver-gence. The scale is 10 nucleotide or amino acid substitutions per 100 sites compared (%). LetX be the most recent common ancestor of B and C. X is here the external fossil calibration,with a paleontological age of 100 million years (Ma). 2.- The previous tree is converted into a
clocklike tree, where all taxa are equidistant from the origin of the tree (R, root). Relative ratetests evaluate the degree of distortion between the initial and clocklike trees. The maximumlikelihood estimate of branch lengths XB = XC corresponds to 6% (dashed lines). The
absolute substitution rate per branch is therefore rG=0.06%/Ma. Extrapolation of this globalclock allows the calculation of divergence times (see the time scale expressed in Ma). Forexample, RA = 25%, indicating that the age of R is RA/rG=417 Ma. 3.- The initial tree is
converted into a maximum likelihood local clock tree, with three different rates: r0, assigned to6 branches, r1 to three branches, and r2 to one branch, with r1< r0< r2. Knowing the localclocks r0) r2, divergence times are calculated. 4.- Rates are allowed to vary along branches,and one distinct rate is estimated per branch. The rate of a given branch b (r[b]) is linked to the
rate of its parental branch (rp[b]). For example, rp[1] = r0. In the relaxed clock approaches, thedistributions of rates r0) r9 and divergence times are estimated under F(r[b]|rp[b]), a penaltyfunction that reduces too large rate variations between daughter and parental branches.
28 MURIEL GARGAUD ET AL.

chronometers should therefore be seen as stochastic clocks rather than per-fect, deterministic metronomes. Similarly, geological chronometers based onradioactivity decay follow the same stochastic behaviours (see part 2.2).
2.4.2. THE GLOBAL MOLECULAR CLOCK: A SINGLE RATE APPROACH
A constant rate of molecular evolution over the whole phylogenetic tree willbe called a global molecular clock. Its calibration by an external date based ontaxa with a rich fossil record is used to estimate divergence times for otherliving organisms (Figure 2.4-2). However, with the growing number ofstudies using the molecular clock to estimate the divergence age of organisms,different and independent problems appeared (Graur and Martin, 2004).
A first, important issue of the molecular clock approach is the fact that aglobal clocklike behaviour of the sequences is certainly not the rule. Severalempirical studies evidenced variations in the rate of molecular evolutionamong taxa, both at the nucleotide and amino acid levels. These trends arenot restricted to a few genes and proteins. For example, a sample of 129proteins from an animal like a drosophila and a plant like the rice accu-mulated the same amount of differences, whereas trypanosomes (flagellateparasites) evolve at least twice faster than humans with respect to the aminoacid replacement rate through time (Philippe et al., 2004). Statistical testswere therefore developed to measure the degree of departure of sequence datafrom the clock hypothesis. The most famous one is the relative rate test(Sarich and Wilson, 1973). Let AB and AC be the genetic distances from thetwo compared species (B and C) relative to a third, external one (A: Fig-ure 2.4–1). If AB and AC are nearly equal, then the evolution of B and C isconsidered as clocklike. Now, if we consider the external species D relative toE and F, then DF>DE, and F is considered to evolve faster than E: theirevolution is not clocklike. An other test is built in a maximum likelihoodframework. The significance of the loss of likelihood between a clocklike setof branch lengths relative to the one of the same set of branches without theglobal clock assumption is compared by a likelihood ratio test (Felsenstein,1988). However, these tests display a low resolving power, even if this may bepartially corrected through the increase of the number of species andnucleotide or amino acid sites analysed (Philippe et al., 1994; Bromhamet al., 2000; Robinson-Rechavi and Huchon, 2000). Though questionablewhen rate variation is the rule rather than the exception, the systematicelimination of erratic molecular rates across taxa and/or genes has beenproposed, in order to restrict molecular dating analyses to the more clocklikedata sets (Ayala et al., 1998; Kumar and Hedges, 1998). For example, the useof 39 constant rate proteins and the paleontological reference of a mammals/
29DATING METHODS AND CORRESPONDING CHRONOMETERS IN ASTROBIOLOGY

birds split at 310±0 Ma was extrapolated to estimate that the animals/fungisplit may have occurred 1,532±75 Ma ago (Wang et al., 1999).
Interestingly, multiple substitutions on the same DNA or protein positionacross the taxa compared can yield a saturation phenomenon, leading toobserve a virtually similar amount of genetic divergence among the sequencescompared. When the noisiest sites are discarded, changes in the topology ofthe phylogenetic tree and in the evolutionary rates may be revealed (Brink-mann and Philippe, 1999; Burleigh and Mathews, 2004): sequences initiallythought to evolve clocklike actually display differences of substitution rates.
A second problem of the global clock approach is the use of a uniquecalibration point. As a fixed time point, it will ignore the inherent uncertaintyof the fossil record. Moreover, when the calibration is chosen within a slow-evolving lineage (or conversely, in a fast-evolving lineage), the inferred rate ofsubstitution will overestimate (or conversely, underestimate) the true diver-gence times. Actually, to explain the length of a given branch, e.g. 10% ofDNA substitutions, a faster rate of evolution (e.g., 1%/Ma) will involve ashorter time duration (10 Ma), whereas a slower rate (0.1%/Ma) will involvea longer time (100 Ma). In numerous recent studies, vertebrates have beentaken as the single calibrating fossils (e.g., Wang et al., 1999). However,vertebrates apparently display a slow rate of genomic evolution, at least forthe proteins usually sampled (Philippe et al., 2005). There is therefore aconcern that the deep divergence times observed between the majoreukaryotic kingdoms, e.g., animals or fungi, would reflect the use of a singlepaleontological reference to calibrate the slow-evolving vertebrates (Douzeryet al., 2004). To circumvent the above-mentioned problems, alternativemolecular clock approaches have been designed which are based on theestimate of a few or several rates rather than a single one.
2.4.3. THE LOCAL MOLECULAR CLOCKS: A FEW RATE APPROACH
When a phylogeny is reconstructed under maximum likelihood, two extrememodels of substitution rates among branches may be used. The first assumesone independent rate for each branch (Figure 2.4-1). The second assumes asingle rate for all branches, a situation called the global molecular clock (seeabove). An intermediate approach has been suggested: the local molecularclock model assumes that some branches are characterized by a first rate–forexample those connecting the most closely related species–whereas otherbranches display a second, distinct rate (Rambaut and Bromham, 1998;Yoder and Yang, 2000). In other words, local constancy of rates is tolerateddespite potential greater variation at larger phylogenetic scales in the tree(Figure 2.4-3). Application of the local clocks to empirical data suggests thatthis approach is a reasonable compromise between too few and too much
30 MURIEL GARGAUD ET AL.
evolutionary rate classes per phylogenetic tree (Douzery et al., 2003). How-ever, a subsequent difficulty is to identify the set of branches which will sharethe same rate, as well as the number of rate classes to assign on the wholetree.
Recent progresses in the local clock framework involve (i) the possibilityto deal with multiple genes and multiple calibration points (Yang and Yoder,2003), and (ii) the development of an improved algorithm – combininglikelihood, Bayesian, and rate-smoothing procedures – to automaticallyassign branches to rate groups during local molecular clocks analyses (Yang,2004).
2.4.4. THE RELAXED MOLECULAR CLOCKS: A MULTIPLE RATE APPROACH
As a solution to circumvent the confounding effect of non-clocklike behav-iour of mutations, dating methods have been developed to relax the molec-ular clock assumption by allowing discrete or continuous variations of therate of molecular evolution along branches of a phylogenetic tree (Sanderson,1997, 2002; Thorne et al., 1998; Huelsenbeck et al., 2000; Kishino et al.,2001; Thorne and Kishino, 2002; Aris-Brosou and Yang, 2002, 2003).Changes in the rate from a parental branch to a daughter branch aregoverned by a penalty function (Welch and Bromham, 2005), which reducestoo large variations (Figure 2.4-4). Penalties are either simple expressions,like the quadratic one – (r[b]–rp[b])
2 – which is time independent (Sanderson,1997, 2002), or more complex functions which depend upon time (stationarylognormal: Kishino et al., 2001; exponential: Aris-Brosou and Yang, 2002).
Some of these approaches are implemented in a Bayesian framework, withestimation of the distributions of rates and divergence times, recapitulated asvalues with associated uncertainty (credibility) intervals. Moreover, theuncertainty of paleontological estimates is explicitly incorporated in the formof prior constraints on divergence times provided by fossil information(Kishino et al., 2001). Calibration time intervals for several independentnodes in the tree may as well be used simultaneously to reduce the impact ofchoosing a particular calibration reference. This method has been convinc-ingly applied to understand the chronological evolution of very diversetaxonomic groups, like viruses (Korber et al., 2000), plants (Bell et al., 2005),mammals (Springer et al., 2003), and eukaryotes (Douzery et al., 2004). Inthe latter study, the relaxed clock on 129 proteins is calibrated by six fossilreferences, and suggests that the animals/fungi split may have occurred984±65 Ma ago. This estimate, markedly smaller than the 1,532±75 Maof Wang et al. (1999), is likely to be more accurate, owing to the use of aflexible molecular clock, and a greater number of proteins, species, and
31DATING METHODS AND CORRESPONDING CHRONOMETERS IN ASTROBIOLOGY
calibrations. It also illustrates how different data, calibrations and methodscan provide contrasted timeline estimates.
2.4.5. THE FUTURE MOLECULAR CLOCKS: ACCURACY AND PRECISION
During the past four decades, molecular clocks have became an invaluabletool for reconstructing evolutionary timescales, opening new views on ourunderstanding of the temporal origin and diversification of species (Kumar,2005). However, to facilitate in the near future the comparison between rocksand clocks, critical paleontological references should be developed (Mullerand Reisz, 2005), and molecular dating should become more accurate andmore precise. Enhanced accuracy of molecular clocks might be achievedthrough the analysis of more genes for more species, but also through thedevelopment of realistic models of rate change, with discrete as well ascontinuous variations of evolutionary rate through time (Ho et al., 2005).Greater precision is however not warranted due to the inherent, stochasticnature of biological chronometers.
2.5. The Triple Clock of Life in the Solar System
THIERRY MONTMERLE AND MURIEL GARGAUD
2.5.1. IS THERE A BEGINING? THE PROBLEM OF ‘‘TIME ZERO’’ AND THE
LOGARITHMIC CLOCK
As discussed in Chapter 1, the solar system must a priori have a ‘‘beginning’’.In other words, there must exist a ‘‘time zero’’ t0* to mark the origin of thesolar system, so that by definition the Sun is formed at t = t0*, and theneverything proceeds and can be dated according to a regular time scale: theformation of the Sun, disk evolution, condensation of the first solids, planetformation, existence of oceans, emergence of life, etc...But as a matter of fact,for very fundamental reasons similar to those of the universe itself, to definet0* as the age of the solar system is astrophysically impossible. Indeed, even ifthe universe is expanding, and a protostar is contracting, the structure of theequations that govern these evolutions is such that time flows logarithmically,not linearly. In other words, looking for t0* is like going backwards in time inunits of fractions of an arbitrary reference time, tr, say: tr/10, tr/100, tr/1000,etc. As for Zenon’s paradox, the ultimate origin, t0*, can never be reached,only approximated to a predefined level. At least as long as the equationsremain valid: in the case of star formation, for instance, it is clear that,
32 MURIEL GARGAUD ET AL.
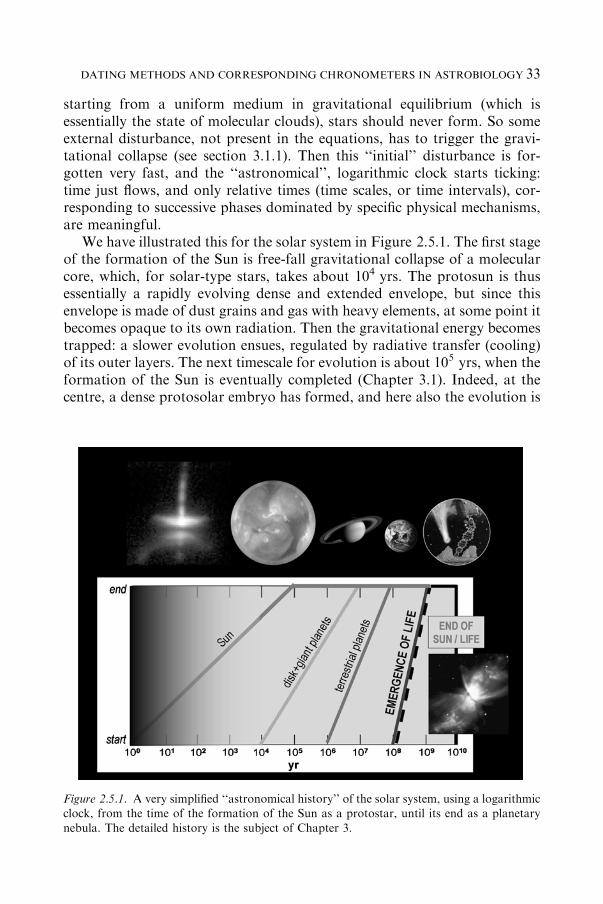
starting from a uniform medium in gravitational equilibrium (which isessentially the state of molecular clouds), stars should never form. So someexternal disturbance, not present in the equations, has to trigger the gravi-tational collapse (see section 3.1.1). Then this ‘‘initial’’ disturbance is for-gotten very fast, and the ‘‘astronomical’’, logarithmic clock starts ticking:time just flows, and only relative times (time scales, or time intervals), cor-responding to successive phases dominated by specific physical mechanisms,are meaningful.
We have illustrated this for the solar system in Figure 2.5.1. The first stageof the formation of the Sun is free-fall gravitational collapse of a molecularcore, which, for solar-type stars, takes about 104 yrs. The protosun is thusessentially a rapidly evolving dense and extended envelope, but since thisenvelope is made of dust grains and gas with heavy elements, at some point itbecomes opaque to its own radiation. Then the gravitational energy becomestrapped: a slower evolution ensues, regulated by radiative transfer (cooling)of its outer layers. The next timescale for evolution is about 105 yrs, when theformation of the Sun is eventually completed (Chapter 3.1). Indeed, at thecentre, a dense protosolar embryo has formed, and here also the evolution is
Figure 2.5.1. A very simplified ‘‘astronomical history’’ of the solar system, using a logarithmicclock, from the time of the formation of the Sun as a protostar, until its end as a planetary
nebula. The detailed history is the subject of Chapter 3.
33DATING METHODS AND CORRESPONDING CHRONOMETERS IN ASTROBIOLOGY

regulated by the opacity, but inside a much denser and hotter body. A quasi-static gravitational equilibrium becomes established, which will last untilnuclear reactions start 108 yrs later when the Sun reaches the main sequence.Meanwhile, and because of rotation, a circumstellar accretion disk forms.This disk has its own evolution, and the growth of dust grains under theinfluence of dynamical interactions has a characteristic timescale of 106 yrs.Then planetesimals collide and eventually build giant planets on timescales of107 yrs. (Chapter 3.2). Finally, terrestrial planets form in 108 yrs (Chapter3.3), which, by coincidence in the case of the solar system, is also the time-scale for the Sun to arrive on the main sequence.
This global (albeit very simplified) chronology of the so-called ‘‘pre-mainsequence’’ phases of evolution of (solar-like) stars is also apparent in the‘‘Herzsprung–Russell Diagram’’ introduced in Section 2.1 (except for theearliest stages which, being embedded and going through optically invisiblephases, cannot be plotted on such a diagram). So even though t0* cannot bedefined strictly speaking, the succession of phases, with its clock scaled (inyrs) in powers of 10, is well-defined.
The history of the solar system can be continued using the same clock.On this scale, life emerges in 109 yrs but must end at 1010 yrs because of theevolution of the Sun, which will become a red giant and engulf the wholesolar system before becoming a planetary nebula (Section 2.1). These arethe two only important events of the solar system at this stage! (Note thatthe characteristic timescale of 1010 yrs is also valid for stars of mass <0.7Mx, which live longer than the age of the universe, itself of the order of1010 yrs.)
As Figure 2.5.1 illustrates, the ‘‘powers of 10’’ stages described above alsohave a certain duration, and at a given time some stages end while others havebegun: for instance, circumstellar disks already exist at the protostellar stage(Section 3.2.1), and similarly the embryos of terrestrial planets (Section 3.2.4and 3.3.1) are already present in the course of disk evolution. Strictlyspeaking, the ‘‘start’’ point of each phase is as impossible to define as t0* itself,since phase n already includes some evolution of phase n + 1. Figure 2.5.1 isonly meant to give schematically a very synthetic idea of the astronomicalchronology described in Chapter 3. What is certainly noteworthy, however, isthat since the existence of the Earth is a prerequisite for the emergence of lifeas we know it, the slope (rate of growth) appears much steeper for life as it isfor all the previous phases: paradoxically (in this chronology) life developsmuch faster that the Sun itself! And certainly the emergence of life is short(10%) compared with the lifetime of the Sun. We will come back to someimportant consequences of this fact in the next paragraph.
34 MURIEL GARGAUD ET AL.

2.5.2. ASTRONOMY VS. GEOLOGICAL AND BIOLOGICAL CHRONOLOGIES: THE LINEAR
CLOCKS
Once the Earth is formed, we become interested in the chronology of eventsthat have shaped its evolution, with the ultimate goal of understanding howlife emerged, and its subsequent evolution into organized, self-replicating andincreasingly complex structures. The essence of dating events comes fromgeology, and it is clear that the numbers obtained by all methods (radioactivedecay, geological layers, etc.) are linearly ordered. In other words, to describethe corresponding chronology we have to adopt a perhaps more familiarlinear clock. This necessary switch from the previous clock offers a paradoxquite similar to that mentioned previously about life: as illustrated in Fig-ure 2.5.2, on a linear astronomical scale, the Sun and the Earth are formedessentially instantaneously (1% of the lifetime of the Sun).
The ‘‘linear clock’’ can then be used in two different ways. Because whenusing this clock the formation of the Sun and of the Earth are almostsimultaneous, the exact definition of t0* is not important: it does not reallymatter to know whether the age of the oldest meteorites is 4.567 Gyr or even3 Gyr – what is important is that this age is much larger than the duration ofthe formation of the Sun and terrestrial planets. However the astronomical
Figure 2.5.2. The astronomical, biological and geological histories of the solar system, usinglinear clocks. While time proceeds forward in astronomy (conventional unit: Gyr) since the
formation of the Sun and planets (which are very short compared with the lifetime of the Sun,hence look almost instantaneous), time is measured backwards from 1950 AD (the ‘‘Present’’)in geology and biology (conventional unit: Ga). The main geological and biological events of
these histories, as described in the text, are indicated in both scales.
35DATING METHODS AND CORRESPONDING CHRONOMETERS IN ASTROBIOLOGY
scale is graduated with increasing values of time, which is the natural way tofollow the evolution of the Sun (for instance, small, but possibly importantfluctuations in its luminosity can be observed) and incorporate the future ofthe Earth, at least, again, until its doom as a vaporized planet inside the redgiant Sun, within 5.5 Gyr. (We are already half-way into this evolution, ofwhich the last steps will take a few million years, so here also will look on thisscale as brief as the formation of the Sun.)
Correspondingly, geologists, who are the watchmakers of biologists,naturally measure the time going backwards. Their clock is still linear, but isgraduated starting from 1950 AD: the ‘‘Present’’ (see Chapter 1 and Section2.2). So while for solar system studies the astronomical time flows forward,3
by necessity geologists have to look backwards so are concerned only withthe past, not the future, of the Earth. (Note also that on all scales theemergence of man is instantaneous.)
The correspondence between the linear astronomical and ‘‘geobiolog-ical’’ clocks is illustrated in Figure 2.5.2, covering all known periods ofthe past (geology and biology) and of the future (astronomy). Alsoshown are the main events that occurred in the remote history of theEarth, as described in detail in the following chapters, from the forma-tion of the first oceans, the so-called Late Heavy Bombardment (LHB),to the appearance of eukaryotes, bracketing the still controversial periodwhere life is thought to have appeared. A summary of the main geo-logical, chemical and biological events covering this period is presented inChapters 8 and 9.
Acknowledgments
We would like to thank Frederic Delsuc, Purificacion Lopez-Garcia, HerveMartin, David Moreira, Herve Philippe, Vincent Ranwez and Jacques Reissefor their contributions in this work.
References
Albarede, F.: 2001, La geochimie, Paris, 190 pp.Albarede, F.: 2003. Geochemistry: An Introduction, Cambridge University Press, Cambridge,
262 pp.Allegre, C. J.: 2005. Geologie Isotopique, Belin, Paris, 495 pp.
3 Note that this is not true in cosmology, where astronomers can explore the past of theuniverse, since the more distant a galaxy (say) is, the younger it looks to us because of the finite
time light takes to travel.
36 MURIEL GARGAUD ET AL.
Aris-Brosou, S. and Yang, Z.: 2002, Syst. Biol. 51, 703–714.Aris-Brosou, S. and Yang, Z.: 2003, Mol. Biol. Evol. 20, 1947–1954.
Ayala, F. J., Rzhetsky, A. and Ayala, F. J.: 1998, Proc. Natl. Acad. Sci. USA 95, 606–611.Bell, C. D., Soltis, D. E. and Soltis, P. S.: 2005, Evolution 59, 1245–1258.Brinkmann, H. and Philippe, H.: 1999, Mol. Biol. Evol. 16, 817–825.
Bromham, L. and Penny, D.: 2003, Nature Rev. Genet. 4, 216–224.Bromham, L., Penny, D., Rambaut, A. and Hendy, M. D.: 2000, J. Mol. Evol. 50, 296–301.Burleigh, J. G. and Mathews, S.: 2004, Am. J. Bot. 91, 1599–1613.Chabrier, G. and Baraffe, I.: 2000, Ann. Rev. Astr. Ap. 38, 337–377.
Dickerson, R. E.: 1971, J. Mol. Evol. 1, 26–45.Douzery, E. J. P., Delsuc, F., Stanhope, M. J. and Huchon, D.: 2003, J. Mol. Evol. 57,
S201–S213.
Douzery, E. J. P., Snell, E. A., Bapteste, E., Delsuc, F. and Philippe, H.: 2004, Proc Natl.Acad. Sci. USA 101, 15386–15391.
Faure, G.: 1986. Principles of Isotope Geology, John Wiley and sons, New York, 589 pp.
Felsenstein, J.: 1988, Ann. Rev. Genet. 22, 521–565.Gat, J. R.: 1996, Annu. Rev. Earth Planet. Sci. 24, 225–262.Geyh, M. A. and Schleicher, H.: 1990, in Absolute Age Determination, Springer-Verlag, Berlin,
503 pp.Graur, D. and Martin, W.: 2004, Trends Genet. 20, 80–86.Hayashi, C.: 1966, Ann. Rev. Astron. Astrophys. 4, 171–192.Hillenbrand, L. A.: 1997, Astron. J. 113, 1733–1768.
Ho, S. Y. W., Phillips, M. J., Drummond, A. J. and Cooper, A.: 2005, Mol. Biol. Evol. 22,1355–1363.
Huelsenbeck, J. P., Larget, B. and Swofford, D.: 2000, Genetics 154, 1879–1892.
Kimura, M. and Ohta, T.: 1971, J. Mol. Evol. 1, 1–17.Kishino, H., Thorne, J. L. and Bruno, W. J.: 2001, Mol. Biol. Evol. 18, 352–361.Korber, B., Muldoon, M., Theiler, J., Gao, F., Gupta, R., Lapedes, A., Hahn, B. H.,
Wolinsky, S. and Bhattacharya, T.: 2000, Science 288, 1789–1796.Kumar, S.: 2005, Nature Rev. Genet. 6, 654–662.Kumar, S. and Hedges, S. B.: 1998, Nature 392, 917–920.
Montmerle, T. and Prantzos, N.: 1988, Soleils Eclates, Presses du CNRS/CEA, 160 pp.Muller, J. and Reisz, R. R.: 2005, BioEssays 27, 1069–1075.Paabo, S. and Wilson, A.: 1991, Curr. Biol. 1, 45–46.Palla, F. and Stahler, S. W.: 2001, Astrophys. J. 553, 299–306.
Philippe, H., Lartillot, N. and Brinkmann, H.: 2005, Mol. Biol. Evol. 22, 1246–1253.Philippe, H., Snell, E. A., Bapteste, E., Lopez, P., Holland, P. W. H. and Casane, D.: 2004,
Mol. Biol. Evol. 9, 1740–1752.
Philippe, H., Sorhannus, U., Baroin, A., Perasso, R., Gasse, F. and Adoutte, A.: 1994, J. Evol.Biol. 7, 247–265.
Rambaut, A. and Bromham, L.: 1998, Mol. Biol. Evol. 15, 442–448.
Robinson-Rechavi, M. and Huchon, D.: 2000, Bioinformatics 16, 296–297.Sanderson, M. J.: 1997, Mol. Biol. Evol. 14, 1218–1231.Sanderson, M. J.: 2002, Mol. Biol. Evol. 19, 101–109.Sarich, V. M. and Wilson, A. C.: 1973, Science 179, 1144–1147.
Schroeder, R. A. and Bada, J. L.: 1976, Earth Sci. Rev. 12, 347–391.Springer, M. S., Murphy, W. J., Eizirik, E. and O’Brien, S. J.: 2003, Proc. Natl. Acad. Sci.
USA 100, 1056–1061.
Thorne, J. L. and Kishino, H.: 2002, Syst. Biol. 51, 689–702.Thorne, J. L., Kishino, H. and Painter, I. S.: 1998, Mol. Biol. Evol. 15, 1647–1657.
37DATING METHODS AND CORRESPONDING CHRONOMETERS IN ASTROBIOLOGY

Vandenabeele-Trambouze, O., Garrelly, L. and Dobrijevic, M.: 2005, in M. Gargaud, P.Claeys and H. Martin (eds.), Des atomes aux planetes habitables, Presses Universitaires
de Bordeaux, Bordeaux, pp. 323–356.Vidal, P.: 1998. Geochimie, Dunod, Paris, 190 pp.Wang, D. Y., Kumar, S. and Hedges, S. B.: 1999, Proc. R. Soc. Lond. B, Biol. Sci. 266,
163–171.Welch, J. J. and Bromham, L.: 2005, Trends Ecol. Evol. 20, 320–327.Wolfenden, R., Snider, M., Ridgway, C. and Miller, B.: 1999, J. Am. Chem. Soc. 121,
7419–7420.
Yang, Z.: 2004, Act. Zool. Sin. 50, 645–656.Yang, Z. H. and Yoder, A. D.: 2003, Syst. Biol. 52, 705–716.Yoder, A. D. and Yang, Z.: 2000, Mol. Biol. Evol. 17, 1081–1190.
Zuckerkandl, E. and Pauling, L.: 1965, in V. Bryson and H. J. Vogel (eds.), Evolving Genes andProteins, Academic Press, New York, pp. 97–166.
38 MURIEL GARGAUD ET AL.
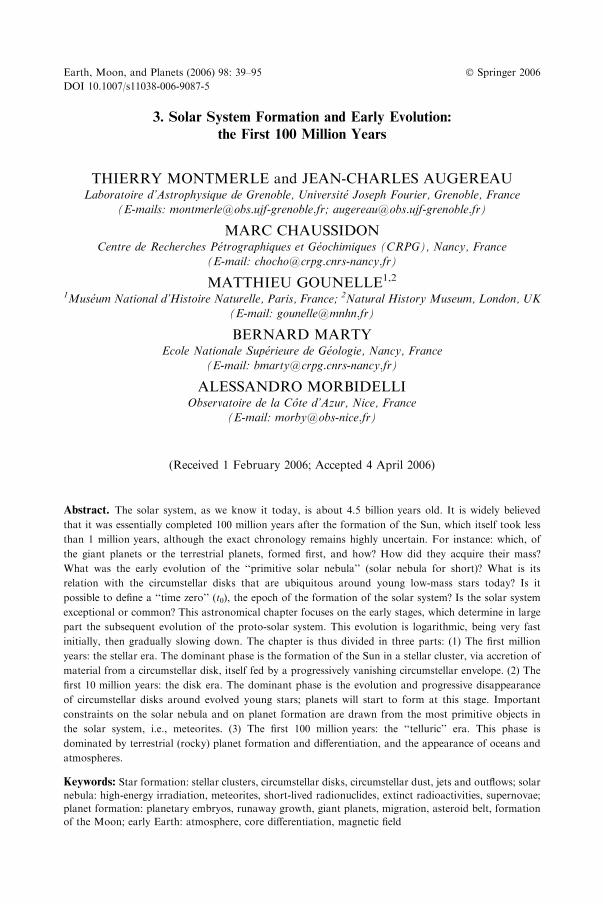
3. Solar System Formation and Early Evolution:
the First 100 Million Years
THIERRY MONTMERLE and JEAN-CHARLES AUGEREAULaboratoire d’Astrophysique de Grenoble, Universite Joseph Fourier, Grenoble, France
(E-mails: [email protected]; [email protected])
MARC CHAUSSIDONCentre de Recherches Petrographiques et Geochimiques (CRPG), Nancy, France
(E-mail: [email protected])
MATTHIEU GOUNELLE1,2
1Museum National d’Histoire Naturelle, Paris, France; 2Natural History Museum, London, UK
(E-mail: [email protected])
BERNARD MARTYEcole Nationale Superieure de Geologie, Nancy, France
(E-mail: [email protected])
ALESSANDRO MORBIDELLIObservatoire de la Cote d’Azur, Nice, France
(E-mail: [email protected])
(Received 1 February 2006; Accepted 4 April 2006)
Abstract. The solar system, as we know it today, is about 4.5 billion years old. It is widely believed
that it was essentially completed 100 million years after the formation of the Sun, which itself took less
than 1 million years, although the exact chronology remains highly uncertain. For instance: which, of
the giant planets or the terrestrial planets, formed first, and how? How did they acquire their mass?
What was the early evolution of the ‘‘primitive solar nebula’’ (solar nebula for short)? What is its
relation with the circumstellar disks that are ubiquitous around young low-mass stars today? Is it
possible to define a ‘‘time zero’’ (t0), the epoch of the formation of the solar system? Is the solar system
exceptional or common? This astronomical chapter focuses on the early stages, which determine in large
part the subsequent evolution of the proto-solar system. This evolution is logarithmic, being very fast
initially, then gradually slowing down. The chapter is thus divided in three parts: (1) The first million
years: the stellar era. The dominant phase is the formation of the Sun in a stellar cluster, via accretion of
material from a circumstellar disk, itself fed by a progressively vanishing circumstellar envelope. (2) The
first 10 million years: the disk era. The dominant phase is the evolution and progressive disappearance
of circumstellar disks around evolved young stars; planets will start to form at this stage. Important
constraints on the solar nebula and on planet formation are drawn from the most primitive objects in
the solar system, i.e., meteorites. (3) The first 100 million years: the ‘‘telluric’’ era. This phase is
dominated by terrestrial (rocky) planet formation and differentiation, and the appearance of oceans and
atmospheres.
Keywords: Star formation: stellar clusters, circumstellar disks, circumstellar dust, jets and outflows; solar
nebula: high-energy irradiation, meteorites, short-lived radionuclides, extinct radioactivities, supernovae;
planet formation: planetary embryos, runaway growth, giant planets, migration, asteroid belt, formation
of the Moon; early Earth: atmosphere, core differentiation, magnetic field
Earth, Moon, and Planets (2006) 98: 39–95 � Springer 2006
DOI 10.1007/s11038-006-9087-5

3.1. The First Million Years: The ‘‘Stellar Era’’1
THIERRY MONTMERLE
3.1.1. THE SUN’S BIRTHPLACE
Stars are not born in isolation, but in clusters. This is what astronomicalobservations of our galaxy (the Milky Way) and other galaxies tell us. Thebirthplace of stars are the so-called ‘‘molecular clouds’’, i.e., vast, cold volumesof gas (mostly molecular hydrogen and helium, and also complex organicmolecules, with so far up to 11 C atoms: see Ehrenfreund and Charnley, 2000for a review). These clouds also contain dust grains (which include heavyelements in the form of silicates, hydrocarbons, and various ices). Themasses of molecular clouds typically range from 106 to 108 Mx: in principle,molecular clouds are sufficiently massive to form millions of stars. However,somewhat paradoxically, molecular clouds do not naturally tend to form stars:gravitation, which would tend to generate the ‘‘free-fall’’ collapse of molecularclouds in less than 1 Myr,2 appears to be balanced by an internal source ofpressurewhichkeeps them in gravitational equilibrium.Thebasic answer lies inthe study, in the radio range, of the velocity distribution in the gas. It can beshown that this distribution corresponds to a state of turbulence, i.e., gaseouseddies that exchange energy from the large scale (the size of the cloud) to thesmall scales (‘‘cloudlets’’ of size ~0.1 pc); smaller scales may be present but arecurrently beyond the spatial capabilities of existing radiotelescopes.However, ona large scale, it can be seen frommid- to far-IRobservations (which have a betterspatial resolution than in the mm range), that molecular clouds are in factfilamentary, but these filaments are constantly moving, as attested by theirvelocity distribution. Figure 3.1 shows a 100-micron image by the IRAS satelliteof the Orion molecular cloud complex, where dense and cold filaments areconspicuous. According to turbulence theories (and dedicated laboratoryexperiments), energy is transferred fromthe large scales to the small scales. So thequestion becomes: what drives the turbulence? Or, in other words, where doesthe supporting energy come from?Current explanations are still debated. Theyfocus either on an external energy source like a neighboring supernova, or onaninternal feedbackmechanism: as we shall see below (Section 3.1.2), young starsdrive powerful outflows of matter (Reipurth and Bally, 2001), in such a way
1 How astronomers determine stellar ages is described in Chapter 2 on ‘‘Chronometers’’(Section 2.1).
2 Here we adopt the usual astronomical convention: 1 ‘‘Myr’’ = 106 years. This is exactlysynonymous to 1 ‘‘Ma’’, as used for instance by geologists elsewhere in the article (where ‘‘a’’
stands for ‘‘annum’’).
40 THIERRY MONTMERLE ET AL.
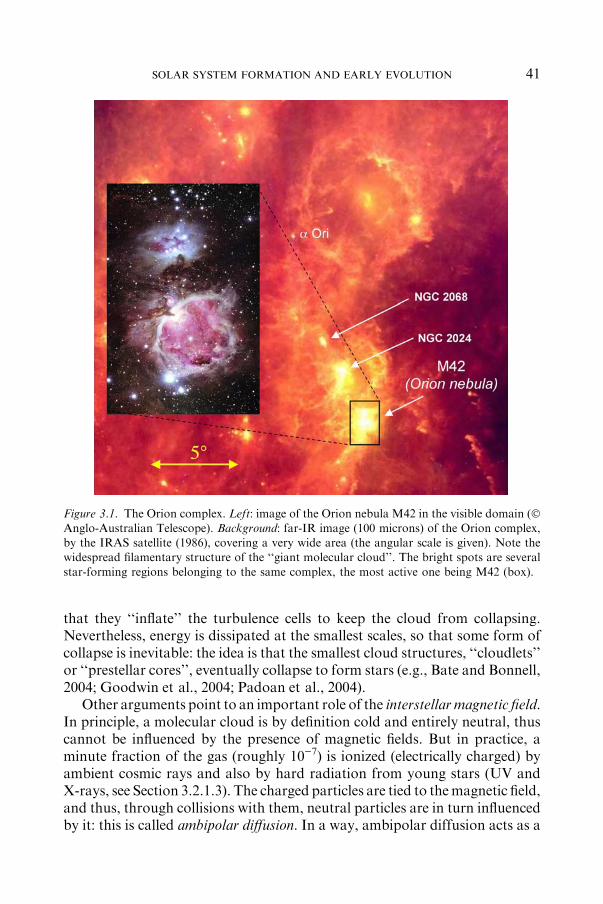
that they ‘‘inflate’’ the turbulence cells to keep the cloud from collapsing.Nevertheless, energy is dissipated at the smallest scales, so that some form ofcollapse is inevitable: the idea is that the smallest cloud structures, ‘‘cloudlets’’or ‘‘prestellar cores’’, eventually collapse to form stars (e.g., Bate and Bonnell,2004; Goodwin et al., 2004; Padoan et al., 2004).
Other arguments point to an important role of the interstellarmagnetic field.In principle, a molecular cloud is by definition cold and entirely neutral, thuscannot be influenced by the presence of magnetic fields. But in practice, aminute fraction of the gas (roughly 10)7) is ionized (electrically charged) byambient cosmic rays and also by hard radiation from young stars (UV andX-rays, see Section 3.2.1.3). The charged particles are tied to themagnetic field,and thus, through collisions with them, neutral particles are in turn influencedby it: this is called ambipolar diffusion. In a way, ambipolar diffusion acts as a
Figure 3.1. The Orion complex. Left: image of the Orion nebula M42 in the visible domain (�Anglo-Australian Telescope). Background: far-IR image (100 microns) of the Orion complex,by the IRAS satellite (1986), covering a very wide area (the angular scale is given). Note thewidespread filamentary structure of the ‘‘giant molecular cloud’’. The bright spots are several
star-forming regions belonging to the same complex, the most active one being M42 (box).
41SOLAR SYSTEM FORMATION AND EARLY EVOLUTION

dragnet through which neutral particles flow across magnetic field lines. Thiseffect is quantitatively important: measurements of magnetic field intensityinsidemolecular clouds (via theZeeman effect onmolecular lines) show that thegas pressure and themagnetic pressure are just about equal, with a difference ofat most a factor of 2 in either direction, depending on the clouds (e.g., Padoanet al., 2004; Crutcher, 2005). Thismeans that in reality we are probably dealingwith magnetically regulated turbulence: the flow of gas in turbulent cells is notfree, but is slowed down by magnetic fields and preferentially proceeds alongfilaments (e.g., Pety andFalgarone, 2003; Falgarone et al., 2005). In particular,this means that, at the small scales, gravitational collapse proceeds either on ashort, free-fall time scale (typically ~104 years) if the magnetic field is on theweak side (magnetic pressure<gaspressure), or on a long, ambipolar diffusiontime scale (which can reach several 105 years or more) if the magnetic fields issufficiently strong (magnetic pressure>gas pressure).
This picture, at least qualitatively, leads to the idea that molecularclouds are stable, self-supported structures, but on the verge of gravita-tional collapse. Depending on the intensity of the magnetic field, starformation may occur at many places in the cloud, perhaps in sequence,within a relatively short timescale, of the order of a few 104 years locally,a few 105 years to 106 years globally. One such global theoretical mech-anism is called ‘‘competitive accretion’’: stars form out of shocks within apool of colliding gaseous filaments, where they compete to acquire theirmass as they move through the cloud (Bate and Bonnell, 2004, Clark et al.2005; Figure 3.2). Pure gravitational collapse has also been advocated(Krumholz et al., 2005).
Whatever the details of the various star formation mechanisms, the netresult is star formation in clusters. Molecular observations (Motte et al.,1998), in the mass range between ~0.1 and 1 Mx, show that above 0.5 Mx
the core mass distribution and the observed stellar ‘‘initial mass function’’(IMF) are the same, which strongly suggests (but does not prove) that thestellar mass distribution directly derives from the core mass distribution,itself linked with the turbulent structure of molecular clouds. (The IMF is thedistribution of stellar masses at formation: it is observed to be a universallaw, expressed as dN*/dlogM*�M*
)1.5 for M* ‡ 0.5 Mx, where N* is thenumber of stars in the mass range M*, M* + dM*; explaining it is one of thehardest challenges for star formation theories: see Kroupa, 2002 for areview.) Depending on a number of external conditions, such as the totalmolecular cloud mass, the passage of a shock wave of a nearby supernovaexplosion from the most massive stars (see below), etc., the high-mass end ofthe IMF is observed to be cut-off at some value Mmax. Some clusters havemassive to very massive stars (Mmax up to several tens of Mx), others haveonly intermediate-mass stars (Mmax = a fewMx at most), all the way to verysmall masses (‘‘brown dwarfs’’, that are not massive enough to eventually
42 THIERRY MONTMERLE ET AL.
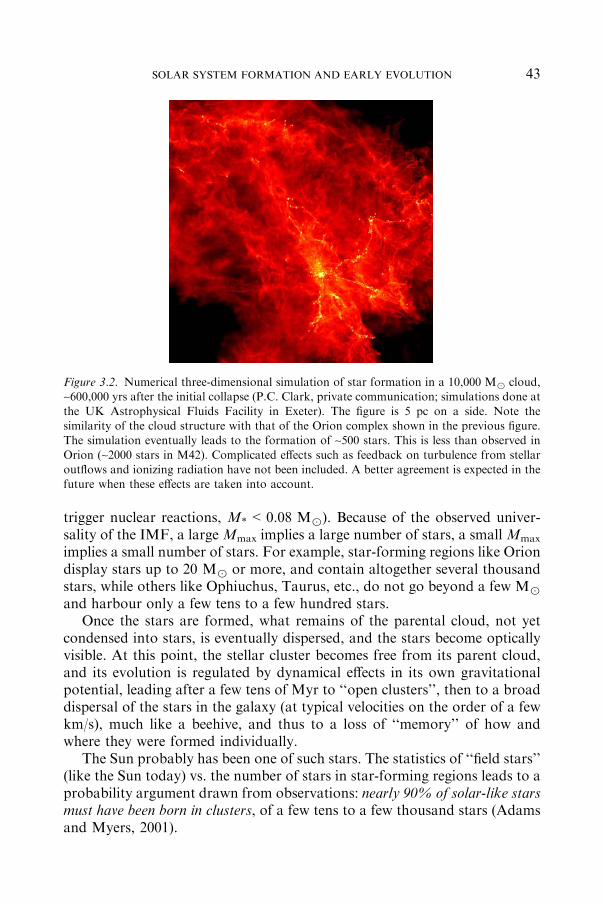
trigger nuclear reactions, M*<0.08 Mx). Because of the observed univer-sality of the IMF, a large Mmax implies a large number of stars, a small Mmax
implies a small number of stars. For example, star-forming regions like Oriondisplay stars up to 20 Mx or more, and contain altogether several thousandstars, while others like Ophiuchus, Taurus, etc., do not go beyond a few Mx
and harbour only a few tens to a few hundred stars.Once the stars are formed, what remains of the parental cloud, not yet
condensed into stars, is eventually dispersed, and the stars become opticallyvisible. At this point, the stellar cluster becomes free from its parent cloud,and its evolution is regulated by dynamical effects in its own gravitationalpotential, leading after a few tens of Myr to ‘‘open clusters’’, then to a broaddispersal of the stars in the galaxy (at typical velocities on the order of a fewkm/s), much like a beehive, and thus to a loss of ‘‘memory’’ of how andwhere they were formed individually.
The Sun probably has been one of such stars. The statistics of ‘‘field stars’’(like the Sun today) vs. the number of stars in star-forming regions leads to aprobability argument drawn from observations: nearly 90% of solar-like starsmust have been born in clusters, of a few tens to a few thousand stars (Adamsand Myers, 2001).
Figure 3.2. Numerical three-dimensional simulation of star formation in a 10,000 Mx cloud,~600,000 yrs after the initial collapse (P.C. Clark, private communication; simulations done at
the UK Astrophysical Fluids Facility in Exeter). The figure is 5 pc on a side. Note thesimilarity of the cloud structure with that of the Orion complex shown in the previous figure.The simulation eventually leads to the formation of ~500 stars. This is less than observed in
Orion (~2000 stars in M42). Complicated effects such as feedback on turbulence from stellaroutflows and ionizing radiation have not been included. A better agreement is expected in thefuture when these effects are taken into account.
43SOLAR SYSTEM FORMATION AND EARLY EVOLUTION
It is therefore impossible at present to know a priori in which type ofstellar cluster the Sun was born: our star is about 50 times older than theoldest open clusters. But the issue is fundamental for planet formation ingeneral and for the origin of the solar system in particular, because of theshort time evolution of the circumstellar disks around young stars (see Sec-tion 3.2.1). To simplify, there are two extreme possibilities for the birthplaceof the Sun:(i) The Sun was born in a ‘‘rich’’, Orion-like environment. (see Hillen-
brand 1997; Figure 3.3) The most massive stars (the Trapezium-likestars) are very hot, and thus emit UV photons able to strongly ionizetheir immediate environment. The disks of the less massive stars thentend also to be ionized and evaporate, as shown in Figure 3.4According to most calculations, the disks, which have masses in therange 10)2 – 10)4 MSun (i.e., 0.1–10 Jupiter masses), will disappear ina few million years only, likely before any terrestrial planet has hadthe time to form. One possibility for disks to survive is not to staytoo long in the vicinity of the hottest stars, so as to escape, viadynamical effects, the original ‘‘beehive’’. We observe that most disksaround young stars are typically 10 times larger that the size of thepresent-day solar sytem; some disks may be cut-off to the size of theKuiper Belt (i.e., the radius of the solar sytem, ~50 AU),3 mainlybecause of evaporation processes (Adams et al. 2004, 2006). On theother hand, the discovery of the existence of Sedna, a relativelymassive, high-eccentricity solar system ‘‘planet’’, implies that theprotosolar disk did not suffer stellar encounters closer than 1,000 AU(Morbidelli and Levison, 2004), so retained its initial large size forsome time, or else managed to be not entirely vaporized. This wouldbe possible in the outskirts of the nebula, or in a less rich cluster likeNGC1333 (Adams et al., 2006). In any case, disk survival in a Orion-like environment is certainly not easy.4
(ii) The Sun was born in a ‘‘poor’’, Ophiuchus-like environment (Fig-ure 3.5). With no massive star around, stars form deeply embeddedinside the molecular cloud, and once formed they stay protected fromexternal disturbances. All disks survive, and can remain very large. Weknow of some examples of stars with large disks in the immediatevicinity of molecular clouds (Figure 3.6). It is not clear how in this case
3 1 UA = 1 Astronomical Unit = Sun-Earth distance = 150 million km.
4 To be complete, one should mention the recent work by Throop and Bally (2005), who arguethat dust grains actually grow into planetesimals under the coagulating effect of UV radiation,hence that planet formation (see below, Section 3.2.1), is favored by evaporation. But even in
this case, the exposure to UV radiation must be fine-tuned for the whole system to survive.
44 THIERRY MONTMERLE ET AL.

Figure 3.3. Near-IR (2 microns) image of the center of M42, revealing the stars of the richOrion nebula cluster, and in particular the four central hot stars called the ‘‘Trapezium’’,which excite the nebula. The nebula is 450 pc away. The image is about 10¢ on a side, which is
250 000 AU. (� ESO, VLT-ISAAC, by M. McCaughrean.).
Figure 3.4. A ‘‘tear’’ in Orion. This is an evaporating circumstellar disk, 500 AU in diameter.The central star is clearly visible. The bright spot is oriented towards h1 Ori C, the hottest starof the Trapezium. The evaporating gas is shaped by the wind from this star (� NASA Hubble
Space Telescope: J. Bally, H. Throop, & C.R. O’Dell).
45SOLAR SYSTEM FORMATION AND EARLY EVOLUTION
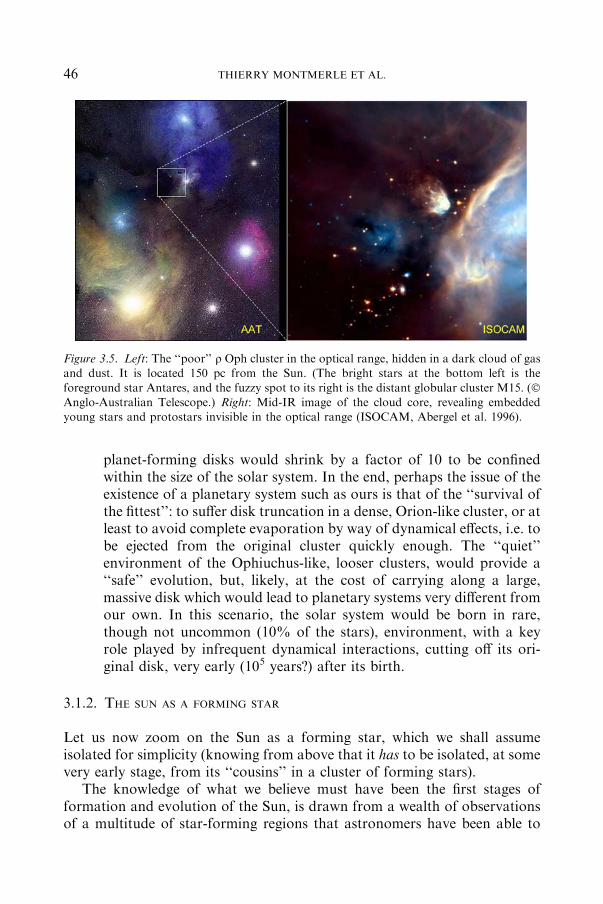
planet-forming disks would shrink by a factor of 10 to be confinedwithin the size of the solar system. In the end, perhaps the issue of theexistence of a planetary system such as ours is that of the ‘‘survival ofthe fittest’’: to suffer disk truncation in a dense, Orion-like cluster, or atleast to avoid complete evaporation by way of dynamical effects, i.e. tobe ejected from the original cluster quickly enough. The ‘‘quiet’’environment of the Ophiuchus-like, looser clusters, would provide a‘‘safe’’ evolution, but, likely, at the cost of carrying along a large,massive disk which would lead to planetary systems very different fromour own. In this scenario, the solar system would be born in rare,though not uncommon (10% of the stars), environment, with a keyrole played by infrequent dynamical interactions, cutting off its ori-ginal disk, very early (105 years?) after its birth.
3.1.2. THE SUN AS A FORMING STAR
Let us now zoom on the Sun as a forming star, which we shall assumeisolated for simplicity (knowing from above that it has to be isolated, at somevery early stage, from its ‘‘cousins’’ in a cluster of forming stars).
The knowledge of what we believe must have been the first stages offormation and evolution of the Sun, is drawn from a wealth of observationsof a multitude of star-forming regions that astronomers have been able to
Figure 3.5. Left: The ‘‘poor’’ q Oph cluster in the optical range, hidden in a dark cloud of gasand dust. It is located 150 pc from the Sun. (The bright stars at the bottom left is the
foreground star Antares, and the fuzzy spot to its right is the distant globular cluster M15. (�Anglo-Australian Telescope.) Right: Mid-IR image of the cloud core, revealing embeddedyoung stars and protostars invisible in the optical range (ISOCAM, Abergel et al. 1996).
46 THIERRY MONTMERLE ET AL.
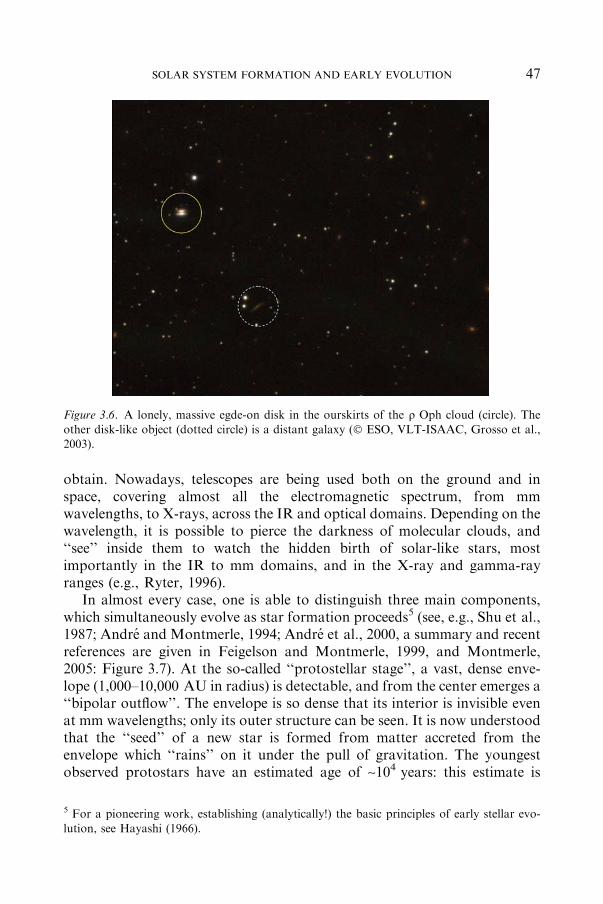
obtain. Nowadays, telescopes are being used both on the ground and inspace, covering almost all the electromagnetic spectrum, from mmwavelengths, to X-rays, across the IR and optical domains. Depending on thewavelength, it is possible to pierce the darkness of molecular clouds, and‘‘see’’ inside them to watch the hidden birth of solar-like stars, mostimportantly in the IR to mm domains, and in the X-ray and gamma-rayranges (e.g., Ryter, 1996).
In almost every case, one is able to distinguish three main components,which simultaneously evolve as star formation proceeds5 (see, e.g., Shu et al.,1987; Andre and Montmerle, 1994; Andre et al., 2000, a summary and recentreferences are given in Feigelson and Montmerle, 1999, and Montmerle,2005: Figure 3.7). At the so-called ‘‘protostellar stage’’, a vast, dense enve-lope (1,000–10,000 AU in radius) is detectable, and from the center emerges a‘‘bipolar outflow’’. The envelope is so dense that its interior is invisible evenat mm wavelengths; only its outer structure can be seen. It is now understoodthat the ‘‘seed’’ of a new star is formed from matter accreted from theenvelope which ‘‘rains’’ on it under the pull of gravitation. The youngestobserved protostars have an estimated age of ~104 years: this estimate is
Figure 3.6. A lonely, massive egde-on disk in the ourskirts of the q Oph cloud (circle). The
other disk-like object (dotted circle) is a distant galaxy (� ESO, VLT-ISAAC, Grosso et al.,2003).
5 For a pioneering work, establishing (analytically!) the basic principles of early stellar evo-
lution, see Hayashi (1966).
47SOLAR SYSTEM FORMATION AND EARLY EVOLUTION

rather uncertain, but is consistent with the number deduced from thedynamical age of outflows (= size/velocity), and from their small numberrelative to their more evolved counterparts, like T Tauri stars (see below):indeed, one finds roughly 1 protostar for every 100 T Tauri stars, aged1–10 Myr.
At an age ~105 years, the envelope is much less dense, since most of ithas collapsed onto the disk. It becomes transparent at mm wavelengths,revealing a dense disk (500–1,000 AU in radius), from which the seed starcontinues to grow. The source of outflows become visible, in the form ofhighly collimated jets originating close to the central star, confirmingearlier models in which molecular ourflows consist of cold cloud materialentrained by the jet. (In fact, this jet-cloud interaction is believed by someauthors to be the main agent to sustain the turbulent state of the cloud:this is the ‘‘feedback’’ mechanism mentioned above, see Matzner andMcKee, 2000.) At this stage is revealed the key three-component structurethat governs the physics of star formation: an outer envelope, an inner‘‘accretion’’ disk, and matter ejected perpendicular to the disk (Figure 3.8).(The accretion disk probably exists from the start of collapse, but itcannot be detected because of the opacity of the envelope at the earlieststage.)
Figure 3.7. A summary table of the various protostellar and stellar phases, with characteristic
timescales and basic observational properties. (From Feigelson and Montmerle, 1999).
48 THIERRY MONTMERLE ET AL.
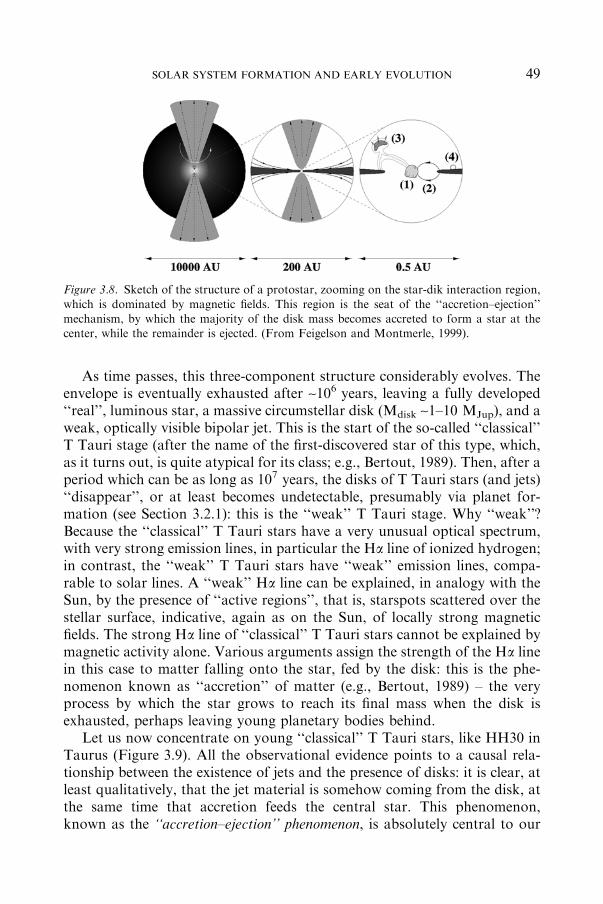
As time passes, this three-component structure considerably evolves. Theenvelope is eventually exhausted after ~106 years, leaving a fully developed‘‘real’’, luminous star, a massive circumstellar disk (Mdisk ~1–10 MJup), and aweak, optically visible bipolar jet. This is the start of the so-called ‘‘classical’’T Tauri stage (after the name of the first-discovered star of this type, which,as it turns out, is quite atypical for its class; e.g., Bertout, 1989). Then, after aperiod which can be as long as 107 years, the disks of T Tauri stars (and jets)‘‘disappear’’, or at least becomes undetectable, presumably via planet for-mation (see Section 3.2.1): this is the ‘‘weak’’ T Tauri stage. Why ‘‘weak’’?Because the ‘‘classical’’ T Tauri stars have a very unusual optical spectrum,with very strong emission lines, in particular the Ha line of ionized hydrogen;in contrast, the ‘‘weak’’ T Tauri stars have ‘‘weak’’ emission lines, compa-rable to solar lines. A ‘‘weak’’ Ha line can be explained, in analogy with theSun, by the presence of ‘‘active regions’’, that is, starspots scattered over thestellar surface, indicative, again as on the Sun, of locally strong magneticfields. The strong Ha line of ‘‘classical’’ T Tauri stars cannot be explained bymagnetic activity alone. Various arguments assign the strength of the Ha linein this case to matter falling onto the star, fed by the disk: this is the phe-nomenon known as ‘‘accretion’’ of matter (e.g., Bertout, 1989) – the veryprocess by which the star grows to reach its final mass when the disk isexhausted, perhaps leaving young planetary bodies behind.
Let us now concentrate on young ‘‘classical’’ T Tauri stars, like HH30 inTaurus (Figure 3.9). All the observational evidence points to a causal rela-tionship between the existence of jets and the presence of disks: it is clear, atleast qualitatively, that the jet material is somehow coming from the disk, atthe same time that accretion feeds the central star. This phenomenon,known as the ‘‘accretion–ejection’’ phenomenon, is absolutely central to our
Figure 3.8. Sketch of the structure of a protostar, zooming on the star-dik interaction region,
which is dominated by magnetic fields. This region is the seat of the ‘‘accretion–ejection’’mechanism, by which the majority of the disk mass becomes accreted to form a star at thecenter, while the remainder is ejected. (From Feigelson and Montmerle, 1999).
49SOLAR SYSTEM FORMATION AND EARLY EVOLUTION

understanding of star formation and early evolution, and to a modern viewof the solar nebula. Such a phenomenon is somewhat paradoxical: it impliesthat, for a star to form, it must lose mass! At least, a significant fraction ofthe mass (>10% from observations, e.g., Muzerolle et al., 2001) musteventually be ejected. The point is that mass accumulation is not the onlynecessity to form a star: since (at we see at all scales in the universe, fromclusters of galaxies to planets) rotation is always present, and seen in the formof circumstellar disks around forming stars, there must exist centrifugalforces that oppose gravity. For gravity to ‘‘win’’ and lead to star formation,angular momentum must be lost. Although the reasons for angular momen-tum loss in a forming star, and in particular the role of the circumstellar disk,are not entirely clear because of complex transport processes within them (seenext subsection), it is well known that mass loss in the form of stellar winds(the solar wind is one example) is very efficient to spin down a star – providedthe ejected matter remains coupled to the star. The only way to do it is to linkthe star and the wind by a magnetic field. Along this line of thought, incurrent models, accretion (mass gain), and ejection (mass and angularmomentum loss), must be mediated by magnetic fields.
3.1.3. A STELLAR VIEW OF THE ‘‘PRIMITIVE SOLAR NEBULA’’
To bemore specific, let us now zoom again, this time on the region very close tothe forming star, for instance a young T Tauri star, to which the primitive solar
Figure 3.9. Left: HST image of the T Tauri star HH30, showing its edge-on disk and jet. Theyoung Sun could have been such an object. Right: sketch of the theoretical magnetic structureused to model the accretion–ejection mechanism (the background drawing is taken from
Ferreira et al., 2000). The ‘‘star’’ is an image of the magnetically active Sun, seen in X-rays bythe Yohkoh satellite (see Section 3.2.1.2).
50 THIERRY MONTMERLE ET AL.

nebula must have been comparable in its first million years (Figure 3.9, left). Arich interplay between observations and theory, over the last decade, results inthe followingpicture (e.g.,Matsumoto et al., 2000; Shang et al., 2002;Ferreiraand Casse, 2004, and refs therein; see Figure 3.9, right). Both the star and thedisk are magnetized: (i) the star is surrounded by a ‘‘dipolar’’ magnetospherethat surrounds it like a tire, with a ‘‘closed’’, loop-like topology of themagneticfield; (ii) in contrast, the magnetic field lines connected to the disk are ‘‘open’’,above and below the disk. Then a special distance, called the ‘‘corotation ra-dius’’Rc, is naturally defined: this is the distance at which the ‘‘Keplerian’’ (i.e.,orbital) velocity of a disk particle rotates at exactly the same speed as the star.(One could say, in analogy with the Earth’s artificial satellites, that this is the‘‘astrostationary’’ orbit.) At distances r<Rc from the star, the intensity of themagnetic field is stronger than atRc, and themagnetosphere rotates in a ‘‘rigid’’fashion, the field lines being anchored on the stellar surface. At distancesr>Rc, the magnetic field decreases rapidly and takes an open, spiral form as itbecomes tied to the disk. The point at Rc thus has a very particular magneticproperty: it is the border at which the magnetic field topology switches fromclosed (stellar component) to open (disk component). As such, it is also knownas the ‘‘X-point’’ (or more exactly the ‘‘X-ring’’ in three dimensions in view ofthe assumed axial symmetry) because of its X-shaped magnetic configuration(Shu et al. 1997).
The existence of the X-point (in a 2-dimensional cut) holds the key to themajority of ‘‘accretion–ejection’’ theories. There are many discussions amongtheorists about its exact status. For instance, it is not clear why the mag-netically defined X-point (at a distance Rx which depends only on the mag-netic field intensity) should be exactly at the same location as thegravitationally defined corotation radius Rc (which depends only on thestellar mass and rotation velocity), in other words why should Rx = Rc. It isnot clear either that the X-point should be that: a point (or more precisely an‘‘X-ring’’, in three dimensions), since this would mean that at Rx there mustbe an infinite concentration of magnetic fields lines, which is physicallyimpossible if matter is coupled to it (via some ionization, for instance due toX-rays), etc. But most theorists (and observers) agree, at least qualitatively,on the following general ‘‘accretion–ejection’’ picture, which will be sufficientfor the purpose of this paper.
Because of its special gravitational and magnetic properties, seen in twodimensions, the X-point de facto behaves like a Lagrange point (Figure 3.9,right): (i) If a particle, initially located at this point, is pushed towards theinterior (r<Rx), it will start falling freely on the star under the pull ofgravity, along the corresponding ‘‘rigid’’ magnetic field line: this is called‘‘magnetospheric accretion’’. (ii) Conversely, if a particle is pushed outwards,it will start following an open field line, and the centrifugal force will push iteven further: this is how ‘‘centrifugal jets’’ are formed. Thus, the X-point is
51SOLAR SYSTEM FORMATION AND EARLY EVOLUTION

intrinsically unstable, analogous to the gravitational Lagrange point L1 be-tween two celestial bodies (which here would be a three-dimensional mag-netic ‘‘Lagrange ring’’ in a star-disk sytem), and flowing through it mattercan either fall onto the star or be ejected. In practice, of course, matter doesboth: depending on the exact model, calculations predict that 1/10 to 1/3 ofthe disk matter should be ejected, the remainder falling on the star and thusfeeding its growth (e.g., Johns-Krull and Gafford, 2002). What is importantfor our purpose is the location of the X-point: for a solar-mass star rotatingrelatively slowly as T Tauri stars are observed to rotate (period of a fewdays), Rx is on the order of several stellar radii. Since a typical T Tauri starhas a radius R* ~ 3 Rx, this means Rx ~ 0.1 AU. In the well-studied T Tauristar AA Tau, for which the accretion disk is seen edge-on, it has been possibleto reconstruct the magnetic structure of the inner hole, from a study of itsactive regions eclipsed by the disk (Bouvier et al., 1999, 2003). Although inthis case the disk is found to be warped, which implies that the magneticaxis is tilted to the rotation axis, the size of the resulting magnetosphere isin good agreement with the theoretical picture (Figure 3.10), in particular
Figure 3.10. Sketch of the tilted magnetic structure inside the disk of the T Tauri star AA Tau.This sketch results from a study of the magnetic activity of the star, eclipsed by its warpedaccretion disk seen nearly edge-on (From Bouvier et al., 1999).
52 THIERRY MONTMERLE ET AL.

with the presence of an inner hole ~0.1 AU in radius. As a matter of fact,the magnetic field in the inner regions of several young stars has recentlybeen directly detected, via the Zeeman effect (Donati et al., 2005).Compared to the present-day solar system, such a hole is well within theorbit of Mercury (0.4 AU). This is also the size of a pinhole compared tothe disk sizes, which, as mentioned above, can be as large as 1,000 AU atan early stage.
Yet this ‘‘pinhole’’ region, which harbors the magnetic ‘‘central engine’’for the accretion–ejection mechanism, may have played an important role forthe early solar system. Indeed, because it is a region of tangled, unstablemagnetic fields, and located close to the star, itself the seat of its own intensemagnetic activity (as testified by the observed flaring X-ray emission, seeSection 3.2.1.2), it is a place where any circumstellar material (gas, grain,possible small planetary bodies, etc.) will suffer a high dose of radiation,either in the form of hard photons (XUV activity), or energetic particles(accelerated in stellar flares like on the Sun, and which, while not directlyobservable, can be induced from X-rays). We shall return below (Section3.2.1.2) to this important question, which connects the early evolution ofcircumstellar disks with the history of the young solar system.
To summarize, at an age of ~106 years, the young solar system – or thesolar nebula – can be depicted as follows. At its center, a magnetized solar-like star has reached most of its final mass, ~1 Mx This star is surroundedby a rigid magnetic ‘‘cavity’’ (its magnetosphere), about 0.1 AU in radius.At the ‘‘X-point’’, corotating with the star, lies the inner edge of the cir-cumstellar disk, from which most (0.9–2/3) of the matter continues to fallon the star. The remainder is ejected on both sides perpendicular to thedisk, in the form of a powerful, highly collimated jet, which evacuatesmost, if not all, its angular momentum. Beyond the X-point lies a densecircumstellar disk, either ‘‘small’’ (~50 AU, say) if it has been truncated inthe vicinity of hot stars (as in a bright, UV-rich Orion-like environment),or ‘‘large’’, a few hundred AU in radius if it was born in a dark, quietOphiuchus-like environment. Within this disk, matter continues to flowfrom the outside to the inside, braked by viscosity, until the disk isexhausted – or because matter starts to assemble to form large grains and,ultimately, planetesimals and giant planets, as discussed in the next sectionbelow.
In this ‘‘dynamic’’ picture of the solar nebula, any ‘‘heavy’’ particle like agrain can have two fates when it arrives in the vicinity of the X-point: either itfalls onto the star by accretion, or it is entrained outwards by ‘‘light’’ par-ticles (the gas), but eventually falls far back onto the disk in a ballistic fashionbecause it is too heavy to be carried away along the open magnetic field linesby the centrifugal force. In this last case, it will have spent some time veryclose to the X-ring, and will have suffered there heavy irradiation by hard
53SOLAR SYSTEM FORMATION AND EARLY EVOLUTION
photons and energetic particles. These particles will then mix to the disk,holding specific ‘‘scars’’ from their passage near the X-ring. As explained inSection 3.2.2, this is how some models explain the mysterious presence of‘‘extinct radioactivities’’ in meteorites.
3.2. The First 10 Million Years: the ‘‘Disk Era’’
3.2.1. THE EVOLUTION OF CIRCUMSTELLAR DISKS AROUND YOUNG STARS AND
IMPLICATIONS FOR THE EARLY SOLAR SYSTEM
3.2.1.1. The path to planets: Astronomical timescale for the growth of dustgrainsJEAN-CHARLES AUGEREAU
Now that a dense circumstellar disk is installed around the central star, itmust evolve: on the one hand, it continues (albeit at a lesser rate) to lose massat its inner edge (by way of magnetic accretion), on the other hand, grainsassemble via low relative velocity collisions to form larger, preplanetarybodies. But how long does it last? Infrared observations of T Tauri stars,which are sensitive to the presence of circumstellar material, show that disksdisappear on widely different timescales. Figure 3.11 (Hillenbrand, 2006),which collects data from ~30 star-forming regions, shows that so-called‘‘inner disks’’ (i.e., regions warm enough to radiate are near-IR wavelengths)are ubiquitous at young ages, and tend statistically to disappear after a fewmillion years only. Quantitatively, the fraction is consistent with 100% at anage 1 Myr, and drops to less than 10% after 10 Myr, with some clusterscontaining no disk at all. Actually, this low fraction of ‘‘old’’ disks is a lowerlimit: mid-IR observations, which are sensitive to cooler disks, hence moredistant from the central star, show that in some cases, like the nearby g Chacluster, aged 9 Myr, the fraction of disks is closer to 40–60% (resp. Megeathet al., 2005; Lyo et al. 2003), suggesting that disks may live longer thanpreviously thought. However, at this stage the disk mass is found to be toolow to form even a Jupiter (10)3 Mx)—or perhaps they have already doneso—so that the general conclusion is that giant planets, if any, must haveformed on timescales significantly shorter than 10 Myr.
Therefore, the disk era is a critical period for planet formation, tightlyconstrained by astronomical observations. Submicron-sized dust particlescomposing young and massive disks constitute the raw material fromwhich planets form. Tiny dust grains must coagulate to form large dustaggregates, pebbles, and then larger rocky bodies (planetesimals) before thedust disk becomes too tenuous. The formation of giant planets through thecore-accretion scenario also requires the formation of planetary cores
54 THIERRY MONTMERLE ET AL.
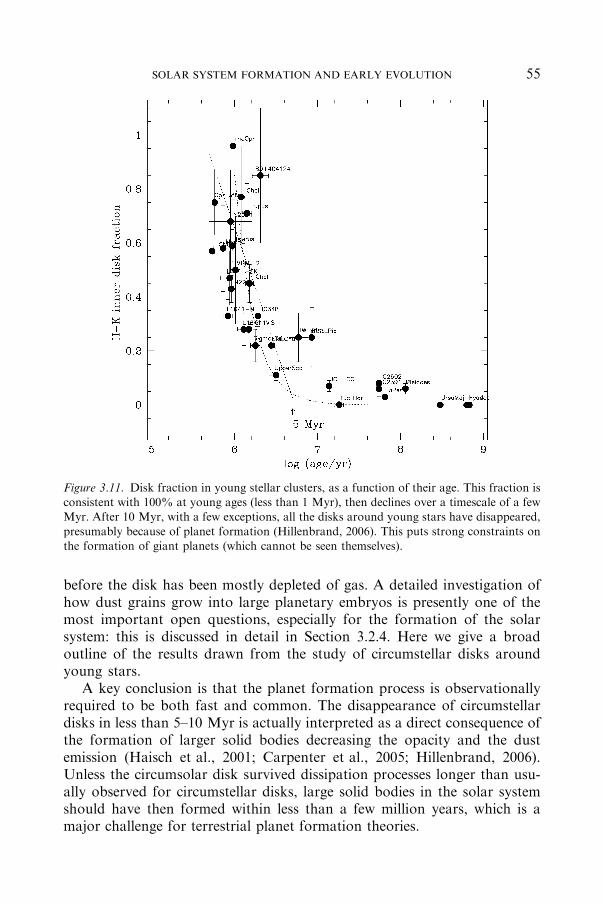
before the disk has been mostly depleted of gas. A detailed investigation ofhow dust grains grow into large planetary embryos is presently one of themost important open questions, especially for the formation of the solarsystem: this is discussed in detail in Section 3.2.4. Here we give a broadoutline of the results drawn from the study of circumstellar disks aroundyoung stars.
A key conclusion is that the planet formation process is observationallyrequired to be both fast and common. The disappearance of circumstellardisks in less than 5–10 Myr is actually interpreted as a direct consequence ofthe formation of larger solid bodies decreasing the opacity and the dustemission (Haisch et al., 2001; Carpenter et al., 2005; Hillenbrand, 2006).Unless the circumsolar disk survived dissipation processes longer than usu-ally observed for circumstellar disks, large solid bodies in the solar systemshould have then formed within less than a few million years, which is amajor challenge for terrestrial planet formation theories.
Figure 3.11. Disk fraction in young stellar clusters, as a function of their age. This fraction isconsistent with 100% at young ages (less than 1 Myr), then declines over a timescale of a fewMyr. After 10 Myr, with a few exceptions, all the disks around young stars have disappeared,
presumably because of planet formation (Hillenbrand, 2006). This puts strong constraints onthe formation of giant planets (which cannot be seen themselves).
55SOLAR SYSTEM FORMATION AND EARLY EVOLUTION
In addition, the growth of solid particles in disks must be sufficientlygeneric for at least two reasons. First, a significant fraction of solar-like starshave been found during the last decade to host giant gaseous exoplanets6.The formation of our solar system may then not be peculiar, and the generalconclusions derived from statistical analysis of star-forming regions may alsoapply to the early solar system. Nevertheless, it is not known whether thesegiant exoplanets formed through the accretion of gas onto a solid core or not.But there exists an independent evidence for planetesimal formation to occurroutinely in disks around young stars. A large fraction of main sequence starsin the solar neighborhood are observed to be surrounded by tenuous diskscomposed of short-lived dust grains. The survival of these so-called ‘‘debrisdisks’’, which contain much less mass that young disks (typically 10)6 Mx),over hundreds of million years points indirectly towards the presence ofreservoirs of meter-sized (or larger) bodies, similar to the Kuiper Belt in oursolar system, which release grains by mutual collisions. (We see this phe-nomenon continuing in the present-day solar system in the form of zodiacallight.) The observation of debris disks is up to now one of the most con-vincing observational clues indicating that planetesimal formation in youngdisks is common.
Various processes contribute to the coagulation and growth of dust grainsin disks of sufficiently high density. Current theoretical models of circum-stellar disks (Section 3.2.4 and references therein) include Brownian motion,vertical settling, radial drift and turbulence. Interstellar like grains (smallerthan about 0.1 micron) stay well mixed with the gas where the gas density ishigh enough. In that case, the low-velocity collisions between grains due toBrownian motion result in aggregates with fluffy structures. This process isparticularly efficient in the disk mid-plane while collisions at the disk surfacecould be destructive. As aggregates grow and reach millimeter sizes, theysettle to the disk mid-plane on short time-scales depending somewhat on thestrength of the turbulence.
Can we test this model? The available tools to witness grain growth indisks remain limited. Observations can only probe the continuum, quasi-blackbody emission of grains with sizes of the order of the observingwavelength. Therefore, astronomers are basically limited to the directdetection of solid particles smaller than, at most, a few centimeters. Fortu-nately, disks become optically thin at millimeter wavelengths, which allowsastronomers to probe the denser regions of disks where sand-like grains areexpected to reside. At these wavelengths, the total disk flux directly relies onthe dust opacity that is a function of the grain size, and it can be shown thatgrains several orders of magnitude larger than those found in the interstellar
6 Visit The Extrasolar Planets Encyclopaedia: http://www.exoplanets.eu
56 THIERRY MONTMERLE ET AL.

medium are required to explain the (sub-)millimeter observations (Draine,2006). At shorter wavelengths, the disk mid-plane is opaque and only theupper layers, mostly consisting of small grains according to the models, areaccessible. But as the opacity of disks inversely depends on the wavelength,observations should probe deeper and deeper regions as the wavelengthsincreases (Duchene et al., 2004). In practice, the interpretation of scatteredlight observations of disks at visible and near-infrared wavelengths is notstraightforward as it strongly depends on the light scattering properties of theindividual grains that are, unfortunately, hard to model properly. This typeof study is also limited to a handful of objects, such as the circumbinary diskof GG Tau (Figure 3.12)
More statistically meaningful conclusions can be derived from the study ofdust mineralogy through infrared spectroscopy. Especially, silicates that arecomposed of silicon, oxygen and, in most cases, a cation (often iron ormagnesium), have characteristic solid-state vibrational bands that occuruniquely at infrared wavelengths. The emission spectra of silicates fromoptically thin disk surfaces display characteristic emission features around 10microns due to the Si–O stretching mode, and around 20 microns due to theO–Si–O bending modes. Silicates are observed in the interstellar medium andin many solar system objects, including the Earth mantle where it appears
Figure 3.12. Left panel: observations of the dust ring about the GG Tau young binary system.In order to properly interpret the almost wavelength-independent appearance of the ring, dustsettling toward the disk midplane must be taking into account in the models (middle and right
panels). Such images may be unveiling the vertical stratified structure of the disk (Ducheneet al., 2004). The cold gas component of the GG Tau ‘‘ring world’’ has also been observed inthe mm domain (Guilloteau et al., 1999).
57SOLAR SYSTEM FORMATION AND EARLY EVOLUTION

mostly in the form of olivine (after its olive-green color). Their presence indisks around young solar-like stars is thus expected, by analogy with thesolar system. But it is only recently that large fractions of T Tauri stars couldbe spectrally studied thanks to highly sensitive infrared space telescopes suchas Spitzer (Figure 3.13). Silicates turn out to be ubiquitous in T Tauri disks inMyr-old forming regions. But, interestingly, the strength and shape of theiremission features differ in many cases from those observed in the interstellarmedium, indicating significant processing of silicates in young disks. As thesilicate features strongly depend on grain size, the presence in disk atmo-spheres of dust particles several orders of magnitude larger than interstellargrains provides a natural explanation to the observations. Silicate emissionfeatures can thus be used as extremely valuable diagnostics of micron-sizedsolid particles in disks, as demonstrated for instance by Kessler-Silacci et al.(2006). Moreover, as the stars are fairly young (less than a few million years),this indicates fast grain growth in disks.
Figure 3.13. Ten micron silicate features from dust disks around stars of various masses
(Natta et al. 2006). From left to right: Herbig Ae stars (HAe), a few times more massive thanthe Sun), T Tauri stars (TTS), and Brown Dwarfs (BDs). Examples of theoretical silicateemission features, based on their experimental optical properties, are dispayed in the extreme
right panel (Lab.Sil.). By comparing the shape and strength of these profiles to the observa-tions, one can infer the presence of large grains as well as the degree of crystallinity of thesilicates.
58 THIERRY MONTMERLE ET AL.

The detection in circumstellar disks of crystalline silicates similar to thoseobserved in solar-system cometary dust is an additional diagnostic of similarsignificant grain processing within the first 10 Myr. The silicates that areinjected into the primordial stellar nebulae are in the form of amorphoussilicates, as proven by the recurrent non-detections of crystalline silicates inthe interstellar medium. The annealing (crystallization) of amorphous sili-cates can only happen in the inner regions of the disks where the temperatureis sufficiently high. Also their incorporation in long-orbital period solarsystem objects points towards radial (and vertical) mixing of dust during theinfancy of the solar system. Various mechanisms throughout the disk such asstellar/disk winds or radial and vertical mixing in (magneto-)turbulent diskscan, in principle, transport dust grains with important implications on thedisk chemistry and mineralogy. The observation of disks around young so-lar-like stars supports the radial mixing scenario since crystalline silicates arefound at distances where the temperature is too low for in situ annealing. Incontrast, it has been suggested that supernova shock waves in the outer solarnebula could have rapidly annealed the amorphous silicates in situ prior totheir incorporation into comets, thereby eliminating the need for large-scalenebular transport processes (Harker and Desch, 2002; see also below, Section3.2.2.3). But it is currently impossible, even for the solar system, to distin-guish between the two proposed scenarios.
It is particularly interesting to note that the statistical analysis of largesamples of T Tauri stars shows a poor correlation between the grain size inthe upper layers of disks and the age of the star. The same conclusion can bedrawn when the degree of crystallinity of the silicate grains is considered.Although star ages are difficult to estimate accurately,7 these results tend toindicate that age is not the only parameter controlling disk evolution. Theenvironment (ambient radiation field, bound companions, etc.) is likely toimpact the disk evolution and hence the planet formation which couldexplain star-to-star variations at similar ages. Although the formation ofmeter-sized (or larger) rocks is a prerequisite to form terrestrial planets andplanetary cores, one should keep in mind that this step is one of the lessobservationally nor theoretically constrained in the planet formation process.Exoplanet embryos are nevertheless expected to leave characteristic imprintsin disks such as gaps or even to clean up the inner disk regions. The detectionof gaps in young systems due to planet-disk coupling is still pending. In a fewcases, the presence of depleted regions inside disks can be indirectly inferredfrom the lack of significant circumstellar emission at short IR wavelengthsindicating a low amount of warm material close to the star. But such objectsremain exceptional. Thus, at present, astronomers are only able to draft
7 See Chapter 2
59SOLAR SYSTEM FORMATION AND EARLY EVOLUTION
general trends without being able yet to further constrain the main steps thatallow to go from sub-micron size grain to km-sized bodies, and this is a majorproblem in particular for theories of the formation of the solar system(Section 3.2.4).
3.2.1.2. X-ray induced irradiation phenomena in circumstellar disksTHIERRY MONTMERLE
A new factor probably plays an important role, for star formation as well asfor planet formation. This is the ubiquitous X-ray emission from young stars,from the protostar stage (see, e.g., Feigelson and Montmerle, 1999; Micelaand Favata, 2005, for reviews). X-rays are mainly detected in the form ofpowerful flares, very similar to those seen in the images of the Sun which theYohkoh satellite sent us every day from 1991 to 2001,8 but much more intense(103–105 times stronger than for the quiet Sun).
In the course of these flares, the stellar X-ray luminosity LX amounts to10)4 to 10)3 times the total luminosity of the young star (called the ‘‘bolo-metric’’ luminosity Lbol), reaching a few percent or more in exceptional cases.It can be shown that the ‘‘plasma’’ (a very hot, ionized gas, with a temper-ature of 107 to 108 K) that emits the X-rays is confined in very large magneticloops (up to 2–3 R�, i.e., about 10 Rx for a T Tauri star). By analogy withthe Sun, it is thought that the fast heating results from so-called ‘‘recon-nection events’’, in which magnetic field lines of opposite polarities get incontact in a ‘‘short-circuit’’, and suddenly release the magnetic energy pre-viously stored in the course of various motions, for instance when magneticfootpoints are dragged by convective cells (e.g., Hayashi et al. 2000). Theplasma then cools radiatively typically in a few hours by the emission ofX-ray photons.
Thanks to X-ray satellites (from the 90s), X-ray emission has been detectedfrom hundreds of T Tauri stars, either concentrated in young stellar clusterslike q Ophiuchi (e.g., Ozawa et al., 2005) or Orion (Getman et al., 2005), orelse more widely dispersed as in the Taurus-Auriga clouds (e.g., Stelzer andNeuhauser, 2001), and many other star-forming regions. For a given popu-lation of T Tauri stars (with and without disks), the X-ray detection rate isconsistent with 100%. (Only the fainter stars are not all detected, for lack ofsufficient sensitivity.) In other words, observations suggest that all young,solar-like stars, emit X-rays, at a level LX/Lbol ~ 10)4 to 10)3 with a fairlylarge dispersion (see, e.g., Ozawa et al., 2005), to be compared with LX/Lbol ~ 10)7 for the present-day Sun. This is for instance most vividly illus-trated by the ~1,500 sources detected in the 10-day Chandra exposure of theOrion Nebula (Getman et al., 2005; Feigelson et al., 2005) (Figure 3.14).
8 Visit http://www.solar.physics.montana.edu/YPOP/
60 THIERRY MONTMERLE ET AL.

In addition to providing us information on the ‘‘magnetic state’’ of youngstars (for instance relevant to ejection phenomena, or to the reconnectionmechanisms, as discussed above), flare X-rays are important on anotherground: they induce irradiation effects on the dense surrounding circum-stellar and interstellar material: ionization and energetic particle interactions(this last point will be discussed in the next subsection; see Glassgold et al.,2000, 2005; Feigelson, 2005).
The first effect of X-ray irradiation is the ionization of the accretion disk.Direct evidence for irradiation has been found recently in the form of afluorescence line of neutral iron at 6.4 keV in the spectra of nearly a dozen ofT Tauri stars with disks, mainly in the q Oph and Orion clusters (Favataet al., 2005; Tsujimoto et al. 2005), and also by the presence of specificmolecules in some disks (e.g., Greaves, 2005; Ilgner and Nelson, 2006, andreferences therein). Such a characteristic fluorescence line can be excited onlyin response to X-ray irradiation of the cold gas. On theoretical grounds,several authors have studied the case of an accretion disk irradiated by X-rays (e.g., Glassgold et al., 2000, 2005; Fromang et al., 2002; Matsumura andPudritz, 2006). The results depends on details of the adopted disk model, butthe main conclusion, sketched in Figure 3.15, is that the ionization of theaccretion disk is dominated by X-rays, except in the densest equatorialregions where they cannot penetrate (‘‘dead zone’’), i.e., within a few AU ofthe central source. Everywhere else, the disk is partially ionized, and theionization fraction xe = ne/nH is roughly comparable to that of the inter-stellar medium (xe ~ 10)7 or less).
The ionization state of the disk has another important consequence: thecoupling of matter with magnetic fields. Indeed, even very weakly ionized
Figure 3.14. The center of the Orion nebula cluster. Left: near-IR image (this is the same as
Figure 3.3). Right: corresponding X-ray image by Chandra (Getman et al., 2005). Note theexcellent identification between the IR and X-ray sources, demonstrating that all young starsemit X-rays at levels much higher than the Sun.
61SOLAR SYSTEM FORMATION AND EARLY EVOLUTION

matter ‘‘sticks’’ to the magnetic field via collisions between neutral atoms andcharged atoms (ions): this process, called ambipolar diffusion, has alreadybeen mentioned above in the context of star formation in molecular clouds(Section 3.1.1). When this process is coupled with the Keplerian motion of allatoms in a disk around the central object, it gives rise to a so-called ‘‘mag-netorotational instability’’, discovered by S. Chandrasekhar and extensivelystudied by Balbus andHawley (1991). This instability is invoked to explain thestrong viscosity of accretion disks, and thus regulates accretion itself (e.g.,Fromang et al., 2004). One interesting consequence is that such strong viscouscoupling would not exist in the (neutral) dead zone, which would then un-dergo accretion only if some other, non-magnetic mechanism for an efficientviscosity were at work (which cannot be excluded). In fact, it has even beensuggested that such a ‘‘protected’’, neutral region, of size ~20 AU, would befavorable for planet formation (Glassgold et al., 2000; Matsumura andPudritz, 2006). Note, however, that the very existence of an extended deadzone has been challenged by recent numerical computations, which take intoaccount turbulent motions within the disk, and which show that the neutral,dead zone volume tends to mix with the surrounding, ionized material: in theend, (weak) ionization probably dominates everywhere in the disk (Flemingand Stone, 2003), although this study does not take grains into account, whichturn out to play an important role in the disk ionization (Ilgner and Nelson,
Figure 3.15. Sketch of the X-ray irradiation of circumstellar disks. Note in particular the
emission of a neutral X-ray fluorescence line at 6.4 keV, detected in several systems. The otherline, at 6.7 keV, is characteristic of a hot, X-ray emitting plasma, at temperatures of several106 K. Note also the dense, neutral ‘‘dead zone’’, which, according to some authors, would be
the most favorable to planet formation.
62 THIERRY MONTMERLE ET AL.
2006). Up to now, such a weak, but widespread ionization, which must alsoaffect the growth of dust grains since they would be electrically charged, hasnot been taken into account in planet formation theories.
3.2.2. THE FIRST FEW MILLION YEARS AS RECORDED BY METEORITE DATA
MARC CHAUSSIDON, MATTHIEU GOUNELLE, THIERRY MONTMERLE
We now turn to the earliest stages of the solar system: the solar nebula, andthe so-called meteoritic record. While most of the extraterrestrial flux to theEarth is in the form of micrometer size dust (�20,000 tons of the so-calledmicrometeorites par year), there are about 10 tons of meteorites of centi-meter to meter size that fall on Earth every year. Most of these meteorites arelikely to come from the asteroidal belt situated between Mars and Jupiter.Among meteorites, chondrites are primitive objects that have endured noplanetary differenciation. This is attested by:(i) their mineralogical composition which reflects accretion of compo-
nents formed at high temperature (the chondrules) and low temper-ature (the matrix), components that were never homogenizedchemically and/or isotopically through melting and metamorphism,
(ii) their bulk composition which is similar to the photospheric abundancesof the elements in the Sun (Anders and Grevesse, 1989) and is thusconsidered as primitive, i.e. reflecting that of the forming solar system,
(iii) their age : they are the oldest rocks of the solar system, with a Rb/Sr ageof �4.55 Gyr (Wasserburg, 1987). (This early pioneering result is nowupdated by more precise measurements: see below, Section 3.2.2.2.)
Other meteorites such as irons or some achondrites are the by-products ofplanetary differentiation : they have younger ages (by a few Myr) and havecompositions reflecting the interplay of silicate–metal differentiation (core-mantle formation) and of silicate–silicate differentiation (crust-mantle for-mation). Thus chondrites, which are undifferentiated, can help us unravel thephysico-chemical conditions in the solar nebula and the astrophysical contextof the Sun’s birth, while differentiated meteorites trace the formation andevolution of large planetary bodies.
3.2.2.1. Chondrite components and physical conditions in the solar nebulaMARC CHAUSSIDON, MATTHIEU GOUNELLE
Among chondrites, carbonaceous chondrites have a chemical compositionmost similar to that of the Sun, and are therefore believed to be our bestproxy for the protosolar nebula (Brearley and Jones, 1998). The mineralogy,
63SOLAR SYSTEM FORMATION AND EARLY EVOLUTION

chemistry and isotopic composition of carbonaceous chondrites can helpdecipher the formation and history of the solar nebula. Carbonaceouschondrites are made of Calcium–Aluminium-rich Inclusions (CAIs),chondrules and matrix, chondrules representing by far the major component,70–80% in volume (see recent reviews by Zanda, 2004 for chondrules and byMacPherson and Huss, 2003, for CAIs). (Figure 3.16)
Matrix is rich in volatile elements (e.g., H2O, C,...) : it is a fine-grainedcomponent made of chondrule fragments and of minerals stable at lowtemperature. Matrix has endured extensive secondary processing in theparent-body evidenced by metamorphic transformations (solid state diffu-sion) and hydrothermalism due to fluid-rock interactions. Matrix is thereforenot very useful for pinpointing the physical conditions in the solar nebula. Atvariance, CAIs and chondrules are high temperature components which wereformed in the solar nebula and thus predate parent-body processes. CAIs arerefractory components made of Al-, Ca-, Ti-rich silicates and oxides.
Figure 3.16. Fragment of the Allende meteorite, revealing (large white area in the bottomright-hand corner) the so-called ‘‘Calcium–Aluminium-rich Inclusions’’ (CAIs), in whichevidence for short-lived, extinct radioactivities have been found.
64 THIERRY MONTMERLE ET AL.
Accordingly, they are generally considered from their mineralogy to be thefirst solids formed by condensation from the solar nebula gas at temperatureshigher than 1800 K. Chondrules are spherical objects, made of iron–magne-sium silicates (mostly olivine and pyroxene), metal and sulfides. Chondrulesgenerally contain a large fraction of glassy mesostasis, implying that they wereonce molten and were subsequently quenched at a few to perhaps 1000 K/h(Hewins, 1997). Experimental studies show that CAIs cooled at �0.1 to�10 K/h (Stolper and Paque, 1986). Both CAIs and chondrules are thoughtto have formed in the solar nebula via complex high-temperature processesincluding condensation, evaporation, melting, etc.... Despite extensive studies,the exact mechanisms that led to the formation of CAIs and chondrules arestill elusive, but it is clear that CAIs and chondrules formed at different timesor locations. Chondrules probably formed at a higher pressure than CAIs andit is generally considered that chondrules formed later than CAIs, althoughthis assumption cannot yet be demonstrated by direct dating of each com-ponent. In fact, the formation of chondrules and CAIs may overlap and thereexists a variety of chondrules and CAIs which may have formed in differentenvironments and may have complicated histories, involving precursors ofvariable composition and more or less extensive exchanges with the nebulargas (see Hewins et al., 2005, and references therein).
3.2.2.2. Duration of the solar nebulaMARC CHAUSSIDON, MATTHIEU GOUNELLE
Radioactive nuclide abundances in rocks are classically used to date rocksand to infer timescales for geological processes.9 Among these, the U/Pbsystem which combines two parent/daughter couples (238U decays to 206Pbwith a half life of 4.47 Gyr, and 235U decays to 207Pb with a half life of0.7 Gyr), is the one which has provided the most accurate dating of mete-oritic components. Accordingly, the CAIs appear to be the oldest componentwithin chondrites, with a U/Pb age of 4567.2±0.6 Myr (Manhes et al.,1988; Allegre et al., 1995; Amelin et al., 2002). Slightly different values, basedon various methods, have appeared in the recent literature, giving an age of4568.5±0.4 Myr (Baker, 2005; Bouvier et al., 2005), but for the purpose ofthis article these values (which differ by ~1.3±0.5 Myr) are consistent withinthe uncertainties. This age can be considered as giving the ‘‘time zero’’, t0, forthe start of the formation of the solar system; however this current experi-mental time resolution of ~1 Myr does not allow to build a precise chro-nology of the earliest processes which occurred in the solar accretion disk andwhich gave birth to the first solar system solids from the nebula. In fact, the
9 See Chapter 2 on Chronometers (Section 2.2).
65SOLAR SYSTEM FORMATION AND EARLY EVOLUTION
typical duration of these processes is most likely less than 1 Myr, so revealingthem requires further improvements in the experimental methods.
Of particular interest for cosmochemistry are the so-called extinct radio-active nuclides, or short-lived radioactive nuclides, which have half-lives be-low a few Myr. The ones which have been identified in meteorites up to noware 7Be (T1/2 = 53 days), 41Ca (T1/2 = 0.1 Myr), 36Cl (T1/2 = 0.3 Myr),26Al (T1/2 = 0.74 Myr), 10Be (T1/2 = 1.5 Myr), 60Fe (T1/2 = 1.5 Myr) and53Mn (T1/2 = 3.7 Myr). The presence of excesses of their radioactivedaughter elements (e.g., positive correlation between 26Mg/24Mg and27Al/24Mg ratios for 26Al, see Figure 3.17) shows that these radioactivenuclides were present in various amounts both in CAIs and in chondruleswhen they formed. Because of their short half-lives, short-lived radioactivitiescan be used to constrain very tightly timescales (McKeegan and Davis, 2003and refs therein): for instance the 26Al/27Al ratio decreases by a factor of twowithin 0.74 Myr. In this respect, 10Be, 26Al and 60Fe are of special interestsince they can (i) help constrain the chronology of the first million years ofevolution of the solar system, and (ii) give nuclear clues to the astrophysicalcontext of the Sun’s birth.
Many measurements of the initial content of 26Al in CAIs have led to theidea of a canonical ratio, 26Al/27Al = 4.5 · 10)5, that would have definedthe starting time t0 of the ‘‘protoplanetary’’ solar system (MacPherson et al.,1995)—which must not be confused with the starting time of the formation ofthe Sun as a star, which in this context precedes t0 (see Section 2.5). CAIs areparticularly well suited for the determination of the 26Al/27Al ratios, becausesince they are refractory objects they are enriched in Al relative to Mg. Lessnumerous measurements in chondrules, which are less enriched in Al relativeto Mg and thus more difficult to analyze, suggest that chondrules formedwith 26Al/27Al < 1 · 10)5 (Mostefaoui et al., 2002). Assuming an homoge-neous distribution of 26Al in the solar nebula, this yields a ~2–3 Myr agedifference between CAIs and chondrules. This timescale has long been con-sidered as the characteristic timescale of the solar nebula as determined bychondrite data. If true, such a long duration for the high temperature pro-cesses in the accretion disk implies that CAIs and chondrules must have beenin some way ‘‘stored’’ in the nebula for 2–3 Myr before being accreted to-gether to form the chondrites.
At this point it is important to stress that this so-called ‘‘chronologicalinterpretation’’ of the 26Al/27Al variations relies entirely on the assumptionmentioned above, which is very strong: the existence once in the early solarsystem of an homogeneous distribution of 26Al (Gounelle and Russell, 2005).This assumption is far from being proven and very difficult to demonstrate infact, simply because one would need very precise independent absolute agesfor different objects to be able to test the homogeneity of their 26Al/27Alratios. It could in fact well be that the difference in the initial content of 26Al
66 THIERRY MONTMERLE ET AL.
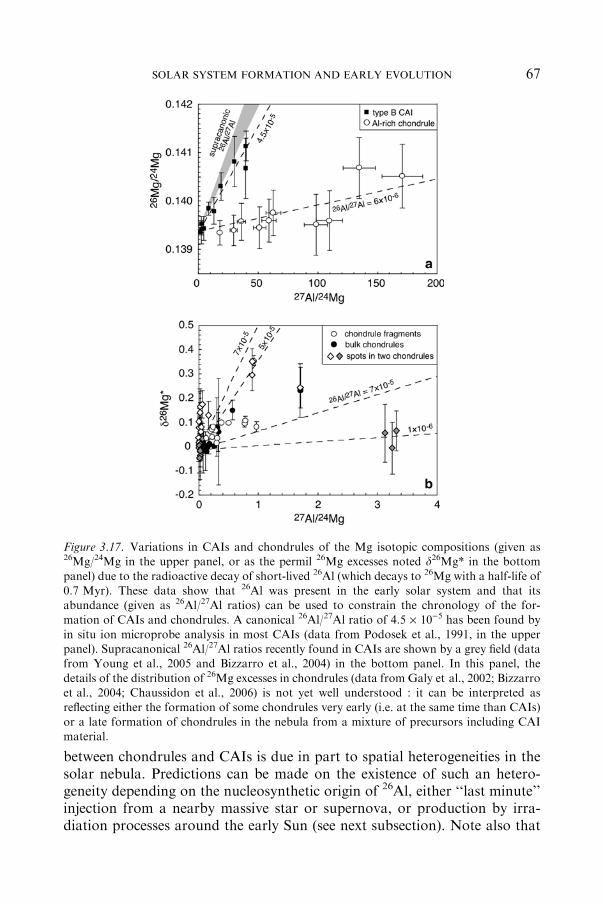
between chondrules and CAIs is due in part to spatial heterogeneities in thesolar nebula. Predictions can be made on the existence of such an hetero-geneity depending on the nucleosynthetic origin of 26Al, either ‘‘last minute’’injection from a nearby massive star or supernova, or production by irra-diation processes around the early Sun (see next subsection). Note also that
Figure 3.17. Variations in CAIs and chondrules of the Mg isotopic compositions (given as26Mg/24Mg in the upper panel, or as the permil 26Mg excesses noted d26Mg* in the bottom
panel) due to the radioactive decay of short-lived 26Al (which decays to 26Mg with a half-life of0.7 Myr). These data show that 26Al was present in the early solar system and that itsabundance (given as 26Al/27Al ratios) can be used to constrain the chronology of the for-mation of CAIs and chondrules. A canonical 26Al/27Al ratio of 4.5 · 10)5 has been found by
in situ ion microprobe analysis in most CAIs (data from Podosek et al., 1991, in the upperpanel). Supracanonical 26Al/27Al ratios recently found in CAIs are shown by a grey field (datafrom Young et al., 2005 and Bizzarro et al., 2004) in the bottom panel. In this panel, the
details of the distribution of 26Mg excesses in chondrules (data from Galy et al., 2002; Bizzarroet al., 2004; Chaussidon et al., 2006) is not yet well understood : it can be interpreted asreflecting either the formation of some chondrules very early (i.e. at the same time than CAIs)
or a late formation of chondrules in the nebula from a mixture of precursors including CAImaterial.
67SOLAR SYSTEM FORMATION AND EARLY EVOLUTION

the picture has recently been complicated by results from the Oxford-UCLAlaboratory (Galy et al., 2002; Young et al., 2005) who showed that thecanonical ratio of CAIs might be due to a resetting event of an initially higherratio of �7 · 10)5, and that chondrules might have formed with an initial26Al/27Al ratio significantly higher than 1 · 10)5. The high 26Al/27Al ratiosinferred for some chondrules can indicate that they formed very early (Biz-zarro et al., 2004) or be simply due to the fact that they contain an inheritedCAI component (Galy et al., 2002).
Recently, high precision data on Pb isotopes (U/Pb dating system) havebeen obtained on CAIs and chondrules (Amelin et al., 2002), providingabsolute ages of the chondrites’ components. CAIs have ages ranging from4567.4±1.1 Myr to 4567.17±0.70 Myr, while chondrules have ages rang-ing from 4564.66±0.3 Myr to 4566.7±1 Myr. This confirms that the solarnebula could have lasted for several million years, and question the idea thatall chondrules formed 2–3 Myr after CAIs. Most recent Pb data seem toindicate that a range of ages do exist for chondrules, from nearly as early asCAIs to a few Myr later.
3.2.2.3. Extinct radioactivities and the astrophysical context of the birthof the SunMARC CHAUSSIDON, THIERRY MONTMERLE
The presence of short-lived radioactivities in the solar nebula is intriguing.Because their half-life is shorter than the timescales needed to isolate the futuresolar system material from the interstellar medium, they need to have a ‘‘lastminute origin’’, as opposed to the steady-state abundance of galactic cosmic-ray induced isotopes. They could have been injected in the nascent solarsystem by a nearby supernova, or made by irradiation of the nebular dust and/or gas by energetic solar protons, or both. The challenge of any mechanism isto explain most, if not all, of the extinct radioactivities at the same time.
The ubiquitous, intense and flare-like X-ray activity of young stars (Sec-tion 3.2.1.2) support the idea that irradiation could have been an importantprocess in the early solar system (see previous sections; also Chaussidon andGounelle, 2006, for a review of the traces of early solar system irradiation inmeteoritic components, and Feigelson, 2005 for the relation with X-ray flaresfrom young stars). Such an origin is supported by the presence of 10Be(T1/2 = 1.5 Myr) and of 7Be (T1/2 = 53 days) in Allende CAIs (McKeeganet al., 2000; Chaussidon et al., 2006), beryllium isotopes being made by flare-induced energetic particle irradiation (see Figure 3.18).
On the other hand, the presence of 60Fe in sulfides and silicates fromchondrites (Huss and Tachibana, 2004; Mostefaoui et al., 2004) implies thepresence of a nearby supernova, since 60Fe is too neutron-rich to have beenmade by in-flight spallation reactions (Lee et al., 1998), and is a signature of
68 THIERRY MONTMERLE ET AL.

explosive nucleosynthesis in supernovae. The presence of a nearby supernovawould imply in turn that the Sun was born in a crowded stellar environment,possibly similar to HII regions as observed in Orion (Hester and Desh, 2005,and above, Section 3.1.1). 26Al also can be made in massive stars andsupernova explosions (though other stellar processes, such as in novae andred giant stars, which are old, are also important sources, see Diehl et al.2006), and it is thus tempting to explain the abundance of both isotopes inthis way. As a matter of fact, one can find a set of parameters (time intervalbetween the explosion and the birth of the solar system Dt = 1 Myr, dilutionfactor due to transport of supernova material to the presolar core f=10)4)that explains both abundances, and also other isotopes (Busso et al., 2003;Gallino et al., 2004). But this may not be completely realistic: as a rule, moststar-forming regions are in some vicinity of OB associations in which massivestars evolve and explode sequentially. If they explode at a frequency shorterthan ~1 Myr, the resulting 60Fe and 26Al nucleosynthesis will tend to be in asteady state locally (as long as the massive star formation episode lasts),rather than in separate bursts, subsequently decaying. For instance, in spite
Figure 3.18. Variations in one Allende CAI of the 10B/11B ratios vs. the 9Be/11B ratio (datafrom Chaussidon et al., 2006). The isochrone-type correlation demonstrates that short-lived10Be (which decays to 10B with T1/2=1.5 Myr) was present in the early solar system. The sameCAI contains traces of the in situ decay of short-lived 7Be (T1/2=53 days). Radioactive 10Be
and 7Be can be produced in the early solar system by irradiation processes around the YoungSun (Chaussidon and Gounelle, 2006).
69SOLAR SYSTEM FORMATION AND EARLY EVOLUTION

of the fact that the Orion Nebula Cluster currently contains no supernova,the 1.809 MeV gamma-rays from the decay of 26Al have been detected by theGRO satellite, as a signature of past supernovae from massive stars exca-vating the nearby so-called Eridanus superbubble (Diehl et al., 2004). Presentsupernovae, on the other hand, have been found by the RHESSI andINTEGRAL satellites, by way of the 1.173 and 1.333 MeV emission of 60Fein the Cygnus region, which hosts the most massive stars in the Galaxy(Harris et al. 2005). On the other hand, for the presolar core the values of Dtand f are loosely constrained since some arbitrary mass cut in the supernovaejecta has to be invoked for the calculated abundances to be in agreementwith observations in meteorites (Meyer, 2005), and neglects the precedingcontribution of the precursor massive stars. It is thus troubling that theirradiation model, which takes into account the enhanced stellar energeticparticle flux deduced from X-ray observations, should be able to account forthe 26Al/27Al ratio in CAIs independently from the possible existence of asupernova.
At this point, it should be noted that, as early as 25 years ago, Montmerle(1979) identified about 30 massive star-forming regions which were, based onvarious observational criteria, tentatively associated with supernova (SN)remnants. These ‘‘special’’ regions, dubbed ‘‘SNOBs’’ (for ‘‘OB associations’’or molecular clouds observed to be associated with supernovae) were at thetime searched in connection with the identification of high-energy gamma-raysources. For our purpose, this sample can be taken as examples of the realityof supernovae exploding in the close vicinity of young stars. It also showsthat only a small fraction of all OB associations are in this situation at anygiven time. An illustration of the complexity of the problem is given, again,by the Orion star-forming region.
In 1895, E.E. Barnard discovered a faint, almost exactly (half-) circularring in the outskirts of Orion, spanning several degrees in the sky. Thisspectacular structure, now known as Barnard’s Loop, is shown in Fig-ure 3.19. It is readily visible in the Ha line of ionized hydrogen. Its exactnature is still uncertain: proposed to be a supernova remnant by Opik back in1935, recent radio observations (Heiles et al., 2000) have shown that theemission is thermal, i.e., radiated only by an ionized gas, just like HII regionsaround young stars. The idea then is that this ring has been created by windsfrom the Belt stars (not the Trapezium; the Belt stars are the conspicuousstars visible with the naked eye on clear winter nights, see Figure 3.19). But itis also possible that the traditional radio signature of supernova remnants,i.e., the nonthermal emission from high-energy electrons accelerated at theshock front, is somehow buried in a more intense thermal emission – aclassical dilemma in supernova remnant identifications. In either case,however, kinematics indicate that Barnard’s Loop must have originatedabout 3 · 106 years ago close to the Orion nebula.
70 THIERRY MONTMERLE ET AL.

When considering the consequences on the possible irradiation of the‘‘proplyds’’ of the Orion nebula (see Figures 3.3 and 3.4), one is thereforefaced with two possibilities: (i) either Barnard’s Loop is not the remnant of asupernova explosion having taken place 3 · 106 years ago, in which casenone of the current young stars in Orion have been peppered with 60Fe, (ii) orit is, then only a fraction of them have been. This can be seen by looking atthe H–R diagram presented in Chapter 2 on chronometers (Figure 2.3). Inthis figure, we can easily see that the majority of young stars present in theOrion Nebula Cluster are in fact younger that 3 · 106 years, so that any 60Fespread by the explosion has disappeared, and these young stars cannot becontaminated by 60Fe. Quantitatively, one can find after Figure 3.20 (takenfrom Palla and Stahler, 1999), that less than 40% of the older generation ofyoung ‘‘suns’’ may have been effectively contaminated by the SN explosion, if
Figure 3.19. Barnard’s Loop surrounding the Orion nebula, seen in Ha. It is unclear whetherthis extended structure is a the remnant of a supernova explosion or an ionized shell created bystellar winds from the Belt stars, but kinematical studies give it an age of 3 · 106 years.(Photograph by E. Mallart).
71SOLAR SYSTEM FORMATION AND EARLY EVOLUTION

there was such an explosion. The presence of 60Fe in the early solar systemwould then not be the rule, even in an Orion-like birthplace.
In the end, and as discussed in the introductory sections, the birthplace ofthe Sun is still an unresolved question, although the birth of the Sun in a richcluster seems to be favored by stellar statistics. To understand whether the Sunwas born in a high-mass environment like Orion, or in a low-mass environ-ment like q Ophiuchi or Taurus has however important implications not onlyfor the astrophysical conditions for the Sun’s birth itself, but also for thechronology of the early solar system. Indeed, depending on their origin, short-lived radionuclides were or were not homogeneously distributed in the solarnebula. Usually short-lived radionuclides are expected to be homogeneouslydistributed if coming from a supernova and heterogeneously distributed iforiginating from in situ irradiation by energetic particles. This comes from thefact that supernova material must be largely volatilized in the HII region andhomogeneously mixed in the accreting disk where it is injected, though there isat present no definitive observation demonstrating whether a fraction of the
Figure 3.20. Age distribution in four mass ranges for stars in the Orion Nebula Cluster (Pallaand Stahler, 1999). The dotted line indicates the estimated age of Barnard’s Loop, 3 Myr. Forstars of mass close to 1 Mx, less than 40% are older than 3 Myr and may have been
contaminated by short-lived nucleosynthetic products of a supernova explosion, providedBarnard’s Loop is a supernova remnant, which is still unclear.
72 THIERRY MONTMERLE ET AL.

supernova ejecta cannot be in the form of solid grains (Hester and Desch,2005). At variance, irradiation models based on X-ray flare observations andthe ‘‘X-ring’’ picture (Gounelle et al., 2001; 2004; see above, Section 1.3)predict possible variations in the production rate of short-lived radionuclidesdepending on parameters such as the fluence of the accelerated particles, theircomposition and the composition of the irradiated target. Irradiation, how-ever, might also produce rather constant radionuclide abundances if charac-teristic time scales and compositions are considered for the irradiation. It isobvious that identifying the source of 26Al and other short lived nuclideswould provide a long-needed basis for the chronological use of these elements.
One could think of solving this problem by looking at young stars withcircumstellar disks, in which particle irradiation is actually taking place asseen in X-rays, making use of the fact that, as mentioned above, 26Al decaysby the emission of 1.8 MeV gamma-rays, and is thus observable elsewherethan in the solar system by gamma-ray telescopes such as GRO. The cal-culation has been done by Montmerle (2002): taking into account thatgamma-ray telescopes have a very wide field-of-view (several degrees indiameter), when pointed at a star-forming region they will integrate the fluxof a whole star-forming region, i.e., several hundred young stars at the sametime. As it turns out, even under the most optimistic assumptions the1.8 MeV flux is undetectable, and dominated by the general 26Al emission inthe Galaxy, which is most conspicuous in massive star-forming regions be-cause of successive supernova explosions (see Diehl et al. 2006).
In summary, while the presence of 60Fe in CAIs shows that the formingsolar system has been at least ‘‘polluted’’ by a nearby supernova, it is not clearwhether this supernova has been responsible for the other extinct radioac-tivities, including 26Al.
3.2.3. INTERMEZZO
THIERRY MONTMERLE
The study of circumstellar disks around solar-like stars, as described inSection 3.1.2, obviously has strong implications on our current views on theorigin and formation of the solar system. We observe their global evolution(timescale for the disappearance of disks in stellar clusters), and we begin tounderstand their physicochemical evolution (growth and mineralogy of dustgrains via IR spectroscopy) over a few million years, while large quantities ofgas (detectable via mm observations) are still present. However, as alreadymentioned, once the grains reach sizes of a few mm, they are not observableany more. They start to be observable again much later (several tens ofmillion years), but only as ‘‘debris’’ of collisions between macroscopic bodies,presumably planetesimals or asteroids, giving indirect evidence for ongoing
73SOLAR SYSTEM FORMATION AND EARLY EVOLUTION
planetary formation. Thus, there is a crucial observational time gap betweenthe ‘‘primordial’’ disks (which would correspond to the solar nebula), and‘‘second-generation’’ debris disks (in which planetary formation is well underway). Translated into sizes, this means that we have essentially no observa-tional constraints on the transition between cm-sized grains (direct) andkm-sized bodies (indirect).
In principle, the ~200 known exoplanetary systems should also give usclues about planetary formation in general, and the formation of the solarsystem in particular. However, at least as far as the formation of the solarsystem is concerned (which is our main concern here in the context of theorigin of life as we know it), there are still many open problems. Indeed, whilecurrent observing techniques are sensitive mostly to super-giant exoplanetsclose to the central stars (the so-called ‘‘hot Jupiters’’, with masses between 5and 10–15 Jupiter masses or more), and increasingly more to lower-massexoplanets, exoplanetary systems with several planets, when they exist, donot resemble at all the solar system. The recently announced discovery of adistant 5-Earth-mass exoplanet orbiting a very low-mass, non-solar, star, byway of gravitational lensing towards the galactic center (Beaulieu et al. 2006),is not helpful either in this context, since nothing is known about the possibleexoplanetary system it belongs to.
In the end, for most of the phase of planet formation we are essentially leftwith theory, backed by rare and difficult laboratory experiments. The goal isto put together mechanisms for grain agglomeration and destruction, andmutual dynamical interactions between bodies of various sizes and masses inthe general gravitational field of the central star, and also in the presence ofgas which affects the motion of small particles. In spite of the relative sim-plicity of the basic equations, this involves sophisticated numerical N-bodysimulations. The following section describes the basic theoretical concepts ofplanetary formation restricted to the solar system, with the goal of ultimatelyunderstanding the various steps that led to the formation of our planet, theEarth.
3.2.4. THE FIRST STAGES OF PLANETARY FORMATION IN THE SOLAR SYSTEM
ALESSANDRO MORBIDELLI
3.2.4.1. From micron-size to kilometer-size bodies (1 Myr)In the proto-solar nebula, the most refractory materials condense first,gradually followed – while the local temperature drops – by more and morevolatile elements. The dust grains thus formed float in the gas. Collisionsstick the grains together, forming fractal aggregates, possibly helpedby electrostatic and magnetic forces. Other collisions then rearrange the
74 THIERRY MONTMERLE ET AL.

aggregates, and compact them. When the grains reach a size of about acentimeter, they begin to rapidly sediment onto the median plane of the diskin a time
Tsed � R=ðqpXaÞ � ðqvÞ=ðqpX2aÞwhere R is the nebula surface density, q is its volume density, v is the r.m.s.thermal excitation velocity of gas molecules, qp the volume density of theparticles, a is the radius, and X is the local orbital speed of the gas (Goldreichand Ward, 1973; Weidenschilling, 1980). Assuming Hayashi’s (1981) minimalnebula (minimal mass solar composition nebula, with surface density Rproportional to r)3/2, containing materials to create the planets as we knowthem), one gets
Tsed � 103=a years
where a is given in cm. This timescale, however, is computed assuming aquiet, laminar nebula. If the nebula is strongly turbulent, or strongly per-turbed from the outside or by the ejection of jets in the proximity of the star,the sedimentation can become much longer.
Once the dust has sedimented on the mid-plane of the nebula, the clockmeasuring the timescale of planet accretion starts effectively to tick. Thus, thetime t0 for planetary accretion is not the time t0 usually used in stellar for-mation theory (start of the collapse of molecular cores) or the time t0 ofcosmochemists (the formation of the first CAIs, see above, Section 3.2.2.2).Linking the various times t0 together is one of the major problems inestablishing an absolute chronology for the formation of the solar system. Inaddition, notice that Tsed above depends on the heliocentric distance r. Thismeans that time t0 is different from place to place in the disk!
The growth from dust grains to kilometer-size planetesimals is stillunexplained. There are two serious issues that remain unsolved. The firstissue concerns the physics of collision between such bodies at speed of order10 m/s (typical collision velocity for Keplerian orbits with eccentricitye ~ 10)3), which is still poorly understood. For dust grains, current theoriespredict that collisions are disruptive at such speeds (Chokshi et al., 1993).However, recent laboratory experiments on collisions between micrometersize grains (Poppe and Blum, 1997; Poppe et al., 2000) give a critical velocityfor accretion (velocity below which grains accrete, and above which theyfragment) 10 times larger than predicted by the theory. The reason is prob-ably that the fractal structure of the dust allows to absorb energy much betterthan envisioned a priori. This may help solving the fragmentation paradoxfor dust–dust collisions. When the agglomeration of dust builds larger bod-ies, though, the problem of collisional disruption becomes much more severe.Laboratory experiments cannot be done at this size range and one has to
75SOLAR SYSTEM FORMATION AND EARLY EVOLUTION

trust computer models. Specific simulations of this process with SPH(Smooth Particle Hydrodynamics) techniques have been done by Benz (2000)for basalt bodies (monolithic or rubble piles) of sizes in the range m to km.He found that low velocity collisions (5–40 m/s) are, for equal incomingkinetic energy per gram of target material, considerably more efficient indestroying and dispersing bodies than their high velocity counterparts.Furthermore, planetesimals modeled as rubble piles are found to be char-acterized by a disruption threshold about five times smaller than solid bodies.Thus, unless accretion can proceed avoiding collisions between bodies ofsimilar masses, the relative weakness of bodies in meter to km size rangecreates a serious bottleneck for planetesimal growth. These apparently neg-ative results, however, may once again depend on our poor understanding onthe internal structure of these primitive small planetesimals. The simulationsassume rocky objects, but it is still unclear how a puffy pile of dust becomes asolid rock. If the planetesimals were not yet ‘solid rocks’ maybe the impactenergy could be dissipated more efficiently.
The second open problem on planetesimal growth concerns radialmigration. Gas drag makes them fall onto the central star: gas being sus-tained by its own pressure, it behaves as if it felt a central star of lower mass,and therefore rotates more slowly than a purely Keplerian orbit at the sameheliocentric distance. Solid particles tend to be on Keplerian orbits andtherefore have a larger speed than the gas. So the gas exerts a force (drag) onthe particles, the importance of which is given by the characteristic stoppingtime:
Ts ¼ ðmDVÞ=ðFDÞ;where m is the mass of the grain, DV the difference between the particlevelocity and the gas velocity, and FD the gas drag. For small particles, the‘‘Epstein’’ gas drag gives
Ts � qp=R;
while for big particles, the ‘‘Stokes’’ drag gives
Ts � qpa2:
(Weideschilling, 1977). We then compare this time with the characteristicKeplerian time
TK ¼ 1=X:
If Ts>>TK, the particle is almost decoupled from the gas. If Ts<<TK, it isstrongly coupled to the gas, and it tends to move with the gas flow. Themaximum effect occurs when Ts ~TK, which occurs for meter sizeparticles. For the Hayashi minimal nebula, at about r = 1 AU from the Sun,
76 THIERRY MONTMERLE ET AL.
DV~ 50–55 m/s, and the particle’s radial velocity induced by the gas drag isthen of order 10–100 m/s (Weideschilling, 1977). So meter-sized particlesshould fall on the Sun in ~100–1,000 years, i.e., before they can grow massiveenough to decouple from the gas.
One way out of this paradox is to have a density of solids larger than thatof the gas. In this case, the growth timescale would be faster than the radialdrift timescale. However, such a composition is not supported by observa-tions nor by current theories.
Another possibility is the existence of vortices in the protoplanetary disk,due to the turbulent viscosity of the nebula (Tanga et al., 1996). In thismodel, 70–90% of the particles are trapped in anti-cyclonic vortices. Oncetrapped, the particles do not fall any more towards the Sun, but rather falltoward the center of the vortex. Such falling timescale varies from a fewtens to a few thousand years, depending mainly on the size of the particleand on the heliocentric distance (which increases all dynamical timescales).Once at the center of the vortex, particles dynamics are stable over thelifetime of the vortex. Their relative velocities are reduced (particles tend tofollow the gas stream lines, so they all tend to have the same velocity) andthe local density is increased, enhancing the accretion process. Therefore,vortices would help the accretion of kilometer-size planetesimals in twoways: by stopping the drift of meter-sized bodies towards the Sun, and byspeeding up the accretion process due to the accumulation of the bodies atthe centers of the vortices.
Which of these two possible situations is the real one, profoundly affectsthe formation timescale. If there is no way to slow down the fall of growingplanetesimals towards the Sun, then the formation of a multi-km object hasto occur in about a few 1,000 years, probably by gravitational instability. If,on the contrary, the turbulence of the disks is an effective obstacle to theinwards drift, then the formation of planetesimals can take much longer. Toadd confusion (reality is never easy), it is likely that while the first plane-tesimals are building up, new dust is settling on the midplane or drift in fromfurther heliocentric distances. So, different planetesimals can see different‘‘times t0’’. In other words, even if the formation of a planetesimal is locallyvery fast, the formation of a population of planetesimals can be ongoing formuch longer.
3.2.4.2. Formation of planetary embryos (1–10 Myr)One way or another, we now have a gas disk containing kilometer-sizeplanetesimals. The dynamics of accretion starts to be dominated by the effectof the gravitational attraction among the planetesimals, which increases thecollisional cross-sections. A runaway growth phase starts, during which thebig bodies grow faster than the small ones, hence increasing their relative
77SOLAR SYSTEM FORMATION AND EARLY EVOLUTION
difference in mass (Greenberg et al., 1978). This process can be summarizedby the equation:
d
dt
M1
M2
� �¼ M1
M2
1
M1
dM1
dt� 1
M2
dM2
dt
� �>0;
whereM1 andM2 are, respectively, the characteristic masses of the ‘‘big’’ andof the ‘‘small’’ bodies, and can be explained as follows.
Generally speaking, accretion is favored by a high collision rate, whichoccurs when the relative velocities are large, but also by large collisionalcross-sections and gentle impacts, which occur when the relative velocities arelow. Therefore the relative velocities between the different planetesimalpopulations govern the growth regime.
At the beginning of the runaway growth phase the large planetesimalsrepresent only a small fraction of the total mass. Hence the dynamics isgoverned by the small bodies, in the sense that the relative velocities amongthe bodies is of order the escape velocity of the small bodies Vesc(2). Thisvelocity is independent of the mass M1 of the big bodies and is smaller thanthe escape velocity of the large bodies Vesc(1). For a given body, the collisionalcross-section is enhanced with respect to the geometrical cross-section by theso-called gravitational focusing factor:
Fg ¼ 1þ ðV2esc=V
2relÞ;
where Vesc is the body’s escape velocity and Vrel is the relative velocity of theother particles in its environment. Because Vrel ~Vesc(2), the gravitationalfocusing factor of the small bodies [Vsec = Vvesc(2)] is of order unity, whilethat of the large bodies [Vesc = Vesc(1)>>Vesc(2)] is much larger. In thissituation one can show that mass growth of a big body is described by theequation
1
M1
dM1
dt
� �� M
1=31 V�2
rel
(Ida and Makino, 1993) Therefore, the relative growth rate is an increasingfunction of the body’s mass, which is the condition for the runaway growth(Figure 3.21).
The runaway growth stops when the mass of the large bodies becomesimportant (Ida and Makino, 1993) and the latter start to govern thedynamics. The condition for this to occur is:
n1M21 > n2M
22;
where n1 (resp. n2) is the number of big bodies (resp. small bodies). In thiscase, Vrel ~Vesc(1) ~M1
1/3, and hence (1/M1)(dM1dt) ~M11/3. The growing
78 THIERRY MONTMERLE ET AL.

rate of the embryos gets slower and slower as the bodies grow, and therelative differences in mass among the embryos also slowly become smaller.In principle, one could expect the small bodies themselves to grow, narrowingtheir mass difference with the embryos. But in reality, the now large relativevelocities prevent the small bodies to accrete with each other. The small
Figure 3.21. A simulation of the runaway growth process for planetary embryos. In a disk ofequal mass planetesimals, two ‘‘seeds’’ (planetesimals of slightly larger size) are embedded. As
time passes, the two seeds grow in mass much faster than the other planetesimals,, becomingplanetary embryos (the size of each dot is proportional to its mass). While the growingplanetary embryos keep quasi-circular orbits, the remaining planetesimals have their eccen-tricities (and inclinations) excited by the close encounters with the embryos. Notice also that
the separation between the embryos slowly grows in time (i.e. passing from one panel to thesubsequent one). From Kokubo and Ida (1998).
79SOLAR SYSTEM FORMATION AND EARLY EVOLUTION

bodies can only participate to the growth of the embryos: this phase is called‘‘oligarchic growth’’.
The runaway growth phase happens throughout the disk, with timescalesthat depend on the local dynamical time (Keplerian time) and on the localdensity of available solid material. This density will also determine themaximum size of the embryos and/or planets when the runaway growth ends(Lissauer, 1987). Assuming a reasonable surface density of solid materials,the runaway growth process forms planetary embryos of Lunar to Martianmass at 1 AU in 105–106 yr, separated by a few 10)2 AU. Beyond the so-called snow line at about 4 AU, where condensation of water ice occurredbecause of the low temperature, enhancing the surface density of solidmaterial, runaway growth could produce embryos as large as several Earthmass in a few million years (Thommes et al., 2003).
3.2.4.3. Formation of the giant planets (10 Myr)Observations and models of the interior of the giant planets give someimportant constraints on the composition and mass of the giant planets (seeGuillot, 1999, and for a review, Guillot, 2005):(i) Jupiter has a mass of 314 ME (Earth mass), and contains ~10–30 ME
of heavy elements;(ii) Saturn has a mass of 94 ME and contains ~10–20 ME of heavy ele-
ments;(iii) Uranus and Neptune have a mass of 14 and 17 ME respectively, of
which only ~1–2 ME of hydrogen and helium.
To account for these constraints, the best current models for the formationof Jupiter and Saturn assume a three-stage formation (Pollack et al., 1996):(1) the solid core accretes as explained in the previous section; beyond the
snow line, the surface density of solid material is enhanced by a factor ofseveral, due to the presence of ice grains. This allows embryos to grow toabout 10 ME on a timescale of a million years (Thommes et al., 2003).
(2) The accretion of the solid core slows down (see above), while a slowaccretion of nebular gas begins, due to the gravity of the core. The gasaccretion continues at a roughly constant rate over many million years,until a total mass of 20–30 ME is reached;
(3) When the mass of the protoplanet reaches ~20–30 ME the gas gravita-tionally collapses onto the planet. The mass of the planet grows expo-nentially and reaches hundreds of Earth masses in ~10,000 years: this isthe ‘‘runaway’’ phase. (Figure 3.22)
The model explains well the properties of Jupiter and Saturn, in particularthe existence of solid cores of about 5–15 Earth masses. There are howeverfour main problems in the above scenario, which have not yet been solved.
80 THIERRY MONTMERLE ET AL.

(I) When the planetary core reaches a mass of several Earth masses, itstidal interaction with the gas disk forces it to migrate very rapidly towardsthe Sun. (This is called ‘‘Type-I migration’’). The estimated falling time ismuch shorter than the time required for the onset of the exponential accre-tion of the massive atmosphere. Thus, giant planets should not exist! Twoways out of this paradox have been proposed.
The first is that the gas disk was violently turbulent. In this case, theplanetary cores would have suffered a random walk, rather than a monotonicinfall towards the star (Nelson, 2005). Some would have collided with the stareven faster than in the absence of turbulence, but others could be luckyenough to avoid collisions for a time long enough to start phase 3 above.
A second possibility (Masset et al., 2006) is that the gas disk surfacedensity had a radial discontinuity. For instance, the inner part of the diskcould be depleted by a factor of a few by the ejection of material in the polarjets, typical of young – magnetically active – stars (Section 3.1.3). If such adiscontinuity exists, the planetary core would migrate towards the disconti-nuity, and stop there until the atmosphere is accreted.
(II) The second phase of giant planet accretion (the slow accretion of theatmosphere, prior to the onset of the runaway growth of the giant planet’smass) is also a problem, as it takes about 10–15 Myr, longer then the typical
Figure 3.22. The growth of a Jupiter-mass planet. The solid curve gives the mass of metals as afunction of time. The dotted curve gives the mass of the gas, and the dash-dotted curve the
sum of the two, as a function of time. Notice that the growth of the solid core of theplanet almost stalls after the first 0.5 Myr. During a ~7 Myr timespan, the planet slowlyacquires an atmosphere, and, only when the total mass overcomes a critical threshold, a finalexponential accretion of gas is possible. The timescale characterizing the slow accretion of the
gas depends on the opacity of the atmosphere. From Pollack et al. (1996).
81SOLAR SYSTEM FORMATION AND EARLY EVOLUTION
nebula dissipation time (Haisch et al., 2001; Hillenbrand 2006) (see above).To shorten the timescale of the second phase, two solutions have been pro-posed: to have an enveloppe of reduced opacity (Podolack 2003), or themigration of the planet, which continuously feeds the growth of its core(Alibert et al., 2005).
(III) The end of the exponential gas accretion is not yet fully understood.Most likely the growth of the giant planets is slowed down when a gap isopened in the gaseous disk, and is finally stopped when the nebula is dissi-pated by photo-evaporation from the central star. If this is true, then the fullformation timescale of Jupiter and Saturn is of the order of the lifetime of thegas disk, namely of a few Myr. For Uranus and Neptune, it is generallyassumed that the nebula disappeared before that the third phase of accretioncould start. This would explain why these two planets accreted only a fewEarth masses of gas.
(IV) The last problem is that, at the endof stage (III) above, the giant planetsopen a gap in the gas disk. Consequently they become locked in the radialevolution of the disk. As the disk’s material tends to be accreted by the star, thegiant planets have to migrate inwards. This migration, although slower thanthat discussed above for the cores, is nevertheless quite fast. (This is the so-called ‘‘Type-II’’ migration.) It is usually invoked to explain the existence of‘‘hot Jupiters’’, massive extra-solar planets that orbit their star at distancessmaller than the orbital radius ofMercury. But in our solar system this kind ofmigration evidently did not happen, or at least did not have a comparably largeradial extent. Again, two solutions to this problem have been advanced.
The first possibility is that Jupiter and Saturn formed sufficiently late thatthe disk was already in the dissipation phase. Thus, the disk disappearedbefore it could significantly move the planets. In addition, this solution hasthe advantage of explaining why Jupiter and Saturn did not grow further inmass and why their massive atmospheres are enriched in heavy elementsrelative to the solar nebula composition (e.g., Guillot and Hueso, 2006).
A second possibility is that Jupiter and Saturn formed almost contem-poraneously and on orbits that were close to each other. In this case, the gapsopened by the two planets in the disk would have overlapped (Masset andSnellgrove, 2001). This would have changed dramatically the migrationevolution of the planets pair, possibly stopping or even reversing it. Of coursethe two solutions imply different formation timescales. If the planets stoppedbecause the gas disappeared, the fact that Jupiter and Saturn did not migratesignificantly implies that their formation timescale is of order of the nebuladissipation time (3–10 Myr; Hillenbrand 2006). In the opposite case, theymight have formed even faster.
Finally, to be complete, a model of giant planet formation alternativeto that of Pollack et al. has been proposed by Boss (see Boss, 2003 and ref-erences herein). In this model, the proto-planetary gas disk was massive
82 THIERRY MONTMERLE ET AL.
enough to be unstable under its own gravity. In this situation, gaseous planetscan form very rapidly, by a process that reproduces in miniature the one thatled to the formation of the central star. There is no need of the presence of amassive solid core to trigger the capture of the giant planet’s atmosphere. Inthis sense, Boss’s model may bring a solution to the timescale problem relatedwith the Pollack et al. model, discussed above. There is a still open debate inthe literature on whether the clumps of gas observed in numerical simulationsof gravitationally unstable disks are temporary features or would persistuntil the disk’s dissipation. For the case of our solar system, the presence ofmassive cores inside all giant planets, and the limited amount of gas in Uranusand Neptune, make us think that the Pollack et al. model is more appropriate.It is possible, however, that some or several of the extra-solar planets observedso far formed through a gravitational instability mechanism.
3.3. The First 100 Million Years: the ‘‘Telluric Era’’
3.3.1. FORMATION OF THE TERRESTRIAL PLANETS AND PRIMORDIAL
SCULPTING OF THE ASTEROID BELT
ALESSANDRO MORBIDELLI
After a few 105 years of runaway growth, the embryos in the terrestrial planetregion and in the asteroid belt region have Lunar to Martian masses. Theygovern the local dynamics and start perturbing each other. The system be-comes unstable, and the embryos’ orbits begin to intersect (Chambers andWetherill, 1998). Because of mutual close encounters, the embryos’ dynam-ical excitation (increase of eccentricity and inclination) moderately increases,and accretional collisions among embryos start to occur. The situationdrastically changes when Jupiter and Saturn acquire their current masses.These two planets strongly perturb the dynamical evolution of the embryosin the asteroid belt region between ~2 and 5 AU. The embryos acquire astrong dynamical excitation, begin to cross each other, and cross ratherfrequently the orbits of the embryos in the terrestrial planets region. Thecollision rate increases. Despite the high relative velocity, these collisions leadto accretion because of the large mass of the embryos.
The typical result of this highly chaotic phase – simulated with severalnumerical N-body integrations – is the elimination of all the embryos orig-inally situated in the asteroid belt and the formation a small number ofterrestrial planets on stable orbits in the 0.5–2 AU region in a timescale~100 Myr (Figure 3.23).
This scenario has several strong points:
83SOLAR SYSTEM FORMATION AND EARLY EVOLUTION

(i) Planets are formed on well separated and stable orbits only inside~2AU. Their number typically ranges from 2 to 4, depending on thesimulations, and their masses are in the range Mars mass – Earth mass(Chambers and Wetherill, 1998; Agnor et al., 1999).
(ii) Quasi-tangent collisions of Mars-mass embryos onto the proto-planets are quite frequent (Agnor et al., 1999). These collisions areexpected to generate a disk of ejecta around the proto-planets (Canupand Asphaug, 2001), from which a satellite is likely to accrete (Canupand Esposito, 1996). This is the standard, generally accepted, scenariofor the formation of the Moon (see below, Section 3.2)
(iii) The accretion timescale of the terrestrial planets is ~100 Myr. This iscompatible with several constraints on the chronology of accretioncoming from geochemistry (Allegre et al. 1995). On the other hand,Hf–W chronology seems to indicate that the formation of the Earth’score occurred within the first 40 Myr (Yin et al., 2002; Kleine et al.,2002). This might suggest that the Earth accretion was faster than itappears in the simulations. However, if the cores of the embryos arenot mixed with the mantles during the collisions – as indicated bySPH simulations (Canup and Asphaug, 2001) – this timescale wouldmeasure the mean differentiation age of the embryos that participated
Figure 3.23. The growth of terrestrial planets from a disk of planetary embryos. Each panelshows the semi-major axis and eccentricity of the bodies in the system, the size of each dot
being proportional to the mass. The color initially reflects the starting position of each em-bryo. When two (or more) embryos collide, the formed object assumes the color corre-sponding to the embryo population that has mostly contributed to its total mass. A system of
four terrestrial planets, closely resembling our solar system, is formed in 200 Myr. FromChambers (2001).
84 THIERRY MONTMERLE ET AL.

to the formation of the Earth, and not the time required for our planetto accrete most of its mass.
(iv) All the embryos located beyond 2 AU are eliminated in 2/3 of thesimulations (Chambers and Wetherill, 2001). They either aredynamically ejected from the solar system, or collide with the Sun, orare accreted by the forming terrestrial planets.
(v) In the same time, the small planetesimals are subject to the combinedperturbations of the giant planets and of the embryos (Petit et al.,2001). The dynamical excitation increasing very rapidly (timescale 1–2 Myr), most of the small planetesimals are eliminated in a few millionyears by either the ejection from the solar system, or the collision withthe Sun or with a growing planet. In the asteroid belt (2–4 AU range),this leads to a remaining population of small bodies (the asteroids) onstable orbits with quite large eccentricities and inclinations, whichcontains only a very small fraction of the total mass initially in theregion. This scenario explains well the current mass deficit of theasteroid belt, the eccentricity and semi-major axis distribution of thelargest asteroids and other more subtle properties of the asteroid beltpopulation, such as the partial mixing of taxonomic types.
However, this scenario of terrestrial planet formation suffers from someweaknesses:(i) The final orbits of the planets formed in the simulations are typically
too eccentric and/or inclined with respect to the real ones. This couldbe due to the fact that the current simulations neglect the so-calledphenomenon of dynamical friction, namely the effect of a large pop-ulation of small bodies, carrying cumulatively a mass comparable tothat of the proto-planets. Dynamical friction should damp theeccentricities and inclinations of the most massive bodies.
(ii) Obliquities of the terrestrial planets should have random values.However in reality, only one planet has a retrograde spin (Venus).Moreover all planetary obliquities are compatible with an initial 0-degrees obliquity, modified by the subsequent evolution in theframework of the current architecture of the planetary system (Laskarand Robutel, 1993).
(iii) The planet formed in the simulations approximately at the location ofMars is typically too massive.
3.3.2. THE FORMATION OF THE MOON
ALESSANDRO MORBIDELLI
As explained above, the currently accepted model for the Lunar formation isthat of a giant impact occurring during the formation of the Earth. The
85SOLAR SYSTEM FORMATION AND EARLY EVOLUTION

current view of terrestrial planet formation implies several giant impacts, andimpacts with an angular momentum similar of that of the Earth–Moonsystem are not rare, particularly during the end of the accretion process(Agnor et al., 1999). Simulations of a Moon-forming impact have been donesince 1986, using SPH simulations. The most advanced, recent high-resolu-tion simulations have been done by Canup and Asphaug (2001) and Canup(2004a). A very detailed review on the Moon formation can be found inCanup (2004b).
In the SPH simulations, three critaria has been used to judge the degree ofsuccess: the formation of a circumplanetary disk with about a Lunar massoutside of the Roche radius of the Earth, a mass of iron in the protolunardisk that is about 10% of the total mass (the fraction present inside theMoon), and a total angular momentum of the Earth-disk system of order ofthat of the current Earth–Moon system. In essence, in case of an ‘‘early’’formation of the Moon, when the proto-Earth was only 60% of the currentEarth mass, the impactor needs to be of about 30% of the total mass (proto-Earth + impactor). If the impact is late, the impactor can be of about 10%of the total mass, namely of order of the mass of Mars. The authors privilegethe ‘‘late impact’’ scenario, because otherwise the Moon would have accretedtoo many siderophile elements after its formation, assuming that it accretedabout 10% of the mass that is required to collide with the Earth to completethe Earth’s formation and a chondritic compostion of such material.
The differentiation of the Moon can be dated using the Hf–W chro-nometer, and turns out to have occurred at about 40 Myr after CAI for-mation (Yin et al., 2002; Kleine et al., 2002). Thus, if the Moon-formingimpact was the last one (or close to the last one), the Earth formed (i.e.,received its last giant impact) in a similar timescale. If on the contrary, theMoon-forming impact was an early one, the formation of the Earth mighthave taken longer. The Hf–W chronometer seems to indicate an age of 40 Myalso for the differentiation of the Earth, but in this case the interpretation isless straightforward because, in case there is little equilibration between thecore and the Mantle during the giant impacts, the overall mechanicalaccretion process of the Earth could have taken significantly longer (Sasakiand Abe, 2004).
In the SPH simulation of the Moon-forming impact, about 80% of thematerial that ends in the proto-lunar disk comes from the impactor, ratherthan from the proto-Earth. The Moon and the Earth have a very similarcomposition under many aspects (for instance the oxygen isotopic compo-sition is identical). The logical interpretation is then that the proto-Lunarimpactor and the proto-Earth had very similar compositions (and identicaloxygen isotope composition). This however seems in conflict with the resultsof N-body simulations of the accretion of terrestrial planets. These simula-tions show that a planet forms by accreting material in a stochastic way from
86 THIERRY MONTMERLE ET AL.

a wide variety of heliocentric distances. Given that the oxygen isotopecompostion of Mars and of all meteorite classes differ from each other, itthen seems unlikely that the proto-Earth and the lunar impactor could haveexactly the same resulting composition. A solution of this apparent paradoxhas been proposed by Pahlevan and Stevenson (2005). During the formationof the proto-lunar disk there might have been enough isotopic exchange withthe proto-Earth to equilibrate the two distributions. Another possibility isthat the fraction of the proto-Lunar disk of terrestrial origin was in realitymuch larger than estimated in the SPH simulations. In fact these simulationsassume a non-spinning Earth, so that the totality of the angular momentumof the Earth-Moon system is carried by the impactor. This has the conse-quence of having the impactor on a quasi-tangent trajectory relaitve to theproto-Earth, which maximizes the amount of impactor material that goes ingeocentric orbit. If the Earth was spinning fast at the time of the Moonformation, then the impactor might have had a more head-on trajectory andless of its material would have contaminated the proto-Lunar disk. SPHsimulations with a fast rotating Earth have never been done up to now.
The accretion of the Moon from a protolunar disk has been simulated byIda et al. (1997) and Kokubo et al. (2000). The Moon forms very quickly, inabout 1 year, at a distance from the Earth of about 1.2 to 1.3 Roche radii. Inmany cases, the Moon is accompanied by many moonlets, left-over of theaccretion process in the disk. More rarely, two Moons of similar mass areformed. The subsequent evolution of these systems, simulated in Canupet al. (1999), typically leads to an end-state with a single Moon on a stableorbit.
3.3.3. TOWARDS 1 GYR: THE EARLY EVOLUTION OF THE EARTH
BERNARD MARTY
3.3.3.1. Formation and closure of the Earth’s atmosphereThe formation of the terrestrial atmosphere is a suite of complex processeswhich are not yet fully understood. Indeed its abundance and isotopiccompositions differ from those of the solar nebula and of other knowncosmochemical components like comets or primitive meteorites. The generalconsensus is that our atmosphere was formed by contributions of severalvolatile-rich components and that it was subject to several episodes of loss tospace throughout its early history. Some of these loss events werenon-fractionating, that is, elements and isotopes were lost in the same pro-portion. This might have been the case of large impacts. Because the isotopiccomposition of some of the atmospheric elements such as noble gases differfrom known end-member compositions, one has to consider also that
87SOLAR SYSTEM FORMATION AND EARLY EVOLUTION
isotopic fractionation took place, and that there are several escape processesfor the atmosphere that have been demonstrated to isotopically fractionatenoble gases. Among these, there are the thermal loss, in which the velocity ofa given isotope is higher than that of another given isotope, allowing theformer to escape at a larger rate, and the pick-up ion loss in which atoms atthe top of the atmosphere are ionized during charge transfer from solar windions, light isotopes being statistically more prone for such ionization. Henceit is convenient to define an epoch at which the atmosphere became closed tofurther loss into space.
During at least the first tens of Myr of its existence, while the Sun was stillon its way to the main sequence, the Earth was subject to large-scale igneous(volcanic) events, during which the proto-mantle exchanged volatile elementswith surface reservoirs. It is likely that a primitive atmosphere existed at thistime, but any chemical record of it has been erased owing to the high thermalstate of the Earth evidenced by core formation and magma ocean episodes.Records of atmospheric processes at this time cannot be found directly at theEarth’s surface at Present. The record of extinct radioactivity systems inwhich parents differ from daughters by their respective volatilities give strongclues on the timing of terrestrial differentiation and the early cycle of volatileelements. Noble gases are chemically inert and their isotopic composition canonly be modified by kinetic fractionation, or mixing with nucleosyntheticcomponents, or through nuclear reactions including extinct radioactivitydecays.
Xenon, the heaviest stable noble gas, is of particular interest because someof its isotopes are the radioactivity products of three different decay systemscovering contrasted time intervals. Iodine is a volatile element for whichone isotope, 129I decays with T1/2 = 15.7 Myr to 129Xe. During terrestrialmagma ocean episodes, xenon, which has presumably a higher volatility thaniodine, was degassed preferentially to it. The amount of 129Xe in the atmo-sphere, in excess of the non-radiogenic xenon composition, corresponds to a‘‘closure’’ interval of about 100 Myr (Allegre et al., 1995). Put in otherwords, only a tiny fraction of radiogenic 129Xe has been retained in theatmosphere, showing evidence that the atmosphere was open to loss in spacefor at least several tens of Myr. The terrestrial mantle has kept even less129Xe. Heavy xenon isotopes e.g., 136Xe, are produced by the spontaneousfission of 244Pu (T1/2 = 82 Myr) so that the combination of both chro-nometers allows one to date the closure of the terrestrial mantle at60–70 Myr (Kunz et al., 1998). This age could be interpreted as averagingthe period during which the magma ocean episodes declined enough toquantitatively retain is volatile elements. Notably, heavy Xe isotopes are alsoproduced by the spontaneous fission of 238U which decays with a half-life of4.45 Gyr, so that it is possible to compute closure ages based on244Pu–238U–136Xe. Results indicate a closure age of about 400–600 Myr
88 THIERRY MONTMERLE ET AL.
(Yokochi and Marty, 2005), which could correspond to a significant declinein mantle geodynamics. Xe isotope variations are therefore consistent withlarge-scale differentiation within the first 100 Myr and also with prolongedmantle activity at rates much higher than at Present during the Hadean. Acomparable scenario was derived from other radioactive tracers, notably the146Sm–142Nd and 147Sm–143Nd systems, and this view is fully consistent withmodels linking the thermal state of the Earth with the rate of mantleconvection.
3.3.3.2. Geological evidence: Core differentiation, magnetic fieldThe time it took to build the Earth and the other terrestrial planets has beeninvestigated from two different approaches, theoretical modeling on onehand (see previous sections), and absolute chronology on the other hand. Inshort, numerical simulations indicate that the growth of terrestrial planetswas a geologically fast process. In the turbulent nascent solar system, dustaccreted into small bodies, for which gravity became the main coalescentagent, within 104–105 years. Models predict that bodies with sizes up to thatof Mars accreted within a few Myr. Independent evidence for rapid growthstems from coupled variations of 142Nd, 182W, 129Xe and 131–136Xe producedby extinct radioactivities of 144Sm (T1/2 = 106 Myr), 182Hf (9 Myr), 129I(15.7 Myr) and 244Pu (82 Myr) observed in Martian meteorites (Hallidayet al., 2001; Marty and Marti, 2002). These geochemical tracers attest thatMartian differentiation including core formation, crustal development andmantle degassing took place within £15 Myr, which is remarkably short, andcontemporaneous to the differentiation of parent bodies of meteorites.Furthermore, they also indicate that these heterogeneities were notre-homogenized later on as is the case of the Earth, and therefore attest for alow mantle convection rate on Mars, if any.
As dicussed previously, it took about 100 Myr to complete the Earth,considerably longer than the time of Mars-sized object formation (Wether-hill, 1980). This longer time interval is the result of the decreasing probabilityfor collisions to occur in an increasingly depleted population of growingbodies. This modeling approach does not allow one to get more detailedchronological definition within this time frame, which needs to be con-strained independently. The tungsten isotopic composition of the Earthcompared to that of the nascent solar system as recorded in primitivemeteorites supports large-scale differentiation within a few tens of millionyears. 182Hf decays into 182W with a half-life T1/2 = 9 Myr. Duringmetal–silicate differentiation, tungsten is siderophile, that is, concentratespreferentially in metal phase whereas hafnium prefers the silicates (litho-phile). If, in a differentiated body, this event took place when 182Hf was still
89SOLAR SYSTEM FORMATION AND EARLY EVOLUTION
present, the isotopic composition of tungsten is different from the solar oneas recorded for example in undifferentiated meteorites.
In pioneering attempts to use this chronometer, no difference in thetungsten isotopic composition was found between carbonaceous chondrites(the most primitive meteorites found so far) and terrestrial silicates, leadingthe authors to conclude that the last global Hf–W differentiation of the Earthhappened after all 182W decayed, in practice ‡60 Myr after the start of solarsystem condensation t0 (Lee and Halliday, 1995). More recently, differencesbetween chondrites and the Earth have been found (Kleine et al., 2002; Yinet al., 2002), implying a mean metal–silicate differentiation of 30 Myr for theEarth if terrestrial differentiation was a single and global event, with a pos-sible range of 11–50 Myr for more realistic accreting conditions. A collisionbetween a Mars-sized object and a growing proto-Earth is consistent with theunique Earth–Moon angular momentum. Numerical models for such a giantimpact indicate that the proto-Earth was severely disrupted while materialfrom the proto-mantle and the impactor spiraled at high temperature andformed the Moon (see above, Section 3.3.2). It is therefore logical, even if ithas not yet been demonstrated, to ascribe to this collision the last globaldifferentiation between metal and silicate recorded in the Hf–W system.Recent tungsten data for lunar basalts indicate a 182W anomaly for the lunarmantle, interpreted as record for differentiation at 45±4 Myr (Kleine et al.,2005). These authors proposed that this age represented the end of magmaocean episodes on the Moon.
The earliest record of a geomagnetic field dates back to the Archean (Haleand Dunlop, 1984; Yoshihara and Hamano, 2004), some 1 Gyr after theformation period. The terrestrial magnetic field has a major role in pre-venting solar wind ions to interact extensively with the top of the atmosphere,and create isotope fractionation of atmospheric elements by pick-up chargeexchange. It also tends to preserve the surface of the Earth from cosmic-raybombardment that are lethal for the development of organic chemistry.However, there is no evidence for the existence of magnetic field induced bythe geodynamo during the first Gyr.
References
Abergel, A. et al.: 1996, Astron. Astrophys. 315, L329–L332.Adams, F. C. and Myers, P. C.: 2001, Astrophys. J. 553, 744–753.Adams, F. C., Hollenbach, D., Laughlin, G. and Gorti, U.: 2004, Astrophys. J. 611, 360–379.
Adams, F. C., Proszkow, E. M., Fatuzzo, M., and Myers, P. C.: 2006, Astrophys. J. 641,504–525.
Agnor, C. B., Canup, R. M. and Levison, H. F.: 1999, Icarus 142, 219–237.
Alibert, Y., Mordasini, C., Benz, W. and Winisdoerffer, C.: 2005, Astorn. Astrophys. 434,343–353.
90 THIERRY MONTMERLE ET AL.

Allegre, C. J., Manhes, G. and Gopel, C.: 1995, Geochim. Cosmochim. Acta. 59, 1445–1456.Amelin, Y., Krot, A. N., Hutcheon, I. D. and Ulyanov, A. A.: 2002, Science 297, 1678–1683.
Anders, E. and Grevesse, N.: 1989, Geochim. Cosmochim. Acta 53, 197–214.Andre, P. and Montmerle, T.: 1994, Astrophys. J. 420, 837–862.Andre, P., Ward-Thompson, D. and Barsony, M.: 2000, in V. Mannings, A. P. Boss and S. S.
Russell (eds.), Protostars and Planets IV, University of Arizona Press, Tucson, pp. 59–97.Baker, J., Bizzarro, M., Wittig, N., Connelly, J. and Haack, H.: 2005, Nature 436, 1127–1131.Balbus, S. A. and Hawley, J. F.: 1991, Astrophys. J. 376, 214–233.Bate, M. R. and Bonnell, I. A.: 2004, in H. J. G. L. M. Lamers, L. J. Smith, and A. Nota (eds.),
The Formation and Evolution of Massive Young Star Clusters. ASP Conf. Ser., 322, 289.Beaulieu, J.-Ph. et al.: 2006, Nature 439, 437–440.Benz, W.: 2000, Sp. Sci. Rev. 92, 279–294.
Bertout, C.: 1989, Ann. Rev. Astron. Astrophys. 27, 351–395.Bizzarro, M., Baker, J. A. and Haack, H.: 2004, Nature 431, 275–278.Boss, A. P.: 2003, Astrophys. J. 599, 577–581.
Bouvier, A., Blichert-Toft, J., Vervoort, J. D., McClelland, W. and Albarede, F.: 2005,Geochim. Cosmochim. Acta Suppl. 69(Suppl. 1), A384.
Bouvier, J. et al.: 1999, Astron. Astrophys. 349, 619–635.
Bouvier, J. et al.: 2003, Astron. Astrophys. 409, 169–192.Brearley, A. and Jones, R. H.: 1998, in J. J. Papike (ed.), Planetary materials. Rev. Mineral.
36, 3/1–3/398.Busso, M., Gallino, R. and Wasserburg, G. J.: 2003, Pub. Astr. Soc. Austr. 20, 356–370.
Canup, R. M.: 2004a, Icarus 168, 433–456.Canup, R. M.: 2004b, Ann. Rev. Astron. Astrophys. 42, 441–475.Canup, R. M. and Asphaug, E.: 2001, Nature 412, 708–712.
Canup, R. M., Levison, H. F. and Stewart, G. R.: 1999, Astr. J. 117, 603–620.Canup, R. M. and Esposito, L. W.: 1996, Icarus 119, 427–446.Carpenter, J. M., Wolf, S., Schreyer, K., Launhardt, R. and Henning, T.: 2005, Astr. J. 129,
1049–1062.Chambers, J. E. and Wetherill, G. W.: 1998, Icarus 136, 304–327.Chambers, J. E. and Wetherill, G. W.: 2001, Met. Plan. Sci. 36, 381–399.
Chambers, J. E.: 2001, Icarus 152, 205–224.Chaussidon, M. and Gounelle, M.: 2006, in D. Lauretta and L. Leshin (eds.), Meteorites &
Early Solar System II. Tucson, University of Arizona Press, pp. 323–340.Chaussidon, M., Libourel, G. and Krot, A. N.: 2006, Lunar Planet. Sci. 36, 1335.
Chaussidon, M., Robert, F. and McKeegan, K. D.: 2006, Geochim. Cosmochim. Acta 70, 224–245.
Chokshi, A., Tielens, A. G. G. M. and Hollenbach, D.: 1993, Astrophys. J. 407, 806–819.
Clark, P. C., Bonnell, I. A., Zinnecker, H. and Bate, M. R.: 2005, Mon. Not. Roy. Astr. Soc.359, 809–818.
Crutcher R. M.: 2005, in Magnetic fields in the Universe: From Laboratory and Stars to
Primordial Structures, AIP Conf. Proc., vol. 784, pp. 129–139.Diehl, R., Halloin, H., Kretschmer, K., Lichti, G. G., Schonfelder, V., Strong, A. W., von
Kienlin, A., Wang, W., Jean, P., Knodlseder, J., et al.: 2006, Nature 439, 45–47.Diehl, R., Cervino, M., Hartmann, D. H. and Kretschmar, K.: 2004, New Astr. Rev. 48, 81–86.
Donati, J.-F., Paletou, F., Bouvier, J. and Ferreira, J.: 2005, Nature 438, 466–469.Draine, B. T.: 2006, Astrophys. J. 636, 1114–1120.Duchene, G., McCabe, C., Ghez, A. M. and Macintosh, B. A.: 2004, Astrophys. J. 606, 969–
982.Ehrenfreund, P. and Charnley, S. B.: 2000, Ann. Rev. Astr. Ap. 38, 427–483.
91SOLAR SYSTEM FORMATION AND EARLY EVOLUTION
Falgarone, E., Hily-Blant, P., Pety, J. and Pineau Des Forets, G.: 2005 in Magnetic fields inthe Universe: From Laboratory and Stars to Primordial Structures, AIP Conf. Proc., vol.
784, pp. 299–307.Favata, F., Micela, G., Silva, B., Sciortino, S. and Tsujimoto, M.: 2005, Astron. Astrophys.
433, 1047–1054.
Feigelson, E. D.: 2005, Met. Planet. Sci. 40(Suppl.), 5339.Feigelson, E. D. and Montmerle, T.: 1999, Ann. Rev. Astron. Astrophys. 37, 363–408.Feigelson, E. D., Getman, K., Townsley, L., Garmire, G., Preibisch, T., Grosso, N., Mont-
merle, T., Muench, A. and McCaughrean, M.: 2005, Astrophys. J. Suppl. Ser. 160, 379–
389.Ferreira, J., Pelletier, G. and Appl, S.: 2000, Mon. Not. R. Astron. Soc. 312, 387–397.Ferreira, J. and Casse, F.: 2004, Astrophys. J. 601, L139–L142.
Fleming, T. and Stone, J. M.: 2003, Astrophys. J. 585, 908–920.Fromang, S., Balbus, S. A., Terquem, C. and De Villiers, J.-P.: 2004, Astrophys. J. 616, 364–
375.
Fromang, S., Terquem, C. and Balbus, S. A.: 2002, Mon. Not. R. Astron. Soc. 329, 18–28.Gallino, R., Busso, M., Wasserburg, G. J. and Straniero, O.: 2004, New Astr. Rev. 48, 133–
138.
Galy, A., Young, E. D., Ash, R. D. and O’Nions, R. K.: 2002, Science 290, 1751–1753.Getman, K. V., Feigelson, E. D., Grosso, N., McCaughrean, M. J., Micela, G., Broos, P.,
Garmire, G. and Townsley, L.: 2005, Astrophys. J. Suppl. Ser. 160, 353–378.Glassgold, A. E., Feigelson, E. D. and Montmerle, T.: 2000, in V. Mannings, A. P. Boss and
S. S. Russell (eds.), Protostars and Planets IV, University of Arizona Press, Tucson, pp.429–455.
Glassgold, A. E., Feigelson, E. D., Montmerle, T. and Wolk, S.: 2005, in A. N. Krot, E. R. D.
Scott and B. Repurth (eds.), Chondrites and the Protoplanetary Disk. ASP Conf. Ser., vol.341, pp. 165–182.
Goldreich, P. and Ward, W. R.: 1973, Astrophys. J. 183, 1051–1061.
Goodwin, S. P., Whitworth, A. P. and Ward-Thompson, D.: 2004, Astron. Astrophys. 423,169–182.
Gounelle, M. and Russell, S. S.: 2005, Geochim. Cosmochim. Acta 69, 3129–3144.
Gounelle, M., Shu, F. H., Shang, H., Glassgold, A. E., Rehm, K. E. and Lee, T.: 2004, LunarPlanet. Sci. Conf. 35, 1829.
Gounelle, M., Shu, F. H., Shang, H., Glassgold, A. E., Rehm, K. E. and Lee, T.: 2001,Astrophys. J. 548, 1051–1070.
Greaves, J. S.: 2005, Mon. Not. R. Astron. Soc. Letters 364, L47–L50.Greenberg, R., Wacker, J. F., Hartmann, W. K. and Chapman, C. R.: 1978, Icarus 35, 1–26.Grosso, N., Alves, J., Wood, K., Neuhauser, R., Montmerle, T. and Bjorkman, J. E.: 2003,
Astrophys. J. 586, 296–305.Guillot, T.: 1999, Science 286, 72–77.Guillot, T.: 2005, Ann. Rev. Earth Plan. Sci. 33, 493–530.
Guillot, T. and Hueso, R.: 2006, Mon. Not. R. Astron. Soc. 367, L47–L51.Guilloteau, S., Dutrey, A. and Simon, M.: 1999, Astr. Astrophys. 348, 570–578.Haisch, K. E., Lada, E. A. and Lada, C. J.: 2001, Astrophys. J. Lett. 553, L153–L156.Hale, C. J. and Dunlop, D.: 1984, Geophys. Res. Lett. 11, 97–100.
Halliday, A. N., Wanke, H., Birck, J. L. and Clayton, R. N.: 2001, Space Sci. Rev. 96, 1–34.Harker, D. E. and Desch, S. J.: 2002, Astrophys. J. Lett. 565, L109–L112.Harris, M. J., Knodlseder, J., Jean, P., Cisana, E., Diehl, R., Lichti, G. G., Roques, J.-P.,
Schanne, S. and Weidenspointner, G.: 2005, Astron. Astrophys. 433, L49–L52.Hayashi, C.: 1966, Ann. Rev. Astron. Astrophys. 4, 171–192.
92 THIERRY MONTMERLE ET AL.

Hayashi, C.: 1981, Prog. Theor. Phys. 70(Suppl.), 35–53.Hayashi, M., Shibata, K. and Matsumoto, R.: 2000, Adv. Sp. Res. 26, 567–570.
Heiles, C., Haffner, L. M., Reynolds, R. J. and Tufte, S. L.: 2000, Astrophys. J. 536, 335–346.Hester, J. J. and Desch, S.: 2005, in A. N. Krot and E. R. D. Scott and B. Reipurth (eds.),
Chondrites and the Protoplanetary Disk. ASP Conf series, vol. 341, pp. 107–130.
Hewins, R. H.: 1997, Ann. Rev. Earth Planet. Sci. 25, 61–83.Hewins, R. H., Connolly, H. C. Jr., Lofgren, G. E. and Libourel, G.: 2005, in A. N. Krot, E.
R. D. Scot and B. Reipurth (eds.), Chondrites and the Protoplanetary Disk. ASP Conf.Series, vol. 341, pp. 286–316.
Hillenbrand, L. A.: 1997, Astron. J. 113, 1733–1768.Hillenbrand, L. A.: 2006, in Livio M. (ed.), A Decade of Discovery: Planets Around Other
Stars. STScI Symposium Series 19, in press.
Huss, G. R. and Tachibana, S.: 2004, Lunar Planet. Sci. Conf. 35, 1811.Ida, S., Canup, R. M. and Stewart, G. R.: 1997, Nature 389, 353–357.Ida, S. and Makino, J.: 1993, Icarus 106, 210–227.
Ilgner, M. and Nelson, R. P.: 2006, Astron. Astrophys. 445, 205–222.Johns-Krull, C. M. and Gafford, A. D.: 2002, Astrophys. J. 573, 685–698.Kessler-Silacci, J. E., Augereau, J.-C. and Dullemond, C. P. et al.: 2006, Astrophys. J. 639,
275–291.Kleine, T., Metzger, K. and Palme, H.: 2005, Lunar Planet. Sci. 36, 1940, CD-ROM.Kleine, T., Munker, C., Mezfer, K. and Palme, H.: 2002, Nature 418, 952–955.Kokubo, E. and Ida, S.: 1998, Icarus 131, 171–178.
Kokubo, E., Ida, S. and Makino, J.: 2000, Icarus 148, 419–436.Kroupa, P.: 2002, Science 295, 82–91.Krumholz, M. R., McKee, C. F. and Klein, R. I.: 2005, Nature 438, 332–334.
Kunz, J., Staudacher, T. and Allegre, C. J.: 1998, Science 280(5365), 877–880.Laskar, J. and Robutel, P.: 1993, Nature 361, 608–612.Lee, D. C. and Halliday, A.: 1995, Nature 378, 771–774.
Lee, T., Shu, F. H., Shang, H., Glassgold, A. E. and Rhem, K. E.: 1998, Astrophys. J. 506,898–912.
Lissauer, J.: 1987, Icarus 69, 249–265.
Lyo, A.-Ran, Lawson, W. A., Mamajek, E. E., Feigelson, E. D., Sung, Eon-Chang andCrause, L. A.: 2003, Mon. Not. R. Astron. Soc. 338, 616–622.
MacPherson, G. J., Davis, A. M. and Zinner, E. K.: 1995, Meteoritics 30, 365–386.MacPherson, G. J. and Huss, G. R.: 2003, Geochim. Cosmochim. Acta 67, 3165–3179.
Matsumura, S. and Pudritz, R. E.: 2006, Mon. Not. R. Astron. Soc. 365, 572–584.Matsumoto, R., Machida, M., Hayashi, M. and Shibata, K.: 2000, Progr. Th. Phys.
138(Suppl.), 632–637.
Matzner, C. D. and McKee, C. F.: 2000, Astrophys. J. 545, 364–378.Megeath, S. T., Hartmann, L., Luhman, K. L. and Fazio, G. G.: 2005, Astrophys. J. Lett. 634,
L113–L116.
Manhes G., Gopel C. and Allegre C. J.: 1988, Comptes Rendus de l’ATP Planetologie, 323–327.
Marty, B. and Marti, K.: 2002, Earth Plan. Sci. Letts. 196(3–4), 251–263.Masset, F., Morbidelli, A., Crida, A. and Ferreira, J.: 2006, Astrophys. J. 642, 478–487.
Masset, F. and Snellgrove, M.: 2001, Mon. Not. R. Astron. Soc. 320, L55–L59.McKeegan, K. D. and Davis, A. M.: 2003, in H. Holl and K. Turekian (eds.), Treatise on
Geochemistry, Elsevier-Pergamon, Oxford, pp. 431–460.
McKeegan, K. D., Chaussidon, M. and Robert, F.: 2000, Science 289, 1334–1337.
93SOLAR SYSTEM FORMATION AND EARLY EVOLUTION

Meyer, B. S.: 2005, in A. N. Krot, E. R. D. Scott and B. Reipurth (eds.), Chondrites and theProtoplanetary Disk, ASP Conf series, vol. 341, pp. 515–526.
Micela, G. and Favata, F.: 2005, Sp. Sci. Rev. 108, 577–708.Montmerle, T.: 1979, Astrophys. J. 231, 95–110.Montmerle, T.: 2002, New Astr. Rev. 46, 573–583.
Montmerle, T.: 2005, in M. Gargaud, B. Barbier, H. Martin and J. Reisse (eds.), Lectures inAstrobiology, Springer, Heidelberg, pp. 27–59.
Morbidelli, A. and Levison, H. F.: 2004, Astron. J. 128, 2564–2576.Mostefaoui, S., Kita, N. T., Togashi, S., Tachibana, S., Nagahara, H. and Morishita, Y.:
2002, Meteoritics Planet. Sci. 37, 421–438.Mostefaoui, S., Lugmair, G. W., Hoppe, P. and El Goresy, A.: 2004, New Astron. Rev. 48,
155–159.
Motte, F., Andre, P. and Neri, R.: 1998, Astron. Astrophys. 336, 150–172.Muzerolle, J., Calvet, N. and Hartmann, L.: 2001, Astrophys. J. 550, 944–961.Natta, A., Testi, L., Calvet, N., Henning, Th., Waters, R. and Wilner, D.: 2006, in: B.
Reipurth (ed.), Protostars and Planets V. Tucson, University of Arizona Press, in press(eprint arXiv:astro-ph/0602041).
Nelson, R. P.: 2005, Astron. Astrophys. 443, 1067–1085.
Ozawa, H., Grosso, N. and Montmerle, T.: 2005, Astron. Astrophys. 429, 963–975.Padoan, P., Jimenez, R., Juvela, M. and Nordlund, A.: 2004, Astrophys. J. 604, L49–L52.Pahlevan, K. and Stevenson, D. J.: 2005, Lunar Planet. Sci. Conf. 36, 1505.Palla, F. and Stahler, S. W.: 1999, Astrophys. J. 525, 772–783.
Petit, J.-M., Morbidelli, A. and Chambers, J.: 2001, Icarus 153, 338–347.Pety, J. and Falgarone, E.: 2003, Astron. Astrophys. 412, 417–430.Podolak, M.: 2003, Icarus 165, 428–437.
Podosek, F. A., Zinner, E. K., MacPherson, G. J., Lundberg, L. L., Brannon, J. C. and Fahey,A. J.: 1991, Geochim. Cosmochim. Acta 55, 1083–1110.
Pollack, J. B., Hubickyj, O., Bodenheimer, P., Lissauer, J. J, Podolak, M. and Greenzweig, Y.:
1996, Icarus 124, 62–85.Poppe, T. and Blum, J.: 1997, Adv. Space. Res. 20, 1595–1604.Poppe, T., Blum, J. and Henning, T.: 2000, Astophys. J. 533, 454–471.
Reipurth, B. and Bally, J.: 2001, Ann. Rev. Astron. Astrophys. 39, 403–455.Ryter, C.: 1996, Astr. Sp. Sci. 236, 285–291.Sasaki, T. and Abe, Y.: 2004, Lunar Planet. Sci. Conf. 35, 1505.Shang, H., Glassgold, A. E., Shu, F. H. and Lizano, S.: 2002, Astrophys. J. 564, 853–876.
Shu, F. H., Adams, F. C. and Lizano, S.: 1987, Ann. Rev. Astron. Astrophys. 25, 23–81.Shu, F. H., Shang, H., Glassgold, A. E. and Lee, T.: 1997, Science 277, 1475–1479.Stelzer, B. and Neuhauser, R.: 2001, Astron. Astrophys. 377, 538–556.
Stolper, E. and Paque, J. M.: 1986, Geochim. Cosmochim. Acta 50, 1785–1806.Tanga, P., Babiano, A., Dubrulle, B. and Provenzale, A.: 1996, Icarus 121, 158–177.Thommes, E. W., Duncan, M. J. and Levison, H. F.: 2003, Icarus 161, 431–455.
Throop, H. B. and Bally, J.: 2005, Astrophys. J. 623, L149–L152.Tsujimoto, M., Feigelson, E. D., Grosso, N., Micela, G., Tsuboi, Y., Favata, F., Shang, H.
and Kastner, J. H.: 2005, Astrophys. J. Suppl. Ser. 160, 503–510.Wasserburg, G. J.: 1987, Earth Plan. Sci. Lett. 86, 129–173.
Weidenschilling, S. J.: 1977, Mon. Not. R. Astron. Soc. 180, 57–70.Weidenschilling, S. J.: 1980, Icarus 44, 172–189.Wetherhill, G. W.: 1980, Ann. Rev. Astron. Astrophys. 18, 77.
Wetherhill, G. W.: 1990, Ann. Rev. of Earth Plan. Sciences 18, 205–256.
94 THIERRY MONTMERLE ET AL.

Yin, Q., Jacobsen, S. B., Yamashita, K., Telouk, P., Blichert-Toft, J. and Albarede, F.: 2002,Nature 418, 949–952.
Yokochi, R. and Marty, B.: 2005, Earth Plan. Sci. Letts 238, 17–30.Young, E. D., Simon, J. I., Galy, A., Russell, S. S., Tonui, E. and Lovera, O.: 2005, Science
308, 223–227.
Yoshihara, A. and Hamano, Y.: 2004, Precambr. Res. 131, 111–142.Zanda, B.: 2004, Earth Planet. Sci. Lett. 224, 1–17.
95SOLAR SYSTEM FORMATION AND EARLY EVOLUTION
4. Building of a Habitable Planet
HERVE MARTINLaboratoire Magmas et Volcans, Universite Blaise Pascal, Clermont-Ferrand, France
(E-mail: [email protected])
FRANCIS ALBAREDEEcole Normale Superieure, Lyon, France
(E-mail: [email protected])
PHILIPPE CLAEYSDGLG-WE, Vrije Universiteit Brussel, Brussels, Belgium
(E-mail: [email protected])
MURIEL GARGAUDObservatoire Aquitain des Sciences de l’Univers, Universite Bordeaux 1, Bordeaux, France
(E-mail: [email protected])
BERNARD MARTYEcole Nationale Superieure de Geologie, Nancy, France
(E-mail: [email protected])
ALESSANDRO MORBIDELLIObservatoire de la Cote d’Azur, Nice, France
(E-mail: [email protected])
DANIELE L. PINTIGEOTOP-UQAM-McGill, Universite du Quebec a Montreal, Montreal, Qc, Canada
(E-mail: [email protected])
(Received 1 February 2006; Accepted 4 April 2006)
Abstract. Except the old Jack Hills zircon crystals, it does not exit direct record of the first 500 Ma of the
Earth history. Consequently, the succession of events that took place during this period is only indirectly
known through geochemistry, comparison with other telluric planets, and numerical modelling. Just after
planetary accretion several episodes were necessary in order to make life apparition and development
possible and to make the Earth surface habitable. Among these stages are: the core differentiation, the
formation of a magma ocean, the apparition of the first atmosphere, oceans and continents as well as the
development of magnetic field and of plate tectonics. In the same time, Earth has been subject to extra-
terrestrial events such as the Late Heavy Bombardment (LHB) between 3.95 and 3.8 Ga. Since
4.4–4.3 Ga, the conditions for pre-biotic chemistry and appearance of life were already met (liquid water,
continental crust, no strong meteoritic bombardment, etc...). This does not mean that life existed as early,
but this demonstrates that all necessary conditions assumed for life development were already present on
Earth.
Keywords: Hadean, Archaean, continental growth, atmosphere and ocean formation, Late Heavy
Bombardment
Earth, Moon, and Planets (2006) 98: 97–151 � Springer 2006
DOI 10.1007/s11038-006-9088-4

After planetary accretion several stages were necessary in order to makelife apparition and development possible, in other words to make the Earthsurface habitable. Among these stages are: the differentiation of Earthsurface, the apparition of the first atmosphere, oceans and continents as wellas the development of magnetic field and of plate tectonics.
4.1. Terrestrial Differentiation
FRANCIS ALBAREDE
The Earth’s primordial mineralogical composition and structure as well asthe petrological nature of its surface are totally unknown. Plate tectonics,mountain building and erosion have long ago destroyed any geological re-cord of this period. As developed in part 4.3, the oldest terrestrial material isa mineral, a zircon from Jack Hills (Australia), dated at 4.4 Ga, the oldestrock we can hold in our hand is a 4.1 Ga old gneiss from Acasta (Canada)and the oldest terrestrial swath of continental crust large enough for a fieldgeologist to pace is 3.8 Ga old and located at Isua (Greenland), (Figure 4.1and part 4.3). In order to understand when and how quickly the moderndichotomy between continental and oceanic crusts has emerged and whetherit is relevant to the dynamics of the early Earth and the origin of life, we needto understand the structure of the planet left to us at the end of planetaryaccretion. To assist us in this task, we can rely on the oldest terrestrial
Figure 4.1. Simplified map showing the emplacement of the localities where very old conti-nental crust has been dated. Exposed Archaean terranes are in red, and areas underlain byArchaean rocks are in orange.
98 HERVE MARTIN ET AL.

material, but as explained in part 4.3, the record until 700 Ma after theEarth’s formation comes out rather blurred. We can also proceed bycomparison with other planets which have not apparently been as completelyresurfaced as the Earth. First and foremost, intense cratering attests to theantiquity of the surface of both Mars and the Moon, while under similarstandard, Venus’s surface is young. Radiometric ages of Martian and Lunarsamples are occasionally old, which supports cratering evidence, similarlychronological data on extinct radioactivities also supported the early Earthdifferentiation hypothesis. The parent body of some basaltic meteorites(Eucrites Parent Body = EPB) is also a particularly old object that canprovide valuable information on the early inner solar system.
4.1.1. BULK COMPOSITION OF THE EARTH (�4.568 GA1)
In order to understand how the Earth formed, it is first necessary to estimate‘what’ our planet is made of. Our current knowledge of the Earth’s com-position is based on a number of observations and constrained by a numberof deductions from our understanding of solar system formation processes:
• The composition of the most primitive carbonaceous chondrites (CI) is(except for gas, mainly H and He) identical to that of the solarphotosphere. Any other type of meteorite has lost a substantial fractionof volatile elements (i.e. H2O, K, Cl, S) due to the radiative activity ofthe young Sun, (most likely during its T-Tauri phase), and during themetamorphic alteration of the meteorite parent body.
• Planetary accretion is a quick process: the giant planets (Jupiter–type)are essentially gaseous and must form before the end of the T-Tauriphase (few Ma) which blew off all the nebular gas. Modern meteoritechronology using U-Pb and extinct radioactivity supports this scenario.
• Exchange of material across the solar system is very active, notably fedby the destabilization of planetary embryo orbits by Jupiter.
• Primordial material cruising around the Earth has a very limited lifeexpectancy in orbit (<100 Ma).
These simple guidelines lead to the conclusion that, if the Earth accretedmostly from local material, our planet must be strongly depleted in volatileelements and consequently its interior must be particularly dry. Suchdepletion can be illustrated using alkali element ratio: in CI carbonaceouschondrites, K/U = 60,000 (refractory U is used as a reference), comparedwith 12,000 in the Earth, and 3000 in the Moon (Taylor, 2001). On the otherhand, since a long time, it has been noticed that the modern 87Sr/86Sr of theEarth (�0.7045) is much too unradiogenic with respect to 87Rb/86Sr in
1 The age of Earth formation (t0) has been chosen as 4568±1 Ma (Amelin et al., 2002; Bouvier et al.,
2005).
99BUILDING OF A HABITABLE PLANET

chondrites; which points to Earth depletion in Rb (Gast, 1960). The Earthmainly formed from dry, volatile-element depleted indigenous material whichis no longer available for analysis. Undepleted ‘wet’ material (ice-coveredasteroids, comets) occasionally thrown off out of the outer solar system byJupiter has been added providing the ‘veneer’ required by the geochemistry ofplatinum group elements and adding at the same time the water necessary toform the terrestrial ocean. Consequently, Earth probably formed by accu-mulation of planetary embryos of different sizes; the ultimate collision beingthe Moon-forming event resulting of the impact of the Mars-size embryowith the Earth.
In addition, oxygen isotopic ratios indicate that Earth’s brew was a specialone (Clayton, 1993). From one object to another, isotopic abundances canvary for three reasons:
(1) Thermodynamic fractionation, due to a temperature-dependent popu-lation of vibrational modes, in a common stock and which shows asmooth dependence with mass; the consistency of d17O–d18O values isthe base for assigning different meteorites to a single planetary body,notably Mars (SNC) and the eucrite–howardite–diogenite parent body;
(2) The survival of poorly mixed different nucleosynthetic components, asin refractory inclusions;
(3) Radiogenic ingrowths in systems with different parent/daughter ratios.Both cases (1) and (2) are very clearly shown in a d17O–d18O plot
(Figure 4.2). There, the Earth and the Moon lie on a same fractionationline with the predicted slope of 0.5. This coincidence is one of thestrongest arguments in favour of the two bodies having accreted onadjacent orbits. Only few CI carbonaceous chondrites and the enstatiteordinary chondrites lie on the terrestrial fractionation line, which gave riseto the conjecture that the Earth may be made of enstatite chondrites(Javoy, 1995). The D17O elevation of the points representing the differentplanetary objects above the Earth–Moon fractionation line is a measureof their nucleosynthetic 16O excess and indicates by how much theirconstituting material differed from Earth: oxygen being the most abun-dant element in the rocky planets, this difference should not be takenlightly.
4.1.2. ENERGETIC OF PLANETARY DIFFERENTIATION PROCESSES
Upon contraction of the solar nebula and collapse of the disk onto itsequatorial plane, dust and particles collide with each other. Shock wavesemitted by the contracting Sun are now thought to be largely responsible forthe melting of chondrules (Hood and Horanyi, 1993). The presence of the
100 HERVE MARTIN ET AL.
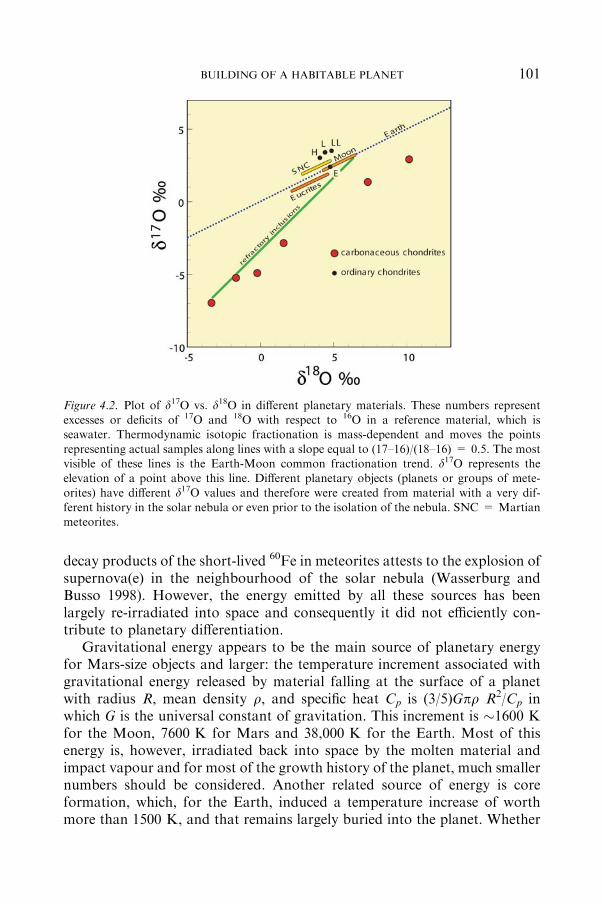
decay products of the short-lived 60Fe in meteorites attests to the explosion ofsupernova(e) in the neighbourhood of the solar nebula (Wasserburg andBusso 1998). However, the energy emitted by all these sources has beenlargely re-irradiated into space and consequently it did not efficiently con-tribute to planetary differentiation.
Gravitational energy appears to be the main source of planetary energyfor Mars-size objects and larger: the temperature increment associated withgravitational energy released by material falling at the surface of a planetwith radius R, mean density q, and specific heat Cp is (3/5)Gpq R2/Cp inwhich G is the universal constant of gravitation. This increment is �1600 Kfor the Moon, 7600 K for Mars and 38,000 K for the Earth. Most of thisenergy is, however, irradiated back into space by the molten material andimpact vapour and for most of the growth history of the planet, much smallernumbers should be considered. Another related source of energy is coreformation, which, for the Earth, induced a temperature increase of worthmore than 1500 K, and that remains largely buried into the planet. Whether
Figure 4.2. Plot of d17O vs. d18O in different planetary materials. These numbers representexcesses or deficits of 17O and 18O with respect to 16O in a reference material, which isseawater. Thermodynamic isotopic fractionation is mass-dependent and moves the points
representing actual samples along lines with a slope equal to (17–16)/(18–16) = 0.5. The mostvisible of these lines is the Earth-Moon common fractionation trend. d17O represents theelevation of a point above this line. Different planetary objects (planets or groups of mete-
orites) have different d17O values and therefore were created from material with a very dif-ferent history in the solar nebula or even prior to the isolation of the nebula. SNC = Martianmeteorites.
101BUILDING OF A HABITABLE PLANET
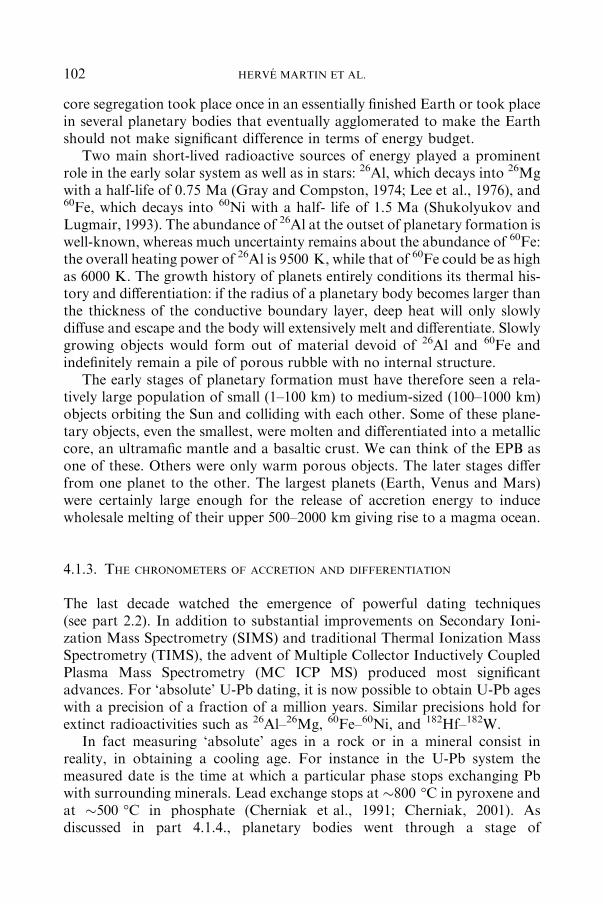
core segregation took place once in an essentially finished Earth or took placein several planetary bodies that eventually agglomerated to make the Earthshould not make significant difference in terms of energy budget.
Two main short-lived radioactive sources of energy played a prominentrole in the early solar system as well as in stars: 26Al, which decays into 26Mgwith a half-life of 0.75 Ma (Gray and Compston, 1974; Lee et al., 1976), and60Fe, which decays into 60Ni with a half- life of 1.5 Ma (Shukolyukov andLugmair, 1993). The abundance of 26Al at the outset of planetary formation iswell-known, whereas much uncertainty remains about the abundance of 60Fe:the overall heating power of 26Al is 9500 K, while that of 60Fe could be as highas 6000 K. The growth history of planets entirely conditions its thermal his-tory and differentiation: if the radius of a planetary body becomes larger thanthe thickness of the conductive boundary layer, deep heat will only slowlydiffuse and escape and the body will extensively melt and differentiate. Slowlygrowing objects would form out of material devoid of 26Al and 60Fe andindefinitely remain a pile of porous rubble with no internal structure.
The early stages of planetary formation must have therefore seen a rela-tively large population of small (1–100 km) to medium-sized (100–1000 km)objects orbiting the Sun and colliding with each other. Some of these plane-tary objects, even the smallest, were molten and differentiated into a metalliccore, an ultramafic mantle and a basaltic crust. We can think of the EPB asone of these. Others were only warm porous objects. The later stages differfrom one planet to the other. The largest planets (Earth, Venus and Mars)were certainly large enough for the release of accretion energy to inducewholesale melting of their upper 500–2000 km giving rise to a magma ocean.
4.1.3. THE CHRONOMETERS OF ACCRETION AND DIFFERENTIATION
The last decade watched the emergence of powerful dating techniques(see part 2.2). In addition to substantial improvements on Secondary Ioni-zation Mass Spectrometry (SIMS) and traditional Thermal Ionization MassSpectrometry (TIMS), the advent of Multiple Collector Inductively CoupledPlasma Mass Spectrometry (MC ICP MS) produced most significantadvances. For ‘absolute’ U-Pb dating, it is now possible to obtain U-Pb ageswith a precision of a fraction of a million years. Similar precisions hold forextinct radioactivities such as 26Al–26Mg, 60Fe–60Ni, and 182Hf–182W.
In fact measuring ‘absolute’ ages in a rock or in a mineral consist inreality, in obtaining a cooling age. For instance in the U-Pb system themeasured date is the time at which a particular phase stops exchanging Pbwith surrounding minerals. Lead exchange stops at �800 �C in pyroxene andat �500 �C in phosphate (Cherniak et al., 1991; Cherniak, 2001). Asdiscussed in part 4.1.4., planetary bodies went through a stage of
102 HERVE MARTIN ET AL.

metamorphic heating or even wholesale melting which may have lastedseveral million years. External (whole-rock) Pb–Pb isochrons potentially datethe original U/Pb fractionation stage, such as the segregation of metal (core)from the silicate minerals and melts (mantle and crust) or the differentiationof different objects in the planet (mantle, crust). This technique howeverrelies on a stringent assumption not necessarily met in natural objects: all thesamples dated must have formed at precisely the same time and they had thesame Pb isotope composition at that time, which is only likely to happen forsamples with strong genetic relationships.
In contrast, extinct radioactivities date the extraction of material from thenebula (see part 2.2). Observing in a particular mineral an excess or a deficitwith respect to the chondritic reference of a radiogenic nuclide, (i.e. 26Al fi26Mg), signals that the host rock picked up Al from the solar nebula at thetime 26Al still existed. The excess may vanish during metamorphic pertur-bation or melting, but it cannot be created after 26Al has disappeared.
Because of the distinctive geochemical behaviour of the parent anddaughterisotopes, different extinct radioactivities reflect different planetary events:
• The fastest accretion chronometers 26Al–26Mg (T1/2 = 0.75 Ma) and60Fe–60Ni (T1/2 = 1.5 Ma) date extraction of the planetary materialfrom the nebula.
• Preferential uptake of W and Ag by metal makes the 182Hf–182W(T1/2 = 8.9 Ma) and 107Pd–107Ag (T1/2 = 6.5 Ma) pairs ideal to dateplanetary core formation.
• Fractionation of the lithophile (silicate-loving) elements makes the146Sm–142Nd chronometer (T1/2 = 103 Ma) suitable for the first 100’s ofMa of planetary evolution, in particular with respect to the existence of amagma ocean (see below).
4.1.4. PETROLOGY OF PLANETARY DIFFERENTIATION
The Earth, Moon, Mars, Venus are all differentiated planets, which indicatesthat they went through a molten stage with ensuing core-mantle mantle-crustsegregation. Planetary differentiation is the outcome of phase separation,metal-silicate first, then mineral-liquid silicates. Regardless of the composi-tion of the molten planets, the mineral phases in equilibrium with most meltsare fortunately few: olivine, three pyroxenes, an Al-bearing phase, andilmenite. At higher pressures typical of the terrestrial mid-mantle, otherphases such as perovskite may be present but their incidence on planetarydifferentiation is unclear.
Plagioclase stability is a parameter that plays a prominent role in plane-tary differentiation (Figure 4.3). Among Al-bearing phases stable in mantle
103BUILDING OF A HABITABLE PLANET
conditions, plagioclase is the only one stable at the lower pressure andconsequently at shallowest depth. Plagioclase has three important propertiesrelated to its loose structure: (a) contrary to any other mantle phase, it is lessdense that the parent melt where it crystallizes and therefore it floats to thesurface instead of sinking; (b) it is fairly compressible and for that reasonbecomes more soluble in melt as pressure increases; (c) it more likely pre-cipitates in dry melts rather than in hydrous melts. On a planet, plagioclasestability is first modulated by gravity: pressure is proportional to gravityacceleration g and g=(4/3)Gpq R: in the Earth, plagioclase production in drymelts extends down to 30 km whereas in the Moon plagioclase is stable up to180 km. In addition, by cutting Si–O–Si bonds to produce Si–OH groups,water breaks down the plagioclase component in melts. Hence, a planet witha strong gravity field (Earth) retained water whereas weak gravity fieldplanets (Moon) are almost dry. Consequently, a molten planet with a deepplagioclase production zone such as the Moon, will produce a thick litho-sphere of buoyant plagioclase-bearing rocks (gabbros, anorthosites), whichwill not be possible on bigger planets (Earth).
A different consequence of a strong gravity and of a wet surface is thehigh-temperature reaction of water with hot mantle and melts. The mostabundant mineral dominating the shallow mantle and precipitating frommagmatic liquids is olivine. It reacts with water to give serpentine at 500 �C,talc and other hydrous minerals at higher temperature. The density of allthese minerals is remarkably low and tends to form a wet lid on top of the hot
Figure 4.3. Solubility of minerals in a basaltic melt as a function of temperature and pressure.
Pressure is proportional to depth, but also to the acceleration of the planet gravity (g). Coolingat low pressure (arrow A), on Vesta or the Moon, for example, leads to the formation of largevolumes of buoyant plagioclase (plagioclase crystallizes before pyroxene) whereas cooling at
higher pressure (arrow B), as in the Earth, where pyroxene crystallizes before plagioclasefavours crystallization of dense olivine and pyroxene.
104 HERVE MARTIN ET AL.

mantle (Boyet et al., 2003). This process also produces enormous quantitiesof hydrogen by damp oxidation of the ferrous component of olivine(fayalite + water fi magnetite + silica + hydrogen) (Barnes and O’Neil,1969; Sleep et al., 2004).
4.1.5. PLANETARY MAGMA OCEANS AND THE SURFACE OF THE PLANETS AT THE
END OF ACCRETION (�4.56 TO �4.45 GA)
The chronological framework emerging from recent data is tightening up.The first planetary objects probably formed shortly before 4.568 Ga (Amelinet al., 2002): the time from the condensation of the first refractory grains tothe accretion of �100 km size objects did not last more than a few Ma(Bizzarro et al., 2004). The smallest objects, such as the parent body of H andL ordinary chondrites, took 5–15 Ma to cool below the phosphate closuretemperature (�500 �C) of Pb (Gopel et al., 1994). From 182Hf–182W evi-dence, terrestrial core formation was nearly complete within 30 Ma aftersolar system isolation (Kleine et al., 2002; Yin et al., 2002b).
By then, most of the terrestrial upper mantle was probably molten as aresult of impacts on a high-gravity planet. The concept of a widespreadmagma ocean, however, goes back to the Moon and the Apollo missions(Wood et al., 1970). The first geochemical observations on lunar basaltsindicated that they formed from a mantle source with an apparent deficit intwo elements concentrated in plagioclase, Eu and Sr. Such a deficit could notresult from solid-state processes and therefore it was argued that the lunarmantle went through a stage of wholesale melting during which enormousamounts of buoyant plagioclase-rich cumulates were floated towards thesurface. Apollo 14 and subsequent missions brought back samples of anor-thosite from the highlands which were identified with these buoyant cumu-lates. Since then, similar observations were made in eucrites. Otherarguments, notably the ubiquity of ilmenite in soil minerals, have been suc-cessfully used to strengthen the hypothesis of a lunar magma ocean.
For decades, the existence of a terrestrial magma ocean met a strongresistance. The main reason was that the mineral assemblage that wouldcrystallize in such a gigantic pool of magma would be less rich in plagioclasethan the lunar highlands and would mostly contain minerals whose density isgreater than magma density; therefore it would sink as it forms, letting heatescape so fast that the magma ocean would freeze on time scales of104)106 years. This interpretation, however, ignores the existence of Earth’shydrosphere, a term which loosely bounds liquid water, vapour and gas. It isa modern concept based on orbital dynamics and on D/H ratios across thesolar system that water was added to the surface from the outer solar system(Morbidelli et al., 2000). The interior of the Earth was nearly dry. Reaction
105BUILDING OF A HABITABLE PLANET

between any form of water with rocks of mantle or even basaltic compositionforms buoyant hydrous minerals (i.e. serpentine). These rocks, transformedinto serpentinite, form rafts covering the magma surface and drasticallyreducing heat radiation into space. In 2003, the case for a terrestrial magmaocean was bolstered by the discovery of 142Nd anomalies in 3.8 Ga oldbasalts at Isua (Greenland) (Boyet et al., 2003; Caro et al., 2003). Theseanomalies indicate that, 3.8 Ga ago, the mantle source of Isua basalts wasstill preserving the record of a major Sm/Nd fractionation event that tookplace within the first 100 Ma of the Earth’s history. As for the Moon, such afractionation can only be achieved by melt/mineral segregation: the currentinterpretation of these hard-won results is therefore that the 142Nd excessrecords the wholesale melting and crystallization of the terrestrial uppermantle. The case of the magma ocean was further strengthened by Boyet andCarlson (2005) who identified a difference of 142Nd abundances between theEarth’s mantle and crust on the one hand, and chondrites on the other hand;this finding not only demonstrates that the terrestrial mantle was largelymolten �30 Ma after the formation of the solar system, but also that thisevent was accompanied by the irreversible segregation at the base of themantle of some material with properties distinct from those of the rest of themantle. It is remarkable that 142Nd exists in lunar rocks (Nyquist et al., 1995)but they are more subdued than those found for the Isua mantle source,which suggests that, as expected from experimental data, Sm/Nd fraction-ation was reduced by the saturation of the magma with plagioclase andprobably that the magma ocean lasted longer in the Moon than in the Earth.
4.1.6. THE EARLY CRUST: TOWARD PLATE TECTONICS AND CONTINENTS
(4.5–4.4 GA)
The nature of the earliest Earth surface is still in the eye of the beholder.Boyet and Carlson (2005) argue that the difference of 142Nd abundancesbetween the Earth’s mantle and chondrites correspond to the foundering ofthe primordial crust at the core-mantle boundary where it may have formedthe D’’ seismic layer. By 4.5–4.4 Ga, plate tectonics was probably nowhere tobe seen and continental crust in the modern sense could not form. In order tocreate plates, a relatively rigid mantle is needed, which, upon upwellingcreates oceanic crust and its underlying lithosphere. Progressive cooling ofthe lithosphere creates negative buoyancy, which is resisted by plate bendingand mantle viscous drag (Conrad and Hager, 1999). Even if we forget aboutthe details of crust formation, dewatering and /or melting of the sinkingplates seem to be required to form a SiO2-rich crust. None of these charac-teristics are likely to exist on top of a cooling magma ocean overlain by alithospheric lid rich in hydrous Mg-bearing minerals. Stronger constraints on
106 HERVE MARTIN ET AL.
the evolution of the terrestrial magma ocean are a prerequisite to theunderstanding of the initiation of the plate tectonics regime.
To wrap up with some speculations with what the earliest Earth’s surfacemay have looked like, it was probably a mixed bag of basaltic to komatiiticflows erupted over or intruded into hydrous mafic and ultramafic rocks(serpentinite and amphibolite). The topographic lows were covered bywhichever liquid water could condense from the thick dense atmosphere, inwhich nitrogen, ammonia, methane, and water gas dominated. Ammonia andmethane were permanently destroyed by solar irradiation of the upperatmosphere but also permanently produced by widespread serpentinization offreshly erupted magma. Wet rocks flow more easily than their dry equivalent:arguably, by softening the underlying mantle, continuous foundering oflithosphere and its hydrous surface rocks, was instrumental into the transitionto plate tectonics. Wet melts are not prone to plagioclase crystallization:occasional patches of more differentiated rocks (granites and granodiorite)would occur produced by melting of amphibolites sinking locally in theunderlying mantle. They may represent parent rocks for the rare 4.4 Ga oldJack Hill zircons (Wilde et al., 2001): such rocks certainly herald theupcoming plate tectonic regime. The precise timing of the transition is not wellunderstood but substantial progress is being made. The unique 4.4 Ga oldzircon from Jack Hill has typical mantle 18O abundances and may haveformed from mantle-derived magmas (similar zircons are present in Icelandicrhyolites and even in lunar soils). In contrast, most of the d18O values of the‘younger’ 4.3 Ga-old crystals are indistinguishable from those of the moderncontinents and bear the imprint of a source affected by low-temperaturegeological processes (Cavosie et al., 2005). In order to resolve this conun-drum, Harrison et al. (2005) measured the Hf isotope compositions of theoldest Jack Hill zircons; they found evidence of Lu/Hf fractionation typical ofcontinental crust extraction and concluded that the earliest crust formationevents took place between 4.3 and 4.4 Ga ago. Although the transition be-tween the magma ocean stage and plate tectonics may have lasted tens or evenhundreds of million years, the oldest continental crust therefore formed in lessthan 150–200 Ma after the accretion of the planet.
4.2. Late Contributions
4.2.1. ATMOSPHERE
BERNARD MARTY
4.2.1.1. The origin of terrestrial volatilesThe Earth is highly depleted in volatile elements when compared to bodieslocated further away from the Sun, like giant planets or comets. Even
107BUILDING OF A HABITABLE PLANET
asteroids located 2–3 AU from the Sun (the Earth is by definition located at1 AU from the Sun) and which are sampled by meteorites falling onto theEarth are richer in volatile elements like water, carbon, nitrogen, halogensand noble gases. The scarcity of volatile elements may result from thecombination of several factors. The classical condensation model for theformation of the solar system stipulates that the existence of a temperaturegradient in the protosolar nebula would have prohibited condensation ofvolatile elements in the inner solar system. Volatile elements such as raregases, carbon and nitrogen found in carbonaceous chondrites are mostlyhosted by carbonaceous phases which are prone to destruction during hightemperature processes (<1300 K in laboratory experiments under low oxygenfugacity (fO2) and <800 K in oxidizing condition). A fraction of volatileelements found in primitive meteorites is implanted from the solar corpus-cular irradiation, presumably at an early stage of solar activity. These sur-face-sited components are also released at relatively low temperature. Thisview is consistent with the apparent concentration gradient of moderatelyvolatile elements (e.g., alkali elements) among the Earth, Mars, Vesta, or-dinary chondrites and carbonaceous chondrites (see part 4.1.1). However,recent models for the formation of the solar system propose that terrestrialplanets grew up from multiple collisions with smaller bodies, the planetesi-mals. These later, originated from areas much wider than those specific of thedifferent terrestrial planets (Morbidelli, 2002). Thus volatile elementsincluding water could have been carried by impacting bodies originatingfrom area ‘‘wetter’’ than the 1 AU one (Morbidelli et al., 2000) like the outerasteroid belt, and the Kuiper belt. In such a case, the volatile element gra-dient could be somewhat coincidental. The Earth is highly volatile-depleted,which could be the result of the giant lunar impact (see below), Mars couldrepresent an Earth that did not experience such a giant impact, ordinarychondrites could represent non differentiated bodies whereas carbonaceouschondrites could originate from region beyond giant planets like comets. Thisscenario is not without problems. The most important is the similar oxygenisotopic compositions of both the Moon and the Earth, which can hardlyresult from mixing by any collisional process. If we take into account thediversity of O isotopic signatures among planetary bodies, it seems difficult toachieve such a similarity for two bodies formed by a random mix of smallerbodies from different regions of the mid plane.
The energy released by the Moon-forming impact might have degassedvigorously the proto-mantle. Indeed, lunar basalts are desperately dry and donot contain fluid inclusions even in their most refractory minerals, and thepotassium content of the Moon is only half that of the Earth, which is itselfabout half of the chondritic abundance. This event took place within a fewtens of Ma after the solar system started to form. Hence, the fate of terrestrialvolatiles is linked to this destruction, which probably resulted in the blow off
108 HERVE MARTIN ET AL.
of any primitive atmosphere and in degassing of the proto-mantle. However,this degassing might not have been perfect as in the case of the Moon. Someprimordial volatiles (i.e. volatile elements that were never at the Earth’ssurface) remain in the mantle, such as the rare isotope 3He (Clarke et al.,1969; Mamyrin et al., 1969), and a neon component different from atmo-spheric neon and which isotopically resembles to solar neon (Sarda et al.,1988; Marty et al., 1989). The trapping of volatile elements in planetarybodies might have occurred when gas-rich dust coalesced and when it wasburied by newly accreting material. Alternatively, these elements could havebeen ‘‘ingassed’’ from a massive atmosphere into a melted proto-mantle(Mizuno et al., 1980). A third, and not exclusive, possibility is that volatileelements were contributed at a late stage of terrestrial accretion to anessentially volatile-free proto-Earth after the lunar cataclysm. Each type ofmodel has its advantage and inconvenient; in the following we presentarguments mainly based on isotopic signatures, which allow further insightinto both the source of terrestrial volatiles and the timing of their trapping.
Volatile elements in the solar system present a large variety of isotopic andelemental abundances that probably reflects processing in the solar nebula ofan original gas, which is best preserved in the Sun, to some extent in theatmosphere of giant planets, and possibly in some cometary families. Forhydrogen and nitrogen, isotopic variations are so large (a factor 7 for D/Hand a factor 3 for 15N/14N) that mass-dependent fractionation seems difficultto advocate as the main source of isotopic variations. Nucleosyntheticanomalies with much larger effects are found in specific micro-phases ofprimitive meteorites but they cannot account for the mentioned large-scaleisotopic variations in the solar system. Thus, D/H and N isotope variationsmeasured among different reservoirs of the solar system are attributed bydefault to mixing with exotic components isotopically fractionated at very lowtemperature during e.g., ion-molecule exchanges in the interstellar medium.
The diversity of isotopic components for some of the key volatile elementspresents the advantage of allowing insight into the origin of volatile elementstrapped in planetary bodies and their atmospheres. Important advances inour understanding of the origin of atmospheric volatiles have stem from theability to identify volatile elements in the terrestrial system in term of solarversus planetary origin. A pre-requisite for this approach is a good knowl-edge of the isotopic composition of volatile elements in the gas from whichthe solar system formed. The best analogue to this is probably the Sun itself,but our knowledge in this field is still very limited. The isotopic compositionof light noble gases (He, Ne and Ar) has been measured in lunar soilsimplanted by the solar corpuscular irradiation (the low energy solar wind –�1 keV/amu – and more energetic emissions such as solar energetic particle –SEP, up to 1 MeV/amu) and in aluminium foils exposed by Apolloastronauts. These experiments have shown that the solar 20Ne/22Ne ratio is
109BUILDING OF A HABITABLE PLANET
30% lower than the atmospheric 20Ne/22Ne ratio. The isotopic compositionof other volatile elements is not well known and measuring the isotopiccomposition of the solar wind was the goal of the Genesis mission whichcollected the solar wind for 27 months and returned (brutally) irradiatedtargets to the Earth on Sept. 8th, 2004 (to date, the samples have not yet beenanalyzed). The pre-deuterium burning hydrogen isotopic composition of thesolar nebula is known from the D/H and 3He/4He analyses of the atmosphereof Jupiter by the Galileo project (Mahaffy et al., 1998). Studies show that thesolar nebula is depleted by 87% in D relative to terrestrial oceans. Recently,depth profiling analysis of lunar soil grains by ion probe together with singlegrain laser analysis of lunar soils by static mass spectrometry allowedHashizume et al. (2000) to propose that solar nitrogen is depleted by at least24% in 15N relative to terrestrial atmospheric N, a result subsequentlyconfirmed by Galileo data analysis (Owen et al., 2001). These experimentscorroborate that planetary bodies like the Earth and primitive meteorites (seebelow) are enriched in heavy, and rare, isotopes of H, N and Ne relative tothe proto-solar nebula, thus making these elements important tracers ofprovenance for these elements.
A remarkable advance in our knowledge was the discovery of a mantleneon end-member having an isotopic composition similar to that inferred forthe solar nebula (Sarda et al., 1988; Marty et al., 1989; Honda et al., 1991).Solar gas could have been trapped in accreting dust and buried during ter-restrial accretion (Trieloff et al., 2000). However, the efficiency of this processappears too small (by several orders of magnitude) to supply the terrestrialinventory (Podosek and Cassen, 1994). Alternatively, nebular gas could havebeen trapped in the terrestrial mantle by dissolution of a massive, hydrogen-rich, solar-like atmosphere into a melted proto-mantle (Mizuno et al., 1980).The atmospheric pressure necessary to account for the noble gas inventory ofthe mantle is reasonable (few bars up to 100 bars, depending on models –Sasaki and Nakazawa, 1984; Porcelli and Pepin, 2000), and total or partialmelting of the proto-mantle, under a massive atmosphere during accretionappears as realistic. In such a case, the limitation of the process is the lifetimeof the solar nebula, less than 10 Ma at best (Podosek and Cassen, 1994),which imposes the Earth to have grown at a size sufficient enough to retain amassive hydrogen-rich atmosphere during this time interval. It also requiresthe proto-mantle to keep at least partially dissolved solar gases during thelunar cataclysm, despite extensive degassing of lunar material. Dissolution ofsolar noble gases in the core (Tolstikhin and Marty, 1998; Porcelli andHalliday, 2001) might have offered such an harvest and may also account forthe association of solar-like neon with mantle plumes, which source is con-sidered as very deep-seated, at the core-mantle boundary.
Recently, the isotopic composition of neon in the convective mantle whichis the source of mid-ocean ridge basalts has been found to be similar to that
110 HERVE MARTIN ET AL.

of gas-rich meteorites, suggesting a mantle-scaled Ne isotope heterogeneity(Ballentine et al., 2005). It also indicates that a major fraction of terrestrialvolatiles were contributed by chondritic matter, possibly after the Moon-forming event. Dust irradiated by the Sun in the early solar system andsnowing gently at the Earth’s surface could have been the vector of suchcontribution, but in this case, a process able to subduct this dust into themantle without degassing it has to be found. Cold subduction in the Hadeancould have done the job (Tolstikhin and Hofmann, 2005), but the occurrencefor such a process is highly speculative.
Other sources than the solar nebula, are also required in order to matchthe isotopic composition of hydrogen and nitrogen in both terrestrialatmosphere and oceans. The D/H ratio of the oceans water (150 · 10)6)coincides with the average value of primitive meteorites and is 7 times thenebular ratio (Robert et al., 2000). In addition, the atmosphere is enriched in15N relative to what has been claimed to be the signature of the proto-solarnebula (Hashizume et al., 2000). Such isotopic ratios are inconsistent withdirect derivation from the solar nebula, but are consistent with a chondriticorigin (Dauphas et al., 2000). Thus, in addition to a solar nebula contribu-tion whose remnant is found in the deep mantle, another component likelycarried by planetary bodies such as meteorites has contributed to the mantleinventory of volatile elements. It seems logical to consider that this contri-bution took place after the Moon-forming event because, as argued above,such event resulted in a drastic degassing of the mantle, only its deepestregions or the core having kept a record of the solar nebula.
4.2.1.2. Early evolution of the atmosphereAtmospheric erosion due to large impacts could have played a significant rolein reducing the atmospheric reservoir. Indeed, the speed of ground on the otherside of the Earth due to a major collision might have exceeded the liberationspeed of 11 km/s for the Earth and therefore triggered major atmosphere (andocean) loss. However, the efficiency of this process in the Hadean is subject todiscussion as it is unclear if the contribution of volatile elements by theimpactors exceeded or not the loss of these elements. A potentially efficientprocess consists in gravitational escape of light elements, enhanced by thephoto-dissociation of water by UV from the young sun, into molecularhydrogen and atomic H, and escape of the latter (Hunten et al., 1987). The so-called hydrodynamic escape process is able to drag atoms and moleculesheavier thanH, so that the escape of volatile elements from the atmosphere willlast during the enhancedUVflux period, which could have lasted up to 150 Main the case of weak T-Tauri phase (Pepin, 1991). Atmospheric escape takesplace when the velocity of gaseous atoms exceeds the liberation velocity for theplanet, and is therefore favoured by high atmospheric temperature. Here too,giant collisions might have played a role by increasing the latter.
111BUILDING OF A HABITABLE PLANET

The study of extinct radioactivities provides evidence that the atmospherewas open to loss to space during the Hadean. The amount of radiogenic 129Xegenerated by decay of 129I and of 131–136Xe from the fission of 244Pu onlyrepresents a fraction of the total Xe isotopes generated by the decays of theseelements in bulk Earth. Degassing of the mantle during the Hadean canperfectly account for the depletion of this reservoir in Xe isotopes. However,the atmosphere must also have lost most of radiogenic and fissiogenic Xeisotopes. Taking into account the half-life of 244Pu (82 Ma), such a lost musthave lasted for at least 200 Ma, possibly up to 600 Ma (Tolstikhin andMarty,1998). Some of the atmospheric noble gases are severely isotopically massfractionated compared to potential precursors (solar or asteroidal compo-nents), which suggests independently escape from the atmosphere thatfavoured light isotopes relative to heavy ones. As discussed above,atmospheric neon is depleted by 30% in the light 20Ne isotope relative to 22Newhen compared to mantle neon, a difference that might have arisen frommassfractionation during atmospheric loss. However, several meteoritic Ne dataencompass the atmospheric isotopic ratio, leaving open the possibility that airNe was contributed by asteroidal bodies (Marty, 1989). Xenon, which is theheaviest noble gas, is severely fractionated by 3% per amu relative to solar orasteroidal precursors, which is fully consistent with isotope fractionationduring hydrodynamic escape (Sasaki and Nakasawa, 1988). However, theproblem with this element is that it is also elementally depleted relative tolighter noble gases, e.g., the atmospheric Xe/Kr ratio is 5 times lower than thechondritic Kr/Xe ratio, exactly the opposite of what would be expected fromXe isotopes. This long-standing problem, known as the xenon paradox,indicates that the early evolution of the atmosphere was probably verycomplex and involved several episodes of exchanges between the mantle, theatmosphere, the outer space and some of the precursors (Pepin, 1991;Tolstikhin and Marty, 1998). In this respect, comets that may be depleted inXe might have contributed lighter volatile elements whereas a residue ofisotopically fractionated Xe attested previous episodes of atmospheric loss(Dauphas, 2003).
The role of comets in supplying volatile elements to the early Earth hasbeen often advocated. Indeed, it seems that, when compared to inner regionsof the solar system, the Kuiper belt has a mass deficit, which is interpreted asreflecting a depletion of bodies due to gravitational perturbations by giantplanets, or to the existence of a yet undiscovered Mars-sized planet that lateron disaggregated, or to external factors like the transit of a nearby star. Smallbodies caught in resonance from nearby giant planets are ejected and part ofthem falls towards the inner solar system. As a result, one would expect theinner solar system to be battered by cometary objects ejected from outerregions of the solar system and providing volatile elements to terrestrialplanets. Cometary data prone to investigate quantitatively this possibility are
112 HERVE MARTIN ET AL.
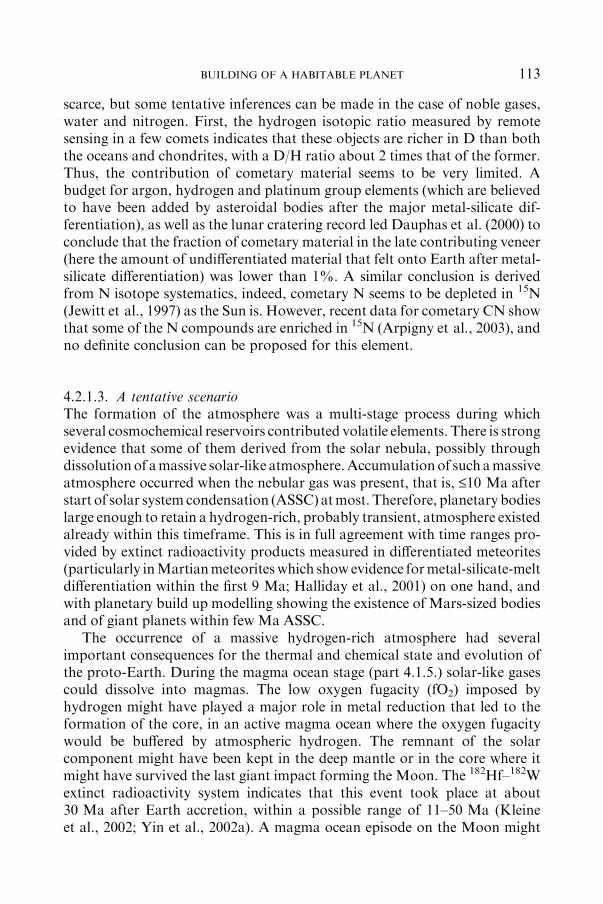
scarce, but some tentative inferences can be made in the case of noble gases,water and nitrogen. First, the hydrogen isotopic ratio measured by remotesensing in a few comets indicates that these objects are richer in D than boththe oceans and chondrites, with a D/H ratio about 2 times that of the former.Thus, the contribution of cometary material seems to be very limited. Abudget for argon, hydrogen and platinum group elements (which are believedto have been added by asteroidal bodies after the major metal-silicate dif-ferentiation), as well as the lunar cratering record led Dauphas et al. (2000) toconclude that the fraction of cometary material in the late contributing veneer(here the amount of undifferentiated material that felt onto Earth after metal-silicate differentiation) was lower than 1%. A similar conclusion is derivedfrom N isotope systematics, indeed, cometary N seems to be depleted in 15N(Jewitt et al., 1997) as the Sun is. However, recent data for cometary CN showthat some of the N compounds are enriched in 15N (Arpigny et al., 2003), andno definite conclusion can be proposed for this element.
4.2.1.3. A tentative scenarioThe formation of the atmosphere was a multi-stage process during whichseveral cosmochemical reservoirs contributed volatile elements. There is strongevidence that some of them derived from the solar nebula, possibly throughdissolutionof amassive solar-like atmosphere.Accumulationof such amassiveatmosphere occurred when the nebular gas was present, that is, £10 Ma afterstart of solar system condensation (ASSC) atmost. Therefore, planetary bodieslarge enough to retain a hydrogen-rich, probably transient, atmosphere existedalready within this timeframe. This is in full agreement with time ranges pro-vided by extinct radioactivity products measured in differentiated meteorites(particularly inMartianmeteoriteswhich show evidence formetal-silicate-meltdifferentiation within the first 9 Ma; Halliday et al., 2001) on one hand, andwith planetary build up modelling showing the existence of Mars-sized bodiesand of giant planets within few Ma ASSC.
The occurrence of a massive hydrogen-rich atmosphere had severalimportant consequences for the thermal and chemical state and evolution ofthe proto-Earth. During the magma ocean stage (part 4.1.5.) solar-like gasescould dissolve into magmas. The low oxygen fugacity (fO2) imposed byhydrogen might have played a major role in metal reduction that led to theformation of the core, in an active magma ocean where the oxygen fugacitywould be buffered by atmospheric hydrogen. The remnant of the solarcomponent might have been kept in the deep mantle or in the core where itmight have survived the last giant impact forming the Moon. The 182Hf–182Wextinct radioactivity system indicates that this event took place at about30 Ma after Earth accretion, within a possible range of 11–50 Ma (Kleineet al., 2002; Yin et al., 2002a). A magma ocean episode on the Moon might
113BUILDING OF A HABITABLE PLANET

have lasted 45 Ma, and on Earth, it might have been much longer fromobvious thermal consideration. The 129I–244Pu–129Xe–136Xe systems haverecorded a mantle closure time at about 60–70 Ma ASSC (Yokochi et al.,2005) which might correspond to a strong decline in large-scale magma oceanepisodes.
Presumably, later on, the proto-mantle was contributed by meteoritic Ne,water, nitrogen and other volatile elements (C, other noble gases). Comparedto sun, planetary material (e.g., meteorites, asteroids) is highly depleted innoble gases (relative to H, C, N etc.), such that contribution of this materialwould dominate the budget of major volatiles without overprinting noble gascharacteristics inherited from previous processes. Thus, isotopic fraction-ation related to atmospheric escape is recorded in noble gases whereas themajor volatile element isotopic ratios (e.g., D/H, 13C/12C, 15N/14N) have kepta less disturbed record of their chondritic origin.
The study of extinct radioactivities involving volatile elements like Xedemonstrates that the early atmosphere was open to loss in space duringlong time intervals, possibly covering the whole Hadean. The Hadean mantlewas also very active, convecting at a rate one order of magnitude or morehigher than at Present, as indicated by the extensive loss of fissiogenic Xefrom 244Pu (half-life of 82 Ma) which occurred well before the loss of iso-topes produced by long-lived radioactivities like 40Ar or 4He (Yokochi et al.,2005).
The amount of nitrogen and water that was supplied by ‘‘late’’ contri-bution (i.e. after the last global metal-silicate segregation) of asteroidalmaterial, as estimated from the platinum group element (PGE) budget of themantle, is consistent,(within a 2–3 times range) with the terrestrial inventoryof oceans and atmosphere (Dauphas et al., 2000; Dauphas and Marty, 2002).Part of water and nitrogen might have been cycled through time between themantle and the surface, so that the match between the PGE budget and thesurface inventory is fairly good (Figure 4.4). This implies that the mainvolatile elements that are present in the atmosphere and in the oceans couldhave been carried by ‘‘late’’ veneer contributions having taken place pre-sumably after the Moon-forming event. It is unclear if these contributionswere the product of big impacts or were delivered by snowing dust. The lattercould have been efficient in providing part of (Marty et al., 2005), or evenmost of, volatile elements present in the atmosphere and the oceans(Maurette, 1998).
The amount of CO2 assumed to be contributed by this veneer is com-parable to the quantity of carbonates trapped in sediments. The latter isprobably a lower limit of the carbon inventory since today, due to recycling;the Earth mantle contains a significant fraction of carbon. The calculatedequivalent partial pressure of CO2 is about 100 atmospheres, which iscomparable to that observed today in Venus atmosphere. Such CO2 partial
114 HERVE MARTIN ET AL.
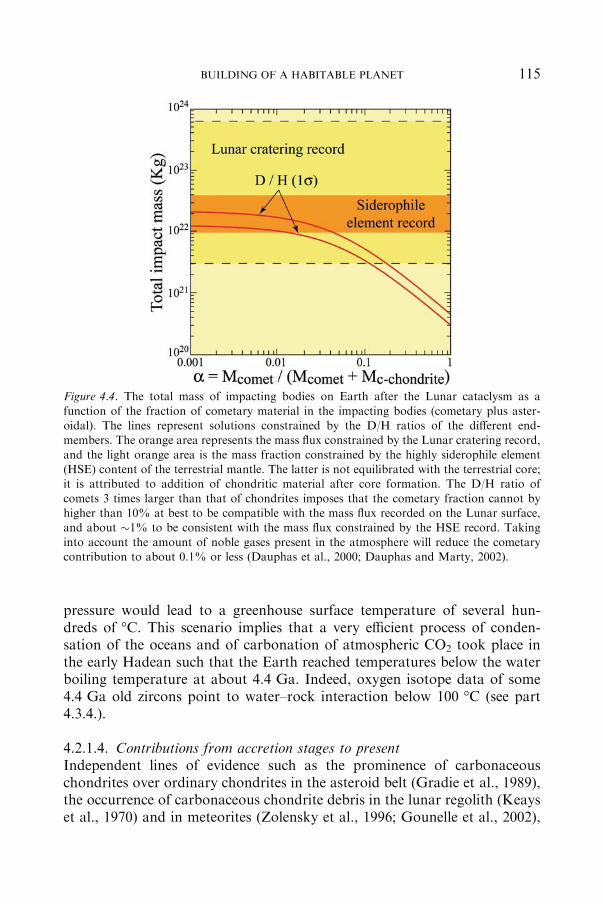
pressure would lead to a greenhouse surface temperature of several hun-dreds of �C. This scenario implies that a very efficient process of conden-sation of the oceans and of carbonation of atmospheric CO2 took place inthe early Hadean such that the Earth reached temperatures below the waterboiling temperature at about 4.4 Ga. Indeed, oxygen isotope data of some4.4 Ga old zircons point to water–rock interaction below 100 �C (see part4.3.4.).
4.2.1.4. Contributions from accretion stages to presentIndependent lines of evidence such as the prominence of carbonaceouschondrites over ordinary chondrites in the asteroid belt (Gradie et al., 1989),the occurrence of carbonaceous chondrite debris in the lunar regolith (Keayset al., 1970) and in meteorites (Zolensky et al., 1996; Gounelle et al., 2002),
Figure 4.4. The total mass of impacting bodies on Earth after the Lunar cataclysm as a
function of the fraction of cometary material in the impacting bodies (cometary plus aster-oidal). The lines represent solutions constrained by the D/H ratios of the different end-members. The orange area represents the mass flux constrained by the Lunar cratering record,
and the light orange area is the mass fraction constrained by the highly siderophile element(HSE) content of the terrestrial mantle. The latter is not equilibrated with the terrestrial core;it is attributed to addition of chondritic material after core formation. The D/H ratio of
comets 3 times larger than that of chondrites imposes that the cometary fraction cannot byhigher than 10% at best to be compatible with the mass flux recorded on the Lunar surface,and about �1% to be consistent with the mass flux constrained by the HSE record. Taking
into account the amount of noble gases present in the atmosphere will reduce the cometarycontribution to about 0.1% or less (Dauphas et al., 2000; Dauphas and Marty, 2002).
115BUILDING OF A HABITABLE PLANET

remnants of a cometary shower in terrestrial sediments (Farley et al., 1998),strongly suggest that extraterrestrial material delivered volatile elements tothe surface of the Earth from accretionary stages to Present (e.g. Chyba,1990; Morbidelli et al., 2000). Mass balance considerations based onhydrogen isotopes, on noble metal and noble gas abundances indicate thatthis flux was dominated by chondritic material, the mass fraction of cometsbeing �10)3 or less (Dauphas et al., 2000; Dauphas and Marty, 2002).Carbonaceous chondrites, comets and interplanetary dust particles (IDPs)are rich in organic molecules and might have contributed directly to the pre-biotic inventory of the Earth (Anders, 1989; Maurette, 1998).
The flux of cosmic dust measured before atmospheric entry in the near-Earth interplanetary space yields a value of 30,000±20,000 tons/yr (Loveand Brownlee, 1993). Cosmic dust represents the largest contribution ofextraterrestrial matter to the Earth’s surface at present, as the meteorite massflux over the 10 g)1 kg interval accounts for only �3–7 tons/yr (Bland et al.,1996). IDPs collected in the stratosphere by NASA have typical sizes below50 lm. They probably sample a mixed population of debris originating fromthe asteroidal belt and from the Edgeworth–Kuiper belt (e.g. Brownlee, 1985;Brownlee et al., 1993), with possible contribution from silicates and organicsof interstellar origin (Messenger, 2000; Aleon et al., 2001; Messenger et al.,2002, 2003; Aleon et al., 2003).
Objects in the size range 25–200 lm (exceptionally up to 400 lm andlarger), labelled micrometeorites (MMs), dominate the mass flux of cosmicdust onto Earth (e.g. Love and Brownlee, 1993). Micrometeorites sharemineralogical and chemical similarities with CM and/or CR chondrites(Kurat et al., 1994; Engrand and Maurette, 1998), and D/H ratios of MMspoint to an extraterrestrial, likely to be asteroidal (CM-CI-type), origin oftrapped water (Engrand et al., 1999).
In the following, we make an estimate of the nitrogen contribution bycosmic dust to the atmosphere through time, following a recent study (Martyet al., 2005). The case of nitrogen perfectly illustrates the fate of other at-mophile elements; it can be extended to that of water as far as orders ofmagnitude are concerned. An estimate of the nitrogen delivery flux can beassessed by assuming a N content of �1000 ppm characteristic of carbona-ceous chondrites and in particular of CM chondrites. This value may be alower limit since some of the micrometeorites might contain a larger initial Ncontent as suggested by the sometimes high trapped noble gas content (seepreceding section), although the frequency of such particles is unknown.IDPs can contain N at the percent level (Aleon et al., 2003). However theIDP mass flux is �0.01 times that of micrometeorites, (Love and Brownlee,1993), so that their nitrogen contribution appears limited, perhaps at thesame level as the one from MMs. Comets contain about 10,000–40,000 ppmN (see Dauphas and Marty, 2002, and references herein) and might have
116 HERVE MARTIN ET AL.

contributed significantly to cosmic dust. However, mass balance consider-ations involving volatile and siderophile elements together with D/H ratios ofthe terrestrial oceans suggest that the bulk cometary contribution to theterrestrial inventory of volatile elements was very limited, of the order of 10)3
relative to the total mass of contributors (Dauphas et al., 2000; Dauphas andMarty, 2002). It must be noted that the nitrogen content of cosmic dustnecessary to account for N isotope variations in lunar soils has been esti-mated at �1000 ppm on average over most of the lunar history (Hashizumeet al., 2002).
The cosmic dust flux might not have varied dramatically since 3.8 Ga ago,except for a significant increase in the last 0.5 Ga (Grieve and Shoemaker,1994; Culler et al., 2000; Hashizume et al., 2002). A near-constant planetarycontribution within a factor of 2 since 3.8 Ga ago is also consistent with thecratering record at the lunar surface (Hartmann et al., 2000). Thus, we as-sume, as done previously (Chyba and Sagan, 1992), that the cosmic dust fluxremained constant since 3.8 Ga at a rate similar to the present-day one.Another important question is the flux ratio between dust and larger objects.The present-day mass ratio between dust and meteorites is of the order of102–103. Although highly imprecise, the mass contribution due to large ob-jects, which is dominated by rare events of km (or more) sized objects, mighthave been comparable to the cosmic dust flux, averaged over the last 3 Ga(Kyte and Wasson, 1986; Anders, 1989; Trull, 1994). A constant cosmic dustflux similar to the present-day one (�30,000 tons/yr) integrated over 3.8 Gacould have supplied �4 · 1015 mol N2, to the atmosphere, which makes only�3 · 10)5 times the atmospheric N2 amount (1.38 · 1020 mol N2, (Ozimaand Podosek, 2002) (Figure 4.5). Such a limited contribution is unlikely tohave had discernable isotopic effects on atmospheric nitrogen. This view isconsistent with available data for Archaean and Proterozoic sedimentsindicating that the atmospheric N isotope composition has been near-con-stant since 3.5 Ga (Sano and Pillinger, 1990; Pinti, 2002).
Some argue a steep decline of the cratering rate between 4.5 and 3.8 Ga,there is compelling evidence that a spike of bombardment took place 4.0–3.8 Ga ago and that in the time interval 4.4–4.0 Ga ago the impacting fluxwas not dramatically high (Hartmann et al., 2000, part 4.5). The total massof impactors during the last spike of bombardment around 3.9 Ga is �6 ·1021 g (Hartmann et al., 2000). The content of siderophile elements in theancient highlands suggests that the amount of interplanetary mass accumu-lated by the Moon in the 4.4–4.0 Ga period is about the same as thatrequired in order to form the 3.9 Ga basins. Consequently, the post 4.4 Gacontribution to the lunar surface might have been �1.2 · 1022 g (Hartmannet al., 2000). This contribution included both bolides (evidenced by remnantsof the lunar cataclysm) and cosmic dust, all of them being integrated in thesiderophile element record. A lower limit for the Earth’s efficiency over Moon
117BUILDING OF A HABITABLE PLANET
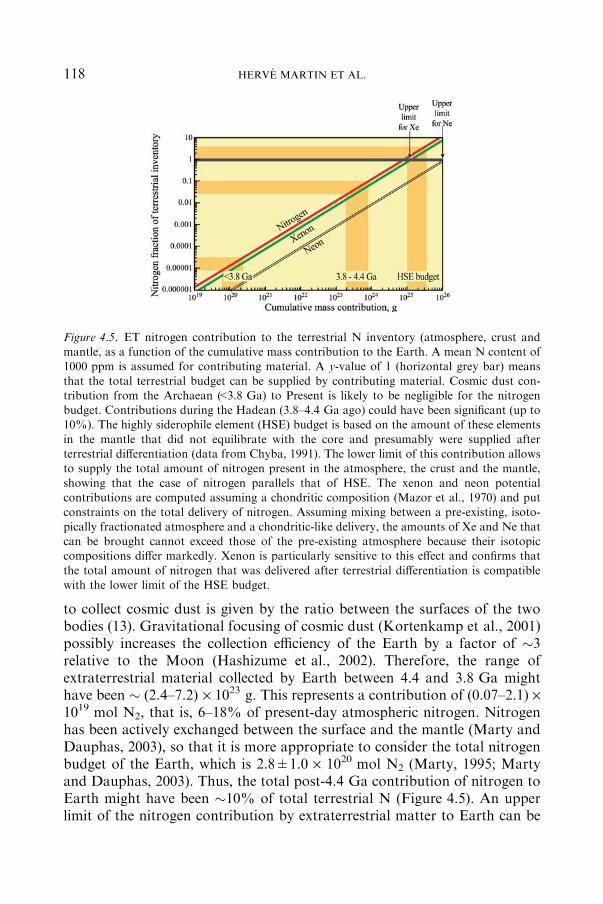
to collect cosmic dust is given by the ratio between the surfaces of the twobodies (13). Gravitational focusing of cosmic dust (Kortenkamp et al., 2001)possibly increases the collection efficiency of the Earth by a factor of �3relative to the Moon (Hashizume et al., 2002). Therefore, the range ofextraterrestrial material collected by Earth between 4.4 and 3.8 Ga mighthave been � (2.4–7.2) · 1023 g. This represents a contribution of (0.07–2.1) ·1019 mol N2, that is, 6–18% of present-day atmospheric nitrogen. Nitrogenhas been actively exchanged between the surface and the mantle (Marty andDauphas, 2003), so that it is more appropriate to consider the total nitrogenbudget of the Earth, which is 2.8±1.0 · 1020 mol N2 (Marty, 1995; Martyand Dauphas, 2003). Thus, the total post-4.4 Ga contribution of nitrogen toEarth might have been �10% of total terrestrial N (Figure 4.5). An upperlimit of the nitrogen contribution by extraterrestrial matter to Earth can be
Figure 4.5. ET nitrogen contribution to the terrestrial N inventory (atmosphere, crust andmantle, as a function of the cumulative mass contribution to the Earth. A mean N content of1000 ppm is assumed for contributing material. A y-value of 1 (horizontal grey bar) means
that the total terrestrial budget can be supplied by contributing material. Cosmic dust con-tribution from the Archaean (<3.8 Ga) to Present is likely to be negligible for the nitrogenbudget. Contributions during the Hadean (3.8–4.4 Ga ago) could have been significant (up to10%). The highly siderophile element (HSE) budget is based on the amount of these elements
in the mantle that did not equilibrate with the core and presumably were supplied afterterrestrial differentiation (data from Chyba, 1991). The lower limit of this contribution allowsto supply the total amount of nitrogen present in the atmosphere, the crust and the mantle,
showing that the case of nitrogen parallels that of HSE. The xenon and neon potentialcontributions are computed assuming a chondritic composition (Mazor et al., 1970) and putconstraints on the total delivery of nitrogen. Assuming mixing between a pre-existing, isoto-
pically fractionated atmosphere and a chondritic-like delivery, the amounts of Xe and Ne thatcan be brought cannot exceed those of the pre-existing atmosphere because their isotopiccompositions differ markedly. Xenon is particularly sensitive to this effect and confirms that
the total amount of nitrogen that was delivered after terrestrial differentiation is compatiblewith the lower limit of the HSE budget.
118 HERVE MARTIN ET AL.

set from the highly siderophile element (HSE) budget of our planet whichmight have been delivered after metal/silicate differentiation towards the endof terrestrial accretion (e.g. Chyba, 1991, and references herein). If nitrogen isa siderophile element as recently argued (Hashizume et al., 1997), the amountnow measured in both mantle and atmosphere might have been deliveredafter core formation during ‘‘late veneer’’ events. The amount of HSE presentin the mantle corresponds to the contribution of 1 · 1025–4 · 1025 g ofchondritic material (Chyba, 1991), thus to a delivery of (3–14) · 1020 mol N2.This is clearly in the range of the nitrogen budget of the Earth (3 · 1020 molN2), thus suggesting that cosmic dust, which dominates now the extrater-restrial flux of matter to Earth, could have supplied nitrogen present in theatmosphere, but only during the late building stages of our planet. A sum-mary of nitrogen delivery through time is given in (Figure 4.4).
4.2.2. OCEAN
DANIELE L. PINTI
The establishment of a precise chronology of the formation of the terrestrialoceans depends on the ability to answer two fundamental questions: (1) howand when did water arrive on the Earth? (2) when did internal heat flow fromthe accreting Earth decreased to a critical threshold allowing water to beliquid on its surface?
The origin of water on Earth has been at the centre of much debate in thelast decades, yet few models have been formulated on the origin of the oceans(Abe, 1993; Sleep et al., 2001; Pinti, 2005) because of the evident lack ofgeological record. Actually, the scientific community agrees with thehypothesis that water was brought very early in the history of the solarsystem, possibly during the last phases of the Earth accretion, which impliesthat the oceanic water inventory was available since the beginning (e.g.Morbidelli et al., 2000). Theories on an ‘‘expanding ocean’’, with waterdelivered all along the Earth history seem to be implausible and not sup-ported by the geological record (de Ronde et al., 1997; Harrison, 1999),although several authors still claim its existence to account for climate andsea-level variations during eons (Deming, 1999). These variations are likelythe result of plate tectonics, continental drifting and the opening of newoceanic basins, rather than variations of the volume of the oceans.
However, contrasting opinions subsist on the extraterrestrial carrier thatbrought water on Earth, splitting in two the scientific community. Someauthors propose a dominant cometary origin (Frank et al., 1986; Delsemme,1999), which has found much credit among the biologists because cometscontain plenty of organic molecules that could be considered as the
119BUILDING OF A HABITABLE PLANET

primordial ‘‘bricks’’ of life. The other part of the community, supported bystrong isotopic evidence and dynamical models of the solar system evolution(Dauphas et al., 2000; Morbidelli et al., 2000; Robert, 2001; Dauphas andMarty, 2002; Dauphas, 2003; Robert, 2003), proposes that a few asteroidalembryos of chondritic composition are the water delivers.
4.2.2.1. Water accretion to Earth (4.56–4.49 Ga = t0 + 11–70 Ma)The prevailing opinion on the origin of the oceans is that the water comesfrom the outer solar system, brought by comets or asteroids colliding thefreshly formed Earth, the usually called ‘‘late veneer scenario’’ (e.g. Javoy,1998; Javoy, 2005 and references therein) (Figure 4.6). Isotopic and massbalance calculations, based respectively on the hydrogen isotopic ratio ofwater (D/H), the amount of water in different extraterrestrial reservoirs (e.g.,meteorites, comets) and numerical simulations of extraterrestrial fluxes sug-gests that delivery of water by comets is less than 10% of the total (Dauphaset al., 2000; Robert, 2001). Compilation of the isotopic ratio of hydrogen
Figure 4.6. Sketch representing the main phases of the formation of the terrestrial oceans(t0 + 11–70 Ma).
120 HERVE MARTIN ET AL.

(D/H) measured in different extraterrestrial reservoirs and compared withthat of the modern seawater (D/H=155.7 · 10)6 or dD ¼ 0 by definition)suggests that few embryos of asteroids (with a D/H=149±6 · 10)6,Morbidelli et al., 2000; Robert, 2003) or alternatively consistent fluxes oflarge IDPs (AMM, Antarctic Micrometeorites with a D/H = 154±16 ·10)6, Maurette et al., 2000) could be the carrier of water on Earth. Thechemical and isotopic composition of both these two reservoirs is close tothat of the carbonaceous chondrites (Robert, 2003), the latter ranging fromthat of Orgueil (CI; fully hydrated) to that of Murchinson (CM; containingabout 40% of hydrated minerals). Independent estimates based on the excessof siderophile elements of the platinum group in the mantle suggest thatcontribution from comets could be less than 10)3 by mass of the total(Dauphas and Marty, 2002). Numerical simulations indicate that impactprobability of comets is too low to supply all of the terrestrial water (Zahnleand Dones, 1998; Morbidelli et al., 2000). Very recently, new simulationshave been carried out in order to explain the cataclysmic Late Heavy Bom-bardment (LHB) period that lasted between 10 and 150 Ma, at around 4.0–3.8 Ga ago (Gomes et al., 2005, see part 4.5). In these simulations, the rapidmigration of the giant planets destabilized the planetesimal disk thus resulting ina sudden massive delivery of these planetesimals to the inner solar system.During this burst, the total amount of cometary material delivered to the Earthis 1.8 · 1023g, which corresponds to about 6% of the current ocean mass.
The hypothesis of Maurette et al. (2000) of adding water to Earth’s oceansby accreting cosmic dust (AMM) is interesting but it fails against the un-known fluxes of extraterrestrial particles hitting the early Earth and thecapacity of AMM to furnish the total Earth’s water inventory. This latterincludes both the mass of the oceans (1.37 · 1024 g; 98% of the total surfacewater inventory) and an unknown amount of water that could reside in theEarth’s mantle, as suggested by its high degree of oxidation. Water masses upto 50 times the amount in the modern ocean have been postulated for theprimitive mantle (Abe et al., 2000), while high-pressure experiments in hy-drous mineral phases suggest that Earth’s lower mantle may actually storeabout five times more water than the oceans (Murakami et al., 2002). Theminimum estimation for the whole mantle is of 1.93 · 1024 g, only 1.4 timesthe present-day oceanic inventory (Dreibus and Wanke, 1989). Acceptedvalues of the volume of water for the most ‘‘wet’’ mantle scenarios are from 5to 10 times that of the modern oceans.
Best estimates of the present-day accretion rate of cosmic dust measuredbefore atmospheric entry yields a value of 30,000±20,000 tons/yr (see part4.2.1.) while initially Love and Brownlee (1993) gave a slightly higher value of40,000±20,000 tons/yr. On Earth surface, the flux is much less and esti-mates obtained from abundance of cosmic dust from Antarctic cores yieldsvalues from 5300±3,100–16,000±9300 tons/yr with a global average of
121BUILDING OF A HABITABLE PLANET
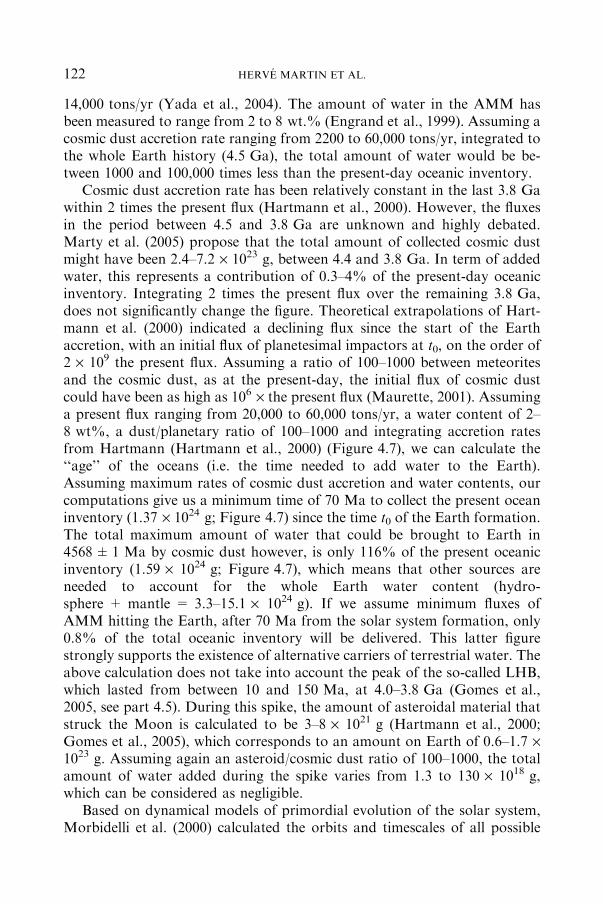
14,000 tons/yr (Yada et al., 2004). The amount of water in the AMM hasbeen measured to range from 2 to 8 wt.% (Engrand et al., 1999). Assuming acosmic dust accretion rate ranging from 2200 to 60,000 tons/yr, integrated tothe whole Earth history (4.5 Ga), the total amount of water would be be-tween 1000 and 100,000 times less than the present-day oceanic inventory.
Cosmic dust accretion rate has been relatively constant in the last 3.8 Gawithin 2 times the present flux (Hartmann et al., 2000). However, the fluxesin the period between 4.5 and 3.8 Ga are unknown and highly debated.Marty et al. (2005) propose that the total amount of collected cosmic dustmight have been 2.4–7.2 · 1023 g, between 4.4 and 3.8 Ga. In term of addedwater, this represents a contribution of 0.3–4% of the present-day oceanicinventory. Integrating 2 times the present flux over the remaining 3.8 Ga,does not significantly change the figure. Theoretical extrapolations of Hart-mann et al. (2000) indicated a declining flux since the start of the Earthaccretion, with an initial flux of planetesimal impactors at t0, on the order of2 · 109 the present flux. Assuming a ratio of 100–1000 between meteoritesand the cosmic dust, as at the present-day, the initial flux of cosmic dustcould have been as high as 106 · the present flux (Maurette, 2001). Assuminga present flux ranging from 20,000 to 60,000 tons/yr, a water content of 2–8 wt%, a dust/planetary ratio of 100–1000 and integrating accretion ratesfrom Hartmann (Hartmann et al., 2000) (Figure 4.7), we can calculate the‘‘age’’ of the oceans (i.e. the time needed to add water to the Earth).Assuming maximum rates of cosmic dust accretion and water contents, ourcomputations give us a minimum time of 70 Ma to collect the present oceaninventory (1.37 · 1024 g; Figure 4.7) since the time t0 of the Earth formation.The total maximum amount of water that could be brought to Earth in4568±1 Ma by cosmic dust however, is only 116% of the present oceanicinventory (1.59 · 1024 g; Figure 4.7), which means that other sources areneeded to account for the whole Earth water content (hydro-sphere + mantle = 3.3–15.1 · 1024 g). If we assume minimum fluxes ofAMM hitting the Earth, after 70 Ma from the solar system formation, only0.8% of the total oceanic inventory will be delivered. This latter figurestrongly supports the existence of alternative carriers of terrestrial water. Theabove calculation does not take into account the peak of the so-called LHB,which lasted from between 10 and 150 Ma, at 4.0–3.8 Ga (Gomes et al.,2005, see part 4.5). During this spike, the amount of asteroidal material thatstruck the Moon is calculated to be 3–8 · 1021 g (Hartmann et al., 2000;Gomes et al., 2005), which corresponds to an amount on Earth of 0.6–1.7 ·1023 g. Assuming again an asteroid/cosmic dust ratio of 100–1000, the totalamount of water added during the spike varies from 1.3 to 130 · 1018 g,which can be considered as negligible.
Based on dynamical models of primordial evolution of the solar system,Morbidelli et al. (2000) calculated the orbits and timescales of all possible
122 HERVE MARTIN ET AL.

water carriers in the primordial solar system. They concluded that towardsthe end of the solar system formation (several tenths of millions years), theEarth began to accrete few planetary embryos originally formed in the outerasteroid belt, heavily hydrated with a water content of about 10 wt.%deduced from average contents of hydrated carbonaceous chondrites (Boato,1954; Robert and Epstein, 1982; Kerridge, 1985; Robert, 2003). A 10% of theEarth mass (6 · 1027 g) could derive from this late accretion of primitive
Figure 4.7. Empirical curve of impact declining flux during Hadean, as reported by Hartmannet al. (2000), modified. The cumulated amount of water transported by a minimum and maxi-
mum flux of cosmic dust composed principally of AMM of chondritic composition (Engrandet al., 1999) is calculated for each segment of the curve. The total amount of water delivered byasteroids and AMM during the LHB have been also reported. Small figure top-right is a zoom
on the first period of Earth’s accretion. It is possible to note that most of the oceanic and mantlewater has been likely transported within the first 100 Ma of the Earth history.
123BUILDING OF A HABITABLE PLANET
material, which means that at least 5 times the present oceanic waterinventory could have been brought by these planetary embryos, satisfying the‘‘wet Earth’’ geochemical models. The timescale of this late water accretioncan be supposed from the argumentations of Dauphas and Marty (2002).They assumed that highly siderophile element (HFSE) excess in the mantlemight have been delivered by a late veneer of chondritic composition, afterthe metal/silicate differentiation of the Earth. The total amount of planetaryembryos that struck the Earth was of 0.7–4 · 1025 g (Chyba, 1991; Dauphasand Marty, 2002). Assuming a 6–22 wt% of water content of these objects,between 0.3 and 6 times oceanic water inventory was delivered after the coreformation by this chondritic veneer. Hf-W chronology indicates that the coreformation occurred during the first 10–50 million years of the life of the solarsystem (Kleine et al., 2002; Yin et al., 2002a; Yin and Ozima, 2003), prior ofthe giant impact from which originated the Moon (Jacobsen and Yin, 2003).This impact is dated at 50 Ma after the differentiation of the earliest plane-tesimal in the solar system (Canup and Asphaug, 2001).
Recent simulations of the loss of the primary solar-type atmosphere ofthe primitive Earth show that an ocean-covered Earth might have existedwell before the Moon-forming giant impact (Genda and Abe, 2005). Thepresence of an ocean significantly enhances the loss of atmosphere during agiant impact owing two effects: evaporation of the ocean and lower shockimpedance of the ocean compared to the ground. Morbidelli et al. (2000)proposed that hydrated asteroids from the outer belt could have deliveredan amount of water comparable to the present ocean, at time t0+10 Ma,but they concluded that only tiny amounts of this water survived tostripping by giant impacts. Genda and Abe (2005) simulations suggest thata giant impact could have stripped out 70% of a proto-atmosphere of solarcomposition, with essentially no loss for the ocean. Thus the initial hy-drated planetesimals of Morbidelli et al. (2000) could have survived thegiant impact period and participated to the oceanic water budget. It isinteresting to note that for all these models, the time of water accretion iswithin the time of the Earth formation. Both hydrated planetary embryosand AMM could have sustained the water flux on Earth between t0+10and 70 Ma.
4.2.2.2. Ocean formation (4.49–4.39 Ga = t0 + 70–165 Ma)If water arrived very early on the accreting Earth, it does not mean neces-sarily that a stable and cold ocean existed in a very early period of its history.Earth became potentially habitable once it developed a solid proto-crust toseparate the hot interior of the planet from a cooler surface environmentfeaturing liquid water. Giant impacts such as the Moon-forming one haslikely molten the Earth surface and vaporized proto-oceans to form a thick
124 HERVE MARTIN ET AL.
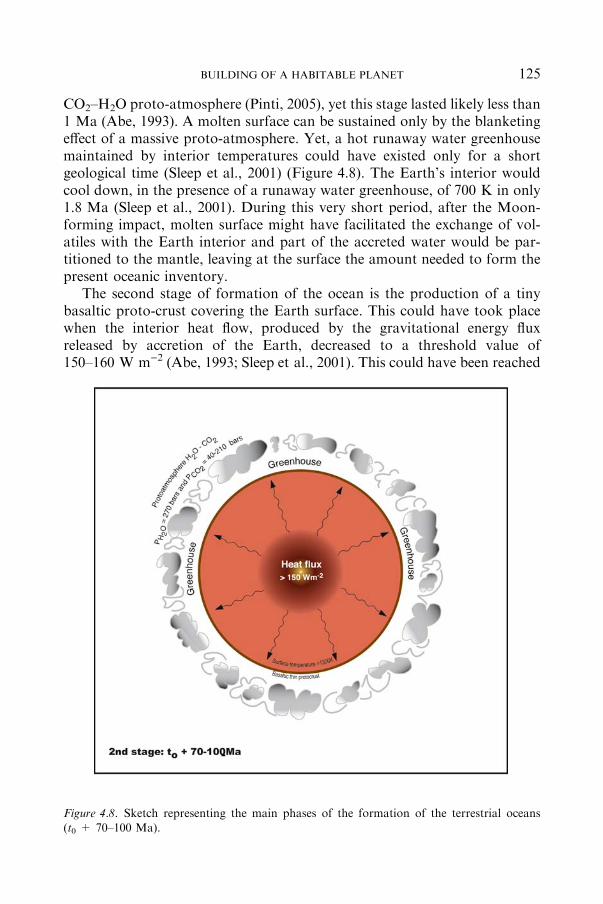
CO2–H2O proto-atmosphere (Pinti, 2005), yet this stage lasted likely less than1 Ma (Abe, 1993). A molten surface can be sustained only by the blanketingeffect of a massive proto-atmosphere. Yet, a hot runaway water greenhousemaintained by interior temperatures could have existed only for a shortgeological time (Sleep et al., 2001) (Figure 4.8). The Earth’s interior wouldcool down, in the presence of a runaway water greenhouse, of 700 K in only1.8 Ma (Sleep et al., 2001). During this very short period, after the Moon-forming impact, molten surface might have facilitated the exchange of vol-atiles with the Earth interior and part of the accreted water would be par-titioned to the mantle, leaving at the surface the amount needed to form thepresent oceanic inventory.
The second stage of formation of the ocean is the production of a tinybasaltic proto-crust covering the Earth surface. This could have took placewhen the interior heat flow, produced by the gravitational energy fluxreleased by accretion of the Earth, decreased to a threshold value of150–160 W m)2 (Abe, 1993; Sleep et al., 2001). This could have been reached
Figure 4.8. Sketch representing the main phases of the formation of the terrestrial oceans(t0 + 70–100 Ma).
125BUILDING OF A HABITABLE PLANET

at the end of the Earth accretion, when the Earth radius was 97% of thepresent size (Abe, 1993).
The ending stage of the Earth accretion, at t0+50–70Ma, was charac-terized by a mechanically fragile proto-crust that was partially molten andresurfaced by meteoritic impacts and extensive volcanism. Assuming anatmospheric pressure at the surface of several hundred bars (270 bars of H2Oand = 40 bars of CO2, Pinti, 2005), water starts to condense and precipitateswhen the surface temperatures were below 600 K. Condensation of theoceans could have been a very rapid process, lasted few thousand years (Abe,1993) (Figure 4.9). Although formed, the oceans were not yet habitable.Temperatures were too high for the survival of any form of life, and large-scale hydrothermal alteration of the proto-crust produced very saline water(halite-dominated brines, Sleep et al., 2001), where few forms of life couldhave survived.
A stable oceanic habitat took place when surface heat flow was lessthan 1 W m)2, and best estimates following the model of Abe (1993)
Figure 4.9. Sketch representing the main phases of the formation of the terrestrial oceans(t0 + 165–400 Ma).
126 HERVE MARTIN ET AL.

indicate that such a situation was reached at t0+400 Ma (Figure 4.10).Independent estimates can be obtained by assuming that the temperatureof the ocean was controlled by the greenhouse effect of a CO2 residualatmosphere, after the condensation of water in the oceans (Sleep et al.,2001). The maximum temperature acceptable for living organism is£110 �C (thermophiles, Lopez-Garcia, 2005). This can be taken as one ofthe minimum conditions acceptable for a habitable ocean. This tempera-ture is reached at equilibrium with a residual atmosphere of 25 bars ofCO2 (Sleep et al., 2001). The initial atmosphere might have containedfrom 40 to 210 bars of CO2 (Pinti, 2005). The most effective way toremove CO2 from the primitive atmosphere is weathering of silicates in theproto-crust (during Hadean, weathering could have been a fast process, atrates of 10,000 times higher than the present ones, Abe, 1993), formationof carbonates and recycling of produced CaCO3 to the mantle. Zhang andZindler (1993) proposed a maximum initial recycling rate of CO2 in themantle of 1.5 · 1014 mol/yr. At this rate, 15–185 bars of CO2 could have
Figure 4.10. Sketch representing the main phases of the formation of the terrestrial oceans
(t0 + 400 Ma).
127BUILDING OF A HABITABLE PLANET

been removed from the atmosphere in a span of time ranging from 19 to140 Ma. The upper limit is close to a t0+165 Ma age, which correspondsto the minimum age of an evolved continental proto-crust containing li-quid water, as suggested by the Jack Hills detrital zircon W74/2–36 Pb-Pbage (4404±4 Ma, Wilde et al., 2001) (Figure 4.11). Clement conditions forthe establishment of a habitable ocean were thus possibly in place att0+165 Ma.
4.3. The First Continents
HERVE MARTIN
On Earth, plate tectonics is a powerful set of mechanisms that continuouslyrebuilds the planet surface; indeed oceanic crust is generated in mid oceanridge systems and due to its relatively high density, it returns into themantle through subduction zones, the average time for such a cycle is60 Ma and no ocean older than 200 Ma is known today. In other wordsoceanic crust is not able to constitute an efficient archive of Earth history.On the opposite, continental crust has a lower density such that it is noteasily recycled into the mantle. Consequently, continental crust is able toundergo and to record most of the episodes of Earth history. In addition,continental crust average composition is granodioritic, such that, contrarilyto oceanic basalts, minerals such as zircon can easily crystallize in it. Theseminerals are extremely important in geochronology and this for two rea-sons: (1) zircon is a silicate of zirconium (ZrSiO4) where sometimes Th and
Figure 4.11. Chronology of the main phases of the Earth formation and differentiation,
together with the phases of extraterrestrial water delivery and ocean formation.
128 HERVE MARTIN ET AL.
U can replace Zr. Due to the radioactivity of these elements zircon is‘‘easy’’ to date. (2) zircon is extremely resistant to weathering and meta-morphism, consequently it can resist to mechanisms as alteration, erosionand even sometimes to partial melting. This resistance allows it to efficientlyrecord ages of old events.
4.3.1. THE 3.8–3.9 GA ARCHAEAN CRUST
4.3.1.1. Amitsoq TTG (Greenland)Since the field work of McGregor (1968; 1973) it has been recognized thatGreenland Archaean terrains were among the oldest in the world. Theoldest components of this craton were called the Amitsoq gneisses, whichwere first dated by Rb–Sr whole rock isochron method at 3.98±0.17 Ga(Black et al., 1971) and 3.74±0.1 Ga (Moorbath et al., 1972). More re-cent works showed that the so-called Amitsoq gneisses were not homo-geneous, but on the contrary very diverse, and in order to account for thisheterogeneity, Nutman et al. (2004) proposed to refer these formations as‘‘Itsaq Gneiss Complex’’; both denominations are used in geological lit-erature. Zircon dating allowed to more precisely determine the ages of thegenesis of these gneisses which range between 3.88 and 3.60 Ga. A sta-tistical analyse performed on ca. 2000 zircons from this area pointed tothe existence of 3 main episodes of continental crust genesis at Amitsoq:at �3.80 Ga; �3.7 Ga and �3.65 Ga. Even if rarer, ages older than3.85 Ga were also measured. A zircon extracted from a gneiss sample,tonalitic in composition, gives the oldest reliable age obtained in this area:3.872±0.010 Ga (Nutman et al., 1996). This age is interpreted as beingthat of crystallisation and emplacement of the tonalitic magma. The sameauthors (Nutman et al., 2000) also obtained an age of 3.883±0.009 Gaon a zircon core, whereas the main part of the mineral was dated at3.861±0.022 Ga; here too these ages are supposed to give the time ofcrystallization of the parental magma.
Amitsoq gneisses outcrop over about 3000 km2; they are well exposedand generally well preserved of weathering (Figure 4.12). They derivedfrom magmatic rocks Tonalitic, Trondhjemitic and Granodioritic (TTG) incomposition (Nutman and Bridgwater, 1986; Nutman et al., 1996). TTG isthe widespread composition of the Archaean crust between 3.8 and2.5 Ga, crust which is considered as generated by hydrous basalt melting,possibly in subduction like environment (Martin et al., 2005). The agesobtained on the Amitsoq gneisses indicate that as early as 3.87 Ga ago,these mechanisms were already active and efficient, able to generate thehuge volumes of continental crust observed at Amitsoq.
129BUILDING OF A HABITABLE PLANET

4.3.1.2. Isua and Akilia greenstone belt (Greenland)Supracrustal rocks (i.e. volcanic and sedimentary) also outcrop as lenses intothe Amitsoq gneisses. Some lenses as at Isua can be big (�35 km long), butthey are generally less than 1km long (Akilia Island for instance). Contrarilyto TTG that emplaced deep into the crust, supracrustal deposited or eruptedat the surface of the Earth (Figure 4.13). At Isua, zircons gave an age of3.812±0.014 Ga (Baadsgaard et al., 1984). In Akilia Island, the Amitsoqtonalite dated at 3.872±0.010 Ga by Nutman et al. (Nutman et al., 1996) isintrusive (dyke) into a banded iron formation (BIF) thus demonstrating thatthis sedimentary rock is older than 3.872 Ga.
Figure 4.12. 3.87 Ga old Amitsoq gneisses (Greenland) that emplaced as TTG (Tonalite,Trondhjemite, Granodiorite) magmas. On this picture they are cut by a pegmatitic dyke
related to later granitic intrusion. (Photo G. Gruau)
Figure 4.13. Isua (Greenland) gneisses, these rocks emplaced as sediments more than 3.87 Ga
ago; they represent the oldest known terrestrial sediment (Photo G. Gruau).
130 HERVE MARTIN ET AL.

The Isua and Akilia supracrustal rocks are extremely important, first ofcourse because they represent the oldest huge volumes of rocks so far rec-ognized, but also because:
• They contain sediments, thus demonstrating the existence of a hydro-sphere (ocean) as old as 3.87 Ga.
• The origin of sediments has been subject to active discussion, someauthors consider them as mostly of pure chemical origin, or even due totransformation (metasomatism) of pre-existing magmatic rocks (Roseet al., 1996; Fedo, 2000; Fedo et al., 2001; Myers, 2001; Fedo andWhitehouse, 2002; Bolhar et al., 2004). However, recent work (Bolharet al., 2005) clearly demonstrates that at least some parts of Isuasupracrustals correspond to true clastic sediments of mixed mafic andfelsic provenance. The weathering, erosion and transport of the clastsare strong arguments in favour of emerged continents as early as3.87 Ga.
• Both Isua and Akilia sediments contain carbonaceous inclusions,(generally into apatite crystals) whose d13C average isotopic constitutionof )30 to �35 could be interpreted as biological signature (Mojzsiset al., 1996). More recently, U-rich sediments from the same localitywere interpreted as indicators of oxidized ocean water resulting ofoxygenic photosynthesis (Rosing and Frei, 2004). However the reliabil-ity of these biological signatures is still subject to a very activecontroversy and the so-called bacteria Isuasphaera Isua as well asAppelella ferrifera are now considered as artefacts (Appel et al., 2002;Westall and Folk, 2003).
• Since at least 30 years, evidence of horizontal tectonics have beenrecognized in Amitsoq area (Bridgwater et al., 1974) and more recentlyit has been proposed that the early Archaean crustal accretion inGreenland proceeded by assemblage and collage of terranes (Nutmanand Collerson, 1991; Nutman et al., 2004). All these arguments militatein favour of plate tectonic like processes operating since the EarlyArchaean.
• Investigation performed on the mafic magmatic components of Isua andAkilia greenstone belts, and based on lead (Kamber et al., 2003) orshort-life isotopes (Boyet et al., 2003; Caro et al., 2003) conclude to avery early differentiation of a proto-crust, probably during the magmaocean stage and its long-lived preservation during the Hadean.
4.3.1.3. Uivakgneisses and Inukjuak (PorpoiseCove) greenstone belt (Canada)Along the northern Labrador coast, metamorphic rocks very similar toAmitsoq and Isua gneisses are exposed; there, they are called the Uivak
131BUILDING OF A HABITABLE PLANET
gneisses. Zircons analysed in these tonalitic (TTG) gneisses yield ages of3.733±0.009 Ga, however they also contain rounded cores dated at3.863±0.012 Ga (Schiøtte et al., 1989). However, in Labrador these rocksuffered a NeoArchaean granulite facies metamorphism (Collerson andBridgwater, 1979) which in not the case in Greenland. Very recently, a vol-cano sedimentary formation very similar to Isua was discovered in HudsonBay (Canada) at Inukjuak (it was earlier called Porpoise Cove) and dated at3.825±0.016 Ga (David et al., 2002; Stevenson, 2003). The wide repartitionof these early Archaean crustal components militates in favour of the exis-tence of a big continent (or of many small) older than 3.8 Ga in this part ofthe northern hemisphere.
4.3.2. THE 4.0 GA ARCHAEAN CRUST
At Acasta, in Northern Territories (Canada) small amounts (20 km2) ofArchaean rocks are exposed. They mainly consist in banded tonalite andgranodiorite (TTG) associated with subordinate amphibolite and ultramaficrocks. Most of these outcrops are strongly deformed, such that in these highstrain zones all lithologies are juxtaposed and parallelized, resulting in ban-ded rocks. However, small low strain zones exist; there, zircons measured inTTG samples gave ages of 4.031±0.003 Ga (Bowring and Williams, 1999).Moreover, in a tonalitic sample, zircons contain cores that have been dated at4.065±0.008 Ga. Bowring and Williams (1999) interpret these cores asreflecting the incorporation in the tonalitic magma of remnants of oldercontinental crust. Consequently, the Acasta TTG, not only represent theoldest rocks (continental crust) so far discovered, but they also demonstratethe existence of even older continental crust.
Ages measured on Amitsoq and Uivak gneisses, lead to the conclusionthat the mechanisms of TTG genesis by hydrous basalt melting were active at3.87 Ga. In the light of Acasta data, this conclusion can be extended back intime until 4.03 Ga and very probably until 4.06 Ga.
4.3.3. THE PRE-4. GA HADEAN CRUST
Until recently, Acasta rocks were the oldest known terrestrial materials, and thequestion was to know if continental crust existed or not before 4.0 Ga. Conse-quently, isotopic compositions of the oldest rocks were used in order to indi-rectly discuss the possible existence and nature of the Hadean continental crust.
4.3.3.1. Indirect evidencesThe basic idea on which are based these hypothesis is that continental crusthas been extracted from the mantle through partial melting processes. As the
132 HERVE MARTIN ET AL.
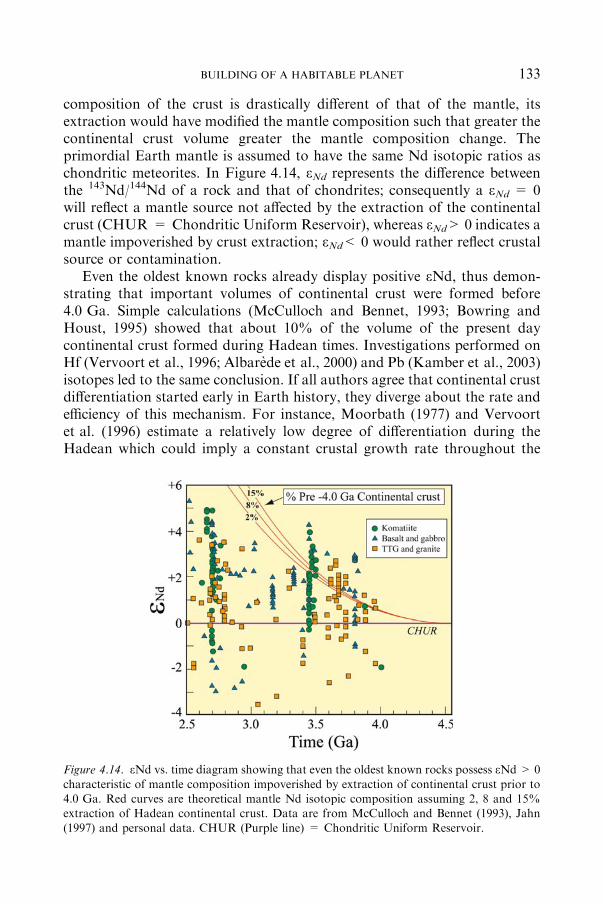
composition of the crust is drastically different of that of the mantle, itsextraction would have modified the mantle composition such that greater thecontinental crust volume greater the mantle composition change. Theprimordial Earth mantle is assumed to have the same Nd isotopic ratios aschondritic meteorites. In Figure 4.14, eNd represents the difference betweenthe 143Nd/144Nd of a rock and that of chondrites; consequently a eNd = 0will reflect a mantle source not affected by the extraction of the continentalcrust (CHUR = Chondritic Uniform Reservoir), whereas eNd> 0 indicates amantle impoverished by crust extraction; eNd< 0 would rather reflect crustalsource or contamination.
Even the oldest known rocks already display positive eNd, thus demon-strating that important volumes of continental crust were formed before4.0 Ga. Simple calculations (McCulloch and Bennet, 1993; Bowring andHoust, 1995) showed that about 10% of the volume of the present daycontinental crust formed during Hadean times. Investigations performed onHf (Vervoort et al., 1996; Albarede et al., 2000) and Pb (Kamber et al., 2003)isotopes led to the same conclusion. If all authors agree that continental crustdifferentiation started early in Earth history, they diverge about the rate andefficiency of this mechanism. For instance, Moorbath (1977) and Vervoortet al. (1996) estimate a relatively low degree of differentiation during theHadean which could imply a constant crustal growth rate throughout the
Figure 4.14. eNd vs. time diagram showing that even the oldest known rocks possess eNd> 0
characteristic of mantle composition impoverished by extraction of continental crust prior to4.0 Ga. Red curves are theoretical mantle Nd isotopic composition assuming 2, 8 and 15%extraction of Hadean continental crust. Data are from McCulloch and Bennet (1993), Jahn
(1997) and personal data. CHUR (Purple line) = Chondritic Uniform Reservoir.
133BUILDING OF A HABITABLE PLANET
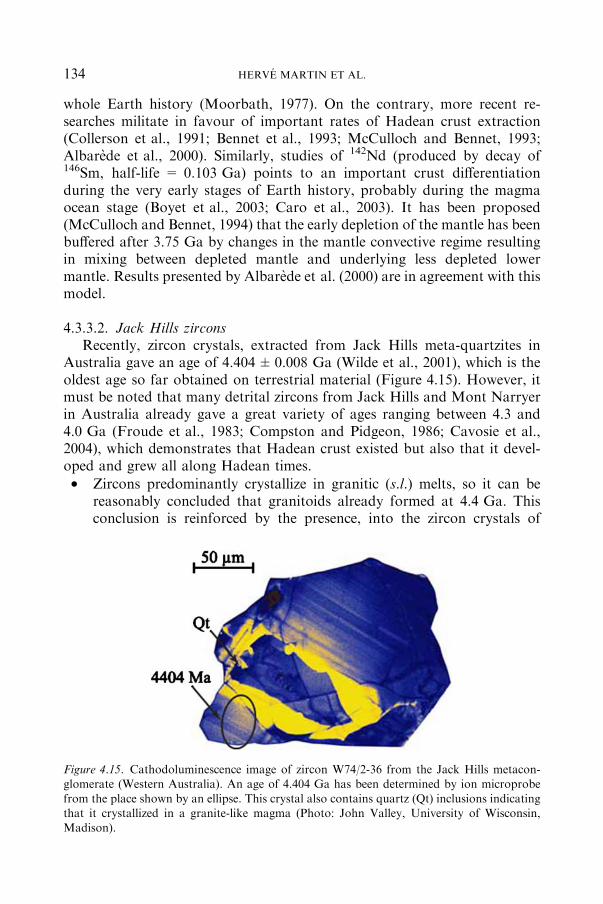
whole Earth history (Moorbath, 1977). On the contrary, more recent re-searches militate in favour of important rates of Hadean crust extraction(Collerson et al., 1991; Bennet et al., 1993; McCulloch and Bennet, 1993;Albarede et al., 2000). Similarly, studies of 142Nd (produced by decay of146Sm, half-life = 0.103 Ga) points to an important crust differentiationduring the very early stages of Earth history, probably during the magmaocean stage (Boyet et al., 2003; Caro et al., 2003). It has been proposed(McCulloch and Bennet, 1994) that the early depletion of the mantle has beenbuffered after 3.75 Ga by changes in the mantle convective regime resultingin mixing between depleted mantle and underlying less depleted lowermantle. Results presented by Albarede et al. (2000) are in agreement with thismodel.
4.3.3.2. Jack Hills zirconsRecently, zircon crystals, extracted from Jack Hills meta-quartzites in
Australia gave an age of 4.404±0.008 Ga (Wilde et al., 2001), which is theoldest age so far obtained on terrestrial material (Figure 4.15). However, itmust be noted that many detrital zircons from Jack Hills and Mont Narryerin Australia already gave a great variety of ages ranging between 4.3 and4.0 Ga (Froude et al., 1983; Compston and Pidgeon, 1986; Cavosie et al.,2004), which demonstrates that Hadean crust existed but also that it devel-oped and grew all along Hadean times.
• Zircons predominantly crystallize in granitic (s.l.) melts, so it can bereasonably concluded that granitoids already formed at 4.4 Ga. Thisconclusion is reinforced by the presence, into the zircon crystals of
Figure 4.15. Cathodoluminescence image of zircon W74/2-36 from the Jack Hills metacon-glomerate (Western Australia). An age of 4.404 Ga has been determined by ion microprobe
from the place shown by an ellipse. This crystal also contains quartz (Qt) inclusions indicatingthat it crystallized in a granite-like magma (Photo: John Valley, University of Wisconsin,Madison).
134 HERVE MARTIN ET AL.

inclusions of quartz, feldspars, hornblende, biotite and monazite; theseminerals crystallized together with the zircon and are typical ofgranitoids (Maas et al., 1992; Wilde et al., 2001; Cavosie et al., 2004).Consequently, as granitoids are the main components of continentalcrust, it can be concluded that continental crust existed at 4.4 Ga. Basedon a hafnium isotope studies in these zircon crystals, Harrison et al.(2005) concluded that both continental crust genesis and plate tectonicsbegan during the first 100–150 Ma of Earth history.
• From Rare Earth Element (REE) content in zircons, and based onpartition coefficients between felsic melts and zircon, it is possible toestimate the REE content of the host magma. The melt compositionscalculated from older zircons have REE patterns enriched in Light REE(LREE: La to Sm) and depleted in Heavy REE (HREE: Gd to Lu)(Wilde et al., 2001); which are characteristics of Archaean granites(TTG, Martin et al., 2005). Similarly, Type-1 zircons from Jack Hillshave the same REE patterns as Acasta gneiss ones that are TTG incomposition (Hoskin, 2005). Consequently, very probably Jack Hillscrystallized in TTG-type felsic magma.
• The population of Jack Hills zircons not only recorded ages of 4.4 Ga,but on the contrary, they recorded several continental crust genesisevents. Cavosie et al. (2004), evidenced several picks of crustal growth at4.4, 4.25, 4.2, 4.0 Ga (Figure 4.16). It can be concluded that the Hadeancontinental crust grew over a time range of about 400 Ma, even if theprocess could have been episodic (as it is since 4.0 Ga).
JackHills zircons also possess rims that indicate that during the 4.4–4.0 timeinterval, they underwent reworking (re-melting). Suchmechanism signifies thatthis Hadean continental has been stable enough to be re-worked, by both
Figure 4.16. Histogram of age frequency of 88 zircons from Jack Hills, Mont Narryer andBarlee terrane (Cavosie et al., 2004).
135BUILDING OF A HABITABLE PLANET

magmatic and sedimentary processes. Similarly, the fact that these zircons existimplies that the early continental crust was enough stable (and consequentlywith a sufficiently huge volume) to resist at least partly to the Late HeavyBombardment.
• Oxygen isotope measurements performed on Jack Hills zircons(d18O = 5.4 to 15) allow to calculate the isotopic composition of theirhost magma which ranges between d18O = 7 and d18O = 11 (Mojzsiset al., 2001; Peck et al., 2001; Wilde et al., 2001). These authorsconclude that the zircons contain crustal material that had interactedwith liquid water under surface or near surface conditions. These dataare extremely important as they imply that liquid water (ocean?) wasprobably available on Earth surface as early as 4.4 Ga. In addition, thegenesis of TTG like magmas results of hydrous melting of metamor-phosed basalts, in the stability field of garnet (Martin, 1986; Martinet al., 2005); which, in turn, also implies the existence of anhydrosphere.
In conclusion, Jack Hills zircons, demonstrate that a TTG like continentalcrust existed as early as 4.4 Ga ago and that it more or less regularly con-tinued to be generated and re-worked during the whole Hadean. This crustcan be considered as stable, such that it can resist to meteoritic bombard-ment. In addition, Hadean crust composition (TTG) as well as zirconsoxygen isotopic composition militate in favour of liquid water on Earthsurface during Hadean, which could constitute a strong argument for dis-cussing possible life existence and development.
4.3.3.3. Discussion of zircon dataJack Hills zircons are subject to several extensive studies and recent papers
(Utsunomiya et al., 2004; Hoskin, 2005) seem to moderate the enthusiasmprovoked by the oxygen isotopes data. Indeed, based on REE, Hoskin (2005)showed that it exists two populations of zircons in Jack Hills population; onegroup is considered as having recorded primary magmatic composition (type-1), whereas the other (type-2) displays typical hydrothermal features. Thehydrothermalism is supposed to have occurred 130 Ma after zircon crystal-lization. The group, which evidenced hydrothermalism, is also the one withthe higher d18O. The author consider that this hydrothermalism did notnecessarily required huge amounts of liquid water, but that it could havedeveloped with small volumes of ephemeral fluid. The conclusion of theauthor is that, their results do not provide any evidence that ocean did notexist during Hadean times, but on the other hand, most high d18O in JackHills zircons do not prove that liquid water was permanently available onHadean Earth surface or near surface.
136 HERVE MARTIN ET AL.
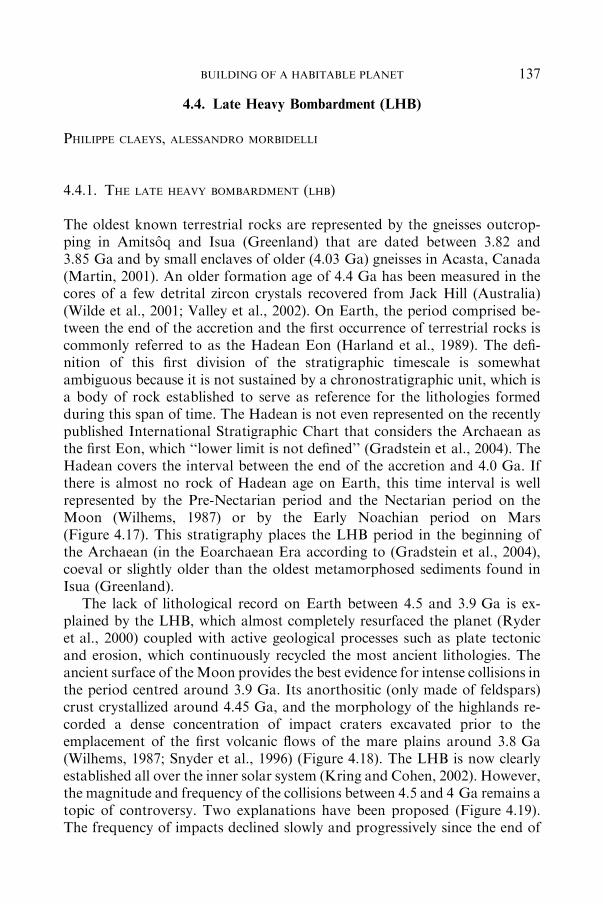
4.4. Late Heavy Bombardment (LHB)
PHILIPPE CLAEYS, ALESSANDRO MORBIDELLI
4.4.1. THE LATE HEAVY BOMBARDMENT (LHB)
The oldest known terrestrial rocks are represented by the gneisses outcrop-ping in Amitsoq and Isua (Greenland) that are dated between 3.82 and3.85 Ga and by small enclaves of older (4.03 Ga) gneisses in Acasta, Canada(Martin, 2001). An older formation age of 4.4 Ga has been measured in thecores of a few detrital zircon crystals recovered from Jack Hill (Australia)(Wilde et al., 2001; Valley et al., 2002). On Earth, the period comprised be-tween the end of the accretion and the first occurrence of terrestrial rocks iscommonly referred to as the Hadean Eon (Harland et al., 1989). The defi-nition of this first division of the stratigraphic timescale is somewhatambiguous because it is not sustained by a chronostratigraphic unit, which isa body of rock established to serve as reference for the lithologies formedduring this span of time. The Hadean is not even represented on the recentlypublished International Stratigraphic Chart that considers the Archaean asthe first Eon, which ‘‘lower limit is not defined’’ (Gradstein et al., 2004). TheHadean covers the interval between the end of the accretion and 4.0 Ga. Ifthere is almost no rock of Hadean age on Earth, this time interval is wellrepresented by the Pre-Nectarian period and the Nectarian period on theMoon (Wilhems, 1987) or by the Early Noachian period on Mars(Figure 4.17). This stratigraphy places the LHB period in the beginning ofthe Archaean (in the Eoarchaean Era according to (Gradstein et al., 2004),coeval or slightly older than the oldest metamorphosed sediments found inIsua (Greenland).
The lack of lithological record on Earth between 4.5 and 3.9 Ga is ex-plained by the LHB, which almost completely resurfaced the planet (Ryderet al., 2000) coupled with active geological processes such as plate tectonicand erosion, which continuously recycled the most ancient lithologies. Theancient surface of theMoon provides the best evidence for intense collisions inthe period centred around 3.9 Ga. Its anorthositic (only made of feldspars)crust crystallized around 4.45 Ga, and the morphology of the highlands re-corded a dense concentration of impact craters excavated prior to theemplacement of the first volcanic flows of the mare plains around 3.8 Ga(Wilhems, 1987; Snyder et al., 1996) (Figure 4.18). The LHB is now clearlyestablished all over the inner solar system (Kring and Cohen, 2002). However,the magnitude and frequency of the collisions between 4.5 and 4 Ga remains atopic of controversy. Two explanations have been proposed (Figure 4.19).The frequency of impacts declined slowly and progressively since the end of
137BUILDING OF A HABITABLE PLANET

the accretion period explaining why the bombardment is still importantaround 3.9 Ga (Hartmann, 1975; Wilhems, 1987; Hartmann et al., 2000).According to these authors, the so-called LHB is not an exceptional event.Rather it is the tail end of a 600 million year period, during which the Earthwas subject to major and devastating collisions, with seminal consequencessuch as the chronic melting of the crust and the vaporization of the oceans.Another view advocates a rapid decline in the frequency of impacts after theformation of the Moon to a value only slightly higher than today (�2X). The
Figure 4.17. Comparative stratigraphy of the first 1.5 Ga on Earth and on the Moon. The fullarrows are isotopic dates, the dotted-line arrows are dates based on relative chronology
(modified after Ryder et al., 2000).
138 HERVE MARTIN ET AL.
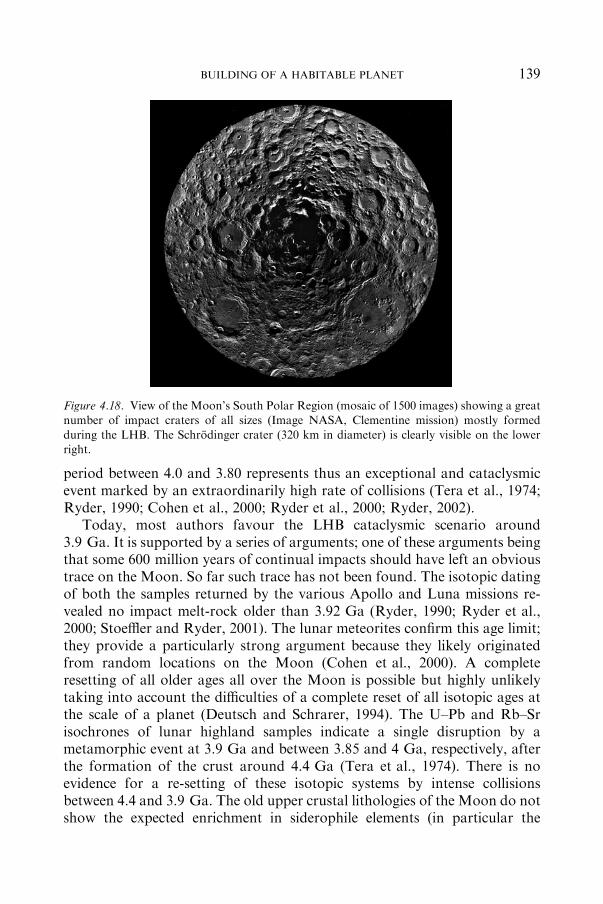
period between 4.0 and 3.80 represents thus an exceptional and cataclysmicevent marked by an extraordinarily high rate of collisions (Tera et al., 1974;Ryder, 1990; Cohen et al., 2000; Ryder et al., 2000; Ryder, 2002).
Today, most authors favour the LHB cataclysmic scenario around3.9 Ga. It is supported by a series of arguments; one of these arguments beingthat some 600 million years of continual impacts should have left an obvioustrace on the Moon. So far such trace has not been found. The isotopic datingof both the samples returned by the various Apollo and Luna missions re-vealed no impact melt-rock older than 3.92 Ga (Ryder, 1990; Ryder et al.,2000; Stoeffler and Ryder, 2001). The lunar meteorites confirm this age limit;they provide a particularly strong argument because they likely originatedfrom random locations on the Moon (Cohen et al., 2000). A completeresetting of all older ages all over the Moon is possible but highly unlikelytaking into account the difficulties of a complete reset of all isotopic ages atthe scale of a planet (Deutsch and Schrarer, 1994). The U–Pb and Rb–Srisochrones of lunar highland samples indicate a single disruption by ametamorphic event at 3.9 Ga and between 3.85 and 4 Ga, respectively, afterthe formation of the crust around 4.4 Ga (Tera et al., 1974). There is noevidence for a re-setting of these isotopic systems by intense collisionsbetween 4.4 and 3.9 Ga. The old upper crustal lithologies of the Moon do notshow the expected enrichment in siderophile elements (in particular the
Figure 4.18. View of the Moon’s South Polar Region (mosaic of 1500 images) showing a greatnumber of impact craters of all sizes (Image NASA, Clementine mission) mostly formed
during the LHB. The Schrodinger crater (320 km in diameter) is clearly visible on the lowerright.
139BUILDING OF A HABITABLE PLANET

Platinum Group Elements, PGE) implied by an extended period of intensecollisions (Ryder et al., 2000). Moreover, if the elevated mass accretiondocumented in the period around 3.9 Ga is considered to be the tail end of anextended period of collisions, the whole Moon should have accreted at about4.1 Ga instead of 4.5 Ga (Ryder, 2002; Koeberl, 2004). On Earth, the oxygenisotopic signature (d18O) of the oldest known zircons (4.4 Ga) indicatesformation temperatures compatible with the existence of liquid water (Valleyet al., 2002). This argument seems contradictory with an extended period ofintense collisions. It can thus be concluded that today, there is strong evi-dence for a cataclysmic LHB event in the inner solar system around 3.9 Ga;in other words a short and intense peak in the cratering rate rather than aprolonged post-accretionary bombardment lasting �600 Ma.
On planets, whose surface was not re-modelled by erosion, sedimentationand plate tectonics (Moon, Mars, Venus...) the ancient impact structuresfrequently exceed 1000 km in diameter (Stoeffler and Ryder, 2001). Thebattered old surfaces of these planets witness past collisions which frequencyand scale were 2 to perhaps 3 orders of magnitude higher than the Phan-erozoic values. It seems highly unlikely that a target the size of Earth wouldhave been spared, even if active geological processes have obliterated therecord of these past impacts. Their traces are perhaps to be found in the
Figure 4.19. Schematic representation of the flux of projectile on Earth between 4.5 and3.5 Ga (modified after Kring, 2003). The green curve shows a slow decrease of the bom-
bardment, the red curve illustrates the leading hypothesis of a rapid decrease of the fluxfollowed by an unexplained peak, the Late Heavy Bombardment, around 4.0–3.9 Ga. Theduration of this high flux period varies (20 and 200 Ma); the slope of the decrease after 3.9 Ga
is also poorly constrained. It cannot be excluded that other cataclysmic events took placebetween 4.5 and 4.0 Ga, but their traces must have been fully erased by the complete resettingof the Earth surface caused by the last event.
140 HERVE MARTIN ET AL.
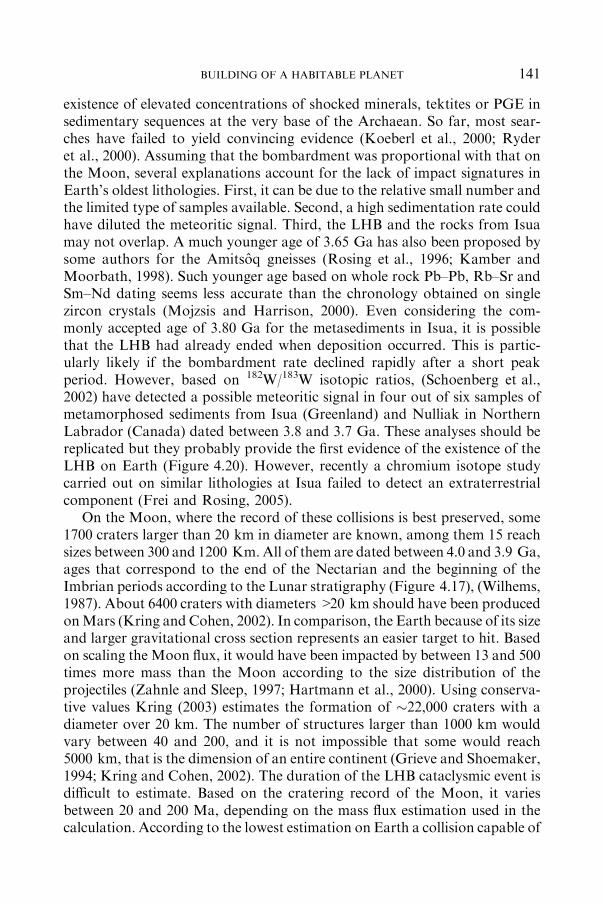
existence of elevated concentrations of shocked minerals, tektites or PGE insedimentary sequences at the very base of the Archaean. So far, most sear-ches have failed to yield convincing evidence (Koeberl et al., 2000; Ryderet al., 2000). Assuming that the bombardment was proportional with that onthe Moon, several explanations account for the lack of impact signatures inEarth’s oldest lithologies. First, it can be due to the relative small number andthe limited type of samples available. Second, a high sedimentation rate couldhave diluted the meteoritic signal. Third, the LHB and the rocks from Isuamay not overlap. A much younger age of 3.65 Ga has also been proposed bysome authors for the Amitsoq gneisses (Rosing et al., 1996; Kamber andMoorbath, 1998). Such younger age based on whole rock Pb–Pb, Rb–Sr andSm–Nd dating seems less accurate than the chronology obtained on singlezircon crystals (Mojzsis and Harrison, 2000). Even considering the com-monly accepted age of 3.80 Ga for the metasediments in Isua, it is possiblethat the LHB had already ended when deposition occurred. This is partic-ularly likely if the bombardment rate declined rapidly after a short peakperiod. However, based on 182W/183W isotopic ratios, (Schoenberg et al.,2002) have detected a possible meteoritic signal in four out of six samples ofmetamorphosed sediments from Isua (Greenland) and Nulliak in NorthernLabrador (Canada) dated between 3.8 and 3.7 Ga. These analyses should bereplicated but they probably provide the first evidence of the existence of theLHB on Earth (Figure 4.20). However, recently a chromium isotope studycarried out on similar lithologies at Isua failed to detect an extraterrestrialcomponent (Frei and Rosing, 2005).
On the Moon, where the record of these collisions is best preserved, some1700 craters larger than 20 km in diameter are known, among them 15 reachsizes between 300 and 1200 Km.All of them are dated between 4.0 and 3.9 Ga,ages that correspond to the end of the Nectarian and the beginning of theImbrian periods according to the Lunar stratigraphy (Figure 4.17), (Wilhems,1987). About 6400 craters with diameters >20 km should have been producedonMars (Kring and Cohen, 2002). In comparison, the Earth because of its sizeand larger gravitational cross section represents an easier target to hit. Basedon scaling the Moon flux, it would have been impacted by between 13 and 500times more mass than the Moon according to the size distribution of theprojectiles (Zahnle and Sleep, 1997; Hartmann et al., 2000). Using conserva-tive values Kring (2003) estimates the formation of �22,000 craters with adiameter over 20 km. The number of structures larger than 1000 km wouldvary between 40 and 200, and it is not impossible that some would reach5000 km, that is the dimension of an entire continent (Grieve and Shoemaker,1994; Kring and Cohen, 2002). The duration of the LHB cataclysmic event isdifficult to estimate. Based on the cratering record of the Moon, it variesbetween 20 and 200 Ma, depending on the mass flux estimation used in thecalculation. According to the lowest estimation on Earth a collision capable of
141BUILDING OF A HABITABLE PLANET

generating a 20 km crater could take place every 10,000 years (Kring, 2003).This would correspond to the impact of a �1 km projectile, an event thatpresently occurs once every 0.350–1 Ma. If the highest estimation is consid-ered, the frequency increases to such an impact every 20 years!
Based on the lunar cratering record, it seems that around 3.8 Gathe impact frequency had decreased significantly and stabilized close to thepresent values. However, slope of the decrease is difficult to estimate. The40Ar–39Ar dating of spherules formed by lunar impacts shows that thisdecrease in the frequency is perhaps more progressive (by factor 2 or 3between 3.5 and 1 Ga), and that it has increased slightly again some 500 Ma
Figure 4.20. Values of eW for terrestrial rocks, meteorites and early Archaean samples rela-tive to the composition of a tungsten standard, ACQUIRE-W (Figure modified fromSchoenberg et al., 2002). Blue diamonds represent early Archaean metasediments, which plot
outside the terrestrial values. Dashed lines show 2r of mean uncertainty envelope of thestandard (n = 46). Terrestrial samples are represented by red circles. Open star is an averageof published iron meteorites; filled star an average of bulk rock enstatite chondrites; open
squares are bulk rock ordinary chondrites; filled squares represent Allende carbonaceouschondrite. Dark blue diamond is an average of early Archaean crust samples.
142 HERVE MARTIN ET AL.
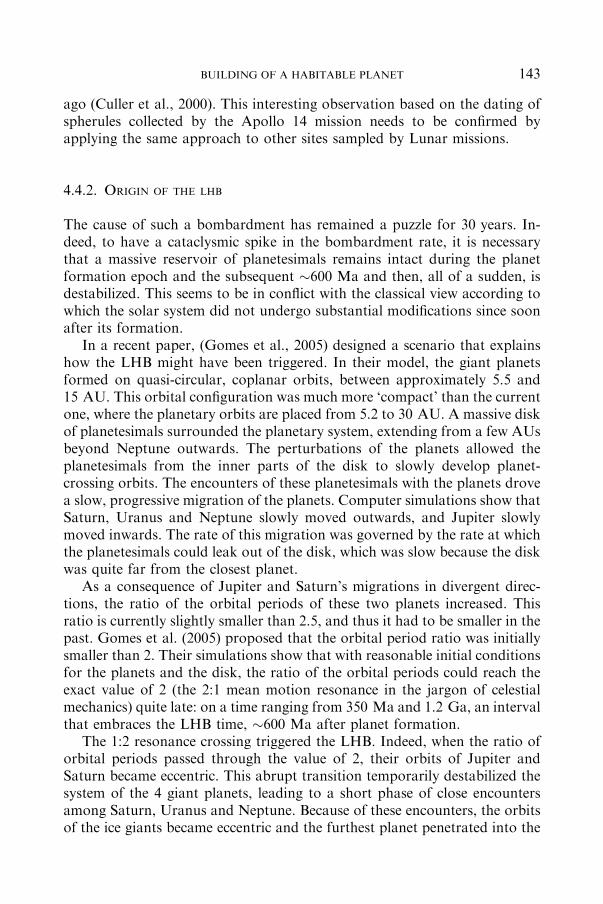
ago (Culler et al., 2000). This interesting observation based on the dating ofspherules collected by the Apollo 14 mission needs to be confirmed byapplying the same approach to other sites sampled by Lunar missions.
4.4.2. ORIGIN OF THE LHB
The cause of such a bombardment has remained a puzzle for 30 years. In-deed, to have a cataclysmic spike in the bombardment rate, it is necessarythat a massive reservoir of planetesimals remains intact during the planetformation epoch and the subsequent �600 Ma and then, all of a sudden, isdestabilized. This seems to be in conflict with the classical view according towhich the solar system did not undergo substantial modifications since soonafter its formation.
In a recent paper, (Gomes et al., 2005) designed a scenario that explainshow the LHB might have been triggered. In their model, the giant planetsformed on quasi-circular, coplanar orbits, between approximately 5.5 and15 AU. This orbital configuration was much more ‘compact’ than the currentone, where the planetary orbits are placed from 5.2 to 30 AU. A massive diskof planetesimals surrounded the planetary system, extending from a few AUsbeyond Neptune outwards. The perturbations of the planets allowed theplanetesimals from the inner parts of the disk to slowly develop planet-crossing orbits. The encounters of these planetesimals with the planets drovea slow, progressive migration of the planets. Computer simulations show thatSaturn, Uranus and Neptune slowly moved outwards, and Jupiter slowlymoved inwards. The rate of this migration was governed by the rate at whichthe planetesimals could leak out of the disk, which was slow because the diskwas quite far from the closest planet.
As a consequence of Jupiter and Saturn’s migrations in divergent direc-tions, the ratio of the orbital periods of these two planets increased. Thisratio is currently slightly smaller than 2.5, and thus it had to be smaller in thepast. Gomes et al. (2005) proposed that the orbital period ratio was initiallysmaller than 2. Their simulations show that with reasonable initial conditionsfor the planets and the disk, the ratio of the orbital periods could reach theexact value of 2 (the 2:1 mean motion resonance in the jargon of celestialmechanics) quite late: on a time ranging from 350 Ma and 1.2 Ga, an intervalthat embraces the LHB time, �600 Ma after planet formation.
The 1:2 resonance crossing triggered the LHB. Indeed, when the ratio oforbital periods passed through the value of 2, their orbits of Jupiter andSaturn became eccentric. This abrupt transition temporarily destabilized thesystem of the 4 giant planets, leading to a short phase of close encountersamong Saturn, Uranus and Neptune. Because of these encounters, the orbitsof the ice giants became eccentric and the furthest planet penetrated into the
143BUILDING OF A HABITABLE PLANET

disk. This destabilized the disk completely. All planetesimals were scatteredin sequence by the planets. A fraction of them temporarily penetrated intothe inner solar system. About 10)7 of the original planetesimals hit the Moonand 10)6 hit the Earth. About 10)3 of the original planetesimals probablyremained trapped in the Kuiper belt.
The interaction of the planets with the destabilized disk enhanced planetmigration and damped the planetary eccentricities and inclinations. A largenumber of simulations of this process, made by Tsiganis et al. (2005) showthat, if the planetesimal disk contained about 35 Earth masses at the time ofthe LHB, the planets statistically had to end on orbits very close to thosecurrently observed. A more massive disk would have driven Jupiter andSaturn too far apart, and a less massive disk would not have moved themenough. Interestingly, given this total disk mass, the total mass of theplanetesimals hitting the Moon turns out to be consistent with that inferredfrom the counting of basins formed at the LHB time.
The distant planetesimals were not the sole cause of the LHB though. Themigrationof Jupiter andSaturn from the 1:2 resonance to their current positiondestabilized also the asteroid belt. About 90% of the asteroids could developorbits crossing those of the terrestrial planets, although this fraction is poorlyestimated because it depends on the dynamical state of the asteroid belt beforetheLHB,which is unknown.Given the currentmass of the asteroidbelt (5 · 104
Earth masses), this implies that �5 · 103 Earth masses of asteroids becameEarth crossers.Of these, about 2 · 10)4 hit theMoon, supplying again amass ofprojectiles consistent with the LHB constraints. Thus, according to Gomeset al. (2005) model, the projectiles causing the LHBwould have been amixtureof comets (from the distant disk) and asteroids, in roughly equal proportions.The exact relative contribution of asteroids and comets to the LHB cannot bestated with precision from the model, at least at the current state. Chemicalanalyzes on lunar samples collected in the vicinity of basins seem to indicatethat asteroids of enstatite or more likely ordinary chondritic type participatedin the process (Kring and Cohen, 2002; Tagle, 2005).
The strength of Gomes et al. (2005) model on the origin of the LHB is thatit explains not only the main characteristics of the LHB (intensity, duration,abrupt start) but also several other puzzling properties of the solar system. Itaccounts for the orbital architecture of the giant planets (for what concernsboth the mutual spacing, the eccentricities and the mutual inclinations of theorbits, Tsiganis et al., 2005), the population of Jovian Trojans (for whatconcerns their orbital distribution and total mass, Morbidelli et al., 2005),the absence of numerous asteroid families formed at the LHB time (Gomeset al., 2005).
There do not seem to be many alternatives to Gomes et al. (2005) model.The destabilization of a small body reservoir requires a change in planetaryorbits. Planet migration gives such a change, and once it is done, the solar
144 HERVE MARTIN ET AL.
system has acquired the current state. Thus, to make a cataclysmic LHBplanet migration had effectively to start at that time. Two conditions need tobe fulfilled in order for a compact planetary system to stay quiet for morethan half a billion years. The first is that the planetary orbits had to be quasi-circular. The second is that the region among the planets was essentiallydepleted of planetesimals. If the planetary orbits had to be quasi-circular,then an event had to excite the eccentricities. Resonance crossing provideseccentricity excitation, but only the 1:2 resonance between Jupiter and Saturnprovides the required eccentricity values. Thus, Jupiter and Saturn had tocross this resonance. And these are the basic ingredients of Gomes et al.(2005) model.
References
Abe, Y.: 1993, Lithos 30, 223–235.
Abe, Y., Drake, M., Ohtani, E., Okuchi, T. and Righter, K.: 2000, in K. Righter and R.Canup (eds.), Origin of the Earth and Moon (University of Arizona Press, Tucson,Arizona), pp. 413–433.
Albarede, F., Blichert-Toft, J., Vervoort, J. D., Gleason, J. D. and Rosing, M. T.: 2000,
Nature 404, 488–490.Aleon, J., Engrand, C., Robert, F. and Chaussidon, M.: 2001, Geochim. Cosmochim. Acta 65,
4399–4412.
Aleon, J., Robert, F., Chaussidon, M. and Marty, B.: 2003, Geochim. Cosmochim. Acta 67(19),3773–3783.
Amelin, Y., Krot, A. N., Hutcheon, I. D. and Ulyanov, A. A.: 2002, Science 297, 1679–1683.
Anders, E.: 1989, Nature 342, 255–257.Appel, P. W. U., Moorbath, S. and Touret, J.: 2002, Precambrian Res. 176, 173–180.Arpigny, C., Jehin, E., Manfroid, J., Hutsemeker, D., Schulz, R., Stuwe, J. A., Zucconi, J. M.
and Ilyin, I.: 2003, Science 301, 1522–1524.Baadsgaard, H., Nutman, A. P., Bridgwater, D., Rosing, M. T., McGregor, V. R. and Allaart,
J. H.: 1984, Earth Planet. Sci. Lett. 68, 221–228.Ballentine, C. J., Marty, B., Lollar, B. S. and Cassidy, M.: 2005, Nature 433(7021), 33–38.
Barnes, I. and O’Neil, J. R.: 1969, Geol. Soc. Amer. Bull. 80, 1947–1960.Bennet, V. C., Nutman, A. P. and McCulloch, M. T.: 1993, Earth Planet. Sci. Lett. 119, 299–
317.
Bizzarro, M., Baker, J. A. and Haack, H.: 2004, Nature 431(7006), 275–278.Black, L. P., Gale, N. H., Moorbath, S., Pankhurst, R. J. and McGregor, V. R.: 1971, Earth
Planet. Sci. Lett. 12, 245–259.
Bland, P. A., Smith, T. B., Jull, A. J. T., Berry, F. J., Bewan, A. W. R., Cloudt, S. andPillinger, C. T.: 1996, Mon. Not. R. Astron. Soc. 283, 551–565.
Boato, G.: 1954, Geochim. Cosmochim. Acta 6, 209–220.Bolhar, R., Kamber, B. S., Moorbath, S., Fedo, C. M. and Whitehouse, M. J.: 2004, Earth
Planet. Sci. Lett. 222(1), 43–60.Bolhar, R., Kamber, B. S., Moorbath, S., Whitehouse, M. J. and Collerson, K. D.: 2005,
Geochim. Cosmochim. Acta 69(6), 1555–1573.
Bouvier, A., Blichert-Toft, J., Vervoort, J. D. and Albarede, F.: 2005, Earth Planet. Sci. Lett.240(2), 221–233.
145BUILDING OF A HABITABLE PLANET
Bowring, S. A. and Houst, T. B.: 1995, Science 269, 1535–1540.Bowring, S. A. and Williams, I. S.: 1999, Contrib. Mineral. Petrol 134, 3–16.
Boyet, M., Blichert-Toft, J., Rosing, M., Storey, M., Telouk, P. and Albarede, F.: 2003, EarthPlanet. Sci. Lett. 214(3–4), 427–442.
Boyet, M. and Carlson, R. W.: 2005, Science 309, 576–581.
Bridgwater, D., McGregor, V. R. and Myers, J. S.: 1974, Precambrian Res. 1, 179–197.Brownlee, D. E.: 1985, Ann. Rev. Earth Planet. Sci. Lett. 13, 147–173.Brownlee, D. E., Joswiak, D. J., Love, S. G., Nier, A. O., Schlutter, D. J. and Bradley, J. P.:
1993, Lunar Planet. Sci. XXIV, 205–206.
Canup, R. and Asphaug, E.: 2001, Nature 412, 708–712.Caro, G., Bourdon, B., Birck, J.-L. and Moorbath, S.: 2003, Nature 423(6938), 428–432.Cavosie, A. J., Valley, J. W. and Wilde, S. A.E. I. M. F.: 2005, Earth Planet. Sci. Lett. 235,
663–681.Cavosie, A. J., Wilde, S. A., Liu, D., Weiblen, P. W. and Valley, J. W.: 2004, Precambrian Res.
135(4), 251–279.
Cherniak, D. J.: 2001, Chem. Geol. 177(3–4), 381–397.Cherniak, D. J., Lanford, W. A. and Ryerson, F. J.: 1991, Geochim. Cosmochim. Acta 55,
1663–1673.
Chyba, C.: 1990, Nature 343, 129–133.Chyba, C. and Sagan, C.: 1992, Nature 355, 125–132.Chyba, C. F.: 1991, Icarus 92, 217–233.Clarke, W. B., Beg, M. A. and Craig, H.: 1969, Earth Planet. Sci. Lett. 6, 213–220.
Clayton, R. N.: 1993, Ann. Rev. Earth Planet. Sci. Lett. 21, 115–149.Cohen, B. A., Swindle, T. D. and Kring, D. A.: 2000, Science 290(5497), 1754–1756.Collerson, K. D. and Bridgwater, D.: 1979, in F. Barker (ed.), Trondhjemites, Dacites and
Related Rocks (Elsevier, Amsterdam), pp. 206–273.Collerson, K. D., Campbell, I. H., Weaver, B. L. and Palacz, Z. A.: 1991, Nature 349, 209–
214.
Compston, W. and Pidgeon, R. T.: 1986, Nature 321, 766–769.Conrad, C. P. and Hager, B. H.: 1999, J. Geophys. Res. 104, 17551–17571.Culler, T. S., Becker, T. A., Muller, R. A. and Renne, P. R.: 2000, Science 287(5459), 1785–
1788.Dauphas, N.: 2003, Icarus 165(2), 326–339.Dauphas, N. and Marty B.: 2002, J. Geophys. Res. Planets 107, E12-1–E12-7.Dauphas, N., Robert, F. and Marty, B.: 2000, Icarus 148(2), 508–512.
David, J., Parent M., Stevenson R., Nadeau P. and Godin L.: 2002. La sequence supracrustalede Porpoise Cove, region d’Inukjuak; un exemple unique de croute paleo-archeenne (ca.3.8 Ga) dans la Province du Superieur. 23 eme Seminaire d’information sur la recherche
geologique, Ministere des ressources naturelles du Quebec.(session 2).de Ronde, C. E. J., Channer, D. M. d., Faure, K., Bray, C. J. and Spooner, T. C.: 1997,
Geochim. Cosmochim. Acta 61(19), 4025–4042.
Delsemme, A. H.: 1999, Planet. Space Sci. 47, 125–131.Deming, D.: 1999, Palaeogeogr. Palaeoclimatol. Palaeoecol. 146, 33–51.Deutsch, A. and Schrarer, U.: 1994, Meteoritics 29, 301–322.Dreibus, G. and Wanke, H.: 1989, in S. K. Atreya, J. B. Pollack and M. S. Matthews (eds.),
Origin and Evolution of Planetary and Satellite Atmospheres (University of Arizona Press,Tucson), pp. 268–289.
Engrand, C., Deloule, E., Robert, F., Maurette, M. and Kurat, G.: 1999, Meteor. Planet. Sci.
34, 773–786.Engrand, C. and Maurette, M.: 1998, Meteorit. Planet. Sci. 33, 565–580.
146 HERVE MARTIN ET AL.
Farley, K. A., Montanari, A., Shoemaker, E. M. and Shoemaker, C.: 1998, Science 1250–1253.
Fedo, C. M.: 2000, Precambrian Res. 101(1), 69–78.Fedo, C. M., Myers, J. S. and Appel, P. W. U.: 2001, Sediment. Geol. 141–142, 61–77.Fedo, C. M. and Whitehouse, M. J.: 2002, Science 296, 1448–1452.
Frank, L. A., Sigwarth, J. B. and Craven, J. D.: 1986, Geophys. Res. Lett. 13, 303–306.Frank, L. A., Sigwarth, J. B. and Craven, J. D.: 1986, Geophys. Res. Lett. 13, 303–306.Frei, R. and Rosing, M. T.: 2005, Earth Planet. Sci. Lett. 236, 28–40.Froude, D. O., Ireland, T. R., Kinny, P. D., Williams, I. S., Compston, W., Williams, I. R.
and Myers, J. S.: 1983, Nature 304, 616–618.Gast, P. W.: 1960, J. Geophys. Res. 65, 1287–1297.Genda, H. and Abe, Y.: 2005, Nature 433, 842–844.
Gomes, R., Levison, H. F., Tsiganis, K. and Morbidelli, A.: 2005, Nature 435, 466–469.Gopel, C., Manhes, G. and Allegre, C. J.: 1994, Earth Planet. Sci. Lett. 121, 153–171.Gounelle, M., Zolensky, M. and Liou, J. C.: 2002, Geochim. Cosmochim. Acta 67, 507–527.
Gradie, J. C., Chapman, C. R. and Tedesco, E. F.: 1989, in T. G. M. S. M. R. P. Binzel (ed.),Asteroids II (Univ. Arizona Press, Tucson), pp. 316–335.
Gradstein F. M., Ogg J. G., Smith A. G., Agterberg F. P., Bleeker W., Cooper R. A.,
Davydov V., Gibbard P., Hinnov L., (y) M. R. H., Lourens L., Luterbacher H.-P.,McArthur J., Melchin M. J., Robb L. J., Shergold J., Villeneuve M., Wardlaw B. R., Ali J.,Brinkhuis H., Hilgen F. J., Hooker J., Howarth R. J., Knoll A. H., Laskar J., Monechi S.,Powell J., Plumb K. A., Raffi I., Rohl U., Sanfilippo A., Schmitz B., Shackleton N. J.,
Shields G. A., Strauss H., Dam J. V., Veizer J., Kolfschoten T.v. and Wilson D.: 2004, AGeological Time Scale 2004. Cambridge University, Cambridge, 610 pp.
Gray, C. M. and Compston, W.: 1974, Nature 251, 495–497.
Grieve, R. A. F. and Shoemaker, E. M.: 1994, in T. Gehrels (ed.), Hazards Due to Cometsand Asteroids (Univ. Arizona Press, Tucson), pp. 417–462.
Halliday, A. N., Wanke, H., Birck, J. L. and Clayton, R. N.: 2001, Space Sci. Rev. 96, 1–34.
Harland, W. B., Armstrong, R. L., Cox, A. V., Craig, L. E., Smith, A. G. and Smith, D. G.:1989, A Geologic Time Scale, Cambridge University Press, Cambridge, 263 pp.
Harrison, C. G. A.: 1999, Geophys. Res. Lett. 26, 1913–1916.
Harrison, T. M., Blichert-toft, J., Muller, W., Albarede, F., Holden, P. and Mojzsis, S. J.:2005, Science 310, 1947–1950.
Hartmann, W. K.: 1975, Icarus 24, 181–187.Hartmann, W. K., Ryder, G., Dones, L. and Grinspoon, D.: 2000, in K. Righter and
R. Canup (eds.), Origin of the Earth and Moon (University f Arizona Press, Tucson,Arizona), pp. 493–512.
Hashizume, K., Chaussidon, M., Marty, B. and Robert, F.: 2000, Science 290(5494), 1142–
1145.Hashizume, K., Kase, T. and Matsuda, J. I.: 1997, Kazan 42, S293–S301.Hashizume, K., Marty, B. and Wieler, R.: 2002, Earth Planet. Sci. Lett. 202, 201–216.
Honda, M., McDougall, I., Patterson, D. B., Doulgeris, A. and Clague, D. A.: 1991, Nature349, 149–151.
Hood, L. L. and Horanyi, : 1993, Icarus 106, 179–189.Hoskin, P. W. O.: 2005, Geochim. Cosmochim. Acta 69(3), 637–648.
Hunten, D. M., Pepin, R. O. and Walker, J. C. B.: 1987, Icarus 69, 532–549.Jacobsen, S. B. and Yin, Q.: 2003, Lunar Planet. Sci. XXXIV, 1913 .Jahn, B. M.: 1997, in R. Hagemann and M. Treuil (eds.), Introduction a la Geochimie et ses
Applications (Editions Thierry Parquet), pp. 357–393.Javoy, M.: 1995, J. Geophys. Res. Lett. 22, 2219–2222.
147BUILDING OF A HABITABLE PLANET

Javoy, M.: 1998, Chem. Geol. 147, 11–25.Javoy, M.: 2005, C. R. Geosci. 337(1–2), 139–158.
Jewitt, D. C., Matthews, H. E., Owen, T. and Meier, R.: 1997, Science 278(5335), 90–93.Kamber, B. S., Collerson, K. D., Moorbath, S. and Whitehouse, M. J.: 2003, Contrib. Mineral.
Petrol. 145, 25–46.
Kamber, B. S. and Moorbath, S.: 1998, Chem. Geol. 150, 19–41.Keays, R. R., Ganapathy, R., Laul, J. C., Anders, E., Herzog, G. F. and Jeffery, P. M.: 1970,
Science 167, 490–493.Kerridge, J. F.: 1985, Geochim. Cosmochim. Acta 49, 1707–1714.
Kleine, T., Munker, C., Mezger, K. and Palme, H.: 2002, Nature 418, 952–955.Koeberl, C.: 2004, Earth Moon Planets 92, 79–87.Koeberl, C., Reimold, W. U., McDonald, I. and Rosing, M.: 2000, in I. Gilmour and
C. Koeberl (eds.), Impacts and the Early Earth (Springer, Berlin), pp. 73–97.Kortenkamp, S. J., Dermott, S. F., Fogle, D. and Grogan K.: 2001, in: B. P.-E.a.B. Schmitz
(ed.), Accretion of Extraterrestrial Matter Throughout Earth’s History (Kluwer Aca-
demic), pp. 13–30.Kring, D. A.: 2003, Astrobiology 3(1), 133–152.Kring, D. A. and Cohen, B. A.: 2002, J. Geophys. Res. 107(E2), 10.1029/2001JE001529.
Kurat, G., Koeberl, C., Presper, T., Branstatter, F. and Maurette, M.: 1994, Geochim. Cos-mochim. Acta 58, 3879–3904.
Kyte, F. T. and Wasson, J. T.: 1986, Science 232, 1225–1229.Lee, T., Papanastassiou, D. A. and Wasserburg, G. J.: 1976, Geophys. Res. Lett. 3, 109–112.
Lopez-Garcia, P.: 2005, in M. Gargaud, B. Barbier, H. Martin and J. Reisse (eds.), Lecturesin Astrobiology (Springer-Verlag, Berlin), pp. 657–676.
Love, S. G. and Brownlee, D. E.: 1993, Science 262, 550–553.
Maas, R., Kinny, P. D., Williams, I. S., Froude, D. O. and Compston W.: 1992,Geochim. Cosmochim. Acta 56, (1281–1300).
Mahaffy, P. R., Donahue, T. M., Atreya, S. K., Owen, T. C. and Niemann, H. B.: 1998, Space
Sci. Rev. 84(1–2), 251–263.Mamyrin, B. A., Tolstikhin, I. N., Anufriev, G. S. and Kamensky, I. L.: 1969, Dokkl. Akad.
Nauk. SSSR. 184, 1197–1199 (In Russian).
Martin, H.: 1986, Geology 14, 753–756.Martin, H.: 2001, in M. Gargaud, D. Despois and J.-P. Parisot (eds.), L’environnement De la
Terre Primitive (Presses Universitaires de Bordeaux, Bordeaux), pp. 263–286.Martin, H., Smithies, R. H., Rapp, R., Moyen, J.-F. and Champion, D.: 2005, Lithos 79(1–2),
1–24.Marty, B.: 1989, Earth Planet. Sci. Lett. 94, 45–56.Marty, B.: 1995, Nature 377, 326–329.
Marty, B. and Dauphas, N.: 2003, Earth Planet. Sci. Lett. 206, 397–410.Marty, B., Jambon, A. and Sano, Y.: 1989, Chem. Geol. 76, 25–40.Marty, B., Robert, P. and Zimmermann, L.: 2005, Meteorit. Planet. Sci. 40, 881–894.
Maurette, M.: 1998, Orig. Life Evol. Biosph. 28, 385–412.Maurette, M.: 2001, in M. Gargaud, D. Despois and J.-P. Parisot (eds.), L’environnement de
la terre primitive (Presses Universitaires de Bordeaux), pp. 99–130.Maurette, M., Duprat, J., Engrand, C., Gounelle, M., Kurat, G., Matrajt, G. and Toppani,
A.: 2000, Planet. Space Sci. 48(11), 1117–1137.Mazor, E., Heymann, D. and Andus, E.: 1970, Geochim. Cosmochim. Acta 34, 781–824.McCulloch, M. T. and Bennet, V. C.: 1993, Lithos 30, 237–255.
McCulloch, M. T. and Bennet, V. C.: 1994, Geochim. Cosmochim. Acta 58, 4717–4738.McGregor, V. R.: 1968, Rapport Gronlands Geol. Unders 19, 31.
148 HERVE MARTIN ET AL.
McGregor, V. R.: 1973, Philos. Trans. R. Soc. Lond. A A-273, 243–258.Messenger, S.: 2000, Nature 404, 968–971.
Messenger, S., Keller, L. P., Stadermann, F. J., Walker, R. M. and Zinner, E.: 2003, Science300, 105–108.
Messenger, S., Keller, L. P. and Walker, R. M.: 2002, Discovery of Abundant Silicates in
Cluster IDPs, LPS XXXIII, LPI, Houston, 1887 pp.Mizuno, H., Nakasawa, K. and Hayashi, C.: 1980, Earth Planet. Sci. Lett. 50, 202–210.Mojzsis, S. J., Arrhenius, G., Keegan, K. D., Harrison, T. H., Nutman, A. J. and Friend, C. L.
R.: 1996, Nature 384, 55–59.
Mojzsis, S. J., Harrison, M. T. and Pidgeon, R. T.: 2001, Nature 409, 178–181.Mojzsis, S. J. and Harrison, T. M.: 2000, GSA Today 10, 1–6.Moorbath, S. (ed.), 1977, Aspects of the geochronology of ancient rocks related to continental
evolution. The continental crust and its mineral deposits, 20. Geological Association ofCanada Special Paper, pp. 89–115.
Moorbath, S., O’Nions, R. K., Pankhurst, R. J., Gale, N. H. and McGregor, V. R.: 1972,
Nature 240, 78–82.Morbidelli, A.: 2002, Ann. Rev. Earth Planet. Sci. 30, 89–112.Morbidelli, A., Chambers, J., Lunine, J. I., Petit, J. M., Robert, F., Valsecchi, G. B. and Cyr,
K.E.: 2000, Meteorit. Planet. Sci. 35, 1309–1320.Morbidelli, A., Levison, H. F., Tsiganis, K. and Gomes, R.: 2005, Nature 435(7041), 462–465.Murakami, M., Hirose, K., Yurimoto, H., Nakashima, S. and Takafuji, N.: 2002, Science 295,
1885–1887.
Myers, J. S.: 2001, Precambrian Res. 105(2–4), 129–141.Nutman, A. J., Bennet, V. C., Friend, C. R. L. and McGregor, V. R.: 2000, Geochim. Cos-
mochim. Acta 64(17), 3035–3060.
Nutman, A. J. and Bridgwater, D.: 1986, Contrib. Mineral. Petrol. 94, 137–148.Nutman, A. J. and Collerson, K. D.: 1991, Geology 19, 791–794.Nutman, A. J., McGregor, V. R., Friend, C. R. L., Bennett, V. C. and Kinny, P. D.: 1996,
Precambrian Res. 78, 1–39.Nutman, A. P., Friend, C. R. L., Barker, S. L. L. and McGregor, V. R.: 2004, Precambrian
Res. 135(4), 281–314.
Nyquist, L. E., Wiesman, H., Bansal, B., Shih, C.-Y., Keith, J. E. and Harper, C. L.: 1995,Geochim. Cosmochim. Acta 59, 2817–2837.
Owen, T., Mahaffy, P. R., Niemann, H. B., Atreya, S. and Wong, M.: 2001, Astrophys. J. 553,L77–L79.
Ozima, M. and Podosek, F. A.: 2002. Noble Gas Geochemistry, Cambridge University Press,Cambridge, 286 pp.
Peck, W. H., Valley, J. W., Wilde, S. A. and Graham, C. M.: 2001, Geochim. Cosmochim. Acta
65(22), 4215–4229.Pepin, R. O.: 1991, Icarus 92, 1–79.Pinti, D. L.: 2002, Trends Geochem. 2, 1–17.
Pinti, D. L.: 2005, in M. Gargaud, B. Barbier, H. Martin and J. Reisse (eds.), Lectures inAstrobiology. Advances in Astrobiology and Biogeophysics (Springer-Verlag, Berlin), pp.83–107.
Podosek, F. A. and Cassen, P.: 1994, Meteorit. Planet. Sci. 29, 6–25.
Porcelli, D. and Halliday, A. N.: 2001, Earth Planet. Sci. Lett. 192(1), 45–56.Porcelli, D. and Pepin, R. O.: 2000, in R. M. Canup and K. Righter (eds.), Origin of the Earth
and Moon (The University of Arizona Press, Tucson), pp. 435–458.
Robert, F.: 2001, Science 293(5532), 1056.Robert, F.: 2003, Space Sci. Rev. 106(1–4), 87.
149BUILDING OF A HABITABLE PLANET

Robert, F. and Epstein, S.: 1982, Geochim. Cosmochim. Acta 46, 81–95.Robert, F., Gautier, D. and Dubrulle, B.: 2000, Space Sci. Rev. 92, 201–224.
Rose, N. M., Rosing, M. T. and Bridgwater, D.: 1996, Am. J. Sci. 296, 1004–1044.Rosing, M. T. and Frei, R.: 2004, Earth Planet. Sci. Lett. 217(3–4), 237–244.Rosing, M. T., Rose, N. M., Bridgwater, D. and Thomsen, H. S.: 1996, Geology 24, 43–46.
Ryder, G.: 1990, Eos Trans AGU 71, 313–323.Ryder, G.: 2002, J. Geophys. Res. Planets 107, 6–14.Ryder, G., Koeberl, C. and Mojzsis, S. J.: 2000, in R. M. Canup and K. Righter (eds.), Origin
of the Earth and Moon (University of Arizona Press, Tucson, Arizona), pp. 475–492.
Sano, Y. and Pillinger, C. T.: 1990, Geochem. J. 24, 315–325.Sarda, P., Staudacher, T. and Allegre, C. J.: 1988, Earth Planet. Sci. Lett. 91, 73–88.Sasaki, S. and Nakasawa, K.: 1988, Earth Planet. Sci. Lett. 89, 323–334.
Sasaki, S. and Nakazawa, K.: 1984, Icarus 59, 76–86.Schiøtte, L., Compston, W. and Bridgwater, D.: 1989, Can. J. Earth Sci. 26, 1533–1556.Schoenberg, R., Kamber, B. S., Collerson, K. D. and Moorbath, S.: 2002, Nature 418, 403–
405.Shukolyukov, A. and Lugmair, G. W.: 1993, Science 259, 1138–1142.Sleep, N. H., Meibom, A., Fridriksson, T., Coleman, R. G. and Bird, D. K.: 2004, Proc. Nat.
Acad. Sci. 101, 12818–12823.Sleep, N. H., Zahnle, K. and Neuhoff, P. S.: 2001, Proc. Natl. Acad. Sci. U. S. A. 98(7), 3666–
3672.Snyder, G., Hall, C. M., Lee, D. C., Taylor, L. A. and Halliday, A. N.: 1996, Meteorit. Planet.
Sci. 31, 328–334.Stevenson, R. K.: 2003, Geochemistry and isotopic evolution (Nd, Hf) of the 3.825 Ga Por-
poise Cove sequence, Northeastern Superior Province, Quebec., Vancouver 2003 GAC –
MAC – SEG Meeting, Vancouver, pp. GS6.Stoeffler, D. and Ryder, G.: 2001. Stratigraphy and Isotopic Ages of Lunar Geologic Units:
Chronological Standard for the Inner Solar System., The Evolution of Mars. Space Science
Reviews, International Space Science Institute, Bern, Switzerland, 7–53 pp.Tagle, R.: 2005, LL-Ordinary chondrite impact on the Moon: Results from the 3.9 Ga impact
melt at the landing site of Apollo 17, Lunar and Planetary Science Conference, Houston
Texas, pp. CD-ROM Abstract # 2008.Taylor, S. R.: 2001. Solar System Evolution: A New Perspective, Univ. Press, Cambridge, 484
pp.Tera, F., Papanastassiou, D. A. and Wasserburg, G. J.: 1974, Earth Planet. Sci. Lett. 22, 1–21.
Tolstikhin, I. N. and Hofmann, A. W.: 2005, Phys. Earth Planet. Int. In press.Tolstikhin, I. N. and Marty, B.: 1998, Chem. Geol. 147, 27–52.Trieloff, M., Kunz, J., Clague, D. A., Harrisson, C. J. and Allegre, C. J.: 2000, Science 288,
1036–1038.Trull, T.: 1994, in J. I. Matsuda (ed.), Noble Gas Geochemistry and Cosmochemistry (Terra
Sci. Pub. Co., Tokyo), pp. 77–88.
Tsiganis, K., Gomes, R., Morbidelli, A. and Levison, H. F.: 2005, Nature 435(7041), 459–461.Utsunomiya, S., Palenik, C. S., Valley, J. W., Cavosie, A. J., Wilde, S. A. and Ewing, R. C.:
2004, Geochim. Cosmochim. Acta 68(22), 4679–4686.Valley, J. W., Peck, W. H., King, E. M. and Wilde, S. A.: 2002, Geology 30(4), 351–354.
Vervoort, J. D., Patchett, P. J., Gehrels, G. E. and Nutman, A. J.: 1996, Nature 379, 624–627.Wasserburg, G. J. G. R. and Busso, M.: 1998, Astroph. J. 500, L189–L193.Westall, F. and Folk, R. L.: 2003, Precambrian Res. 126, 313–330.
Wilde, S. A., Valley, J. W., Peck, W. H. and Graham, C. M.: 2001, Nature 409, 175–178.
150 HERVE MARTIN ET AL.
Wilhems, D. E.: 1987, Geologic history of the Moon. Professional Paper, 1348. US GeologicalSurvey, Reston VA.
Wood, J. A., Dickey, J. S., Marvin, U. B. and Powell, B. N.: 1970, Proc. Apollo 11(Lunar Sci.Conf. 1), 965–988.
Yada, T., Nakamura, T., Takaoka, N., Noguchi, T., Terada, K., Yano, H., Nakazawa, T. and
Kojima, H.: 2004, Earth Planets Space 56, 67–79.Yin, Q., Jacobsen, S. B., Yamashita, K., Blicchert-Toft, J., Telouk, P. and Albarede, F.:
2002a, Nature 418, 949–952.Yin, Q., Jacobsen, S. B., Yamashita, K., B.-T., J., Telouk, P. and Albarede, F.: 2002b, Nature
418, 949–952.Yin, Q. Z. and Ozima, M.: 2003, Geochim. Cosmochim. Acta 67(18), A564–A564.Yokochi, R., Marty, B., Pik, R. and Burnard, P.: 2005. Geochem. Geophys. Geosyst. 6,
Q01004.Zahnle, K. and Dones L.: 1998. Source of terrestrial volatiles, Origin of the Earth and Moon.
LPI Contribution, pp. 55–56.
Zahnle, K. J. and Sleep, N. H.: 1997, in P. J. Thomas, C. F. Chyba and C. P. McKay (eds.),Comets and the Origin and Evolution of Life (Springer, New York), pp. 175–208.
Zhang, Y. X. and Zindler, A.: 1993, Earth Planet. Sci. Lett. 117(3–4), 331–345.
Zolensky, M. E., Weisberg, M. K., Buchanan, P. C. and Mittlefehldt, D. W.: 1996, Meteorit.Planet. Sci. 31, 518–537.
151BUILDING OF A HABITABLE PLANET
5. Prebiotic Chemistry – Biochemistry – Emergence
of Life (4.4–2 Ga)
ROBERT PASCAL and LAURENT BOITEAUDepartement de Chimie, Universite Montpellier II, Montpellier, France
(E-mails: [email protected]; [email protected])
PATRICK FORTERREInstitut de Genetique et Microbiologie, Universite Paris-Sud, Orsay, France
(E-mail: [email protected])
MURIEL GARGAUDObservatoire Aquitain des Sciences de l’Univers, Universite Bordeaux1, Bordeaux, France
(E-mail: [email protected])
ANTONIO LAZCANOUniversidad Nacional Autonoma de Mexico (UNAM), Mexico City, Mexico
(E-mail: [email protected])
PURIFICACION LOPEZ-GARCIA and DAVID MOREIRAUnite d’Ecologie, Systematique et Evolution, Universite Paris-Sud, Orsay, France
(E-mails: [email protected]; [email protected])
MARIE-CHRISTINE MAURELInstitut Jacques Monod, Universite Paris 6, Paris, France
(E-mail: [email protected])
JULI PERETOInstitut Cavanilles de Biodiversitat i Biologia Evolutiva, Universitat de Valencia, Valencia, Spain
(E-mail: [email protected])
DANIEL PRIEURLaboratoire de Microbiologie des Environnements Extremes, Universite de Bretagne
Occidentale, Brest, France(E-mail: [email protected])
JACQUES REISSEFaculte des Sciences Appliquees (CP 165/64), Universite Libre de Bruxelles, Brussels, Belgium
(E-mail: [email protected])
(Received 1 February 2006; Accepted 4 April 2006)
Abstract. This chapter is devoted to a discussion about the difficulties and even the impossibility to
date the events that occurred during the transition from non-living matter to the first living cells.
Nevertheless, the attempts to devise plausible scenarios accounting for the emergence of the main
molecular devices and processes found in biology are presented including the role of nucleotides at early
stages (RNA world). On the other hand, hypotheses on the development of early metabolisms, com-
Earth, Moon, and Planets (2006) 98: 153–203 � Springer 2006
DOI 10.1007/s11038-006-9089-3
partments and genetic encoding are also discussed in relation with their role in extant living organisms.
The nature of the Last Common Ancestor is also presented as well as hypotheses on the evolution of
viruses. The following sections constitute a collection of independent articles providing a general
overview of these aspects.
Keywords: Origin of life, chemical evolution, origin of genetic information, metabolism, membrane
5.1. A Word of Caution about Chronology
JACQUES REISSE, LAURENT BOITEAU, PATRICK FORTERRE, MURIEL GARGAUD,ANTONIO LAZCANO, PURIFICACION LOPEZ-GARCIA, MARIE-CHRISTINE MAUREL,DAVID MOREIRA, ROBERT PASCAL, JULI PERETO, DANIEL PRIEUR
Compared to astronomers and geologists, chemists and biochemists findthemselves in a very difficult situation when asked to participate to a col-lective work on the dating of significant events in astrobiology. Littleinformation is available that can allow them to date in detail the events thattook place when the protosolar nebula started to collapse and eventually theyoung Earth was formed and life first appeared in our planet. Dating theorigin of the constituents of living matter is in itself a huge problem. Some ofthese molecules were probably already present in the interstellar cloud longbefore it splitted into various nebulae. One of these nebulae was the proto-solar nebula, which therefore must have contained a vast ensemble of organicmolecules. It is generally accepted that during the accretion of the solarsystem, these organic molecules were probably destroyed in the inner part ofthe system, but some of them may have remained intact or with little mod-ifications in small volatile-rich bodies like comets or, perhaps, even in theparent bodies of carbonaceous chondrites. During post-accretional processesthese preformed organic compounds, which may have included amino acidsor nucleic bases, were delivered to the young Earth together with watermolecules and other simple volatiles. Therefore, it could be argued that someof the components of living systems were probably formed before the solarsystem itself. Obviously, it can also be argued that the hydrogen atoms foundin past and extant life forms were formed very soon after the Big Bang, andthat the life story started many billions year before the origin of the solarsystem itself! The choice of an origin is always arbitrary and requires a carefuldefinition of what is the starting point.
Although there are some dissenting views, it is has been generally assumedthat life appeared on Earth once the physico-chemical conditions of theprimitive environment were compatible with the presence of organic polymerslike nucleic acids and polypeptides. Most researchers agree that one of theseconditions was the presence of liquid water, and that therefore the prebioticstage may have started around 4.4–4.2 billions year ago. On the other hand,
154 ROBERT PASCAL ET AL.

although the identification of the oldest traces of life remains a contentiousissue, it is generally agreed that a microbial biosphere had already developedon Earth 3.5 billions years ago. In between, chemical evolution took place.Any attempt to put exact dates on particular steps may be futile at the timebeing. Of course, and as we will see in the following pages, chemists andbiochemists are able tomake some reasonable assumptions about the sequenceof some steps leading from the synthesis and accumulation of biochemicalmonomers to the first cells. Let us consider two examples: given the chemicallability of RNA, it is possible that oligopeptides may have existed beforepolyribonucleotides began to accumulate, and that RNA in turn evolved priorto DNA. Nevertheless, no one is able to state if the accumulation of a neces-sary (whatever ‘‘necessary’’ may have been) amount of polypeptides required1 year or 1 million years. Similarly, nobody is ready to claim that the synthesisof a ‘‘sufficient’’ amount of polynucleotides took a ‘‘short time’’ or a ‘‘verylong time’’, considering that even ‘‘short’’ and ‘‘very long’’ cannot be defined!
Individually, chemical reactions can be fast or slow depending on the rateconstants values (which themselves are strongly depending on the tempera-ture, pH, ionic strength, and so on) but also on the reactant concentrations.Given our poor understanding of primitive Earth conditions, it could beargued that it is impossible to estimate, even roughly, the time necessary, inan unknown place on the young Earth to go through the various steps re-quired for the emergence of a living cell. However, simulation experimentscan provide important insights on the rate of chemical syntheses and/ordegradations under various conditions.
In order to avoid the problem related to the degradation of organic mol-ecules and of the supramolecular systems into which they may have evolved, itis tempting to suggest that the multi-steps syntheses which led to the forma-tion of the first living cell were fast processes. It is difficult to estimate the rateof self-organization of the precursors of life into replicating systems, becausethe chemical steps are unknown. Whatever the time scale required for theappearance of an informational polymer, once formed it must have persistedat least long enough to allow its replication. If polymers formed by a slowaddition of monomers, this process must have been rapid compared to rates ofhydrolysis, especially if a considerable amount of genetic information wascontained in the polymer. Self-replicating systems capable of undergoingDarwinian evolution must have emerged in a period shorter than thedestruction rates of their components; even if the backbone of primitive ge-netic polymers was highly stable, the nitrogen bases themselves woulddecompose over long periods of time. In fact, it can be argued that theaccumulation of all components of the primitive soup will be limited bydestructive processes, including the pyrolysis of the organic compounds in thesubmarine vents (large amounts of the entire Earth’s oceans circulate throughthe ridge crests every 10 million years facing temperatures of 350 �C or more).
155PREBIOTIC CHEMISTRY
However, nobody knows the number of aborted ‘‘attempts’’ before thefinal result was reached and life appeared and persisted. What is sure is thefact that presently, prebiotic chemistry is unable to put dates on stepsbetween a system that is definitively non-living and a system which could berecognized as living. It is doubtful that the situation will change in the nearfuture: as we said previously, our poor knowledge on the actual conditions ofthe primitive environment, the absence of molecular relics from the prebioticorganic world, the dependence of organic reactions rates on external condi-tions and, last but not least, the fast degradation of organic molecules andsupramolecular organic assemblies will perhaps preclude for ever to dateprebiotic events. The only thing that can be done (with great care!) is tosuggest a plausible sequence of events. This is what the authors of the fol-lowing chapter have tried to do.
Following this approach, chemical evolution and the first stages of bio-chemical evolution may be thought as a succession of stages corresponding tochemical or biochemical structures of increasing complexity. However, thisview is probably biased by our current description of the basic properties ofextant life. Then early chemical and biochemical stages may have followedone another gradually and probably involved the coexistence of a largenumber of pathways, the majority of which disappeared and might be con-sidered as dead branches of the evolution tree. It is also possible that what wecall the ‘‘RNA world�� (or the additional hypotheses suggested by those thatfollow other alternatives) simply corresponded to a subset of molecules thatwe consider as qualitatively significant among a large number of systems thatcame to a dead end, so that these stages may have occurred simultaneously.For these reasons, the chapter on chemical and early biological evolution hasbeen divided into several parts corresponding to structures of increasingcomplexity, which does not mean that evolution proceeded following thissequence: for instance, it will never be possible to know if the confinementwithin vesicles preceded or not the appearance of primitive replicating geneticpolymers, or if they coexisted from the very beginning.
Evolutionary biologists interested in very early evolution are largely infront of similar problems to those faced by chemists and biochemists. Theycould be helped in principle by some imposed constraints coming fromgeology, micropaleontology, and geochemistry, including bona-fide micro-fossils, isotopic data and molecular fossils. However, sometimes these sig-natures are ambiguous and controversial (see chapter 7.1), and in most casesdo not allow any inference about the lifestyle, the metabolism or the phy-logenetic affiliation of the corresponding living species. Biologists are obligedto use indirect arguments based on what they know about modern micro-organisms, comparing genes and proteins involved in metabolic pathways tosuggest a plausible evolutionary route that explains their observed contem-porary patterns of distribution in organisms and, eventually, a series of
156 ROBERT PASCAL ET AL.

possible sequential events towards the past that leads to speculate about thenature of the earliest metabolic strategies. However, in some cases thisdepends strongly on the model of evolutionary reconstruction that is chosen.One or a few parsimonious scenarios can be identified but, ultimately,evolution does not necessarily follow the most parsimonious way among allthose that are possible, so that absolute certainty about the succession ofearly evolutionary steps is unattainable. Nobody knows for sure how the lastunicellular common ancestor looked like or even when it became the domi-nant form of life on the young Earth. So, for different reasons, chemistsinterested in prebiotic chemistry and biologists interested in the first livingorganisms must accept that they have few things to say about chronology butthey have to explain why it is so. The works that give the impression that the‘‘how’’ and ‘‘when’’ questions concerning the origin of life are solved, exceptfor few details, do not contribute to the development of astrobiology. It ismuch better to list the problems for which plausible explanations exist butalso those which remain without solution. In these last cases, it is sometimesnecessary to question the question and to try to find another way to for-mulate the questioning. In science, the impossibility to find a solution to aproblem can be the proof that the problem is not well formulated.
5.2. A Scenario Starting from the First Chemical Building Blocks
LAURENT BOITEAU, ROBERT PASCAL
Although chronology is impossible in prebiotic chemistry, building plausiblescenarios, linking the possibilities of simple abiotic processes to what themost ancient biochemical pathways are supposed to be, is the central goal ofthis field of science. In other words, there is no definitive answer to thequestion: how long did it take for life to be present? But there may be an (orseveral) answer(s) to: what is the sequence of stages that were covered forliving beings to emerge in the abiotic environment of the early Earth, wheresimple organic compounds were synthesized in the early atmosphere, in otherplaces (hydrothermal vents, volcanic plumes) or delivered from the outerspace by meteoritic bombardment? The object of prebiotic chemistry is thento solve a problem that depends on the definition of what was the environ-ment of the early Earth (unsteady over the 4.4–2 Ga b.p. era assigned to theorigin of life) and on the definition of what could have been the biochemistryof early living organisms inferred from the sciences of evolution (see part 5.7).It is then necessary to analyze what occurred in the black box separating thetwo stages to get a continuous sequence of incremental steps as usually ob-served in the evolution of living organisms, the state of the system at theentrance and at the exit being not clearly known.
157PREBIOTIC CHEMISTRY

5.2.1. Availability of organic matter and energy
The origin of organic matter and energy on the early Earth is still debatedmainly because of the lack of precise indications establishing the compositionof the atmosphere (and especially the relative content in H2 and CO2, seechapter 6.2.1) and the surface and ocean temperatures (that may have beencomprised within a range of less than 0 �C to above 80 �C, see chapters 4.4and 6.2). Moreover, as pointed out by Miller (1998), the conditions underwhich organic molecules can be formed in an equilibrium state or in a sta-tionary state (thanks to a flux of energy or of reactive species with a dehy-dration or oxidation state away from equilibrium) are usually those in whichthese molecules become instable. Then, any synthetic process in a given area(or under defined conditions) must also involve a quenching step to protect theactivated mixture from further degradation by transferring it into a milderenvironment. This is true for any kind of energy sources including lightning,ultraviolet irradiation of the atmosphere, hydrothermal processes of synthesisand even for the delivery of exogenous organic matter by bombardment.Therefore, the claim of a hypothetical synthetic or deleterious character of agiven energy source should only be considered after taking into account theefficiency of the quenching process. Anyway, it is unlikely that a single energysource may have been responsible for the formation of the organic matterneeded by the origin of life process and the early stages of life evolution.
Two different kinds of processes have contributed to feed the early Earthwith biogenic molecules, biomolecules and the building blocks needed forpolymer synthesis: the exogenous delivery and the endogenous formation as aresult of energy input in the atmosphere or in the oceans. The relativeimportance of the two processes was principally dependant on the degree ofoxidation of the primitive atmosphere and thus on its hydrogen content(Chyba and Sagan, 1992; Chyba, 2005). The initial Miller experiment (Miller,1953) was carried out in a mixture with a high content in H2, CH4, and NH3
that is favourable for the synthesis of organic molecules. Then, it has beenconsidered that the escape of hydrogen from the atmosphere to the outerspace had been so fast that the Earth atmosphere rapidly reached a com-position based on CO2 and N2 with a low content in H2 (Kasting, 1993),much less favourable for synthesis. As a result, the amount of biogenicmolecules synthesized on the early Earth may have been much lower and lifedepended on extraterrestrial delivery. Indications have been reported sup-porting the formation of organic molecules in the solar nebula and then theirdelivery to the early Earth since a high organic content can be found inmeteorites and comets (Mullie and Reisse, 1987; Cronin and Chang, 1993).Then, it is obvious that the delivery of biogenic compounds from the outerspace played a role at that stage but its relative contribution mainly dependedon the local production, which can only be deduced from hypothetical
158 ROBERT PASCAL ET AL.

models of the early atmosphere. A recent model of the evolution of atmo-sphere supports a hydrogen escape that could have been much slower thanpreviously believed (Tian et al., 2005), so that the amount of organic matterproduced on Earth could have been sufficient for the emergence of life. It hasalso been proposed that hydrothermal synthesis, by which organic moleculecould have been synthesized by heating taking advantage of the presence ofminerals (see for example Holm and Andersson, 1998; Russell and Martin,2004), may have contributed to endogenous production. The catalogue ofmolecules produced includes high-energy biogenic basic species such asHCN, cyanate, formaldehyde and other aldehydes (Miller, 1998). Thesesimple molecules can undergo different processes under conditions simulatingthe primitive Earth capable of yielding the building blocks of biochemistry:amino acids (Strecker reaction of aldehydes), nucleic bases, and sugars(formose reaction from formaldehyde). But it is more difficult to define ascenario of chemical evolution by which the system became more complexallowing the formation of macromolecular and supramolecular componentsof life and their combination into metabolic processes.
5.2.2. Favourable areas for prebiotic chemical processes
Since the knowledge of the Earth formation suggests that an habitable oceanmay have been present as early as 4.4 Ga (see chapter 4.2.2), it is possible tospeculate that life emerged within the first few hundred million years of thehistory of the planet and may have survived the Late Heavy Bombardment(see chapters 4.4 and 6.2.1). But we have no indication about the occurrenceof this event. Hypothetical places that would have been favourable can beinferred from the processes leading to the accumulation of organic matter ina specific environment. For instance, as soon as emerged lands were present,it can be devised that ocean tides (induced by the vicinity of the Moon) mayhave allowed the formation of pools concentrating monomers and may havetriggered wetting/drying cycles capable of inducing their polymerizationpossibly with the assistance of minerals (Rohlfing, 1976, Lahav et al., 1978,Rode et al. 1999). They may also have induced solid-gas reactions that havebeen shown to induce peptide bond formation (Commeyras et al., 2002).Volcanic areas, rich in reduced and sulphur-derived compounds, or hydro-thermal vents in the ocean may be considered as favourable locations forthese processes as well.
5.2.3. Chemical evolution through a stepwise process
Prebiotic chemistry is customarily divided into different stages correspondingto an increasing degree of complexity of the entities involved:
159PREBIOTIC CHEMISTRY

• The synthesis of building blocks (amino acids, nucleic bases, nucleo-sides, nucleotides...).
• The formation of polymers (nucleic acids, peptides).• The emergence of supramolecular architectures including the formation
of the membrane and hence of individual cells.This partition corresponds to one of the first hypothesis on the origin of life
suggesting that life began in a ‘‘primordial soup’’ containing all the chemicalcomponents needed for feeding the first living organism. Since Miller’sexperiment was performed, prebiotic chemistry has demonstrated the capacityof making a wide range of building blocks available (amino acids, carbohy-drates, nucleic bases) under favourable abiotic environments (Miller, 1998).The next degree of organization, the formation of peptides and nucleic acids,may have been the result of interactions (involving possibly activating agents)in a pool of inactivated building blocks. Then, the origin of life is considered inthis hypothesis as a sequence of events resulting from more or less improbableencounters of building blocks leading finally to a system capable of self-replication. As it does not involve any driving force, this hypothesis suggeststhat the origin of life was highly improbable. As a result, it would have beenless unlikely starting from high concentrations of building blocks maintainedduring a long period of time in a stable environment required for monomers toaccumulate and polymers to have a sufficient lifetime.
5.2.4. Chemical evolution through a dynamic process
The partition of the origin-of-life problem into several stages corresponds toan approach that could rather be considered as based on the present daybiochemistry way of thinking and teaching. This partition may however bemisleading since the capacity to evolve and to promote the emergence of newproperties must have been the most important feature of the chemical systemfrom which life arose. This behaviour is observed for chemical systemsmaintained in states far away from equilibrium by a constant or erratic fluxof matter and energy (Eigen, 1971; Nicolis and Prigogine, 1977). The originof life may therefore be considered as the emergence of individual structureswith new properties (and incorporating an information content capable ofbeing reproduced) from a prebiotic network of chemical reactions linkinghigh-energy species to inactivated products. Then the supply of energy andactivated reactants may be considered as the driving force for chemicalevolution. Additionally, the process is likely to be dependant on physico-chemical constraints governing the reactivity of activated biogenic com-pounds. Increasing the strength of constraints and of the driving force wouldhave made the emergence of life less improbable so that an unstable envi-ronment may have been less deleterious than in a process purely governed bychance. In other words, these constraints may have influenced the rate of
160 ROBERT PASCAL ET AL.

evolution of the system and, consequently, the chronology of events eventhough the process remained non-deterministic and historically unique (as faras we know). The synthesis of building blocks, polymers and supramolecularstructures may then have been associated in a single process so that noactivation of monomers was needed, the energy needed for polymerizationbeing carried by precursors. From high-energy biogenic compounds, anyearly chemometabolic pathways leading to more complex species required asequence of kinetically and thermodynamically spontaneous reactions linkingsubstrates to products (Weber, 2002). Catalytic abilities to overcome acti-vation barriers were probably limited (Weber, 2002). Of course, thermody-namics would never by itself identify the pathway leading to the firstreplicating molecule or supramolecular edifice (Kuhn and Kuhn, 2003). But,as any other chemical reactions, chemometabolic pathways are governed bythermodynamic constraints, the quantitative analysis of which can be used torule out or to validate these processes.
5.2.5. Catalytic activity and information storage
A minimal form of life would have needed the association of a carrier ofinformation content and the chemical activity needed for its replication. Theform of life that we are presently familiar with on Earth mainly developedaround two classes of biopolymers: protein and peptides carrying catalyticactivity and nucleic acids carrying information. But noteworthy exceptions(ribozymes, nucleotide-like enzyme cofactors) have been considered as strongindications that the situation may have been quite different at early stages ofevolution (see part 5.5). More generally, we have no indication that thedifferent classes of biomolecules played the same role at early stages as inmodern biochemistry. Three main hypotheses can be devised concerning thedevelopment of this process. Two of them correspond to a stepwise process inwhich one class of polymers could have acquired a replicating ability andthen, in a later stage, the translation process was discovered leading to themodern protein-nucleic acid world. The advantage of this process from achronological point of view is that it can be described by a sequence of stagesinvolving an increasing complexity, but the driving force leading to theemergence of new properties is not obvious. On the contrary, the last process,corresponding to coevolution, may have developed from a probably quitecomplicated network of organic reactions, maintained far away from equi-librium through the feeding with activated biogenic compounds.
5.2.5.1. Emergence of life in a peptide world:Since there is no accepted abiotic pathways leading to nucleosides and nucleo-tides, and since amino acids are the more easily synthesized building blocks inprebiotic experiments and have been detected in extraterrestrial organic matter
161PREBIOTIC CHEMISTRY
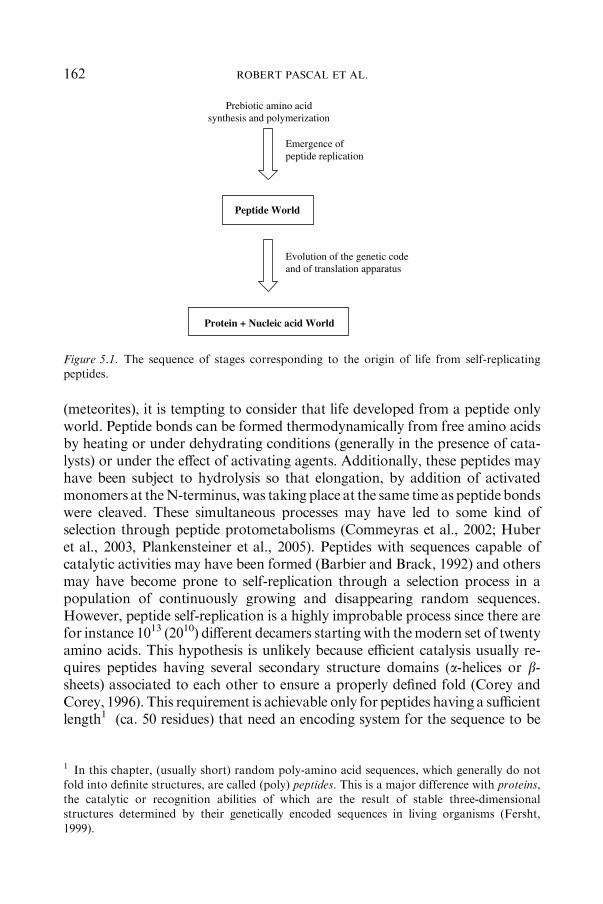
(meteorites), it is tempting to consider that life developed from a peptide onlyworld. Peptide bonds can be formed thermodynamically from free amino acidsby heating or under dehydrating conditions (generally in the presence of cata-lysts) or under the effect of activating agents. Additionally, these peptides mayhave been subject to hydrolysis so that elongation, by addition of activatedmonomers at theN-terminus, was taking place at the same time as peptide bondswere cleaved. These simultaneous processes may have led to some kind ofselection through peptide protometabolisms (Commeyras et al., 2002; Huberet al., 2003, Plankensteiner et al., 2005). Peptides with sequences capable ofcatalytic activities may have been formed (Barbier and Brack, 1992) and othersmay have become prone to self-replication through a selection process in apopulation of continuously growing and disappearing random sequences.However, peptide self-replication is a highly improbable process since there arefor instance 1013 (2010) different decamers startingwith themodern set of twentyamino acids. This hypothesis is unlikely because efficient catalysis usually re-quires peptides having several secondary structure domains (a-helices or b-sheets) associated to each other to ensure a properly defined fold (Corey andCorey, 1996). This requirement is achievable only for peptides having a sufficientlength1 (ca. 50 residues) that need an encoding system for the sequence to be
Prebiotic amino acidsynthesis and polymerization
Emergence of peptide replication
Peptide World
Protein + Nucleic acid World
Evolution of the genetic codeand of translation apparatus
Figure 5.1. The sequence of stages corresponding to the origin of life from self-replicatingpeptides.
1 In this chapter, (usually short) random poly-amino acid sequences, which generally do not
fold into definite structures, are called (poly) peptides. This is a major difference with proteins,the catalytic or recognition abilities of which are the result of stable three-dimensionalstructures determined by their genetically encoded sequences in living organisms (Fersht,
1999).
162 ROBERT PASCAL ET AL.
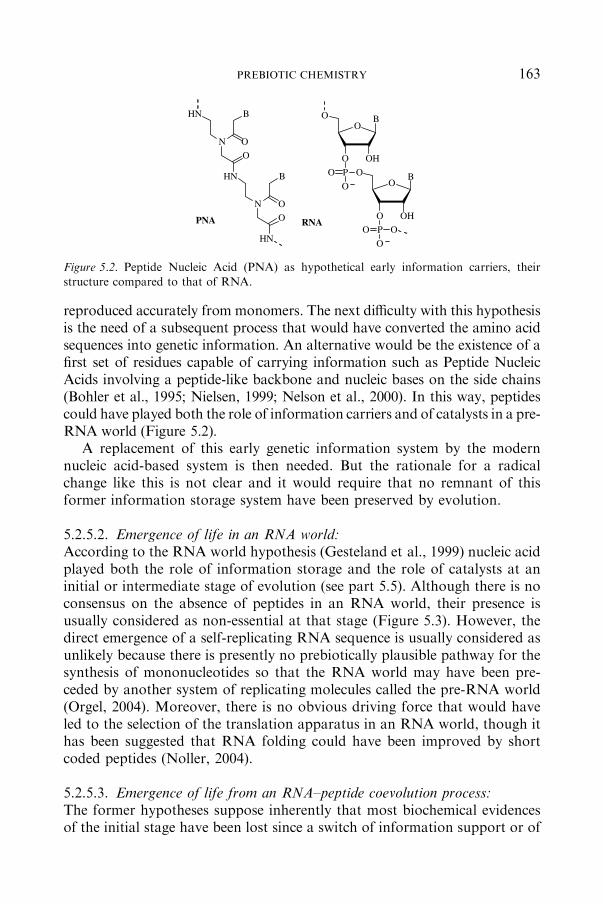
reproduced accurately from monomers. The next difficulty with this hypothesisis the need of a subsequent process that would have converted the amino acidsequences into genetic information. An alternative would be the existence of afirst set of residues capable of carrying information such as Peptide NucleicAcids involving a peptide-like backbone and nucleic bases on the side chains(Bohler et al., 1995; Nielsen, 1999; Nelson et al., 2000). In this way, peptidescould have played both the role of information carriers and of catalysts in a pre-RNA world (Figure 5.2).
A replacement of this early genetic information system by the modernnucleic acid-based system is then needed. But the rationale for a radicalchange like this is not clear and it would require that no remnant of thisformer information storage system have been preserved by evolution.
5.2.5.2. Emergence of life in an RNA world:According to the RNA world hypothesis (Gesteland et al., 1999) nucleic acidplayed both the role of information storage and the role of catalysts at aninitial or intermediate stage of evolution (see part 5.5). Although there is noconsensus on the absence of peptides in an RNA world, their presence isusually considered as non-essential at that stage (Figure 5.3). However, thedirect emergence of a self-replicating RNA sequence is usually considered asunlikely because there is presently no prebiotically plausible pathway for thesynthesis of mononucleotides so that the RNA world may have been pre-ceded by another system of replicating molecules called the pre-RNA world(Orgel, 2004). Moreover, there is no obvious driving force that would haveled to the selection of the translation apparatus in an RNA world, though ithas been suggested that RNA folding could have been improved by shortcoded peptides (Noller, 2004).
5.2.5.3. Emergence of life from an RNA–peptide coevolution process:The former hypotheses suppose inherently that most biochemical evidencesof the initial stage have been lost since a switch of information support or of
HN
O
N
HN
O
O
N
BHN
B
OO
B
OHO
PO
O
OO
B
OHO
PO
O
OPNA RNA
O
Figure 5.2. Peptide Nucleic Acid (PNA) as hypothetical early information carriers, their
structure compared to that of RNA.
163PREBIOTIC CHEMISTRY

catalytic molecules has erased records of the initial process. There is analternative possibility that life evolved using directly both systems, whichseems more complex on a first sight. But if life developed from an RNA–peptide coevolution process, the translation machinery could be consideredas a metabolic remnant of the initial stage (Figure 5.4). Indeed, covalentbonds between amino acids and AMP or tRNAs are formed in the bio-
Prebiotic oligonucleotidesynthesis and replication
RNA World
Emergence of translation apparatus
Evolution of ribonucleotide reductase
RNA + Protein World
RNA + Protein + DNA World
Figure 5.3. The sequence of stages corresponding to the direct emergence of an RNA world.
Prebiotic chemistry ofamino acids and nucleotides
Emergence ofcoded peptide synthesis andnucleic acid replication
Peptide + Nucleic acid World
Figure 5.4. Coevolution process for the emergence of life leading directly to an RNA proteinworld.
164 ROBERT PASCAL ET AL.
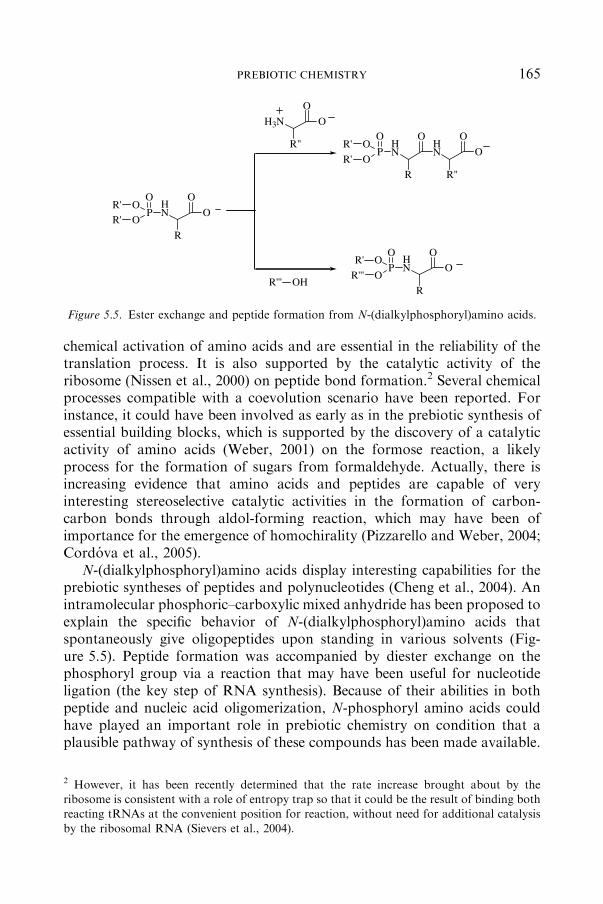
chemical activation of amino acids and are essential in the reliability of thetranslation process. It is also supported by the catalytic activity of theribosome (Nissen et al., 2000) on peptide bond formation.2 Several chemicalprocesses compatible with a coevolution scenario have been reported. Forinstance, it could have been involved as early as in the prebiotic synthesis ofessential building blocks, which is supported by the discovery of a catalyticactivity of amino acids (Weber, 2001) on the formose reaction, a likelyprocess for the formation of sugars from formaldehyde. Actually, there isincreasing evidence that amino acids and peptides are capable of veryinteresting stereoselective catalytic activities in the formation of carbon-carbon bonds through aldol-forming reaction, which may have been ofimportance for the emergence of homochirality (Pizzarello and Weber, 2004;Cordova et al., 2005).
N-(dialkylphosphoryl)amino acids display interesting capabilities for theprebiotic syntheses of peptides and polynucleotides (Cheng et al., 2004). Anintramolecular phosphoric–carboxylic mixed anhydride has been proposed toexplain the specific behavior of N-(dialkylphosphoryl)amino acids thatspontaneously give oligopeptides upon standing in various solvents (Fig-ure 5.5). Peptide formation was accompanied by diester exchange on thephosphoryl group via a reaction that may have been useful for nucleotideligation (the key step of RNA synthesis). Because of their abilities in bothpeptide and nucleic acid oligomerization, N-phosphoryl amino acids couldhave played an important role in prebiotic chemistry on condition that aplausible pathway of synthesis of these compounds has been made available.
O
OHN
R
P
OO
O
R'
R'
O
O
H3N
R" HN
OHN
R
P
OO
O
R'
R'
R"
O
O
R''' OHO
OHN
R
P
OO
O
R'
R'''
Figure 5.5. Ester exchange and peptide formation from N-(dialkylphosphoryl)amino acids.
2 However, it has been recently determined that the rate increase brought about by theribosome is consistent with a role of entropy trap so that it could be the result of binding bothreacting tRNAs at the convenient position for reaction, without need for additional catalysis
by the ribosomal RNA (Sievers et al., 2004).
165PREBIOTIC CHEMISTRY
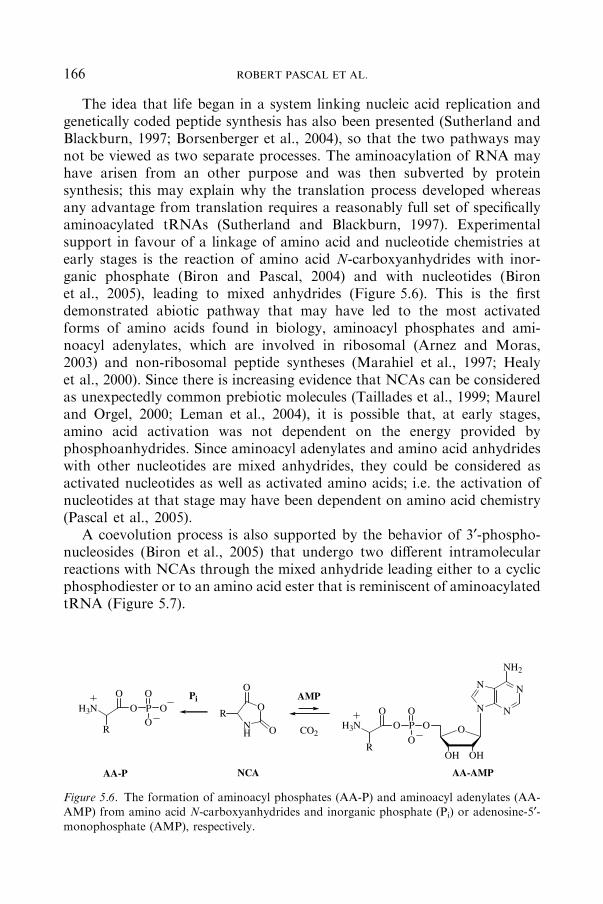
The idea that life began in a system linking nucleic acid replication andgenetically coded peptide synthesis has also been presented (Sutherland andBlackburn, 1997; Borsenberger et al., 2004), so that the two pathways maynot be viewed as two separate processes. The aminoacylation of RNA mayhave arisen from an other purpose and was then subverted by proteinsynthesis; this may explain why the translation process developed whereasany advantage from translation requires a reasonably full set of specificallyaminoacylated tRNAs (Sutherland and Blackburn, 1997). Experimentalsupport in favour of a linkage of amino acid and nucleotide chemistries atearly stages is the reaction of amino acid N-carboxyanhydrides with inor-ganic phosphate (Biron and Pascal, 2004) and with nucleotides (Bironet al., 2005), leading to mixed anhydrides (Figure 5.6). This is the firstdemonstrated abiotic pathway that may have led to the most activatedforms of amino acids found in biology, aminoacyl phosphates and ami-noacyl adenylates, which are involved in ribosomal (Arnez and Moras,2003) and non-ribosomal peptide syntheses (Marahiel et al., 1997; Healyet al., 2000). Since there is increasing evidence that NCAs can be consideredas unexpectedly common prebiotic molecules (Taillades et al., 1999; Maureland Orgel, 2000; Leman et al., 2004), it is possible that, at early stages,amino acid activation was not dependent on the energy provided byphosphoanhydrides. Since aminoacyl adenylates and amino acid anhydrideswith other nucleotides are mixed anhydrides, they could be considered asactivated nucleotides as well as activated amino acids; i.e. the activation ofnucleotides at that stage may have been dependent on amino acid chemistry(Pascal et al., 2005).
A coevolution process is also supported by the behavior of 3¢-phospho-nucleosides (Biron et al., 2005) that undergo two different intramolecularreactions with NCAs through the mixed anhydride leading either to a cyclicphosphodiester or to an amino acid ester that is reminiscent of aminoacylatedtRNA (Figure 5.7).
NH
OR
O
O
AMPN
NN
N
NH2
O
OHOH
OPO
O
O
NCA
O
H3N
R
CO2
OPOO
OO
H3N
R
AA-AMPAA-P
Pi
Figure 5.6. The formation of aminoacyl phosphates (AA-P) and aminoacyl adenylates (AA-AMP) from amino acid N-carboxyanhydrides and inorganic phosphate (Pi) or adenosine-5¢-monophosphate (AMP), respectively.
166 ROBERT PASCAL ET AL.

5.3. Hypothesis about Early Metabolisms
DANIEL PRIEUR
All organisms living on Earth to day (with the exception of viruses, see part5.8) are organized on a cellular basis. The cell is the fundamental unit of livingmatter, and is an entity isolated from its environment by a membrane (mostlymade of lipids). Within this membrane are gathered molecules and sub-cel-lular structures required for cell life, and particularly macromolecules such asproteins, lipids, polysaccharides and nucleic acids. A cell may be single orassociated to others, forming tissues, organs and finally complex organisms.But in any case, a living cell possesses five major functions: metabolism,growth (reproduction), differentiation, chemical communication and evolu-tion. Consequently, the universal common ancestor of all living organisms(LUCA, see part 5.7), was almost probably also organized on a cellular basis.
The first cell function listed above is metabolism, which is the sum of allbiochemical reactions occurring within the cell. These reactions aim to syn-thesize macromolecules (anabolism) or to obtain the energy required for allcellular functions (catabolism). A quick look at the biochemical pathwaysdescribed for the metabolisms used by contemporary cells, and particularlyprokaryotic cells, shows that these pathways (for catabolism and anabolism)are very complicated in the sense they require a variety of transporters,electron carriers, enzymes, co-enzymes, and a complex genome encoding allthe required proteins. The first entities certainly used a rather simple processto gain their energy from their environment, and consequently to synthesizetheir components. No traces, no signatures, no dates are known for theseearly metabolisms, and the biologist can only imagine something simple, and
Figure 5.7. Intramolecular reactions of mixed anhydride derived from 3¢-phosphorylatednucleosides.
167PREBIOTIC CHEMISTRY

compatible with the conditions existing for the period preceding the firstrecords of microbial fossils (see chapter 7.1).
5.3.1. Preliminary DEFINITIONS
Altogether, contemporary living organisms use a variety of metabolic path-ways to gain the energy required by their living functions. Although severalenergy sources such as magnetism and thermal gradients have been theo-retically considered (Schulze-Makuch and Irwin, 2002), all present livingorganisms depend on chemical or photochemical reactions for their energy(Madigan et al., 2003).
Living organisms can be classified in several groups, depending on theirenergetic metabolism. Those using light as energy source are called photo-trophs. Those gaining their energy from chemical reactions are namedchemotrophs. In this case, those using organic molecules as energy sources arechemo-organotrophs, while those using inorganic molecules as energy sourcesare called chemo-lithotrophs.
In order to build their components, cells uptake in their environments smallamounts of micro-nutrients (Cr, Co, Cu, Mn, Mo, Ni, etc) but larger amountsof macro-nutrients (C, N, H, O, P, S, K, Mg, Ca, Na, Fe). Among them,carbon is particularly important since it is present in all macromolecules. Cellsusing organic carbonmolecules for biosynthesis are named heterotrophs, whilethose using inorganic carbon (carbon dioxide) are called autotrophs.
5.3.2. How the FIRST ENTITIES PRESUMABLY GAINED THEIR ENERGY
AND CARBON?
Despite the report of microfossils showing prokaryotic morphotypes in veryold rocks (Westall et al., 2001), the metabolism displayed by these organismscannot be deduced from these observations. If a photosynthetic (mostprobably anoxygenic) metabolism (based on morphological similarities withextant stromatolites) has been suggested for putative microorganismsoccurring in stromatolite fossils aged of 3.5 Ga or younger (Schopf, 1993),this is not finally proved (Brasier et al., 2002), and the question of metabo-lism is still open for other old microfossils reported from Barberton rocks inAustralia (see chapter 7.1).
The scenario given by Madigan et al. (2003) is rather convincing andexplained below.
Whatever the exact dating for the first cellular-like entities with an ener-getic metabolism, it is obvious that this event occurred under anoxic condi-tions. From our knowledge of energetic metabolisms used by contemporaryprokaryotes, several anaerobic metabolisms can be hypothesized: anoxicphotosynthesis, fermentation and anaerobic respiration. All require a variety
168 ROBERT PASCAL ET AL.
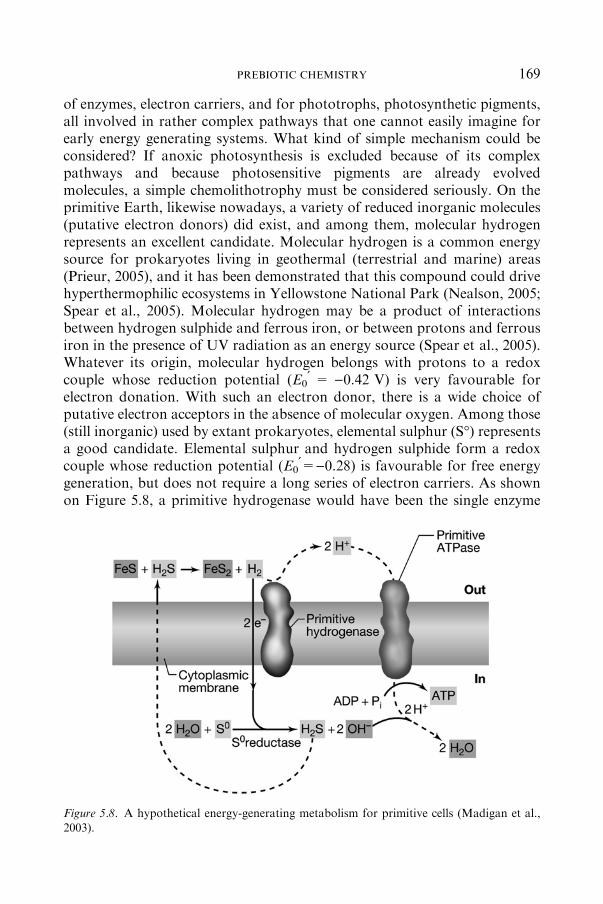
of enzymes, electron carriers, and for phototrophs, photosynthetic pigments,all involved in rather complex pathways that one cannot easily imagine forearly energy generating systems. What kind of simple mechanism could beconsidered? If anoxic photosynthesis is excluded because of its complexpathways and because photosensitive pigments are already evolvedmolecules, a simple chemolithotrophy must be considered seriously. On theprimitive Earth, likewise nowadays, a variety of reduced inorganic molecules(putative electron donors) did exist, and among them, molecular hydrogenrepresents an excellent candidate. Molecular hydrogen is a common energysource for prokaryotes living in geothermal (terrestrial and marine) areas(Prieur, 2005), and it has been demonstrated that this compound could drivehyperthermophilic ecosystems in Yellowstone National Park (Nealson, 2005;Spear et al., 2005). Molecular hydrogen may be a product of interactionsbetween hydrogen sulphide and ferrous iron, or between protons and ferrousiron in the presence of UV radiation as an energy source (Spear et al., 2005).Whatever its origin, molecular hydrogen belongs with protons to a redoxcouple whose reduction potential (E0
¢ = )0.42 V) is very favourable forelectron donation. With such an electron donor, there is a wide choice ofputative electron acceptors in the absence of molecular oxygen. Among those(still inorganic) used by extant prokaryotes, elemental sulphur (S�) representsa good candidate. Elemental sulphur and hydrogen sulphide form a redoxcouple whose reduction potential (E0
¢=)0.28) is favourable for free energygeneration, but does not require a long series of electron carriers. As shownon Figure 5.8, a primitive hydrogenase would have been the single enzyme
Figure 5.8. A hypothetical energy-generating metabolism for primitive cells (Madigan et al.,2003).
169PREBIOTIC CHEMISTRY

required for uptaking molecular hydrogen, producing protons and electrons,and consequently forming a proton gradient and a proton motive force. Aprimitive ATPase (this enzyme is present for all living organisms) would haveused this proton motive force for ATP generation. This hypothesis is ratherconvincing, taking into account that the mechanism hypothesized is rathersimple and requires only two primitive enzymes, and that the inorganiccompounds involved were most probably abundant on the primitive Earth.
If such an energy generating mechanism is suggested, one must nowconsider the question of the carbon source (s).
An organism which uses molecular hydrogen as electron donor andelemental sulphur as an electron acceptor is called a chemolithotrophcarrying out anaerobic respiration (see definitions above). Such organismsare, for most of those living nowadays, also autotrophs and use carbondioxide as a single carbon source. Autotrophy is a property of variousorganisms that do not use organic carbon for their energy generation:anoxygenic and oxygenic photosynthesizers and chemolithotrophs. Totransform carbon dioxide into organic carbon, they use rather complexpathways such as the Calvin cycle, but also the reverse citric acid or thehydroxypropionate cycles. These pathways require a variety of enzymes,which are again difficult to imagine working all together in primitiveorganisms. Since organic compounds (whatever their origins) existed onthe primitive Earth, it is more probable that the primitive chemolitho-trophic cells utilized already formed organic carbon as carbon sources, inthe same way as extant mixotrophic organisms (such as certain sulphur-oxidizers) are doing today. If that was the case, although it is more dif-ficult to consider it as a common and unique energy generating mecha-nism, a kind of simple fermentation3 could also be considered as apossible hypothesis. Actually, various fermentations are nowadays sup-porting the growth of many different organisms. Although they generaterather low amounts of energy compared with respirations using electrondonors and acceptors with a great difference of reduction potentials, theycannot be eliminated as a possible early metabolism. But it is difficult toimagine which particular fermentation among many possibilities, wouldhave been the first. Consequently, molecular hydrogen might remain themost probable energy generating compound for early living organisms, asit is still today used by a variety of mesophilic and thermophilic Bacteriaand Archea (Prieur, 2005).
3 In fermentation an organic compounds serves as electron donor and carbon source, anelectron acceptor is temporarily generated from an intermediate compounds resulting from the
degradation of the initial carbon and an energy source.
170 ROBERT PASCAL ET AL.

5.4. Origin and Evolution of Compartments
PURIFICACION LOPEZ-GARCIA, DAVID MOREIRA AND JULI PERETO
Although impossible to date, and hard to place in a relative succession ofevents, compartments must have appeared very early during the emergence oflife to enclose metabolism (self-maintenance) and information storage inentities that reproduced and could undergo natural selection. For manyauthors, the earliest life forms must have had boundaries: life only appearedwhen the state of self-reproducing compartments was reached (Varela et al.,1974; Morowitz et al., 1988; Deamer, 1997; Luisi, 1998; Pereto, 2005).Contemporary cells are surrounded by membranes that assure their integrity,facilitate the necessary exchange with the external environment (diffusion ofgases, active transport of ions and metabolites) and harbour energy-trans-ducing systems that take advantage of the ion gradients maintained acrossthe membrane using primary energy sources (i.e. visible light or chemicalreactions). The exploitation of electrochemical gradients across membranesto supply energy (the chemiosmotic theory) is a universal property of livingcells. Any hypothesis on the origin of life must explicitly state the way toconvert energy into complex structures and organization, something that isonly achieved in terrestrial life through compartments (Harold, 2001). Cellmembranes are essentially made out of phospholipids, amphiphilic moleculescomposed of a hydrophilic glycerol-phosphate head bound to long hydro-phobic fatty acid or isoprenoid tails. They organise in bilayers and hostdifferent proteins involved in transport and energy-transducing processes(Figure 5.9). Of course, at early stages, compartments must have been definedby much simpler barriers and less functions, possibly only two: definition of a‘self’ boundary and of a not-quite-impermeable one, i.e. one allowing theimport of ions and metabolites but retaining most of the internally producedmaterial. A remarkable ab initio problem would be the osmotic crisis gener-ated by the enclosure of polymers. This situation could be mitigated by thecoevolution of membranes and primitive ion exchange systems that neces-sarily could not be sophisticated protein structures but simplest moleculardevices (e.g. the Escherichia coli non-proteinaceous calcium channel madeout of polyphosphate and polyhydroxybutyrate; Reusch, 2000).
5.4.1. Amphiphilic versus non-amphiphilic compartments
What was the nature of those early compartments? The fact that amphiphiliclipid bilayers are universal today suggests that protocellular compartmentsmay have been founded on simpler molecular grounds with similar propertiessuch as long single-chain monocarboxylic acids, alcohols or monoglycerides,
171PREBIOTIC CHEMISTRY
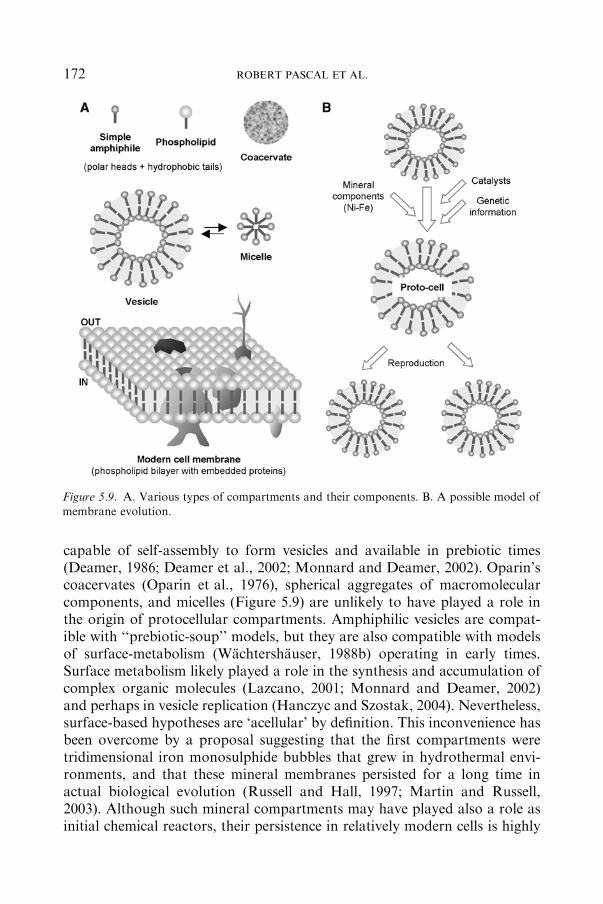
capable of self-assembly to form vesicles and available in prebiotic times(Deamer, 1986; Deamer et al., 2002; Monnard and Deamer, 2002). Oparin’scoacervates (Oparin et al., 1976), spherical aggregates of macromolecularcomponents, and micelles (Figure 5.9) are unlikely to have played a role inthe origin of protocellular compartments. Amphiphilic vesicles are compat-ible with ‘‘prebiotic-soup’’ models, but they are also compatible with modelsof surface-metabolism (Wachtershauser, 1988b) operating in early times.Surface metabolism likely played a role in the synthesis and accumulation ofcomplex organic molecules (Lazcano, 2001; Monnard and Deamer, 2002)and perhaps in vesicle replication (Hanczyc and Szostak, 2004). Nevertheless,surface-based hypotheses are ‘acellular’ by definition. This inconvenience hasbeen overcome by a proposal suggesting that the first compartments weretridimensional iron monosulphide bubbles that grew in hydrothermal envi-ronments, and that these mineral membranes persisted for a long time inactual biological evolution (Russell and Hall, 1997; Martin and Russell,2003). Although such mineral compartments may have played also a role asinitial chemical reactors, their persistence in relatively modern cells is highly
Figure 5.9. A. Various types of compartments and their components. B. A possible model ofmembrane evolution.
172 ROBERT PASCAL ET AL.

improbable (see part 5.7). Additional evidence comes from contemporarymembranes, which do not form de novo but grow and divide from pre-existing membranes. This membrane heredity view (Cavalier-Smith, 2001)together with the heuristic principle of continuity (Morowitz et al., 1991)would conform to the idea that some type of amphiphilic bilayer existed sinceearly times and that a kind of continuum allowed its evolution to date.Within this framework, amphiphiles and vesicles would be key chemicalintermediates during life emergence (Ourisson and Nakatani, 1994; Luisiet al., 1999; Segre et al., 2001).
5.4.2. Self-assembly and early evolution of compartments
How and when did early compartments evolve? A possibility is that theearliest protocellular compartments resulted from the self-assembly oforganic mixtures that were available on the planet. Long (C16–18) fattyacids and alcohols assemble spontaneously, forming vesicles above aconcentration threshold. Shorter fatty acids (C14) would be even bettercandidates because they were easily synthesized and the bilayers formedare much more permeable, an advantage in times when membrane trans-port proteins had not yet evolved (Deamer, 1986; Monnard and Deamer,2002). Interestingly enough, a selective passive incorporation of ribose intofatty acid vesicles has been shown (Sacerdote and Szostak, 2005), sug-gesting that preferential ribose uptake by primitive cells would play a rolein the rise of a hypothetical RNA world. Long monocarboxylic acids werepresent in prebiotic conditions both by exogenous delivery and endogenoussynthesis. The exogenous delivery is attested by the presence of mixedaliphatic and aromatic compounds in meteorites such as Murchison that,indeed, are able to form vesicles spontaneously (Monnard and Deamer,2002). This kind of compounds can also be synthesized by Fischer-Tropsch-type reactions (Deamer et al., 2002). Deamer (1997) suggestedthat prebiotic conditions favoured saturated over unsaturated acids andconsidered that isoprenoid-type molecules were difficult to make abioti-cally. Interestingly, the presence of ‘‘impurities’’, for instance pyrroliccompounds (the first pigments) increases vesicle permeability (Deamer,1997). Furthermore, it has been shown experimentally that the interactionand incorporation of minerals (montmorillonite) to fatty acids catalyzevesicle formation (Hanczyc et al., 2003). Such vesicles can grow byincorporating surrounding fatty acids and divide (Hanczyc et al., 2003).Moreover, the growth of vesicles can generate incipient ion gradients(Chen and Szostak, 2004). RNA and other macromolecular species can beencapsulated in vesicles leading to an experimental approach to the sim-plest life forms (Luisi et al., 1994; Chen et al., 2004). Therefore, it isplausible that prebiotic mixed short-chain fatty acids formed vesicles that
173PREBIOTIC CHEMISTRY
encapsulated, sequentially, catalytic species and genetic systems to becomeself-reproducing compartments. Nevertheless, whether this occurred andhow it occurred remains a matter of speculation. Attempts to re-create lifein vitro by encapsulating macromolecules such as ribozymes (see part 5.5)and other catalytic species in replicative vesicles will certainly yield inter-esting results (Szostak et al., 2001). Hopefully, these experiments will atleast contribute to test the feasibility of those hypotheses.
5.5. The Hypothesis of an RNA World
MARIE-CHRISTINE MAUREL
The time necessary to go from an habitable Earth to a protocell-like pro-caryote can be divided in three periods. During the first period molecularorganics sources, from which building blocks of life could have appeared,accumulated on the early Earth. The next period led to macromolecularsynthesis from small monomers and to the first metabolic steps including theformation of the first replicating polymers. Subsequently a scenario can bedescribed for the development from random polymers to a replicative system,capable of evolving by mutation and natural selection. This last period, calledthe RNA world period, would have opened the door to evolutionary biologyas we know it today, leading to organized and complex systems.
The question of how long did it take to go from prebiotic building blocks tothe first living cell must be addressed according to the inherent constraintsimposed by primeval conditions. Any extrapolations from results obtained inthe laboratory to what may have occurred 4 billion years ago are tenuous. Asa result we have to study the stability of all components in extreme conditions,that is the behaviour of monomers andmacromolecules of life at high and coldtemperatures (Schwartzman and Lineweaver, 2004; Vergne et al., 2006), withand without salt (Tehei et al., 2002), at low and high pH (Kuhne and Joyce,2003), at low and high pressure (Tobe et al., 2005; DiGiulio, 2005), in differentredox conditions, radio-ionizating and cosmic conditions, solvent conditionsetc., as well as in conditions simulating an ocean-boiling asteroid impact...
Diverse molecular ecosystems could potentially have arisen in thesephysico-chemical specifications and we have to take them into accountespecially if the hereditary criteria are retained as mandatory in designing life.Thus the half-lives for the decomposition of the components of life (aminoacids, peptides, sugars, lipids) and of the first genetic materials, that arenucleobases must be measured and considered on the geological time scale.Also the balance between synthesis and degradation must lead to consistentconcentrations.
174 ROBERT PASCAL ET AL.
Minerals and mineral surfaces, salt and crystals may help to stabilizemacromolecules and monomers (Tehei et al., 2002; Cornee et al., 2004;Ricardo et al., 2004). Purines and pyrimidines have been found in sedimentcores from both ocean and lake basins, some dating back as far as25 · 106 year, but they may be the result of contamination or decompositionunder anhydrous conditions. On the other hand, adenine, uracile, guanine,xanthine, hypoxanthine nitrogenous bases and several organics have beenfound in the Murchison meteorite (Stoks and Schwartz, 1982) and it is nowpossible to detect subpicomoles of purine bases trapped in a mineral or acolloidal supports (El Amri et al., 2003, 2004, 2005).
Finally, these materials, if applicable to any origin of life theory foundedon Darwinian evolution, may have resisted to several extinctions where thesurvival of a single organism (in a micro- environment) would be sufficient toreestablish an entire ecosystem.
Speculations from results obtained in the laboratory, specially uncon-strained sequences obtained by in vitro selection, to what may have occurred4 billion years ago, are weak. Again, a valuable approach lies in the exami-nation and the experimental test of the resistance of RNA molecules underthe inherent constraints imposed by prebiotic geochemical and geophysicalconditions.
Lastly as it seems likely that the RNA World may not have beenthe pristine nucleic acid-dominated ecosystem but simply a transientgo-between during the evolution to the contemporary DNA–protein world,considerations above would apply to any alternative pre-RNA backbonebefore the emergence of standard ribonucleic acids.
5.5.1. The RNA world script
A scenario of evolution postulates that an ancestral molecular world, theRNAWorld, existed originally before the contemporary DNA–RNA–Proteinworld meaning that the functional properties of nucleic acids and proteins aswe see them today would have been produced by molecules of ribonucleicacids (Gilbert, 1986; Benner et al., 1989, 1993; Joyce, 1989; Orgel, 1989;Bartel and Unrau, 1999; Gesteland et al., 1999; Joyce and Orgel, 1999;McGinness et al., 2002; Joyce, 2002). RNAs occupy a pivotal role in the cellmetabolism of all living organisms and several biochemical observationsresulting from the study of contemporary metabolism should be stressed. Forinstance, throughout its life cycle, the cell produces the deoxyribonucleotidesrequired for the synthesis of DNA from ribonucleotides, the monomers ofRNA. Thymine, a base specific of DNA, is obtained by transformation(methylation) of uracil a base specific of RNA, and RNAs serve as obligatoryprimers during DNA synthesis. Finally, the demonstration that RNAs act ascatalysts is an additional argument in favour of the presence during evolution
175PREBIOTIC CHEMISTRY

of RNAs before DNA. Therefore it seems highly likely that RNA arosebefore DNA during biochemical evolution, and for this reason DNA issometimes considered as modified RNA better suited for the conservation ofgenetic information. This genetic privilege would constitute a logical step inan evolutionary process during which other molecules could have precededRNA and transmitted genetic information. The idea of an RNA world restsprimarily on three fundamental hypotheses, developed by Joyce and Orgel(1999):– during a certain period in evolution, genetic continuity was assured by
RNA replication;– replication was based on Watson–Crick type base pairing;– early catalysis was performed by small non genetically coded peptides
and by ribozymes.Orgel and his coworkers showed that starting from activated monomers, it
is possible in certain conditions to copy a large number of oligonucleotidesequences containing one or two different nucleotides in the absence ofenzyme (Inoue and Orgel, 1983; Joyce and Orgel, 1986; Orgel, 1992; Hillet al., 1993). On the other hand, Ferris and his coworkers studied theassembly of RNA oligomers on the surface of montmorillonite (Ferris, 1987;Ferris and Ertem, 1992). Thus, experimental results demonstrated thatminerals which serve as adsorbing surfaces and as catalysts (Paecht-Horowitzet al., 1970; Ferris et al., 1996), can lead to accumulation of long oligonu-cleotides, given that activated monomers are available. One can thusenvisage that activated mononucleotides assembled into oligomers on themontmorillonite surface or on an equivalent mineral surface. The longeststrands, serving as templates, direct the synthesis of complementary strandsstarting from monomers or short oligomers, leading double-stranded RNAmolecules to accumulate. Finally, a double RNA helix – of which one strandis endowed with RNA polymerase activity –, would dissociate to copy thecomplementary strand and to produce a second polymerase that would copythe first to produce a second complementary strand, and so forth. The RNAworld would thus have emerged from a mixture of activated nucleotides.However, a mixture of activated nucleotides would need to have beenavailable! Finally, when either the first replicative molecule, the template orone of its elements (nucleotides) is to be synthesized from the originalbuilding blocks, in particular the sugars that are constituents of nucleotides, acertain number of difficulties are encountered (Sutherland and Whitfield,1997). First, synthesis of sugars from formaldehyde produces a complexmixture in which ribose is in low amounts. Second, production of a nucle-oside from a base and a sugar leads to numerous isomers, and no synthesis ofpyrimidine nucleosides has so far been achieved in prebiotic conditions.Finally, phosphorylation of nucleosides also tends to produce complexmixtures (Ferris, 1987). Consequently, onset of nucleic acid replication is
176 ROBERT PASCAL ET AL.

nearly inconceivable if one does not envisage a simpler mechanism for theprebiotic synthesis of nucleotides. Eschenmoser succeeded in producing2,4-diphosphate ribose during a potentially prebiotic reaction between glycolaldehyde monophosphate and formaldehyde (Eschenmoser, 1999). It is thuspossible that direct prebiotic nucleotide synthesis occurred by an alternativechemical pathway. Nevertheless, it is more likely that a certain organizedform of chemistry preceded the RNA world, hence the notion of ‘‘genetictake-over’’. Since the ribose-phosphate skeleton is theoretically not indis-pensable for the transfer of genetic information, it is logical to propose that asimpler replication system would have appeared before the RNA molecule.During the evolutionary process, a first genetic material, mineral in naturewould have been replaced by another totally distinct material of organicnature. The hypothesis of a precursor of nucleic acid (Cairns-Smith, 1966,1982; Joyce et al., 1987) is a relatively ancient idea, but it is only within thelast few years that research has been oriented towards the study of simplermolecules than present day RNAs, yet capable of auto-replication. In thePeptide Nucleic Acids (PNA) of Nielsen and coworkers, the ribofuranose-phosphate skeleton is replaced by a polyamidic skeleton on which purine andpyrimidine bases are grafted (see Figure 5.2). Indeed, PNAs form very stabledouble helices with an RNA or a complementary DNA (Egholm et al., 1993)and can serve as template for the synthesis of RNA, or vice versa (Schmidtet al., 1997). Moreover, PNA–DNA chimeras containing two types ofmonomers have been produced on DNA or PNA templates (Koppitz et al.,1998). Eventually, the information can be transferred from PNAs (achiralmonomers) to RNA during directed synthesis; the double helical moleculewith a single complementary RNA strand is stable. Transition from a ‘‘PNAworld’’ to an ‘‘RNA world’’ is hence possible. The group of Eschenmoserrecently replaced the ribose moiety of RNA by a four-carbon sugar, threose,whose prebiotic synthesis seems easier. The resulting oligonucleotidesdesignated TNAs, (30 ! 20)-a-L-threose nucleic acid, can form a doublehelix with RNA (Schoning et al., 2000). TNA is capable of antiparallelWatson–Crick pairing with complementary DNA, RNA and TNA oligo-nucleotides. Finally, this leads us to a major conclusion, namely that atransition may have occurred between two different systems without loss ofinformation.
From the point of view of evolution, the studies described previouslydemonstrate that other molecules capable of transmitting hereditary infor-mation may have preceded our present day nucleic acids. This is what Cairns-Smith coined the ‘‘take-over’’ (Cairns-Smith, 1982), the evolutionaryencroachment or genetic take-over, or to some extent what Francois Jacob(1970) calls genetic tinkering, in other words, making new material from theold.
177PREBIOTIC CHEMISTRY
The role of cofactors at all steps of the metabolism and their distributionwithin contemporary groups of organisms suggests that a great variety ofnucleotides was present in the ancestor common to all forms of life andbefore. Several authors have underscored the possible presence of coenzymesbefore the appearance of the translation machinery (White, 1976). Present-day coenzymes, indispensable cofactors for many proteins, would be livingfossils of catalysts of primitive metabolism. Most coenzymes are nucleotides(NAD, NADP, FAD, coenzyme A, ATP...) or contain heterocyclic nitrogenbases and it is even possible to consider that catalytic groups that were partof nucleic enzymes were incorporated in specific amino acids rather thanbeing ‘‘retained’’ as coenzymes. This could be the case of imidazole, thefunctional group of histidine, whose present synthesis in the cell is triggeredby a nucleotide.
Work has been carried out based on the demonstration of esterase activityin a nucleoside analogue N6-ribosyladenine (Fuller et al., 1972; Maurel andNinio, 1987; Maurel, 1992). This activity which is due to the presence of animidazolyl group that is free and available for catalysis, is comparable to thatof histidine placed in the same conditions. We have studied the kineticbehaviour of this type of catalyst (Ricard et al., 1996) and have shown thatthe catalytic effect increases greatly when the catalytic element, pseudohis-tidine, is placed in a favourable environment within a macromolecule(Decout et al., 1995). Moreover, primitive nucleotides were not necessarilyrestricted to the standard nucleotides encountered today, and because of theirreplicative and catalytic properties, the N6 and N3 substituted derivatives ofpurines could have constituted essential links between the nucleic acid worldand the protein world.
5.5.2. The case of adenine
Purine nucleotides, and in particular those containing adenine, participate in alarge variety of cellular biochemical processes (Neunlist et al., 1987; Maureland Decout, 1999; Nissen et al 2000). Also, the ease with which purine basesare formed in prebiotic conditions (Oro, 1960) suggests that these bases wereprobably essential components of an early genetic system. Furthermore,purines have also been found in theMurchison meteorite showing the range ofresistance of this molecule. The first genetic system was probably capable offorming base pairs of the Watson–Crick type, Hoogsteen and other atypicalassociations, by hydrogen bonds as they still appear today in RNA. Itprobably contained a different skeleton from that of RNA, and no doubt italso modified bases, thereby adding chemical functions, but also hydrophobicgroups, and functions such as amine, thiol, imidazole, etc. Wachtershauser(1988a) also suggested novel pairings of the purine–purine type.
178 ROBERT PASCAL ET AL.
Today, from a vast combination of nucleic acids, one can isolate aptamersthat possess catalytic properties (RNA ligation, cleavage or synthesis of apeptide bond, transfer of an aminoacyl group, etc.). The first nucleic acidscould possess independent domains, separated by flexible segments, creatingreversible conformational motifs, dependent on ions and bound ligands.Thus, a 10 amino acid-long peptide can recognize fine structural differenceswithin a micro RNA helix (discrimination can be made between two closely-placed microhelices). Just as protein and antibodies, RNA molecules canpresent hollows, cavities, or slits that make these specific molecular recog-nitions possible. RNAs must ‘‘behave as proteins’’. Whatever the chronologyand the order of appearance of the various classes of molecules, the impor-tance lies in the shape, the scaffolding and the architecture that have allowedfunctional associations.
Starting from a heterogenous population of RNAs with 1015 variants (apopulation of 1015 different molecules), five populations of RNAs capable ofspecifically recognizing adenine after about ten generations have been selected(Meli et al., 2002). When cloned, sequenced andmodelled, the best one amongthe individuals of these populations, has a shape reminiscent of a claw capableof grasping adenine. Is it the exact copy of a primitive ribo-organism that feedson prebiotic adenine in prebiotic conditions? Functional and structural studiespresently under way will highlight other activities, other conformations...
Following this line of investigation two adenine-dependent ribozymescapable of triggering reversible cleavage reactions have been selected. One ofthem is also active with imidazole alone. This result leads to very importantperspectives (Meli et al., 2003).
A considerable amount of research has been focused on the selection ofribozymes in vitro. Recently, it was demonstrated that a ribozyme is capableof continuous evolution, adding successively up to 3 nucleotides to the initialmolecule (McGinness, 2002). It is also possible to construct a ribozyme withonly two different nucleotides, 2,6-diaminopurine and uracil (Reader andJoyce, 2002).
5.5.3. Provisional conclusions
Very little is known to date about the behavior of macromolecules in ‘‘ex-treme’’ environments. How do structures behave? What are the majormodifications observed? What are the conditions of structural and functionalstability? How are the dynamics of the macromolecules and their interactionsaffected? What are the possibilities of conserving biological macromoleculesin very ancient soils or in meteorites? Can we find traces of these macro-molecules as molecular biosignatures, and if so in what form (Maurel andZaccaı, 2001; Tehei et al., 2002)?
179PREBIOTIC CHEMISTRY

The selection of thermohalophilic aptamers, RNAs resistant to hightemperatures (80 �C) in the presence of salt (halites 30 million years old)(Vergne et al., 2002, 2006), will maybe allow us to answer some of thesequestions, that are fundamental for the search and the date of past traces oflife, and of life on other planets...
5.6. The RNA/DNA Transition and the Origin of the Genetic Code
5.6.1. The origin of the genetic code
JULI PERETO
The hypothesis of an RNA world is widely accepted (see part 5.2 and part5.5). Nevertheless, the different evolutionary paths emerging from such ascenario have attracted much less attention. Did the protein synthesis and thegenetic code emerge in an RNA–peptide world and, afterwards, DNA wasinvented in an RNA/protein world? Or did DNA precede proteins? All theseand other alternative possibilities have been critically discussed by Dworkinet al. (2003). Albeit a precise chronology of the different transitions isimpossible, we can try to establish the most parsimonious order of eventsbased in our chemical and biochemical knowledge. Therefore, and althoughwe are conscious that alternative solutions can not be totally ruled out, thecurrent consensus around a growing experimental evidence favours anemergence of the machinery for biosynthesis of coded peptides in a world ofribozymes helped by amino acids and short peptides as cofactors (i.e. anRNA–peptide coevolution process, see part 5.2; Szathmary, 1999; Noller,2004). The view of an early emergence – in any case, before the universalcenancestor, see part 5.7 – of the machinery for both transcription andtranslation is consistent with genomic and structural studies of the majormacromolecular components of RNA polymerases and ribosomes (Fox andNaik, 2004).
5.6.1.1. Origin of protein synthesis in an RNA worldThe biosynthesis of coded proteins in modern cells is performed by theribosome, an extraordinarily complex assembly of proteins and RNA whosehigh-resolution structure has been recently elucidated – the large subunitdescribed by Ban et al. (2000), the small subunit by Wimberly et al. (2000),and the complete ribosome by Yusupov et al. (2001). There are goodstructural (Nissen et al., 2000; Hoang and Noller, 2004) and chemical (Zhangand Cech, 1997) reasons to propose that peptidyltransferase activity residesin the 23S rRNA of the large ribosomal subunit, although this view is notfully consistent with some biochemical and genetic observations (see Fox and
180 ROBERT PASCAL ET AL.
Naik, 2004, and references therein). It is widely assumed that the ribozymicnature of the ribosomal peptidyltransferase is a molecular fossil from theRNA world.
Protein biosynthesis is one of the more complex, energy dependent,metabolic processes. To perform its function, the ribosome is assisted bymany different molecular components: tRNAs – which both activate aminoacids through an ester bond and carry the anticodon triplet complementaryof a codon triplet in the mRNA –, aminoacyl-tRNA synthases – aaRS, whichcatalyze the synthesis of aminoacyl-tRNAs from each amino acid and itscognate tRNA throughout an aminoacyl-adenylate intermediate –, and manyprotein factors that participate in the different biosynthetic phases – initia-tion, elongation, translocation, and termination of the polypeptide chain.
In vitro selection experiments have shown the ability of ribozymes tocatalyze the basic steps of translation: RNA aminoacylation – including theformation of the activated aminoacyl-adenylate – and peptide bond synthesis(see Joyce, 2002, and references therein). Thus, the emergence of thismetabolic process seems chemically plausible in an RNA world (Lazcanoet al., 1992; Maynard Smith and Szathmary, 1995; Brosius, 2001; Joyce,2002; Fox and Naik, 2004; Noller, 2004).
Some models try to present the evolutionary transitions during theestablishment of all the macromolecular components of the translationmachinery and the origin of the genetic code in the context of the RNAworld hypothesis. Thus, the key role of tRNAs for the emergence of theprimitive ribosome in an RNA world has been emphasized by severalauthors (Weiner and Maizels, 1987; Brosius, 2001). The coding coenzymehandle (CCH) hypothesis is a testable scheme for the origin of translationand the code (Szathmary, 1999). In short, this proposal starts with theclassical notion that present day coenzymes (carrying a ribonucleotidemoiety) are molecular fossils of the RNA world (White 1976, 1982). In theprimitive stage of an RNA world, ribozymic activities would be supple-mented with amino acids and short peptides acting as cofactors, leading tofurther metabolically complex stages. The CCH hypothesis suggests thatthe binding of cofactors to the ribozymes was non-covalent, throughbase-pairing of short oligonucleotides recognizing some sequence of theribozyme active site. The progressive replacement of ribozymes by poly-peptides led to the transition to an RNA–protein world with an incipientgenetic code initially established by the recognition of the oligonucleotidehandles (precursors of anticodons) of the coenzymes and the handlebinding sites (precursors of codons) of the ribozymes (for further detailssee Szathmary and Maynard Smith, 1997; Szathmary, 1999). In summary,translation might initially have evolved to rise the functional versatilitiesof the RNA world (Noller, 2004) but eventually also sparked off its fall(Joyce, 2002).
181PREBIOTIC CHEMISTRY

5.6.1.2. Origin and evolution of the genetic codeThe origin of the genetic code – i.e. the assignment of base triplets to aminoacids during protein biosynthesis – remains a mystery since its deciphering inthe 1960s. One of the most impressive characteristics of the code is its uni-versality: except for some recent evolutionary innovations, notably mito-chondrial variants, all extant organisms use the same code (Santos and Tuite,2004). This is one of the most compelling arguments favoring the existence ofa universal cenancestor (see part 5.7). However, the classic hypothesis byCrick (1968) suggesting that the code is a frozen accident (i.e. an historicalaccident fixed in the universal cenancestor) has been challenged by modelswith different balance between chance and necessity during the origin andevolution of the code and, especially, by the very occurrence of code variants(Santos and Tuite, 2004).
5.6.1.3. An expanding codeIn their classical paper on the hypercycle and the origin of genetic infor-mation Eigen and Schuster (1978) suggested that the primitive code did useunits of less than three bases. It follows that the number of initial codons(and coded amino acids) was less than the current 64 (for the 20 amino acidsuniversally found in proteins). During its early evolution the code would haveincreased both the number of codons and of coded amino acids, and thepresent code would reflect the pattern of this historical expansion (for recenthypotheses see: Patel, 2005 and Wu et al., 2005).
5.6.1.4. The stereochemical hypothesisPelc (1965) and Dunnill (1966) postulated the appearance of a primitive codebased in the specific steric interaction between base triplets – codons oranticodons – and amino acids. Nowadays one experimental test of this modelsearches the synthetic RNA sequences that bind strongly an amino acid. Thein vitro selection methods have originated several aptamers – i.e. specificRNA ligands – for some protein amino acids, like Phe, Ile, His, Leu, Gln,Arg, Trp, and Tyr, that contain the coding sequences (codon and/or anti-condon) for those amino acids (Yarus et al., 2005), but this method does notwork in other cases, like Val (Yarus, 1998). In general, it is assumed thatstereochemical interactions played some role – more or less strong, more orless visible in present-day cells – during the origin and early evolution of thecode. A critical analysis on the stereochemical hypothesis can be found inEllington et al. (2000).
5.6.1.5. Adaptive evolutionThe degeneracy of the code (i.e. the existence of synonymous codons) and thesimilarity of the codons (one base difference) for physicochemically similar
182 ROBERT PASCAL ET AL.

amino acids suggest that some optimization process has sculpted most of thecode to minimize the damage due to point mutations (Sonneborn, 1965) ormistranslations (Woese, 1965). Recent approaches to test this idea consist inthe statistical comparison of the natural code with thousands of computa-tionally generated random codes. The results suggest that nature’s choicemight be the best possible code (Freeland et al., 2003). Historical, stereo-chemical, and adaptive patterns have been combined into a coherent pictureby Knight et al. (1999).
5.6.1.6. The coevolution modelDegeneracy aside, there are other patterns observed in the table of the geneticcode (for a good summary, see Figure 1 in Szathmary, 1999). Thus, aminoacids adjacent in biosynthetic pathways cluster together in the code (Dillon,1973; Jukes, 1973; Wong, 1975). Prebiotic chemistry on early Earth did notsupply all 20 current protein amino acids (see part 5.2) and most likely someof them had a biosynthetic origin. The expanding amino acid repertoiremight have therefore coevolved with the code, namely new metabolic prod-ucts could usurp codons previously used by their metabolic precursors (for arecent review, see Wong, 2005).
5.6.1.7. Clues from aminoacyl-tRNA synthases and tRNAsAminoacyl-tRNA synthases (aaRS) are responsible of the actual decoding: inextant cells, each one of these 20 enzymes specifically recognizes each proteinamino acid and their corresponding cognate tRNAs. A notable observationis the existence of a set of rules through which current aaRS recognize thetRNA molecules, mostly at the end of the acceptor stem – i.e. the end part ofthe tRNA that it is esterified by the amino acid, far from the anticodon stem,the part that recognizes the codon in the mRNA. Those rules – also known asthe operative code – were established using minihelices, i.e. small fragments ofRNA that mimic the aforementioned acceptor stems (Schimmel et al., 1993).On the other hand, structural studies of the active sites have revealed theexistence of two classes of aaRS, each deriving from a different, non-homologous, ancient protein domain (Schimmel et al., 1993). Members ofthe two classes differ in the binding region on the acceptor stem of tRNAs, sothat each tRNA can be potentially recognized by two binding sites, each onefrom one class, in a symmetric way. The specific pairings of the two aaRSclasses to the different tRNAs have served to unveil a new pattern in thecode. Ribas de Pouplana and Schimmel (2001) convincingly argued that theorigin and coevolution of the aaRS-tRNA specific recognitions left theirimprints in the present-day code. Thus, in a primitive stage each tRNA wasrecognized by two ancestral aaRS active sites, each from a different class, and
183PREBIOTIC CHEMISTRY

each amino acid of the primitive – smaller – set had several codons assigned.The incorporation of new amino acids required the duplication of the ele-ments (aaRS and tRNAs), leading to both the redistribution of codons andaaRS classes for the new couples amino acid/tRNA to originate the extantcode. Subsequently, aaRS acquired new domains to better recognize bothamino acid lateral chains and cognate tRNAs.
In summary, most of our current ideas about the origin of the genetic codeare refinements of the early proposals made just after the code was estab-lished more than 30 years ago. The different hypotheses are complementaryrather than mutually exclusive and the processes postulated could have beensimultaneous. Although we may never know exactly how and when theuniversal code was established, experimental testing of the biochemicalplausibility of the different proposals may eventually contribute to completea coherent evolutionary narrative with component parts from all thehypotheses.
5.6.2. Dating genetic takeovers: how old are cellular dna genomes?
ANTONIO LAZCANO
As demonstrated by the numerous double-stranded polymeric structures,with backbones quite different from those of nucleic acids but held togetherby Watson–Crick base pairing, that have been synthesized in the past fewyears, a wide variety of informational molecules that have the potential forgenetic information transfer is possible. These nucleic acid analogues provideuseful laboratory models of the molecules that may have bridged the gapbetween the prebiotic soup and the earliest living systems. However, nowa-days the only genetic polymers found in biological beings are RNA andDNA, two closely related nucleic acids. Which of them is older? Although thepossibility of a simultaneous origin of DNA and RNA has been suggested(Oro and Stephen-Sherwood, 1974), many agree with the pioneering pro-posals made by A. N. Belozerskii and J. Brachet at the 1957 Moscow meetingof the origin of life, who suggested in an independent way that the highamounts of cellular RNA could be interpreted as evidence of a more con-spicuous role during early biological evolution (cf. Dowrkin et al., 2003).This possibility is strongly supported by deoxyribonucleotide biosynthesis, ahighly conserved pathway that forms the monomeric constituents of DNAvia the enzymatic reduction of RNA’s monomers. As reviewed elsewhere(Lazcano et al., 1988), this metabolic pathway can be interpreted as evidencethat the transition from RNA to DNA genomes did not involve majormetabolic changes but was facilitated by the evolutionary acquisition of onesingle enzymatic step (Lazcano et al., 1988).
184 ROBERT PASCAL ET AL.
During the past 15 years the possibility of early replicating and catalyticcell systems based on RNA and devoid of both proteins and DNA, as sug-gested in the late 1960’s by Carl R. Woese, Francis H. Crick and Leslie E.Orgel, i.e. the so-called RNA world, has received considerable support withthe demonstration of wide range of biochemical reactions catalyzed byribozymes (Joyce, 2002). Although the nature of the predecessor(s) of theRNA world are completely unknown and can only be surmized, it is rea-sonable to assume that the extreme chemical instability of catalytic andreplicative polyribonucleotides may have been the main limitation of suchRNA world. In fact, the chemical lability of RNA implies that primordialribozymes must have been very efficient in carrying out self-replicationreactions in order to maintain an adequate inventory of molecules needed forsurvival. The instability of RNA may have been one of the primary reasonsunderlying the transition to the extant DNA/RNA/protein world where, dueto the increased stability of the genetic molecules, survival would have beenless dependent on polymer stability.
How did such transition take place? According to Joyce (2002), it ispossible that in the RNA world ribozymes arose that could catalyze thepolymerization of DNA; in this manner information stored in RNA could betransferred to the more stable DNA. On the other hand, since four of thecentral reactions involved in protein biosynthesis are catalyzed by ribozymes,their complementary nature suggest that they may have first appeared in anRNA world (Kumar and Yarus, 2001), i.e. double-stranded DNA genomesappeared once ribosome-catalyzed, nucleic acid-coded protein synthesis hadevolved in an RNA-dominated primitive biosphere. Thus, the most likelyexplanation for DNA takeover could have been that because of increasedstability much longer oligomers could have accumulated and this providedfor an enhanced storage capacity of information that could be passed on tothe next generation of living entities. Before long, RNA which once playedthe singular role of replication and catalysis was replaced by the more effi-cient and robust DNA/protein world wherein RNA was demoted to a role ofmessenger/transcriber of DNA stored information needed for proteinbiosynthesis.
When did the transition from RNA to DNA cellular genomes take place?As is often the case with metabolic innovations, such antiquity of such stepcannot be documented from geological data. However, since all extant cellsare endowed with DNA genomes, the most parsimonious conclusion is thatthis genetic polymer was already present in the last common ancestor (LCA)that existed prior to the divergence of the three primary domains, i.e., theBacteria, Archaea, and Eucarya. As discussed elsewhere (Delaye et al., 2004),although there have been a number of suggestions that the LCA (or itsequivalents) was endowed with genomes formed by small-sized RNA mole-cules or hybrid RNA/DNA genetic system, there are manifold indications
185PREBIOTIC CHEMISTRY
that double-stranded DNA genomes of monophyletic had become firmlyestablished prior to the divergence of the three primary domains. The majorarguments supporting this possibility are:(a) in contrast with other energetically favourable biochemical reactions
(such as hydrolysis of the phosphodiester backbone, or the transfer ofamino groups), the direct removal of the oxygen from the 2¢-C ribo-nucleotide pentose ring to form the corresponding deoxy-equivalents isa thermodynamically much less-favoured reaction. This is a majorconstraint that strongly reduces the likelihood of multiple, indepen-dent origins of biological ribonucleotide reduction;
(b) the demonstration of the monophyletic origin of ribonucleotidereductases (RNR), which are the enzymes involved in the biosynthesisof deoxyribonucleotides from ribonucleotide precursors, is greatlycomplicated by their highly divergent primary sequences and the dif-ferent mechanisms by which they generate the substrate 3¢-radicalspecies required for the removal of the 2¢-OH group. However,sequence analysis and biochemical characterization of RNRs from thethree primary biological domains has confirmed their structural sim-ilarities, which speaks of their ultimate monophyletic origin (seeFreeland et al., 1999 and references therein);
(c) the sequence similarities shared by many ancient, large proteins foundin all three domains suggest that considerable fidelity existed in theoperative genetic system of their common ancestor (i.e., the LCA), butsuch fidelity is unlikely to be found in RNA-based genetic systems(Lazcano et al., 1992).
The nucleic acid replication machinery requires, at the very least, a set ofenzymes involving a replicase, a primase, and a helicase. Quite surprisingly,when the corresponding enzymes are compared between the three primarydomains, they appear to be of polyphyletic origins although there are indi-cations of a closer phylogenetic relationship between the Eucarya and theArchaea. Given the central role that is assigned to nucleic acid replication inmainstream definitions of life, the lack of conservation and polyphyly ofseveral of its key enzymatic components is somewhat surprising. However,there is structural evidence that some of components do have a single origin. Itis reasonable to assume, for instance, that the oldest function of polymerases isthe formation of the phosphodiester bond in a growing nucleic acid molecule.This reaction is catalyzed by the so-called palm domain of DNA polymerase I,and there is evidence of the ample phylogenetic distribution of this subdomainnot only in the homologues of bacterial DNA polymerase I, but also amongmitochondrial and viral DNA-dependent RNA polymerases (Steitz, 1999).These findings have been interpreted to imply that the palm domain is one ofthe oldest recognizable components of an ancestral cellular polymerase, thatmay have acted both as a replicase and a transcriptase during theRNA/protein
186 ROBERT PASCAL ET AL.
world stage (Delaye et al., 2004). The presence of homologous palm domain inDNA- and RNA polymerases suggests that once the advent of double-stran-ded DNA took place, relatively few mutations would have been required forthe evolution of this RNA replicase into a DNA polymerase, well before thedivergence of the three domains. If this hypothesis is correct, then the palmdomain of extant DNA polymerases is a silent but chemically active witness ofthe nature of biological systems older than the double stranded DNA cellulargenomes. The biosphere never losses the traces of its evolutionary past.
5.7. The Last Common Ancestor
DAVID MOREIRA AND PURIFICACION LOPEZ-GARCIA
In The origin of species, Darwin concluded that a logical outcome of thepremises of descent with modification and natural selection is ‘that probablyall the organic beings which have ever lived on this earth have descended fromsome one primordial form, into which life was first breathed’ (Darwin, 1859).The strong development of biochemistry and molecular biology during thelast century clearly demonstrated that all terrestrial life is based on commonbiochemical themes (Kornberg, 2000; Pace, 2001), lending solid ground tothat idea. Since the basic structural constituents of the cell and its mostfundamental metabolic reactions are shared by the three domains of life,Bacteria, Eucarya and Archaea (Woese and Fox 1977b), the hypothesis of acommon ancestor from which modern organisms possessing already thosetraits made its way naturally.
Such hypothetical ancestor has received different names: the last com-mon ancestor, the cenancestor (from the Greek kainos meaning recent andkoinos meaning common) (Fitch and Upper, 1987) and the last universalcommon ancestor or LUCA (Forterre and Philippe, 1999). Althoughimpossible to date, the cenancestor likely existed several billion years ago,predating the diversification of the three life domains. Therefore, thereconstruction of its model portrait is a difficult, speculative, task. Mostauthors favour the idea that the cenancestor was a single organism, anindividual cell that existed at a given time and that possessed most of thefeatures (and the genes encoding them) common to all contemporaryorganisms (Figure 5.10A–D). Others, on the contrary, envisage a popula-tion of cells which, as a whole, possessed all those genes, although no singleindividual did (Kandler, 1994; Woese, 1998; Woese, 2000). The level ofgene exchange and spreading in this population should have been very highbut, at some point, a particular successful combination of genes occurred ina subpopulation that became ‘isolated’ and gave rise to a whole line ofdescent. Kandler, for instance, proposed in his ‘pre-cell theory’ that
187PREBIOTIC CHEMISTRY

bacteria, archaea, and eukaryotes emerged sequentially in this way(Figure 5.10E) (Kandler, 1994; Wachtershauser, 2003). Despite the con-troversy between the ‘single-cell’ and ‘population’ hypotheses, the cenan-cestor is generally conceived as an already quite complex entity. Thisimplies that life had already undergone a more or less long evolutionarypathway from the prebiotic times to the cenancestor stage. Therefore, boththe origin of life and the nature of the cenancestor are different evolu-tionary questions. However, although rather complex, the cenancestor’slevel of complexity depends on the model. For Woese, it was a relativelyprimitive entity, a ‘progenote’, that ‘had not completely evolved the linkbetween genotype and phenotype’ (Woese and Fox, 1977a). For many otherauthors the progenote state occurred prior to the cenancestor, which wasnearly a modern cell (Doolittle, 2000a, b).
Is it possible to build a model portrait of the cenancestor? At least, severalof its fundamental characteristics can be inferred thanks to biochemistry andmolecular biology comparative studies and, more recently, to the most
Figure 5.10. Different models of evolution of the three domains of life from a single-cellcenancestor (A–D) or a population of pre-cells (E).
188 ROBERT PASCAL ET AL.
powerful comparative genomics and molecular phylogeny. This approachhas provided strong evidence for the very ancient origin of the ribosome-based protein synthesis (translation), a well-developed transcriptionmachinery for the synthesis of structural and messenger RNAs, and theenergy-obtaining process based on the generation of a proton gradient acrossmembranes. All these are universal features in contemporary cells and,consequently, most likely present in the cenancestor. Other cenancestor’sproperties are, however, much more controversial, such as the existence of aDNA-based genome or even the possession of lipid-based membranes.
5.7.1. Protein synthesis in the cenancestor
When all available complete genome sequences of bacterial, archaeal andeukaryotic species are compared, only ~60 genes are found to be common toall of them. This is a small number knowing that prokaryotic species containbetween 500 and 10,000 genes, and eukaryotic species between 2,000 and30,000 genes. Interestingly, the set of ‘universal’ genes is almost entirelyintegrated by genes encoding ribosomal RNA and ribosomal proteins andother proteins involved in translation (aminoacyl-tRNA synthetases andtranslation factors) (Koonin, 2003). These genes are most likely ancestral,strongly suggesting that the cenancestor possessed a ribosomal-based trans-lation machinery for protein synthesis comparable to that found in modernorganisms. Protein synthesis by ribosomes is, therefore, the most universallyconserved process and it appears to have remained practically unchangedsince the cenancestor’s times.
A few genes of that universal core encode RNA polymerase subunits,responsible for the synthesis of messenger and other RNAs from their DNAtemplates (genes). This suggests that the cenancestor possessed at least partof the transcription machinery that is found in contemporary organisms.Nevertheless, several RNA polymerase subunits and transcription factors arenot universally distributed, so that the evolutionary conservation of thetranscription machinery is not as high as that of translation.
5.7.2. The cenancestor’s genome: DNA or RNA?
DNA is the molecule where genetic information is stored in all contemporarycells. However, only three out of the ~60 universal genes are related to DNAreplication and/or repair: one DNA polymerase subunit, one exonuclease andone topoisomerase (Koonin, 2003). Today, archaea and eukaryotes sharemany genes involved in DNA replication that are absent from bacteria which,in turn, possess apparently unrelated genes encoding proteins performingequivalent functions. Various hypotheses try to explain this paradox. One of
189PREBIOTIC CHEMISTRY
them postulates that the cenancestor did not possess a DNA, but an RNA,genome. DNA and its replication would have evolved twice independently,once in the bacterial line of descent and other in a lineage leading to archaeaand eukaryotes (Leipe et al., 1999; Forterre, 2002). However, although few,universally conserved proteins and protein domains involved in DNAmetabolism exist (Giraldo, 2003), suggesting that the cenancestor possessedindeed a DNA genome. Furthermore, due to a higher mutation rate, RNA ismuch more error-prone than DNA and, consequently, individual RNAmolecules cannot exceed a certain size (Eigen limit) without falling into rep-licative catastrophe (Eigen, 1971; 2002). This size is small (~30–50 kb), so thata single RNA molecule can contain only a few dozens of genes. Since thecenancestor may have had over 600 genes (Koonin, 2003), its genome wouldhave required many RNA molecules, entailing serious problems of stabilityand partition among daughter cells. Contemporary DNA and RNA virusesare good examples for these stability problems: DNA viruses can have verylarge genomes, up to ~1 Mbp (Raoult et al., 2004), but those of RNA virusesdo not exceed ~30 kb (Domingo and Holland, 1997).
The remaining models postulate a DNA-based genome for the cenancestor.One of them hypothesises that transcription and translation were already welldeveloped while DNA replication was still very primitive. DNA replicationwould have been refined as the two lines of descent leading to the bacteria andto the archaea/eukaryotes diverged (Olsen and Woese, 1997). An oppositepossibility could be that the cenancestor had a very complex DNA-basedmetabolism, containing ancestral versions of the proteins found today in boththe bacterial and the archaeal/eukaryotic replication machineries. One set ofthese proteins would be involved in replication, whereas the other would bespecialized in DNA repair. During the separation of the two lineages, each lineof descent would have retained only one of the two sets of proteins. In anotherhypothesis, the DNA replication machinery would be already developed in thecenancestor, but it evolved very fast in one or the two lineages descending fromthe cenancestor, so that the similarity between homologous genes in the twolineages are no longer recognisable (Olsen and Woese, 1997; Moreira, 2000).Yet in another model, the cenancestor would have had a DNA replicationmachinery, whose genes were inherited by archaea and eukaryotes, but that wasreplaced by viral genes in bacteria (Forterre, 1999). However, the directionalityof these gene transfers is highly discussed, since present evidence demonstratesthat viruses have acquired many, including replication-related, genes from theirbacterial hosts (Moreira, 2000).
5.7.3. Energy and carbon metabolism in the cenancestor
The question of how metabolism looked like in the cenancestor is rarelyaddressed, partly because the reconstruction of early metabolic pathways is
190 ROBERT PASCAL ET AL.

extremely difficult. Genes involved in energy and carbon metabolism mostoften display a patchy distribution in organisms of the three domains of lifeand usually belong to large multigenic families whose members have beenrecruited for different functions in various metabolic pathways. In addition,horizontal gene transfer frequently affects metabolic genes, since they mayconfer an immediate adaptive advantage to the new host. Hence, thereconstruction of ancestral metabolic pathways is hampered by a complexhistory of gene duplications and losses, differential enzyme recruitment, andhorizontal gene transfer (Castresana and Moreira, 1999). Nevertheless, theuniversal presence of a highly conserved membrane-bound ATPase in con-temporary organisms indicates that the cenancestor was able to produceenergy in the form of ATP by generating a proton gradient across the cellmembrane. The energy source required to generate this proton gradient waslikely chemical (oxido-reduction – redox-reactions), since phototrophy (light-based) evolved later and only in the bacterial line. The type of electrondonors and acceptors involved in those redox reactions, whether they wereorganic, inorganic or both, is not known. It is possible that the cenancestorused a variety of oxidized inorganic molecules as electron acceptors (Cas-tresana and Moreira, 1999), and that it carried out a simple heterotrophicmetabolism, at least some kind of fermentation.
A purely heterotrophic cenancestor, needing to uptake organic moleculesfrom the environment, would be logical if life originated in a prebiotic soup(Oparin, 1938; Broda, 1970). An autotrophic cenancestor, able to synthesiseorganic molecules from CO or CO2, would be a logical outcome of modelsproposing that the first living forms were chemolithoautotrophic, derivingenergy from redox reactions involving inorganic molecules such as H2S, H2
and FeS (Wachtershauser, 1988b; Russell and Hall, 1997, see also part 5.3).However, this is not incompatible with soup-based models, since autotrophymight have evolved between life emergence and the cenancestor. If the ce-nancestor was autotrophic, which metabolic pathway to fix carbon did it use?Today, four different pathways of autotrophic carbon fixation are known:The Calvin–Benson cycle (reductive pentose-phosphate pathway), the Arnoncycle (reductive citric acid pathway), the Wood–Ljundahl cycle (reductiveacetyl-CoA pathway), and the hydroxypropionate pathway, none of which isuniversal (Pereto et al., 1999). The complex Calvin–Benson cycle appearedrelatively late during bacterial evolution, but any of the other, simpler,pathways might have been ancestral following different authors(Wachtershauser, 1990; Pereto et al., 1999; Russell and Martin, 2004).
5.7.4. The membrane of the cenancestor
All contemporary cells are surrounded by a plasma membrane that is madeout of phospholipids, generally organized in bilayers (see part 5.4). However
191PREBIOTIC CHEMISTRY
there exist profound differences between the membrane lipids of archaea andthose of bacteria and eukaryotes. In archaea, phospholipids are generallymade out of isoprenoid lateral chains that are bounded by ether linkages toglycerol-1-phosphate, whereas in bacteria and eukaryotes they are made outof fatty acids bounded by ester linkages to glycerol-3-phosphate. Theenzymes that synthesise the glycerol-phosphate stereoisomers are nothomologous in archaea and bacteria/eukaryotes, belonging to differentenzymatic families. To explain this profound difference, some authors evenproposed that the cenancestor was not yet membrane-bounded and thatmembrane lipids together with membrane-bounded cells evolved indepen-dently to generate bacteria and archaea (Koga et al., 1998). Others proposedthat the cenancestor was cellular but, instead of lipid membranes, it possessediron monosulphide boundaries. Cells would be mineral compartments in anever-growing hydrothermal chimney traversed by alkaline fluids, and mem-brane lipids would have been invented independently in bacteria and archaea(Martin and Russell, 2003). Another, less radical, option is that the cenan-cestor had a lipid membrane that was heterochiral, i.e. composed of amixture of lipids built upon glycerol-1-phosphate and glycerol-3-phosphate(Wachtershauser, 2003). The biosynthetic pathways to produce the two typesof homochiral membranes would have evolved as archaea and bacteriadiverged. This is supported by recent phylogenetic analyses of the enzymesinvolved suggesting that the cenancestor synthesized phospholipids via anon-stereospecific pathway (Pereto et al., 2004). In addition, the occurrenceof universally conserved membrane-bound proteins, such as the proton-pump ATPases (Gogarten et al., 1989) and the signal recognition particle,SRP (Gribaldo and Cammarano 1998) fully supports the hypothesis of acenancestor endowed with lipid membranes.
5.7.5. Other unresolved questions
Many additional questions about the nature of a hypothetical cenancestor re-main open, e.g. whether the cenancestor was hyperthermophilic or not, andwhether it was ‘simple’ or ‘complex’. The hypothesis of a hyperthermophiliccenancestor arose from the discovery of hyperthermophilic bacteria and ar-chaea growing optimally at >80 �C and from the proposals of a hot, auto-trophic origin of life in a hotter early Earth (Achenbach-Richter et al., 1987;Pace, 1991). The first criticisms to it derived from the fact that RNA and otherbiomolecules have relatively short life-times at high temperatures so that ahot origin of life would be unlikely (Lazcano and Miller, 1996). However, theorigin of life and the cenancestor might have occurred in different environ-mental conditions (Arrhenius et al., 1999). Hence, attempts to reconcile ahyperthermophilic cenancestor with a cold origin of life propose that onlyhyperthermophiles could survive the late heavy meteorite bombardment
192 ROBERT PASCAL ET AL.

~3.9 Ga ago (Gogarten-Boekels et al., 1995; about LHB, see chapter 4.4).The most decisive argument sustaining a hyperthermophilic cenancestor wasthat hyperthermophilic bacteria and archaea branched at the most basalpositions in phylogenetic trees (Stetter, 1996). Two major objections fol-lowed. First, computer reconstruction of ancestral rRNAs suggests that thecontent of guanine and cytosine in the cenancestor’s rRNA was incompatiblewith life at >80 �C (Galtier et al., 1999), although the analysis of the samedata by other methods favours, on the contrary, a hyperthermophilic ce-nancestor (Di Giulio, 2000; 2003). Second, refined phylogenetic analyses ofrRNAs suggest that the basal emergence of hyperthermophilic bacteria wasan artefact of phylogenetic tree reconstruction, and that they adapted sec-ondarily to hyperthermophily (Brochier and Philippe, 2002). By contrast, thearchaeal ancestor was most likely hyperthermophilic (Forterre et al., 2002).Therefore, if the bacterial ancestor was also a hyperthermophile, then thecenancestor was most likely hyperthermophilic too, but if the bacterialancestor was not hyperthermophilic, the question remains open. At any rate,all models appear compatible with the occurrence of a thermophilic (60–80 �C) cenancestor (Lopez-Garcıa, 1999).
Another controversial issue concerns the level of structural complexity of thecenancestor. For most authors, it was ‘structurally simple’, resembling today’sprokaryotes, with the genetic material directly immersed in the cytoplasm. Suchan ancestor would agree with the widely accepted bacterial rooting of the tree oflife, between the bacteria and the archaea/eukaryotes (Figure 5.10A) (Woeseet al., 1990), but would be also compatible with two alternative tree topologies(Figure 5.10B and C). However, other authors propose that the root lies be-tween the eukaryotes and a branch leading to the two prokaryotic domains(Figure 5.10D) (Brinkmann and Philippe, 1999; Philippe and Forterre, 1999).This rooting would still be compatible with a prokaryote-like cenancestor, butopens the possibility that the cenancestor had some features of moderneukaryotes, such as a membrane-bound nucleus andmany small RNAs claimedto be relics of a hypothetical RNA world (Poole et al. 1999). Despite the po-sition of the root is indeed an open question, models proposing a eukaryotic-like cenancestor do not explain how such a complex entity was built from theprebiotic world. In this sense, a simpler, prokaryotic-like cenancestor appearsmuch more parsimonious in evolutionary terms.
5.8. The Origin of Viruses
PATRICK FORTERRE
Viruses are often ignored in evolutionary scenarios. For many biologists,viruses are not even considered as genuine living beings, since they are
193PREBIOTIC CHEMISTRY

absolutely dependent on cellular organisms (archaea, bacteria or eukaryotes)for their development. Nevertheless, viruses are very diverse and can be quitecomplex, as is revealed by recent observations including (i) the discovery of agiant virus (Mimivirus) whose genome doubles the size of certain cell gen-omes, (ii) the fact that, after the analysis of many viral genomes, many viralproteins have no known homologues in cells, (iii) the existence of a phylo-genetic link between viruses and different evolutionary distant cellular hosts(e.g. man and bacteria) or (iv) the discovery of an unexpected morphologicaland functional diversity, particularly in the less-explored archaeal viruses.
5.8.1. Viral properties
Viruses may be considered as living entities if we consider their chemicalcomposition and their developmental cycle. Viruses are made out of the samemolecules as cellular organisms: proteins, nucleic acids, and often, lipids andsugars. However, viruses exhibit a number of singularities. By contrast tocellular genomes, always made out of double-stranded DNA, viral genomescan be constituted by DNA or RNA, either single- or double-stranded. Theessential difference between viruses and their cellular hosts is that viruses areunable to synthesize their own proteins and to produce their ATP. Viruseslack ribosomes as well as any form of energy and carbon metabolism.Therefore, viruses are obligatory parasites of cells (Villareal, 2005).
During their cycle, viruses exhibit two different forms. One form is stable,normally extracellular, the virion, which is unable to grow and reproduce,and the other (or others) is intracellular and can lead to the viral repro-duction. Virions are constituted by a protective shell, the capsid, whichencapsulates the viral genome that is generally associated with proteinsforming a nucleoprotein filament. Virions can be observed only by electronmicroscopy and display very different morphologies (spherical, filamentous,head-and-tail, etc). Being very small, they were initially discovered by theircapacity to traverse filters that retain bacteria. Nonetheless, their size canvary from a few dozens to various hundreds of nanometres, thus the largestviruses are comparable in size to the smallest known cells (Villareal, 2005).Viral genomes can also vary from a few kilobase pairs for the smallest RNAor DNA viruses to 1,200 kilobase pairs for the Mimivirus genome (Raoultet al., 2005). The simplest protein capsids are assembled following a precisegeometry, but many virions have one or two additional envelopes, often fromcellular origin. Virions have frequently been considered as passive formssimply allowing the transport and protection of the viral genome. However,an archaeal virus has been discovered recently, whose virion is able to changeits morphology extracellularly (Haring et al., 2005).
The virion can either penetrate entirely within the cell cytoplasm or justinject its genetic material into it. These processes require more or less
194 ROBERT PASCAL ET AL.
sophisticated mechanisms involving proteins that recognise the host cellsurface, allow the fusion of the viral envelope with that of the cell, the captureof the virus by cellular endocytose or the transport of DNA through the cellplasma membrane. Once inside, the virus deviates the cellular metabolism toreplicate and transcribe its own genome, make its capsid proteins and, in theend, produce new viruses. This cycle may trigger the death of infected cellswith the sudden liberation of many virions (virulence), or may induce thecontinuous production of a limited amount of virions while allowing cellsurvival. Finally, the viral genome may stay within the cell without producingnew viruses (lysogenic state). During the lysogenic state, viral genomes canbecome integrated in the host chromosome. In the case of retroviruses (e.g.AIDS virus), this integration is achieved by retrotranscription of the viralRNA to DNA. Lysogenic viruses can be reactivated when cells undergodifferent stress, which allows the virus to escape and initiate a new cycle.
All cellular organisms, archaea, bacteria or eukaryotes, can be infected byan extraordinary diversity of viruses. Viruses constitute indeed a majorcomponent of the biosphere and play, and have likely played, a determinantrole in the evolution of their hosts (Villareal, 2005). Therefore, it is probablethat viruses have also influenced early steps in biological evolution but, whenand how did viruses originated? The origin of viruses is still a mystery. Manyresearchers think that viruses are polyphyletic, i.e. they have multiple origins.However, viruses share a number of properties that may suggest, on thecontrary, a common mechanism for their emergence.
5.8.2. Hypotheses on the origin of viruses
Traditionally, three hypotheses to explain the origin of viruses have been putforward. First, viruses would be primitive entities that appeared before cells.Second, viruses would derive from ancient cells that parasitized other cells bya reduction process implying the loss of their ribosomes and energy andcarbon metabolism. And third, viruses would be chromosome fragmentsfrom cells that became autonomous and began to parasitize (Balter, 2000,Forterre, 2006). The three hypotheses have been severely criticized. The firstone was refuted because, being obligatory parasites, viruses could have neverbeen emerged before cells. The second was also criticized because there are noknown intermediates between viruses and cellular parasites, since even themost reduced cellular parasites (mycoplasma within the bacteria or micro-sporidia within the eukaryotes) have retained their basic cellular features.The third hypothesis was favoured by most biologists, although it does notexplain how RNA or DNA fragments could have escaped from cells andacquire a capsid, and how the mechanisms that allow viruses to penetratecells were developed. In addition, in its original form, this hypothesis pos-tulated that viruses infected bacteria (bacteriophages) and those infecting
195PREBIOTIC CHEMISTRY

eukaryotes had originated from bacterial and eukaryotic genomes, respec-tively. However, many viral proteins have no known homologues in theirhost genomes, which exclude, for some authors, a common origin. Fur-thermore, some viral proteins may have homologues in a different cellulardomain to that being actually infected by the virus (Bamford, 2003).
Recent structural analyses of conserved viral proteins show that RNApolymerases from RNA bacteriophages are homologous to those from RNAviruses infecting eukaryotes, and that certain capsid proteins from someDNA bacteriophages are homologous to those from DNA viruses infectingeukaryotes and archaea. Although the possibility that viruses can ‘‘jump"and infect organisms from different domains cannot be excluded, variousresearchers think that viruses are very ancient, existing well before thedivergence of the three cellular domains, that is, before the last universalcommon (or cellular) ancestor (Bamford, 2003, Forterre, 2005).
All the criticism raised against the above-mentioned hypotheses is difficultto overcome if viruses emerged in the cellular world that we know today (e.g.it would be difficult to imagine a regressive evolution from modern cellstowards a viral form). However, the situation may be different if virusesoriginated prior to a last cellular ancestor during an RNA world. Thus, someauthors that support the idea of a long acellular evolution during this RNAworld period have hypothesized that viruses appeared before cells. Viruseswould have been ‘‘hosted’’ primarily by a primitive semi-liquid soup or bymineral ‘‘cells’’ (Koonin and Martin, 2005). This idea is criticized by otherauthors favouring the idea that, on the contrary, free cells surrounded by aplasma membrane emerged very early. If this was the case, two differentscenarios corresponding to the second and third hypotheses mentioned abovecan be envisaged: viruses emerged either by reduction of RNA cells thatparasitized other RNA cells, or by the separation and independence of RNAfragments that would become autonomous and infectious. These scenarios,improbable in the modern cellular world, could be more realistic in thecontext of primitive RNA-based cells whose genomes were likely constitutedby several linear RNA molecules (Forterre, 2006).
In any case, the first viruses may have been RNA viruses, although thequestion of when they emerged remains unanswered. The discovery ofstructural homologies between viral RNA and DNA polymerases suggeststhat DNA viruses evolved secondarily from certain RNA viruses. It could beeven possible that DNA appeared for the first time in viruses, since achemical modification in the viral genome could have represented animmediate selective advantage in order to escape from cellular defencesdesigned to destroy the viral genome. This hypothesis would explain whymany viruses encode their own ribonucleotide reductase (the enzyme thatreduces the ribose into deoxyribose) and/or thymidylate synthase (responsi-
196 ROBERT PASCAL ET AL.
ble for the synthesis of thymine, the nucleotide that replaces uracile in DNA)(Forterre, 2002).
Although the mechanisms that led to the emergence of viruses remainhypothetical, viruses must have played a considerable role in biologicalevolution. Many viral genomes or genome fragments are present (cryptic) incontemporary cell genomes. Viruses can pick up genes from one organismand transfer them to another, thus serving as vehicles of gene transfer be-tween cellular lines. Horizontal gene transfer is now recognized as animportant motor in cellular evolution. The essential role of viruses in bio-logical history is beginning to be fairly recognized.
References
Achenbach-Richter, L., Gupta, R., Stetter, K. O. and Woese, C. R.: 1987, Syst. Appl.Microbiol. 9, 34–39.
Arnez, J. G. and Moras, D.: 2003, Trends Biochem. Sci. 22, 211–216.
Arrhenius, G., Bada, J. L., Joyce, G. F., Lazcano, A., Miller, S. and Orgel, L. E.: 1999, Science283, 792.
Balter, M.: 2000, Science 289, 1866–1867.
Bamford, D. H.: 2003, Res. Microbiol. 154, 231–236.Ban, N., Nissen, P., Hansen, J., Moore, P. B. and Steitz, T. A.: 2000, Science 289, 905–920.Barbier, B. and Brack, A.: 1992, J. Am. Chem. Soc. 114, 3511–3515.
Bartel, D. P. and Unrau, P. J.: 1999, Trends Biochem. Sci. 24, 9–13.Benner, S. A.: 1993, Science 261, 1402–1403.Benner, S. A., Ellington, A. D. and Tauer, A.: 1989, Proc. Natl. Acad. Sci. U.S.A. 86, 7054–
7058.
Biron, J.-P. and Pascal, R.: 2004, J. Am. Chem. Soc. 126, 9198–9199.Biron, J.-P., Parkes, A. L., Pascal, R. and Sutherland, J. D.: 2005, Angew. Chem. Int. Ed. 44,
6731–6734.
Bohler, C., Nielsen, P. E. and Orgel, L. E.: 1995, Nature 376, 578–581.Borsenberger, V., Crowe, M. A., Lehbauer, J., Raftery, J., Helliwell, M., Bhutia, K., Cox, T.
and Sutherland, J. D.: 2004, Chem. Biodivers. 1, 203–246.
Brasier, M. D., Green, O. R., Jephcoat, A. P., Kleppe, A. K., van Kranendonk, M., Lindsay,J. F., Steele, A. and Grassineau, N.: 2002, Nature 416, 76–81.
Brinkmann, H. and Philippe, H.: 1999, Mol. Biol. Evol. 16, 817–825.
Brochier, C. and Philippe, H.: 2002, Nature 417, 244.Broda, E.: 1970, Prog. Biophys. Mol. Biol. 21, 143–208.Brosius, J.: 2001, Trends Biochem. Sci. 26, 653–656.Cairns-Smith, A. G.: 1966, J. Theor. Biol. 10, 53–88.
Cairns-Smith, A. G.: 1982, Genetic Takeover and the Mineral Origins of Life, CambridgeUniversity Press, Cambridge, 477 pp.
Castresana, J. and Moreira, D.: 1999, J. Mol. Evol. 49, 453–460.
Cavalier-Smith, T.: 2001, J. Mol. Evol. 53, 555–595.Chen, I. and Szostak, J. W.: 2004, Proc. Natl. Acad. Sci. U.S.A. 101, 7965–7970.Chen, I., Roberts, R. W. and Szostak, J. W.: 2004, Science 305, 1474–1476.
Cheng, C. M., Liu, X. H., Li, Y. M., Ma, Y., Tan, B., Wan, R. and Zhao, Y. F.: 2004, OriginsLife Evol. Biosphere 34, 455–464.
197PREBIOTIC CHEMISTRY

Chyba, C.: 2005, Science 308, 962–963.Chyba, C. and Sagan, C.: 1992, Nature 355, 125–132.
Commeyras, A., Collet, H., Boiteau, L., Taillades, J., Vandenabeele-Trambouze, O., Cottet,H., Biron, J.-P., Plasson, R., Mion, L., Lagrille, O., Martin, H., Selsis, F. and Dobrijevic,M.: 2002, Polym. Int. 51, 661–665.
Cordova, A., Engqvist, M., Ibrahem, I., Casas, J. and Sunden, A.: 2005, Chem. Commun.2047–2049.
Corey, M. J. and Corey, E.: 1996, Proc. Natl. Acad. Sci. U.S.A. 93, 11428–11434.Cornee A., Vergne J., Guyot F., Goffe B., Rouchy J.-M. and Maurel M.-C.: 2004, in
G. Camoin and P. Gautret (eds.), Microbialites and Microbial Communities in SedimentarySystems, Publication Speciale ASF, Paris, 31 p.
Crick, F. H. C.: 1968, J. Mol. Biol. 38, 367–379.
Cronin J. R. and Chang S. 1993, in J. M. Greenberg, C. X. Mendoza-Gomez and V. Pirronello(eds.), The Chemistry of Life’s Origins, Kluwer Dordrecht pp. 209–258.
Darwin, C.: 1859, The Origin of Species by Means of Natural Selection, J. Murray, London.
Deamer, D. W.: 1986, Origins Life Evol. Biosphere 17, 3–25.Deamer, D. W.: 1997, Microbiol. Mol. Biol. Rev. 61, 239–261.Deamer, D., Dworkin, J. P., Sandford, S. A., Bernstein, M. P. and Allamandola, L. J.: 2002,
Astrobiology 2, 371–381.Decout, J.-L., Vergne, J. and Maurel, M.-C.: 1995, Macromol. Chem. Phys. 196, 2615–
2624.Delaye L., Becerra A. and Lazcano A.: 2004, in L. Ribas de Pouplana (ed.), The Genetic Code
and the Origin of Life. Landes Bioscience, Georgetown, pp. 34 –47.Di Giulio, M.: 2000, J. Theor. Biol. 203, 203–213.Di Giulio, M.: 2003, J. Theor. Biol. 224, 277–283.
Di Giulio, M.: 2005, Gene 346, 7–12.Dillon, L. S.: 1973, Bot. Rev. 39, 301–345.Domingo, E. and Holland, J. J.: 1997, Annu. Rev. Microbiol. 51, 151–178.
Doolittle, R. F.: 2000a, Res. Microbiol. 151, 85–89.Doolittle, W. F.: 2000b, Curr. Opin. Struct. Biol. 10, 355–358.Dunnill, P.: 1966, Nature 210, 1267–1268.
Dworkin, J. P., Lazcano, A. and Miller, S. L.: 2003, J. Theor. Biol. 222, 127–134.Egholm, M., Buchardt, O., Christensen, L., Behrens, C., Freier, S. M., Driver, D. A., Berg,
R. H., Kim, S. K., Norden, B. and Nielsen, P. E.: 1993, Nature 365, 566–568.Eigen, M.: 1971, Naturwissenschaften 58, 465–523.
Eigen, M.: 2002, Proc. Natl. Acad. Sci. U.S.A. 99, 13374–13376.Eigen, M. and Schuster, P.: 1978, Naturwissenschaften 65, 341–369.El Amri, C., Baron, M.-H. and Maurel, M.-C.: 2003, Spectrochim. Acta Part A 59, 2645–2654.
El Amri, C., Baron, M.-H. and Maurel, M.-C.: 2004, J. Raman Spectrosc. 35, 170–177.El Amri, C., Maurel, M.-C., Sagon, G. and Baron, M.-H.: 2005, Spectrochim. Acta Part A 61,
2049–2056.
Ellington, A. D., Khrapov, M. and Shaw, C. A.: 2000, RNA 6, 485–498.Eschenmoser, A.: 1999, Science 284, 2118–2124.Ferris, J. P.: 1987, Cold Spring Harbor Symp. Quant. Biol. LII, 29–39.Ferris, J. P. and Ertem, G.: 1992, Science 257, 1387–1389.
Ferris, J. P., Hill, A. R., Liu, R. and Orgel, L. E.: 1996, Nature 381, 59–61.Fersht, A. R.: 1999, Structure ans Mechanism in Protein Science: A Guide to Enzyme Catalysis
and Protein Folding, Freeman, New York.
Fitch, W. M. and Upper, K.: 1987, Cold Spring Harbor Symp. Quant. Biol. 52, 759–767.Forterre, P.: 1999, Mol. Microbiol. 33, 457–465.
198 ROBERT PASCAL ET AL.

Forterre, P.: 2002, Curr. Opin. Microbiol. 5, 525–532.Forterre, P.: 2005, Biochimie 87, 793–803.
Forterre P.: 2006, Virus Res., 5–16.Forterre, P. and Philippe, H.: 1999, Biol. Bull. 196, 373–375.Forterre, P., Brochier, C. and Philippe, H.: 2002, Theor. Popul. Biol. 61, 409–422.
Fox G. E. and Naik A. K. 2004, in Ll. Ribas de Pouplana (ed.), The Genetic Code and theOrigin of Life, Landes Bioscience, Georgetown, pp. 92–106.
Freeland, S. J., Knight, R. D. and Landweber, L. F.: 1999, Science 286, 690–692.Freeland, S. J., Wu, T. and Keulman, N.: 2003, Origins Life Evol. Biosphere 33, 457–477.
Fuller, W. D., Sanchez, R. A. and Orgel, L. E.: 1972, J. Mol. Biol. 67, 25–33.Galtier, N., Tourasse, N. and Gouy, M.: 1999, Science 283, 220–221.Gesteland, R. F., Cech, T. R. and Atkins, J. F., (eds.): 1999, The RNA World (2nd ed.), Cold
Spring Harbor Laboratory Press, Cold Spring Harbor NY.Gilbert, W.: 1986, Nature 319, 618.Giraldo, R.: 2003, FEMS Microbiol. Rev. 26, 533–554.
Gogarten, J. P., Kibak, H., Dittrich, P., Taiz, L., Bowman, E. J., Bowman, B. J., Manolson,M. F., Poole, R. J., Date, T., Oshima, T., Konishi, J., Denda, K. and Yoshida, M.: 1989,Proc. Nat. Acad. Sci. U.S.A. 86, 6661–6665.
Gogarten-Boekels, M., Hilario, E. and Gogarten, J. P.: 1995, Origins Life Evol. Biosphere 25,251–264.
Gribaldo, S. and Cammarano, P.: 1998, J. Mol. Evol. 47, 508–516.Hanczyc, M. M. and Szostak, J. W.: 2004, Curr. Opin. Chem. Biol. 8, 660–664.
Hanczyc, M. M., Fujikawa, S. M. and Szostak, J. W.: 2003, Science 302, 618–622.Haring, M., Vestergaard, G., Rachel, R., Chen, L., Garrett, R. A. and Prangishvili, D.: 2005,
Nature 436, 1101–1102.
Harold, F. M.: 2001, The Way of the Cell. Molecules, Organisms and the Order of Life, OxfordUniversity Press, Oxford.
Healy, V. L., Mullins, L. S., Li, X., Hall, S. E., Raushel, F. M. and Walsh, C. T.: 2000, Chem.
Biol. 7, 505–514.Hill, A. R., Orgel, L. E. and Wu, T.: 1993, Orig. Life Evol. Biosphere 23, 285–290.Hoang, L., Fredrick, K. and Noller, H. F.: 2004, Proc. Natl. Acad. Sci. U.S.A. 101, 12439–
12443.Holm, N. G. and Andersson, E. M.: 1998, in A. Brack (ed.), The Molecular Origins of Life
Assembling pieces of the Puzzle, Cambridge University Press, Cambridge, pp. 86–99.Huber, C., Eisenreich, W., Hecht, S. and Wachtershauser, G.: 2003, Science 301, 938–940.
Inoue, T. and Orgel, L. E.: 1983, Science 219, 859–862.Joyce, G. F.: 1989, Nature 338, 217–224.Joyce, G. F.: 2002, Nature 418, 214–221.
Joyce, G. F. and Orgel, L. E.: 1986, J. Mol. Biol. 188, 433–441.Joyce, G. F. and Orgel, L. E.: 1999, in R. F. Gesteland, T. R. Cech and J. F. Atkins (eds.),
The RNA World, Cold Spring Harbor Laboratory Press, Cold Spring Harbor NY, pp. 49–
77.Joyce, G. F., Schwartz, A. W., Miller, S. L. and Orgel, L. E.: 1987, Proc. Natl. Acad. Sci.
U.S.A. 84, 4398–4402.Jukes, T. H.: 1973, Biochem. Biophys. Res. Commun. 53, 709–714.
Kandler O.: 1994, in: S. Bengston (ed.), Early Life on Earth, Columbia University Press, pp.152–160.
Kasting, J. F.: 1993, Science 259, 920–926.
Knight, R. D., Freeland, S. J. and Landweber, L. F.: 1999, Trends Biochem. Sci. 24, 241–247.Koga, Y., Kyuragi, T., Nishihara, M. and Sone, N.: 1998, J. Mol. Evol. 46, 54–63.
199PREBIOTIC CHEMISTRY

Koonin, E. V.: 2003, Nat. Rev. Microbiol. 1, 127–136.Koonin, E. V. and Martin, W.: 2005, Trends Genet. 21, 647–654.
Koppitz, M., Nielsen, P. E. and Orgel, L. E.: 1998, J. Am. Chem. Soc. 120, 4563–4569.Kornberg, A.: 2000, J. Bacteriol. 182, 3613–3618.Kuhn, H. and Kuhn, C.: 2003, Angew. Chem. Int. Ed. 42, 262–268.
Kuhne, H. and Joyce, G. F.: 2003, J. Mol. Evol. 57, 292–298.Kumar, R. K. and Yarus, M.: 2001, Biochemistry 40, 6998–7004.Lahav, N., White, D. and Chang, S.: 1978, Science 201, 67–69.Lazcano A. 2001, in D. E. G. Briggs and P. R. Crowther (eds.), Paleobiology II, Blackwell
Science Oxford, ch. 1.Lazcano, A. and Miller, S. L.: 1996, Cell 85, 793–798.Lazcano, A., Guerrero, R., Margulis, L. and Oro, J.: 1988, J. Mol. Evol. 27, 283–290.
Lazcano, A., Fox, G. E. and Oro, J.: 1992, in R. P. Mortlock (ed.), The Evolution of MetabolicFunction, CRC Press, Boca Raton FL, pp. 237–295.
Leipe, D. D., Aravind, L. and Koonin, E. V.: 1999, Nucleic Acids Res. 27, 3389–3401.
Leman, L., Orgel, L. and Ghadiri, M. R.: 2004, Science 305, 283–286.Lopez-Garcıa, P.: 1999, J. Mol. Evol 49, 439–452.Luisi, P. L.: 1998, Origins Life Evol. Biosphere 28, 613–622.
Luisi, P. L., Walde, P. and Oberholzer, T.: 1994, Ber. Bunsenges. Phys. Chem. 98, 1160–1165.Luisi, P. L., Walde, P. and Oberholzer, T.: 1999, Curr. Opin. Colloid Interface Sci. 4, 33–39.Madigan, M. T., Martinko, J. M. and Parker, J.: 2003, Brock Biology of Microorganisms,
Prentice Hall Upper Saddle River, NJ, USA.
Marahiel, M. A., Stachelhaus, T. and Mootz, H. D.: 1997, Chem. Rev. 97, 2651–2673.Martin, W. and Russell, M. J.: 2003, Philos. Trans. R. Soc. Lond., B Biol. Sci. 358, 59–83.Maurel, M.-C.: 1992, J. Evol. Biol. 2, 173–188.
Maurel, M.-C. and Decout, J.-L.: 1999, Tetrahedron 55, 3141–3182.Maurel, M.-C. and Ninio, J.: 1987, Biochimie 69, 551–553.Maurel, M. C. and Orgel, L.: 2000, Origins Life Evol. Biosphere 30, 423–430.
Maurel, M.-C. and Zaccaı, G.: 2001, BioEssays 23, 977–978.Maynard Smith, J. and Szathmary, E.: 1995, The Major Transitions in Evolution, Freeman,
New York.
McGinness, K. E., Wright, M. C. and Joyce, G. F.: 2002, Chem. Biol. 9, 585–596.Meli, M., Vergne, J., Decout, J.-L. and Maurel, M.-C.: 2002, J. Biol. Chem. 277, 2104–2111.Meli, M., Vergne, J. and Maurel, M.-C.: 2003, J. Biol. Chem. 278, 9835–9842.Miller, S. L.: 1953, Science 117, 528–529.
Miller, S. L.: 1998, in A. Brack (ed.), The Molecular Origins of Life. Assembling pieces of thePuzzle, Cambridge University Press, Cambridge, pp. 59–85.
Monnard, P. A. and Deamer, D. W.: 2002, Anat. Rec. 268, 196–207.
Moreira, D.: 2000, Mol. Microbiol. 35, 1–5.Morowitz, H. J., Heinz, B. and Deamer, D. W.: 1988, Origins Life Evol. Biosphere 18, 281–
287.
Morowitz, H. J., Deamer, D. W. and Smith, T.: 1991, J. Mol. Evol. 33, 207–208.Mullie, F. and Reisse, J.: 1987, Top. Curr. Chem. 139, 83–117.Nealson, K. H.: 2005, Proc. Natl. Acad. Sci. U.S.A. 102, 3889–3890.Nelson, K. E., Levy, M. and Miller, S. L.: 2000, Proc. Natl. Acad. Sci. U.S.A. 97, 3868–3871.
Neunlist, S., Bisseret, P. and Rohmer, M.: 1987, Eur. J. Biochem. 87, 245–252.Nicolis, G. and Prigogine, I.: 1977, Self-Organization in Nonequilibrium Systems, Wiley,
New York.
Nielsen, P. E.: 1999, Acc. Chem. Res. 32, 624–630.Nissen, P., Hansen, J., Ban, N., Moore, P. B. and Steitz, T. A.: 2000, Science 289, 920–930.
200 ROBERT PASCAL ET AL.

Noller, H. F.: 2004, RNA 10, 1833–1837.Olsen, G. J. and Woese, C. R.: 1997, Cell 89, 991–994.
Oparin, A. I.: 1938, The Origin of Life, Mac Millan, New York.Oparin, A. I., Orlovskii, A. F., Bukhlaeva, V. and Gladilin, K. L.: 1976, Dokl. Akad. Nauk
SSSR 226, 972–974.
Orgel, L. E.: 1989, in M. Grunberg-Manago et al. (eds.), Evolutionary Tinkering in GeneExpression, Plenum Press, London, pp. 215–224.
Orgel, L. E.: 1992, Nature 358, 203–209.Orgel, L. E.: 2004, Crit. Rev. Biochem. Mol. Biol. 39, 99–123.
Oro, J.: 1960, Biochem. Biophys. Res. Commun. 2, 407–412.Oro, J. and Stephen-Sherwood, E.: 1974, in J. Oro, S. L. Miller, C. Ponnamperuma and
R. S. Young (eds.), Cosmochemical Evolution and the Origins of Life, Reidel, Dordrecht,
pp. 159–172.Ourisson, G. and Nakatani, Y.: 1994, Chem. Biol. 1, 11–23.Pace, N. R.: 1991, Cell 65, 531–533.
Pace, N. R.: 2001, Proc. Natl. Acad. Sci. U.S.A. 98, 805–808.Paecht-Horowitz, M., Berger, J. and Katchalsky, A.: 1970, Nature 7, 847–850.Pascal, R., Boiteau, L. and Commeyras, A.: 2005, Top. Curr. Chem. 259, 69–122.
Patel, A.: 2005, J. Theor. Biol. 233, 527–532.Pelc, S. R.: 1965, Nature 207, 597–599.Pereto, J.: 2005, Int. Microbiol. 8, 23–31.Pereto, J. G., Velasco, A. M., Becerra, A. and Lazcano, A.: 1999, Int. Microbiol. 2, 3–10.
Pereto, J., Lopez-Garcia, P. and Moreira, D.: 2004, Trends Biochem. Sci. 29, 469–477.Philippe, H. and Forterre, P.: 1999, J. Mol. Evol. 49, 509–523.Pizzarello, S. and Weber, A. L.: 2004, Science 303, 1151–1151.
Plankensteiner, K., Reiner, H. and Rode, B. M.: 2005, Curr. Org. Chem. 9, 1107–1114.Poole, A., Jeffares, D. and Penny, D.: 1999, Bioessays 21, 880–889.Prieur, D.: 2005, in T. Tokano (ed.), Water on Mars and Life, Springer, Berlin, pp. 299–324.
Raoult, D., Audic, S., Robert, C., Abergel, C., Renesto, P., Ogata, H., La Scola, B., Suzan, M.and Claverie, J. M.: 2004, Science 306, 1344–1350.
Reader, J. S. and Joyce, G. F.: 2002, Nature 420, 841–844.
Reusch, R. N.: 2000, Biochemistry (Moscow) 65, 280–295.Ribas de Pouplana, Ll. and Schimmel, P.: 2001, Trends Biochem. Sci. 26, 591–596.Ricard, J., Vergne, J., Decout, J.-L. and Maurel, M.-C.: 1996, J. Mol. Evol. 43, 315–325.Ricardo, A., Carrigan, M. A., Olcott, A. N. and Benner, S. A.: 2004, Science 303, 196.
Rode, B. M., Son, H. L., Suwannachot, Y. and Bujdak, J.: 1999, Origins Life Evol. Biosphere29, 273–286.
Rohlfing, D. L.: 1976, Science 193, 68–70.
Russell, M. and Hall, A. J.: 1997, J. Geol. Soc. Lond. 154, 377–402.Russell, M. J. and Martin, W.: 2004, Trends Biochem. Sci. 29, 358–363.Sacerdote, M. G. and Szostak, J. W.: 2005, Proc. Natl. Acad. Sci. U.S.A. 102, 6004–6008.
Santos M. A. S. and Tuite M. F. 2004, in Ll. Ribas de Pouplana (ed.), The Genetic Code andthe Origin of Life, Landes Bioscience, Georgetown, pp. 183–200.
Schimmel, P., Giege, R., Moras, D. and Yokoyama, S.: 1993, Proc. Natl. Acad Sci. U. S. A.90, 8763–8768.
Schmidt, J. G., Nielsen, P. E. and Orgel, L. E.: 1997, Nucleic Acids Res. 25, 4797–4802.Schoning, K.-U., Scholz, P., Guntha, S., Wu, X., Krishnamurthy, R. and Eschenmoser, A.:
2000, Science 290, 1347–1351.
Schopf, J. W.: 1993, Science 260, 640–646.Schulze-Makuch, D. and Irwin, L. N: 2002, Astrobiology 2, 105–121.
201PREBIOTIC CHEMISTRY

Schwartzman, D. W. and Lineweaver, C. H.: 2004, Biochem. Soc. Trans. 32, 168–171.Segre, D., Ben-Eli, D., Deamer, D. W. and Lancet, D.: 2001, Origins Life Evol. Biosphere 31,
119–145.Sievers, A., Beringer, M., Rodnina, M. V. and Wolfenden, R.: 2004, Proc. Natl. Acad. Sci.
U.S.A. 101, 7897–7901.
Sonneborn T. M. 1965, in V. Bryson and H. J. Vogel (eds.), Evolving Genes and Proteins,Academic Press, New York, pp. 379–397.
Spear, J. R., Walker, J. J., McCollom, T. M. and Pace, N. R.: 2005, Proc. Natl. Acad. Sci.U.S.A. 102, 2555–2560.
Steitz, T. A.: 1999, J. Biol. Chem. 274, 17395–17398.Stetter, K. O.: 1996, FEMS Microbiol. Rev. 18, 149–158.Stoks, P. G. and Schwartz, A. W.: 1982, Geochim. Cosmochim. Acta 46, 309–315.
Sutherland, J. D. and Blackburn, J. M.: 1997, Chem. Biol. 4, 481–488.Sutherland, J. D. and Whitfield, J. N.: 1997, Tetrahedron 53, 11493–11527.Szathmary, E.: 1999, Trends Genet. 15, 223–229.
Szathmary, E. and Maynard Smith, J.: 1997, J. Theor. Biol. 187, 555–571.Szostak, J. W., Bartel, D. P. and Luisi, P. L.: 2001, Nature 409, 387–390.Taillades, J., Collet, H., Garrel, L., Beuzelin, I., Boiteau, L., Choukroun, H. and Commeyras,
A.: 1999, J. Mol. Evol. 48, 638–645.Tehei, M., Franzetti, B., Maurel, M.-C., Vergne, J., Hountondji, C. and Zaccaı, G.: 2002,
Extremophiles 6, 427–430.Tian, F., Toon, O. B., Pavlov, A. A. and De Sterck, H.: 2005, Science 308, 1014–1017.
Tobe, S., Heams, T., Vergne, J., Herve, G. and Maurel, M.-C.: 2005, Nucleic Acids Res. 33,2557–2564.
Varela, F. G., Maturana, H. R. and Uribe, R.: 1974, Biosystems 5, 187–196.
Vergne J. and Maurel M.-C. 2002, Origins Life Evol. Biosphere (abstract) 32(5–6), 538.Vergne J., Cognet J. A. H., Szathmary E., and Maurel M.-C. 2006, Gene, 371, 182–193.Villarreal L. P. 2005, in L. P. Villarreal (ed.), Viruses and the Evolution of Life, ASM Press,
Washington.Wachtershauser, G.: 1988a, Proc. Natl. Acad. Sci. U.S.A. 85, 1134–1135.Wachtershauser, G.: 1988b, Microbiol. Rev. 52, 452–484.
Wachtershauser, G.: 1990, Proc. Natl. Acad. Sci. U.S.A. 87, 200–204.Wachtershauser, G.: 2003, Mol. Microbiol. 47, 13–22.Weber, A. L.: 2001, Origins Life Evol. Biosphere 31, 71–86.Weber, A. L.: 2002, Origins Life Evol. Biosphere 32, 333–357.
Weiner, A. M. and Maizels, N.: 1987, Proc. Natl. Acad. Sci. U.S.A. 84, 7383–7387.Westall, F., De Wit, M. J., Dann, J., Van der Gaast, S., De Ronde, C. and Gerneke, D.: 2001,
Precambrian Res. 106, 93–116.
White, H. B.: 1976, J. Mol. Evol. 7, 101–104.White H. B.: 1982, in J. Everse, B. Anderson and K. You (eds.), The Pyridine Nucleotide
Coenzymes, Academic Press, New York, pp. 1–17.
Wimberly, B. T., Brodersen, D. E., Clemons, W. M. Jr, Morgan-Warren, R. J., Carter, A. P.,Vonrhein, C., Hartsch, T. and Ramakrishnan, V.: 2000, Nature 407, 327–339.
Woese, C. R.: 1965, Proc. Natl. Acad. Sci. U.S.A. 54, 1546–1552.Woese, C.: 1998, Proc. Natl. Acad. Sci. U.S.A. 95, 6854–6859.
Woese, C. R.: 2000, Proc. Natl. Acad. Sci. U.S.A. 97, 8392–8396.Woese, C. R. and Fox, G. E.: 1977a, J. Mol. Evol. 10, 1–6.Woese, C. R. and Fox, G. E.: 1977b, Proc. Natl. Acad. Sci. U.S.A. 74, 5088–5090.
Woese, C. R., Kandler, O. and Wheelis, M. L.: 1990, Proc. Natl. Acad. Sci. U.S.A. 87, 4576–4579.
202 ROBERT PASCAL ET AL.

Wong, J. T.: 1975, Proc. Natl. Acad. Sci. U.S.A. 72, 1909–1912.Wong, J. T.: 2005, BioEssays 27, 416–425.
Wu, H. L., Bagby, S. and van Elsen, D.: 2005, J. Mol. Evol. 61, 54–64.Yarus, M.: 1998, J. Mol. Evol. 47, 109–117.Yarus, M., Caporaso, J. G. and Knight, R.: 2005, Annu. Rev. Biochem. 74, 179–198.
Yusupov, M., Yusupova, G., Baucom, A., Lieberman, K., Earnest, T. N., Cate, J. H. andNoller, H. F.: 2001, Science 292, 883–896.
Zhang, B. and Cech, T. R.: 1997, Nature 390, 96–100.
203PREBIOTIC CHEMISTRY

6. Environmental Context
HERVE MARTINLaboratoire Magmas et Volcans, Universite Blaise Pascal, Clermont-Ferrand, France
(E-mail: [email protected])
PHILIPPE CLAEYSDGLG-WE, Vrije Universiteit Brussel, Brussels, Belgium
(E-mail: [email protected])
MURIEL GARGAUDObservatoire Aquitain des Sciences de l’Univers, Universite Bordeaux1, Bordeaux, France
(E-mail: [email protected])
DANIELE L. PINTIGEOTOP-UQAM-McGill, Universite du Quebec a Montreal, Quebec, Canada
(E-mail: [email protected])
FRANCK SELSISCentre de Recherche Astronomique de Lyon and Ecole Normale Superieure de Lyon, Lyon,
France
(E-mail: [email protected])
(Received 1 February 2006; Accepted 4 April 2006)
Abstract. On Earth, the Archaean aeon lasted from 4.0 to 2.5 Ga; it corresponds to a relatively stable
period. Compared with today, internal Earth heat production was several times greater resulting in high
geothermal flux that induced the genesis of rocks such as komatiites and TTG suites, which are no more
generated on Earth since 2.5 Ga. Similarly, the details of plate tectonic modalities (plate size, plate motion
rate, plate thickness, tectonic style, irregular crustal growth, etc...) were different of modern plate tectonics.
Both atmosphere and ocean compositions have been progressively modified and the greater heat production
favoured the development of hydrothermalism and therefore created niches potentially favourable for the
development of some forms of life. Catastrophic events such as giant meteorite falls or world-sized glaci-
ations drastically and suddenly changed the environment of Earth surface, thus being able to strongly affect
development of life. Even if specialists still debate about the age of the oldest indubitable fossil trace of life,
Archaean can be considered as having been extremely favourable for life development and diversification.
Keywords: Archaean, continental growth, atmosphere and ocean evolution, meteoritic impacts, glacia-
tions, young sun
After the Late Heavy Bombardment (see chapter 4.5), the Earth entered in arelative stability period that lasted until now. This does not mean that at4.4 Ga, the Earth was similar to modern Earth, on the contrary, it was archaicand the internal as well as external processes were significantly different ofthose active on our modern Earth. For instance, if plate tectonics existed, the
Earth, Moon, and Planets (2006) 98: 205�245 � Springer 2006
DOI 10.1007/s11038-006-9090-x

detail of its modality (plate size, plate motion rate, plate thickness, irregularcrustal growth, etc...) changed until today. Both atmosphere and oceancompositions have been progressively modified. All these changes, even if slowand progressive certainly had significant influence on the development andevolution of life on Earth surface. In addition to these progressive modifica-tions, more punctual and/or catastrophic events took place, such as giantmeteorite falls or world-sized glaciations. These events drastically and sud-denly changed the environment of Earth surface, and even if they lasted ashort period of time (at geological time scale), they also strongly affecteddevelopment of life. The target of this chapter is to identify and describe thesechanges and to try to replace them in their temporal frame.
6.1. Evolution of Geological Mechanisms: The 2.5 Ga Transition
HERVE MARTIN
6.1.1. EPISODIC CRUSTAL GROWTH
Since more than 15 years, it has been clearly established that, if continentalcrust growth has been continuous, it was also a highly irregular process(Condie, 1989; McCulloch and Bennet, 1993; Condie, 1998). Figure 6.1 isbased on two complementary approaches: estimate of crustal growth rates(McCulloch and Bennet, 1993) and compilation of crustal zircon ages(Condie, 1989; Condie, 1998). It shows that throughout the whole Earthhistory, crustal growth proceeded by super-events (i.e. 3.8, 2.7, 1.8, 1.1 and
Figure 6.1. Histograms showing the estimated rates of crustal growth averaged over 200 Maintervals (after McCulloch and Bennet, 1993, orange pattern) and the distribution frequency
(100 Ma intervals) of U-Pb zircon ages (after Condie, 1989 and Condie, 1998, red pattern).This diagram clearly shows that the growth of continental crust has been a continuous butirregular process.
206 HERVE MARTIN ET AL.
0.5 Ga). Typically each event lasted 250 to 350 Ma and is separated from theothers by about 700�900 Ma.
Several authors consider that mantle plume activity could be responsiblefor the periodicity of Earth crust production (Stein and Hofmann, 1994;Albarede, 1998; Albarede, 2005). Albarede (1998) proposed that plumeactivity resulted in the emplacement of large oceanic plateaus, similar to theMesozoic Ontong-Java plateau, where thick piles of plume basalts erupted onthe oceanic floor. Indeed, when entering in subduction, these plateaus areable to undergo partial melting and to generate continental crust. For in-stance, today in Ecuador, the Carnegie ridge, which is generated by theGalapagos hot spot activity, is subducted under the South American platesince 5 Ma. There, the volcanic activity is more important than in other partsof Andes, the arc is larger and adakites are generated (Gutscher et al., 2000;Samaniego et al., 2002; Bourdon et al., 2003; Samaniego et al., 2005). Thismodern analogue testifies that increase of magmatic activity can result ofbasaltic plateau subduction.
Based on the Stein and Hofmann work (1994), Condie (1998) proposed analternative model, which considers that in a subduction zone, the descendingresidual oceanic crust, transformed into eclogite, accumulates at the 660-kmseismic discontinuity. When the amount of accumulated oceanic crustexceeds a threshold, it breaks the discontinuity and suddenly sinks into themantle as a cold avalanche. These cold eclogites reach the mantle-coreboundary (D’’ layer) and take the place of the autochthonous warm mantleperidotite resulting in the uprising of a hot mantle plume. This catastrophicevent can be considered as being a mantle and thermal overturn. As proposedby Albarede (1998) these uprising hot plumes can generate oceanic plateaus.Condie (1998) proposed that ascent of hot mantle mostly contributes to heatthe upper mantle, which increases the rate of oceanic crust genesis, resultingin smaller and faster plates that enter more rapidly in subduction. Fastersubduction of younger oceanic crust also results in increasing the rate ofproduction continental crust (Martin and Moyen, 2002; Martin et al., 2005).
The downward motion of cold avalanches drags the overlying mantle, thuscausing the development of ‘‘super subduction zones’’ above, which attractplates fromgreat distances (Peltier et al., 1997;Condie, 1998). The convergenceof the plates results in the growthof super continent. In fact, the development ofsuper continents in these periods is due to two concomitant mechanisms: thecollage and/or collision of pre-existing continental plates and the genesis of newjuvenile continental crust due to subduction-related magmatic activity. Someof these supercontinents received names: Rodinia (1.1 Ga); Gondwana(0.5 Ga). Vaalbara has also been proposed for late Archaean (see: Condie,1998; Zegers et al., 1998; Bourrouilh, 2001, for more details).
Moyen (1997) also evidenced the cyclic continent growth and evolution,which he divided into 4 stages. The first stage consists in arc complexes,
207ENVIRONMENTAL CONTEXT
where continental crust is generated by melting of subducted slab (TTG andadakites) or of overlying mantle wedge (classic calc-alkaline magmas).During a second episode, arcs accrete due to collision or collage; this can becorrelated to the cold avalanche as described by Condie (1998). The thirdstage consists in the reworking of the newly accreted crust. Indeed, genesis ofjuvenile continental crust also results in transferring and concentratingstrongly incompatible elements such as U, Th and K from the mantle into thecrust. These elements have radiogenic isotopes (235U, 238U, 232Th, 40K),whose decay contributes to heat the crust and thus, can help in its meltingand recycling. The last episode is a quiescence period (may be partly due tothe temporal impoverishment of the upper mantle in radioactive elements);which can evolve towards a new cycle or towards cratonization and devel-opment of thick and cold lithospheric keel.
Existence of supercontinents has major influence not only in magmatic ordeep geology, but also on climate and life. For instance, on a supercontinentfauna and flora will tend to homogenize and to follow a parallel evolution.After breakdown of such a continent, living being will evolve independentlyon their continental fragment.
6.1.2. GLOBAL EVOLUTION AND CHANGES (~2.5 GA AGO)
Taking into account the episodic and cyclic crustal growth could lead to theconclusion that the parameters of this cyclicity remained constant since theearly Archaean. However, a rapid overlook of crustal composition throughtime points tomajor disparity betweenEarlyArchaean and Phanerozoic times.One of the more obvious differences consists in the temporal change in thenature and abundance of rocks. Some rocks are widespread in Archaean ter-rains whereas they are rare or inexistent after 2.5 Ga. This is the case forkomatiites, TTG (Tonalite, Trondhjemite and Granodiorite) associations andBanded Iron Formations (BIF). Others, such as andesites, per-alkaline mag-matic rocks and eclogites are abundant after 2.5 Ga and rare or unknown inArchaean terrains. In addition, others as high-Mg granodiorites (sanukitoids)are mainly known at the Archaean-Proterozoic boundary. Consequently, insuperposition with cyclic crustal growth it exists an other secular evolution.
6.1.2.1. Change in magma petrogenesisTypically, the main secular change in our planet history since its accretion isits progressive cooling. The more obvious evidence of this cooling is providedby komatiites (Figure 6.2). Komatiites are ultramafic lavas, which only existin Archaean terrains. They were produced by high degrees of mantle melting(P50%) and they emplaced at temperatures ranging from 1525 to 1650 �C(Nisbet et al., 1993; Svetov et al., 2001) (today basalts are produced by 25 to35% mantle melting at temperatures of about 1250�1350 �C). They
208 HERVE MARTIN ET AL.
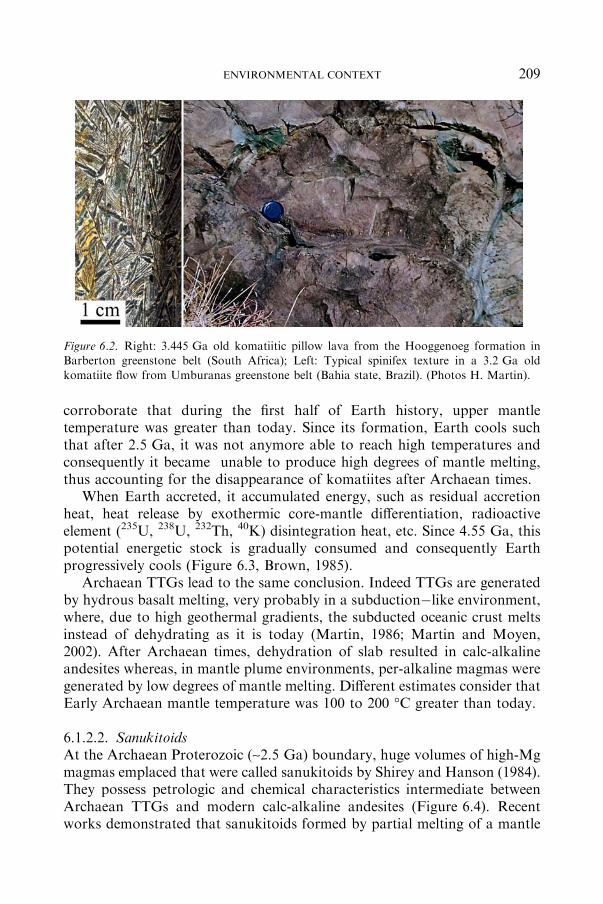
corroborate that during the first half of Earth history, upper mantletemperature was greater than today. Since its formation, Earth cools suchthat after 2.5 Ga, it was not anymore able to reach high temperatures andconsequently it became unable to produce high degrees of mantle melting,thus accounting for the disappearance of komatiites after Archaean times.
When Earth accreted, it accumulated energy, such as residual accretionheat, heat release by exothermic core-mantle differentiation, radioactiveelement (235U, 238U, 232Th, 40K) disintegration heat, etc. Since 4.55 Ga, thispotential energetic stock is gradually consumed and consequently Earthprogressively cools (Figure 6.3, Brown, 1985).
Archaean TTGs lead to the same conclusion. Indeed TTGs are generatedby hydrous basalt melting, very probably in a subduction�like environment,where, due to high geothermal gradients, the subducted oceanic crust meltsinstead of dehydrating as it is today (Martin, 1986; Martin and Moyen,2002). After Archaean times, dehydration of slab resulted in calc-alkalineandesites whereas, in mantle plume environments, per-alkaline magmas weregenerated by low degrees of mantle melting. Different estimates consider thatEarly Archaean mantle temperature was 100 to 200 �C greater than today.
6.1.2.2. SanukitoidsAt the Archaean Proterozoic (~2.5 Ga) boundary, huge volumes of high-Mgmagmas emplaced that were called sanukitoids by Shirey and Hanson (1984).They possess petrologic and chemical characteristics intermediate betweenArchaean TTGs and modern calc-alkaline andesites (Figure 6.4). Recentworks demonstrated that sanukitoids formed by partial melting of a mantle
Figure 6.2. Right: 3.445 Ga old komatiitic pillow lava from the Hooggenoeg formation inBarberton greenstone belt (South Africa); Left: Typical spinifex texture in a 3.2 Ga old
komatiite flow from Umburanas greenstone belt (Bahia state, Brazil). (Photos H. Martin).
209ENVIRONMENTAL CONTEXT

peridotite which composition has been modified by addition (metasomatism)of TTG magma (Smithies, 2000; Moyen et al., 2003; Rapp et al., 2003;Martin et al., 2005). In a subduction zone, the slab melts (TTG magma) havea low density and ascent through the overlying mantle wedge where theyreact with mantle peridotite. Rapp et al. (1999) established the concept of‘‘effective melt/rock ratio’’: when this ratio is high, not all slab-melt is con-sumed during peridotite metasomatism and so, part of slab melt (TTG)reaches the continental crust. When the melt/rock ratio is low, all the slab
Figure 6.3. Temporal change of Earth heat production (after Brown, 1985).
Figure 6.4. 2.7 Ga old sanukitoids from Eastern Finland. Left: dyke of sanukitoid intrusiveinto the basic volcanics of the Kuhmo�Suomussalmi greenstone belt. Right: detail picture ofsanukitoid, attesting of the abundance of feldspar megacrysts (white) in a matrix mainly made
up of dark minerals (biotite and hornblende). (Photos H. Martin).
210 HERVE MARTIN ET AL.
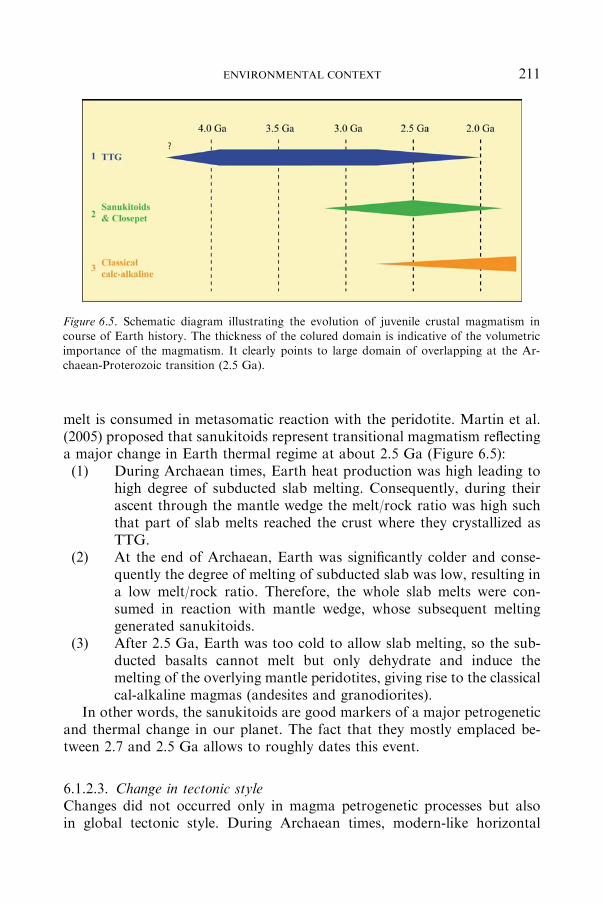
melt is consumed in metasomatic reaction with the peridotite. Martin et al.(2005) proposed that sanukitoids represent transitional magmatism reflectinga major change in Earth thermal regime at about 2.5 Ga (Figure 6.5):(1) During Archaean times, Earth heat production was high leading to
high degree of subducted slab melting. Consequently, during theirascent through the mantle wedge the melt/rock ratio was high suchthat part of slab melts reached the crust where they crystallized asTTG.
(2) At the end of Archaean, Earth was significantly colder and conse-quently the degree of melting of subducted slab was low, resulting ina low melt/rock ratio. Therefore, the whole slab melts were con-sumed in reaction with mantle wedge, whose subsequent meltinggenerated sanukitoids.
(3) After 2.5 Ga, Earth was too cold to allow slab melting, so the sub-ducted basalts cannot melt but only dehydrate and induce themelting of the overlying mantle peridotites, giving rise to the classicalcal-alkaline magmas (andesites and granodiorites).
In other words, the sanukitoids are good markers of a major petrogeneticand thermal change in our planet. The fact that they mostly emplaced be-tween 2.7 and 2.5 Ga allows to roughly dates this event.
6.1.2.3. Change in tectonic styleChanges did not occurred only in magma petrogenetic processes but alsoin global tectonic style. During Archaean times, modern-like horizontal
Figure 6.5. Schematic diagram illustrating the evolution of juvenile crustal magmatism in
course of Earth history. The thickness of the colured domain is indicative of the volumetricimportance of the magmatism. It clearly points to large domain of overlapping at the Ar-chaean-Proterozoic transition (2.5 Ga).
211ENVIRONMENTAL CONTEXT
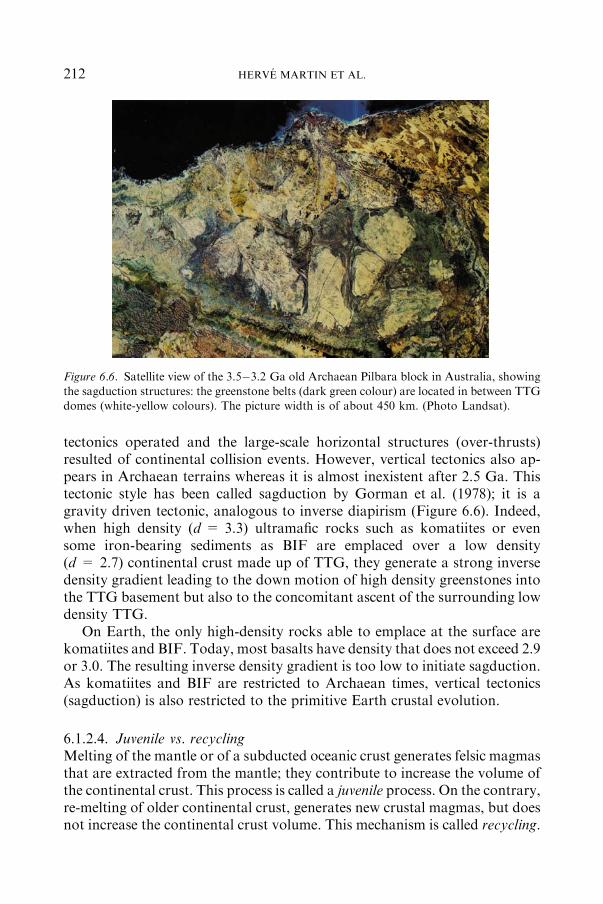
tectonics operated and the large-scale horizontal structures (over-thrusts)resulted of continental collision events. However, vertical tectonics also ap-pears in Archaean terrains whereas it is almost inexistent after 2.5 Ga. Thistectonic style has been called sagduction by Gorman et al. (1978); it is agravity driven tectonic, analogous to inverse diapirism (Figure 6.6). Indeed,when high density (d = 3.3) ultramafic rocks such as komatiites or evensome iron-bearing sediments as BIF are emplaced over a low density(d = 2.7) continental crust made up of TTG, they generate a strong inversedensity gradient leading to the down motion of high density greenstones intothe TTG basement but also to the concomitant ascent of the surrounding lowdensity TTG.
On Earth, the only high-density rocks able to emplace at the surface arekomatiites and BIF. Today, most basalts have density that does not exceed 2.9or 3.0. The resulting inverse density gradient is too low to initiate sagduction.As komatiites and BIF are restricted to Archaean times, vertical tectonics(sagduction) is also restricted to the primitive Earth crustal evolution.
6.1.2.4. Juvenile vs. recyclingMelting of the mantle or of a subducted oceanic crust generates felsic magmasthat are extracted from the mantle; they contribute to increase the volume ofthe continental crust. This process is called a juvenile process. On the contrary,re-melting of older continental crust, generates new crustal magmas, but doesnot increase the continental crust volume. This mechanism is called recycling.
Figure 6.6. Satellite view of the 3.5�3.2 Ga old Archaean Pilbara block in Australia, showing
the sagduction structures: the greenstone belts (dark green colour) are located in between TTGdomes (white-yellow colours). The picture width is of about 450 km. (Photo Landsat).
212 HERVE MARTIN ET AL.
However, before to be able to recycle continental crust, it is necessary to createit. This is why, during Archaean times, juvenile processes were prominent andrecycling was a subordinated process. Contrarily, after 2.5 Ga, the volume ofcontinental crust was so great that recycling became prominent.
6.1.3. CONCLUSION
It appears that a very important period in Earth history has been the Ar-chaean - Proterozoic boundary at about 2.7�2.5 Ga. It marks the changefrom archaic mechanisms before 2.5 Ga towards modern-like ones after. Asingle and simple cause can account for all the observed changes: the pro-gressive cooling of our planet. However, the recorded change is relativelysudden and brutal whereas Earth cooling is a progressive mechanism. Con-sequently, we must invoke some threshold effect. This effect is well known inthe case of felsic magmas (TTGs vs. calc-alkaline andesite). Indeed, a hy-drous subducted oceanic slab melts at temperatures of about 700 �C; if it isdehydrated, it would only be able to melt for temperature greater than1200 �C. Consequently, the threshold will be the geothermal gradient thatwill allow dehydration to occur for temperatures lower than 700 �C. Before2.5 Ga, high geothermal gradients did not allow dehydration to occur priorto 700 �C, whereas today, lower geothermal gradients result in intense slabdehydration at temperatures lower than 700 �C.
The quick character of the change could have also been accentuated andreinforced by the genesis of a supercontinent at about 2.7 Ga. Figure 6.1shows that this event was probably the more important ever recorder on ourplanet. Such a peak in crustal growth is accompanied by a huge transfer ofheat producing radioactive elements from the mantle to the crust. One of theconsequences is the warming of the crust leading to its intense recycling.However, another consequence is the important impoverishment of the uppermantle in these elements, which made it colder and significantly contributedin decreasing geothermal gradients, which could have accelerated the rapidcharacter of the change.
Of course, these changes did not take place everywhere on Earth exactly atthe same time. Indeed, for instance, today in subduction zones the geother-mal gradient depends not only of the mantle temperature but also of the ageof the subducted crust, the age of subduction, etc... (Martin, 1999). The valueof these two last parameters can be highly variable, such that, for example,the age of oceanic crust when it enters in subduction ranges between 0 and180 Ma. Consequently, locally calc-alkaline andesites were generated before2.5 Ga whereas some TTG are known in Proterozoic terrains. However, itremains that most of the changes occurred after the 2.7 Ga supercontinentgenesis, at about 2.5±0.2 Ga.
213ENVIRONMENTAL CONTEXT
6.2. Atmosphere and Ocean Physico-chemical Evolution
The presence of an atmosphere-hydrosphere early in the history of the Earthhas been essential to life, mainly supporting synthesis of organic molecules,providing suitable ecologic niches (Nisbet and Sleep, 2001; Nisbet andFowler, 2003), and regulating the climate (Sleep and Zahnle, 2001a; Zahnleand Sleep, 2002). Here, we report most recent hypothesis and the few directand indirect evidences for the evolution of the atmosphere and hydrosphereduring the Hadean and the Archaean eons. With the increasing geologicalrecord available after the 2.5 Ga transition, a description of the chemicalevolution of the ocean and the atmosphere during Proterozoic and Phan-erozoic times is a daunting work, well beyond the scope of this paper. A briefand updated account of the entire geological history of seawater and of theatmosphere can be found in (Holland, 2003).
6.2.1. ATMOSPHERE EVOLUTION
FRANCK SELSIS
6.2.1.1. The prebiotic atmosphereBy prebiotic, we refer to the era when life emerged on Earth. In order not toeliminate the possibility of interplanetary or interstellar panspermia, weconsider here that life started to evolve on Earth during the prebiotic era,whether the origin of life origin was endogenous or extraterrestrial. A ‘‘ref-erence’’ composition of the prebiotic atmosphere is given by Kasting (1993).This model describes the atmosphere around 3.8 Ga, a period closelybounded by the Late Heavy Bombardment (3.9�3.8 Ga) and the oldestplausible isotopic signatures of life (3.8 Ga) (Rosing, 1999). It is based on thefollowing assumption:• The composition of volcanic gases is roughly the same as it is today.
This is supported by the composition of the oldest (~3.9 Ga) magmaticrocks (ultramafic lavas?) (Delano, 2001; Li and Lee, 2004).
• Molecular nitrogen has reached its present atmospheric level (PAL).This is consistent with the outgassing timing inferred from isotopes, witha ~30% uncertainty on the level of N2 due to recycling between theatmosphere, the crust and the mantle (see part 4.3.1.4.).
• Carbonate-silicate regulation of the mean surface temperature (TS) is atwork (Walker et al., 1981). This requires the weathering of emergedcontinents and imposes a CO2 level of about 0.2 bars. This point wasdebated by Sleep and Zahnle (2001b) who suggested that such high levelof atmospheric CO2 would be unstable due to the carbonitization of
214 HERVE MARTIN ET AL.
basalts, which would maintain the early Earth in a globally frozen state.Efficient carbonitization of seafloor seems however inefficient whenoccurring below a km-thick frozen ocean. As carbonate-silicate recyclingwas shown to be the mechanism allowing the Earth to recover fromSnowball events (Hoffman et al., 1998), it is reasonable to assume that itwas also a mechanism able to overcome carbonitization and to sustainTS above 0 �C.
The abundance of molecular hydrogen is obtained by balancing volcanicoutgassing and Jeans escape of atomic H to space. Assuming a diffusion-limited loss to space, as in Kasting’s original work, yields a H2 mixing ratio of10)3. However, escape of atomic hydrogen in the modern oxic atmosphere isonly limited by its diffusion above the tropopause because the exosphere issufficiently hot (~1000 K). The high temperature of Earth’s exosphere is dueto its high O2 and low CO2 contents (the exosphere of Venus, for instance,remains below 278 K). The prebiotic atmosphere was anoxic and the lowexospheric temperature, rather than diffusion, limited the loss of hydrogen.Tian et al. (2005) estimated the hydrogen loss and showed that a volcanicrate equal to the present one would result in an H2 mixing ratio 100 timeshigher (0.1 bar). For higher volcanic rates (which are likely), molecularhydrogen can become the dominant species in Earth prebiotic atmosphere.
In the prebiotic atmosphere, O2 is produced only by photochemistry andescape of hydrogen following H2O photolysis, and maintained to a very lowlevel (<10)10) by reaction with reducing volcanic gases.
The abundance of methane depends on the efficiency of its abiotic pro-duction, which is assumed to originate from reducing hydrothermal fluidsproduced after serpentinization of ultramafic rocks. Today’s abiotic pro-duction (mainly at off-axis mid-ocean ridges) released in an anoxic atmo-sphere would lead to mixing ratio below 10)6. As a more extensivehydrothermal activity was likely at 3.8 Ga and because meteoritic impactsalso contributed to the methane production (Kress and McKay, 2004), sig-nificantly higher levels of CH4 (10)5)10)4) could be sustained (Kasting,2005).
The composition in other gases is much more speculative: CO is oftenpointed as a major prebiotic gas because of its formation during impactand its abundance in the protosolar nebula. However, no quantitativestudy on the sources and sinks of CO are available. Nitrogen-bearingprebiotic compounds like HCN and NO can be produced by lightning andimpacts at a rate critically depending on the level of the other gases,among which H2, CO2 and CH4 (Navarro-Gonzalez et al., 2001;Commeyras et al., 2004).
This model likely represents average conditions on Earth at about 3.8 Gaif life was absent or only marginally involved in the global geochemicalcycles. However, recent revisions of the impact history question this dating of
215ENVIRONMENTAL CONTEXT

the prebiotic era at about 3.8 Ga. Earth became habitable after the lastimpact able to vaporize the whole ocean hit the Earth.1 By triggering amagma ocean phase, such impact would not only annihilate the biospherebut also reset to simple molecules the complex organics that could have beenformed before. By considering a monotonic decrease of the bombardmentbetween the moon-forming impact and the dated lunar impacts, several au-thors estimated the rate of such catastrophes and the horizon for ancient lifeon Earth (Maher and Stevenson, 1988; Oberbeck and Fogelman, 1989; Sleepet al., 2001). They concluded that long lasting habitability started on Eartharound 4.0±0.1 Ga. As described in part 4.5, such monotonic decrease is notconsistent with solar system formation models and the bombardment ratecould have been comparable to the present one between the end of Earthaccretion (~4.4 Ga) and the LHB (3.9 Ga; part 4.5). During the LHB itself,the Earth was bombarded by an integrated mass of asteroids lower than 1.8 ·1023g (Gomes et al., 2005), which does not imply the occurrence of 500 kmimpactors (3 · 1012 Megatons) required to evaporate the entire oceans or200 km bodies (1011 Megatons) able to warm it up to 100 �C. Therefore, andin the absence of constraints on the bombardment before 3.9 Ga, life couldhave emerged significantly earlier than previous hypotheses, as early as about4.4 Ga. One of the main implications is that the prebiotic atmosphere mayhave been much more reducing that usually assumed. The composition of theatmosphere later than 4 Ga was the result of more than 500 Ma of irre-versible oxidation through the escape of hydrogen to space, under the strongXUV irradiation of the early Sun (Selsis, 2004; Ribas et al., 2005), althoughhydrogen could still be abundant (Tian et al., 2005). H2 and other reducingspecies including CH4 could have dominated the very early atmosphere~ 4.4 Ga ago (Sleep et al., 2004). It is important to insist that the uncertaintyon the dating of the prebiotic atmosphere as well as on the dating of theoldest traces of life (see part 7.1) allows us to consider an origin of terrestriallife under a wide range of atmospheric composition: from H2-, CH4-rich toH2, CH4-poor.
6.2.1.2. The rise of O2
Between 2.4 and 2.0 Ga, a change from global anoxic to oxic atmosphericconditions, the so-called ‘‘Great Oxidation Event’’ or G.O.E. (Holland,2002), is revealed by several geological evidences (BIFs, red beds, palaeosols,detrital uraninite deposits) (Holland, 1994; Figure 6.7). It can now be datedwith high precision thanks to sulphur isotopic enrichments recorded in rocks:Sulphur isotopes follow a ‘‘normal’’ mass-dependent fractionation for high
1 This assumption is no longer true if life can survive such impact inside ejecta escaping the
Earth and reseeding it after its recovery (Wells et al., 2003; Gladman et al., 2005).
216 HERVE MARTIN ET AL.
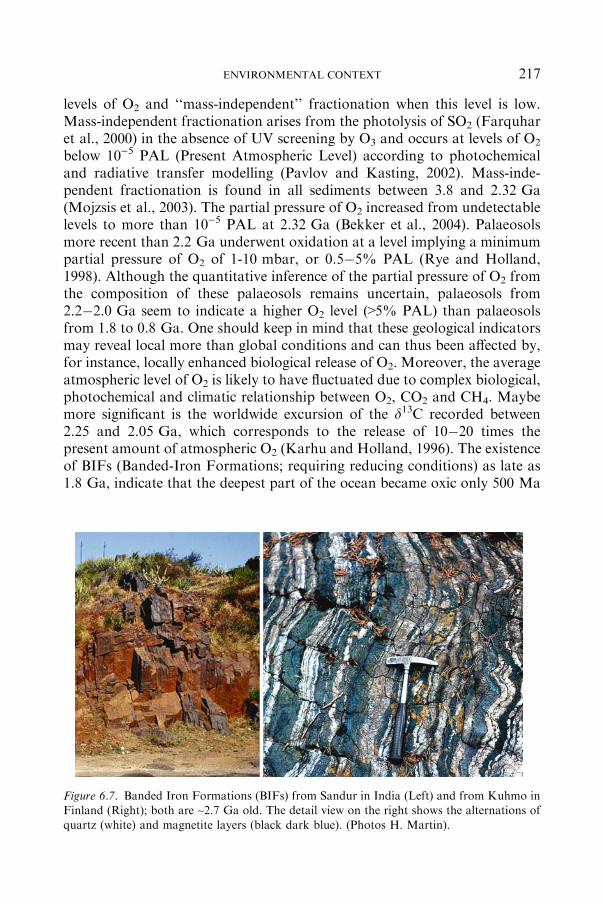
levels of O2 and ‘‘mass-independent’’ fractionation when this level is low.Mass-independent fractionation arises from the photolysis of SO2 (Farquharet al., 2000) in the absence of UV screening by O3 and occurs at levels of O2
below 10)5 PAL (Present Atmospheric Level) according to photochemicaland radiative transfer modelling (Pavlov and Kasting, 2002). Mass-inde-pendent fractionation is found in all sediments between 3.8 and 2.32 Ga(Mojzsis et al., 2003). The partial pressure of O2 increased from undetectablelevels to more than 10)5 PAL at 2.32 Ga (Bekker et al., 2004). Palaeosolsmore recent than 2.2 Ga underwent oxidation at a level implying a minimumpartial pressure of O2 of 1-10 mbar, or 0.5�5% PAL (Rye and Holland,1998). Although the quantitative inference of the partial pressure of O2 fromthe composition of these palaeosols remains uncertain, palaeosols from2.2�2.0 Ga seem to indicate a higher O2 level (>5% PAL) than palaeosolsfrom 1.8 to 0.8 Ga. One should keep in mind that these geological indicatorsmay reveal local more than global conditions and can thus been affected by,for instance, locally enhanced biological release of O2. Moreover, the averageatmospheric level of O2 is likely to have fluctuated due to complex biological,photochemical and climatic relationship between O2, CO2 and CH4. Maybemore significant is the worldwide excursion of the d13C recorded between2.25 and 2.05 Ga, which corresponds to the release of 10�20 times thepresent amount of atmospheric O2 (Karhu and Holland, 1996). The existenceof BIFs (Banded-Iron Formations; requiring reducing conditions) as late as1.8 Ga, indicate that the deepest part of the ocean became oxic only 500 Ma
Figure 6.7. Banded Iron Formations (BIFs) from Sandur in India (Left) and from Kuhmo inFinland (Right); both are ~2.7 Ga old. The detail view on the right shows the alternations of
quartz (white) and magnetite layers (black dark blue). (Photos H. Martin).
217ENVIRONMENTAL CONTEXT
after the atmosphere (Holland, 1999). In fact, Anbar and Knoll (2002)showed that anoxic but sulphidic conditions in the deep ocean might stillhave prevailed after 1.8 Ga and as late as 0.6 Ga. Sulphur and carbon iso-topes seem to indicate a second rise of O2, from ~0.5% PAL to more than5�20% PAL around 0.7±0.1 Ga ago (Canfield and Teske, 1996; Catlingand Claire, 2005). The present level of O2 was at least reached before theexplosion of complex life took place (543 Ma) and probably around 0.6 Ga.The partial pressure of O2 remained above 50% PAL during the entirePhanerozoic with a notable excursion to 150�200% PAL (350�400 mbar)around 300 Ma (Permo-Carboniferous), associated with the rise of vascularland plants and the associated increase of carbon burial (Berner et al., 2003).
The question whether the appearance of oxygen producers coincidedwith the beginning of the great oxidation event or occurred much earlier isstill open-ended. Molecular fossils of biogenic origins (hopanes and ster-anes) are a plausible indication for the existence of cyanobacteria andeukaryotes (the producer and consumer of O2) at 2.7 Ga (Brocks et al.,2003b). Stromatolites built by phototrophs became abundant at about2.8 Ga and exhibit similarities with modern stromatolites associated withcyanobacterial mats. Some of these stromatolites could result of non-oxy-genic bacterial activity but Buick (1992) showed that at least some of themwere not found in conditions allowing non-oxygenic photosynthesis. Iso-topes of iron (Rouxel et al., 2005) and nitrogen (Shen et al., 2006) alsoexhibit changes at 2.7�2.8 Ga, possibly indicating that oxygenation of theEarth was taking place at that time. Local oxidizing conditions found in3.7 Ga sediments (Rosing and Frei, 2004) can be the result of an earlybiological oxygen release. If O2 producers did appear as early as before 2.7or even before 3.7 Ga, what is the cause of the delayed rise of atmosphericoxygen? Several mechanisms have been proposed:(1) The net release of atmospheric O2 by photosynthesis is limited by the
burial of organic carbon. Organic carbon that remains at the surfacecan eventually be oxidized, whether consumed by eukaryotes ordirectly exposed to atmospheric oxidants. It is thus possible that therate of carbon burial, and thus the net release of O2, has been keptat low values by early tectonics and then enhanced as result ofthe break-up of the Late Archaean Supercontinent after 2.3 Ga(Des Marais et al., 1992).
(2) The build-up of O2 can also be frustrated by the release of reducingvolcanic gases when it exceeds the biological production of O2.Kasting et al. (1993) proposed that, due to a progressive oxidation ofthe mantle, the balance might have favoured the accumulation of O2
only after 2.3 Ga. However, the mantle redox required to producesuch reducing volcanic gases is not consistent with the timing for the
218 HERVE MARTIN ET AL.

degassing of nitrogen (Libourel et al., 2003; Marty and Dauphas,2003) and no redox evolution is observed in lavas formed between3.6 Ga and today (Delano, 2001; Li and Lee, 2004).
(3) Unstable climate due to coexistence of widespread methanogens andemerging O2 producers could have prevented the build-up of O2 untilsolar luminosity increased to a high-enough value (Selsis, 2002).
(4) Catling et al. (2001) suggested that methane-producing bacteria musthave preceded the rise of O2 by several hundred million years inorder to enhance the escape of hydrogen to space and, consequently,the required irreversible oxidation of the Earth. However, consid-ering the large hydrogen losses that occurred in the earliest history ofthe Earth (when the H2-rich atmosphere was submitted to the strongsolar XUV radiation, see Figure 6.8), it is unlikely that the hydrogenloss that occurred in the latest period predating the rise of O2
contributed significantly to the total loss integrated since the for-mation of the Earth.
Figure 6.8. XUV emission from Sun-like stars at different ages. This graph represents theSolar-normalized fluxes measured in different wavelength intervals (filled symbols) from 6Solar-type stars, EK Dra (0.10 Ga), p1 UMa and v1 Ori (0.30 Ga), j1 Cet (0.65 Ga), b Com
(1.6 Ga), b Hyi (6.7 Ga), and the Sun (4.56 Ga). The corresponding power-law fits are indi-cated. Empty symbols give the inferred flux where no observation is available. Adapted fromRibas et al. (2005).
219ENVIRONMENTAL CONTEXT
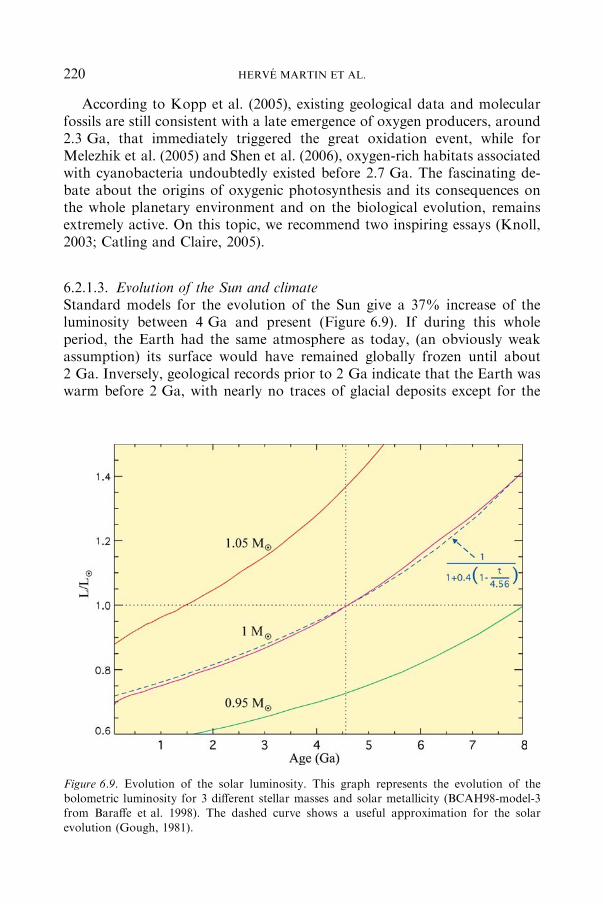
According to Kopp et al. (2005), existing geological data and molecularfossils are still consistent with a late emergence of oxygen producers, around2.3 Ga, that immediately triggered the great oxidation event, while forMelezhik et al. (2005) and Shen et al. (2006), oxygen-rich habitats associatedwith cyanobacteria undoubtedly existed before 2.7 Ga. The fascinating de-bate about the origins of oxygenic photosynthesis and its consequences onthe whole planetary environment and on the biological evolution, remainsextremely active. On this topic, we recommend two inspiring essays (Knoll,2003; Catling and Claire, 2005).
6.2.1.3. Evolution of the Sun and climateStandard models for the evolution of the Sun give a 37% increase of theluminosity between 4 Ga and present (Figure 6.9). If during this wholeperiod, the Earth had the same atmosphere as today, (an obviously weakassumption) its surface would have remained globally frozen until about2 Ga. Inversely, geological records prior to 2 Ga indicate that the Earth waswarm before 2 Ga, with nearly no traces of glacial deposits except for the
Figure 6.9. Evolution of the solar luminosity. This graph represents the evolution of thebolometric luminosity for 3 different stellar masses and solar metallicity (BCAH98-model-3from Baraffe et al. 1998). The dashed curve shows a useful approximation for the solar
evolution (Gough, 1981).
220 HERVE MARTIN ET AL.
Pongola (2.9 Ga) (Nhleko, 2004) and Huronian polar glaciations (3 eventsbetween 2.45 Ga and 2.32 Ga) (Hilburn et al., 2005) and the Makganyenelow-latitude glaciation (Snowball, 2.2 Ga) (Kopp et al., 2005, see part 6.3.2).This apparent contradiction, called the faint young Sun problem (Sagan andMullen, 1972), is no longer a paradox once known that the atmospheric levelof greenhouse gases (mainly CO2) changed during Earth history (see Selsis,2004, for alternative explanations of the faint young Sun problem). In par-ticular, the atmospheric level of CO2 is likely to be stabilized over geologicalperiods by the carbonate precipitation (associated with the weathering ofsilicates) on one hand and the volcanic emission on the other (Walker et al.,1981). This climate regulation, which is assumed to work for Earth-likeplanets inside the circumstellar habitable zone (Kasting, 1993), can accountfor most of Earth’s climate history. However, it could have been renderedinoperative in two ways. First, under very early tectonics, carbonate-silicateregulation may fail: efficient carbonitization of seafloor (Sleep and Zahnle,2001b) could lead to surface temperatures below 0 �C while the lack ofemerged continents to provide silicate weathering could lead to a build-up ofCO2 and surface temperatures well above 0 �C. Second, the release andconsumption of atmospheric gases by the biological activity can overrule thecarbonate-silicate regulation. In particular, methanogenesis, known as a veryprimitive metabolism, could have sustained a warm climate before the riseof oxygen (Pavlov et al., 2000; Kasting, 2005). In the absence of atmo-spheric O2, the present production rate of CH4 by methanogens would resultin 100 to 1000 times the present atmospheric abundance of methane(1 PAL = 1.6 · 10)6). To illustrate the efficiency of CH4 as a greenhousegas, let us consider that the atmosphere of the Earth at 2.8 Ga had the samecomposition as today, except for O2, assumed to be absent (for practicalreasons, we assume a 1 bar partial pressure of N2 to compensate for thelacking 0.2 bars of O2). The present level of CO2 (3 · 10)4) would be too lowto sustain a temperature above 0 �C: even with 1 PAL of CH4, the averagesurface temperature would be around )10 �C. If we keep the CO2 level to 1PAL and we increase the CH4 to 10, 100 and 1000 PAL, the surface tem-perature would rise to 0 �C, 5 �C and 15�20 �C, respectively (Pavlov et al.,2000). Moreover, under anoxic conditions, methanogens can colonize mostof the habitable environment, while on modern Earth they can grow onlyunder anaerobic conditions, like the ones found in swamps, in hydrothermalsystems and in the digestive system of mammals. Even higher levels ofatmospheric methane, and higher surface temperatures, are thus likely tohave occurred between the emergence of methanogens (at an unknown date)and the great oxidation event (2.3 Ga), although there is no geological evi-dence to support this hypothesis. At very high levels of CH4, 1) photo-chemical hazes start to form like in Titan atmosphere, resulting in anenhanced albedo and 2) CH4 begins to absorb a significant part of the visible
221ENVIRONMENTAL CONTEXT

and near infrared solar radiation, producing a stratospheric warming thatreduces the surface warming (again like on Titan). For a given level of CO2,there is thus a limit of the surface temperature that can be reached under aCH4-rich atmosphere. This limit is however not well determined due toincomplete spectroscopic data of CH4 and uncertain properties of these ha-zes, but it could certainly be as high as 30 �C for 1 PAL of CO2 at 2.8 Ga.
If the emergence of O2 producers occurred when CH4 was the maingreenhouse gas, climatic consequences would be dramatic: the photochemi-cal lifetime of atmospheric CH4 drops, anoxic conditions required bymethanogens became scarcer yielding a decrease of the production rate ofCH4, and CO2 consumption increases due to the enhanced biological pro-ductivity. Therefore, the beginning of O2 production is likely to trigger aglaciation or even a snowball2 event. Under snowball conditions, oxygenicphotosynthesis ‘‘freezes’’ while CH4 and CO2 can rise again. Under low solarirradiation, such configuration (competing CH4- and O2-producers) can in-duce a steady state characterized by a temperature slightly above 0 �C and avery low abundance of O2 (<10
)5). Such steady state is however unstable andcan result in repeated glaciations (Selsis, 2000). The collapse of a CH4-warming is the favoured explanation for the earliest identified snowball(Makganyene glaciation, 2.3�2.2 Ga) (Kopp et al., 2005). The three Huro-nian glaciations (probably restricted to low-latitudes, Hilburn et al., 2005),which shortly predated the Makganyene event, and the Pongola Glaciation(2.9 Ga) could be caused by such instabilities if oxygen producers werealready widespread.
After the great oxidation event, atmospheric levels of methane were lim-ited by the growing oxic environment and by the short photochemical life-time of CH4 but could have remained a major greenhouse gas, with a levelexceeding 10 PAL (Pavlov et al., 2003). Therefore, the NeoproterozoicSnowball, associated with a second rise of O2 could have also been triggeredby the fall of the CH4 abundance down to about its present level.
2 Snowball glaciations, characterized by an ice cover down to the equator, are the coldest
times recorded in Earth’s history. At the beginning of these events, the runaway ice-albedofeedback makes the global mean temperature drop to )50 �C for a few tens of thousands ofyears (Schrag et al. 2002). This temperature drop is followed by a period of a few million years
during which the mean temperature is around )10 �C. Earth recovers from Snowball eventsthanks to the carbonate-silicate regulation (Hoffman et al., 1998): volcanic gases released inthe absence of surface liquid water and carbonate precipitation, allow CO2 to build-up to a
level high enough to warm the surface above 0 �C.
222 HERVE MARTIN ET AL.
6.2.2. CHEMICAL EVOLUTION OF THE OCEANS
DANIELE L. PINTI
6.2.2.1. Hadean (4.6�3.8 Ga)The chemistry of seawater in the early Hadean was likely controlled by high-temperature water�rock interactions between the hot CO2�H2O runawaygreenhouse and the basaltic proto-crust (see part 4.2.2.2). Modern analoguesof these environments could be mid-oceanic ridges. At mid-oceanic ridges,due to water circulation, rocks partially dissolve thus saturating water in themajor constituents of the rock. Similarly, in the early Earth, magma eruptionrepeatedly brought basalts into contact with the atmospheric water vapour,maintaining its saturation in major elements (Sleep et al., 2001). Today,similar atmosphere-rock reactions are supposed to take place at the surfaceof Venus (Johnson and Fegley, 2002). When the runaway greenhouse cooleddown, possibly before t0+165 Ma (see part 4.2.2), condensed seawaterstarted to penetrate deeper in the oceanic basaltic proto-crust, experiencingextensive water�rock interactions. A significant difference with modernseawater is that CO2 was an abundant volatile in the early runaway atmo-sphere making early oceans more acidic than today (pH = 5.5, Pinti, 2005).Attack of such solutions on exposed rock was thus more rapid, enriching thesolution of dissolved salts (Krauskopf and Bird, 1995).
The first volatile to condense was chlorine, likely outgassed from theEarth’s interior in the form of HCl (Holland, 1984; Graedel and Keene,1996). The amount of chlorine available at the beginning is difficult toevaluate. Holland, (1984) considered that H2O and Cl were both degassedfrom the interior of the Earth. Using the Cl/H2O ratio in the crust, Holland,(1984) calculated an amount of 24.8 g/Kgwater, which represents 1.2 times thepresent value (18.8 g/Kgwater). This figure is probably a minimum estimate,and it is expected that higher concentrations of chlorine were available in theprimordial oceans. Amounts of chlorine 2 times the present values have beenargued by Knauth (1998, 2005), based on mass balance calculations includingchlorine from evaporite deposits of marine origin, recycled and deposited onthe continental crust during Proterozoic and Phanerozoic times.
The amount of available Na in early seawater was by far enough tocombine with Cl to form NaCl. Sodium was removed from the basalticproto-crust, through pervasively hydrothermal-driven water�rock interac-tions. As an example, a global layer of basalt of 500-meter thick could supplythe total amount of Na actually present in the modern ocean (Sleep andMcClure, 2001; Sleep et al., 2001). Continuous genesis and recycling ofcooled lava at the surface of the planet could have thus supplied theamount of sodium required for saturating the primordial ocean with a NaCl-dominated brine. Depending on the pressure, solid NaCl may have been
223ENVIRONMENTAL CONTEXT
in equilibrium with a water�rich high-pressure gas (representing theproto-atmosphere, Pinti, 2005). Temperature and pressure conditions nec-essary for the transition from two fluids to one fluid plus solid NaCl were407 �C, at 298 bars (Bischoff and Rosenbauer, 1988).
Other abundant cations were likely K+, Ca2+ and Mg2+. Particularly,Ca2+ and Mg2+ should have been more concentrated than today due to thehigher pH of the primitive oceans, since at low pH they exist together withHCO �
3 . The Ca2+/Mg2+ ratio could have been higher than today because it
was likely controlled by the reactions with basalts at mid-ocean ridges(Bischoff and Dickson, 1975). Sulphate ion would have been scarce or absent,because sulphur was mainly under its reduced form (Krauskopf and Bird,1995). Rarer metals whose concentrations at present are kept low by reactionswith and such as Ba2+, Sr2+ andMn2+ likely played a more important role inHadean seas (Krauskopf and Bird, 1995; Holland, 2002; Holland, 2003).Halogens could have been also abundant, mainly bromine and iodine, becausethe absence of a biosphere able to scavenge them from seawater and fix onsediments, as occurs today (Krauskopf and Bird, 1995; Channer et al., 1997).The lower rates of sedimentation expected for a Hadean planet dominated byoceans, with small continental plates and very small or no emerged continent,should have favoured the concentration of halogens in seawater. Finally, in apoorly oxygenated and acidic early ocean, iron was very abundant as solubleferrous iron (Fe2+) (Holland, 2003, and references therein).
During Hadean, high salinities, together with high temperatures (Knauthand Lowe, 2003), could have limited the hypothetical biological activity inthe sea (Knauth, 2005). Complex organic molecules are indeed vulnerable todamage caused by sodium and chlorine in seawater and only organismsadapted to these ‘‘drastic’’ conditions, such as extremophiles, could havedeveloped and survived (Cowen, 2005; Knauth, 2005).
6.2.2.2. Archaean (3.8�2.5 Ga)Major advances in the comprehension of the chemical evolution of theoceans come from two main sources: indirect evidence derived from themineralogy of sediments of that period (see: Holland, 1984; Holland, 2003,for a detailed analysis) and from the isotopic fractionation of elements sen-sitive to the redox of their depositional environment (mainly sulphur andnitrogen, Beaumont and Robert, 1999; Farquhar et al., 2000; Farquharet al., 2001; Pinti et al., 2001; Shen and Buick, 2004). Direct evidence for thechemical composition of seawater is rather scarce in the Archaean sequencesand mostly derived from a very few chemical analyses carried out in fluidsinclusions into minerals which are considered to have preserved pristineseawater (Channer et al., 1997; de Ronde et al., 1997; Appel et al., 2001;Foriel et al., 2004; Weiershauser and Spooner, 2005).
224 HERVE MARTIN ET AL.

Indirect evidence of the chemical properties of seawater and of its redoxstate comes mostly from the study of the few carbonates and Banded IronFormation (Figure 6.7) (Holland, 1984; Isley, 1995; Holland, 2002; Konka-user et al., 2002). The carbonate minerals in Archaean sediments are mainlycalcite, dolomite, aragonite and scarce siderite (FeCO3). This latter mainlyoccurs in the Banded Iron Formations (Holland, 1984). This means that theoceans were supersaturated in Ca2+ and Mg2+, but estimation of theirconcentrations is difficult to achieve (Holland, 2003). A rough upper limit of250 for the Ca2+/Fe2+ ratio in the Archaean seawater has been derived byHolland (2003) from the absence of significant siderite fraction in the BIF.This value is much lower than the present-day Ca2+/Fe2+ ratio in seawaterof 9.1 · 106 (Horibe et al., 1974; Gordon et al., 1982). In the modern oxy-genated ocean, Fe3+ is rapidly precipitated as Fe(OH)3. The higher Fe2+
concentrations observed in the Archaean indicates a much lower O2 contentin the atmosphere and in the near-surface ocean. The higher Fe2+ and Mn2+
contents found in Archaean limestones, compared to their Phanerozoiccounterparts (Veizer et al., 1989), support this hypothesis.
Stronger evidences of a poorly oxygenated ocean come from the isotopicfractionation of elements such as sulphur and nitrogen. In the absence of O2,solar UV interact with SO2 and generate large mass-independent fraction-ation (mif) of sulphur isotopes (d33S) in the reactions products (sulphides andsulphates, Farquhar et al., 2000). The mass-dependent fractionation of thesulphur isotopes (d34S) in sedimentary sulphides is smaller prior to 2.7 Ga(less than 20%) than in more recent times, when variations of 20% to 40 %are measured. This has been interpreted as the result of a lower concentrationof sulphate in the Archaean seawater (0.2 mMol L)1) compared to thepresent-day (28.7 mMol L)1), which inhibited isotopic fractionation duringsulphate reduction (Holland, 2002). In the absence of oxygen, pyrite wouldnot have been oxidized during weathering, reducing drastically the con-centrations of sulphates in the Archaean ocean. Nitrogen isotope ratios(d15N) measured in Archaean (older than 2.7 Ga) organic matter (Beaumontand Robert, 1999; Pinti et al., 2001; Pinti et al., 2003; Ueno et al., 2004),show two distinct populations centred around d15N values of �3:6 and þ4:3,respectively (Shen et al., 2006). Negative nitrogen isotopic values have beeninterpreted by Beaumont and Robert (1999) as the result of an Archaeannitrogen oceanic cycle different from the modern one, and dominated bynitrogen fixation in a poor-O2 environment. Alternatively, Pinti et al. (2001)interpreted these values as representative of a marine N cycle dominated bybiological cycling of reduced N species by chemolithotrophs at hydrothermalvents, suggesting a chemistry of the ocean largely buffered by interactionswith the mantle (see: Shen et al., 2006, for a detailed synthesis).
Direct evidence for the chemical composition of seawater is rather scarcein Archaean sequences. Some studies suggest that pristine fluid inclusions,
225ENVIRONMENTAL CONTEXT
containing Archaean seawater, could have been preserved in the geologicalrecord (Channer et al., 1997; de Ronde et al., 1997; Appel et al., 2001; Forielet al., 2004; Weiershauser and Spooner, 2005) (Table 6.1). Appel et al. (2001)studied quartz globules preserved in pillow basalts from localized low-straindomains of 3.75 Ga sequences at Isua Greenstone Belt, West Greenland.Fluid-gaseous inclusions in quartz globules contain remnants of two inde-pendent fluid/mineral systems including pure CH4 and highly saline aqueousfluids (about 25 wt.% NaCl equivalent), and co-precipitating carbonates(calcite). Appel et al. (2001) interpreted this aqueous system as a relic of sea-floor hydrothermal fluids (Table 6.1). However, the salinity of modernventing solutions is close of that in modern seawater (3.5 wt% equivalentNaCl), deviating by 40�200% from the average only at specific vents(0.4�7 wt% equivalent NaCl, von Damm et al., 1995). The high salinitiesmeasured in these inclusions (10 times the modern hydrothermal systems)may have been produced by Archaean seawater, with salinity 3 times thepresent value, modified by high temperature hydrothermal reactions withbasalts (Appel et al., 2001). Alternatively, phase separation could have beenproduced during prograde metamorphism of the rocks, leaving an enrichedsaline residual in the inclusions. Isua sequences are indeed highly metamor-phosed, at amphibolite facies ( T460� 480C and 4 kb), and it cannot beexcluded that phase separation could have affected the fluid content of theseinclusions.
High salinities have also been observed in primary fluid inclusions fromintra-pillow quartz from the North Pole Dresser Formation (3.490 Ga),Pilbara craton, Western Australia (Foriel et al., 2004). These rocks neverexperienced high-T metamorphism (T £ 200 �C). The chemistry of the fluidinclusions, particularly the Cl/Br ratios, point to the occurrence of at leastthree fluids: a saline fluid (Cl/Br = 631 and a 12 wt% equivalent NaCl); aFe-rich fluid (Cl/Br = 350); and a Ba-rich fluid (Cl/Br = 350). The salinefluid is likely seawater (Foriel et al., 2004). The Cl/Br ratio of 630 is indeedvery close to that of modern seawater (Cl//Br = 647). The amount ofchlorine, 4 times the present value, is explained by intense evaporation ofseawater. The Fe-rich and Ba-rich fluids have Cl/Br ratios close to bulk Earthvalue (420), possibly indicating mantle buffering (Channer et al., 1997; deRonde et al., 1997) and a hydrothermal origin for these fluids. This seems tobe corroborated by the occurrence of nitrogen and argon having a purepristine mantle signature in intra-pillow cherts from the same formation(Pinti et al., 2003; Shen et al., 2006). The Dresser formation sequence atNorth Pole has been interpreted as an estuarine littoral sedimentary depositwith a stratified body of deeper water enriched of primary hydrothermalbarium and silica emanating from white smokers (Nijman et al., 1998; VanKranendonk et al., 2001). Therefore, it appears logic to find a mixing be-tween evaporated seawater and hydrothermal fluids, in these inclusions.
226 HERVE MARTIN ET AL.

TABLE
6.1
Chem
istryofArchaean,Paleoproterozoic
seawaterandhydrothermalfluids,together
withthatofNa�C
a�C
lbrines
from
PrecambrianShields
Location
Age
Ma
Stratigraphy
Typeof
inclusion/
sample
name
Cl)
mmol/L
Br)
mmol/L
SO
2� 4
mmol/L
Na+
mmol/L
K+
mmol/L
Mg2+
mmol/L
Ca2+
mmol/L
Sr2
+
mmol/L
CI/Br
mmol/L
Typeof
fluids
NorthPole,
W.Australia
3490
Warrawoona;
Dresser
Fmt
Metal-depleted1
(Pi0l-21)
2284
3.8
n.d.
n.d.
49.1
n.d.
525
3.7
596
Seawater
NorthPole,
W.Australia
3490
Warrawoona;
Dresser
Fmt
Metal-depleted1
(Pi02-39/1)
1772
2.7
n.d.
n.d.
44.4
nd
385
2.4
642
Seawater
NorthPole,
W.Australia
3490
Warrawoona;
Dresser
Fmt
Metal-depleted1
(Pi02-39/2)
2580
4.2
n.d.
n.d.
78.0
n.d.
679
4.3
607
Seawater
NorthPole,
W.Australia
3490
Warrawoona;
Dresser
Fmt
Metal-depleted1
(Pi02-39/3)
2065
3.4
n.d.
n.d.
52.1
n.d.
486
3.0
652
Seawater
NorthPole,
W.Australia
3490
Warrawoona;
Dresser
Fmt
Iron-rich1
2580
4.2
n.d.
n.d.
78.0
n.d.
679
4.3
402
Hydrothermal
NorthPole,
W.Australia
3490
Warrawoona;
Dresser
Fmt
Barium-rich1
1599
4.0
n.d.
n.d.
603.9
n.d.
437
3.5
370
Hydrothermal
Ironstone
Pods,RAS
3230
Fig
Tree
Group
Seawater
end-m
ember
2
920
2.3.
2.3
789
18.9
50.9
232
4.5
409
Seawater
Ironstone
Pods,RAS
3230
Fig
Tree
Group
Hydrothennal
end-m
ember
2
730
2.6
822
21.5
43
0.2
282
Hydrothermal
Ironstone
Pods,RAS
3230
Fig
Tree
Group
Seawater
end-m
ember
2
758
2.4
n.d.
n.d.
n.d.
n.d.
n.d.
n.d.
313
Seawater
Griqualand
West,RAS
2220
Transvaal;
OngelukFmt
Quartz
(BoschAar)
33538
262.0
185
6446
605.0
164
12258
316.0
128
Hydrothermal
Griqualand
West,RAS
2220
Transvaal;
OngelukFmt
Quartz
(BoschAar)
11559
95.0
46
2178
201.0
45
4160
99.0
122
Hydrothermal
Griqualand
West,RAS
2220
Transvaal;
OngelukFmt
Qtz-II
(Bovenongeluk)
1675
16.4
42
283
60.0
n.d.
n.d.
n.d.
102
Seawater
227ENVIRONMENTAL CONTEXT
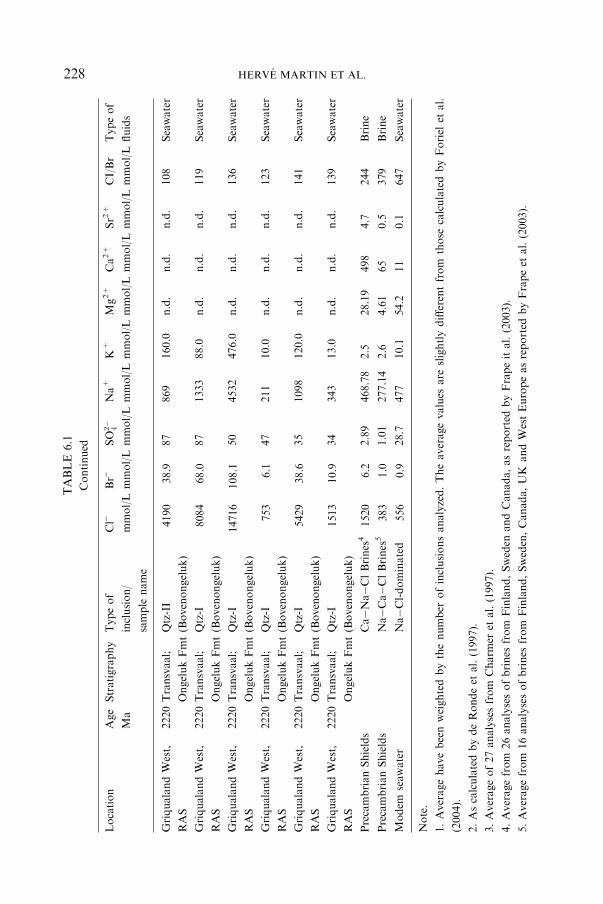
TABLE
6.1
Continued
Location
Age
Ma
Stratigraphy
Typeof
inclusion/
sample
name
Cl)
mmol/L
Br)
mmol/L
SO
2� 4
mmol/L
Na+
mmol/L
K+
mmol/L
Mg2+
mmol/L
Ca2+
mmol/L
Sr2
+
mmol/L
CI/Br
mmol/L
Typeof
fluids
GriqualandWest,
RAS
2220Transvaal;
OngelukFmt
Qtz-II
(Bovenongeluk)
4190
38.9
87
869
160.0
n.d.
n.d.
n.d.
108
Seawater
GriqualandWest,
RAS
2220Transvaal;
OngelukFmt
Qtz-I
(Bovenongeluk)
8084
68.0
87
1333
88.0
n.d.
n.d.
n.d.
119
Seawater
GriqualandWest,
RAS
2220Transvaal;
OngelukFmt
Qtz-I
(Bovenongeluk)
14716
108.1
50
4532
476.0
n.d.
n.d.
n.d.
136
Seawater
GriqualandWest,
RAS
2220Transvaal;
OngelukFmt
Qtz-I
(Bovenongeluk)
753
6.1
47
211
10.0
n.d.
n.d.
n.d.
123
Seawater
GriqualandWest,
RAS
2220Transvaal;
OngelukFmt
Qtz-I
(Bovenongeluk)
5429
38.6
35
1098
120.0
n.d.
n.d.
n.d.
141
Seawater
GriqualandWest,
RAS
2220Transvaal;
OngelukFmt
Qtz-I
(Bovenongeluk)
1513
10.9
34
343
13.0
n.d.
n.d.
n.d.
139
Seawater
PrecambrianShields
Ca�N
a�C
lBrines
41520
6.2
2.89
468.78
2.5
28.19
498
4.7
244
Brine
PrecambrianShields
Na�C
a�C
lBrines
5383
1.0
1.01
277.14
2.6
4.61
65
0.5
379
Brine
Modem
seawater
Na�C
l-dominated
556
0.9
28.7
477
10.1
54.2
11
0.1
647
Seawater
Note.
1.Averagehavebeenweightedbythenumber
ofinclusionsanalyzed.Theaveragevalues
are
slightlydifferentfrom
those
calculatedbyForiel
etal.
(2004).
2.AscalculatedbydeRondeet
al.(1997).
3.Averageof27analysesfrom
Charm
eret
al.(1997).
4.Averagefrom
26analysesofbrines
from
Finland,Sweden
andCanada,asreported
byFrapeital.(2003).
5.Averagefrom
16analysesofbrines
from
Finland,Sweden,Canada,UK
andWestEuropeasreported
byFrapeet
al.(2003).
228 HERVE MARTIN ET AL.
However, the fact that seawater could have evolved in a closed basin does nothelp in determining its initial saline content.
De Ronde et al. (1997) studied the fluid chemistry of what they believed tobe Archaean (3.2 Ga) seafloor hydrothermal vents. Quartz crystals found iniron oxide structures (Ironstone Pods) from the 3.5�3.2 Ga Barbertongreenstone belt, South Africa, contain fluid inclusions, which may derive froma mixing between a NaCl�CaCl2 dominated seawater and a CaCl2�FeCl2hydrothermal fluid. TheNa/Cl ratio in this presumedArchaean seawater is thesame as the present-day ocean (0.858), but the total amount of sodium andchlorine is 1.6 times the present day value (Table 6.1). The concentrations ofCa2+, Sr2+ are 22 and 50 times higher than the present-day ocean, possibly,because the more acidic ocean did not allow them to precipitate as carbonate,as today. The concentration of is lower than in modern seawater becausesulphur was largely in reduced form (Krauskopf and Bird, 1995; Holland,2003). Finally, the Cl/Br ratio of 400 is very close to the bulk Earth value (420)and of those observed at mid-oceanic ridges, suggesting that halogens werebuffered by mantle. Lowe and Byerly (2003) have recently contested the Ar-chaean age of these deposits, showing that the Ironstone Pods are largelycomposed of goethite (a thermally unstable hydrated iron oxide mineral),deriving from quaternary dissolution of the Archaean siderite. The debate thatfollowed is casting doubts on the validity of these data, which were consideredthe most compelling evidence of the chemistry of the Archaean seawater.
Very recently, Weiershauser and Spooner (2005) reported the chemistry ofprimary fluid inclusions in quartz-filled vesicles and interstitial and drainagecavity quartz from pillowed flows in the area of Ben Nevis, in the 2.7 GaAbitibi Greenstone Belt, Ontario, Canada. They measured salinities in whatthey assumed to be Archaean seawater, ranging from 4.8 to 11.4 wt%equivalent NaCl with a small subset of inclusions yielding salinities between20 and 25 wt% equivalent NaCl. These results point out again the possiblehigher salinity of the Archaean ocean compared to modern seawater. Threemain hypothesis can account for high salinities in fluid inclusions: (1)Younger high saline fluids of unknown origin were trapped and erroneouslyinterpreted as primary, modified high-salinity seawater; (2) phase separationoccurred, leaving a highly saline brine as the liquid phase (which got trappedin the inclusions), and a low-salinity vapour phase, which escaped the systembefore trapping could occur; and (3) a pristine Archaean high-salinity sea-water was trapped (Weiershauser and Spooner, 2005).
The first hypothesis seems not plausible. There are compelling mineralog-ical evidence that the structures, where the fluid inclusions reside, are primarystructures. They aremostly undisturbed by post-depositionmetamorphism (deRonde et al., 1997; Foriel et al., 2004; Weiershauser and Spooner, 2005), withthe possible exception of inclusions from Isua (Appel et al., 2001). Weiersha-user and Spooner (2005) argued against phase separation, because there is no
229ENVIRONMENTAL CONTEXT
evidence of liquid and vapour-dominated inclusions in the same fluid inclusionassemblages, which will be the rule for samples affected by boiling (Roedder,1984). Although assuming these fluid inclusions as pristine seawater, severalquestions can be raised. Do these inclusions give a real representation of theearly global ocean? Alternatively, do the high salinities recorded in theseinclusions reflect local conditions, such as close basins, where seawater wasaffected by high degree of evaporation? This latter hypothesis, for example,seems to be the likely explanation for the high salinities observed in the NorthPole aqueous inclusions (Foriel et al., 2004).
Salinity of Archaean fluids could have been strongly modified by inter-actions with the volcanic pile at seafloor, prior to be definitively trapped inrocks. Several of these inclusions contain Na�Ca�Cl dominated fluids,which are characteristics of deep continental water circulating or havinginteracted with the crystalline basement (Frape et al., 2003). Ca�Na�Cl andNa�Ca�Cl brines, with salinities 10 times the modern seawater, have beenfound in most Precambrian shields, in Finland, Sweden, Russia and Canada(Fritz and Frape, 1987; Frape et al., 2003, and references therein). In (Fig-ure 6.10), we reported the concentrations of dissolved species, normalized tothose found in modern seawater, for Archaean seawater (de Ronde et al.,1997), Palaeoproterozoic seawater (Gutzmer et al., 2003) and the averagecomposition of Ca�Na�Cl and Na�Ca�Cl-dominated brines (calculatedfrom compiled literature data from Frape et al., 2003). Except for a lowerK+ and Mg2+ amount in Ca�Na�Cl brines, the variations in dissolvedspecies and the dilution-enrichment factors of these brines are very close tothose estimated for the Archaean seawater. Deep-brines from Precambrianshields have been interpreted, based on their H, O, Cl and Sr isotopic ratios,as derived from intense evaporation of modern-like seawater. Prolongedwater�rock interactions are thus responsible for their variations in the dis-solved species (Frape et al., 2003). The resemblance with Archaean seawatermay suggest that early oceans had chemistry and Total Dissolved Salinity(TDS) practically identical to modern seawater. Most of the variations in theamounts of dissolved species (Figure 6.10) could be thus derived from sea-floor water�rock interactions or contamination by hydrothermal fluids andmay not reflect a different chemistry of the early oceans. Further studies onthis issue are needed to answer to this hypothesis.
It is only in Proterozoic terrains that fluid inclusions with a chemistrysimilar to that of modern seawater is finally found. Palaeoproterozoicaqueous inclusions found in 2.22 Ga pods and short veins of quartz withinbasaltic andesites of the Ongeluk Formation, Transvaal Supergroup, SouthAfrica, show the presence of Ca-rich high saline fluids, resulting from wa-ter�rock interactions with the host volcanic rocks together with seawaterhaving a NaCl concentration equivalent to that of modern seawater (~4 wt%equivalent NaCl, Gutzmer et al., 2003). This could indicate that the
230 HERVE MARTIN ET AL.

chemistry of seawater was starting to evolve towards the present-day con-ditions, just after the 2.5 Ga transition. However, Knauth (2005) suggestedthat the first great lowering of oceanic salinity probably occurred in latestPrecambrian (ca. 1 Ga ago), when enormous amounts of salt and brine weresequestered in giant Neoproterozoic evaporite basins.
Gutzmer et al. (2003) measured Cl/Br values in 2.22 Ga inclusions andfound that they are similar to those predicted for Archaean seawater (bulkEarth value), but significantly below to those of the present-day seawater.Gutzmer et al. (2003) suggested that ambient seawater in continental shelfenvironments at ca. 2.22 Ga was still buffered by vent fluids. This conclusionseems to be common in most of the Archaean studies: the chemistry of theArchaean ocean was buffered by the mantle, through emission of dissolvedchemical species and volatiles from mid-oceanic vents and high-temperaturepervasive water�rock interactions throughout the oceanic crust. Only with
Figure 6.10. Concentration of dissolved anions and cations in Archaean and Paleoproterozoicseawater (data from de Ronde et al., 1997 andGutzmer et al., 2001, respectively) normalized to theconcentrations in modern seawater. Seawater-normalized average concentrations of Ca�Na�Cl
and Na�Ca�Cl-dominated brines flowing in crystalline Precambrian shields of Finland, Sweden,Russia and Canada are also reported for comparison (data from Frape et al., 2003).
231ENVIRONMENTAL CONTEXT

the progressive build up of larger continents and of an abundant biosphere inProterozoic times, riverine input and biological controls start to regulate thechemistry of seawater (Veizer and Compston, 1976; Veizer et al., 1989;Channer et al., 1997; Kamber and Webb, 2001; Pinti, 2005, and referencestherein).
This high saline ocean could have been warmer than today. Oxygen iso-tope data for early diagenetic cherts (Figure 6.11) indicate surface tempera-tures of about 55�85 �C throughout the Archaean (Knauth and Lowe, 1978;Knauth, 1998; Knauth and Lowe, 2003), but these data are actually con-troversial (see Pinti, 2005, and references therein). Data from fluid inclusionssuggest a temperature of 39 �C at 3.2 Ga (de Ronde et al., 1997). Because O2
solubility decreases strongly with increasing temperature and salinity (Weiss,1970), the Archaean hotter and highly saline ocean has been probablymaintained anoxic, even if atmospheric O2 were somehow as high as 70% ofthe modern level (Knauth, 2005).
6.3. Disturbing Events
PHILIPPE CLAEYS
Among the brutal events capable of modifying the environment of life onEarth surface are meteoritic impacts and glaciations. If most Archaean and
Figure 6.11. 3.445 Ga old chert from the Hooggenoeg formation in Barberton greenstone belt
(South Africa). This chert is considered as formed due to hydrothermal activity in an envi-ronment possibly similar to modern mi-ocean ridges. Chemical analyse of such rocks providesinformation on water composition at the time of their formation. (Photo H. Martin).
232 HERVE MARTIN ET AL.
Proterozoic impact craters disappeared due to erosion and plate tectonics,their traces are preserved in sedimentary records, as spherule layers. Simi-larly, glaciation periods strongly affected the environment and modifiedexogenous mechanisms such that their existence and influence have also beenimprinted in the sedimentary record.
6.3.1. SPHERULE LAYERS: THE RECORD OF ARCHAEAN AND PROTEROZOIC IMPACT
EVENTS.
Among the ~175 impact structures known on Earth, only a small fraction isProterozoic in age, but this fraction includes two giants: Sudbury in Canada(~250 km in diameter and 1.850 Ga old) and Vredefort in South Africa(estimated to reach 300 km in diameter and dated at 2.023 Ga). So far, nocrater of Archaean age has been identified, and due to the limited amount ofpreserved lithologies of this age, it is rather unlikely that one will ever befound. It is undeniable that also during this period, asteroids and/or cometswere colliding with Earth. The ejecta layers recorded in ancient sedimentarysequences constitute the only remaining trace of these early impacts. Theselayers are generally composed of particles ejected during the cratering pro-cess, transported for hundreds to thousands of km and deposited in sedi-mentary sequences. When an extraterrestrial body collides with the Earth, ahuge amount of energy is released leading to the vaporization and melting ofboth the projectile and the upper parts of the target-rock. The crateringprocess is accompanied by the ejection of target-rock debris as solid, vapourand molten phases. These different impact products are recorded in sedi-mentary sequences as distinct ejecta layers containing shocked minerals,spherules made of glass (or its alteration product) and crystallites, Ni-richspinels, and/or geochemical anomalies (such as the famous positive anomalyin Iridium and in other Platinum group elements).
The study of Phanerozoic ejecta, especially at the Cretaceous-Tertiary(KT) boundary, demonstrates that rounded millimetre-sized spherules con-stitute the type of ejecta by far easiest to recognize in the field. The spherulesoriginate by the melting or vaporization of the target-rock and of part of theprojectile. They condense or quench in flight, inside or outside the upperatmosphere, before landing back at distal sites from the impact point. Thespherules are usually rounded but other aerodynamically shaped morphol-ogies such as elongated, teardrops or dumbbells are also frequent. Smit et al.(1992) and Smit (1999) have discussed in detail the characteristics and geo-graphic distribution of the different types of spherules occurring in the KTboundary layer. Two kinds of spherules are classically distinguished: (a)spherules containing crystallites of clinopyroxene, spinels and olivine andcalled microkrystites (Glass and Burns, 1988); they most likely condensed out
233ENVIRONMENTAL CONTEXT
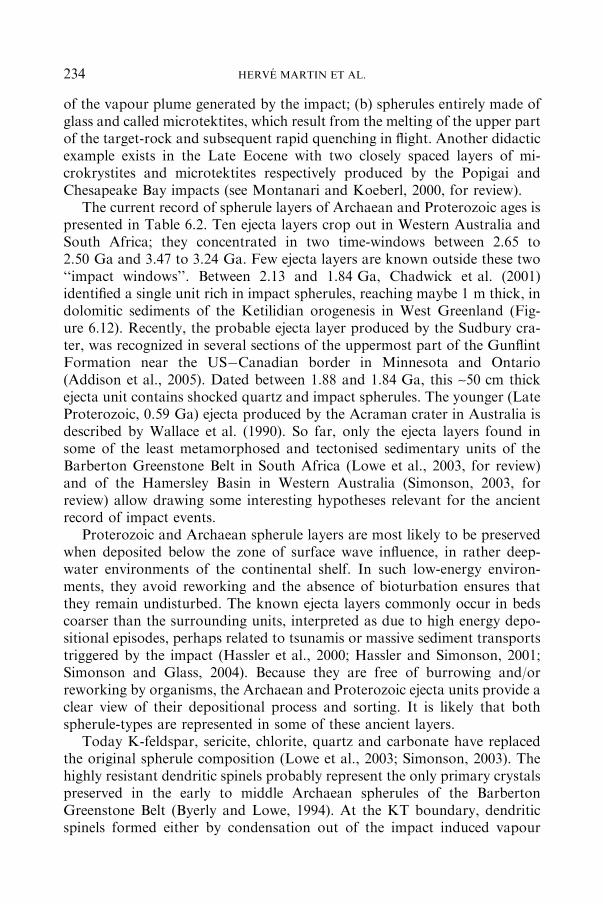
of the vapour plume generated by the impact; (b) spherules entirely made ofglass and called microtektites, which result from the melting of the upper partof the target-rock and subsequent rapid quenching in flight. Another didacticexample exists in the Late Eocene with two closely spaced layers of mi-crokrystites and microtektites respectively produced by the Popigai andChesapeake Bay impacts (see Montanari and Koeberl, 2000, for review).
The current record of spherule layers of Archaean and Proterozoic ages ispresented in Table 6.2. Ten ejecta layers crop out in Western Australia andSouth Africa; they concentrated in two time-windows between 2.65 to2.50 Ga and 3.47 to 3.24 Ga. Few ejecta layers are known outside these two‘‘impact windows’’. Between 2.13 and 1.84 Ga, Chadwick et al. (2001)identified a single unit rich in impact spherules, reaching maybe 1 m thick, indolomitic sediments of the Ketilidian orogenesis in West Greenland (Fig-ure 6.12). Recently, the probable ejecta layer produced by the Sudbury cra-ter, was recognized in several sections of the uppermost part of the GunflintFormation near the US�Canadian border in Minnesota and Ontario(Addison et al., 2005). Dated between 1.88 and 1.84 Ga, this ~50 cm thickejecta unit contains shocked quartz and impact spherules. The younger (LateProterozoic, 0.59 Ga) ejecta produced by the Acraman crater in Australia isdescribed by Wallace et al. (1990). So far, only the ejecta layers found insome of the least metamorphosed and tectonised sedimentary units of theBarberton Greenstone Belt in South Africa (Lowe et al., 2003, for review)and of the Hamersley Basin in Western Australia (Simonson, 2003, forreview) allow drawing some interesting hypotheses relevant for the ancientrecord of impact events.
Proterozoic and Archaean spherule layers are most likely to be preservedwhen deposited below the zone of surface wave influence, in rather deep-water environments of the continental shelf. In such low-energy environ-ments, they avoid reworking and the absence of bioturbation ensures thatthey remain undisturbed. The known ejecta layers commonly occur in bedscoarser than the surrounding units, interpreted as due to high energy depo-sitional episodes, perhaps related to tsunamis or massive sediment transportstriggered by the impact (Hassler et al., 2000; Hassler and Simonson, 2001;Simonson and Glass, 2004). Because they are free of burrowing and/orreworking by organisms, the Archaean and Proterozoic ejecta units provide aclear view of their depositional process and sorting. It is likely that bothspherule-types are represented in some of these ancient layers.
Today K-feldspar, sericite, chlorite, quartz and carbonate have replacedthe original spherule composition (Lowe et al., 2003; Simonson, 2003). Thehighly resistant dendritic spinels probably represent the only primary crystalspreserved in the early to middle Archaean spherules of the BarbertonGreenstone Belt (Byerly and Lowe, 1994). At the KT boundary, dendriticspinels formed either by condensation out of the impact induced vapour
234 HERVE MARTIN ET AL.

TABLE
6.2
Main
spherule
layersrecorded
inArchaeanandProterozoic
terrains,Modified
after
Sim
onsonandGlass
(2004)
Layer
Location
Form
ation
Age
(Ga)
Lateral
extend
(km)
Layer
thickness
(cm)
Accumulation
spherules
(cm)
Spherule
size
(mm)
Ir (ppb)
Acraman
South
Australia,Adelaide
Geosyncline,
OfficerBasin
Bunyeroo,Roddabeds
0.59
700
0�4
0Traces
1.0
2.0
Sudbury
OntarioMinnesota
Gunflint-Roveboundary
Biwabik-V
irginia
boundary
1.84�1
.88
260
25�7
0?
?n.d
n.n
SouthernGreenland
Vallen
Group,Graensesø
2.13�1
.85
26*
100
20
1.4
<DL
n.n
Western
Australia
Hamersley
basin
DalesGorgeMem
ber
ofBrockman
2.48
135
30
6.0
2.1
19.9
n.n
Western
AustraliaHamersley
basin
Wittenoom
2.54
330
10�1
00
3.5
1.1
0.43
n.n
South
AfricaGriqualandWestbasin
Reivilo
2.56?
25
2�2
01.8
1.3
n.d
n.n
Western
AustraliaHamersley
basin
Carawine**
2.63?
75
940�2
470
30.0
2.3
1.54
n.n
Western
AustraliaHamersley
basin
Jeerinah**
2.63
160
0.3�2
80
7.0
2.0
11.4
n.n
South
AfricaGriqualandWestbasin
Monteville**
2.60�2
.63
230
55
5.0
1.6
6.4
S4
South
Africa,Barbertonbelt
Mapepe
3.24
Single
outcrop
15
7.5
1.6
450
S3
South
Africa,Barbertonbelt
MapepeandUnlundi
3.24
30
15�2
00
10.0
4.0
725
S2
South
Africa,Barbertonbelt
Mapepe
3.26
12
20�3
10
10
2.5
3.9
S1
South
Africa,Barbertonbelt
Hooggenoeg
3.47
25
10�3
55.0
1.0
3.0
Pilbara
cratonWestern
Australia
Apex
Basalt**
1110
7.5
0.8
n.d
235ENVIRONMENTAL CONTEXT
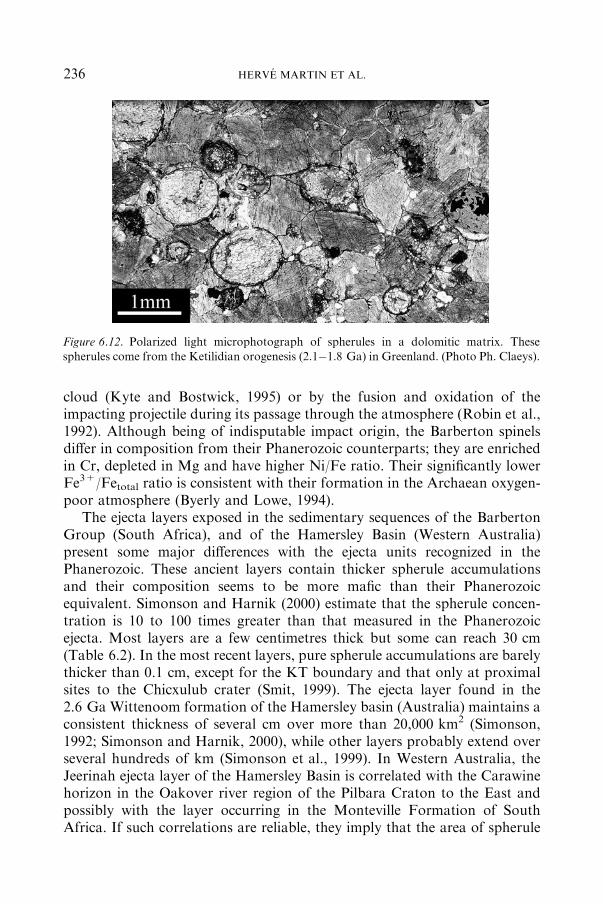
cloud (Kyte and Bostwick, 1995) or by the fusion and oxidation of theimpacting projectile during its passage through the atmosphere (Robin et al.,1992). Although being of indisputable impact origin, the Barberton spinelsdiffer in composition from their Phanerozoic counterparts; they are enrichedin Cr, depleted in Mg and have higher Ni/Fe ratio. Their significantly lowerFe3+/Fetotal ratio is consistent with their formation in the Archaean oxygen-poor atmosphere (Byerly and Lowe, 1994).
The ejecta layers exposed in the sedimentary sequences of the BarbertonGroup (South Africa), and of the Hamersley Basin (Western Australia)present some major differences with the ejecta units recognized in thePhanerozoic. These ancient layers contain thicker spherule accumulationsand their composition seems to be more mafic than their Phanerozoicequivalent. Simonson and Harnik (2000) estimate that the spherule concen-tration is 10 to 100 times greater than that measured in the Phanerozoicejecta. Most layers are a few centimetres thick but some can reach 30 cm(Table 6.2). In the most recent layers, pure spherule accumulations are barelythicker than 0.1 cm, except for the KT boundary and that only at proximalsites to the Chicxulub crater (Smit, 1999). The ejecta layer found in the2.6 Ga Wittenoom formation of the Hamersley basin (Australia) maintains aconsistent thickness of several cm over more than 20,000 km2 (Simonson,1992; Simonson and Harnik, 2000), while other layers probably extend overseveral hundreds of km (Simonson et al., 1999). In Western Australia, theJeerinah ejecta layer of the Hamersley Basin is correlated with the Carawinehorizon in the Oakover river region of the Pilbara Craton to the East andpossibly with the layer occurring in the Monteville Formation of SouthAfrica. If such correlations are reliable, they imply that the area of spherule
Figure 6.12. Polarized light microphotograph of spherules in a dolomitic matrix. These
spherules come from the Ketilidian orogenesis (2.1�1.8 Ga) in Greenland. (Photo Ph. Claeys).
236 HERVE MARTIN ET AL.
distribution was greater than 32,000 km2 (Simonson et al., 1999; Rasmussenand Koeberl, 2004; Simonson and Glass, 2004). The possibility of a globaldistribution of these ejecta debris certainly deserves to be considered. Basedon the Phanerozoic record, a crater of ~100 km in diameter is probablycapable of spreading ejecta worldwide. The location of their source craters isof course unknown, but based on the spherule accumulation and consistencyover important distance, Simonson et al. (199) interpreted them as ratherdistal (deposited >5 crater radii) ejecta layers.
The size of these ancient spherules ranges between 1 and 4 millimetres.Meteoritic contamination of these layers is generally quite significant (Loweet al., 2003). The reported Iridium concentrations range from a few ppb(equivalent to most KT boundary sites) up to values of 725 ppb for one ofthe Barberton layers (Table 6.2). Chromium isotopes (53Cr/52Cr) indicatethat the projectile responsible for the formation of the Carawine and Jeerinahspherules likely corresponded to an ordinary chondrite, while the S4, S3, andS2 layers were probably formed by the fall of carbonaceous chondrites(Shukolyukov et al., 2000; Shukolyukov et al., 2002; Kyte et al., 2003).
Based on texture and overall composition, the Archaean and Proterozoicspherules were probably originally basaltic. Due to secondary replacement, itis difficult to estimate their primary composition. However, it appears that inmany spherules, the replacement occurred with (some) preservation of theoriginal texture. The K-feldspar crystals commonly display a typical elon-gated and fibrous lath-shaped morphology that resembles that formed by therapid cooling of basaltic glasses (Simonson and Harnik, 2000). In otherspherules now containing calcite, quartz or chlorite pseudomorphs, quenchedand devitrification textures can still be recognized along with botroydalshapes and flow-bands (Simonson, 2003). Phanerozoic spherules are mostcommonly replaced by smectite and their chemistry rather reflects the com-position of the continental crust. So far, only one sample of the Jeerinah layerin Western Australia contains shocked quartz grains (Rasmussen and Koe-berl, 2004). The mafic character of the Archaean and Proterozoic spherules,combined with the scarcity of shocked quartz has been interpreted as theresult of impacts on the oceanic crust (Lowe et al., 2003; Simonson, 2003).Oceanic impacts are further substantiated by the occurrence of manyspherules in high-energy sedimentary units that could be caused by a majordisturbance of the water masses during deposition (Hassler and Simonson,2001; Lowe et al., 2003; Simonson et al., 2004). The dominance of oceanicimpacts agrees with the suggestion that before 2.5 Ga the volume of oceaniccrust was more important than the present-day 60% (McCulloch and Ben-nett, 1994). In the Phanerozoic oceanic impacts are rare, mafic ejecta isexceptional, and so far no crater is known to have excavated the oceanic crust(Dypvik et al., 2003). The apparently common cratering of the oceanic crust
237ENVIRONMENTAL CONTEXT

in the Archaean and Proterozoic may be explained either by very largeprojectiles or by much shallower oceans than in the Phanerozoic, or both.
It thus seems likely that collisions the size of the KT event, or even sig-nificantly bigger, took place during two distinct intervals between 3.47 to3.24 Ga and 2.65 to 2.5 Ga. The thickness of the ejecta, � if indeed they aredistal layers �, the rather large dimension of spherule, and mass balanceestimations based on the concentration of Ir and extraterrestrial Cr, �assuming the global distribution of the ejecta �, all these evidences indicatethat the projectiles responsible for the formation the S2, S3, S4 Barbertonimpact layers varied between 20 and 50 km in diameter (Lowe et al., 2003).These sizes imply the formation of craters between 400 and 1000 km indiameter, quite bigger than Chicxulub, Sudbury or Vredefort. Simonsonet al. (1999) also advocates that large projectiles, KT equivalent or more,formed some of the younger impact layers identified in Western Australia.
The clustering of spherule layers between 3.47 to 3.24 Ga and 2.65 to2.5 Ga might be due to the coincidental preservation of two exceptionalperiods marked by a higher delivery rate of large impactors. It could also beinterpreted as evidence that the whole Archaean and Early Proterozoicperiod was marked by a high flux of projectiles on Earth. The latter iscompatible with the dating of lunar spherules that documents a progressivedecrease in the collision frequency, after the end of the Late Heavy Bom-bardment 3.8 Ga ago (Culler et al., 2000, see discussion in Claeys, chapter4.5). Glikson (2001) speculated that the Barberton dense spherule recordcoincides with a possible spike of impacts on the Moon around 3.2 Ga. Theseimpacts could have influenced the evolution of early life, affected the oceans/atmosphere system or even modified the plate tectonic regime. Large oceanicimpact could evaporate part of the ocean, and/or the associated disturbancecould contribute to the mixing of a strongly stratified ocean increasing theexchange of nutriment-rich waters (Lowe et al., 2003). Glikson (1999; 2001)has speculated that they also lead to crustal deformation, rifting, fracturingof the crust, massive volcanism and uplift. The on-going searches for ejectadeposits at other stratigraphic levels in the Archaean and the Proterozoicshould provide answers to some of these questions.
6.3.2. THE PALEOPROTEROZOIC GLACIATIONS, THE FIRST SNOWBALL EARTH
The first evidence for possible mid-latitude glaciations occurs in the dia-mictite of the Pongola Supergroup in South Africa, which is dated at about2.9 Ga (Young et al., 1998; Nhleko, 2004) unfortunately few studies havebeen devoted to them. Between 2.45 and 2.22 Ga, three episodes of glacia-tions are recorded in the Huronian Supergroup of Canada (Hilburn et al.,2005). From oldest to youngest, diamictite deposits are present in the Ramsey
238 HERVE MARTIN ET AL.
Lake, the Bruce and the Gowganda Formations. The precise ages of theseevents remain poorly constrained. The Nipissing diabase, dated at 2.22 Ga,crosscuts the entire Huronian sequence. Therefore, the Gowganda diamictitemust be older than 2.2 Ga, as it is covered by km-thick sediments belongingto the Lorrain, Gordon Lake and Bar River Formations (Kopp et al., 2005).Based on the existing paleomagnetic data, the latitudinal extension of thethree Huronian glacial deposits cannot be defined (Kopp et al., 2005). At thispoint, it is thus difficult to compare them with the Late Proterozoic glacia-tions, which probably covered the whole planet leading to the concept ofSnowball Earth (Hoffman et al., 1998). Moreover, the Huronian glacialsediments do not seem to be covered by warm water carbonates (the so-calledcap carbonates) (Kopp et al., 2005), which in the Late Proterozoic areindicative of an abrupt transition to much warmer climates.
Recent isotopic dates and new correlations indicate that the glacialdeposits occurring in the Transvaal Supergroup of South Africa probablypostdate the Huronian diamictites (Kopp et al., 2005). The Bosheok dia-mictite cropping out in the eastern part of the Transvaal region probablycorrelates with the Makganyene diamictite deposited in the Griqualand re-gion, to the west of the Transvaal Basin. A Re-Os age of 2.3 Ga has beenestablished for the Timeball Hill formation that is found below the Boshoekdiamictite (Hannah et al., 2004). The Makganyene glacial deposits are in-terfingered with the Ongeluk marine basalt. The latter correlates with itssubaerial equivalent the Hekpoort volcanics, which contains zircons, dated at2.2 Ga (Cornell et al., 1996). Paleomagnetic data acquired on the Ongelukbasalts imply that the Makganyene glacial unit was deposited at tropicallatitude, around 11�±5� (Evans et al., 1997). Based on this stratigraphy andlow latitude occurrence, Kopp et al., (2005) advocated that the Makganyeneevent represents the oldest evidence for global glaciation, in other words, thefirst case of a Snowball Earth in the history of the planet.
The origin of oxygen producing cyanobacteria remains a major topic ofdiscussion (see part 7.1). Several organic Biomarkers, traces of microfossils �considered by some authors as controversial �, the presence of stromatolitesand isotopic fractionation, which origin has been debated, have widely beenused as indicators of oxygen production by organisms since 2.8 Ga or even asearly as 3.7 Ga (see Brocks et al., 1999; Des Marais, 2000; Catling et al.,2001; Brasier et al., 2002; Brocks et al., 2003a; Rosing and Frei, 2004).However, the significant mass independent fractionation of sulphur isotopesdetected only in Archaean and Palaeoproterozoic sulphides supports anatmospheric oxygenation taking place only 2.5�2.2 Ga ago (Farquhar et al.,2002; Farquhar and Wing, 2003). The presence of only a few percent ofoxygen in the lower atmosphere would hamper the penetration of the light ofwavelength under 200 nm responsible for the photolysis of SO2 to S, whichresults in the fractionation of S isotopes (Farquhar et al., 2001).
239ENVIRONMENTAL CONTEXT
The presence of thick red beds, lateritic paleosols and major Mn depositsindicative of oxygen conditions occurs immediately below or above theMakganyene glacial deposits. This succession let Knopp et al., (2005) topropose that O2-producing cyanobacteria appeared just before the Makg-anyene glaciation, between 2.3 and 2.2 Ga. The active oxygenic photosyn-thesis would have induced the rapid collapse of the pre-existing methanegreenhouse leading to a Snowball event on a time scale of ~1 Ma (Koppet al., 2005).
References
Addison, W. D., Brumpton, G. R., Vallini, D. A., McNaughton, N. J., Davis, D. W., Kissin,S. A., Fralick, P. W. and Hammond, A. L.: 2005, Geology 33(3), 193�196.
Albarede, F.: 1998, Tectonophysics 296, 1�14.Albarede, F.: 2005, in M. Gargaud, P. Claeys and H. Martin (eds.), Des atomes aux planetes
habitables, Presses Universitaires de Bordeaux, Bordeaux, pp. 79�102.Anbar, A. D. and Knoll, A. H.: 2002, Science 297, 1137�1141.
Appel, P. W. U., Rollinson, H. R. and Touret, J. L. R.: 2001, Precambrian Res. 112, 27�49.Baraffe, I., Chabrier, G., Allard, F. and Hauschildt, P. H.: 1998, Astron. Astrophys. 337, 403.Beaumont, V. and Robert, F.: 1999, Precambrian Res. 96(1�2), 63�82.
Bekker, A., Holland, H. D., Wang, P.-L., Rumble III, D., Stein, H. J., Hannah, J. L., Coetzee,L. L. and Beukes, N. J.: 2004, Nature 427, 117�120.
Berner, R. A., Beerling, D. J., Dudley, R., Robinson, J. M. and Wildman, R. A. Jr: 2003, Ann.
Rev. Earth Planetary Sci. 31, 105�134.Bischoff, J. L. and Dickson, F. W.: 1975, Earth Planetary Sci. Lett. 25, 385�397.Bischoff, J. L. and Rosenbauer, R. J.: 1988, Geochim. Cosmochim. Acta 52, 2121�212.Bourdon, E., Eissen, J.-P., Gutscher, M.-A., Monzier, M., Hall, M. L. and Cotten, J.: 2003,
Earth Planetary Sci. Lett. 205(3�4), 123�138.Bourrouilh, R.: 2001, in M. Gargaud, D. Despois and J.-P. Parisot (eds.), Evolution paralleles
de la Terr et de la Vie. L�environnement de la Terre primitive, Presses Universitaires de
Bordeaux, Bordeaux, pp. 287�320.Brasier, M. D., Green, O. R., Jephcoat, A. P., Kleppe, A. K., Van Kranendonk, M. J.,
Lindsay, J. F., Steele, A. and Grassineau, N. V.: 2002, Nature 416, 76�81.
Brocks, J. J., Buick, R., Logan, G. A. and Summons, R. E.: 2003a, Geochemica et Cosm-ochemica Acta 67, 4289�4319.
Brocks, J. J., Logan, G. A., Buick, R. and Summons, R. E.: 1999, Science 285, 1033�1036.
Brocks, J. J., Buick, R., Summons, R. E. and Logan, G. A.: 2003, Geochimica et CosmochimicaActa 67(22), 4321�4335.
Brown, G. C.: 1985, in N. Snelling (ed.), The Chronology of the Geological Record, Memoir -Geological Society of London, London, pp. 326�334.
Buick, R.: 1992, Nature 255, 74�77.Byerly, G. R. and Lowe, D. R.: 1994, Geochemica et Cosmochemica Acta 58(16), 3469�3486.Canfield, D. E. and Teske, A.: 1996, Nature 382, 127�132.
Catling, D. C. and Claire, M. W.: 2005, Earth Planetary Sci. Lett. 237, 1�20.Catling, D. C., Zahnle, K. J. and McKay, C. P.: 2001, Science 293, 839�843.Chadwick, B., Claeys, P. and Simonson, B.: 2001, J. Geol. Soc. London 158, 331�340.
Channer, D. M. D. R., de Ronde, C. E. J. and Spooner, E. T. C.: 1997, Earth Planetary Sci.Lett. 150, 325�335.
240 HERVE MARTIN ET AL.

Commeyras, A., Taillades, J., Collet, H., Boiteau, L., Vandenabeele-Trambouze, O., Pascal,R., Rousset, A., Garrel, L., Rossi, J., Biron, J., Lagrille, O., Plasson, R., Souaid, E.,
Danger, G., Selsis, F., Dobrijevic, M. and Martin, H.: 2004, Origins Life Evol. Biosphere34, 35�55.
Condie, K. C.: 1989. Plate Tectonics and Crustal Evolution, Pergamon, Oxford, 476 pp.
Condie, K. C.: 1998, Earth Planetary Sci. Lett. 163(1�4), 97�108.Cornell, D. H., Schutte, S. S. and Elington, B. L.: 1996, Precambrian Res. 79, 101�123.Cowen, R.: 2005, The History of Life, 4th edn. Blackwell Scientific, 324 pp.Culler, T. S., Becker, T. A., Muller, R. A. and Renne, P. R.: 2000, Science 287, 1785�1788.
de Ronde, C. E. J., Channer, D. M. d., Faure, K., Bray, C. J. and Spooner, T. C.: 1997,Geochimica and Cosmochimica Acta 61(19), 4025�4042.
Delano, J. W.: 2001, Origins Life Evol. Biosphere 31(4�5), 311�341.
Des Marais, D. J.: 2000, Science 289, 1703�1705.Des Marais, D. J., Strauss, H., Summons, R. E. and Hayes, J. M.: 1992, Nature 359, 605�609.Dypvik, H., Burchell, M. J. and Claeys, P.: 2003, in H. Dypvik, M. J. Burchell and P. Claeys
(eds.), Cratering in Marine Environments and on Ice, Springer, Berlin, pp. 1�19.Beukes, N. J. and Kirschvink, J. L.: 1997, Nature 386, 262�266.Farquhar, J., Bao, H. M. and Thiemens, M.: 2000, Science 289(5480), 756�758.
Farquhar, J., Savarino, J., Airieau, S. and Thiemens, M. H.: 2001, J. Geophys. Res. Planets106(E12), 32829�32839.
Farquhar, J. and Wing, B. A.: 2003, Earth Planetary Sci. Lett. 213, 1�13.Farquhar, J., Wing, B. A., McKeegan, K. D., Harris, J. W., Cartigny, P. and Thiemens, M.
H.: 2002, Science 298, 2369�2372.Foriel, J., Philippot, P., Rey, P., Somogyi, A., Banks, D. and Menez, B.: 2004, Earth Planetary
Sci. Lett. 228, 451�463.
Frape, S. K., Blyth, A., Blomqvist, R. and McNutt, R. H.: 2003, in J. I. Drever (ed.), Deepfluids in the continents: II Crystalline rocks. The Oceans and Marine Geochemistry. Treatiseof Geochemistry, Elsevier-Pergamon, Oxford, pp. 541�580.
Fritz, P. and Frape, S.K. (eds.), 1987. Saline Water and Gases in Crystalline Rocks. GACSpecial Paper, 33, Geological Association of Canada, Ottawa, 259 pp.
Gladman, B., Dones, L., Levison, H. F. and Burns, J. A.: 2005, Astrobiology 5(4), 483�496.
Glass, B. P. and Burns, C. A.: 1988, Proc. Lunar Planetary Sci. Conf., 455�458.Glikson, A. Y.: 1999, Geology 27(5), 387�390.Glikson, A. Y.: 2001, J. Geodynamics 32(1�2), 205�229.Gomes, R., Levison, H. F., Tsiganis, K. and Morbidelli, A.: 2005, Nature 435, 466�469.
Gordon, R. M., Martin, J. H. and Knauer, G. A.: 1982, Nature 299, 611�612.Gorman, B. E., Pearce, T. H. and Birkett, T. C.: 1978, Precambrian Res. 6, 23�41.Gough, D. O.: 1981, Solar Phys. 74, 21�34.
Graedel, T. E. and Keene, W. C.: 1996, Pure Appl. Chem. 68, 1689�1697.Gutscher, M.-A., Maury, F., Eissen, J.-P. and Bourdon, E.: 2000, Geology 28(6), 535�538.Gutzmer, J., Banks, D., Luders, V., Hoefs, J., Beukes, N. J. and von Bezing, K. L.: 2003,
Chem. Geol. 201, 37�53.Gutzmer, J., Pack, A., Luders, V., Wilkinson, J.-J., Beukes, N. J. and van Niekerk, H. S.:
2001, Contrib. Mineral. Petrol. 142, 27�42.Hanna, J. L., Bekker, A., Stein, H. J. J., Markey, R. J. and Holland, H. D.: 2004, Earth
Planetary Sci. Lett. 225, 43�52.Hassler, S. W., Robey, H. F. and Simonson, B.: 2000, Sedimentary Geol. 135, 283�294.Hassler, S. W. and Simonson, B. M.: 2001, J. Geol. 109.
Hilburn, I. A. L. J., Kirschvink, J. L. E. T., Tada, R., Hamano, Y. and Yamamoto, S.: 2005,Earth Planetary Sci. Lett. 232(3�4), 315�332.
241ENVIRONMENTAL CONTEXT

Hoffman, P. F., Kaufman, A. J., Halverson, G. P. and Schrag, D. P.: 1998, Science 281,1342�1346.
Holland, H. D.: 1984. The Chemical Evolution of the Atmosphere and Oceans, Princeton Seriesin Geochemistry. Princeton University Press, Princeton, 582 pp.
Holland, H. D. 1994, in S. Bengston (ed.), Early Life on Earth. Columbia University Press,
New York, pp. 237�244.Holland, H. D.: 1999, The Geochemical News 100, 20�22.Holland, H. D.: 2002, Geochimica et Cosmochimica Acta 66(21), 3811�3826.Holland, H. D.: 2003, in H. D. Holland and K. K. Turekian (eds.), The Oceans and Marine
Geochemistry. Treatise of Geochemistry, Elsevier-Pergamon, Oxford, pp. 583�625.Horibe, Y., Endo, K. and Tsubota, H.: 1974, Earth Planetary Sci. Lett. 23(1), 136�140.Isley, A. E.: 1995, J. Geol. 103, 169�185.
Johnson, N. M. and Fegley, B. Jr.: 2002, Adv. Space Res. 29, 2333�241.Kamber, B. S. and Webb, G. E.: 2001, Geochimica et Cosmochimica Acta 65, 2509�2525.Karhu, J. A. and Holland, H. D.: 1996, Geology 24, 867�870.
Kasting, J. F.: 1993, Earth�s Early Atmosphere 259, 920�926.Kasting, J. F.: 2005, Precambrian Res. 137, 119�129.Kasting, J. F., Eggler, D. H. and Raeburn, S. P.: 1993, J. Geol. 101, 245�257.
Knauth, L. P.: 1998, Nature 395, 554�555.Knauth, L. P.: 2005, Palaeogeogr. Palaeoclimatol. Palaeoecol. 219(1�2), 53�69.Knauth, L. P. and Lowe, D. R.: 1978, J. Geol. 41, 209�222.Knauth, L. P. and Lowe, D. R.: 2003, Geol. Soc. Am. Bull. 115(5), 566�580.
Knoll, A. H.: 2003, Deobiology 1, 3�14.Konkauser, K. O., Hamade, T., Morris, R. C., Ferris, G. F., Southam, G. and Canfield, D. E.:
2002, Geology 30, 1079�1082.
Kopp, R. E., Kirschvink, J. L., Hilburn, I. A. and Nash, C. Z.: 2005, Proc. Nat. Acad. Sci.102, 11131�11136.
Krauskopf, K. B. and Bird, D. K.: 1995. Introduction to Geochemistry, McGraw-Hill, New
York, 647 pp.Kress, M. E. and McKay, C. P.: 2004, Icarus 168(2), 475�483.Kyte, F. T., Shukolyukov, A., Lugmair, G. W., Lowe, D. R. and Byerly, G. R.: 2003, Geology
31, 283�286.Kyte, F. T. and Bostwick, J. A.: 1995, Earth Planetary Sci. Lett. 132(1�4), 113�127.Li, Z.-X. A. and Lee, C.-T. A.: 2004, Earth Planetary Sci. Lett. 228, 483�493.Libourel, G., Marty, B. and Humbert, F.: 2003, Geochimica et Cosmochimica Acta 67,
4123�4135.Lowe, D. R. and Byerly, G. R.: 2003, Geology 31(10), 909�912.Lowe, D. R., Byerly, G. R., Kyte, F. T., Shukolyukov, A., Asaro, F. and Krull, A.: 2003,
Astrobiology 3(1), 7�48.Maher, K. A. and Stevenson, D. J.: 1988, Nature 331, 612�614.Martin, H.: 1986, Geology 14, 753�756.
Martin, H.: 1999, Lithos 46(3), 411�429.Martin, H. and Moyen, J.-F.: 2002, Geology 30(4), 319�322.Martin, H., Smithies, R. H., Rapp, R., Moyen, J.-F. and Champion, D.: 2005, Lithos 79(1�2),
1�24.
Marty, B. and Dauphas, N.: 2003, Earth Planetary Sci. Lett. 206, 397�410.McCulloch, M. T. and Bennet, V. C.: 1993, Lithos 30, 237�255.McCulloch, M. T. and Bennett, V. C.: 1994, Geochimica and Cosmochimica Acta 58,
4717�4738.
242 HERVE MARTIN ET AL.

Melezhik, V. A., Fallick, A. E., Hanski, E. J., Kump, L. R., Lepland, A., Prav, A. R. andStrauss, H.: 2005, Geol. Soc. Am. Today 15(11), 4�11.
Mojzsis, S. J., Coath, C. D., Greenwood, J. P., McKeegan, K. D. and Harrison, T. M.: 2003,Geochimica et Cosmochimica Acta 67, 1635�1658.
Montanari, A. and Koeberl, C.: 2000. Impact Stratigraphy Lecture Notes in Earth Sciences, 93,
Springer Verlag, Berlin, 364 pp.Moyen, J.-F., Jayananda, M., Nedelec, A., Martin, H., Mahabaleswar, B. and Auvray, B.:
2003, J. Geol. Soc. India 62, 753�758.Moyen, J.-F., Martin, H. and Jayananda, M.: 1997, Compte Rendus de l�Academie des Sci-
ences de Paris 325, 659�664.Navarro-Gonzalez, R., McKay, C. P. and Nna Mvondo, D.: 2001, Nature 412, 61�64.Nhleko, N.: 2004, The Pongola Supergroup in Swaziland. Rand Afrikaans University.
Nijman, W., de Bruijne, K. C. H. and Valkering, M. E.: 1998, Precambrian Res. 88(1�4),25�52.
Nisbet, E. G., Cheadle, M. J., Arndt, N. T. and Bickle, M. J.: 1993, Lithos 30, 291�307.
Nisbet, E. G. and Fowler, C. M. R.: 2003, in W. H. Schlesinger (ed.), Biogeochemistry.Treatise of Geochemistry, Elsevier-Pergamon, Oxford, pp. 1�61.
Nisbet, E. G. and Sleep, N. H.: 2001, Nature 409, 1083�1091.
Oberbeck, V. and Fogelman, G.: 1989, Nature 339, 434.Pavlov, A. A., Hurtgen, M. T., Kasting, J. F. and Arthur, M. A.: 2003, Geology 31, 87�90.Pavlov, A. A. and Kasting, J. F.: 2002, Astrobiology 2(1), 27�41.Pavlov, A. A., Kasting, J. F., Brown, L. L., Rages, K. A. and Freedman, R.: 2000, J. Geophys.
Res. 105, 11981�11990.Peltier, W. R., Butler, S. and Solheim, L. P.: 1997, in D. J. Grossley (ed.), Earth�s Deep
Interior, Gordon and Breach, Amsterdam, pp. 405�430.
Pinti, D. L.: 2005, in M. Gargaud, B. Barbier, H. Martin and J. Reisse (eds.), Lectures inAstrobiology. Advances in Astrobiology and Biogeophysics, Springer-Verlag, Berlin, pp.83�107.
Pinti, D. L., Hashizume, K. and Matsuda, J.: 2001, Geochimica et Cosmochimica Acta 65(14),2301�2315.
Pinti, D. L., Hashizume, K., Philippot, P., Foriel, J. and Rey, P.: 2003, Geochimica et Cos-
mochimica Acta, A287.Rapp, R. P., Shimizu, N. and Norman, M. D.: 2003, Nature 425, 605�609.Rapp, R. P., Shimizu, N., Norman, M. D. and Applegate, G. S.: 1999, Chem. Geol. 160,
335�356.
Rasmussen, B. and Koeberl, C.: 2004, Geology 32, 1029�1032.Ribas, I., Guinan, E. F., Gudel, M. and Audard, M.: 2005, The Astrophis J. 622(1), 680�694.Robin, E., Bonte, P., Froget, L., Jehanno, C. and Rocchia, R.: 1992, Earth Planetary Sci. Lett.
108, 181�190.Roedder, E.: 1984. Fluid Inclusions, Rewiews in Mineralogy 12., Mineralogical Society of
America.
Rosing, M. T.: 1999, Science 283, 674�676.Rosing, M. T. and Frei, R.: 2004, Earth Planetary Sci. Lett. 217, 237�244.Rouxel, O. J., Bekker, A. and Edwards, K. J.: 2005, Science 307, 1088�1091.Rye, R. and Holland, H. D.: 1998, Am. J. Sci. 298, 621�672.
Sagan, C. and Mullen, G.: 1972, Science 177, 52�56.Samaniego, P., Martin, H., Robin, C. and Monzier, M.: 2002, Geology 30(11), 967�970.Samaniego, P., Martin, H., Robin, C., Monzier, M. and Cotten, J.: 2005, J. Petrol. 46,
2225�2252.
243ENVIRONMENTAL CONTEXT
Selsis, F.: 2000, Evolution of the atmosphere of terrestrial planets. From early Earth atmo-sphere to extrasolar planets. Ph. D. Thesis, University of Bordeaux.
Selsis, F.: 2002, Occurrence and detectability of O2-rich atmosphere in circumstellar ‘‘habit-able zones’’. ASP 269: The Evolving Sun and its Influence on Planetary Environments.
Selsis, F.: 2004. The Prebiotic Atmosphere of the Earth., Astrobiology, Future Perspective,
Kluwer, Astrophysics and Space Science Library.Schrag, D. P., Berner, R. A., Hoffman, P. F. and Halverson, G. P.: 2002. Geochem. Geophys.
Geosyst., 3(6), doi: 10.1029/2001GC000219.Shen, Y. and Buick, R.: 2004, Earth-Sci. Rev. 64(3�4), 243�272.
Shen, Y., Pinti, D. L. and Hahsizume, K.: 2006, in K. Benn, J.-C. Mareschal and K. Condie(eds.), Archean Geodynamics and Environments. AGU Geophysical Monograph, AmericanGeophysical Union, Washington, DC, Vol 164, pp. 305�320.
Shirey, S. B. and Hanson, G. N.: 1984, Nature 310, 222�224.Shukolyukov, A., Castillo, P. and Simonson, B. W. L. G., 2002. Chromium in Late Archean
spherule layers from Hamersley basin, Western Australia; isotopic evidence for extrater-
restrial component, Lunar and Planetary Science Conference, Houston, Texas, pp. 1369(abstract).
Shukolyukov, A., Kyte, F. T., Lugmair, G. W., Lowe, D. R. and Byerly, G. R.: 2000, in I.
Gilmour and C. Koeberl (eds.), Impacts and the Early Earth, Springer, Berlin, pp. 99�115.Simonson, B.: 2003, Astrobiology 3(1), 49�65.Simonson, B., Hassler, S. W., Smit, J. and Summer, D.: 2004, How Many Late Archean
Impacts are Recorded in the Hamersley Basin of Western Australia, Lunar and Planetary
Science, Houston Texas, pp. CD-ROM 1718 [Abstract].Simonson, B. M.: 1992, Geol. Soc. Am. Bull. 104, 829�839.Simonson, B. M. and Glass, B. P.: 2004, Ann. Rev. Earth Planet Sci. 32, 329�361.
Simonson, B. M. and Harnik, P.: 2000, Geology 28(11), 975�978.Simonson, B. M., Hassler, S. W. and Beukes, N. J.: 1999, Late Archean impact spherule layer
in South Africa that may correlate with a Western Australian layer. Geological Society of
America, Special paper 339.Sleep, B. E. and McClure, P. D.: 2001, J. Contam. Hydrol. 50(1�2), 21�40.Sleep, N. H., Meibom, A., Fridriksson, T., Coleman, R. G. and Bird, D. K.: 2004, Proc. Nat.
Acad. Sci. 101(35), 12818�12823.Sleep, N. H. and Zahnle, K.: 2001a, J. Geophys. Res. Planets 106(E1), 1373�1399.Sleep, N. H., Zahnle, K. and Neuhoff, P. S.: 2001, Proc. Nat. Acad. Sci. USA 98(7),
3666�3672.
Sleep, N. H. and Zahnle, K. J.: 2001b, J. Geophys. Res. 106, 1373�1400.Smit, J.: 1999, Ann. Rev. Earth Planetary Sci. 27, 75�113.Smit, J., Alvarez, W., Montanari, A., Swinburne, N., Van Kempen, T. M., Klaver, G. T. and
Lustenhouwer, W. J.: 1992, Proc. Lunar Planetary Sci. 22, 87�100.Smithies, R. H.: 2000, Earth Planetary Sci. Lett. 182, 115�125.Stein, M. and Hofmann, A. W.: 1994, Nature 372, 63�68.
Svetov, S. A., Svetova, A. I. and Huhma, H.: 2001, Geochem. Int. 39, 24�38.Tian, F., Toon, O. B., Pavlov, A. A. and De Sterck, H.: 2005, Science 308, 1014�1017.Ueno, Y., Yoshioka, H., Maruyama, S. and Isozaki, Y.: 2004, Geochimica et Cosmochimica
Acta 68(3), 573�589.
Van Kranendonk, M. J., Hickman, A. H., Williams, I. R. and Nijman, W.: 2001, Archaeangeology of the East Pilbara granite-greenstone terrane, Western Australia � A field guide,Geological Survey of Western Australia, Perth.
Veizer, J. and Compston, W.: 1976, Geochimica et Cosmochimica Acta 40, 905�914.
244 HERVE MARTIN ET AL.

Veizer, J., Hoefs, J., Ridler, R. H., Jensen, L. S. and Lowe, D. R.: 1989, Geochimica etCosmochimica Acta 53, 845�857.
von Damm, K. L., Oosting, S. E., Kozlowski, R., Buttermore, L. G., Colodner, D. C.,Edmonds, H. N., Edmond, J. M. and Grebmeir, J. M.: 1995, Nature 375, 47�50.
Walker, J. C. G., Hays, P. B. and Kasting, J. F.: 1981, J. Geophys. Res. 86, 9776�9782.
Wallace, M. W., Gostin, V. A. and Keays, R. R.: 1990, Geology 18(2), 132�135.Weiershauser, L. and Spooner, E. T. C.: 2005, Precambrian Res. 138(1�2), 89�123.Weiss, R. F.: 1970, Deep-Sea Res. 17, 721�735.Wells, L. E., Armstrong, J. C. and Gonzalez, G.: 2003, Icarus 162, 38�46.
Young, G. M., von Brunn, V., Gold, D. J. C. and Minter, W. E. L.: 1998, J. Geol. 106,523�538.
Zahnle, K. and Sleep, N. H.: 2002, in C. M. R. Fowler, C. J. Ebinger and C. J. Hawkesworth
(eds.), The Early Earth: Physical, Chemical and Biological Development, Geological Soci-ety, London, pp. 231�257.
Zegers, T. E., de Wit, M. J., Dann, J. and White, S. H.: 1998, Terra Nova 10, 250�259.
245ENVIRONMENTAL CONTEXT

7. Ancient Fossil Record and Early Evolution (ca. 3.8 to 0.5 Ga)
PURIFICACION LOPEZ-GARCIA and DAVID MOREIRAUnite d’Ecologie, Systematique et Evolution, Universite Paris-Sud, Orsay, France
(E-mail: [email protected])
EMMANUEL DOUZERYInstitut des Sciences de l’Evolution, Universite Montpellier II, Montpellier, France
(E-mail: [email protected])
PATRICK FORTERREInstitut de Genetique et Microbiologie, Universite Paris-Sud, Orsay, France
(E-mail: [email protected])
MARK VAN ZUILENEquipe Geobiosphere Actuelle et Primitive, Institut de Physique du Globe, Paris, France
(E-mail: [email protected])
PHILIPPE CLAEYSDepartment of Geology, Vrije Universiteit, Brussels, Belgium
(E-mail: [email protected])
DANIEL PRIEURUniversite Bretagne Occidentale, Brest, France
(E-mail: [email protected])
(Received 1 February 2006; Accepted 4 April 2006)
Abstract. Once life appeared, it evolved and diversified. From primitive living entities, an evolutionary
path of unknown duration, likely paralleled by the extinction of unsuccessful attempts, led to a last
common ancestor that was endowed with the basic properties of all cells. From it, cellular organisms
derived in a relative order, chronology and manner that are not yet completely settled. Early life evolution
was accompanied by metabolic diversification, i.e. by the development of carbon and energy metabolic
pathways that differed from the first, not yet clearly identified, metabolic strategies used. When did the
different evolutionary transitions take place? The answer is difficult, since hot controversies have been
raised in recent years concerning the reliability of the oldest life traces, regardless of their morphological,
isotopic or organic nature, and there are also many competing hypotheses for the evolution of the
eukaryotic cell. As a result, there is a need to delimit hypotheses from solid facts and to apply a critical
analysis of contrasting data. Hopefully, methodological improvement and the increase of data, including
fossil signatures and genomic information, will help reconstructing a better picture of life evolution in early
times as well as to, perhaps, date some of the major evolutionary transitions. There are already some
certitudes. Modern eukaryotes evolved after bacteria, since their mitochondria derived from ancient
bacterial endosymbionts. Once prokaryotes and unicellular eukaryotes had colonized terrestrial ecosys-
tems for millions of years, the first pluricellular animals appeared and radiated, thus inaugurating the
Cambrian. The following sections constitute a collection of independent articles providing a general
overview of these aspects.
Earth, Moon, and Planets (2006) 98: 247–290 � Springer 2006
DOI 10.1007/s11038-006-9091-9
Keywords: Biomarkers, Cambrian explosion, early evolution, microfossil, origin of eukaryotes
7.1. The First Traces of Life
MARK VAN ZUILEN
Approximately a century ago the fossil record, based predominantly onmacroscopic morphologic evidence, could only be traced to the beginning ofthe Cambrian (544 Ma). The record of life therefore comprised only about12% of the total history of the Earth (4500 Ma). However, the abruptappearance of complex organisms suggested that more primitive forms of lifemust have occurred before the Cambrian. Indeed, as more rock formations ofPrecambrian age were studied, many microfossils and even macrofossils ofprimitive life forms were found (Schopf, 2000). The understanding of lifethrough time was greatly improved with the development of new types oftracers, or ‘biosignatures’, which include isotopic, mineralogic and chemicalindicators. In addition some indirect geochemical evidence has been used toinvoke the presence of life; e.g. the first appearance of oxygenic photosyn-thesizing bacteria is believed to have preceded the rise of oxygen in theatmosphere at ca. 2.3 Ga ago. Due to these new developments, the start ofthe evolution of life was slowly pushed back in time (Schopf and Klein, 1992;Knoll, 1999). Beyond the Proterozoic–Archean boundary at 2.5 Ga, how-ever, two fundamental changes do occur that greatly challenge the search fortraces of early life.
Firstly, a change in geologic processes due to which a simple interpreta-tion of paleo-environmental conditions is difficult. The Hadean and Archeanwere dominated by high temperature ultramafic volcanism (e.g. komatiites)and chemical sediment deposition (e.g. Banded Iron Formations – BIF – andcherts). The inferred high geothermal gradient (see Chapter 6.1: evolution ingeological mechanisms: the 2.5 Ga transition) and predominantly anoxicsurface conditions (see Chapter 6.3: atmospheric and ocean physiochemicalevolution) must have shaped the nature and habitat of early forms of life.Hydrothermal settings such as are found today at mid-ocean ridges werecommon and chemoautotrophic life would have been the most dominant lifeform on the early Earth (Nisbet and Sleep, 2001). The metabolism of theseorganisms depends on reduced chemical species (e.g. CH4, H2, S, H2S, Fe
2+)that are released during alteration of ocean floor volcanic rocks. The searchfor traces of early life should therefore be directed to those specific envi-ronments (hydrothermal vents, subaerial hotspring deposits, chilled marginsof pillow basalts) that were likely to have harbored these primitive groups oforganisms.
248 P. LOPEZ-GARCIA ET AL.
Secondly, a change in degree of preservation of the rock record due to whichconventional paleontological tools become highly ineffective. In the pro-gressively metamorphosed rock record of the Early Archean all currentlyreported types of biosignatures have been found to be ambiguous. Possiblemicrofossil structures have lost most of their original morphology, organiccompounds including molecular biomarkers have turned into kerogen orcrystalline graphite (of uncertain origin), and isotope signatures have beenblurred by exchange reactions and hydrothermal processes. Furthermore,several abiologic metamorphic reactions have been identified that can pro-duce kerogen or graphite, and specific abiologic processes have been de-scribed that can generate complex structures that resemble microfossils.Macroscopic fossil evidence in the form of stromatolites has been contro-versial as well, since several abiologic processes were identified that resultedin similar degrees of structural complexity. In summary, several processesassociated with metamorphism (strain, deformation, hydrothermal fluidcirculation, metasomatic mineral deposition, thermal degradation) havemade the search for traces of early life a great challenge, and has led toseveral ongoing controversies.
Currently it is difficult to declare with certainty what the oldest trace of lifeis, and importantly what its nature and habitat were. Life can be tracedunambiguously to approximately 2.7 Ga ago, based on well-described mor-phological microfossils and especially molecular fossils. Beyond this pointmany claims for biologic processes have been made, and all of them have tosome degree been drawn into question (Fig.7.1). Some of the intriguing butcontroversial early Archean traces include (1) isotopically light graphiteinclusions in older than 3.8 Ga rocks from Akilia island and the IsuaSupracrustal Belt in southwest Greenland, (2) kerogenous microstructures,stromatolites and diverse stable isotope ratio anomalies in 3.5 Ga cherts fromthe Pilbara Granitoid–Greenstone Belt in Western Australia, (3) kerogenousmicrostructures, stromatolites, and diverse stable isotope ratio anomalies incherts, as well as microscopic tubes in altered pillow basalts from the 3.4–3.2 Ga Barberton Greenstone Belt in South Africa. The purpose of thischapter is to show the problems associated with the search for the earliesttraces of life. Paragraph 7.1.1 describes some commonly used tools (bio-markers, microfossil morphology, isotope ratios), and their limitations withregard to the Archean rock record. Paragraph 7.1.2 is an account of someimportant field examples of the earliest traces of life. This is by no means arigorous discussion of all work that has been done on describing the earlybiosphere on Earth. For a classical account of all fossil evidence of theArchean, the reader is referred to ‘The Earth’s earliest biosphere’ (Schopf,1983).
249ANCIENT FOSSIL RECORD AND EARLY EVOLUTION

7.1.1 THE TRACERS
7.1.1.1 Morphological fossilsMacroscopic fossils of Archean age are scarce. Apart from occurrences in theNeoproterozoic of preserved multicellular life (see, for instance Schopf andKlein, 1992; Xiao et al., 1998; Chen et al., 2004), the only macroscopic evi-dence of Precambrian life comes from stromatolites (Grotzinger and Knoll,1999). These are laminated, accretionary structures which are commonlyregarded to have formed by the sediment-binding or direct carbonate pre-cipitating activities of microbial mats or biofilms composed of photosyn-thesizing and associated bacteria. Fossil stromatolites only rarely containindividual microfossils. The fine microfabric that is observed in extant stro-matolites (Stolz et al., 2001) has been destroyed by diagenesis and meta-morphism, leaving only the overall macroscopic appearance of Archeanstromatolites as an indicator for biogenicity. The biologic processes thatcontrol growth of stromatolites is currently the subject of intense study (see,for instance Reid et al., 2000; Bosak et al., 2004) and different mathematical
Figure 7.1. A simplified overview of the record of life on Earth over time. Episodes of high
meteorite flux to the Earth during the Hadean ceased after ca. 3.9 Ga. Life did not exist or wasfrequently destroyed during this time (Chyba, 1993). The rise in atmospheric oxygen at ca.2.3 Ga (Bekker et al., 2004) was caused by oxygenic photosynthesizing bacteria, which are
relatively highly evolved organisms. These two events therefore define the ‘time window’ forthe origin and evolution of early life on Earth. Metamorphic alteration of rocks older than2.7 Ga has caused ambiguity (indicated by question marks) in the interpretation of microfossil
and carbon isotopic evidence for life.
250 P. LOPEZ-GARCIA ET AL.

models for stromatolite surface growth have been proposed to either arguefor (Batchelor et al., 2004) or against (Grotzinger and Rothman, 1996) abiologic control. Several stromatolite structures have been documented ingreenstone belts from South Africa and Western Australia that are older than3.2 Ga. The biologic origin of these structures is the subject of debate, sincethey only meet several but not all of the criteria for biogenicity (Buick et al.,1981). Abiologic explanations include evaporitic precipitation, soft-sedimentdeformation, or silicious sinter formation around hot springs (Lowe, 1994).
Most microfossils in silicified Proterozoic microbial mats have relativelysimple coccoid or filamentous morphologies and possess a limited number ofattributes available for taxonomic characterization. Many characteristics ofcell cultures can be modified during post-mortem degradation. Elevatedtemperature, pressure and strain can cause structures to flatten and ulti-mately loose their original three-dimensional shape (Schopf and Klein, 1992).These problems have led to many misinterpretations, and to classificationssuch as ‘pseudofossils’, ‘non-fossils’, or ‘dubiofossils’. In fact undeformedmicrofossil shapes in moderately metamorphosed rocks are rather suspicious.
Figure 7.2. Potential problems in microfossil recognition. (a) Endolithic coccoids within acrack in an Isua BIF sample. The coccoids are embedded in extracellular polymeric sub-stances, and although they are partially fossilized they can be recognized as post-metamorphiccontamination. (Reprinted from Precambrian Research, Vol. 126, Westall, F. and Folk, R. L.,
Exogenous carbonaceous microstructures in Early Archaean cherts and BIFs from the IsuaGreenstone Belt: implications for the search for life in ancient rocks, pages 313–330, copyright(2003), with permission from Elsevier). (b) Carbonaceous microstructure from the Apex
Chert, Pilbara called it the ‘ballerina’, clearly showing a general problem of morphology;certain ‘characteristic’ shapes can easily be produced by metamorphic processes. (Reprinted bypermission from Macmillan Publishers Ltd: Nature, Brasier M., Green O.R., Jephcoat A. P.,
Kleppe A., van Kranendonk M. J., Lindsay J. F., Steele A., and Grassineau N. (2002),Questioning the evidence for Earth’s oldest fossils, Vol. 416, 76–81, copyright 2002).(c) Microstructures produced by abiologic processes in the laboratory. Such structures can
absorb organics, and resemble true Archean microfossils (From Garcia-Ruiz J. M., Hyde S.T., Carnerup A. M., Van Kranendonk M. J., and Welham N. J. (2003) Self: assembled silica-carbonate structures and detection of ancient microfossils. Science 302, 1194–1197).
251ANCIENT FOSSIL RECORD AND EARLY EVOLUTION
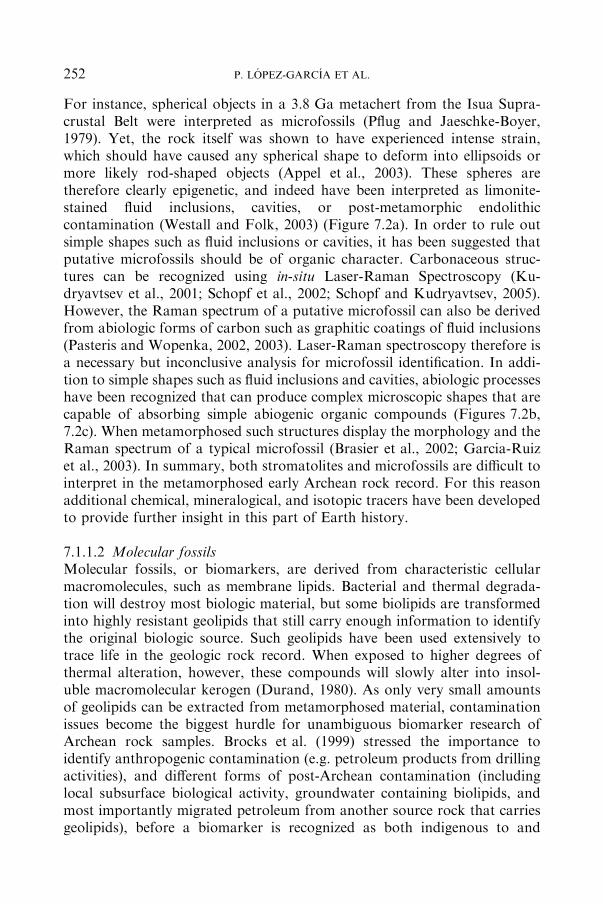
For instance, spherical objects in a 3.8 Ga metachert from the Isua Supra-crustal Belt were interpreted as microfossils (Pflug and Jaeschke-Boyer,1979). Yet, the rock itself was shown to have experienced intense strain,which should have caused any spherical shape to deform into ellipsoids ormore likely rod-shaped objects (Appel et al., 2003). These spheres aretherefore clearly epigenetic, and indeed have been interpreted as limonite-stained fluid inclusions, cavities, or post-metamorphic endolithiccontamination (Westall and Folk, 2003) (Figure 7.2a). In order to rule outsimple shapes such as fluid inclusions or cavities, it has been suggested thatputative microfossils should be of organic character. Carbonaceous struc-tures can be recognized using in-situ Laser-Raman Spectroscopy (Ku-dryavtsev et al., 2001; Schopf et al., 2002; Schopf and Kudryavtsev, 2005).However, the Raman spectrum of a putative microfossil can also be derivedfrom abiologic forms of carbon such as graphitic coatings of fluid inclusions(Pasteris and Wopenka, 2002, 2003). Laser-Raman spectroscopy therefore isa necessary but inconclusive analysis for microfossil identification. In addi-tion to simple shapes such as fluid inclusions and cavities, abiologic processeshave been recognized that can produce complex microscopic shapes that arecapable of absorbing simple abiogenic organic compounds (Figures 7.2b,7.2c). When metamorphosed such structures display the morphology and theRaman spectrum of a typical microfossil (Brasier et al., 2002; Garcia-Ruizet al., 2003). In summary, both stromatolites and microfossils are difficult tointerpret in the metamorphosed early Archean rock record. For this reasonadditional chemical, mineralogical, and isotopic tracers have been developedto provide further insight in this part of Earth history.
7.1.1.2 Molecular fossilsMolecular fossils, or biomarkers, are derived from characteristic cellularmacromolecules, such as membrane lipids. Bacterial and thermal degrada-tion will destroy most biologic material, but some biolipids are transformedinto highly resistant geolipids that still carry enough information to identifythe original biologic source. Such geolipids have been used extensively totrace life in the geologic rock record. When exposed to higher degrees ofthermal alteration, however, these compounds will slowly alter into insol-uble macromolecular kerogen (Durand, 1980). As only very small amountsof geolipids can be extracted from metamorphosed material, contaminationissues become the biggest hurdle for unambiguous biomarker research ofArchean rock samples. Brocks et al. (1999) stressed the importance toidentify anthropogenic contamination (e.g. petroleum products from drillingactivities), and different forms of post-Archean contamination (includinglocal subsurface biological activity, groundwater containing biolipids, andmost importantly migrated petroleum from another source rock that carriesgeolipids), before a biomarker is recognized as both indigenous to and
252 P. LOPEZ-GARCIA ET AL.

syngenetic with the host rock. Currently, small amounts of such unam-biguous biomarkers, representative of e.g. cyanobacteria, have been foundin the 2.6 Ga Marra Mamba Formation of the Hamersley Group, and the2.715 Ga Maddina Formation of the Fortesque Group, which both occur inWestern Australia (Brocks et al., 1999). Most Archean rocks older thanthat have experienced more severe metamorphic alteration (lower-greens-chist and up), and currently the biomarker record has only been traced to2.7 Ga (Figure 7.1). New techniques, however, such as hydropyrolyticdegradation (Brocks et al., 2003) provide promising venues for obtaininghigher yields of extractable geolipids from Archean kerogen. It is thereforecertainly possible that the biomarker record will be further extended intodeep Archean time.
7.1.1.3 Isotope ratiosThe carbon isotope ratio d13C is expressed as d13C=([(13C/12C)sample/(13C/12C)ST])1)*1000 in per mil (&), relative to a standard (ST = ViennaPee Dee Belemnite, VPDB). Carbon isotope ratios have been used extensivelyto trace back life over the geological record (Hayes et al., 1983; Schidlowski,1988, 2001). The two main reservoirs of carbon in sediments are carbonateswith an average d13C of 0&, and the remains of biologic material with anaverage d13C value of �25&. This characteristic difference in isotope ratiobetween the two carbon reservoirs has been observed in many organic-richsediments of different ages and is due to a kinetic isotope effect associatedwith irreversible enzyme-controlled metabolic pathways of autotrophicorganisms (most of them photosynthetic). Carbonaceous material in Archeancherts has a low average d13C value of ca. )35 to )30 & (Hayes et al., 1983;Ueno et al., 2004). If it is assumed that mantle-derived CO2 at that time had ad13C similar to that of today ()5 &, Des Marais and Morre, 1984), CO2-fixation by organisms should have produced a carbon isotope fractionationclose to �30& relative to the source. Photosynthesizing organisms andmethanogens are capable of producing this degree of carbon isotope frac-tionation (House et al., 2003). Unfortunately in moderately to highly meta-morphosed rocks these initial isotopic ratios can be lost. Processes that cancause changes include isotope exchange with carbonates or CO2-rich fluids(Schidlowski et al., 1979; Robert, 1988; Kitchen and Valley, 1995) anddevolatilization reactions during metamorphism (Hayes et al., 1983). Theseprocesses shift the d13C of sedimentary biological material to higher values,making it isotopically indistinguishable from e.g. graphite that forms abio-logically during metamorphic processes (van Zuilen et al., 2002, 2003).
The sulfur isotope ratio d34S is expressed as d34S=([(34S/32S) sample/(34S/32S)ST])1)*1000 in per mil (&), relative to a standard (ST = CanyonDiablo troilite, CDT). Sulfate-reducing bacteria preferentially reduce the
253ANCIENT FOSSIL RECORD AND EARLY EVOLUTION
light isotope, leading to isotopically depleted sulfides with a range in d34Sbetween )10 to �40& (Canfield and Raiswell, 1999). In general a small rangein d34S is observed for igneous rocks of about 0&� 5&. Therefore it hasbeen suggested by many workers that the significantly low d34S values ofsedimentary sulfide deposits provide a record of sulfur reducing bacteria overtime (Ohmoto et al., 1993; Rasmussen, 2000; Shen et al., 2001). In rocksolder than approximately 2.7 Ga most d34S values of sedimentary sulfidescluster around mantle sulfur isotope values (0 & with a range of ca. 10&).Hydrothermal fluid circulation can cause inorganic sulfate reduction andpotentially cause isotope effects that fall in the observed range. The search forunambiguous biologic d34S signatures is further complicated by metamorphicoverprinting. Especially in early Archean deposits it becomes difficult toestablish a syngenetic origin of sulfide deposits.
The nitrogen isotope ratio d15N is expressed as d15N=([(15N/14N)sample/(15N/14N)ST])1)*1000, in per mil (&) relative to a standard (ST = nitrogen-air standard, Nier, 1950). Beaumont and Robert (1999) have shown that thed15N of kerogen in Archean metasediments is several per mil (&) lower thanthat found in the modern biosphere (ca. þ5&), which they suggest is due tothe absence of nitrifying and denitrifying bacteria, and the presence of nitrogenfixing bacteria in the mildly reducing Archean oceans. Specific low nitrogenisotope compositions have been observed in certain Archean hydrothermalsettings (Pinti et al., 2001). Such isotopic ratios may be indicative of chemo-autotrophic bacteria, which occur in deep sea hydrothermal vent communitiesand derive NH3 directly from hydrothermal fluids. However, van Zuilen et al.(2005) have observed low d15N in graphites from the 3.8 Ga Isua SupracrustalBelt, and argued that mantle type nitrogen (�5&) could have been incorpo-rated during secondary metasomatic processes. Nitrogen that is lost frombiogenic material by devolatilization during metamorphism, can be incorpo-rated in clay minerals in the form of NH4
+ were it substitutes for K+. Whenthese clay minerals recrystallize at high-grade metamorphism this ammoniumion is retained in the resulting mica (e.g. tobelite). It has therefore beensuggested that NH4
+ concentration in micas and the associated d15N, couldact as a potential indirect biomarker in metasedimentary rocks (Papineauet al., 2005 and references therein). However, metamorphism could drive thed15N of residual nitrogen in rocks to higher values (Bebout and Fogel, 1992),making it difficult to interpret d15N as a biosignature.
The iron isotope ratio d56Fe is expressed as d56Fe=([(56Fe/54Fe)sample/(56Fe/54Fe)ST])1)*1000 in per mil (&) relative to a standard (IRMM-014reference material). Igneous rocks worldwide have a near-constant d56Fe ofzero &, and geologic processes such as melting/crystallization or weatheringdo not cause significant isotope fractionation (Johnson et al., 2004b). Theisotopic composition of iron is affected by biological processes and canpotentially be used to trace life in ancient environments (Johnson et al.,
254 P. LOPEZ-GARCIA ET AL.

2004b and references therein). For instance Fe(II)-oxidizing anoxygenicphotosynthesizers can cause a shift in d56Fe of þ1:5& (Croal et al., 2004).Shifts towards negative d56Fe are observed for Fe(III)-reducing bacteria(Johnson et al., 2005). A range of d56Fe values (between ca. )1 and þ1&)has been observed in Precambrian BIFs (Johnson et al., 2003; Dauphaset al., 2004; Yamaguchi et al., 2005); negative values in the more reducedmineral phases (pyrite, siderite) and positive values in oxidized mineralphases (magnetite, hematite). It has been suggested before that BIFs are thedirect (Konhauser et al., 2002) or indirect (Beukes, 2004) result of photo-synthetic activity. The observed positive shifts in Fe-isotope ratio could be afurther confirmation of these hypotheses. However, there are abiologicprocesses by which BIFs can form. For instance direct photodissociation ofocean surface water by UV-radiation could lead to oxidation and precipi-tation of BIF (Braterman et al., 1983). It is not known to what extent ironisotopes are fractionationed during such a process, and therefore it remainsdifficult to use BIFs and their Fe-isotope ratio as a biosignature. Further-more, there are abiologic redox processes that can cause a shift to positived56Fe (Bullen et al., 2001). The analysis of d56Fe is a relatively new field ofresearch (Anbar, 2004) many aspects of iron isotope fractionation still remainto be studied. The use of d56Fe therefore remains a promising tool for tracingearly Archean life.
7.1.2 EXAMPLES FROM THE FIELD
7.1.2.1 Before 3.8 Ga: Akilia Island, West GreenlandA highly metamorphosed quartz–pyroxene rock on the southwestern tip ofAkilia Island has for long been the center of attention regarding the oldesttraces of life on Earth. This five-meter wide outcrop (Figure 7.3) was inter-preted as a BIF and was found to contain graphite inclusions within apatitecrystals (Mojzsis et al., 1996). The low d13C of these graphite inclusionssuggested a biologic source material that had retained its original carbonisotope signature. This claim has since been the center of controversy, as itwas argued that the protolith of this rock was not a BIF, but instead a highlymetasomatized ultramafic rock which does not represent a marine deposi-tional setting and would not be able to harbor traces of ancient life (Fedo andWhitehouse, 2002a). Since then, geochemical data has been presented toeither argue for or against a sedimentary origin (Fedo and Whitehouse,2002b; Friend et al., 2002; Mojzsis and Harrison, 2002b; Palin, 2002; Mojzsiset al., 2003; Whitehouse et al., 2005). Recently, iron isotope systematics andtrace element ratios have been used to establish more firmly a sedimentaryorigin. Dauphas et al. (2004) observed d56Fe up to þ1:1& in the fine-grainedpart of this quartz–pyroxene rock, which is in line with values observed in
255ANCIENT FOSSIL RECORD AND EARLY EVOLUTION
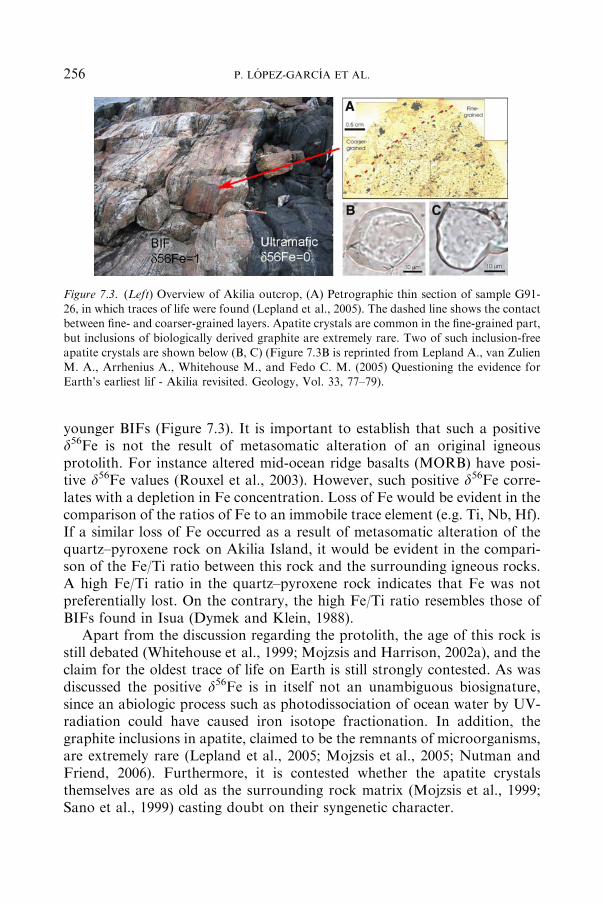
younger BIFs (Figure 7.3). It is important to establish that such a positived56Fe is not the result of metasomatic alteration of an original igneousprotolith. For instance altered mid-ocean ridge basalts (MORB) have posi-tive d56Fe values (Rouxel et al., 2003). However, such positive d56Fe corre-lates with a depletion in Fe concentration. Loss of Fe would be evident in thecomparison of the ratios of Fe to an immobile trace element (e.g. Ti, Nb, Hf).If a similar loss of Fe occurred as a result of metasomatic alteration of thequartz–pyroxene rock on Akilia Island, it would be evident in the compari-son of the Fe/Ti ratio between this rock and the surrounding igneous rocks.A high Fe/Ti ratio in the quartz–pyroxene rock indicates that Fe was notpreferentially lost. On the contrary, the high Fe/Ti ratio resembles those ofBIFs found in Isua (Dymek and Klein, 1988).
Apart from the discussion regarding the protolith, the age of this rock isstill debated (Whitehouse et al., 1999; Mojzsis and Harrison, 2002a), and theclaim for the oldest trace of life on Earth is still strongly contested. As wasdiscussed the positive d56Fe is in itself not an unambiguous biosignature,since an abiologic process such as photodissociation of ocean water by UV-radiation could have caused iron isotope fractionation. In addition, thegraphite inclusions in apatite, claimed to be the remnants of microorganisms,are extremely rare (Lepland et al., 2005; Mojzsis et al., 2005; Nutman andFriend, 2006). Furthermore, it is contested whether the apatite crystalsthemselves are as old as the surrounding rock matrix (Mojzsis et al., 1999;Sano et al., 1999) casting doubt on their syngenetic character.
Figure 7.3. (Left) Overview of Akilia outcrop, (A) Petrographic thin section of sample G91-
26, in which traces of life were found (Lepland et al., 2005). The dashed line shows the contactbetween fine- and coarser-grained layers. Apatite crystals are common in the fine-grained part,but inclusions of biologically derived graphite are extremely rare. Two of such inclusion-free
apatite crystals are shown below (B, C) (Figure 7.3B is reprinted from Lepland A., van ZulienM. A., Arrhenius A., Whitehouse M., and Fedo C. M. (2005) Questioning the evidence forEarth’s earliest lif - Akilia revisited. Geology, Vol. 33, 77–79).
256 P. LOPEZ-GARCIA ET AL.

7.1.2.2 3.8 Ga: The Isua Supracrustal Belt, West GreenlandEarly work on the 3.8 Ga old Isua Supracrustal Belt (ISB) in southern WestGreenland showed evidence for a marine depositional setting; BIFs, me-tacherts, pillow lava structures, carbonates, and felsic metasediments inwhich graded bedding is locally preserved. The occurrences of siderite anddolomite, occasionally interlayered with quartzite in the ISB, appears similarto marine platform deposits that are found throughout the Precambrian andthe Phanerozoic, and in early studies this field appearance led to the inter-pretation of a shallow marine, subtidal depositional environment (Dimroth,1982). The ISB has a complex metamorphic history; evidence has beenreported for multiple episodes of early Archean deformation and metamor-phism (Nutman et al., 1996). These events were responsible for amphibolite-facies metamorphism, reaching temperatures between 500�C and 600�C andpressures to 5–5.5 kbar (Boak and Dymek, 1982). Biologic remains in thesesedimentary sequences would therefore have been converted to crystallinegraphite. It has been suggested in several studies that graphite contained inthe ISB could be biogenic in origin (Schidlowski et al., 1979; Hayes et al.,1983; Mojzsis et al., 1996). The wide range of carbon isotope ratios (d13Crange from )25 to �6&) of graphite in carbonate rich rocks has beeninterpreted to reflect post-depositional isotopic equilibration of graphitizingorganic matter with co-existing carbonates. More recent work has showninconsistencies in this interpretation (van Zuilen et al., 2002, 2003). Proto-liths of several carbonate-rich rocks in Isua have been reinterpreted (Roseet al., 1996; Rosing et al., 1996) as secondary metasomatic and not as sedi-mentary in origin. This fundamental reinterpretation of the protolith wouldrule out a biogenic origin of graphite in metasomatic rocks. Graphite wasfound in large quantities in such metasomatic carbonate-rich rocks, whereasno distinguishable graphite particles were found in sedimentary BIF andmetacherts. In these latter samples a very low concentration of reducedcarbon was measured (less than 100 ppm), that could be combusted atrelatively low temperature (450 �C). Since graphite typically combustsaround 700–800 �C and all syngenetic organic material in Isua should haveturned into graphite during metamorphic events, it can be concluded that thesmall amounts of isotopically light reduced carbon in these samples aremainly derived from post-metamorphic (and thus much younger, non-indigenous) organic material. In contrast, the metasomatic carbonate veinswithin mafic country rocks contain graphite-siderite-magnetite assemblages(Figure 7.4), suggesting that graphite and magnetite in these rocks are theproducts of partial thermal disproportionation of the carbonate. The siderite(FeCO3) disproportionation reaction, yielding graphite and magnetite(6FeCO3 fi 2Fe3O4+5CO2+C) has been studied in detail at metamorphicP, T, fO2-conditions (French, 1971), and has been suggested earlier as a
257ANCIENT FOSSIL RECORD AND EARLY EVOLUTION
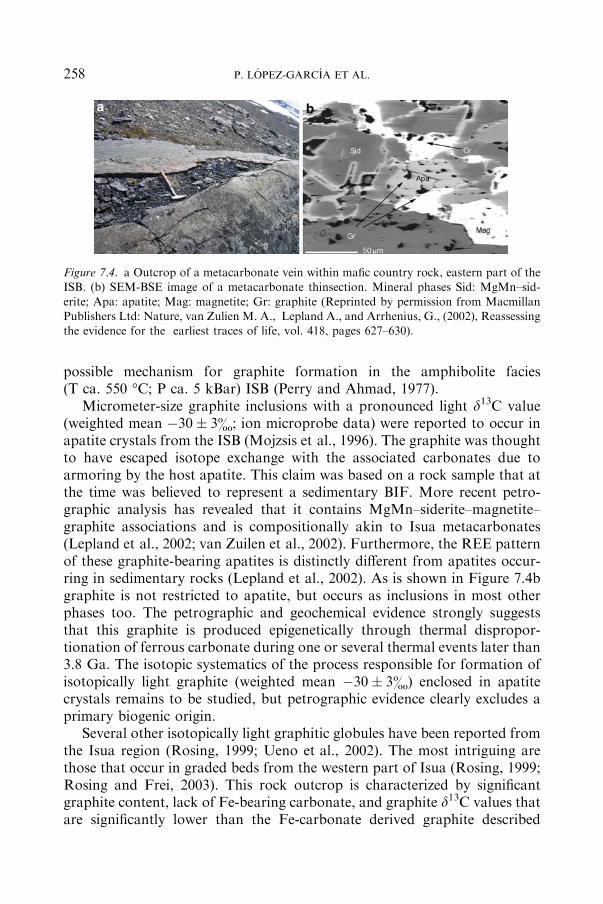
possible mechanism for graphite formation in the amphibolite facies(T ca. 550 �C; P ca. 5 kBar) ISB (Perry and Ahmad, 1977).
Micrometer-size graphite inclusions with a pronounced light d13C value(weighted mean �30� 3&; ion microprobe data) were reported to occur inapatite crystals from the ISB (Mojzsis et al., 1996). The graphite was thoughtto have escaped isotope exchange with the associated carbonates due toarmoring by the host apatite. This claim was based on a rock sample that atthe time was believed to represent a sedimentary BIF. More recent petro-graphic analysis has revealed that it contains MgMn–siderite–magnetite–graphite associations and is compositionally akin to Isua metacarbonates(Lepland et al., 2002; van Zuilen et al., 2002). Furthermore, the REE patternof these graphite-bearing apatites is distinctly different from apatites occur-ring in sedimentary rocks (Lepland et al., 2002). As is shown in Figure 7.4bgraphite is not restricted to apatite, but occurs as inclusions in most otherphases too. The petrographic and geochemical evidence strongly suggeststhat this graphite is produced epigenetically through thermal dispropor-tionation of ferrous carbonate during one or several thermal events later than3.8 Ga. The isotopic systematics of the process responsible for formation ofisotopically light graphite (weighted mean �30� 3&) enclosed in apatitecrystals remains to be studied, but petrographic evidence clearly excludes aprimary biogenic origin.
Several other isotopically light graphitic globules have been reported fromthe Isua region (Rosing, 1999; Ueno et al., 2002). The most intriguing arethose that occur in graded beds from the western part of Isua (Rosing, 1999;Rosing and Frei, 2003). This rock outcrop is characterized by significantgraphite content, lack of Fe-bearing carbonate, and graphite d13C values thatare significantly lower than the Fe-carbonate derived graphite described
Figure 7.4. a Outcrop of a metacarbonate vein within mafic country rock, eastern part of theISB. (b) SEM-BSE image of a metacarbonate thinsection. Mineral phases Sid: MgMn–sid-
erite; Apa: apatite; Mag: magnetite; Gr: graphite (Reprinted by permission from MacmillanPublishers Ltd: Nature, van Zulien M. A., Lepland A., and Arrhenius, G., (2002), Reassessingthe evidence for the earliest traces of life, vol. 418, pages 627–630).
258 P. LOPEZ-GARCIA ET AL.

above. A biologic origin can therefore not be excluded, and further researchis necessary to confirm this claim.
7.1.2.3 3.5 Ga: Pilbara, Western AustraliaSome of the oldest traces of life on Earth have been found in chert horizons(predominantly the Dresser Formation at North Pole Dome, the Apex chert,and the Strelley Pool chert) occurring in the lower Warrawoona Group,eastern Pilbara Craton, Western Australia (Van Kranendonk and Pirajno,2004), and include stromatolites (Allwood et al., 2006; Walter et al., 1980;Awramik et al., 1983; Lowe, 1983; Hoffman et al., 1999; Van Kranendonket al., 2003), microfossils of photosynthesizing bacteria (Schopf, 1983, 1993;Schopf et al., 2002), sulfur isotopic evidence of sulfate-reducers (Shen et al.,2001), carbon isotopic evidence for autotrophic life (Hayes et al., 1983; Uenoand Isozaki, 2001; Ueno et al., 2004), and nitrogen isotopic evidence ofchemoautotrophic life (Pinti et al., 2001). The validity of these claimsstrongly depends on the geological context, and especially on the process offormation of the chert horizons in which most of these traces of life arefound. The origin of several chert units in the Warrawoona Group has beencontroversial. The bedded chert–barite horizons in the Dresser Formationwere originally interpreted as evaporitic and clastic deposits that were silic-ified by later hydrothermal circulation (Buick and Dunlop, 1990). In con-trast, several lines of evidence suggest that such chert–barite horizons wereformed as exhalite deposits associated with hydrothermal seafloor alteration(Van Kranendonk and Pirajno, 2004). This is particularly evident from theswarms of chert–barite veins (Figure 7.5a) that terminate into shallowevaporitic bedded chert–barite units. Such episodes of hydrothermal activityare thought to be associated with caldera formation, as is inferred from chertveins that developed in active growth faults (Nijman et al., 1999). The Apex
Figure 7.5. (a) Swarms of hydrothermal chert feeder dikes within the Dresser Formation atNorth Pole Dome, Pilbara, Western Australia. (b) Outcrop of the Apex Chert near Chinaman
Creek, Pilbara, Western Australia. Microfossil structures described by Schopf (1993) andSchopf et al. (2002) occur in a hydrothermal feeder dike, not in the actual exhalative seafloorportion of the Apex Chert.
259ANCIENT FOSSIL RECORD AND EARLY EVOLUTION
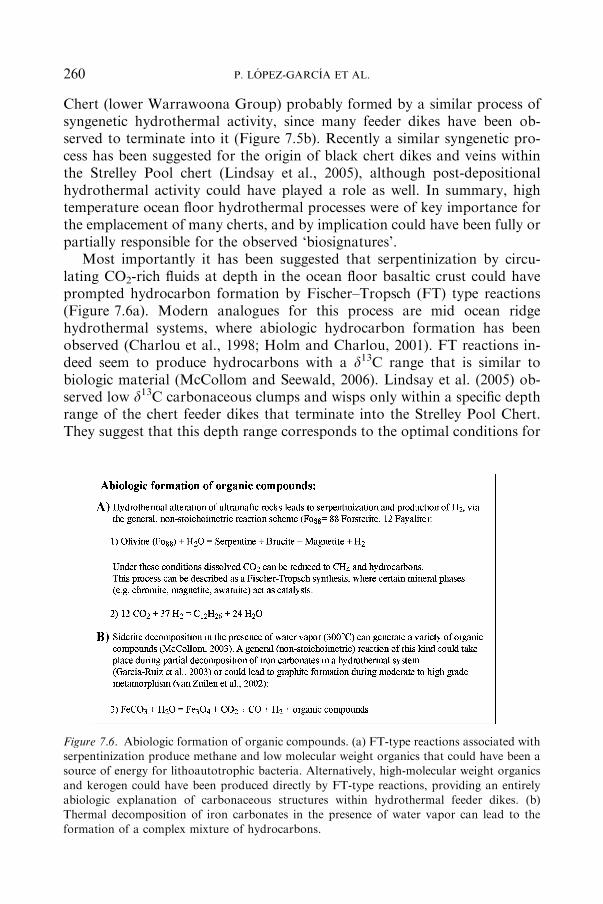
Chert (lower Warrawoona Group) probably formed by a similar process ofsyngenetic hydrothermal activity, since many feeder dikes have been ob-served to terminate into it (Figure 7.5b). Recently a similar syngenetic pro-cess has been suggested for the origin of black chert dikes and veins withinthe Strelley Pool chert (Lindsay et al., 2005), although post-depositionalhydrothermal activity could have played a role as well. In summary, hightemperature ocean floor hydrothermal processes were of key importance forthe emplacement of many cherts, and by implication could have been fully orpartially responsible for the observed ‘biosignatures’.
Most importantly it has been suggested that serpentinization by circu-lating CO2-rich fluids at depth in the ocean floor basaltic crust could haveprompted hydrocarbon formation by Fischer–Tropsch (FT) type reactions(Figure 7.6a). Modern analogues for this process are mid ocean ridgehydrothermal systems, where abiologic hydrocarbon formation has beenobserved (Charlou et al., 1998; Holm and Charlou, 2001). FT reactions in-deed seem to produce hydrocarbons with a d13C range that is similar tobiologic material (McCollom and Seewald, 2006). Lindsay et al. (2005) ob-served low d13C carbonaceous clumps and wisps only within a specific depthrange of the chert feeder dikes that terminate into the Strelley Pool Chert.They suggest that this depth range corresponds to the optimal conditions for
Figure 7.6. Abiologic formation of organic compounds. (a) FT-type reactions associated withserpentinization produce methane and low molecular weight organics that could have been asource of energy for lithoautotrophic bacteria. Alternatively, high-molecular weight organics
and kerogen could have been produced directly by FT-type reactions, providing an entirelyabiologic explanation of carbonaceous structures within hydrothermal feeder dikes. (b)Thermal decomposition of iron carbonates in the presence of water vapor can lead to the
formation of a complex mixture of hydrocarbons.
260 P. LOPEZ-GARCIA ET AL.

FT reactions (P ca. 500 kBar, T ca. 300 �C). It must be stressed, though, thatFT reactions appear to be only efficient in the vapor phase, and areexceedingly more sluggish in hydrothermal systems (McCollom and Seewald,2001). Ueno et al. (2004) observed low d13C carbonaceous structures in thechert feeder dike swarms of the Dresser Formation and noted the absence ofan effective catalyst mineral phase and a relatively low hydrothermal tem-perature (ca. 100–200 �C). They therefore suggest that chemolithoauto-trophic organisms may actually have been present in these feeder dikes. Thenotion that hydrothermal processes could at least in part have producedcarbonaceous material in cherts of the Warrawoona Group has led to someimportant reinterpretations of previously recognized microfossil life. Car-bonaceous microstructures resembling fossilized bacteria were reported fromthe 3.5-Ga-old Apex chert (Schopf, 1993; Schopf et al., 2002). At the timethis chert was thought to represent a shallow marine depositional setting inwhich photosynthetic bacteria could thrive. However, it was subsequentlyshown by Brasier et al. (2002) that the samples studied by Schopf (1993)actually represent one of the hydrothermal feeder dikes that terminates in abedded chert horizon (Figure 7.5b). It is highly unlikely that photosyntheticbacteria occurred in such a sub-seafloor hydrothermal setting. Instead,Brasier et al. (2002) argued for the abiologic origin of the observed carbo-naceous particles by FT reaction (Figure 7.6). Alternatively, the carbona-ceous structures in this feeder dike may have formed by partialdecomposition of iron carbonates (as suggested by Garcia-Ruiz et al., 2003,see Figure 7.6b) or may be actually the remnants of chemoautotrophicorganisms, in analogy to the suggestion made by Ueno et al. (2004). Manyaspects of hydrothermal systems and associated conditions for chemoauto-trophic life remain to be studied. As Lindsay et al. (2005) suggest, the abioticorganic output of such systems may overwhelm the signatures of primitivelife that are present, and therefore make it the most difficult environments inwhich to recognize a record of the early biosphere.
Hydrothermal processes would also have caused the emplacement ofsecondary mineral phases. For instance pyrite with low d34S and of putativebiological origin could therefore have had a hydrothermal origin. Shen et al.(2001), however, provide compelling evidence that rules out a hydrothermalorigin; pyrite grains in bedded chert–barite horizons of the Dresser Forma-tion were found to occur along the original crystal phases of primary gypsum(Buick and Dunlop, 1990). Since gypsum is unstable above 60 �C it impliesthat these sulfide crystals were emplaced before hydrothermal conversion tobarite took place.
7.1.2.4 3.4–3.2 Ga: Barberton, South AfricaTraces of life have been found in chert deposits occurring in the OnverwachtGroup of the 3.4–3.2 Ga Barberton Greenstone Belt, South Africa (de Wit
261ANCIENT FOSSIL RECORD AND EARLY EVOLUTION
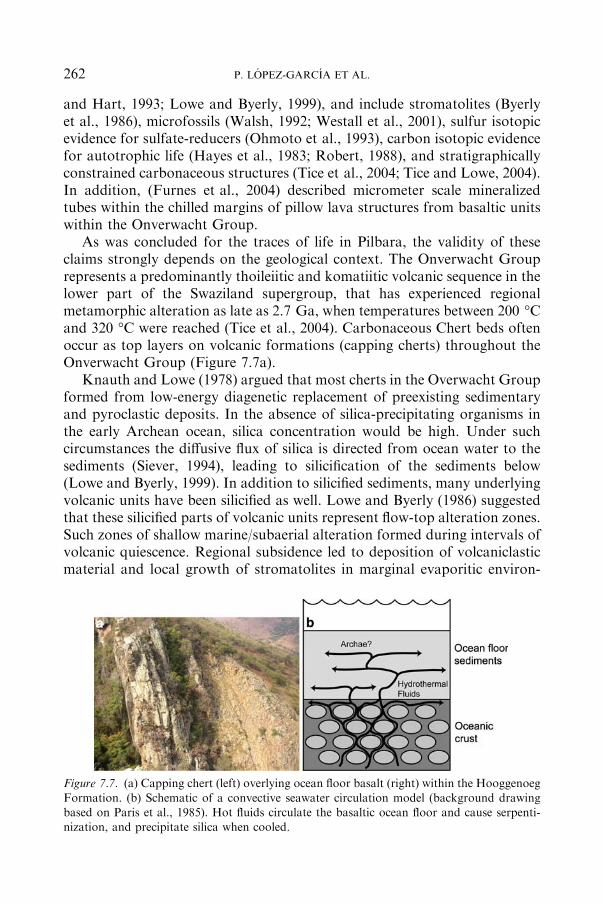
and Hart, 1993; Lowe and Byerly, 1999), and include stromatolites (Byerlyet al., 1986), microfossils (Walsh, 1992; Westall et al., 2001), sulfur isotopicevidence for sulfate-reducers (Ohmoto et al., 1993), carbon isotopic evidencefor autotrophic life (Hayes et al., 1983; Robert, 1988), and stratigraphicallyconstrained carbonaceous structures (Tice et al., 2004; Tice and Lowe, 2004).In addition, (Furnes et al., 2004) described micrometer scale mineralizedtubes within the chilled margins of pillow lava structures from basaltic unitswithin the Onverwacht Group.
As was concluded for the traces of life in Pilbara, the validity of theseclaims strongly depends on the geological context. The Onverwacht Grouprepresents a predominantly thoileiitic and komatiitic volcanic sequence in thelower part of the Swaziland supergroup, that has experienced regionalmetamorphic alteration as late as 2.7 Ga, when temperatures between 200 �Cand 320 �C were reached (Tice et al., 2004). Carbonaceous Chert beds oftenoccur as top layers on volcanic formations (capping cherts) throughout theOnverwacht Group (Figure 7.7a).
Knauth and Lowe (1978) argued that most cherts in the Overwacht Groupformed from low-energy diagenetic replacement of preexisting sedimentaryand pyroclastic deposits. In the absence of silica-precipitating organisms inthe early Archean ocean, silica concentration would be high. Under suchcircumstances the diffusive flux of silica is directed from ocean water to thesediments (Siever, 1994), leading to silicification of the sediments below(Lowe and Byerly, 1999). In addition to silicified sediments, many underlyingvolcanic units have been silicified as well. Lowe and Byerly (1986) suggestedthat these silicified parts of volcanic units represent flow-top alteration zones.Such zones of shallow marine/subaerial alteration formed during intervals ofvolcanic quiescence. Regional subsidence led to deposition of volcaniclasticmaterial and local growth of stromatolites in marginal evaporitic environ-
Figure 7.7. (a) Capping chert (left) overlying ocean floor basalt (right) within the Hooggenoeg
Formation. (b) Schematic of a convective seawater circulation model (background drawingbased on Paris et al., 1985). Hot fluids circulate the basaltic ocean floor and cause serpenti-nization, and precipitate silica when cooled.
262 P. LOPEZ-GARCIA ET AL.
ments. Synsedimentary silicification of these deposits then produced imper-meable carbonaceous capping cherts on top of these komatiite flows. Inanother model Paris et al. (1985) have suggested that silica addition to bothvolcanic units and overlying sediments is the result of convective seawatercirculation that acted directly on the oceanic crust and overlying sediments.Higher heat flux and greater availability of Mg,Fe-rich silicates (ultramafic/mafic basalts) in the early Archean caused effective serpentinization of oce-anic crust that produced large quantities of silica-enriched hydrothermalfluids. Lateral migration of such fluids caused silicification of the upper oceanfloor basalts and overlying sediments (Figure 7.7b). In addition to this rel-atively low-temperature hydrothermal circulation model, it has been sug-gested that some ferruginous chert deposits in Barberton could representexhalites from local high-temperature hydrothermal vents. This model isbased on the occurrence of ironstone pods in close association with BIFs andferruginous cherts in the region (de Wit et al., 1982; de Ronde and Ebbesen,1996). The origin of these ironstone pods, however, is still controversial. Forinstance, it has been suggested that these ironstone bodies are of Quaternaryage, and are therefore irrelevant to interpretations of Archean hydrothermalevents (Lowe and Byerly, 2003). Alternative explanations for the origin ofthese iron stone pods, however, have been suggested (Lowe et al., 2003).
As was discussed for Pilbara, serpentinization by circulating CO2-richfluids at depth in the ocean floor basaltic crust could have promptedhydrocarbon formation by Fischer–Tropsch (FT) type reactions. However,organics should then be found at a specific depth range within chert feederdikes that cross-cut the underlying ultramafic/mafic volcanic sequence. Al-though such carbonaceous veining has been observed, it is clearly not asabundant as in Pilbara. Instead, there is a clear division between theregionally traceable carbonaceous cherts and underlying organics-free vol-canic alteration zones. A simple comparison with carbonaceous cherts fromPilbara can therefore not be made, and careful studies are required to resolvethe possible biologic origin of the observed organic structures. For exampleTice and Lowe (2004) described a stratigraphic sequence within the BuckReef Chert in the lower Kromberg Formation, and found that carbonaceousdebris were restricted to specific shallow marine siderite-dominated succes-sions. The apparent confinement to the photic zone, and the absence of alocally oxidized environment (such as is normally inferred from magnetite orhematite rich BIF’s, Beukes, 2004), led them to conclude that anoxygenicphotosynthetic life was present at this time. Such organisms use H2, H2S orFe2+ as an electron donor for their metabolism. These elements would bereadily available in an environment that was dominated by ocean floorhydrothermal alteration processes. The observations by Tice et al. (2004) andby Furnes et al. (2004) suggest that early Archean life may have been inti-mately linked to ocean floor hydrothermal alteration processes.
263ANCIENT FOSSIL RECORD AND EARLY EVOLUTION

7.1.3 THE CHALLENGES AHEAD
From the field examples discussed above, it can be concluded that studiesof early life in the incomplete and strongly metamorphosed Archean rockrecord face specific challenges. There is a strong need for careful descriptionof geological context, identification of secondary metamorphic processes,and detailed structural, isotopic and chemical description of microstructuresthat are indigenous to and syngenetic with the rock formations. Oneimprovement for this field of research is the increased availability of rep-resentative, relatively fresh Archean rock samples. Recently several scientificdrilling projects have been initiated in Archean terrains, with the specificpurpose to study traces of early life. Such drill cores represent samples thathave been protected from weathering processes, and are less prone tobiologic surface contamination. On the other hand, this type of samplingintroduces new problems and challenges. Organic contamination can beavoided by working with well-characterized drilling mud or water. Dis-crimination between indigenous carbonaceous structures and extant deepbiosphere can be achieved by on-site biologic monitoring of drilling mud.Another improvement for this field of research is the wide variety of newisotopic and chemical techniques that can be applied to small rock samples.Laser Raman spectroscopy is now used routinely to determine the organiccharacter (Schopf and Kudryavtsev, 2005) and degree of structure (Beyssacet al., 2002; Tice et al., 2004) of carbonaceous material. It enables therecognition of indigenous metamorphosed structures, and excludes fluidinclusions or post-metamorphic contamination. In situ isotopic analysis ofputative microfossils is made possible using ion probe techniques. For in-stance carbon isotope ratios have been determined of individual carbona-ceous structures within Archean rock samples (House et al., 2000; Uenoand Isozaki, 2001; Ueno et al., 2002). Detailed sub-micron chemical anal-ysis and chemical mapping of microstructures is achieved using a Nano-SIMS (Robert et al., 2005) and detailed sub-micron chemicalcharacterization of fluid inclusions has been achieved for Archean chertsamples (Foriel et al., 2004). These in situ techniques make it possible todirectly link microfossil morphology to both chemistry and isotopic char-acteristics, greatly improving the discrimination between biologic and abi-ologic processes. Finally, our understanding of Archean surface processes isgreatly expanded with the use of multicollection ICP-MS. This techniqueenables the precise determination of the natural isotopic variation of e.g.transition metals and other biologically significant elements (Johnson et al.,2004a).
264 P. LOPEZ-GARCIA ET AL.

7.2. Microbial and Metabolic Diversification
DANIELL PRIEUR
Organisms living today on Earth use chemicals and/or light to gain the en-ergy required for cellular functions, and they carry out biosynthetic processesconverting carbon dioxide or already existing organic compounds. Consid-ered as a whole, the prokaryotes (microscopic unicellular organisms whosegenetic material is not separated from cytoplasm by a membrane) possess alltypes of metabolic pathways known so far. Their study might serve as modelsfor establishing a scenario.
7.2.1 HOW DO CONTEMPORARY CELLS GAIN THEIR ENERGY?
The variety of metabolisms used by prokaryotes has been presented in detailsby Madigan et al. (2003) in a text book which inspired this paragraph.
7.2.1.1 Chemotrophic metabolismsChemotrophic organisms gain their energy from oxidation–reductionchemical reactions which obligatorily involve inorganic and/or organicelectron donors and acceptors. When molecular oxygen (O2) is present, itcan play as an electron acceptor; then processes are called aerobic respi-rations. When molecular oxygen is lacking, other molecules (organic orinorganic) play as electron acceptors for processes called anaerobic res-pirations. In both cases, electrons are transported by electron carrierswhose number and type depend on the donor and acceptor involved.During this process, a proton motive force is established across thecytoplasmic membrane, allowing ATP synthesis through an oxidativephosphorylation. When molecular oxygen and other electron acceptors aremissing, certain organic molecules can be degraded through an energygenerating process called fermentation, in which electron acceptors areprovided by intermediate organic compounds deriving from the degrada-tion of the initial organic compound.
7.2.1.2 Phototrophic metabolismsPhotosynthesis can be defined as a conversion of light energy into chemicalenergy: it is one of the most important biological processes on Earth.Organisms carrying out photosynthesis are called phototrophs. Most of themare usually autotrophs, and utilize carbon dioxide as carbon source. Photo-synthesis depends on light sensitive pigments present in all phototrophs.
Photosynthesis is the sum of two series of reactions: light reactions anddark reactions. During light reactions, light energy is converted into chemical
265ANCIENT FOSSIL RECORD AND EARLY EVOLUTION
energy. When excited by light, some pigment molecules are converted into astrong electron donor with a very electronegative reduction potential. Elec-trons are then released, and transported by different ways, according to theorganisms concerned. This electron flow leads to ATP synthesis.
During dark reactions, chemical energy is utilized to reduce carbondioxide into organic compounds. Electrons required for carbon dioxidereduction come from the reduced form NADPH (for nicotinamide-adeninedinucleotide-phosphate) of the coenzyme NADP+ (for nicotinamide-adeninedinucleotide-phosphate), previously reduced by electrons whose origin mayvary according to the type of photosynthesis concerned.
They are two types of photosynthetic processes. Terrestrial and aquaticgreen plants, algae, and some prokaryotes of the Bacteria domain (Cyano-bacteria) carry out oxygenic photosynthesis. In this case, electrons requiredfor reduction of NADP+ into NADPH are generated by photolysis of water,with the reaction:
H2O ! 2Hþ þ 2e� þ 1=2O2:
Molecular oxygen released during this reaction gives its name to this par-ticular photosynthesis.
The second type of photosynthesis is carried out exclusively by otherprokaryotes from the Bacteria domain, called the green bacteria and thepurple bacteria. These prokaryotes harbor photo-sensitive pigments (bacte-riochlorophylls) that slightly differ from the pigments harbored by oxygenicphototrophs. Transport of electrons released by the light-excited pigments,and following phosphorylation is also different from those encounteredduring oxygenic photosynthesis. But, in the case of autotrophic growth,purple bacteria use electrons given by reduced molecules present in theenvironment such as hydrogen sulfide (H2S) or various organic molecules forreduction of NADP+ into NADPH. This photosynthesis that does notproduce molecular oxygen is called anoxygenic photosynthesis.
7.2.1.3 Electron carriers and ATP synthesisDuring an oxidation–reduction reaction within a cell, electrons are
transferred from the donor to the acceptor, by one or more intermediateslocated in the cytoplasmic membrane and called electron carriers. Thesecarriers are oriented within the membrane in such a way that electrons aretransported along this chain, while protons are extruded outside the cell. Theresult is the formation of a proton gradient and an electrochemical potentialacross the membrane, with the inside of the cytoplasm alkaline and electri-cally negative, and the outside of the membrane acidic and electrically po-sitive. This energized state of the membrane is called the proton motive force.This proton motive force is then used to synthesize ATP (adenosine
266 P. LOPEZ-GARCIA ET AL.
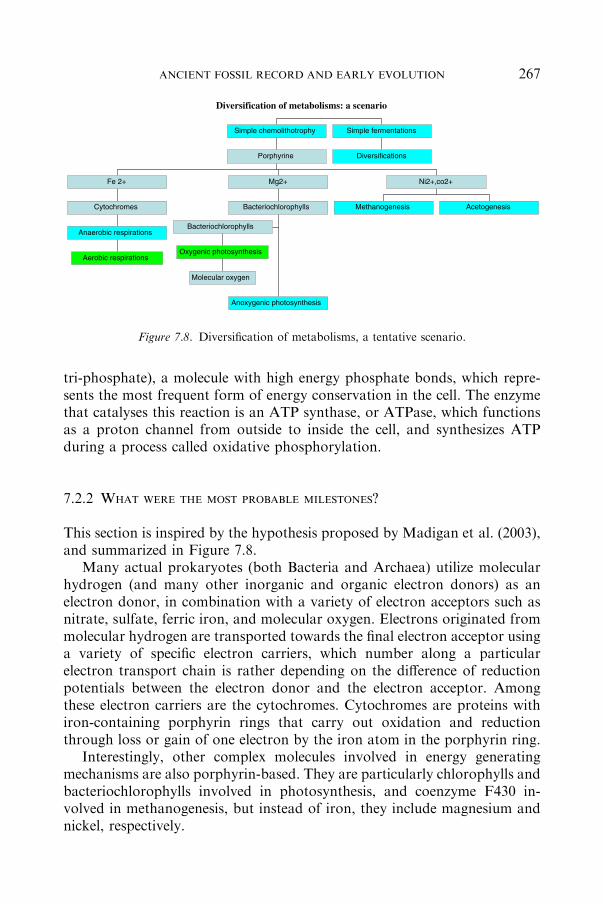
tri-phosphate), a molecule with high energy phosphate bonds, which repre-sents the most frequent form of energy conservation in the cell. The enzymethat catalyses this reaction is an ATP synthase, or ATPase, which functionsas a proton channel from outside to inside the cell, and synthesizes ATPduring a process called oxidative phosphorylation.
7.2.2 WHAT WERE THE MOST PROBABLE MILESTONES?
This section is inspired by the hypothesis proposed by Madigan et al. (2003),and summarized in Figure 7.8.
Many actual prokaryotes (both Bacteria and Archaea) utilize molecularhydrogen (and many other inorganic and organic electron donors) as anelectron donor, in combination with a variety of electron acceptors such asnitrate, sulfate, ferric iron, and molecular oxygen. Electrons originated frommolecular hydrogen are transported towards the final electron acceptor usinga variety of specific electron carriers, which number along a particularelectron transport chain is rather depending on the difference of reductionpotentials between the electron donor and the electron acceptor. Amongthese electron carriers are the cytochromes. Cytochromes are proteins withiron-containing porphyrin rings that carry out oxidation and reductionthrough loss or gain of one electron by the iron atom in the porphyrin ring.
Interestingly, other complex molecules involved in energy generatingmechanisms are also porphyrin-based. They are particularly chlorophylls andbacteriochlorophylls involved in photosynthesis, and coenzyme F430 in-volved in methanogenesis, but instead of iron, they include magnesium andnickel, respectively.
Diversification of metabolisms: a scenario
Aerobic respirations
Anaerobic respirations
Cytochromes
Fe 2+
Molecular oxygen
Oxygenic photosynthesis
Bacteriochlorophylls
Anoxygenic photosynthesis
Bacteriochlorophylls
Mg2+
Methanogenesis Acetogenesis
Ni2+,co2+
Porphyrine
Simple chemolithotrophy
Diversifications
Simple fermentations
Figure 7.8. Diversification of metabolisms, a tentative scenario.
267ANCIENT FOSSIL RECORD AND EARLY EVOLUTION
Thus the formation of porphyrin-like molecules might have constituted afirst step preceding the diversification of anaerobic respirations (includingmethanogenesis), which allowed living organisms to take advantage of thealmost infinite combination of electron donors and acceptors (both inorganicand inorganic) existing on Earth, particularly those yielding large amounts ofenergy such as molecular hydrogen (donor) and ferric iron (acceptor).Replacement of iron by magnesium within the porphyrin might have led tothe formation of photosensitive molecules: the bacteriochlorophylls and thechlorophylls. For the first time, organisms had the possibility to utilize solarlight as an unlimited primary energy source.
Photosynthesis (anoxygenic or oxygenic) allows the transformation ofphoton energy into chemical energy. Briefly, photons excite specific sensitivecompounds whose reduction potential becomes electronegative with theexcitation, which generates an electron flow, and finally ATP synthesis. Thenthese phototrophic organisms have to use their energy for synthesizingmacromolecules. Some of them can utilize already formed organic com-pounds from their environment, but many are autotrophs and utilize carbondioxide as a carbon source, via various biochemical pathways.
Transformation of carbon dioxide into organic carbons requires not onlyenergy, but also a reducing power. In case of molecular hydrogen-oxidizingorganisms, hydrogen can reduce carbon dioxide via the electron carriersNADH or NADPH. For some anoxygenic photosynthetic Bacteria (Greensulfur Bacteria and Heliobacteria) the primary electron acceptor is suffi-ciently electronegative for carbon dioxide reduction through the reverse citricacid cycle or the hydroxypropionate cycle. When an electron donor with aless favorable reduction potential (sulfide, ammonium, etc) is involved,organisms concerned must have recourse to an inverse electron flow. This isthe case for purple bacteria (anoxygenic phototrophs), which uptake theirreducing power from the environments, using electron donors such ashydrogen sulfide, ferrous iron or organic compounds.
A second, but major step, in the evolution of energy generating metabo-lisms, was the evolution of oxygenic photosynthesis, carried out by ancestorsof the Cyanobacteria. These organisms achieved a mechanism through whichthe reducing power required for carbon dioxide fixation came from photol-ysis of water, producing electrons, protons and molecular oxygen as aby-product. This production of molecular oxygen, probably hidden at itsbeginning by the presence of large amounts of reducing substances and/or itsimmediate consumption by evolving aerobic organisms, would provide theliving organisms the best electron acceptor, in terms of energy generation,and lead to the explosion of aerobic respiration.
Finally, the transfer of energy generating mechanisms invented by pro-karyotes (oxygenic photosynthesis and aerobic respiration) to primitiveeukaryotes through endosymbiosis, gave the best energetic processes to
268 P. LOPEZ-GARCIA ET AL.
lineages that evolved successfully into multicellular complex organisms. Onemust note that even if today photosynthetic driven life seems to dominate onearth, chemotrophy (organo-but also lithotrophy) is widespread (Karl et al.,1980; Cavanaugh, 1983; Parkes et al., 2000) and are the driving forces ofmany ecosystems such as deep-sea hydrothermal vents or deep marine sedi-ments (Karl et al., 1980; Cavanaugh, 1983; Parkes et al., 2000).
This tentative scenario might appear feasible but would require supportsthat will be impossible to obtain. Particularly, one cannot say if the scenariostarted before or after LUCA (see part 5.7), and how it could have beencoupled with the early genome evolution.
The most evident proof of this tentative succession of metabolisms is theincrease of molecular oxygen in the atmosphere, following the oxygenicphotosynthesis carried out by Cyanobacteria or their ancestors. But one canremind that today, when an aquarium is well balanced (chemically andbiologically speaking), nitrite (which results from aerobic ammonium oxi-dation) is immediately oxidized into nitrate by specific micro-organisms, andis almost or totally undetectable in the aquarium environment. Similarly, thefirst production of molecular oxygen could have been masked by immediatechemical oxidations, then by the first aerobic respirations, before oxygenproduction overcame oxygen utilization, and finally reached the equilibriumof the actual atmosphere. For these reasons, the discussion about the firstrecord of Cyanobacteria (or oxygenic photosynthetic organisms) and theoxygenation of the atmosphere is not finished yet.
Also, one must consider the size of micro-organisms and their habitats. Aone micrometer microbe is actually depending on physico-chemical condi-tions which exist in the surrounding micrometers: 1 mm for a micro-organism is equivalent to 1 km for a man. A remote analysis of Earth, andparticularly its atmosphere, could not detect the anaerobic life which mostprobably occurred first and still exist.
7.3. The Origin of Eukaryotes
PURIFICACION LOPEZ GARCIA, DAVID MOREIRA, PATRICK FORTERRE
AND EMMANUEL J. P. DOUZERY
The terms ‘prokaryote’ and ‘eukaryote’ were introduced with their modernmeaning by the microbiologists R. Stanier and C.B. van Niel in 1962 (Stanierand Van Niel, 1962; Sapp, 2005). They reflect the two major structuralpatterns in cellular organization. Eukaryotes, either unicellular (e.g. micro-algae, dinoflagellates, amoebas) or multicellular (e.g. plants, animals, fungi),are characterized by three major features that are missing in prokaryotes: awell-developed cytoskeleton of actin filaments and tubulin microtubules,membrane-bounded organelles (mitochondria, where respiration takes place
269ANCIENT FOSSIL RECORD AND EARLY EVOLUTION
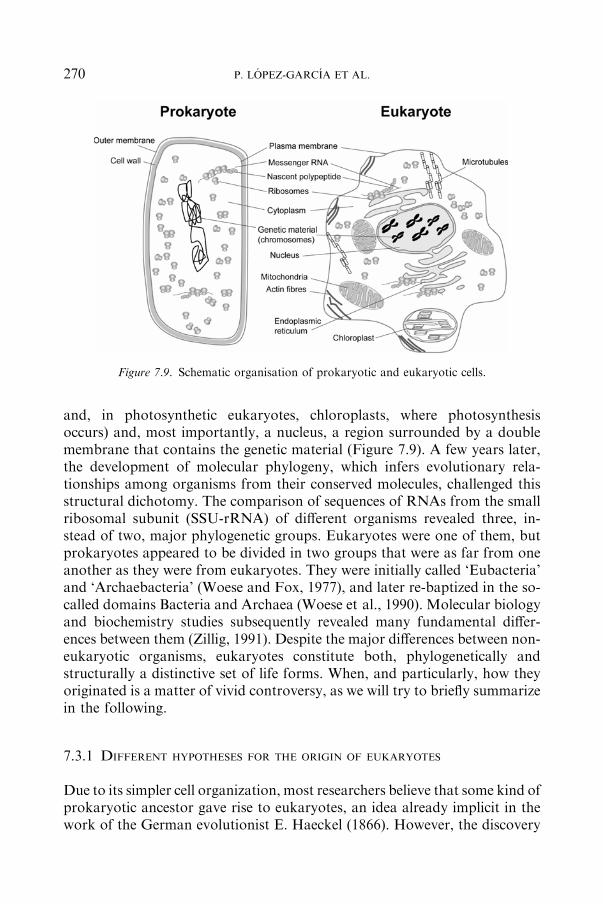
and, in photosynthetic eukaryotes, chloroplasts, where photosynthesisoccurs) and, most importantly, a nucleus, a region surrounded by a doublemembrane that contains the genetic material (Figure 7.9). A few years later,the development of molecular phylogeny, which infers evolutionary rela-tionships among organisms from their conserved molecules, challenged thisstructural dichotomy. The comparison of sequences of RNAs from the smallribosomal subunit (SSU-rRNA) of different organisms revealed three, in-stead of two, major phylogenetic groups. Eukaryotes were one of them, butprokaryotes appeared to be divided in two groups that were as far from oneanother as they were from eukaryotes. They were initially called ‘Eubacteria’and ‘Archaebacteria’ (Woese and Fox, 1977), and later re-baptized in the so-called domains Bacteria and Archaea (Woese et al., 1990). Molecular biologyand biochemistry studies subsequently revealed many fundamental differ-ences between them (Zillig, 1991). Despite the major differences between non-eukaryotic organisms, eukaryotes constitute both, phylogenetically andstructurally a distinctive set of life forms. When, and particularly, how theyoriginated is a matter of vivid controversy, as we will try to briefly summarizein the following.
7.3.1 DIFFERENT HYPOTHESES FOR THE ORIGIN OF EUKARYOTES
Due to its simpler cell organization, most researchers believe that some kind ofprokaryotic ancestor gave rise to eukaryotes, an idea already implicit in thework of the German evolutionist E. Haeckel (1866). However, the discovery
Figure 7.9. Schematic organisation of prokaryotic and eukaryotic cells.
270 P. LOPEZ-GARCIA ET AL.

that prokaryotes are profoundly divided in two groups phylogenetically dis-tinct complicated this view. Furthermore, the first gene comparisons, latercorroborated by the analysis of complete genome sequences, uncovered aparadox: eukaryotic genes related to DNA replication, transcription andtranslation – the basic informational core – resembled archaeal genes, whereasgenes involved in energy and carbon metabolism resembled their bacterialcounterparts (Rivera et al., 1998).How could thismixed heritage in eukaryotesbe explained? A variety of competing models have been put forward for re-views, see (Lopez-Garcıa andMoreira, 1999;Martin et al., 2001) (Figure 7.10).
7.3.1.1 Autogenous modelsThe most widely accepted proposal is an elaboration of the traditionalprokaryote-to-eukaryote transition, whereby the emergence of the nucleusand most of the other eukaryotic features occurred by complexification ofancestral structures that appeared in a single prokaryotic lineage (Cavalier-Smith, 1987). Since the first attempts to find the origin of the tree of lifeplaced the root along the bacterial branch, implying the sisterhood of archaeaand eukaryotes (Gogarten et al., 1989; Iwabe et al., 1989) (see Figure 5.10.Ain Chapter 5.7), the prokaryotic lineage from which eukaryotes emergedwould be archaeal-like (Woese et al., 1990; Brown and Doolittle, 1997). Inthis model, the eukaryotic bacterial-like genes would have been importedfrom mitochondria and chloroplasts to the nucleus, since it has beenunambiguously demonstrated that both organelles evolved from bacterialendosymbionts: mitochondria derive from alphaproteobacteria, and chloro-plasts from photosynthetic cyanobacteria (Gray and Doolittle, 1982). In avariant, the ‘you are what you eat’ model, those bacterial genes would comealso from bacterial preys (Doolittle, 1998). The nucleus would have formedby invagination of the cell membrane at the same time and by the samemechanism that the endoplasmic reticulum, an internal membrane system formacromolecule transport (Jekely, 2003) (Figure 7.10).
7.3.1.2 Chimeric modelsTo explain the mixed composition of eukaryotic genomes, various hypoth-eses propose that eukaryotes resulted from the union of two prokaryoticlines, one archaeal and one bacterial (see Figure 5.10.B in Chapter 5.7). Someproposals are relatively simple and suggest a direct fusion or some kind ofunspecified symbiosis of one archaeon and one bacterium (Zillig, 1991), ei-ther by an engulfment of one archaeon by a bacterium (Lake and Rivera,1994; Gupta and Golding, 1996) or by a hypothetical descendant of an RNAworld (Sogin, 1991) (Figure 7.10). Symbiosis-based models are the morecomprehensive of the chimeric proposals. Symbiosis (living-together) betweendifferent organisms does not imply merely the sum of the parts but may leadto the creation of novel functions and properties as a consequence of gene
271ANCIENT FOSSIL RECORD AND EARLY EVOLUTION

Alphaproteobacterium
Autogenous model
The nucleus evolved in anarchaeal-like lineage.
Mitochondria derive from a bacterial endosymbiont.
The model of Zillig 1991
Eukaryotes derive from a fusionor unspecified symbiosis
between one archaeon and one bacterium
The models ofLake & Rivera 1994
Gupta & Golding 1996
One bacterium engulfs a crenarchaeote ('eocyte'), a member of the Archaea
The model of Sogin 1991
An RNA-based proto-eukaryote engulfs an
archaeon
The model of Searcy 1992
Eukaryotes derive from a sulphur-based symbiosis
between a bacterium that became the mitochondrionand a Thermoplasma-like
archaeon
H2S
Hydrogen hypothesis Martin & Müller 1998
Eukaryotes emerged from a hydrogen-based symbiosis
between a fermentative alphaproteobacterium that became the mitochondrion
and a methanogenicarchaeon (Euryarchaeota)
COH
organic CH
Serial Endosymbiosis ModelMargulis 1993
A Thermoplasma-like archaeon established a
symbiosis withspirochetes, acquiring
motility. Later on, mitochondrial ancestors becames endosymbionts
Alphaproteobacterium
Syntrophy hypothesis Moreira & López-García 1998
Eukaryotes emerged from a hydrogen-based symbiosis
between a H2-producingmyxobacterium and a
methanogenic archaeon.Mitochondria derived from
methanotrophic alphaproteobacteria
organic
H
CO
CH
CO
A eukaryotic-like cenancestor
A nucleus-bearing eukaryotic-like organism
would be ancestral. It acquired mitochondria later
in evolution.
Alphaproteobacterium
A viral origin
The eukaryotic nucleuswould be the result of the
infection of a proto-eukaryotic lineage by a
complex virus
Figure 7.10. Different models for the origin of eukaryotes.
272 P. LOPEZ-GARCIA ET AL.
redundancy and increased evolutionary rate (Kirschner and Gerhart, 1998;Margulis and Fester, 1993). Excellent examples are mitochondria and chlo-roplasts, once bacterial endosymbionts, which have positively contributed tothe make-up of contemporary eukaryotes, attesting to the incontestableimportance of symbiosis in eukaryotic evolution. Under these models, a long-term symbiotic relationship between one archaeon and one bacterium couldhave ended up in a novel entity, a eukaryote.
Detailed symbiotic proposals for the origin of eukaryotes, those that ex-plicit a selective advantage for the involved partners, can be classified in twomain classes. A first group of models states that eukaryotes stemmed from asymbiosis established between the ancestor of mitochondria (a bacterium)and one archaeon, more precisely one euryarchaeote (Euryarchaeota andCrenarchaeota are the two major branches of Archaea) (Figure 7.10). Onehypothesis proposed a symbiosis between a wall-less euryarchaeote (aThermoplasma-like species) able to reduce S0 to H2S and a bacterium oxi-dizing H2S to S0. To increase the efficiency of the exchange of sulfur species,the bacterium (the future mitochondrion) became an endosymbiont of thearchaeon (Searcy, 1992). The hydrogen hypothesis states that the ancestorof mitochondria, one alphaproteobacterium able to ferment organicsliberating H2, established a symbiosis with a methanogenic archaeon (oneeuryarchaeote) using H2 to reduce CO2 to CH4. As in the previous case, thebacterium became an endosymbiont of the archaeon and, with time, themitochondrion (Martin and Muller, 1998). A second group of modelsenvisages that the bacterium involved in the initial eukaryogenetic symbiosiswas different from the mitochondrial ancestor, and that mitochondria de-rived from a second symbiotic event (Figure 7.10). The Serial EndosymbiosisTheory (SET) thus states that a first symbiosis was established between aThermoplasma-like archaeon and spirochetes, which would have conferredmotility to the ensemble, becoming eukaryotic flagella. The consortiumevolved to form a proto-eukaryotic cell that then acquired the mitochondrialendosymbiont (Margulis, 1981). The syntrophy hypothesis proposes thateukaryotes arose from a symbiosis based on interspecies hydrogen transferbetween an ancestral myxobacterium (gliding bacteria with complex devel-opmental cycles belonging to the deltaproteobacteria) and a methanogenicarchaeon. The ancestor of mitochondria would be a versatile alphaproteo-bacterium able, among others, to oxidize the CH4 produced by the archaeon(Moreira and Lopez-Garcıa, 1998; Lopez-Garcıa and Moreira, 1999).Whereas in the above-mentioned models the eukaryotic nucleus was formedde novo in the cytoplasm of the archaeal host, in the syntrophy hypothesis thenucleus would be a relic of the archaeal partner.
Since the different hypotheses predict that the eukaryotic nucleus shouldcontain genes coming from various specific prokaryotic groups, comparativegenomic analysis of the rapidly increasing number of prokaryotic and
273ANCIENT FOSSIL RECORD AND EARLY EVOLUTION

eukaryotic complete genome sequences should allow in a next future tocorroborate or refute some of these hypotheses.
7.3.1.3 Other modelsAlthough most authors favor a prokaryote-to-eukaryote transition, variousscientists have argued that prokaryotes are reduced descendants of morecomplex, eukaryotic-like ancestors already endowed with a nucleus (Bisset,1973; Reanney, 1974; Poole et al., 1998; Forterre and Philippe, 1999). In thiscase, the origin of eukaryotes would be in essence the origin of the last commonancestor to extant organisms (see Figure 5.10.D in chapter 5.7) which, later inevolution, acquired mitochondria. The recent discovery of a membranousenvelope containing the genetic material and part of the cytoplasm in thePlanctomycetales together with their apparent early-branching position in thebacterial tree has led some authors to suggest that they could be intermediatesbetween a eukaryotic ancestor and the rest of bacteria (Fuerst andWebb, 1991;Brochier and Philippe, 2002). However, the analysis of the genome sequence ofthe planctomycete Rhodopirellula baltica does not reveal any particular simi-larity with eukaryotes (Glockner et al., 2003). Finally, a recent set of modelsproposes that the eukaryotic nucleus derived from complex viruses related toPoxviruses (Bell, 2001; Takemura, 2001; Villarreal, 2005) (Figure 7.10).Several features of the Poxviruses cell cycle are reminiscent of the eukaryoticnucleus biology. In its original version, the authors of the viral eukaryogenesistheory suggested that the virus at the origin of the nucleus infected a wall-lessmethanogenic archaeon. Later on, it was proposed that the host was a moreprimitive cell (even possibly an RNA cell) (Forterre, 2005).
7.3.2 THE LAST COMMON ANCESTOR OF CONTEMPORARY EUKARYOTES
Be as it may, there is one certitude that is relevant for chronological aspects:modern eukaryotes emerged only after prokaryotes had appeared anddiversified. This is the only explanation to the fact that all known eukaryoteshave or have had mitochondria, which themselves derive from already quitemodified bacteria, the alphaproteobacteria. Eukaryotes lacking apparentmitochondria exist and, in addition, they branched at the base of theeukaryotic tree in initial phylogenetic analyses. For some time, they werethought to be primitive eukaryotes that preceded the mitochondrial acqui-sition (Sogin, 1991). However, subsequent studies refuted this view. First,several genes of undeniable mitochondrial origin were found in the genomesof these mitochondrial-lacking eukaryotes, suggesting that they harboredthese organelles once but lost them, in many cases because of a radicaladaptation to a parasitic lifestyle (Simpson and Roger, 2002). Second, theimprovement of evolutionary models in phylogenetic analyses together with
274 P. LOPEZ-GARCIA ET AL.
the incorporation of many more eukaryotic sequences showed that thoselineages had been misplaced to the base of the tree due to methodologicalartifacts (Simpson and Roger, 2002; Baldauf, 2003). Today, although theeukaryotic tree is not fully resolved, it is widely accepted that the last com-mon ancestor of extant eukaryotes possessed mitochondria. Most scientistsalso think that eukaryotes suffered a radiation, i.e. they diversified in a veryshort time span, which would explain the difficulties to determine the relativeorder of emergence of the major eukaryotic lineages (Philippe et al., 2000).The cause of that sudden radiation is unclear. For some authors it was theacquisition of mitochondria which, providing O2 respiration, granted a greatselective advantage to colonize a variety of new ecological niches (Philippeet al., 2000). In conclusion, eukaryotes sensu stricto – i.e. possessing anucleus, a well-developed cytoskeleton and organelles – evolved after andderived, at least partly, from prokaryotes. But when?
7.3.3 WHEN DID EUKARYOTES APPEAR AND DIVERSIFY?
7.3.3.1 Fossil recordThere is little agreement as to when the first eukaryotic traces appeared in thefossil record. The oldest traces claimed to be of eukaryotic origin arebiochemical: sterane compounds found in 2.7 Ga old kerogenes (Brockset al., 1999). Steranes are fossil lipids derived from sterols, typically synthe-sized by eukaryotes. However, this finding is highly controversial because (i)a later contamination of this material by eukaryotes is possible, and (ii) manybacterial groups also synthesize sterols including, at least, methanotrophicbacteria, cyanobacteria, myxobacteria, actinobacteria and planctomycetes(Ourisson et al., 1987; Pearson et al., 2003). The oldest morphologicaleukaryotic fossils have been claimed to correspond to the coiled, spaghetti-like Grypania spiralis (~2 Ga ago) because of their large size (Han andRunnegar, 1992). However, size alone is not a definitive criterion as pro-karyotic and eukaryotic sizes overlap (Javaux et al., 2003). The eukaryoticstatus of Grypania is highly discussed, as it may rather simply correspond tolarge cyanobacterial filaments (Cavalier-Smith, 2002). Surface ornamenta-tion appears to be a more defining criterion since unicellular eukaryotes oftendisplay different scales and other surface structures that confer them anidiosyncratic aspect, while prokaryotes lack decoration in individual cells.The oldest decorated fossils, acritarchs, date from 1.5 Ga ago and wereidentified in the Mesoproterozoic Roper Group (Northern Australia) (Jav-aux et al., 2001). It is however difficult to relate this fossil group to any of theextant eukaryotic lineages (Javaux et al., 2003). The oldest fossils that havebeen assigned to a modern eukaryotic lineage correspond to Bangiomorphapubescens, claimed to belong to red algae (Butterfield et al., 1990), and dated
275ANCIENT FOSSIL RECORD AND EARLY EVOLUTION

from 723 Ma to 1.267 Ga ago, yet certainly closer to the latter bound(Butterfield, 2001). In summary, although there is reasonable morphologicalevidence suggesting that eukaryotes have developed by 1.5 Ga ago, theirtraces are sparse in rocks older than 1 Ga; Cavalier-Smith (2002) has evenproposed that eukaryotes appeared in the fossil record only relatively re-cently, ~850 Ma ago, and that all older eukaryotic-like fossils correspondedto extinct groups of morphologically complex bacteria.
7.3.3.2 Molecular datingDue to the scarcity of the eukaryote fossil record, the chronology of theirorigin and diversification has always been difficult to establish (Knoll, 2003).Comparative analysis of genomic data – homologous DNA, RNA, andprotein sequences sampled from eukaryotic genomes – provided an alterna-tive approach to reconstruct the history of life on Earth by (inter)connectinggeological, paleontological, and biological information (Benner et al., 2002).Biomacromolecular sequences retain information about past history, andtheir degree of divergence among organisms has been correlated to the timeof separation from their last recent common ancestor: the greater the numberof differences between genomes or proteomes, the deeper the age of the splitbetween the corresponding species. This hypothesis of a molecular clockticking in biomolecules, i.e. the relative constancy of molecular evolutionaryrate over time (Zuckerkandl and Pauling, 1965), is presented and discussed inChapter 2.4 (Biological chronometers: the molecular clocks).
Several molecular dating studies attempted to evaluate divergence timesof the major lineages of eukaryotes, with special focus on plants, animals,and fungi (Table 7.1). A striking concern about these independent multigenestudies is the large range of estimates proposed for eukaryotic divergencetimes. For example, the dichotomy between animals and fungi is supposedto have occurred between 1.513 Ga ago (beginning of the Mesoproterozoic:Hedges et al., 2004) and 984 Ma ago (beginning of the Neoproterozoic;Douzery et al., 2004). Deeper divergence times corresponding to the splitbetween unicellular (protists) and multicellular eukaryotes also display awide range of estimates, from 1.545 to 2.309 Ga ago (Table 7.1). It wouldbe desirable to directly compare all these results, but the different datingapproaches (global vs. relaxed molecular clocks), genes and proteins (vari-able number of sites sampled from nuclear and plastid compartments),paleontological calibrations (from one to six, with or without incorporationof fossil record uncertainty), and taxon samplings make this difficult.However, more reliable estimates are expected to be inferred from largerdata sets (typically more than 100 markers in order to reduce stochasticerrors), under relaxed molecular clocks that are not hampered by thedetection of constant rate sequences, and with the aid of several indepen-dent primary calibrations. In this context, the age of the dichotomy between
276 P. LOPEZ-GARCIA ET AL.

TABLE
7.1.
Moleculardatingofthedivergence
ofthemajorgroupsofeukaryotescompiled
from
severalreferences
Splits
Ages
(Ma)
Markers
Clocks
Calibrations
References
Anim
als+
Fungi
984(SD±
65)
129proteins
Relaxed
(rate
auto
correlation)
6constraints
(P)
Douzery
etal.(2004)
30,399aa
Anim
als+
Fungi
1513(SE±
66)
69–92proteins
Global/Relaxed
1constraint(P)
Hedges
etal.(2004)
31,362aa
3points
(S)
Plants–Anim
als–Fungi
1215–1272(–)
64proteins
Global
6points
(P)
Fenget
al.(1997)
25,000aa
Plants–Anim
als–Fungi
1576(SD±
88)
38proteins
Global
1point(P)
Wanget
al.(1999)
22,888aa
Plants–Anim
als–Fungi
1392(SE±
256)
11proteins
Global
1point(P)
Nei
etal.(2001)
3310aa
Plants/[Anim
als+
Fungi]
1085(SD±
79)
129proteins
Relaxed
(rate
auto
correlation)
6constraints
(P)
Douzery
etal.(2004)
30,399aa
Plants/[Anim
als+
Fungi]
1609(SE±
60)
99–143proteins
Global/Relaxed
1constraint(P)
Hedges
etal.(2004)
60,274aa
3points
(S)
Photosynthetic
eukaryotes/Anim
als
>1558(1531–1602)
6plastid
genes
Relaxed
(penalized)
6constraints
(P)
Yoonet
al.(2004)
7111nt
Protists/Plants–Anim
als–Fungi
1545(–)
64proteins
Global
6points
(P)
Fenget
al.(1997)
25,000aa
Protists/Plants–Anim
als–Fungi
1717(SE±
349)
11proteins
Global
1point(P)
Nei
etal.(2001)
3310aa
277ANCIENT FOSSIL RECORD AND EARLY EVOLUTION
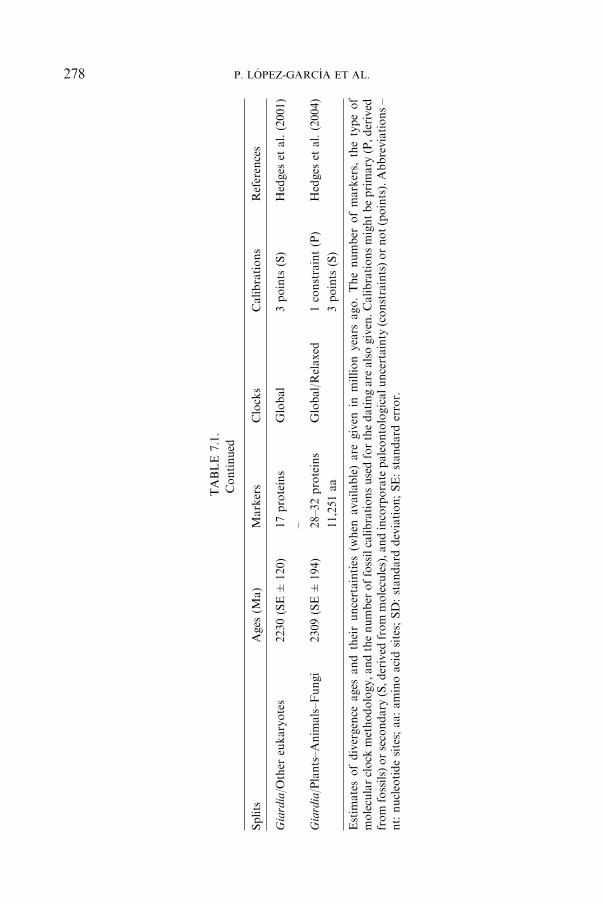
TABLE
7.1.
Continued
Splits
Ages
(Ma)
Markers
Clocks
Calibrations
References
Giardia/O
ther
eukaryotes
2230(SE±
120)
17proteins
Global
3points
(S)
Hedges
etal.(2001)
–
Giardia/Plants–Anim
als–Fungi
2309(SE±
194)
28–32proteins
Global/Relaxed
1constraint(P)
Hedges
etal.(2004)
11,251aa
3points
(S)
Estim
atesofdivergence
ages
andtheiruncertainties
(when
available)are
given
inmillionyears
ago.Thenumber
ofmarkers,
thetypeof
molecularclock
methodology,andthenumber
offossilcalibrationsusedforthedatingare
alsogiven.Calibrationsmightbeprimary
(P,derived
from
fossils)orsecondary
(S,derived
from
molecules),andincorporate
paleontologicaluncertainty
(constraints)ornot(points).Abbreviations–
nt:nucleotidesites;aa:aminoacidsites;SD:standard
deviation;SE:standard
error.
278 P. LOPEZ-GARCIA ET AL.

plants (i.e., photosynthetic eukaryotes) and animals + fungi would becloser to 1.085 Ga ago (Douzery et al., 2004) than to 1.609 Ga ago (Hedgeset al., 2004). This suggests that primary plastids resulting from the endo-symbiosis of a free-living cyanobacterium appeared at the end of theMesoproterozoic some 1.1 Ga ago.
The postulated anoxic and sulfidic redox status of oceans until 1 Ga mighthave limited the rise of photosynthetic eukaryotes (Anbar and Knoll, 2002),whereas cytoskeletal and ecological prerequisites for their diversification werealready established some 1.5 Ga ago (Javaux et al., 2001). The more oxy-genic environments of the Neoproterozoic (1 Ga to 540 Ma) could possiblyhave triggered the diversification of the major eukaryotic lineages, culmi-nating with the seemingly abrupt appearance of animals in the Cambrianexplosion (Conway Morris, 2000).
7.4. The Neoproterozoic–Cambrian Transition (~1000 to 542 Ma)
PHILIPPE CLAEYS
The end of the Proterozoic (Neoproterozoic ~1000 to 542 Ma) correspondsto a period of major global changes most likely initiated by the break-up ofthe supercontinent Rodania around 750 Ma ago (Kah and Bartley, 2001).Three widespread and severe glaciation events occur during the Neoprote-rozoic: the Sturtian (~710 to 725 Ma), the Marinoan (~635 to 600 Ma), andGaskiers (~580 Ma) (Figure 7.11). These events are identified based on iso-topic profiles (13C/12C and 87Sr/86Sr) and the repetitive accumulation of thickpackages of glacial sediments, recognized worldwide. These tillites (or dia-mictites) are commonly covered by distinctive cap carbonates, which, curi-ously, almost certainly precipitated inorganically under warm-waterconditions. The Sturtian and Marinoan events were probably the most ex-treme glaciations recorded on Earth. Evans (2000) provided paleomagneticevidence for the presence of glaciers at sea level within 10 � from the Neo-proterozoic equator. Hoffman et al. (1998a) proposed that the Sturtian andMarinoan were global glaciations covering the entire planet, commonly re-ferred to as the Snowball Earth hypothesis. The thick ice cover (up to 1 km)implies a drastic reduction in photosynthesis and a collapse of biologicalproductivity that best explains the intensity of the negative carbon isotopicanomalies (up to �14& in surface ocean ¶13C) recorded in carbonates brac-keting glacial sediments (Hoffman et al., 1998a). The presence of continentalice inhibited silicate weathering, another CO2 sink, leading to its accumulationin the atmosphere. Outgassing by subaerial volcanoes contributed further tothe increase of CO2 in the atmosphere throughout the icehouse period. Theglacial conditions ended abruptly when greenhouse gas concentrations
279ANCIENT FOSSIL RECORD AND EARLY EVOLUTION
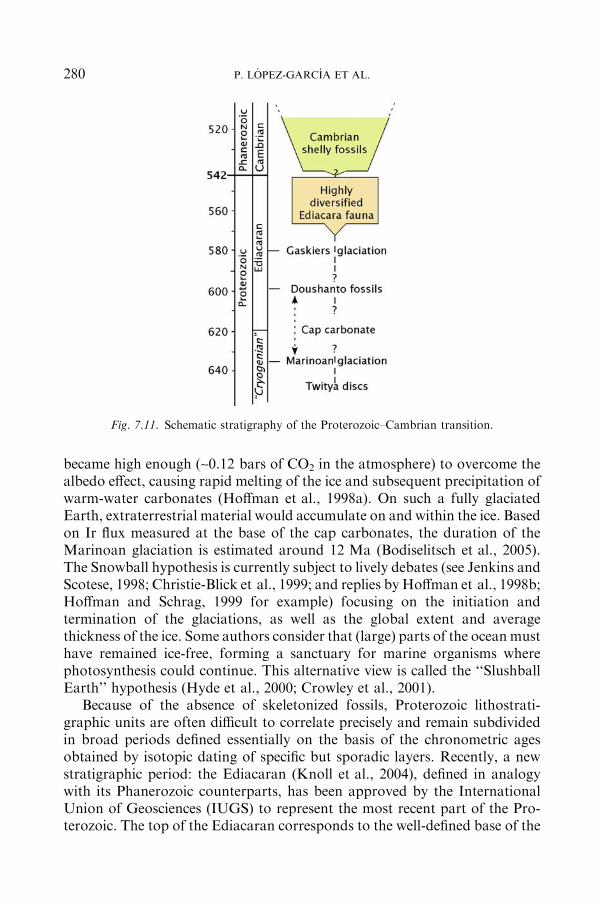
became high enough (~0.12 bars of CO2 in the atmosphere) to overcome thealbedo effect, causing rapid melting of the ice and subsequent precipitation ofwarm-water carbonates (Hoffman et al., 1998a). On such a fully glaciatedEarth, extraterrestrial material would accumulate on and within the ice. Basedon Ir flux measured at the base of the cap carbonates, the duration of theMarinoan glaciation is estimated around 12 Ma (Bodiselitsch et al., 2005).The Snowball hypothesis is currently subject to lively debates (see Jenkins andScotese, 1998; Christie-Blick et al., 1999; and replies by Hoffman et al., 1998b;Hoffman and Schrag, 1999 for example) focusing on the initiation andtermination of the glaciations, as well as the global extent and averagethickness of the ice. Some authors consider that (large) parts of the ocean musthave remained ice-free, forming a sanctuary for marine organisms wherephotosynthesis could continue. This alternative view is called the ‘‘SlushballEarth’’ hypothesis (Hyde et al., 2000; Crowley et al., 2001).
Because of the absence of skeletonized fossils, Proterozoic lithostrati-graphic units are often difficult to correlate precisely and remain subdividedin broad periods defined essentially on the basis of the chronometric agesobtained by isotopic dating of specific but sporadic layers. Recently, a newstratigraphic period: the Ediacaran (Knoll et al., 2004), defined in analogywith its Phanerozoic counterparts, has been approved by the InternationalUnion of Geosciences (IUGS) to represent the most recent part of the Pro-terozoic. The top of the Ediacaran corresponds to the well-defined base of the
Fig. 7.11. Schematic stratigraphy of the Proterozoic–Cambrian transition.
280 P. LOPEZ-GARCIA ET AL.

Cambrian, dated at 542 Ma (Gradstein et al., 2004). Its base is placed in adistinct carbonate layer that overlies sediment deposited by the Marinoanglaciation in the Flinders Ranges of South Australia (Figure 7.11). The baseof the Ediacaran is not precisely dated. It is younger than an U-Pb date of635.5±1.2 Ma measured on zircons from within the glacial diamictites ofNamibia and older than a Pb–Pb date of 599±4 Ma obtained on post-glacialphosphorites in China (Barfod et al., 2002; Hoffman et al., 2004; Knoll et al.,2004). In term of event stratigraphy, the Ediacaran is bounded above by therapid diversification of shelly organisms and below by the Marinoan ice ageof global extent (Knoll et al., 2004).
The Ediacaran period is characterized by the presence of the traces of soft-body organisms fossilized as impression on sandstone beds or less commonlyon ash-layers (Figure 7.12). Such fossils lacking a mineralized shell (orskeleton) differ significantly from their Phanerozoic counterparts. Namedafter the remarkable collection recognized in South Australia, almost60 years ago, the Ediacara fauna occurs worldwide (30 localities on 5 con-tinents, Narbonne, 1998). At most localities, the preserved fossils attest ofhighly diversified and sophisticated organisms displaying a great variety of
Figure 7.12. Ediacaran fauna. (A) reconstruction of the Ediacaran environment; (B) Chania(Cnidaria?); (C) Dickensonia (worm? cnidaria?); (D) Mawsonites (medusa); (E) Pikaia, Bur-
gess Pass (first known chordate).
281ANCIENT FOSSIL RECORD AND EARLY EVOLUTION

shapes and sizes. This complex fauna forms a biological transition betweenthe modern shelly organisms of the Phanerozoic and the essentially microbialcommunities of the Proterozoic, dominated by prokaryotes and microbialeukaryotes including algae. Although, the first Eukaryotes probablyappeared between 2.7 and 1.8 Ga ago, they do not seem to have beenabundant or diversified until the end of the Proterozoic (Knoll, 2003). Javauxet al. (2004) reported the presence of a moderate diversity of probableeukaryotic remains, among a fauna rich in protistan microfossils in carbo-naceous shales dated between 1.5 and 1.4 Ga from Australia.
Either Snowball or Slushball, both scenarios seem capable to stronglyinfluence the evolution of life. Ediacara fauna diversified within a few millionyears after the last Neoproterozoic glacial event (Narbonne, 2005). The lesssevere glaciation at the end of the Ordovician caused one of the major massextinctions of the Phanerozoic (Sheehan et al., 1996). Although not clearlylinked to extinction, these Neoproterozoic glaciations followed by green-house conditions, must have been harsh selection factors, possibly triggeringin their aftermath the radiation of Ediacaran organisms. An issue that re-mains unclear is the role of the rising oxygen concentrations (Knoll, 2003).The level of oxygen necessary for the development of large-scale metazoans isestimated between 1% and 10% of that of the present day (Knoll andHolland, 1994). Post-glacial oxygenation may also have favored the diver-sification of the Ediacara organisms (Narbonne, 2005).
The characteristic Ediacara biota clearly marks the first appearance onEarth of large, complex and highly diversified communities. These fossilassemblages contain radial and bilateral organisms constituting, perhaps theroot-stock of the Cambrian radiation, possible life-forms belonging to other,now extinct, eukaryotic phyla or kingdoms, and/or what appear as ‘‘failedexperiments’’ in animal evolution (see Narbonne, 2005 for a detailed review).The stratigraphic distribution of the Ediacara organisms is rather well con-strained. The Twitya formation of northwestern Canada contains, just belowthe Marinoan tillites, a poorly diversified assemblage of ‘‘Twitya discs’’considered perhaps as the oldest known Ediacara-type fossils (Hofmannet al., 1990). Possible bilaterian eggs and embryos as well as fossilized cni-darian may be present in the Doushantuo formation in China (Xiao et al.,1998), which is dated by Pb–Pb and Lu–Hf on phosphates between 599 and584 Ma (Barfod et al., 2002). These still enigmatic fossils clearly predate themajor radiation of Ediacara organisms. Conway Morris (1998) recognizesrare Ediacara survivors among the Cambrian Burgess shale fauna. Never-theless, the typical, highly diversified Ediacara fauna is restricted to a well-constrained stratigraphic interval between ~575 and 542 Ma (Figure 7.11);starting just above the youngest glacial deposits (Gaskiers) of the Neopro-terozoic and extending to the very base of the Cambrian (Narbonne, 2005).
282 P. LOPEZ-GARCIA ET AL.
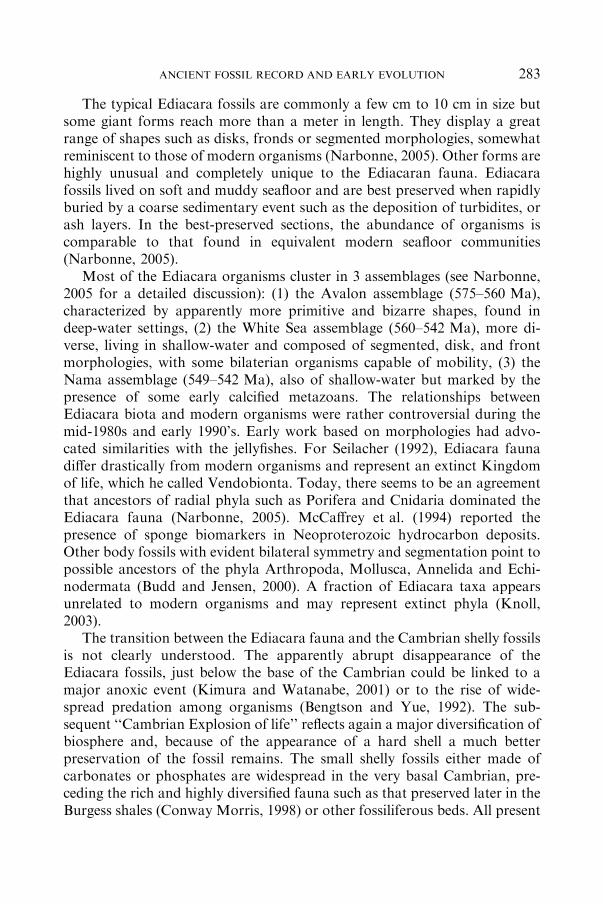
The typical Ediacara fossils are commonly a few cm to 10 cm in size butsome giant forms reach more than a meter in length. They display a greatrange of shapes such as disks, fronds or segmented morphologies, somewhatreminiscent to those of modern organisms (Narbonne, 2005). Other forms arehighly unusual and completely unique to the Ediacaran fauna. Ediacarafossils lived on soft and muddy seafloor and are best preserved when rapidlyburied by a coarse sedimentary event such as the deposition of turbidites, orash layers. In the best-preserved sections, the abundance of organisms iscomparable to that found in equivalent modern seafloor communities(Narbonne, 2005).
Most of the Ediacara organisms cluster in 3 assemblages (see Narbonne,2005 for a detailed discussion): (1) the Avalon assemblage (575–560 Ma),characterized by apparently more primitive and bizarre shapes, found indeep-water settings, (2) the White Sea assemblage (560–542 Ma), more di-verse, living in shallow-water and composed of segmented, disk, and frontmorphologies, with some bilaterian organisms capable of mobility, (3) theNama assemblage (549–542 Ma), also of shallow-water but marked by thepresence of some early calcified metazoans. The relationships betweenEdiacara biota and modern organisms were rather controversial during themid-1980s and early 1990’s. Early work based on morphologies had advo-cated similarities with the jellyfishes. For Seilacher (1992), Ediacara faunadiffer drastically from modern organisms and represent an extinct Kingdomof life, which he called Vendobionta. Today, there seems to be an agreementthat ancestors of radial phyla such as Porifera and Cnidaria dominated theEdiacara fauna (Narbonne, 2005). McCaffrey et al. (1994) reported thepresence of sponge biomarkers in Neoproterozoic hydrocarbon deposits.Other body fossils with evident bilateral symmetry and segmentation point topossible ancestors of the phyla Arthropoda, Mollusca, Annelida and Echi-nodermata (Budd and Jensen, 2000). A fraction of Ediacara taxa appearsunrelated to modern organisms and may represent extinct phyla (Knoll,2003).
The transition between the Ediacara fauna and the Cambrian shelly fossilsis not clearly understood. The apparently abrupt disappearance of theEdiacara fossils, just below the base of the Cambrian could be linked to amajor anoxic event (Kimura and Watanabe, 2001) or to the rise of wide-spread predation among organisms (Bengtson and Yue, 1992). The sub-sequent ‘‘Cambrian Explosion of life’’ reflects again a major diversification ofbiosphere and, because of the appearance of a hard shell a much betterpreservation of the fossil remains. The small shelly fossils either made ofcarbonates or phosphates are widespread in the very basal Cambrian, pre-ceding the rich and highly diversified fauna such as that preserved later in theBurgess shales (Conway Morris, 1998) or other fossiliferous beds. All present
283ANCIENT FOSSIL RECORD AND EARLY EVOLUTION

day phyla, along with a few enigmatic taxa, are already present at this level ofthe Cambrian. No new phylum will emerge in the next 500 Ma.
References
Allwood, A. C., Walter, M. R., Kamber, B. S., Marshall, C. P. and Burch, I. W.: 2006, Nature
441, 714–718.Anbar, A. D.: 2004, Earth Planet. Sci. Lett. 217, 223–236.Anbar, A. D. and Knoll, A. H.: 2002, Science 297, 1137–1142.Appel, P. W. U., Moorbath, S. and Myers, J. S.: 2003, Precambrian Res. 126, 309–312.
Awramik, S. M., Schopf, J. W. and Walter, M. R.: 1983, Precambrian Res. 20, 357–374.Baldauf, S. L.: 2003, Science 300, 1703–1706.Barfod, G. H., Albarede, F., Knoll, A. H., Xiao, S., Telouk, P., Frei, R. and Baker, J.: 2002,
Earth Planet. Sci. Lett. 201, 203–212.Beaumont, V. and Robert, F.: 1999, Precambrian Res. 96, 63–82.Bebout, G. E. and Fogel, M. L.: 1992, Geochim. Cosmochim. Acta 56, 2839–2849.
Bekker, A., Holland, H. D., Wang, P.-L., Rumble III, D., Stein, H. J., Hannah, J. L., Coetzee,L. L. and Beukes, N. J. 2004, Nature, 117–120.
Bell, P. J.: 2001, J. Mol. Evol. 53, 251–256.Bengtson, S. and Yue, Z.: 1992, Science 257, 367–369.
Benner, S. A., Caraco, M. D., Thomson, J. M. and Gaucher, E. A.: 2002, Science 296,864–868.
Beukes, N. J.: 2004, Nature 431, 522–523.
Beyssac, O., Goffe, B., Chopin, C. and Rouzaud, J. N.: 2002, J. Metamor. Geol. 2002(20),859–871.
Bisset, K. A.: 1973, Nature 241, 45.
Boak, J. L. and Dymek, R. F.: 1982, Earth Planet. Sci. Lett. 59, 155–176.Bodiselitsch, B., Koeberl, C., Master, S. and Reimold, W. U.: 2005, Science 308, 239–242.Bosak, T., Souza-Egipsy, V., Corsetti, F. A. and Newman, D. K.: 2004, Geology 32, 781–784.
Brasier, M., Green, O. R., Jephcoat, A. P., Kleppe, A., Van Kranendonk, M. J., Lindsay,J. F., Steele, A. and Grassineau, N. V.: 2002, Nature 416, 76–81.
Brasier, M., Green, O. R., Lindsay, J. F., McLoughlin, N., Steele, A. and Stoakes, C.: 2005,Precambrian Res. 140, 55–102.
Brochier, C. and Philippe, H.: 2002, Nature 417, 244.Braterman, P. S., Cairns-Smith, A. G. and Sloper, R. W.: 1983, Nature 303, 163–164.Brocks, J. J., Logan, G. A., Buick, R. and Summons, R. E.: 1999, Science 285, 1025–1027.
Brocks, J. J., Love, G. D., Snape, C. E., Logan, G. A., Summons, R. E. and Buick, R.: 2003,Geochim. Cosmochim. Acta 67, 1521–1530.
Brown, J. R. and Doolittle, W. F.: 1997, Microbiol. Mol. Biol. Rev. 61, 456–502.
Budd, G. E. and Jensen, S.: 2000, Biol. Rev. 75, 253–295.Buick, R. and Dunlop, J. S. R.: 1990, Sedimentology 37, 247–277.Buick, R., Dunlop, J. S. R. and Groves, D. I.: 1981, Alcheringa 5, 161–181.Bullen, T. D., White, A. F., Childs, C. W., Vivit, D. V. and Schulz, M. S.: 2001, Geology 29,
699–702.Butterfield, N. J., Knoll, A. H. and Swett, K.: 1990, Science 250, 104–107.Butterfield, N. J.: 2001, Precambrian Res. 111, 235–256.
Batchelor, M. T., Burne, R. V., Henry, B. I. and Jackson, M. J.: 2004, Physica A – Stat. Mech.Appl. 337, 319–326.
284 P. LOPEZ-GARCIA ET AL.

Byerly, G. R., Lowe, D. R. and Walsh, M.: 1986, Nature 319, 489–491.Canfield, D. E. and Raiswell, R.: 1999, Am. J. Sci. 299, 697–723.
Cavanaugh, C.: 1983, Nature 302, 340–341.Cavalier-Smith, T.: 1987, Ann. N. Y. Acad. Sci. 503, 17–54.Cavalier-Smith, T.: 2002, Int. J. Syst. Evol. Microbiol. 52, 7–76.
Charlou, J. L., Fouquet, Y., Bougault, H., Donval, J. P., Etoubleau, J., Jean-Baptiste, P.,Dapoigny, A., Appriou, P. and Rona, P. A.: 1998, Geochim. Cosmochim. Acta 62, 2323–2333.
Chen, J.-Y., Bottjer, D. J., Oliveri, P., Dornbos, S. Q., Gao, F., Ruffins, S., Chi, H., Li, C. -W.
and Davidson, E. H.: 2004, Science 305, 218–222.Christie-Blick, N., Sohl, L. E. and Kennedy, M. J.: 1999, Science 284, 1087a.Chyba, C. F.: 1993, Geochim. Cosmochim. Acta 57, 3351–3358.
Conway Morris, S.: 1998. The Crucible of Creation: The Burgess Shale and The Rise ofAnimals, Oxford University Press, Oxford, 242 pp.
Conway Morris, S.: 2000, Proc. Natl. Acad. Sci. USA 97, 4426–4429.
Croal, L. R., Johnson, C. M., Beard, B. L. and Newman, D. K.: 2004, Geochim. Cosmochim.Acta 68, 1227–1242.
Crowley, T. J., Hyde, W. T. and Peltier, W. R.: 2001, Geophys. Res. Lett. 28, 283–236.
Dauphas, N., van Zuilen, M. A., Wadhwa, M., Davis, A. M., Marty, B. and Janney, P. E.:2004, Science 306, 2077–2080.
de Ronde, C. E. J. and Ebbesen, T. W.: 1996, Geology 24, 791–794.de Wit, M. J., Hart, R., Martin, A. and Abbott, P.: 1982, Econ. Geol. 77, 1783–1802.
de Wit, M. J. and Hart, R. A.: 1993, Lithos 30, 309–335.Des Marais, D. J. and Morre, J. G.: 1984, Earth Planet. Sci. Lett. 69, 43–47.Dimroth, E.: 1982, in A. V. Sidorenko (ed.), Sedimentary Geology of the Highly Metamor-
phosed Precambrian Complexes, pp. 16–27.Doolittle, W. F.: 1998, Trends Genet. 14, 307–311.Douzery, E. J. P., Snell, E. A., Bapteste, E., Delsuc, F. and Philippe, H.: 2004, Proc. Natl.
Acad. Sci. USA 101, 15386–15391.Durand, B.: 1980, Kerogen: Insoluble Organic Matter from Sedimentary Rocks.Dymek, R. F. and Klein, C.: 1988, Precambrian Res. 39, 247–302.
Evans, D. A. D.: 2000, Am. J. Sci. 300, 347–433.Fedo, C. M. and Whitehouse, M.: 2002a, Science 296, 1448–1452.Fedo, C. M. and Whitehouse, M. J.: 2002b, Science 298, 917.Feng, D. F., Cho, G. and Doolittle, R. F.: 1997, Proc. Natl. Acad. Sci. USA 94, 13028–13033.
Foriel, J., Philippot, P., Rey, P., Somogyi, A., Banks, D. and Menez, B.: 2004, Earth Planet.Sci. Lett. 228, 451–463.
Forterre.: 2005, Bichimie 87, 793–803.
Forterre, P. and Philippe, H.: 1999, Biol. Bull. 196, 373–375.French, B. M.: 1971, Am. J. Sci. 271, 37–78.Friend, C. R. L., Nutman, A. P. and Bennett, V. C.: 2002, Science 298, 917.
Fuerst, J. A. and Webb, R.: 1991, Proc. Natl. Acad. Sci. USA 88, 8184–8188.Furnes, H., Banerjee, N. R., Muehlenbachs, K., Staudigel, H. and de Wit, M.: 2004, Science
304, 578–581.Garcia-Ruiz, J. M., Hyde, S. T., Carnerup, A. M., Van Kranendonk, M. J. and Welham,
N. J.: 2003, Science 302, 1194–1197.Glockner, F. O., Kube, M., Bauer, M., Teeling, H., Lombardot, T., Ludwig, W., Gade, D.,
Beck, A., Borzym, K., Heitmann, K., Rabus, R., Schlesner, H., Amann, R. and Reinhardt,
R.: 2003, Proc. Natl. Acad. Sci. USA 30, 30.
285ANCIENT FOSSIL RECORD AND EARLY EVOLUTION

Gogarten, J. P., Kibak, H., Dittrich, P., Taiz, L., Bowman, E. J., Bowman, B. J., Manolson,M. F., Poole, R. J., Date, T., Oshima, T., Konishi, J., Denda, K. and Yoshida, M.: 1989,
Proc. Natl. Acad. Sci. USA 86, 6661–5.Gradstein, F. M., Ogg, J. G., Smith, A. G., Agterberg, F. P., Bleeker, W., Cooper, R. A.,
Davydov, V., Gibbard, P., Hinnov, L., M. R. H., Lourens, L., Luterbacher, H.-P.,
McArthur, J.,Melchin,M. J., Robb, L. J., Shergold, J., Villeneuve,M.,Wardlaw, B. R., Ali,J., Brinkhuis, H., Hilgen, F. J., Hooker, J., Howarth, R. J., Knoll, A. H., Laskar, J.,Monechi, S., Powell, J., Plumb, K. A., Raffi, I., Rohl, U., Sanfilippo, A., Schmitz, B.,Shackleton, N. J., Shields, G. A., Strauss, H., Dam, J. V., Veizer, J., Kolfschoten, T.v. and
Wilson, D.: 2004,AGeological Time Scale 2004, CambridgeUniversity, Cambridge, 610 pp.Gray, M. W. and Doolittle, W. F.: 1982, Microbiol. Rev. 46, 1–42.Grotzinger, J. P. and Knoll, A. H.: 1999, Annu. Rev Earth Planet. Sci. 27, 313–358.
Grotzinger, J. P. and Rothman, D. H.: 1996, Nature 383, 423–425.Gupta, R. S. and Golding, G. B.: 1996, Trends Biochem. Sci. 21, 166–71.Haeckel, E.: 1866. Generelle Morphologie der Organismen: Allgemeine Grundzuge der organ-
ischen Formen-Wissenschaft, mechanisch begrundet durch die von Charles Darwin reformirteDescendenz-Theorie, Georg Reimer, Berlin.
Han, T. M. and Runnegar, B.: 1992, Science 257, 232–235.
Hanor, J. S. and Duchac, K. C.: 1990, J. Geol. 98, 863–877.Hayes, J. M., Kaplan, I. R. and Wedeking, W.: 1983, in J.W. Schopf (ed.), Earth’s Earliest
Biosphere, Its Origin and Evolution, Princeton University Press, pp. 93–134.Hedges, S. B., Blair, J. E., Venturi, M. L. and Shoe, J. L.: 2004, BMC Evol. Biol. 4, 2.
Hedges, S. B., Chen, H., Kumar, S., Wang, D. Y., Thompson, A. S. and Watanabe, H.: 2001,BMC Evol. Biol. 1, 4.
Hoffman, H. J., Grey, K., Hickman, A. H. and Thorpe, R.: 1999, Geol. Soc. Am. Bull. 111,
1256–1262.Hoffman, P. F., Kaufman, A. J., Halverson, G. P. and Schrag, D. P.: 1998a, Science 281,
1342–1346.
Hoffman, P. F. and Schrag, D. P.: 1999, Science 284, 1087a.Hoffman, P. F., Schrag, D. P., Halverson, G. P. and Kaufman, J. A.: 1998b, Science 282, 1644.Hofmann, H. J., Narbonne, G. M. and Aitken, J. D.: 1990, Geology 18, 1199–1202.
Hoffmann, K.-H., Condon, D. J., Bowring, S. A. and Crowley, J. L.: 2004, Geology 32, 817–820.
Holm, N. G. and Charlou, J. L.: 2001, Earth Planet. Sci. Lett. 191, 1–8.House, C. H., Schopf, J. W., McKeegan, K. D., Coath, C. D., Harrison, T. M. and Stetter, K.
O.: 2000, Geology 28, 707–710.House, C. H., Schopf, J. W. and Stetter, K. O.: 2003, Org. Geochem. 34, 345–356.Hyde, W. T., Crowley, T. J., Baum, S. K. and Peltier, W. R.: 2000, Nature 405, 425–429.
Iwabe, N., Kuma, K., Hasegawa, M., Osawa, S. and Miyata, T.: 1989, Proc. Natl. Acad. Sci.USA 86, 9355–9359.
Javaux, E. J., Knoll, A. H. and Walter, M.: 2003, Orig. Life Evol. Biosph. 33, 75–94.
Javaux, E. J., Knoll, A. H. and Walter, M. R.: 2001, Nature 412, 66–69.Javaux, E. J., Knoll, A. H. and Walter, M. R.: 2004, Geobiology 2, 121–132.Jekely, G.: 2003, Bioessays 25, 1129–1138.Jenkins, G. S. and Scotese, C. R.: 1998, Science 282, 1644.
Johnson, C. M., Beard, B. L., and Albarede, F.: 2004a, Geochemistry of Non-traditional StableIsotopes, Mineralogical Society of America.
Johnson, C. M., Beard, B. L., Beukes, N. J., Klein, C. and O’Leary, J.: 2003, Contr. Mineral.
Petrol. 144, 523–547.
286 P. LOPEZ-GARCIA ET AL.

Johnson, C. M., Beard, B. L. Roden, E. E., Newman, D. K. and Nealson, K. H.: 2004b, inGeochemistry of Non-traditional Stable Isotopes, vol. 55, Mineralogical Society of America,
pp. 359–402.Johnson, C. M., Roden, E. E., Welch, S. A. and Beard, B. L.: 2005, Geochim. Cosmochim.
Acta 69, 963–993.
Kah, L. C. and Bartley, J. K.: 2001, Precambrian Res. 111, 1–283.Karl, D. M., Wirsen, C. O., and Jannasch, H. W.: 1980, Science 207, 1345–1347.Kimura, H. and Watanabe, Y.: 2001, Geology 29, 995–998.Kirschner, M. and Gerhart, J.: 1998, Proc. Natl. Acad. Sci. USA 95, 8420–8427.
Kitchen, N. E. and Valley, J. W.: 1995, J. Metamor. Geol. 13, 577–594.Knauth, L. P. and Lowe, D. R.: 1978, Earth Planet. Sci. Lett. 41, 209–222.Knoll, A. H.: 1999, Science 285, 1025–1026.
Knoll, A. H.: 2003. Life on a Young Planet; The First Three Billion Years of Evolution onEarth, Princeton University Press, Princeton, 277 pp.
Knoll, A. H. and Holland, H. D.: 1994, in Stanley, S. M. (eds.), Proterozoic oxygen and
evolution: an update. Biological Responses to Past Global Changes, National AcademyPress, Washington D.C., pp. 21–33.
Knoll, A. H., Walter, M. R., Narbonne, G. M. and Christie-Blick, N.: 2004, Science 305, 621–
622.Konhauser, K. O., Hamade, T., Raiswell, R., Morris, R. C., Ferris, F. G., Southam, G. and
Canfield, D. E.: 2002, Geology 30, 1079–1082.Kudryavtsev, A. B., Schopf, J. W., Agresti, D. G. and Wdowiak, T. J.: 2001, Proc. Natl. Acad.
Sci. 98, 823–826.Lake, J. A. and Rivera, M. C.: 1994, Proc. Natl. Acad. Sci. USA 91, 2880–2881.Lancet, M. S. and Anders, E.: 1970, Science 170, 980–982.
Lepland, A., Arrhenius, G. and Cornell, D.: 2002, Precambrian Res. 118, 221–241.Lepland, A., van Zuilen, M. A., Arrhenius, A., Whitehouse, M. and Fedo, C. M.: 2005,
Geology 33, 77–79.
Lindsay, J. F., Brasier, M. D., McLoughlin, N., Green, O. R., Fogel, M., Steele, A. andMertzman, S. A.: 2005, Precambrian Res. 143, 1–22.
Lopez-Garcıa, P. and Moreira, D.: 1999, Trends Biochem. Sci. 24, 88–93.
Lowe, D. R.: 1983, Precambrian Res. 19, 239–283.Lowe, D. R.: 1994, Geology 22, 387–390.Lowe, D. R. and Byerly, G. R.: 1986, Nature 324, 245–248.Lowe, D. R. and Byerly, G. R.: 1999, Geologic Evolution of the Barberton Greenstone Belt,
South Africa, The Geological Society of America.Lowe, D. R. and Byerly, G. R.: 2003, Geology 31, 909–912.Madigan, M. T., Martinko, J. M. and Parker, J.: 2003. Brock Biology of Microorganisms,
Prentice Hall, Upper Saddle River, NJ, USA.Margulis, L.: 1981. Symbiosis in Cell Evolution, W. H. Freeman, San Francisco, CA.Margulis, L. and Fester, R.: 1993. Symbiosis as a Source of Evolutionary Innovation, MIT
Press, Cambridge, MA.Martin, W., Hoffmeister, M., Rotte, C. and Henze, K.: 2001, Biol. Chem. 382, 1521–1539.Martin, W. and Muller, M.: 1998, Nature 392, 37–41.McCaffrey, M. A., Moldowan, J. M., Lipton, Paul A., Summons, R. E., Peters, K. E.,
Jeganathan, A. and Watt, D. S.: 1994, Geochim. Cosmochim. Acta 58, 529–532.McCollom, T. M. and Seewald, J. S.: 2001, Geochim. Cosmochim. Acta 65, 3769–3778.McCollom, T. M. and Seewald, J. S.: 2006, Earth. Planet. Sci. Lett 243, 74–84.
Mojzsis, S. J., Arrhenius, G., McKeegan, K. D., Harrison, T. M., Nutman, A. P. and Friend,C. R. L.: 1996, Nature 384, 55–59.
287ANCIENT FOSSIL RECORD AND EARLY EVOLUTION
Mojzsis, S. J., Coath, C. D., Greenwood, J. P., McKeegan, K. D. and Harrison, T. M.: 2003,Geochim. Cosmochim. Acta 67, 1635–1658.
Mojzsis, S. J. and Harrison, T. M.: 2002a, Earth Planet. Sci. Lett. 202, 563–576.Mojzsis, S. J. and Harrison, T. M.: 2002b, Science 298, 917.Mojzsis, S. J., Harrison, T. M., Arrhenius, G., McKeegan, K. D. and Grove, M.: 1999, Nature
400, 127–128.Mojzsis, S. J., McKeegan, K. D. and Harrison, T. M.: 2005, Life on Earth before 3.83 Ga?
Carbonaceous inclusions from Akilia (West Greenland). NAI Annual Meeting abstract.Moreira, D. and Lopez-Garcıa, P.: 1998, J. Mol. Evol. 47, 517–530.
Narbonne, G. M.: 1998, GSA Today 8, 1–6.Narbonne, G. M.: 2005, THE EDIACARA BIOTA: Neoproterozoic Origin of Animals and
Their Ecosystems: Annual Review of Earth and Planetary Sciences, vol. 33, pp. 421–442.
Nei, M., Xu, P. and Glazko, G.: 2001, Proc. Natl. Acad. Sci. USA 98, 2497–2502.Nier, A. O.: 1950, Phys. Rev. 77, 789–793.Nijman, W., de Bruijne, C. H. and Valkering, M. E.: 1999, Precambrian Res. 95, 247–274.
Nisbet, E. G. and Sleep, N. H.: 2001, Nature 409, 1083–1091.Nutman, A. P., McGregor, V. R., Friend, C. R. L., Bennett, V. C. and Kinny, P. D.: 1996,
Precambrian Res. 78, 1–39.
Nutman, A. P. and Friend, C. R. L.: 2006, Precambrian Res.Ohmoto, H., Kakegawa, T. and Lowe, D. R.: 1993, Science 262, 555–557.Ourisson, G., Rohmer, M. and Poralla, K.: 1987, Annu. Rev. Microbiol. 41, 301–333.Palin, J. M.: 2002, Science 298, 961.
Papineau, D., Mojzsis, S. J., Karhu, J. A. and Marty, B.: 2005, Chem. Geol. 216, 37–58.Paris, I., Stanistreet, I. G. and Hughes, M. J.: 1985, J. Geol. 93, 111–129.Parkes, R. J., Cragg, B. A. and Wellsbury, P.: 2000, Hydrogeol. J. 8, 11–28.
Pasteris, J. D. and Wopenka, B.: 2002, Nature 420, 476–477.Pasteris, J. D. and Wopenka, B.: 2003, Astrobiology 3, 727–738.Pearson, A., Budin, M. and Brocks, J. J.: 2003, Proc. Natl. Acad. Sci. USA 100, 15352–15357.
Perry, E. C. Jr. and Ahmad, S. N.: 1977, Earth Planet. Sci. Lett. 36, 280–284.Pflug, H. D. and Jaeschke-Boyer, H.: 1979, Nature 280, 483–486.Philippe, H., Lopez, P., Brinkmann, H., Budin, K., Germot, A., Laurent, J., Moreira, D.,
Muller, M. and Le Guyader, H.: 2000, Proc. R. Soc. Lond. B Biol. Sci. 267, 1213–1221.Pinti, D. L., Hashizume, K. and Matsuda, J.: 2001, Geochim. Cosmochim. Acta 65, 2301–2315.Poole, A. M., Jeffares, D. C. and Penny, D.: 1998, J. Mol. Evol. 46, 1–17.Rasmussen, B.: 2000, Nature 405, 676–679.
Reanney, D. C.: 1974, Theor. Biol. 48, 243–251.Reid, R. P., Visscher, P. T., Decho, A. W., Stolz, J. F., Bebout, B. M., Dupraz, C., Macintyre,
I. G., Paerl, H. W., Pinckney, J. L., Prufert-Bebout, L., Steppe, T. F. and Des Marais, D.
J.: 2000, Nature 406, 989–992.Rivera, M. C., Jain, R., Moore, J. E. and Lake, J. A.: 1998, Proc. Natl. Acad. Sci. USA 95,
6239–6244.
Robert, F.: 1988, Geochim. Cosmochim. Acta 52, 1473–1478.Robert, F., Selo, M., Hillion, F. and Skrzypczak, 2005, Lunar Planet. Sci. XXXVI, 2 pp.Rose, N. M., Rosing, M. T. and Bridgwater, D.: 1996, Am. J. Sci. 296, 1004–1044.Rosing, M. and Frei, R.: 2003, Earth Planet. Sci. Lett. 217, 237–244.
Rosing, M. T.: 1999, Science 283, 674–676.Rosing, M. T., Rose, N. M., Bridgwater, D. and Thomsen, H. S.: 1996, Geology 24(1), 43–46.Rouxel, O., Dobbek, N., Ludden, J. and Fouquet, Y.: 2003, Chem. Geol. 202, 155–182.
Sano, Y., Terada, K., Takahashi, Y. and Nutman, A. P.: 1999, Nature 400, 127.Sapp, J.: 2005, Microbiol. Mol. Biol. Rev. 69, 92–305.
288 P. LOPEZ-GARCIA ET AL.
Schidlowski, M.: 1988, Nature 333, 988.Schidlowski, M.: 2001, Precambrian Res. 106, 117–134.
Schidlowski, M., Appel, P. W. U., Eichmann, R. and Junge, C. E.: 1979, Geochim. Cosmo-chim. Acta 43, 89–199.
Schopf, J. W.: 1983, Earth’s Earliest Biosphere, Its Origin and Evolution, Princeton University
Press.Schopf, J. W.: 1993, Science 260, 640–646.Schopf, J. W.: 2000, Proc. Natl. Acad. Sci. 97, 6947–6953.Schopf, J. W. and Klein, C.: 1992, The Proterozoic Biosphere: A Multidisciplinary Study,
Cambridge University Press.Schopf, J. W. and Kudryavtsev, A.: 2005, Geobiology 3, 1–12.Schopf, J. W., Kudryavtsev, A., Agresti, D. G., Wdowiak, T. J. and Czaja, A. D.: 2002,
Nature 416, 73–76.Searcy, D. G.: 1992, in H. Hartman and K. Matsuno (eds.), The Origin and Evolution of the
Cell, World Scientific, Singapore, pp. 47–78.
Seilacher, A.: 1992, J. Geol. Soc. Lon. 149, 607–613.Sheehan, P. M., Coorough, P. J. and Fastovski, D. E.: 1996, in G. Ryder, D. Fastovski, and S.
Gartner (eds.), The Cretaceous-Tertiary Event and Other Catastrophes in Earth History,
vol. 307, Geological Society of America Special Paper, pp. 477–490.Shen, Y., Buick, R. and Canfield, D. E.: 2001, Nature 410, 77–81.Simpson, A. G. and Roger, A. J.: 2002, Curr. Biol. 12, R691–693.Siever, R.: 1994, Geochim. Cosmochim. Acta 56, 3265–3272.
Sogin, M. L.: 1991, Curr. Opin. Genet. Dev. 1, 457–463.Stanier, R. Y. and Van Niel, C. B.: 1962, Arch. Mikrobiol. 42, 17–35.Stolz, J. F., Feinstein, T. N., Salsi, J., Visscher, P. T. and Reid, R. P.: 2001, Am. Mineral. 86,
826–833.Takemura, M.: 2001, J. Mol. Evol. 52, 419–425.Tice, M. M., Bostick, B. C. and Lowe, D. R.: 2004, Geology 32, 37–40.
Tice, M. M. and Lowe, D. R.: 2004, Nature 431, 549–552.Ueno, Y. and Isozaki, Y.: 2001, Int. Geol. Rev. 43, 196–212.Ueno, Y., Yoshioka, H., Maruyama, S. and Isozaki, Y.: 2004, Geochim. Cosmochim. Acta 68,
573–589.Ueno, Y., Yurimoto, H., Yoshioka, H., Komiya, T. and Maruyama, S.: 2002, Geochim.
Cosmochim. Acta 66, 1257–1268.Van Kranendonk, M. J. and Pirajno, F.: 2004, Geochem.: Explor. Environ. Anal. 4, 253–278.
Van Kranendonk, M. J., Webb, G. E. and Kamber, B. S.: 2003, Geobiology 1, 91–108.van Zuilen, M. A., Lepland, A. and Arrhenius, G.: 2002, Nature 418, 627–630.van Zuilen, M. A., Lepland, A., Teranes, J. L., Finarelli, J., Wahlen, M. and Arrhenius, A.:
2003, Precambrian Res. 126, 331–348.van Zuilen, M. A., Mathew, K., Wopenka, B., Lepland, A., Marti, K. and Arrhenius, A.:
2005, Geochim. Cosmochim. Acta 69, 1241–1252.
Villarreal, L. P. (ed.): 2005, Viruses and the Evolution of Life, ASM press, Washington.Walsh, M.: 1992, Precambrian Res. 54, 271–293.Walter, M. R., Buick, R. and Dunlop, J. S. R.: 1980, Nature 284, 443–445.Wang, D. Y., Kumar, S. and Hedges, S. B.: 1999, Proc. R. Soc. Lond. B, Biol. Sci. 266,
163–171.Westall, F., de Wit, M. J., Dann, J., van der Gaast, S., de Ronde, C. E. J. and Gerneke, D.:
2001, Precambrian Res. 106, 93–116.
Westall, F. and Folk, R. L.: 2003, Precambrian Res. 126, 313–330.Whitehouse, M., Kamber, B. S. and Moorbath, S.: 1999, Chem. Geol. 160, 204–221.
289ANCIENT FOSSIL RECORD AND EARLY EVOLUTION

Whitehouse, M. J., Kamber, B. S., Fedo, C. M. and Lepland, A.: 2005, Chem. Geol. 222,112–131.
Woese, C. R. and Fox, G. E.: 1977, Proc. Natl. Acad. Sci. USA 74, 5088–5090.Woese, C. R., Kandler, O. and Wheelis, M. L.: 1990, Proc. Natl. Acad. Sci. USA 87,
4576–4579.
Xiao, S., Zhang, J. and Knoll, A. H.: 1998, Nature 391, 553–558.Yamaguchi, K. E., Johnson, C. M., Beard, B. L. and Ohmoto, H.: 2005, Chem. Geol. 218,
135–169.Yoon, H. S., Hackett, J. D., Ciniglia, C., Pinto, G. and Bhattacharya, D.: 2004, Mol. Biol.
Evol. 21, 809–818.Zillig, W.: 1991, Curr. Opin. Genet. Dev. 1, 544–551.Zuckerkandl, E. and Pauling, L.: 1965, J. Theor. Biol. 8, 357–366.
290 P. LOPEZ-GARCIA ET AL.
8. A Synthetic Interdisciplinary ‘‘Chronological Frieze’’: an Attempt
DIDIER DESPOIS and MURIEL GARGAUDObservatoire Aquitain des Sciences de l’Univers, Universite Bordeaux 1, Bordeaux, France
(E-mail: [email protected], [email protected])
(Received 1 February 2006; Accepted 4 April 2006)
Abstract. This chapter introduces the chronological and interdisciplinary ‘‘frieze’’ which presents the
main events relevant (in our opinion) to the problem of the emergence of life on Earth. This selection of
events is directly connected to the previous chapters of this book.
Keywords: Origin of life, chronology, time scales, hadean, archean, proterozoic
8.1. General Description
The frieze enclosed at the end of this book (Figure 8.1) presents a table ofvarious events considered by the authors as relevant to the origins of life onEarth. These events have been tentatively chronologically ordered in accor-dance with actual knowledge within all the scientific disciplines involved inastrobiology.
When isotopic dating is available, as is the case for most geological eventsor processes as well as for some astronomical events, an absolute age isobtained which corresponds to the time elapsed between the event andpresent. For other astronomical events or processes, durations or timeintervals are estimated either from theoretical models or observationalarguments. In all cases time can be expressed either with respect to present(BP) or with respect to a reference time, t0
1. A separate timescale, starting at(t0*)
2, has however been introduced for the early phases of the Sun forma-tion, due to the present uncertainty on the precise timing of these events withrespect to planetary formation. In other cases (prebiotic chemistry and earlybiological evolution) when the dating remains relative, the chronology isqualitatively presented as a logical sequence of events (taking into consid-eration that this sequence is not unique).
1 t0 corresponds to the age of the oldest solids in the Solar System which have been dated until
now
2 t0* is defined as the beginning of the collapse of the interstellar cloud core which gave birth
to the Solar System
Earth, Moon, and Planets (2006) 98: 291–297 � Springer 2006
DOI 10.1007/s11038-006-9092-8

In our initial project, it was considered to give a rough estimate of theduration of events or reactions for chemical and early biological processes;such a target rapidly appeared inaccessible as it consists in an extremelycomplex or even impossible task. The only possibility consisted in estab-lishing some time-beacons. The opportunity to assign an absolute age (byradiochronology) to an indisputable microfossil identified in a sedimentarysequence constitutes a reliable time marker for biological evolution. Unfor-tunately, such absolute markers remain so far extremely sporadic, and intheir absence only a relative succession of biological events can be suggested(even if still hotly debated).
An attempt was made to systematically refer to all available data sourcesand in case of controversies, to present alternative models and views and tocite the appropriate references. Unfortunately, this was not always possible:for example, too many scenarios are currently proposed for prebiotic chem-istry and early biological evolution; likewise dating of the ‘‘first’’ microfossilsis subject to many controversies impossible to report in a synthetic form.
As already discussed in the previous chapters, this ‘‘chronological frieze’’does not present a complete overview of the Earth evolution but rather islimited to the period ranging between t0* and the so-called explosion of life atthe beginning of the Cambrian period. The selected period includes threegeological eras: the Hadean, Archaean and Proterozoic, which are classicallyregrouped under the Precambrian. The fact that the Precambrian is theperiod during which the most important events relative to the emergence andearly evolution of life took place justifies our selection.
The data inserted in the ‘‘chronological frieze’’ were subject to long inter-disciplinary discussions in order to resolve the constraints linked to the differenttypes of chronometers used by each discipline concerned with the origins of life.When possible an interpretation relevant for the origin of life is proposed, andtentatively inserted in an unique and coherent interdisciplinary timescale. Thistheoreticalmodus operandi is limited due to the huge lack of chronological datarelative to prebiotic and early biological evolution, which did not permit theirinsertion into a reliable time scale. Consequently, it was decided to insert thepart of the ‘‘chronological frieze’’ relative to the prebiotic chemistry and earlybiological evolution between 4.4 and 2.7 Ga. The date of 3.8 Ga was chosenbecause it represents the age of the oldest sedimentary rocks so far recognized.
Whatever the dating method is, age is determined within an uncertaintydomain; consequently, when available, an error bar on the date/age isgiven. It must be noted that this error bar gives the analytical uncertaintyon age determination, and is totally independent of the interpretation of theage. For instance, in an old magmatic rock, the age measured on a zirconcrystal can reflect the age of the source of the magma, the age of magmacrystallization or even the age of a subsequent thermal event (calledmetamorphism). The discussion relative to these aspects is presented in a
292 DIDIER DESPOIS AND MURIEL GARGAUD
column called ‘‘reliability.’’ In some critical cases, discussion has been ex-tended further as ‘‘notes.’’
8.2. How to Interpret the Data of the ‘‘Chronological Frieze’’?
8.2.1. EON AND PHASE
Eon and phase refer to periods of time. Eons are officially defined by theInternational Union of Geological Sciences (IUGS). However, since Hadeanis not official in the latest version of the international stratigraphic chart, itwas decided to place the Hadean–Archaean boundary at 4.0 Ga, which isroughly the age of the oldest known rocks. In addition to this officialinternational nomenclature, Earth history is subdivided in several phases,which refer to periods important in terms of life apparition and development;these phases are closely related to the various chapters of this book.
8.2.2. AGE, ERROR BARS, TIME AND DURATION
They are expressed in mega years (Ma or Myr) or giga years (Ga or Gyr).The choice of ‘‘anno’’ or ‘‘year’’ reflects the convention differences betweenscientific domains: Geology and Astronomy respectively. Ages refer topresent time, and are thus expressed as ‘‘age before present’’ (BP), moreprecisely defined as 1950 AD(see chapter 1).
8.2.3. REFERENCE TIMES
Excepted for the formation of the Sun, and to some extent, for the formationof the protoplanetary disk, all relative times presented in the ‘‘chronologicalfrieze’’ refer to an absolute time t0, that corresponds to the oldest solids in theSolar System which have been dated until now; these solid particles are theCAIs (Calcium–Aluminium Inclusions) of the Allende meteorite, dated at4.5685 Ga BP. For the first 1–10 Myr, corresponding to the stellar formationand early protoplanetary evolution, a t0* time has been introduced, arbi-trarily chosen as the start of the collapse of the initial molecular cloud core.This t0* time can be linked to the absolute time t0 if the durations of thevarious stellar successive phases (e.g. protostar, T Tauri) are estimated; itmust be clear that these durations are model-dependent.
8.2.4. EVENTS
The column ‘‘events’’ lists what we consider the most relevant phenomenonsfor our understanding of emergence of life. They are presented under a generic
293A SYNTHETIC INTERDISCIPLINARY

title. In case of complex events made of a succession of composite steps, thecolumn labelled ‘‘Comments about these events’’ attempts to describe thesedifferent steps as clearly as possible. Their importance or their role in theemergence of life is presented in the column ‘‘Consequences for life.’’
8.2.5. DATING METHODS
The tools used to determine the age of an event are reported in this column.Chapter 2 provides additional information about methods.
8.2.6. RELEVANT OBSERVATIONS
This column gives additional information about the dated objects, the natureof observations, and/or the model used.
8.2.7. RELIABILITY
This column reports the problems linked to the data interpretation. In somecases, it points to the vivid controversies in the scientific community.
8.2.8. CONSEQUENCES FOR LIFE’S ORIGIN AND EVOLUTION
This column attemps to present the potential or possible link between aparticular event and the emergence of life.
8.2.9. REFERENCES
Only the number of the relevant chapter of this book is reported here;detailed references can be found in the chapter itself.
8.2.10. NOTES
They refer to the following further details on data interpretation and possiblecontroversies:
(#N1) t0* must be distinguished from t0, which is the age of the oldest datedsample of primitive material in the solar system (see below: CAIs, dated4.568±1 Gyr).
(#N2) The date corresponding to t0 (4568.5 Ma BP) is now rather wellestablished : (1) Amelin (2002) and Bouvier et al. (2005) show that AllendeCAI ages are consistent with this age within an error bar of ±0.4 Ma (2)
294 DIDIER DESPOIS AND MURIEL GARGAUD

Lugmair and Shukolyukov (1998) get the same age by adding Pb–Pb ageof Ste Marguerite (H4) with 26Al–26Mg age (3) The same age is obtained ifwe add the Pb–Pb age of 6 angrites (Baker et al., 2005) and the 26Al–26Mginternal isochrone age of 99555 (their total rocky age are obviously 1.2 Matoo old)
(#N3) Hence possible role in the existence of Europa-like bodies(#N4) A last metal-silicate equilibrium is recorded at 30 Ma with an error bar
11–50 Ma. Moreover N-body models predict a rather rapid first phase intelluric planet formation up to (roughly) the size of Mars (‘‘planetaryembryos’’) followed by a slower one (build up of Earth-size bodies byembryo encounters). The age of 30 Ma for the Earth could correspond to acollision with a Mars size body and indeed, a recent work propose an182Hf–182W age of 45 Ma for the Moon crustal differentiation, which couldcorrespond to the end of magmatic oceans on the Moon.
(#N5) The magmatic ocean stage could have lasted longer on Earth than onMoon, may be 60–70 Ma (129I–129Xe chronometers coupled to 129I–129Xe).The different 142Nd isotopic anomalies between chondrites and the Earth(Boyet and Carlson, 2005) show that the effective formation of Earthmagmatic ocean was achieved 30 Ma after accretion. In addition, due totheir different gravities, less plagioclase crystallized in Earth magma oceanwhen compared to Moon where plagioclase accumulation formed theanorthositic crust.
(#N6) Before this shock, a H2-rich primitive atmosphere may have existed; itsubsequently disappeared by hydrodynamic escape or as the consequenceof impacts.
(#N7) 100 Ma correspond to the epoch at which the atmosphere begins toretain 129Xe produced from 129I. However the atmosphere may have stayedopen during a much longer period (in order to allow the escape of the 136Xeproduced by 244Pu radioactivity). About 100 Ma is only an average closuretime, because of problems linked to the measure of the age of reservoirs.
(#N8)The isotopic systems 146Sm–142Nd et 244Pu–136Xe indicate a veryactive Earth during the Hadean, allowing for a global differentiationduring the first 100–400 Ma. The oldest dated zircon (4.4 Ga) does nothave high d 18O typical of interaction with water at low temperature. Thisd 18O alone, could be interpreted as mantle value, however, zircon crystalalso contains quartz and plagioclase inclusions; which demonstrates that itcrystallized in a continental crustal magmatic rock.
(#N9) Other authors consider that most, if not all, halogens and H, C, N, O,S, P, were already present and available on Earth surface at 4.4 Ga whenfirst oceans formed.
(#N10) On Earth this episode is not certain but only extremely probable;indeed, on the Moon, the Imbrian event is recognized only on the visibleface of the Moon (which could then be considered as a local event)
295A SYNTHETIC INTERDISCIPLINARY
(#N11)A similar isotopic deviation can be produced abiotically. The sedi-mentary nature of the graphite was analysed, and even its age has beenquestioned.
(#N12) It is impossible to say whether these metabolisms appeared simul-taneously or successively. A parallel evolution appears possible, and evensupported (e.g. phylogenetic radiation within the bacteria and priordivergence of the archaea) for most respiration types, photosynthesis andmethanogenesis.
(#N13) The interpretation of these observations is strongly debated. Ifmacroscopic laminar structures do correspond to fossil stromatolites, thiswould prove the occurrence of laminated microbial communities (micro-bial mats) implying the presence of metabolically diverse microorganisms.If the presence of microfossils associated to these structures is confirmed, itwould constitute evidence for the existence of cellular life. If negative d 13Cvalues are actually biogenic and syngenetic with the rock, some type ofautotrophic metabolism (photosynthesis and/or chemoautotrophy) wouldhave already developed.
(#N14) Eukaryotic morphologies characterized by extent surface decorationare widely accepted
The frieze may be found in print as an insert at the back of the printpublication. This supplementary material is also available in the onlineversion of this article at http://dx.doi.org/10.1007/s11038-006-9092-8 and isaccesssible for authorized users.
Acknowledgements
We’d like to thank warmly all the authors for their help during the‘‘making of’’ of this ‘‘chronological frieze.’’ We are especially very gratefulto the coordinators of the various chapters of this review for fruitfull dis-cussions, comments and critical reading of the (numerous) ‘‘proto-frieze’’which precede this one: Philippe Claeys, Purification Lopez-Garcia, HerveMartin, Thierry Montmerle, Robert Pascal and Jacques Reisse. We alsothank especially Francis Albarede, Daniele Pinti and Franck Selsis forfruitfull discussions on oldest dated sample, oceans and atmosphere for-mation. Finally, we also thank Judith Pargamin for her help in the editorialpresentation of this frieze and Michel Viso for his constant support to thisproject.
296 DIDIER DESPOIS AND MURIEL GARGAUD

References
Amelin Y., Grossman L., Krot A. N., Pestaj T., Simon S. B., and Ulyanov A. A. (2002), Lunarand Planetary Institute Conference Abstracts 33, 1151.
Baker, J., Bizzarro, M., Wittig, N., Connelly, J., and Haack, H.: 2005, Nature 436, 1127–1131.Bouvier, A., Blichert-Toft, J., Vervoort, J. D., McClelland, W., and Albarede, F.: 2005,
Geochim. Cosmochim. Acta 69(Suppl.), 384 .
Boyet, M. and Carlson, R. W.: 2005, Science 309, 576–581.Lugmair, G. W. and Shukolyukov, A.: 1998, Geochim. Cosmochim. Acta 62, 2863–2886.
297A SYNTHETIC INTERDISCIPLINARY

9. Life On Earth... And Elsewhere?
THIERRY MONTMERLELaboratoire d’Astrophysique de Grenoble, Universite Joseph Fourier, Grenoble, France
(E-mail: [email protected])
PHILIPPE CLAEYSDGLG-WE, Vrije Universiteit Brussel, Brussels, Belgium
(E-mail: [email protected])
MURIEL GARGAUDObservatoire Aquitain des Sciences de l’Univers, Universite Bordeaux 1, Bordeaux, France
(E-mail: [email protected])
PURIFICATION LOPEZ-GARCIAUnite d’Ecologie, Systematique et Evolution, Universite Paris-Sud, Orsay, France
(E-mail: [email protected])
HERVE MARTINLaboratoire Magmas et Volcans, Universite Blaise Pascal, Clermont-Ferrand, France
(E-mail: [email protected])
ROBERT PASCALDepartment de Chimie, Universite Montpellier 2, Montpellier, France
(E-mail: [email protected])
JACQUES REISSEFaculte des Sciences Appliquees (CP 165/64), Universite Libre de Bruxelles, Brussels, Belgium
(E-mail: [email protected])
FRANCK SELSISCentre de Recherche Astronomique de Lyon and Ecole Normale Superieure de Lyon, Lyon,
France(E-mail: [email protected])
(Received 1 February 2006; Accepted 4 April 2006)
Abstract. This concluding chapter is divided into two main parts. The first part is a summary of the main
facts and events which constitute the present body of knowledge of the chronology of life in the solar
system, in the form of ‘‘highlights’’ in astronomy, geology, chemistry and biology. The second part raises
the interrogation ‘‘Is life universal?’’, and tries to provide answers based on these facts and events. These
answers turn out to differ widely among the various disciplines, depending on how far they feel able to
extrapolate their current knowledge.
Keywords: Astrobiology, chemical evolution, early Earth, early Mars, early Venus, eukaryotes, exopla-
nets, habitable planets, Late Heavy Bombardment, microfossils, Moon, origin of life, prebiotic molecules,
solar system, star planet information, supernovae, universality of life
Earth, Moon, and Planets (2006) 98: 299–312 � Springer 2006
DOI 10.1007/s11038-006-9093-7

9.1. The Chronology of Life in the Solar System: Highlights
9.1.1. FROM THE BIRTH OF THE SUN TO THE BIRTH OF THE EARTH
According to recent estimates, the Earth was assembled in less than100 Myr.1 Since its very existence is a pre-requisite for the emergence and/orevolution of life as we know it, a key problem for astronomers consists intrying to reconstitute its origin, and to establish whether the formation ofterrestrial planets among solar-like stars is a common or an exceptionalphenomenon. Unfortunately, until now this question remains unanswered;however, the observations of nearby solar-like stars and star-forming regions,lead to establish at least five important facts:
(i) Molecular clouds, out of which stars form, contain numerous organicmolecules. They also contain dust grains. The grain mantles are formedduring the pre-collapse phase. Once a protostar is formed, the heating ofthe central object and/or the shocks created by the outflowing materialinject back into the gas phase the mantle components. Further reactionstake place in the central regions of protostars, forming new complexmolecules.
(ii) Circumstellar disks, composed of gas (hydrogen, helium and heavierelements) and dust grains (mostly carbon compounds, silicates and ices),having masses equivalent to many solar systems, are present around allyoung solar-like stars. Molecules are frozen onto the grain mantles inthe plane of the protoplanetary disks. Planetesimals coagulate and formthe bricks of planets, comets and asteroids, possibly incorporating themolecule-rich mantle components.
(iii)To date, nearly 200 ‘‘exoplanets’’ (with masses currently ranging fromfive Earth masses to 12 Jupiter masses)2 have been discovered. Theprobability for nearby solar-like stars to host a planet we can detect withour present technology is about 5%.
(iv)Mostly theoretical considerations show that the presence of giantplanets influences the formation of terrestrial (i.e., rocky) planets fromcircumstellar disks. Indeed, numerical simulations without giant planetstend to form smaller and more numerous terrestrial planets than sim-ulations including Jupiter-like planets.
1 For comments on the units of time adopted by astronomers (Myr or Gyr) vs. those adoptedby geologists and biologists or chemists (Ma or Ga), and how they use them, see Chap. 2 on
chronometers (Chap. 2.5).
2 This is the limit, officially adopted by the IAU (International Astronomical Union), between
a ‘‘planet’’ and a ‘‘brown dwarf’’ star. See (Chap. 2.1).
300 THIERRY MONTMERLE ET AL.
(v) On the other hand, the study of the oldest meteorites (chondrites) showsthat the young solar system must have been filled very early withcolliding planetary embryos known as ‘‘planetesimals’’.
In Chapter 3, we have attempted to describe in a simplified fashion thechronology of the evolution of the solar system, starting with the birth of itsparent star, our Sun, and ending with the very young Earth, our planet. Inanalogy with a musical piece, this chronology can be divided in three (log-arithmic) movements: allegro, for the formation of the Sun (inferred from theformation of solar-like stars), that takes about 1 Myr (we called it the ‘‘stellarera’’); andante, for the evolution of circumstellar disks and the formation ofgiant planets (the ‘‘disk’’ era), which takes about 10 Myr, and lento, for theformation of terrestrial planets and the early evolution of the Earth (the‘‘telluric era’’), which is dominated by collisions between small bodies (for-tissimo!) and takes about 100 Myr. It is in the course of the andante, that westart to combine circumstellar disk evolution with young solar system physics(the so-called meteoritic record). However, we have been forced to introducean intermezzo, because our understanding of how dust grains, observable incircumstellar disks only up to a few mm in size, grow into solar-systemplanetesimals of a few km, suffers from a severe bottleneck. The highlights ofthis ‘‘musical piece’’ are as follows.
(1) The ‘‘stellar era’’ (1 Myr). Modern ideas on the formation of the Sunand solar-like stars stress that, as a rule, stars start forming inside dense, cold‘‘molecular clouds’’, not in isolation but in clusters, ultimately comprising afew tens to a few thousand visible stars. This is thought to be the result ofturbulence and magnetic fields threading these clouds. Because they arerotating, ‘‘protostars’’ form disks while collapsing under the pull of gravi-tation; they also form ‘‘bipolar jets’’ mediated by, again, magnetic fields. Theso-called ‘‘primitive solar nebula’’ must have been at least part of such disks,which are observed around all stars except the most massive ones (i.e., abovea few solar masses).
(2) The ‘‘disk era’’ (10 Myr). Observations show that circumstellar disksdisappear, in a statistical sense, after a few million years only. This is inter-preted as corresponding to giant planet formation, putting severe constraintson theoretical models for the transition from dust grains to planetesimals andtheir assembling into giant planets. On the other hand, X-ray observationsshow that while disks evolve, they must be irradiated by hard radiation(X-ray flares), for which there is now direct evidence, and by inference byenergetic particles. In the young solar system, there is possible evidence forthis energetic ‘‘internal’’ irradiation from the presence of so-called ‘‘extinctradioactivities’’ in the most primitive meteorites. However, some of these‘‘extinct radioactivities’’ also point out to a supernova explosion in the
301LIFE ON EARTH... AND ELSEWHERE?

vicinity of the very young Sun (less than 1 Myr), which, contrary to theubiquitous presence of circumstellar disks, may have been a relatively rareoccurrence. Then, after the intermezzo mentioned above, theory takes over,subject to severe dynamical constraints, to explain the formation of planetaryembryos and giant planets.
(3) The ‘‘telluric era’’ (100 Myr). Strongly influenced by gravitationalinteractions from giant planets, and also constrained by observations of‘‘debris disks’’ around evolved young stars, a few terrestrial planets, and aprimordial asteroid belt, form by accretion from planetesimals. This is thetime of the last cataclysmic collisions, giving rise to the terrestrial planets. Inparticular, one such late (around 30 Myr) collision between a Mars-sizedbody and the young Earth is invoked to account for the formation of theMoon.
At this stage, the Earth starts to be differentiated (formation of a core), andan atmosphere appears. Another era begins, that of geology. The storycontinues in Chapter 4.
9.1.2. THE HISTORY OF THE EARLY EARTH AND GEOLOGICAL CONSTRAINTS ON THE
ORIGIN OF LIFE
The succession of events that occurred on Earth surface since its formationmainly depends on both internal and external factors.
The main internal factor is the progressive cooling of our planet thatstarted just after accretion and that still continues today. Most of internalheat (accretion energy, radioactive elements, latent heat of core crystalliza-tion, etc.) has been fixed 4.568 Ga ago and its budget slowly decreased untilnow. This cooling is progressive and accounts for the main changes in ourplanet dynamics (Magma Ocean, plate tectonic development, etc. – seeChapter 4.1). In addition, the greater heat production on the primitive Earthcan have favoured the development of hydrothermalism and consequentlycreated niches potentially favourable for the development of some forms oflife (Chapter 6). As these changes are slow, life could have more easilyaccommodated and adapted to them.
Among external factors, some also changed progressively, such as thesurface temperature of the Sun (Chapter 6.2), but others were more brutal,such as for instance the Late Heavy Bombardment or even glaciations(Chapters 4.4 and 6.3). These events may have had a more drastic and cat-astrophic effect on life evolution and development. Indeed, meteorites,micrometeorites or comets, not only can partly or totally vaporize oceans andconsequently eradicate possible pre-existing life, but they are also able tobring on Earth chemical elements that modified the composition of the
302 THIERRY MONTMERLE ET AL.

atmosphere and oceans (Chapters 4.2 and 6.2), as well as they were able tobring on the Earth surface the ‘‘bricks’’ of life.
Here too, the history of the Earth can be divided in few periods, each onebeing characterized by a specific thermodynamic conditions and geodynamicenvironments and consequently by different set of niches and conditions forlife development.
(1) The Early Hadean period (4.568–4.40 Ga) [No life possible].
It is highly probable that this period was not favourable for the emergence oflife and for its development on Earth. Indeed, most of the Earth mantle wasat a very high temperature such that it was molten, giving rise to a magmaocean; continental crust did not exist and liquid water was not condensed onthe Earth surface. In addition, it is also highly likely that the meteoriticbombardment intensity was still important. If this period was not favourablefor the emergence of life, however it was a period of elaboration of conditionsand building of niches and environments where subsequently life has beenable to develop.
(2) The Late Hadean period (4.40–4.00 Ga) [Conditions favourable forpotential emergence of life].
Recently, very old (4.3–4.4 Ga) zircon crystals have been discovered in JackHills (Australia; Chapter 4.3); their composition indicates that they formed inthe continental crust and that the latter was already stable. In addition, theiroxygen isotopic composition also shows that liquid water (ocean?) alreadyexisted at the surface of the Earth. Similarly, recent works on meteoriticbombardment showed that very probably the Hadean period was relativelycool (‘‘Cool Early Earth’’) and that the meteoritic bombardment only lastedbetween 4.0 and 3.8 Ga (Chapter 4.4). Consequently, since the 4.4–4.3 Gaperiod, the conditions for prebiotic chemistry and appearance of life werealready met (liquid water, continental crust, no strong meteoritic bombard-ment, etc...). This does not mean that life existed so early, but this demon-strates that some (all?) necessary conditions assumed for life developmentwere already present on Earth.
(3) The Archaean period (4.00–2.50 Ga) [Conditions favourable for lifeevolution].
This period started with the Late Heavy Bombardment (LHB; 4.0–3.8 Ga;Chapter 4.4). Even if internal Earth heat production was lower than duringHadean times, it remained 2–4 times larger than today. The correlated highgeothermal flux gave rise to rocks such as komatiites and TTG suites, whichare no more generated on Earth since 2.5 Ga. The Archaean is a period ofvery intense continental crust differentiation. The greater heat productionfavoured the development of hydrothermalism and possibly created niches
303LIFE ON EARTH... AND ELSEWHERE?
potentially favourable for the development of some forms of life (Chapter 6).The Isua greenstone belt in Greenland contains some of the oldest rocksknown today on the Earth surface. Among them, outcrop detrital sedimentsdemonstrate that ocean and emerged continents already existed 3.865 Ga ago(Chapter 4.3). These conclusions are corroborated by the younger(3.5–3.4 Ga) rocks in both Barberton (S. Africa) and Pilbara (Australia).Weak traces as well as isotopic signatures in these sediments (Chapter 7.1)are interpreted as possible indications of primitive life, but this interpretationis strongly debated and these markers cannot for the moment be actuallyconsidered as unequivocal evidence for the earliest forms of life. If specialistsstill hotly debate about the age of the oldest undisputable traces of life(Chapters 5.2–5.6 and 7.2), all agree that life appeared during part, if not all,of this period, which can be considered as having been extremely favourablefor life development and diversification.
(4) Proterozoic and Phanerozoic period (2.50 Ga – today) [Conditions fordiversification and explosion of life].
After Archaean times and almost since 2.50 Ga, the Earth had significantlycooled for its geodynamic regime to become similar to the modern platetectonics as we know it today on Earth. Thermal and compositional condi-tions in oceans were not drastically different from the ones we know todayand the solar bolometric luminosity (i.e., summing over all wavelengths)significantly increased since 4.4 Ga (Chapter 6.2.1.3). The main change ap-pears to be a consequence of life development and consists in the increasingamount of dioxygen in the Earth atmosphere between 2.3 and 2.0 Ga(Chapter 6.2.1.2) as a consequence of photosynthesis. The Protero-zoic–Phanerozoic boundary, about 540 Ma ago, consists only in the explo-sion and strong diversification of Metazoan life, which, due to the finalincrease of atmospheric O2 (and correlated O3), resulted in the conquest ofemerged continent surfaces.
9.1.3. FACTS OF LIFE
That life appeared, or at least evolved, on Earth is a fact, but exactly whenand how it did remains, and will most likely remain for a long time, unre-solved. Life must have arisen after a period of active pre-biotic chemistry ofunknown duration (Chapter 5.1). Life resulted from the merging of geneticsystems capable to store, express, and transmit information, and also able toevolve, i.e., to accumulate changes (mutations) upon which natural selectioncould operate. Life resulted also from metabolic abilities for management oforganic and inorganic sources for self-sustainment, including free energyproduction, storage and use. The merging of both systems was made possibleby, or was associated with, their separation from the environment, while
304 THIERRY MONTMERLE ET AL.
allowing metabolite exchange, by a membrane envelope defining acompartment (Chapters 5.2–5.6). The relative order of emergence of thedifferent systems is controversial and highly speculative, as was forewarned inChapter 5.1. They may even have evolved in parallel. Indeed, from a given(though unknown) moment in time (perhaps close to the theoretical limitbetween non-life and life), they did co-evolve. From the common propertiesoccurring in extant terrestrial life, it is possible to conclude that a ‘‘lastcommon ancestor’’, possessing those common traits to all living beings, ex-isted (Chapter 5.7). However, although it must have been already quitecomplex, its precise nature is hotly debated, and when it thrived on Earth isimpossible to tell. It must have lived some time between the emergence of thefirst living entities and the divergence between the different domains of life.
When did life appear in geological times? The answer is very uncertain.For many authors, this could be during the period comprised between3.8 Ga (after the LHB) and 3.5 Ga. But a more cautious answer would be:some time between formation of the Earth and oceans (4.4 Ga) and theoldest unambiguous microfossils at 2.7 Ga (see Chapter 7). Will it be possiblein the future to restrict further these limits? Looking at the farthest limit(4.4 Ga), if the LHB was actually sterilizing, life as we know it today musthave developed only after 3.8 Ga. Life might have evolved and got extinctpreviously, but in that case, it will be impossible to know if such early life wasbased on similar molecules and mechanisms as the one that we know today.Looking at the closest limit, 2.7 Ga, it is quite possible that this threshold willeventually be pushed back in time. Claims for the occurrence of microfossilsand isotopic traces of microbial activities at 3.5 Ga exist, although the evi-dence presented is not yet strong enough not to be criticized (Chapter 7.1).Hopefully, methodological advances and improvement in biomarkerknowledge will help yielding more compelling answers about the nature ofthe putative oldest traces of life. However, it will be very difficult to distin-guish early living entities from more derived bacteria or archaea at the oldestfossil-record level. Furthermore, the eventual recognition of a certain groupof organisms in the fossil record does not preclude the possibility that itevolved much earlier without leaving traces in that fossil record. For in-stance, eukaryotes, whose oldest certified fossils date back to 1.5 Ga, mayhave appeared earlier without leaving easily identifiable morphological re-mains. It is clear, nevertheless, that eukaryotes appeared only after pro-karyotes since their ancestor acquired mitochondria (derived fromendosymbiotic bacteria). In addition to time constraints fixed by paleontol-ogy, many questions remain open in early microbial evolution regarding boththe relative emergence of the different groups and their metabolic strategies,and the date at which they appeared (Chapters 5.2–5.6 and 7.2). Hopefullytoo, progress in molecular phylogenetic and comparative genomic analysescan help resolve some of these evolutionary questions by pointing out to
305LIFE ON EARTH... AND ELSEWHERE?

enzymes or metabolic pathways that are more ancestral than others. But weneed to assume as scientists that in most cases, we will be left with a bundle ofappealing, unfortunately non-testable, historical hypotheses.
9.2. Our World in Perspective: Is Life Universal?
Life, as we know it, is present on only one of the terrestrial planets in thesolar system. Perhaps life appeared on Mars and Venus at some stage as therewas liquid water on Early Mars and possibly on Early Venus. Orbital dis-tance was the critical factor that determined the divergent evolution of Venusand the Earth, as our planet was far enough from the Sun to avoid a runawaygreenhouse effect. The different fates of Mars and the Earth are more relatedwith their gravity, tectonic and volcanic activity, and magnetic field, threeparameters determined by the planetary mass, which in the case of Mars istoo small to sustain a dense atmosphere on geological timescales. Apart fromhaving the right mass, composition and orbital distance, other less genericeffects (such as the stabilization of the Earth rotation axis by the Moon, theearly bombardment history) may have played an important role in the sus-tainment and development of life on Earth.
There is currently no observational evidence of living systems elsewhere inthe Universe, which immediately raises the question: Are we alone? But inthis review we have deliberately limited ourselves to the emergence and earlyevolution of life on Earth, i.e., the development of microbial life. The ques-tion of the development of intelligent life is related to the post-Cambrianevolution of species up to the appearance of Man and the development oftechnology.3 We did not discuss this point, and therefore we discard it asbeing outside of the scope of this concluding chapter.
Even limited to the question of the universality of life in general, theanswers the authors of this article are able to provide will ultimately relyonly on the available data. As a matter of fact, these data (and their inter-pretation) differ widely according to the different fields of research, andreasonable scientific conclusions depend on how far (in time and space) theyfeel able to extrapolate from their current knowledge of the chronologicalhistory of the solar system and the Earth as described in this review.
More precisely, the ‘‘observable horizon’’ shrinks as we consider stars,planetary systems, pre-biotic chemistry, and finally life. In short, astronomersare now able to observe myriads of forming solar-like stars, and soon hun-dreds of planetary systems, out to a horizon hundreds of light-years awayfrom the Earth. Thus astronomers can rely on a large statistical basis to drawconclusions, for instance about the ‘‘typical’’ time for the disappearance of
3 In particular, this is the context of the famous so-called ‘‘Fermi paradox’’.
306 THIERRY MONTMERLE ET AL.

circumstellar disks, and about the diversity of exoplanets, such as the ubiq-uitous presence of ‘‘hot Jupiters’’. However, to date no planetary systemsimilar to the solar system is known, so that, in spite of continuing discov-eries, astronomers are currently unable to tell what fraction of planetarysystems is harbouring habitable exoplanets. Astronomers, geologists andgeochemists can, to some extent, reconstitute the early history of planets,such as gravitational interactions, collisions, accretion and internal differ-entiation, composition and early evolution of atmospheres and oceans, butthey are able to do so in some detail only in the single planetary system oneknows because it is ours: this horizon is about 10,000 times smaller than theprevious one, illuminated by a single star of known evolution in luminosityand temperature, with no more than a few dozens of planets, satellites andminor bodies available for individual study (albeit spanning a tremendouslylarge range of physical, chemical and magnetic conditions). At least for sometime, chemists and biologists are confined to one object only, the Earth, tounderstand how life evolved, from the first (still undefined) ‘‘brick of life’’.They don’t even know whether the path life took is the only one possible,since they have to rely on the Earth only, yet the Earth itself now containsmillions of living species. And as is well known, ‘‘life destroys life’’, so toreconstitute its chronology back to its origin is a daunting, perhaps impos-sible, task.
At the end of this review, let us then try to be more specific and elaborateour contribution to the challenge of astrobiology. In other words, let’sexamine what each community has brought here through the chronology ofthe formation of the solar system and the Earth – a trip reminiscent of that ofMicromegas, Voltaire’s 18th century interplanetary traveler...
For astronomers, all solar-like stars (at least) are born surrounded bycircumstellar disks. The conspicuous existence of exoplanetary systems,even if very different from ours, suggest that planet formation is com-monplace, perhaps even universal, in spite of the fact that only 5% of theobserved solar-like stars in the solar vicinity4 are found to harbour giantplanets relatively close to the parent star. If one admits that liquid water isa necessary condition for the emergence and development of life, it ispossible to define for each system a ‘‘radiative habitable zone’’ where thestellar irradiation is such that liquid water may be present at the surface ofterrestrial planets (or perhaps the large satellites of giant planets) havingorbits confined within this zone. The fraction of Sun-like stars that host atleast one 0.5–5 Earth-mass terrestrial planet in their radiative habitablezone is still unknown but will hopefully be determined in the solar vicinity
4 Their average distance is about 30 pc, or 100 light-years. For more details on exoplanets and
their statistics, see http://vo.obspm.fr/exoplanetes/encyclo/catalog-main.php?mdAff=stats#tc.
307LIFE ON EARTH... AND ELSEWHERE?
by the next generation of space observatories.5 But recalling that our gal-axy, the Milky Way, contains about 1011 stars, clearly a very large numberof exoplanets are likely to be candidates for harbouring at least primitiveforms of life.
Geologists and geochemists, on the other hand, would raise the concernwhether planets in an a priori ‘‘habitable zone’’ would have oceans andatmospheres lasting long enough to develop and sustain life ‘‘in the open’’ toeventually lead to the Cambrian explosion of living species: we have evidenceto the contrary in the solar system with Venus and Mars. On Earth, it took~1–2 billion years before life emerged: this required that during all this time,the planet remained habitable and as we have seen, this necessary conditionwas perhaps the consequence of an impact between the young Earth and abody of the size of Mars leading to the Moon formation. Without this largesatellite, it is not so sure that the physical conditions on Earth would haveremained sufficiently stable for such a long time.
For chemists, life in the Universe may not be considered uniquely from thispoint of view, and seeking for indications of forms of life that evolved dif-ferently will be a major field of research following the discovery of extrasolarplanets. Moreover, the presence of organic matter, in molecular clouds andprotostellar envelopes, in meteorites, comets, and in various places in thesolar system has shown that the building blocks of life including aminoacidsare very common molecules. We are far from the clear-cut separation betweenorganic chemistry and inorganic chemistry, which prevailed at the beginningof the 19th century when the organic world was supposed to be related to life.It simply indicates that the somewhat unexpected but common chemicalprocesses that have supported the development of life on Earth may occurelsewhere. A logical next step is to look for spectroscopic indications for life-related chemistry in exoplanetary atmospheres. Although we do not know forsure what could be an unambiguous signature of life, the spectroscopiccharacterization of terrestrial exoplanets will allow us to identify potentiallyhabitable planets and to search for atmospheric compounds of possiblebiogenic origin. The detection of an out-of-equilibrium atmospherecontaining for example O2 or O3 together with some reduced molecules likeCH4 or NH3 would be probably considered as a strong indication that somemetabolic pathways took place on the planet. This is currently the formidablegoal of future space missions like Darwin and TPF (see below, footnote 5).
For biologists, the situation is different. Astrophysicists, geologists andchemists find the objects of their disciplines in other planets. By contrast, lifeis known only on Earth, so that biologists generally feel uneasy in a field
5 COROT launched by CNES in late 2006, Kepler, by NASA in 2009, Darwin by ESA and
Terrestrial Planet Finder (TPF) by NASA in 2020?
308 THIERRY MONTMERLE ET AL.
where their object of study is purely hypothetical elsewhere. A great step wasmade in the 1970s due to the discovery of extremophilic microorganisms,whose study considerably extended the physico-chemical conditions in whichlife, terrestrial life, could occur. Some of these organisms might be able tothrive in other planets. In addition to microbiologists studying extremeenvironments, evolutionists trying to reconstruct the origin and early evo-lution of life are among the less skeptical biologists. Given the appropriatephysico-chemical settings, some form of life based on a similar biochemistryto the terrestrial one could have developed. However, we unfortunatelyignore how life evolved and the question of whether life was a rare uniqueevent or a necessary outcome remains still unanswered.
Should we then envisage that the conditions on Earth (and in the youngsolar system) were so exceptional that life not only emerged, but also wasable to evolve very quickly and survive major catastrophes such as, possibly,the Late Heavy Bombardment or later cosmic collisions, or major atmo-spheric changes?
As a matter of fact, one cannot be but surprised at some peculiarities ofthe Earth and the solar system, which may or may not have been importantfor life to emerge and survive. To list but a few, in chronological order:– Is the possible presence of a supernova in the vicinity of the forming Sun,attested by the presence of 60Fe in meteorites, important or circumstantial?Does it tell us that Sun-like planetary systems can be born only in‘‘special’’, rare stellar associations?
– Has such a supernova anything to do with chirality? The compact remnantof a supernova is in general a neutron star6 and, therefore, it may well bethat a neutron star was located near the protosolar nebula. A neutron starcan be described as a huge natural synchrotron source (a ‘‘pulsar’’) whichmeans that above the poles of this fast rotating stellar object, a strongcircularly polarized light is emitted at all wavelengths. Of course, thepolarization is opposite above each pole but, for a particular position ofthe protosun with respect to the neutron star, it can be shown that if amixture of chiral molecules pre-exists in the nebula, an enantioselectivephotolysis of these molecules could take place. This means that even in thecase of a 50/50 mixture of molecules of opposite chirality (racemicmixture), an enantiomeric excess could be observed after photolysis.Interestingly enough, some aminoacids found in carbonaceous chondritesshow enantiomeric excesses as large as 12%. Therefore, the origin ofhomochirality of the constituents of living matter could have been
6 In reality, only a small fraction of young supernova remnants, known as ‘‘plerions’’ (like thefamous Crab nebula, the remnant of a supernova having exploded in 1059 AD), are definitely
known to host a neutron star, in the form of ‘‘pulsar’’. See also Chapter 2.
309LIFE ON EARTH... AND ELSEWHERE?
indirectly influenced by the explosion of a supernova in the vicinity of theforming solar system.
– Was the circumstellar disk around the young Sun a rare survivor of a UVor X-ray induced early evaporation in the vicinity of hot, massive stars?
– What was the role of the Moon? If one believes some large-scale mixing ofpre-biotic material in water, like tides, or the stabilization and orientationof the Earth’s rotation axis, was necessary, or even essential, for a large-scale spreading of protolife across its surface, then the Earth is the onlyplanet in the solar system with a satellite massive enough and close enoughto fulfill this condition.
– Was the exchange of ejected material between planets important for thepreservation of life? During the early Hadean, the faint young Sun mayhave hosted three habitable planets (Venus, Earth and Mars), which weresporadically submitted to giant impacts. If life had already emerged on oneof these planets, it could have survived these sterilizing impacts inside ejectaand reseeded its planet of origin or another one. In that case, odds mightfavour life emerging in systems with more than one habitable planet.
– What was the role of the Late Heavy Bombardment? Did it obliterate allforms of life possibly existing in oceans at that time, so that the process hadto start all over again? Certainly, the present evidence is not inconsistentwith the presence of bacterial life before the LHB, which could havesurvived even in small proportions, the near-vaporization of the oceans.
Lastly, many events in relation with the emergence of life and its earlyevolution remain totally unknown and are related to processes that are oftendependent on the answers given to previous questions.– Are the conditions for ‘‘starting’’ life (whatever that means: the firstreplication, for instance) extremely demanding and narrow, thus very rare,or on the contrary ‘‘inevitable’’, i.e., due to happen sooner or later?
– Once life ‘‘starts’’, how fast is its evolution, and how does it depend on thephysical and chemical evolution of planetary atmospheres over time?
– Did life happen very early (before the Late Heavy Bombardment) with areducing atmosphere favourable to pre-biotic synthesis? Then, how longdid it take for life to settle on the whole planet and to bring aboutdetectable traces?
– What was the first oxido-reduction reaction used by life for the necessaryenergy production and what was the first energy storage system?
– What was the composition of the atmosphere before and after the LateHeavy Bombardment and what is the relative importance of endogeneousand exogeneous origin for the building blocks of life? Did life on Earthstart from a heterotrophic process depending on the abiotic production oforganic molecules? Did it happen very early with a reducing atmosphere
310 THIERRY MONTMERLE ET AL.

favourable to pre-biotic synthesis? Then, how long did it take forautotrophy to develop, for life to settle on the whole surface of the planetand to bring about detectable traces?
– Or, alternatively, was the emergence of life intimately associated withenergy production pathways? Which means that it may have proceededlater in an environment less favourable to the formation of prebioticmolecules and that life may have developed faster.
Certainly, future multidisciplinary research in astronomy, geology, biol-ogy and chemistry, in the solar system and (partly) in young stars andexoplanets, along the lines developed in this review, will help us addressthese questions.
For the time being, we just hope to have provided readers from thesevarious backgrounds with enough elements of knowledge and scientificcuriosity, but also evidence of ignorance, that they may endeavour to try toanswer these questions, and others, by themselves, and to participate to thedevelopment of this highly unconventional science called astrobiology.Indeed, astrobiology is unconventional because it is necessarily interdisci-plinary or even supradisciplinary. It necessitates a strong collaborationbetween scientists with very different backgrounds and different scientificattitudes towards enigmatic facts or observations. People involved inastrobiology must necessarily be open-minded scientists, convinced that thenumber of things we don’t know is incredibly much higher that the numberof things we know, yet are stubborn enough not to be discouraged.
Further readings
Books
Gargaud, M., Barbier, B., Martin, H. and Reisse, J. (eds.): 2005, Lectures in Astrobiology, Vol.1, Springer, Berlin, Heidelberg, New York.
Gargaud, M., Claeys, Ph. and Martin, H. (eds.): 2006, Lectures in Astrobiology, Vol. 2,Springer, Berlin, Heidelberg, New York (in press).
Lunine, J.: 1999. Earth, Evolution of a Habitable World, Cambridge University Press,
Cambridge.Norris, S. C.: 2004, Life’s Solution: Inevitable Humans in a Lonely Universe, Cambridge
University Press, Cambridge.Mayor, M. and Frei, P. -Y.: 2001, Les nouveaux mondes du Cosmos: a la decouverte des
exoplanetes, Editions du Seuil, Paris.Mayr, E.: 2004. What Makes Biology Unique: Considerations on the Autonomy of a Scientific
Discipline, Cambridge University Press, Cambridge.
311LIFE ON EARTH... AND ELSEWHERE?

Review articles
Bada, J. L., and Lazcano, A.: 2002, Science 296, 1982–1983.Chyba, C. E., and Hand, K. P.: 2005, Ann. Rev. Astr. Ap. 43, 31–74.
Ehrenfreund, P., and Charnley, S. B.: 2000, Ann. Rev. Astr. Ap., 38, 427–483.Greenberg, J. M.: 1996, in D. B. Cline (ed.), Physical Origin of Homochirality on Earth,
American Institute of Physics, Proc. 379, Woodbury New York, pp. 185–186.
312 THIERRY MONTMERLE ET AL.

ALBAREDE FrancisProfessor
Ecole Normale Superieure, Lyon, FranceE-mail: [email protected]
Geochemistry: early Earth, meteorites
AUGEREAU Jean-CharlesResearch scientist CNRS
Laboratoire d’Astrophysique de GrenobleUniversite Joseph Fourier, Grenoble, France
E-mail : [email protected]: young stars, evolved disks, dynamics,
dust evolution, exoplanets
BOITEAU LaurentResearch Scientist CNRS
Group Dynamique des Systmes Biomolculaires Complexes,Department de Chimie
Universite Montpellier II, FranceE-mail: [email protected]
Chemistry, physical organic chemistry: origin of life, originsof amino acids and peptides
CHAUSSIDON MarcResearch Director CNRS
Centre de Recherches Petrographiques et Geochimiques(CRPG), Nancy
E-mail: [email protected]/Cosmochemistry : Early Solar System evolution,
isotopic composition of meteorites and archeans rocks
CLAEYS PhilippeProfessor
Vrije Universiteit Brussels, Brussels, BelgiumE-mail: [email protected]
Geology: comets and asteroids impacts and their consequencesfor life evolution
Earth, Moon, and Planets (2006) 98: 313–317DOI 10.1007/s11038-006-9126-2
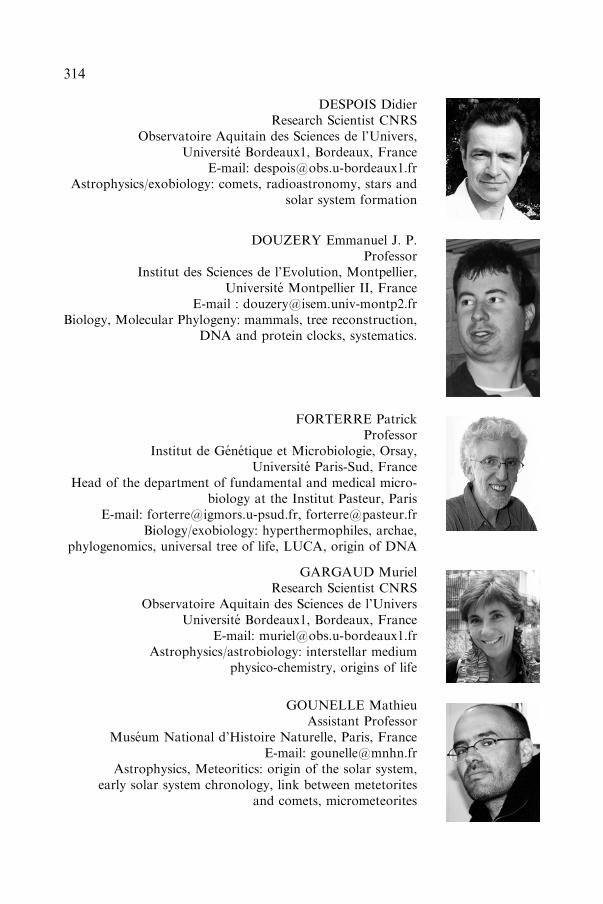
DESPOIS DidierResearch Scientist CNRS
Observatoire Aquitain des Sciences de l’Univers,Universite Bordeaux1, Bordeaux, France
E-mail: [email protected]/exobiology: comets, radioastronomy, stars and
solar system formation
DOUZERY Emmanuel J. P.Professor
Institut des Sciences de l’Evolution, Montpellier,Universite Montpellier II, France
E-mail : [email protected], Molecular Phylogeny: mammals, tree reconstruction,
DNA and protein clocks, systematics.
FORTERRE PatrickProfessor
Institut de Genetique et Microbiologie, Orsay,Universite Paris-Sud, France
Head of the department of fundamental and medical micro-biology at the Institut Pasteur, Paris
E-mail: [email protected], [email protected]/exobiology: hyperthermophiles, archae,
phylogenomics, universal tree of life, LUCA, origin of DNA
GARGAUD MurielResearch Scientist CNRS
Observatoire Aquitain des Sciences de l’UniversUniversite Bordeaux1, Bordeaux, France
E-mail: [email protected]/astrobiology: interstellar medium
physico-chemistry, origins of life
GOUNELLE MathieuAssistant Professor
Museum National d’Histoire Naturelle, Paris, FranceE-mail: [email protected]
Astrophysics, Meteoritics: origin of the solar system,early solar system chronology, link between metetorites
and comets, micrometeorites
314
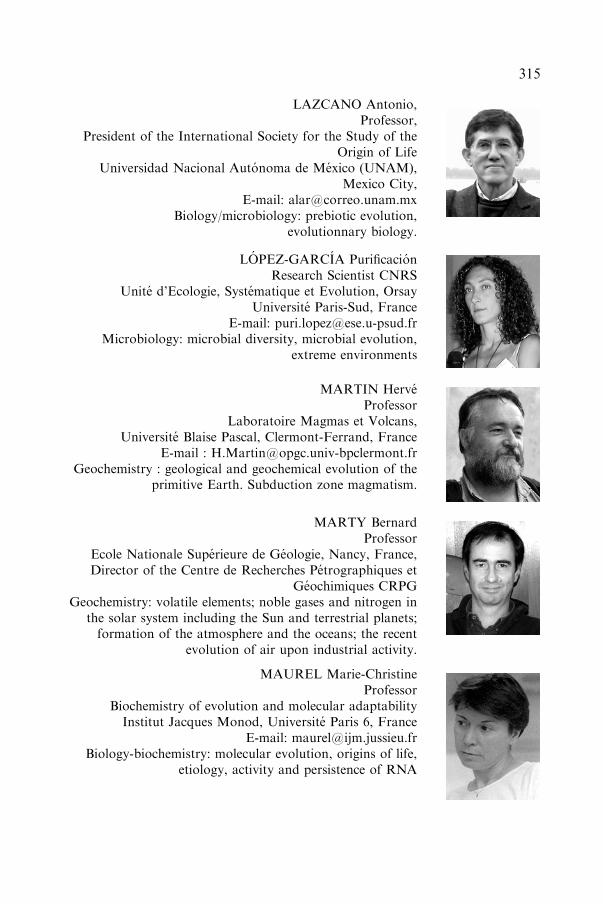
LAZCANO Antonio,Professor,
President of the International Society for the Study of theOrigin of Life
Universidad Nacional Autonoma de Mexico (UNAM),Mexico City,
E-mail: [email protected]/microbiology: prebiotic evolution,
evolutionnary biology.
LOPEZ-GARCIA PurificacionResearch Scientist CNRS
Unite d’Ecologie, Systematique et Evolution, OrsayUniversite Paris-Sud, France
E-mail: [email protected]: microbial diversity, microbial evolution,
extreme environments
MARTIN HerveProfessor
Laboratoire Magmas et Volcans,Universite Blaise Pascal, Clermont-Ferrand, France
E-mail : [email protected] : geological and geochemical evolution of the
primitive Earth. Subduction zone magmatism.
MARTY BernardProfessor
Ecole Nationale Superieure de Geologie, Nancy, France,Director of the Centre de Recherches Petrographiques et
Geochimiques CRPGGeochemistry: volatile elements; noble gases and nitrogen in
the solar system including the Sun and terrestrial planets;formation of the atmosphere and the oceans; the recent
evolution of air upon industrial activity.
MAUREL Marie-ChristineProfessor
Biochemistry of evolution and molecular adaptabilityInstitut Jacques Monod, Universite Paris 6, France
E-mail: [email protected]: molecular evolution, origins of life,
etiology, activity and persistence of RNA
315
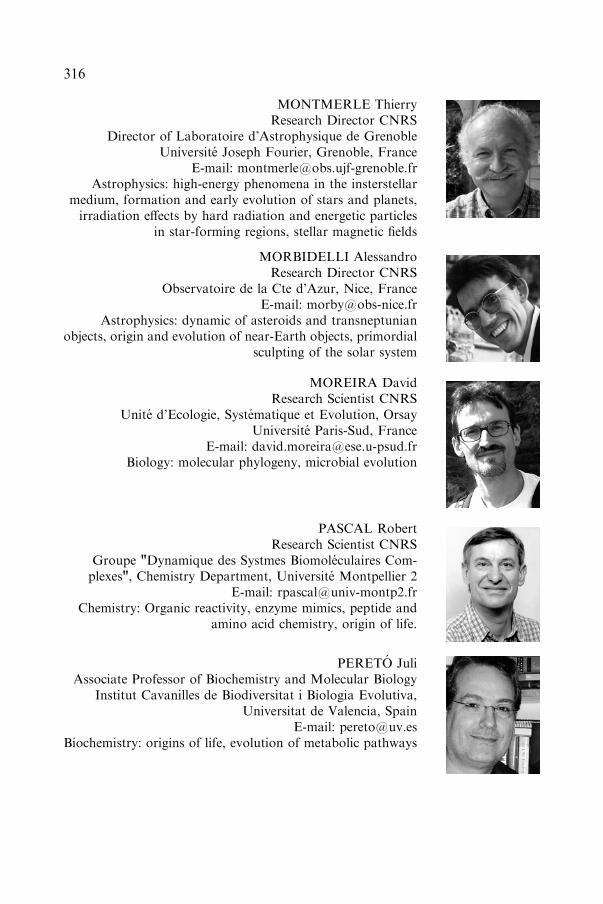
MONTMERLE ThierryResearch Director CNRS
Director of Laboratoire d’Astrophysique de GrenobleUniversite Joseph Fourier, Grenoble, France
E-mail: [email protected]: high-energy phenomena in the insterstellar
medium, formation and early evolution of stars and planets,irradiation effects by hard radiation and energetic particles
in star-forming regions, stellar magnetic fields
MORBIDELLI AlessandroResearch Director CNRS
Observatoire de la Cte d’Azur, Nice, FranceE-mail: [email protected]
Astrophysics: dynamic of asteroids and transneptunianobjects, origin and evolution of near-Earth objects, primordial
sculpting of the solar system
MOREIRA DavidResearch Scientist CNRS
Unite d’Ecologie, Systematique et Evolution, OrsayUniversite Paris-Sud, France
E-mail: [email protected]: molecular phylogeny, microbial evolution
PASCAL RobertResearch Scientist CNRS
Groupe "Dynamique des Systmes Biomoleculaires Com-plexes", Chemistry Department, Universite Montpellier 2
E-mail: [email protected]: Organic reactivity, enzyme mimics, peptide and
amino acid chemistry, origin of life.
PERETO JuliAssociate Professor of Biochemistry and Molecular Biology
Institut Cavanilles de Biodiversitat i Biologia Evolutiva,Universitat de Valencia, Spain
E-mail: [email protected]: origins of life, evolution of metabolic pathways
316
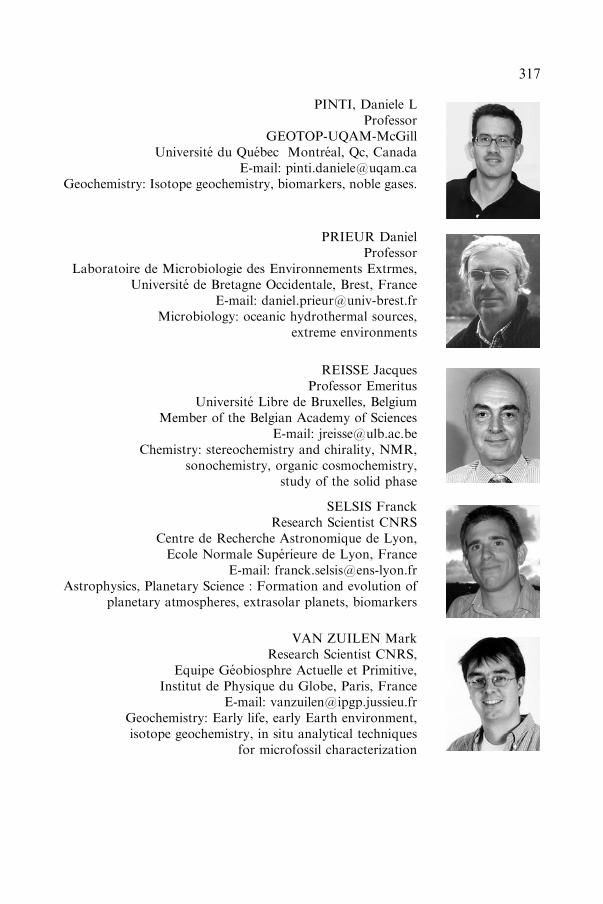
PINTI, Daniele LProfessor
GEOTOP-UQAM-McGillUniversite du Quebec Montreal, Qc, Canada
E-mail: [email protected]: Isotope geochemistry, biomarkers, noble gases.
PRIEUR DanielProfessor
Laboratoire de Microbiologie des Environnements Extrmes,Universite de Bretagne Occidentale, Brest, France
E-mail: [email protected]: oceanic hydrothermal sources,
extreme environments
REISSE JacquesProfessor Emeritus
Universite Libre de Bruxelles, BelgiumMember of the Belgian Academy of Sciences
E-mail: [email protected]: stereochemistry and chirality, NMR,
sonochemistry, organic cosmochemistry,study of the solid phase
SELSIS FranckResearch Scientist CNRS
Centre de Recherche Astronomique de Lyon,Ecole Normale Superieure de Lyon, France
E-mail: [email protected], Planetary Science : Formation and evolution of
planetary atmospheres, extrasolar planets, biomarkers
VAN ZUILEN MarkResearch Scientist CNRS,
Equipe Geobiosphre Actuelle et Primitive,Institut de Physique du Globe, Paris, France
E-mail: [email protected]: Early life, early Earth environment,isotope geochemistry, in situ analytical techniques
for microfossil characterization
317
GLOSSARY
The field of astrobiology is by definition multidisciplinary, therefore, anyglossary devoted to it is likely to be incomplete. Nevertheless, the editors hopethat the following glossary, which contains approximately 1000 terms com-monly used in astrobiology, will help specialists in one field to obtain pertinentinformation or clarifications about other disciplines.
This glossary is also published In: M. Gargaud, Ph. Claeys, H. Martin(Eds), Lectures in Astrobiology (vol. 2) Springer, 2006.
M. Gargaud, Ph. Claeys, H. Martin
A
a (astronomy): Orbital parameter,semi-major axis of elliptical orbit.Abiotic: In absence of life.Ablation (astronomy): Loss of matterby fusion or vaporization during theentrance of an object into the atmo-sphere.Absolute magnitude: Magnitude of astellar object when seen from a distanceof 10 parsecs (32.6 light-years) fromEarth.Acasta: Region of Northern Territories(Canada) where the oldest relicts ofcontinental crust were discovered.These gneisses were dated at 4.03 Ga.Accretion (astronomy): Matter aggre-gation leading to the formation of lar-ger objects (stars, planets, comets,asteroids). Traces of accretion of theirparent body (asteroid) can be observedin some meteorites.Accretion disk: Disk of matter around astar (or around a black hole) such thatmatter is attracted by the central objectand contributes to its growth. Disksaround protostars, new-born stars andT-Tauri stars are accretion disks.Accretion rate (astronomy): Mass ac-creted per time unit (typically 10)5 to10)8 solar mass per year).
Accuracy: The accuracy of a method isits capacity to measure the exact valueof a given quantity.Acetaldehyde: CH3CHO, ethanal.Acetic acid: CH3COOH, ethanoic acid.Acetonitrile: CH3CN, cyanomethane,methyl cyanide.Achiral: Not chiral.Acidophile: Organism which « likes »acidic media, which needs an acidicmedium.Actinolite: Mineral. Inosilicate (doublechain silicate). [Ca2 (Fe,Mg)5 Si8O22
(OH,F)2]. It belongs to the amphibolegroup.Activation energy (Ea): Empiricalparameter that permits to describe, viaArrhenius law, the temperature depen-dence of a reaction rate. In the case of areaction A + B fi C, Ea can be de-scribed as the energy difference betweenthe reactants A + B and the activatedcomplex (AB*) on the reaction pathwaytoC. It corresponds to an energy barrier.Active site (of an enzyme): Part of anenzyme where substrate is specificallyfixed, in a covalent or non-covalentway, and where catalysis takes place.Activity (solar or stellar): All physicalphenomena which are time dependentand which are related to star life(like stellar wind, solar prominence,
Earth, Moon, and Planets 98: 319–370DOI 10.1007/s11038-006-9127-1
sun-spots). Their origin is mainlymagnetic, they correspond to emissionsof electromagnetic waves at differentfrequencies (from radio-waves to X-rays) and also to emissions of chargedparticles (protons, alpha particles andheavier particles). In the case of theSun, the solar activity is cyclic. Theshorter cycle is an eleven year cycle.Activity: In non-ideal solution, activityplays the same role as mole fraction forideal solution.Adakite: Volcanic felsic rock generatedin subduction zone, by partial meltingof the subducted basaltic oceanic crust.Adaptive optics: The goal of adaptiveoptics is to correct the effects of atmo-spheric turbulence on the wavefrontscoming from stars. The basic ideaconsists of measuring the wavefrontform each 10 ms (to follow the atmo-spheric turbulence), and to deform themirror(s) accordingly to correct andstabilize the wavefront.Adenine: Purine derivative which playsan important role in the living world ascomponent of nucleotides.Adenosine: Nucleoside which resultsfrom condensation of adenine withribose.ADP: Adenosine diphosphate (see alsoATP).Aerobian: Organism whose life requiresfree oxygen in its environment.Aerobic respiration: Ensemble of reac-tions providing energy to a cell, oxygenbeing the ultimate oxidant of organicor inorganic electrons donors.Aerosols: Liquid or solid sub-millimet-ric particles in suspension in a gas.Aerosols play an important role inatmospheric physics and chemistry.Affinity constant: The efficiency of rec-ognition of a target by a ligand ischaracterised by an affinity constant (inM)1) which is the ratio of ligand-target
concentration ([ligand-target]eq) to theproduct of the free ligand and freetarget concentrations at equilibrium([ligand]eq x [target]eq) : K = ([ligand-target]eq/[ligand]eqx[target]eq.AIB: See aminoisobutyric acid.Akilia: Region of Greenland near Isuawhere are exposed sediments and vol-canic rocks similar in both compositionand age (3.865 Ga) to the Isua gneisses.Alanine (Ala): Proteinic amino acidcontaining three carbon atoms.Albedo: Fraction of the incident lightwhich is reflected by a reflecting med-ium (i.e. atmosphere) or surface (i.e. icecap). A total reflection corresponds toan albedo of 1.Albite: Mineral. Tectosilicate (3D sili-cates). Sodic plagioclase feldspar Na-AlSi3O8.Alcalophile: Organism, which « likes »alkaline (basic) media, or needs analkaline mediumAlcohol: R-OH.Aldehyde: R-CHO.Aldose: Any monosaccharide that con-tains an aldehyde group (-CHO).ALH84001: Martian meteorite found,in 1984, in the Alan Hills region (Ant-arctica). In 1996, the claim that it con-tains traces of metabolic activity andeven, possibly, microfossils was thestarting point of strong debates.Aliphatic hydrocarbon: Hydrocarbonhaving an open chain of carbon atoms.This chain can be normal or forked.Allende: Large carbonaceous chondrite(meteorite) of 2 tons, of the C3/CV typeand found in Mexico in 1969.Allochtonous sediment: Sediment thatformed in a place different of its presentday location (transported).Alpha helix: A type of secondary helicalstructure frequently found in proteins.One helix step contains approximately3.6 amino acid residues.
320

Alteration (Weathering): Modificationof physical and chemical properties ofrocks and minerals by atmosphericagents.Amide: R-CO-NH2, R-CO-NH-R’, R-CO-NR’R’’ depending if the amide isprimary, secondary or tertiary. Thebond between the CO group and the Natom is generally called the amide bondbut when it links two amino acid resi-dues in a polypeptide or in a protein, itis called the peptide bond.Amine: Derivatives of ammonia NH3 inwhich one, two or three H atoms aresubstituted by an R group (a groupcontaining only C and H atoms) to giveprimary, secondary or tertiary amines.Amino acid (AA): Organic moleculecontaining a carboxylic acid function(COOH) and an amino function (gener-ally but not always a NH2 group). If thetwo functions are linked to the same car-bon atom, theAA is an alpha amino acid.All proteinic AA are alpha amino acids.Amino acids (biological): AA directlyextracted from organisms, fossils, sedi-mentary rocks or obtained, afterhydrolysis, from polypeptides or pro-teins found in the same sources.Amino acids (proteinic): AA found asbuilding blocks of proteins. All protei-nic AA are homochiral and character-ized by an L absolute configuration.Amino isobutyric acid (AIB): Nonproteinic alpha amino, alpha methylAA. Detected in chondrites.Amino nitrile: Molecule containing aCN group and an amine function. Itcould have played a role in the prebi-otic synthesis of amino acids.Amitsoq: Region of Greenland whereare exposed the oldest huge outcrops(~3000 km2) of continental crust, datedat 3.822 Ga (gneiss)Amorphous: Solid state characterizedby a lack of order at large distances
Amphibole: Mineral family. Inosilicate(water-bearing double chain silicate),including actinolite, hornblende, glau-cophane, etc.Amphibolite: Rock generated by meta-morphism of basalt. It mainly consistsin amphibole and plagioclase feldsparcrystals, sometimes associated withgarnet.Amphiphile: Molecule with a hydro-philic part and a lipophylic part.Amplification (of DNA): Production, inrelatively large quantity, of fragmentsof DNA by in vitro replication, startingfrom a very small initial sample (see:PCR).Amu (atomic mass unit): Atomic massunit such that the atomic mass of the12C (carbon isotope) has exactly a massequal to 12.0000.Anabolism: General term to designatea group of biochemical reactionsinvolved in the biosynthesis of differentcomponents of living organisms.Anaerobian: Organism, which does notneed free oxygen for his metabolism. Insome cases, free oxygen is a poison foranaerobian organisms.Anaerobic respiration: Ensemble ofreactions providing energy to a cell, theultimate oxidant being an inorganicmolecule other than oxygen.Anatexis: High degree metamorphismwhere rock begins to undergo partialmelting.Andesite: Effusive mafic magmatic rock(volcanic); it mainly consists in sodicplagioclase feldspar + amphibole ±pyroxene crystals. These magmas areabundant in subduction zones. Dioriteis its plutonic equivalent.Angular momentum: The angularmomentum, L of a rigid body with amoment of inertia I rotating with anangular velocity x is L = I·x. In theabsence of external torque, the angular
321
momentum of a rotating rigid body isconserved. This constancy of angularmomentum allows to fix constraints onstar and planetary system genesis fromhuge interstellar gas clouds.Anorthite: Mineral. Tectosilicate (3Dsilicates). Calcic plagioclase feldsparCaAl2Si2O8.Anorthosite: Plutonic magmatic rockonly made up of plagioclase feldspar.Generally, it consists in an accumulation(by flotation) of plagioclase crystals.Relatively rare on Earth, anorthositesare widespread on the Moon where theyform the ‘‘primitive’’ crust.Anoxic: Environment (water, sediment,etc.) where oxygen is highly deficient orabsent. Synonym: anaerobic.Anthophyllite: Mineral. Inosilicate(double chain silicate). [(Mg)7 Si8 O22
(OH,F)2]. It belongs to the amphibolegroup.Antibody (immunoglobulin): Glycopro-tein produced because of the introduc-tion of an antigen into the body, andthat possesses the remarkable ability tocombine with the very antigen thattriggered its production. Polyclonalantibodies are produced by differenttypes of cells (clones), whereas mono-clonal antibodies are exclusively pro-duced by one type of cell by fusionbetween this cell and a cancerous cell.Anticodon: Triplet of nucleotides oftRNA able to selectively recognize atriplet of nucleotides of the mRNA(codon).Antigen: Foreign substance that in anorganism, is able to induce the pro-duction of an antibody.Antisense: Strand of DNA that is tran-scripted into a mRNA (messenger RNA).Aphelia: In the case of an object inelliptical motion around a star, thepoint which corresponds to the largestdistance with respect to the star.
Apollo: Ensemble of asteroids whoseorbits intersect Earth orbit.Aptamer: Synthetic polynucleotidemolecule that binds to specific mole-cular targets, such as a protein oligo-nucleotide. Contrarily to nucleic acids,aptamers are able to fold back into a 3Dstructure, thus leading to the formationof binding cavities specific to the target.Archaea: One of the three main do-mains of the living world. All theorganisms of this domain are prokary-otes. Initially, these organisms wereconsidered as the most primitive formof life but this is no longer accepted bymost biologists. Most extremophilessuch as hyperthermophiles and hyper-acidophiles belong to archaea domain.Archaean (Aeon): Period of time (Aeon)ranging from 4.0 to 2.5 Ga. Archaeanaeon belongs to Precambrian. Unicel-lular life existed and possibly was al-ready aerobeArchebacteria: See Archaea.Arginine: Proteinic alpha amino acidcontaining six carbon atoms and aguanido group in the side chain.Aromatic hydrocarbon: Hydrocarbonthat contains one or several benzenering(s).Aspartic acid (Asp): Proteinic AA withan acidic side chain.Assimilative metabolism: In a cell,reduction process by which an inor-ganic compound (C, S, N, etc) isreduced for use as a nutriment source.The reduction reaction necessitates anenergetic supply (endothermic).Asteroid belt: Ring-shaped belt betweenMars and Jupiter where the majority ofthe asteroids of the Solar System arelocatedAsteroid: Small object of the Solar systemwith a diameter less than 1000 km. Manyof them are orbiting around the Sun,between Mars and Jupiter (asteroid belt).
322
Asthenosphere: Layer of the Earthmantle, located under the lithosphereand having a ductile behaviour. It isaffected by convective movements.Depending on geothermal gradient, itsupper limit varies between 0 km undermid oceanic ridges and 250 km undercontinents.Astrometry: Part of astrophysics thatstudies and measures the position andmotion of objects in the sky. Byextension, astrometry refers to allastrophysics phenomenons that can bedocumented or studied by observationand measurement of the motion ofcelestial object.Asymmetric atom: Synonym for chiro-tropic carbon. See asymmetric.Asymmetric: An atom is called asym-metric when it is surrounded by fourligands which are oriented in 3D spacein such a way that they define anirregular tetrahedron. Such an atomicarrangement is chiral and can exist astwo enantiomeric forms. These twoenantiomers are called D or Ldepending on their absolute configura-tion. The D/L nomenclature is nowreplaced by the R/S nomenclature ofCahn, Ingold and Prelog but the D/Lsystem is still accepted for amino acidsand oses. The asymmetric carbon atomis a particular (but very important)example of asymmetric atom.Atmosphere:Gaseous envelope around astar, a planet or a satellite. In absence ofrigid crust or ocean, the atmosphere isdefined as the most external part of theobject. The primary atmosphere of ayoung planet corresponds to the firstgaseous envelope directly generatedfrom protostellar nebula. The primitiveatmosphere of the Earth corresponds tothe atmosphere in which prebioticchemistry occurred, when free oxygenwas in very low concentrations. In the
second part of the past century, thisprimitive atmosphere was considered asbeing highly reductive. Today, it is con-sidered as mainly consisting in carbondioxide, nitrogen and water vapour.ATP synthetase: Enzyme involved inATP synthesis.ATP: Adenosine triphosphate. Mole-cule which plays an important role inthe living world for the energy trans-fers. Its hydrolysis in ADP and ininorganic phosphate is an exergonicreaction.AU (astronomical unit): AverageEarth-Sun distance corresponding to149.6 · 106 km (or approximately 8minute light and 100 Sun diameters).Authigenic minerals: In a sedimentaryenvironment, minerals generated bydirect local precipitation of dissolvedions.Autocatalysis: Chemical reaction suchthat a reaction product acts as a cata-lyst for its own synthesis.Autochthonous sediment: Sediment thatformed in the place where it is now.Automaton (chemical automaton): Asdefined by A. Brack, chemical systemable to promote its own synthesis.Autotroph: Organism which is able tosynthesize its own constituents fromsimple molecules like water and carbondioxide.
B
Bacteria: One of the three domains ofthe living world. Organisms of thisdomain are all prokaryotes. They arethe more abundant micro-organisms onEarth. One of their characteristicsconsists in the presence of a cell-wallcontaining muramic acid. Some ofthese organisms are extremophiles likeAquifex and Thermoga.
323

Bacteriochlorophylls: Pigment found inmicro-organisms and containing atetrapyrole acting as a ligand for an Mgcation (similarly to chlorophylls ofgreen plants).Barophile: Micro-organism that livesoptimally (or can only grow) in highpressure environments such as deep seaenvironments.Basalt: Effusive mafic magmatic rock(volcanic); it mainly consists in plagio-clase feldspar + pyroxenes ± olivinecrystals. It results of 20 to 25% meltingof the mantle. Gabbro is its plutonicequivalent.Bases in nucleotides: See nucleic base,purine bases and pyrimidine bases.Benioff plane: In a subduction zone,interface between the subducted slaband the overlying mantle wedge.Beta sheet: A secondary pleated struc-ture frequently observed in proteins.BIF (Banded Iron Formation): Sedi-mentary rocks widespread in Archaeanterrains and no more generated today.They consist in alternation of blackiron-rich (magnetite) and white amor-phous silica-rich layers.Bifurcation (thermodynamics): Thisterm describes the behaviour of a sys-tem; which submitted to a very smallvariation in exchange conditions withits surroundings, jumps suddenly fromone stationary state to another one.The characteristics of new stationarystate cannot be predicted on the basisof a complete knowledge of the initialstationary state.Binding energy (nuclear): In an atom thenuclear binding energy is the energynecessary to break the atomic nucleusinto its elementary components. This isalso the amount of energy released dur-ing the formation of an atomic nucleus.Biocenosis: Group of interactingorganisms living in a particular habitat
and forming an ecological community(ecosystem).Biochemical sediment: Sediment formedfrom chemical elements extracted fromwater by living organisms (for instance,limestone formed by an accumulationof shells).Biofilm: Tiny film (few lm thick) con-sisting in colonies of micro-organismsfixed on an inorganic or organic sur-face.Biogenic sediment: Sediment formed byprecipitation of ions dissolved in waterby the mean of living beings (e.g. cal-cium ion in shells).BIOPAN: Experimental module madeby ESA to be fixed on a Russiansatellite of the Photon type, the aim ofthe system is to expose samples ordosimeters to space conditions asvacuum, microgravity or radiation.Bioprecipitation: Precipitation of solidmineral phases linked to the metabo-lism of living organism. Throughselective evolution, this process wasused by organisms to reduce the toxicexcess of some soluble compounds orelements (for example Ca), then toconstitute new functionalities (exo- orendoskeleton, protective tests, teethes…). In some extent, the organisms canfavour bioprecipitation while the sur-rounding physico-chemical conditionsare unfavourable. This is for examplethe case of diatoms that precipitate anSiO2 test under seawater conditions,which would normally dissolve SiO2.Biosensor: Device containing biologicalcompounds on/in a membrane, whichtranslates biological parameters such aselectric potential, movement, chemicalconcentration, etc. into electrical signals.Biosignature: observable considered asan evidence of the presence of life.Biosphere: Ensemble of species livingon Earth.
324
Biosynthesis: production of a chemicalcompound by a living organism,equivalent to anabolism.Bio-tectonic: Environmental conceptproposed to account for the situation inLake Vostok (Antarctica), where crus-tal tectonics (faults) controls and acti-vates hydrothermal circulation. Thelatter provides chemical elementsallowing life to survive. In the ocean, aswell as in the oceanic crust, life liked tomagmatic activity should rather becalled bio-magmatic.Biotite: Mineral. Phyllosilicate (water-bearing sheet silicate). [K(Fe,Mg)3-Si3AlO10 (OH)2]. It belongs to the micagroup and is also called black mica.Biotope: Smallest unit of habitat whereall environment conditions and all typeof organisms found within are the samethroughout.Bipolarflow (astronomy):Flowofmatterin two opposite directions, perpendicu-larly to the circumstellar disk associatedto a new-born star. The components ofthe bipolar flow are molecules, atoms,ions and dust particles.Birthline: Locus, in the Hertzsprung-Russell diagram where young starsbecome optically visible.Black body (radiation): Radiationemitted by a body at a temperature Tand such that the coupling betweenmatter and radiation is perfect. Such abody is black. The total power emittedby unit area and the power emitted at awell defined frequency depends only onthe temperature (the T4 dependence isgiven by the empirical Stefan law and bythe theoretical Planck law). As a firstapproximation and on the basis of theiremission properties, stars and planetscan be described as black bodies.Black smoker: Also called hydrother-mal vent. Structure observed on theoceans floor generally associated with
mid ocean ridges. There, hot hydro-thermal fluid, rich in base metal sulp-hides, enters in contact with coldoceanic water. Polymetallic sulphidesand calcium sulphate precipitate pro-gressively building a columnar chimneyaround the vent.Blast: Blast (Basic Local AlignmentSearch Tool) represents a powerful andrapid way to compare new sequences toan already existing database, whichmay either contain nucleotides (Blastn)or proteins (Blastp). Since the BLASTalgorithm establishes local as well asglobal alignments, regions of similarityembedded in otherwise unrelated pro-teins could be detected. The Blast pro-gram gives a value for each of the highscoring results, together with theprobability to find an identical score ina database of the same size by chanceBlue algae: See cyanobacteria. Oldname for some procaryotic unicellularwhich are not algaeBolometric light (or bolometric magni-tude): Total radiation output by timeunit of a stellar objectBootstrap: Statistical method withre-sampling, commonly used to mea-sure the robustness and the reliabilityof phylogenic trees.Braking radiation: Electromagneticradiation emitted by high speed particle(electron, proton) when deviated by amagnetic or electric field. (Also seeBremsstrahlung).Branching ratio: In the case of achemical or of a nuclear reaction, suchthat different reaction paths exist, thebranching ratio is the relative rateconstants or probabilities of occurrenceper unit of time for each different path.Breccias (geology): Sedimentary ormagmatic rocks consisting in an accu-mulation of angular fragments in asedimentary or magmatic matrix.
325

Bremsstrahlung: German word alsoused in French and English to describethe electromagnetic radiation emittedby high speed particle (electron, pro-ton) when deviated by a magnetic field.Brown Dwarf: Space body born as astar, but whose mass is too small (<80Jupiter mass) to allow nuclear reaction:both core temperature and core pres-sure are insufficient to initiate hydrogenfusion.
C
C (alpha): Carbon atom linked to achemical function we are interested in.More specifically, the carbon atomdirectly linked to the carboxylic functionin amino acids. In alpha amino acids, theamino group is linked to the alpha car-bon. The Greek letters alpha, beta,gamma … are used to describe carbonatoms separated from the function byone, two, three… other carbon atoms.CAI (Ca-Al Inclusions): Ca-and Al-richinclusions abundant in some chondritemeteorites.Caldera: Circular km-sized structuredue to the collapse of superficial for-mation induced by the emptying of anunderlying magma chamber.Carbonaceous chondrite: Chondritewith high carbon content. The famousMurchison meteorite is a carbonaceouschondrite.Carbonate compensation depth (CCD):Depth below which sedimentary car-bonates are systematically dissolved inseawater. This depth depends on thephysico-chemical conditions of theenvironment (amount of sinking parti-cles due to surface biological produc-tion, deep-water circulation, etc.).These conditions can change from one
ocean to another and may also changethrough time. The present Atlanticocean CCD is at about 3500 m.Carbonate: (CO3)
2--bearing mineral e.g.Calcite = CaCO3; Dolomite =MgCa(CO3 )2.Carbonation: In Ca-, Mg-, K-, Na- andFe- bearing minerals, chemical reactionof alteration resulting in the formationof carbonates.Carbonic anhydride: CO2. Synonym forcarbon dioxide.Carbonyl: -(CO)-, thischemical function is found in carbox-ylic acids, ketones, aldehydes, amidesand many other organic molecules.Carboxylic acid: Organic moleculecontaining a COOH group.C-asteroid: Asteroid containing carbon.C-asteroids are the parent-bodies ofcarbonaceous chondrites.Catabolism: Part of metabolisminvolving all degradation chemicalreactions in the living cell resulting inenergy production. Large polymericmolecules such as polysaccharides, nu-cleic acids, and proteins are split intotheir smallest size constituents, such asamino acids, after which the monomersthemselves can be broken down intosimple cellular metabolites. The smallsize constituents can be subsequentlyused to construct new polymeric mole-cules. These reactions involve a processof oxidation that releases chemical freeenergy, part of which is stored throughsynthesis of adenosine triphosphate(ATP). All these reactions requireenzymatic catalysis.Catalysis: Chemical process such that asubstance (catalyst) increases reactionrate by changing reaction pathway butwithout being chemically modifiedduring reaction. Enzymes are very effi-cient catalysts able to increase reactionrates by several orders of magnitude
326
and also able to limit the number ofsecondary products and therefore toincrease reaction selectivity.CCD (Charge-Coupled Device): Siliconphoto electronic imaging device con-taining numerous photo-sensors (oftenat least 1000 X 1000). The most usedastronomic detector in the visiblewavelength domain.Cell: Complex system surrounded by asemi-permeable membrane which canbe considered as the basis unit of allliving organisms.Cenancestor: Last ancestor shared byall living beings. Synonym of LUCA.Cenozoic (Era): Period of time (Era)ranging from 65 Ma to today, it is alsocalled Tertiary Era but in addition alsoit includes Quaternary area.Chalcophile: Chemical element fre-quently associated with sulphur (i.e.Cu, Zn, Cd, Hg…).Chandrasekhar mass: Also calledChandrasekhar limit. In astrophysics,the maximum possible mass of a whitedwarf star. This maximum mass isabout 1.44 times the mass of the Sun.After having burned all its nuclear fuelthe star atmosphere collapses back onthe core. If the star has a mass belowChandrasekhar limit, its collapse islimited by electron degeneracy pres-sure; if the mass is above the Chandr-asekhar limit it collapses and becomes aneutron star and possibly a black hole.Chemical derivatization: Typically,derivatization consists in the chemicalmodification of a compound in order toproduce a new compound easier todetect due to its new physico-chemicalproperties (volatility, absorption inultraviolet, fluorescence…). The deriv-atization of a molecule involves alteringpart of it slightly or adding a new partto the original compound.
Chemical sediment: Sediment formedby direct precipitation of ions dissolvedin water.Chemolithoautotroph: Chemotroph thatuses CO2 as only source of carbon.Chemolithotroph: Chemotroph thattakes its energy from the oxidation ofinorganic molecules such as NH3, H2S,Fe++. On Earth, the first livingorganisms could have been chemo-lithotrophs.Chemolitotroph: Chemotroph thattakes its energy from the oxidation ofinorganic molecules. On Earth, the firstliving organisms could have beenchemolitotrophs.Chemoorganotroph: Chemotroph thattakes its energy from oxidation oforganic molecules.Chemotroph: Organism that takes itsfree energy from the oxidation ofchemicals.Chert: Microcrystalline to cryptocrys-talline sedimentary rock consisting ofquartz crystals whose size in <30lm,or of amorphous silica. Synonym: flint.Chicxulub: Large (180 km in diameter)impact crater, located in Mexico Gulf.It is assumed to result of the collision ofa big (10 km in diameter) meteorite, 65Ma ago. This impact is considered asthe cause of the important biologicalcrisis at the Cretaceous-Tertiaryboundary that led to mass extinction ofthousands of living species, such asammonites, dinosaurs, etc.Chirality: Property of an object (andtherefore of a molecule) to be differentfrom its mirror image in a plane mirror.A hand is an example of a chiral object(in Greek: cheir means hand). Anyobject is chiral or achiral and if it is chi-ral, it can exist as two enantiomorphousforms (called enantiomers for mole-cules).
327
Chlorophylls: Pigments of major impor-tance in the oxygenic photosynthesis.The chemical structure of all chloro-phylls is based on a porphyrin ring sys-tem chelating an Mg2+ cation.Chlorophylls are found in higher plants,algae and some micro-organisms.Chloroplast: sub-Cellular structure thatplays a fundamental role for photo-synthesis in all photosynthetic eukary-otes. Chloroplasts have more probablyan endosymbiotic origin.Chondre: Small spherical aggregate ofradiated silicate minerals (typically 1mm in diameter) which is frequent instony meteorites and especially inchondrites. Olivine is the main com-ponent of chondres.Chondrite: Undifferentiated stonymeteorite unmelted and frequentlyconsidered as a very primitive object.Chondrites have the same compositionas the Sun except for volatile elements.Chromatographic co-elution: Refers toorganics compounds that cannot be sep-arated by a given chromatographicmethod and that migrate at the samespeed leading toa singledetectable signal.Chromatography: Preparative or ana-lytical chromatography: experimentalmethod based on the properties of allmolecules to be absorbed more or lessselectively by a solid phase (the sta-tionary phase) and therefore to migrateat different rates when they are « pu-shed away » by a mobile phase whichcan be a gas (gas chromatography orGC) or a liquid (LC or HPLC for HighPerformance LC).Chromophore: Chemical group thatabsorbs UV and visible wavelengths,thus colouring the molecules or objectsthat contain them.Chromosome: Sub-cellular structurecontaining most of the genetic materialof the cell. Prokaryotic cells generally
contain only one chromosome made ofa circular DNA molecule whileeukaryotic cells generally have severalchromosomes, each of them containinga linear DNA molecule.CIP (for Cahn-Ingold-Prelog): Generalnomenclature used in chemistry todescribe chiral molecules and moregenerally stereoisomers. Following theInternational Union of Pure andApplied Chemistry (IUPAC), CIPnomenclature must replace all othernomenclatures including D, L Fishernomenclature except for amino acidsand sugars for which the D/L nomen-clature is still accepted.Circular dichroism: The absorptioncoefficient of right and left circularlypolarized light are different if theabsorbing medium is chiral. By plottingthe difference between the absorptioncoefficients as a function of the lightwavelength, the curve which is obtainedcorresponds to the circular dichroismcurve of the medium.Circumstellar disk: Disk of gas and dustparticles around a star.Class [0,I,II,III] (astronomy): Classifi-cation of young stellar objects based ontheir electro-magnetic emission in themicro-wave and infra-red domains. Itconsists in an evolution sequence fromthe protostars (0 and I) to the T-Tauristars (III).Clast: Fragment of mineral or rockincluded in another rock.Clay: Mineral family. Phyllosilicate (wa-ter-bearing sheet silicate), e.g. kaolinite,illite, smectite, montmorillonite.CM matter: Pristine material of thesolar system, analogue to constitutivematter of CM carbonaceous meteorites(M = Mighei) and very abundant inmicrometeorites.CNO cycle: Series of hydrogen burningreactions producing helium by using C,
328
N, O as catalysers. These reactionsprovide the energy of the mainsequence stars with a mass >1.1 MSun.Coacervat (droplet): Protein and poly-saccharides containing emulsion.According to Oparin, model of proto-cells.Codon: Triplet of nucleotides in amRNA molecule which corresponds toa specific amino acid of a protein syn-thesized in a ribosome or which corre-sponds to a punctuation signal inprotein synthesis.Coenzyme: Small molecule that bindswith an enzyme and that is necessary toits activity. ATP, CoA, NADH, biotineare examples of coenzymes. Coenzymesare often derived from vitamins.Collapse (astronomy): Process that de-scribes the formation of stars fromdense cores. The process seems to befast: less than 105 years.Coma: Broadly spherical cloud of dustparticles and gaseous molecules, atomsand ions surrounding cometary nucleus.It appears when nucleus becomes active,generally when approaching the Sun.Combustion: Used to describe anyexothermal chemical reaction involvingdioxygen and organic reactants.Sometimes used in astrophysics to de-scribe the thermonuclear fusion reac-tions taking place in the stars andwhich, obviously, are also exothermal.Comet: Small body of the Solar systemwith an average size of 1 to 100 km,travelling generally on a strongly ellip-tic orbit around the Sun. Comets areconstituted of ice and dust and areconsidered as the most primitive ob-jects of the Solar system.Cometary nucleus: Solid part of a comet(1-100 km diameter), made of ice (H2O,CH3OH, CO. . .) and of dust.Cometary tail: Part of an active comet;three different cometary tails are
known depending from their composi-tion (dust particles and molecules,neutral sodium atoms, ions).Complex molecule (Astronomy): Mole-cule containing more than 3 atoms.Complexation: Chemical term used todescribe the non-covalent interaction ofa molecule or, more frequently, aninorganic ion with other molecules(called ligands) to give a supramolecu-lar system described as a complex.Condensation: Chemical reactioninvolving two molecules and leading tothe formation of a new chemical bondbetween the two subunits but also tothe elimination of a small molecule(generally a water molecule). The for-mation of bonds between the subunitsof many biochemical polymers arecondensation reactions (examples:polynucleotides, polypeptides, polysac-charides).Configuration: Term used in stereo-chemistry. Stereoisomers (except if theyare conformers) have different config-urations. As an example, butene can becis or trans and it corresponds to twodifferent configurations. In the case ofchiral the D- and L-valine, the stereoi-somers are enantiomers and they have« opposite » configurations. It isimportant to make a clear distinctionbetween the relative configurations oftwo enantiomers and the absoluteconfiguration of each of them.Conglomerate (chemistry): In therestricted case of crystallized chiralmolecules, a crystalline state such thatall molecules of the same chirality(homochiral) crystallize together givinga mixture of crystal which, themselves,are of opposite chirality.Conglomerate (geology): Detrital sedi-mentary rock consisting in an accu-mulation of rounded fragments in asedimentary matrix.
329

Continental margin: Submarine part ofa continent making the boundary withoceanic crust.Continents: Emerged and associatedshallow depth (<300 m) parts of theEarth surface. Their average composi-tion is that of a granitoids.Continuum (astronomy): in emission(or absorption) spectroscopy, emission(or absorption) background of a spec-trum extending on a large frequencydomain. Frequently, lines are superim-posed on the continuous spectrum.Black body radiation corresponds to acontinuous spectrum.Cool Early Earth: Period of timebetween Earth accretion (4.55 Ga) andthe late heavy bombardment (4.0–3.8Ga). This model considers that periodof early Earth as quiescent with respectto meteoritic impacts, thus beingpotentially favourable for life develop-ment.Core (geology): Central shell of a pla-net. On Earth core mainly consists iniron with minor amounts of nickel andsome traces of sulphur; it represents16% volume but 33% mass of theplanet. It is subdivided in a solid innercore from 5155 to 6378 km depth and aliquid outer core from 2891 to 5155 kmdepth.Coronography: Technique used inastronomy and that consists of mask-ing one part of the observed field (forinstance a bright star) to allow theobservation of a lower luminosityobject located in the immediate vicin-ity. This technique was first developedby Bernard Lyot, who masked the sundisk to observe its corona, thus leadingto the given name of coronography.COROT: French project for the searchof extrasolar planets based on a 25 cmtelescope and able to detect planetshaving a diameter equal to two times
the Earth diameter and located at 0.5AU from its star.Cosmic rays: Highly accelerated ionscoming from the Sun (solar wind,essentially protons) or coming fromother and extrasolar sources (galacticcosmic rays).Covalent bonds: Interatomic bonds suchthat two atoms share one, two or threeelectrons pairs leading to the formationof a single, a double or a triple bond. Acovalent bond is described as a polar-ized bond if the two bonded atomshave different electronegativities.CPT (theorem): general theorem ofphysics which assumes that physicallaws are unchanged if, simultaneously,space is reversed (parity operation),time is reversed (the sense of motion isreversed) and matter is replaced byanti-matter. In many cases but not all,the CP theorem alone is valid.Craton: Huge block of old (often Pre-cambrian in age) and very stable con-tinental crust (see also shield)Crust (geology): The more superficialshell of the solid Earth. Its lower limitwith the mantle is called Morohovicic(Moho) discontinuity. Together withthe rigid part of the upper mantle itforms the lithosphere. Two main crustsexist 1) oceanic crust, basaltic in com-position and about 7 km thick, it con-stitutes the ocean floor; 2) continentalcrust is granitic in composition, with athickness ranging between 30 and 80km, it constitutes the continents.Cryosphere: Part of the Earth surfacemade of ice.Cumulate: Igneous rock generated byaccumulation of crystals extracted frommagma.Cyanamid: NH2-CO-CN.Cyanhydric acid: HCN, hydrogen cya-nide. Triatomic molecule that duringprebiotic period could have played the
330
role of starting material for purinesynthesis.Cyanoacetylene or better cyanoethyne:H-CC-CN.Cyanobacteria: Microorganism belong-ing to the Bacteria domain and able toperform oxygenic photosynthesis. Inthe past, these microorganisms wereimproperly called « blue algae ». Thecyanobacteria could be the ancestors ofchloroplasts.Cyanogen: C2N2.Cysteine (Cys): Protinic amino acidcontaining three C atoms and a –SHgroup in its side chain. In a proteinicchain, two cysteine residues can belinked together by a –S-S- bond(disulfide bond) often used to stabilizeprotein conformation. Two cysteineslinked together by a disulfide bond is acystine molecule.Cytidine: The ribonucleoside of cyto-sine. The corresponding deoxyribonu-cleoside is called deoxycytidine.Cytochrome c: One particular exampleof the large cytochrome family. Cyto-chrome c is a protein involved in theelectron transfers associated to aerobicrespiration. In the eukaryotic cells,cytochrome c is localized in the mito-chondrias.Cytoplasm: Whole content of a cell(protoplasm) except the nucleus whosecontent is called nucleoplasm.Cytoplasmic membrane: also calledplasmatic membrane or cell membrane.Cytosine (C): One of the nucleic basesof pyrimidine type.
D
D/H ratio: D = Deuterium; H =Hydrogen. Due to their mass differ-ence, molecules containing either H orD are able to fractionate. For instance,
during vaporization, a molecule con-taining the light isotope (H) is moreefficiently vaporized than its heavyequivalent (D). Chemical reactions,including biochemical ones are alsoable to fractionate these isotopes.Consequently the D/H ratio can pro-vide information on the biotic or abi-otic origin of some organic molecules.The D/H ratio can be very high inchondritic organic matter due toD-enrichment during reactions takingplace in the interstellar clouds.Dalton (Da): Molecular mass unitequal to the sum of the atomic massesgiven in amu (atomic mass unit).DAP: Abbreviation frequently used todesign two different molecules, diaminopropionic acid and diamino-pimelic acid.Darwin: Research programme from theEuropean Space Agency devoted tothe search of extrasolar planets andthe study of their atmosphere compo-sition by spatial interferometry, in theinfra-red spectral region. Five inde-pendent telescopes of 1,5 m each con-stitute the basis of this verysophisticated system.Daughter molecule (in comet): In thecometary coma, any molecule pro-duced by photo-dissociation of a par-ent molecule coming from the nucleus.Deamination: Reaction associated tothe elimination of an amine group(NH2, NHR or NRR’).Decarboxylation: Reaction associatedto the elimination of a CO2 molecule.Decay constant (k): Probability thatover a given time interval, one radio-nuclide will decay. This probability isunique for each isotope and its value isindependent of its chemical and min-eralogical environment. The constant(k) unit is s)1.Deccan (Trapps): Voluminous stackingof basaltic flows emplaced in North-
331

west India at the end of Cretaceousperiod. It constitutes the evidence of anextremely important volcanic eventcontemporaneous with the extinctionof dinosaurs.Delta (isotopic) (d): Difference betweenthe isotopic ratio of a sample (Re) andthat of a standard (Rs). d ¼ 1000Æ (Re–Rs)/Rs. e.g. d
18O.Denaturation: Change of the nativeconformation of a biopolymer. Morespecifically and in the case of proteins,denaturation can be induced byincreasing temperature and/or pressureor by adding a chemical reagent (likeurea). Denaturation can be reversibleor irreversible. It is generally associ-ated with a loss of enzymatic proper-tiesDenitrification: Capability of someorganisms to transform dissolved ni-trate (NO3
)) into molecular nitrogen(N2) or nitrogen oxide (N2O). Thismetabolism requires anoxic or dysoxicconditions.Dense clouds: See interstellar clouds.Dense core (Astronomy): Gravitation-ally bound substructure located inside amolecular cloud and surrounded byprotoplanetary disks. Dense core col-lapsing leads to the formation of one orseveral stars.Deoxyribose: Ose or monosaccharidehaving a structure identical to riboseexcept that the OH group in position 2’is replaced by an H atom. In livingorganisms, deoxyribose comes fromribose via a reduction reaction.Depletion: Impoverishment of chemicalelement abundance when compared toa standard of reference composition.D-Glucose: D enantiomer of glucose. Itplays a primeval role in living cellswhere it produces energy through bothanaerobic (fermentation) and aerobic
(associated with respiration) metabo-lism. D-glucose is also a precursor ofseveral other molecules such as osesand nucleotides.Diagenesis: Chemical and/or biochem-ical transformation of sediment after itsdeposition. This process, which gener-ally consists in cementation and com-paction, transforms a running sedimentin a compact rock.Diapirism: Gravity driven magma orrock ascent in the Earth. Generally lowdensity materials rise up into greaterdensity rocks.Diastereoisomers (or diastereomers):Stereoisomers that are not enantio-mers. Diastereisomers are characterizedby physical and chemical propertieswhich can be as different as observedfor isomers having different connectiv-ity (constitutional isomers).Diazotrophy: Capability of someorganisms to assimilate nitrogen as N2.This assimilating process is also callednitrogen biofixation.Differentiation (Chemistry): Separationof an initially homogeneous compoundinto several chemically and physicallydistinct phases.Differentiation (Earth): Separation froma homogeneous body of several compo-nents whose physical and chemicalproperties are contrasted. In the case ofEarth these components are core,mantle,crusts, hydrosphere and atmosphere.Diffuse clouds: See interstellar clouds.Dinitrogen: N2, also frequently callednitrogen.Dioxygen: O2, also frequently calledoxygen.Disk (of second generation): Diskaround a star resulting from thebreaking off of solid bodies previouslyformed like planetesimals, asteroids orcomets. The beta Pictoris disk is prob-
332
ably a secondary disk.Dismutation: Reaction that from a sin-gle reactant gives two products one ofthem being more oxidized than thereactant and the other one morereduced. A typical example is thetransformation of an aldehyde into analcohol and an acid.Dissimilative metabolism: In a cell,mechanism that uses a compound inenergy metabolism. The reductionreaction releases energy (exothermic).Dissolve inorganic carbon equilibrium:
Concentration proportions of the mainchemical forms of the dissolved inor-ganic carbon in aqueous solution:HCO3
)/CO32)/CO2. These proportions
depend on the physico-chemical con-ditions, especially the pH.Disulfide bond: Covalent bond betweentwo S atoms. When the –SH groups oftwo cysteines react on each other inpresence of an oxidant, it gives a cys-tine molecule, i.e. a cysteine dimerlinked by a –S-S- bond. Disulfidebridges stabilize the ternary and qua-ternary structures of proteins. Someirreversible denaturazing of proteinscan be associated to formation ofdisulfide bonds.DNA: Desoxyribonucleic acid, longchain polymer of desoxynucleotides.Support of the genetic code in mostliving cells. Frequently observed as adouble helix made by two complemen-tary strandsDrake (Equation of): Empirical for-mula (containing several adjustableparameters) which, following his au-thor, gives a rough estimation of thenumber of « intelligent civilizations» inthe galaxy.Dust (interstellar, cometary): Smallsolid particles (0.1 mm – 1 mm), gen-erally made of silicates, metal ions and/or carbonaceous matter.
Dysoxic: Environment (water, sedi-ment, etc.) where oxygen is in limitedamount. Synonym: dysaerobic.
E
e (astronomy): Orbital parameter thatmeasures the eccentricity of ellipticalorbit.Eccentricity: Parameter (e) characteriz-ing the shape of an orbit. e is equal to 0for a circle, equal to 1 for a parabola,higher than 1 for a hyperbola andbetween 0 and 1 for an ellipse.Ecliptic: Geometric plane of the Earthorbit. More precisely, average planar ofEarth-Moon barycentre orbit.Eclogite: High degree metamorphosedbasalt. It consists in an anhydrous rockmade up of pyroxene and garnet.Ecosystem: Community of organismsand their natural environment: Eco-system = community + biotope.Eddington: ESA project devoted toasteroseismology and search for extra-solar planets by the transits method.Kepler: similar project for exoplanetaryscience.Electrophoresis: Analytical methodused in chemistry and based on thedifference between diffusion rates ofions when placed in an electric field.Initially the ions are adsorbed on asupport or immersed into a viscousmedium. Capillary electrophoresis is atechnique adapted to the analysis ofsmall samples.Enantiomeric excess (i.e. in percents):In the case of a mixture of twoenantiomers whose respective concen-trations are D and L with D greaterthan L, i.e. = (D – L / D + L). 100Enantiomeric ratio: In the case of amixture of two enantiomers, the enan-tiomeric ratio is the ratio of the twoenantiomers.
333

Enantiomers: Two stereoisomers thatdiffer only due to their opposite chi-rality (like an idealized left hand and anidealized right hand).Enantiomorph: Two objects that differonly due to their opposite chirality (likean idealized left hand and an idealizedright hand).Enantioselectivity: A reaction leadingto products which are chiral is said tobe enantioselective if it gives an excessof one enantiomer. Enantioselectivityis generally induced by a chiral reac-tant or a chiral catalyst (like an en-zyme). Enantioselectivity is also usedto describe a reaction such that start-ing from a mixture of enantiomers;one of them reacts faster than theother. In this case, the reactant mustbe chiral.Enantiotopic (Chemistry): A planarmolecule like H-CO-CH3 can be seen asa scalene triangle with summits of dif-ferent colours. In the 2D space, such anobject is chiral and the two faces aresaid to be enantiotopic. A chiralreagent is able to differentiate enantio-topic faces.Endergonic: A chemical reaction or aphysical change is endergonic if itrequires a supply of free energy from itssurroundings to succeed.Endogenous (Biochemistry): That takesplace inside. For instance an endoge-nous organic synthesis is a synthesisthat occurs in a planetary atmosphereor at the bottom of an ocean. Antonym= exogenous.Endogenous (Geology):Word that refers topetrogenetic mechanisms taking place in-side the Earth, as well as to the rocksgenerated by such mechanisms. A mag-matic or a metamorphic rock is anendogenous rock. Antonym= exogenous.Endolithic (biology): Micro-organismsliving in rocks.
Endosymbiosis: Process by which aneukaryotic cell lives in symbiosis withan other cell (generally a prokaryoticcell) located in its cytoplasm. Chlo-roplasts and mitochondria are consid-ered as vestiges of endosymbioticprokaryotes.Endothermic: A chemical reaction or aphysical change is endothermic if itneeds a supply of energy from its sur-roundings to succeed.Enstatite: Mineral. Inosilicate (simplechain silicate). Mg-rich Pyroxene[MgSiO3].Envelope (circumstellar): In astronomy,cloud of dust particles and gas sur-rounding a new-born star (protostar).Enzyme: In biochemistry, a moleculewhich catalyses a reaction. Mostenzymes are proteins but some arepolynucleotides (ribozymes).Epitope: Region on a macromoleculethat is recognized by an antibody. It isgenerally about 5 to 12 amino acidslong, which is the size of the antigenbinding site on the antibody.Equator (celestial): Plane perpendicu-lar to the rotation axis of the Earth andcorresponding to an extension in spaceof the terrestrial equator.Escape velocity: Velocity required fora body to escape the planetary gravityfield. On Earth, the escape velocity is11 km/s.Escherichia Coli: Bacteria found in theintestine and commonly used in exper-imental bacteriology. Its size is of theorder of one micron. Its genome codes,approximately, for 3000 proteins.Ester: Molecule that can be describedas the result of condensation of an acidand an alcohol associated with elimi-nation of a water molecule. (-O-CO-) isthe ester bond.Eubacteria: Sometimes used instead ofbacteria, in order to point out the dif-
334

ference between Bacteria and Archaea.Archaeas themselves are sometimescalled Archebacterias.Eukaria: One of the three domains oflife (together with bacteria andarchaea). Eukaryotic cells are membersof the Eukaria domain.Eukaryote: Any organism from Euk-arya domain and characterized by anucleus (containing the genetic mate-rial) separated from the cytoplasm by amembrane. Eukaryotes can be unicel-lular or pluricellular.Europe: Satellite of Jupiter with adiameter of about 3100 km (same sizeas the Moon). An ocean could existbeyond its icy surface.Evaporite: Sedimentary rock generatedby evaporation of huge volumes ofwater; chemical elements dissolved inwater precipitate leading to the depo-sition of minerals such as halite (NaCl)or gypsum = (CaSO4, 2H2O).Exergonic: Chemical reaction or aphysical change is exergonic when itprovides free energy to its surroundings.EXOCAM: Special reactor used toexperimentally simulate exobiologicalprocesses.Exogenous (Biochemistry): That takesplace outside. For instance exogenousmolecules are molecules synthesised inan extraterrestrial environment andimported on Earth by (micro) meteor-ites or interplanetary dust particles.Antonym = endogenous.Exogenous (Geology): Word that refersto petrogenetic mechanisms takingplace at the surface of the Earth (inatmosphere or hydrosphere), as well asto the rocks generated by such mecha-nisms. A sedimentary rock (sandstone,limestone, etc...) is an exogenous rock.Antonym = endogenous.
Exon: Sequence of transcripted nucle-otides that is present in natural RNAand which corresponds to a DNA se-quence. In DNA, exons are separatedby introns (intervening sequences). Ex-ons and introns are respectively codingand non-coding sequences for proteins.Exoplanet: Planet orbiting around astar other than the Sun. The number ofalready discovered exoplanets is greaterthan 100. (More information on thisfast developing field is available onwww.obspm.fr/planets)Exoplanetology: Part of astrophysicsdevoted to extrasolar planets.Exosphere: The outermost region of aplanet’s atmosphere. This is the placewhere most of the photodissociationreactions of molecules take place. Fromthe exosphere, the molecules with suf-ficient velocity can escape the Earth’sgravitation.Exothermic: A chemical reaction or aphysical change is exothermic if itprovides energy to its surroundings.Explosive nucleosynthesis: Nucleosyn-thethic reactions taking place duringstar explosion. The characteristic timeof these reactions is by far shorter thanthat of the same reaction occurring in astar at rest.Extinction (interstellar, atmospheric):Decrease of the light intensity of a stardue to light diffusion or absorption bya medium (planetary atmosphere,interstellar cloud). In an interstellarcloud, visible magnitude can bereduced by a factor of 1 while thereduction can be as large as 100 in aprotostar dense nucleus.Extremophile: Micro-organism thatoptimally lives (or optimally grows) in‘‘extreme’’ physico-chemical environ-ments (P, T, Ph. . .).
335

F
Fatty acid: Carboxylic acid R-COOHwhere R is a long chain containing onlyC and H atoms.Fayalite:Mineral. Nesosilicate (isolatedSiO4 tetrahedrons). [(Fe)2SiO4]. Thismineral is the ferrous end-member ofolivine series (peridot family).Feldspar: Mineral family. Tectosilicate(3D silicate). Feldspars are subdividedinto two main chemical groups: 1)Alkali feldspars (NaAlSi3O8 = Albiteand KAlSi3O8 = Orthoclase); 2) Pla-gioclase feldspars (NaAlSi3O8 = Albiteand CaAl2Si2O8 = Anorthite). Theseminerals constitute 52% of the conti-nental and oceanic crusts.Fermentation: Biochemical process suchthat complex organic molecules (i.e.glucose) are transformed into lowmolecular mass molecules (i.e. ethanol)by cells, in anaerobic conditions. Fer-mentation corresponds to an oxidationprocess but the final electron acceptoris an organic molecule instead of oxy-gen. During fermentation as duringrespiration, ATP is produced but lessefficiently.Ferrihydrite: Iron hydroxide, 5Fe2O3
9H2O.Fisher: German chemist who was thefirst to introduce the D/L nomenclatureto differentiate enantiomers and tocharacterize their absolute configura-tions.Fisher-Tropsch (reaction of): Reactionwhich gives hydrocarbons from a mix-ture of H2 and CO. The FT reactionhad and still has a great industrialimportance but it could also have beenimportant in prebiotic chemistry. TheFT reaction requires metallic catalysts.Flint (or flintstone): see chert.Flint: Rock mainly made of amorphoussilica and having a biogenic origin. It
frequently appears as nodules in chalkor limestone.Fluid inclusion: 1 to 100 lm-sized cavi-ties in minerals that contain fluidstrapped during mineral crystallization.Fluorophore: Fluorescent molecule.This molecule absorbs light and itselectrons are excited to higher energystates; their return to lower energystates is accompanied by light emission(fluorescence).Formaldehyde or methanal: The sim-plest aldehyde (H-CO-H).Formation (geology): Group of terrainsor rocks having the same characteris-tics.Formic acid: HCOOH, methanoic acid.Formose (reaction): Starting fromformaldehyde in water solution at highpH, this reaction leads to the formationof a large variety of sugars. Its impor-tance in prebiotic chemistry remains anopen question. It is also called Butle-row reaction.Forsterite:Mineral.Nesosilicate (isolatedSiO4 tetrahedrons). [(Mg)2SiO4]. Thismineral is themagnesium end-member ofolivine series (peridot family).Fossil (geology): All kind of trace ofpassed life (bone, shell, cast, bio-mole-cule, track, footprint, etc.. . .).Fractionation (Chemistry): Separationof chemical elements or isotopes byphysical or chemical mechanisms.Frasil: Ice disks with a diameter of fewmm that are observed in water as soonas surfusion occurs. Frasil is commonin Artic and Antarctic rivers but alsobelow the huge ice platforms movingforward in the Antarctic Ocean.Free-fall time: Time required for anobject of mass m, initially at rest, toreach an object of mass M (M > m)under effect of gravitation alone. Itgives a good approximation of the timerequired for an accretion disk to col-
336
lapse during the protostar stage (typi-cally 105 years).FRET: (Fluorescence Resonance EnergyTransfer). The energy of an excitedelectron in one molecule (the donor) canbe passed on to an electron of anothermolecule in close proximity (the accep-tor) through resonance, then released asa photon. If the donor is on a target andthe acceptor on a ligand, a molecularrecognition event can be detected by thephoton emission resulting from theligand-target complex formation.Furanose: A "furanose ring" is a cyclicose formed of 4 carbons and an oxygenatom.
G
Ga: Giga annum = one billion years(= Gy)Gabbro: Plutonic magmatic rock. It hasa granular texture and mainly consistsin pyroxenes and plagioclase (±oliv-ine). Basalt is its effusive equivalent.Gaia: Ambitious project of ESA tomeasure the position of one billion ofstars with a precision of one micro arcsecond. Gaia is essentially devoted tothe search for extraterrestrial planets.Galactic ‘‘Open’’ cluster (Astronomy):Cluster that can contain from a dozento a few thousand of stars (‘‘I’’ popu-lation) and are younger than globularclusters.Garnet: Mineral. Nesosilicate (isolatedSiO4 tetrahedrons). Its general compo-sition is Y2
+++ X3++(SiO4)3 (Y =
Al, Fe+++, Cr and X = Ca, Mg,Fe++, Mn). Garnet is stable at highpressure (>70 km depth). In the man-tle, at depth, garnet is the only alu-minium-bearing phase.GC (gas chromatography): Chromato-graphic method using gas as moving
phase. It can be used in analytical andpreparative chemistry.Gene: Segment of DNA, containinghundreds to thousands nucleotides,found in a chromosome. A gene codesfor a specific protein.Genome: Ensemble of genes of anorganism.Genomic: Science that studies genomes.Genomic includes studying andsequencing of genomes as well asmethod for the analyses of mRNA(transcriptome) and proteins (prote-ome). Genomic also tries to index thegenes of an organism, to localize themon chromosomes, to determine theirsequence and to study their function-ality.Genotype: Ensemble of the geneticcharacters of an organism.Geocruiser: Asteroid with an orbit thatintersects that of Earth. Objects onsuch an orbit may eventually collidewith Earth.Geographic pole: Point where the rota-tion axis (instantaneous) of a planetintersects the globe surface.Geomorphology: Branch of the geo-sciences that studies the characteristics,the configuration and the evolution ofland forms. The methods developed onEarth to interpret the geomorphologicmechanisms (magmatism, erosion,sedimentation, etc. . .) are especiallywell adapted to the interpretation ofimages from other planets, where re-mote sensing is the only availablesource of information.Geothermal gradient: Thermal gradientcorresponding to the temperatureincrease with depth. In the Earth crustgeothermal gradient is ~30�C.km)1.Giant planets: Large size planets of lowdensity, such as Jupiter, Saturn, Ura-nus and Neptune. One can distinguishtwo groups: gaseous giants, Jupiter and
337

Saturn, mainly made up of gas (H2, He)coming from the protosolar nebula andicy giants, Uranus and Neptune, rich inice (H2O, NH3, and CH4). They allhave a core made of heavy elementsand were formed in the outer part ofthe solar nebula, beyond the ice line.Glacial-interglacial alternation: Oscilla-tory change of ice volume, mainly dueto the extension of ice caps located inhigh latitudes. The episodes of large icecap extension are called glacial, whilethose of minimum extension are calledinterglacial. These oscillations are not apermanent feature of the Earth’s cli-mate; they require specific conditions,in term of plate tectonic configuration(position of the continents), and orbitalparameters. The present-day climate isinterglacial.Glaciation: Cold period in the Earthhistory characterized by the presence ofa large cryosphere (ice). Frozen wateraccumulates and forms ice caps on thecontinents; consequently, it becomesunable to return to ocean whose leveldecreases. The main glaciationsoccurred during Precambrian, EarlyCambrian, End of the Ordovician,Carboniferous, and from the Oligoceneto the Quaternary.Glass inclusion: 1 to 100 lm-sized cav-ities in minerals that contain magmatrapped during mineral crystallization.Glass: Amorphous material. In volca-nic rocks, it can result of the rapidcooling of the magma.Global ecosystem: (=planetary ecosys-tem). The whole set of interactions be-tween the living and non-livingcompartments of a life-bearing planet,which contribute to regulate its statefar from the thermodynamic equilib-rium (where no life is possible).Globular cluster (Astronomy): Largespherical cluster containing from a few
thousands to several millions of oldstars (‘‘II’’ population)Glucide: Name for sugar molecule, alsocalled carbon hydrate, saccharide orose. In living cells, they can be energyproviders and components of nucleicacids or of wall proteins (glycopro-teins).Glucose: CH2OH(CHOH)4COH.D-glucose is the wider spread ose.Glucose is an aldohexose : the carbonylgroup belongs to the aldehyde function(aldose); it contains 6 atoms of carbon(hexose). L-Glucose is also called lev-ulose and D-Glucose is called dextrose.Glutamic acid (Glu): Alpha AA with aside chain containing an acidic COOHfunction. Described as a hydrophilicAA.Glutamine (Glu): Amino acid contain-ing 5 C atoms with a NH2 group in theside chain, it is considered as hydro-philic.Glycan: Synonymous of polysaccha-rides.Glyceraldehyde: (HO-CH2-CHOH-CHO); the simplest aldose, containingonly one chirotopic carbon atom. Thetwo enantiomers play an historical rolein stereochemistry because they are atthe origin of the D, L nomenclaturewhich describes absolute configuration(Fisher). Glyceraldehyde is the bio-chemical precursor of other oses.Glycerol: (HO-CH2-CHOH-CH2OH);1,2,3-propanetriol also called glycerine,component of many membrane phos-pholipids (which are esters of glycerol).Glycine (Gly): The simplest amino acidand the only one which is achiral.Glycolic acid: HO-CH2-COOH.Gneiss: Metamorphic rock made up ofquartz, feldspars and micas. All micacrystals show the same orientation thusdefining a surface of preferential cut-ting up called « foliation plane ».
338

Gondwana (Gondwanaland): Palaeozoicsuper-continent formed by convergenceand agglomeration of continents (Pen-insular India, Madagascar, Africa,Australia, South America and Antarc-tica) due to plate tectonic activity. Itwas mainly located in the South hemi-sphere.Gram +: Bacteria previously colouredduring a Gram test and which does notloose the colour after a treatment withethanol (« positive » response).Granite: Plutonic magmatic rock. It hasa granular texture and mainly consistsof quartz, alkali feldspar and plagio-clase feldspar; mica can be presentwhereas amphibole is rare. Rhyolite isits effusive equivalent.Granitoid: Family of quartz-bearingplutonic magmatic rocks includinggranites, granodiorites, tonalites andtrondhjemites.Granodiorite: Plutonic magmatic rock.It is similar to granite but contains nomore than 10% alkali feldspar.Green bacteria: Micro-organisms of theBacteria domain able to performanoxic photosynthesis.Greenhouse effect: Warming of a planetsurface due to the trapping by planetatmosphere of the electro-magneticwaves received and radiated by theplanet.Greenstone belts: Volcanic (basalts andkomatiites) and volcano-sedimentaryformation widespread in Archaeanterrains. It generally presents an elon-gated shape( ~100 km long and few tenskm wide). Its green colour is due tometamorphism of basalts and komati-ites.Guanine (G): Nucleic base with purinestructure.Gy: Giga year = one billion years (=Ga).
H
Habitable zone (HZ): Zone around astar where the physical conditions(temperature, presence of liquid water,etc.) on the orbiting planets are con-sidered favourable for the birth and thedevelopment of an ‘‘Earth-like’’ life.Hadean (Aeon): Period of time (Aeon)ranging from 4.55 Ga (Earth forma-tion) to 4.0 Ga (oldest known rock:Acasta gneisses). Hadean aeon belongsto Precambrian.Hadley cell: On Earth troposphericconvection cell; the air masses rise atthe level of the equator and descend atabout 30� latitude. At intermediatelatitude, this cell is relayed by Ferrelcell and by Polar cell at high latitudes.Sometimes, the term Hadley circulationis used to describe the whole system.This global tropospheric circulationresults in a redistribution of heat fromthe equator towards the poles. Theconcept remains true on Mars as onmany other planets. In the case of Marsand Earth, the planet rotation stronglyaffects the circulation. For instance, theair moving toward the equator inthe lower atmosphere is deflected by theCoriolis effect to create the easterliestrade winds in the tropics.Half-life (T): Synonym of period. For asingle radioactive decay process thehalf-life is the time needed for thenumber of radioactive atoms to de-crease to half its original value. Half-life (T) is linked to the decay constant(k) by the relation T = ln(2)/k. T unit iss.Halogen (Chemistry): Fluorine (F),Chlorine (Cl), Bromine (Br), Iodine (I),Astatine (At). Chemical elementbelonging to the (VIIA) period in theMendeleıcr periodic table.
339
Halophile: Micro-organism that livesoptimally (or can only grow) in envi-ronments with high salt concentration(1M NaCl).Hamiltonian (operator): Mathematicalentity describing the motion of a classicor quantic particle. In quantummechanics, this mathematical entityallows one to write the wave equationfor a stationary state whose solutionsgive the probability density of one orseveral electrons in any point in space.Hapten: Can be considered as an iso-lated epitope. By definition a hapten isa small molecule (few 100’s Da), notantigenic by itself: alone hapten cannotinduce immune response; it stimulatesproduction of antibodies only in com-bination with a specific protein calledcarrier or schlepper.Harzburgite: Peridotite made up ofolivine and orthopyroxene. It generallycorresponds to residual mantle afterlherzolite melting and extraction ofbasaltic magma.HD 209458b: First exoplanet, whoseprevious detection by radial velocime-try method has been confirmed by theobservation of a transit in front of itsparent star (HD 209458).Heavy element (astronomy): Any ele-ment other than hydrogen and helium.Helium: Rare gas whose 3He isotope isused in geology as marker of a recentdegassing process from the deep mantle.Hertzsprung-Russel diagram (HR dia-gram): In astronomy, a two-dimen-sional diagram with star temperature(or spectral type) as abscissa and starluminosity (or absolute magnitude) ascoordinate. Temperatures decreasefrom left to right and the spectral typessequence is OBAFGKM.Heterocycle: Cyclic organic moleculecontaining heteroatoms (i.e. atoms
other than C.) as constituents of thecyclic structure.Heterosphere: Part of an atmospherelocated above the homopause andwhere each gas density distributiondecreases according to its own scaleheight.Heterotrophous: Organism which usesreduced organic molecules as principalcarbon source for its biosynthesis.Nowadays, these reduced organic mol-ecules are generally produced by otherorganisms. At the beginning of life,these reduced molecules were probablyfound in the environment.Histidine (His): Proteinic amino acidcontaining an imidazole group in itsside chain. Histidine residues (hystidyl)are frequently found in active site ofenzymes.HMT: (C6H12N4); hexamethylenetet-ramine, could be a minor component ofcomet nucleus.Homeostasis (Biology): In livingorganisms homeostasis is the regulationof a physical or of a chemical factor,which attempts to actively keep thesefactors at equilibrium, even in case ofexternal environmental change (i.e.thermal regulation). This involves afeedback mechanism.Homeostasis: Property of a livingorganism to maintain unchanged someof its physico-chemical characteristicseven in presence of a change in theenvironment. Homeostasis requiresautoregulation.Homoacetogens:Microorganisms of theBacteria domain producing acetatefrom H2 and CO2.Homochirality:Of the same chirality.Allproteinic amino acids are L while ribosein RNA or ATP is always D. The originof homochirality for the large majorityof the chiral constituents of organisms
340

remains an active research subject.Homogenization temperature: Temper-ature at which a fluid inclusion trans-forms from a multi-phase(heteregeneous, for instance gaz +seawater) to a one-phase (homoge-neous) state. This temperature is con-sidered as the minimal temperature offormation of the fluid inclusion.Homology (biology): Two structures intwo different species are homologous(and therefore comparable) irrespectiveof their forms, if they are connected inthe same way to identical structures.Homolysis: Homolytic cleavage orhomolytic fission. Breaking of a bondsuch that each molecule fragmentretains the same amount of bindingelectrons; consequently, no electriccharge is created due to the cleavage.Homolytic (rupture): Rupture of achemical bond in which the bondingelectrons are equally partitionedbetween the two fragments; no chargeappears during this process.Homopause: Atmospheric boundarybetween the homosphere and the het-erosphere.Homosphere: Part of an atmospherewhere the gases are uniformly mixed.Their densities decrease as the altitudeincreases following a single mean scaleheight, defined by the mean molecularweight and the temperature.Hornblende: Mineral. Inosilicate(double chain silicate). [Na0-1Ca2(Feþþ,Mg)3-5 (Al, Feþþþ)0-2 Si8-6Al0-2O22 (OH,F)2]. It belongs to theamphibole group.Hot Jupiter: Jupiter massive-like exo-planet, orbiting close to a star. Most ofthe extrasolar planets so far discoveredbelong to this type.Hot spot: see mantle plume.HPLC (High Performance LiquidChromatography): Very efficient liquid
phase chromatography performedunder high pressure up to 100-400 bars.Hydrocarbons: Molecules containingonly C and H atoms. If the hydrocar-bon contains an aromatic system, it issaid aromatic. If the hydrocarboncontains only tetra-coordinated Catoms, the hydrocarbon is called ali-phatic. Some hydrocarbons result fromthe polymerization of isoprene (2-methylbutene); they are called isoprenoıdhydrocarbons. Latex contains isoprenoıdhydrocarbons.Hydrogen bond: Intermolecular butsometimes intramolecular low energybond (about 20 kJ/mol) involving gen-erally an H atom linked to an electro-negative atom like O, N, S and an atombearing non-bonding electron pairssuch as O or N. The H-bond implies anH-donor and an H-acceptor.Hydrogen cyanide: H-CN.Hydrogen sulphide: (H2S)Hydrogenoid (function): Exact elec-tronic wave function describing themotion of the electron in an atom witha single electron.Hydrolysis: Cleavage of a molecule dueto reaction with H2O.Hydrosphere: The whole water avail-able on Earth surface; it includes,oceans, seas, lakes rivers, undergroundwaters and atmospheric water vapour.Hydrothermal vent: see black smoker.Hydroxy acid: Carboxylic acid con-taining also an alcohol function. Gly-colic acid is the simplest hydroxy acid.Hydroxyl (group): -OH or alcoholgroupHyperthermophile: Micro-organismthat lives optimally (or can only grow)in high temperature environments (>80�C).Hypoxanthine (6-hydroxypurine): Pur-ine base and biological precursor ofadenine and guanine.
341

I
Ice shelves: Ice platforms generated byglaciers whose ice progresses fromAntarctica land over ocean. Ross shelfis about 1000km wide and extents over600km in ocean. They are the source ofvery large tabular icebergs.Ices (astronomy): Solid form (crystal-line or amorphous) of volatile mole-cules like water, carbon dioxide orammonia.IDP: Interplanetary Dust particle.Igneous rocks: Magmatic rocks = dueto magma crystallization.Immunoaffinity chromatography: (IAC)All chromatographic methods based ona stationary phase that contains anti-bodies or fragments of antibodies.Immunogenic: Substance able to inducean immune response.Impact melt rock: Rock associated withimpact craters (=impactite). It resem-bles a lava and consists of a mixture ofsolid or molten fragments from thelocal lithologies floating in a glassymicrocrystalline or recrystallizedmatrix. It is generated by cooling of themagma produced by the melting of thetarget lithologies under the hightemperatures and pressures induced bythe collision.Impactite: Heterogeneous breccia gen-erated at depth by the impact of alarge-size stellar body (>10,000 tons).It is made up of fragments of the rocksubstrate included in a vitreous matrix.Impactite: Lithologies generated duringmeteorite impact. Melt-rock, suevitesand breccias found inside or at closeproximity of an impact crater are calledimpactites.Inclination (1) (astronomy): Anglebetween the orbital plane of a solarobject and the ecliptic plane in degrees(always lower than 90�).
Inclination (2) (astronomy): Anglebetween the orbital plane of an inter-stellar object and the ‘‘sky plane’’(plane perpendicular to the ‘‘line ofsight’’ i.e. the straight line joining theobserver and the stellar object).Indels: Acronym for insertions / dele-tions. Phylogenetic analysis on severalDNA or protein sequences requiressequences with same length. During theprocess of alignment, alignment gaps(indels) must be introduced insequences that have undergone dele-tions or insertions.Interferometry: Observation and astro-physical measurement technique basedon the use of several disconnectedtelescopes spread over an area, andallowing reaching the angular resolu-tion a single-dish telescope with thesame area would give. This techniquecan be implemented different ways:visibility measurement, direct imagingby aperture synthesis, differential phasemeasurement, nulling interferometry. . .Interplanetary dust: Small grains leftbehind by asteroids and comets, anddispersed in a cloud including thewhole Solar system.Interstellar cloud: Cloud of gas (98 %)and dust (2 %). The gas is mainly H(diffuse cloud) or H2 (molecular cloud).Molecular clouds are called dense clouds(n(H2)>103 molecules.cm-3) or darkclouds if dense and cold (10-20 K).Intertidal environment: Environmentbetween high and low tide. Also calledtide range.Intron: Non-coding sequence of nucle-otides that separates exons. Introns areremoved during the maturation pro-cesses of the three types of RNA bysplicing.Ion-molecule (reaction): Kind of reac-tion between two gaseous reactants andinitiated by ionizing cosmic rays,
342

X-rays or UV radiation. They areimportant in interstellar clouds and inplanetary ionospheres.IR: Infrared. Wavelength rangingbetween 1 and 300 lm.Iridium (Ir): Element belonging toplatinum element family. Its concen-tration in Earth crust is extremely low.A local Ir enrichment as at the Creta-ceous-Tertiary (K/T) boundary isinterpreted as a strong argument infavour of meteoritic impact.ISM: Interstellar medium.Isochron (geology): Rectangular dia-gram plotting isotopic ratio of a disin-tegration system (abscissa = parentalisotope; ordinate = daughter isotope)(e.g. 87Sr/86Sr versus 87Rb/86Sr). In thisdiagram, cogenetic rocks of the sameage plot along a straight line whoseslope is proportional to age. Thismethod of age determination is widelyused in geology.Isocyanhydric acid: H-N=C.Isocyanic acid: HN=C=O.Isoleucine (Ile): Proteinic amino acidcontaining six carbon atoms anddescribed as hydrophobic. Ile is con-sidered as one of the prebiotic AA.Isoprenoid hydrocarbon: Hydrocarbonformed by polymerization of isopreneCH2=C(CH3)-CH=CH2.Isostasy (Geology): Hydrostatic equi-librium in the Earth’s crust such thatthe forces tending to elevate landmassesbalance the forces tending to depressthem. When this equilibrium is broken,the return to equilibrium takes place byvertical movements of the crust. Forinstance, in Scandinavia during the lastice age the weight of the ice capspushed the continental crust into themantle. As the ice melted, the loaddecreased and the lithosphere bouncedback towards equilibrium level, (this
process is still going on at a rate ofabout 1m per century).Isotopic ratio: Concentration ratio oftwo isotopes or concentration ratio oftwo isotopomers of amolecule (likeH2Oand D2O). Isotopic ratio can provideinformation on the age of a sample(when used in isochron calculation) aswell as on its origin and source.Isovaline (Iva): Hydrophobic non-pro-teinic amino acid, isomer of valine andcontaining five carbon atoms.Isovaline: Hydrophobic non proteina-ceous amino acid. This constitutionalisomer of valine contains five C atoms.Isua: Region of Greenland where areexposed the oldest sediments so farrecognized 3.865 Ga (gneiss). Theycontain carbon whose origin could bebiogenic. (See also Akilia)
J
Jeans escape: Process leading to theescape of atomic or molecular speciesfrom a planet atmosphere. It happenswhen the thermal agitation rate isgreater than escape rate. The lighterelements or molecules (like H, H2 orHe) escape faster than the heavier ones.Jovian planets: Other name for giantplanets.Jupiter: The fifth and largest planet(1400 times the Earth volume, 320times the Earth mass) of the Solarsystem. Jupiter is 5.2 AU away fromthe Sun. Its gaseous envelope mainlymade of H2 and He, surrounds a coreof ice and rocks (10–20 Earth mass).Juvenile gases: Gases produced by ortrapped inside the Earth and whichreach the surface of Earth for the firsttime. 3He is an example of juvenile gasdetected in sub-marines geothermalfluids.
343
K
K/T (Strata): Few centimetre-thicksedimentary layer located at the Cre-taceous Cainozoic boundary. Its Irid-ium-enrichment is interpreted as due toa giant meteoritic impact.Kepler: Spacecraft NASA missiondevoted to detection of Earth-typeexoplanets (equipped with a 1m tele-scope).Keplerian rotation: Orbital motion thatfollows Kepler’s laws.Kerogen: Insoluble organic matterfound in terrestrial sediments and insome types of meteorites like carbona-ceous chondrites.Kilo base or kilo base pair (kb): Unitused to measure the number ofnucleotides in a gene or a genome: 1000base pairs of DNA or 1000 bases ofRNA.Komatiite: Ultramafic high-Mg lava. Itcontains olivine and pyroxene; mineralswhich sometimes can have needle ordendritic shapes (spinifex texture).Komatiites were abundant before 2.5Ga and extremely rare after.Kuiper Belt or Edgeworth-Kuiper: Alarge ring-shaped reservoir of cometsbeyond Neptune at about 30 astro-nomical units (AU) from the Sun.
L
L/D (Ratio): For a chiral molecule, theratio between the L and the D enan-tiomer concentrations.Lactic acid: HO-CH(CH3)-COOH.Lagrange points: The five points deter-mining the equilibrium position of abody of negligible mass in the plane ofrevolution of two bodies (ex: star-pla-net couple) in orbit around their com-mon gravity centre.
Late Heavy Bombardment: Heavybombardment of the Moon (and cer-tainly also of the Earth and others tel-luric planets) which happened between4 and 3.8 Ga ago. It could correspondto either the end of a long period ofbombardment by asteroids, meteoritesand comets or to a short time cata-clysmic phenomenon.Laurasia: Palaeozoic super-continentformed by convergence and agglomer-ation of continents (Europe, NorthAmerica and Asia) due to plate tectonicactivity. It was mainly located in theNorth hemisphere. Continent resultingof Pangaea broke in two parts at theend of Palaeozoic.Lava: Magma emplaced as a flow at thesurface of the Earth or any other pla-net.Leaching: Dragging of soluble elementsor particles of a soil by infiltratedwater.Leucine (Leu): Proteinic amino acidcontaining six C atoms and consideredas one of the prebiotic AA.Lherzolite: Peridotite made up of oliv-ine and pyroxenes (ortho- and clino-pyroxenes) as well as of an Al-bearingmineral. Its melting generates basalticmagmas leaving a harzburgite residue.Ligand: Any atom or group of atomsbonded to the atom we are interestedin. As an example, the four ligands of achirotopic (asymmetric) carbon atomare necessarily different.Ligase: Class of enzymes that catalysesthe binding between two molecules (ortwo DNA fragments).Light-year: Measure of distance used inastronomy, it corresponds to the dis-tance that light runs in one year (0.9461016 m).Liquidus: Line which, in compositionvs. temperature or pressure vs. tem-perature diagrams, separates the
344
domain where crystals and liquidcoexist from the field where only liquidexists.Lithophile (Geochemistry): Chemicalelement frequently associated withoxygen. A lithophile element has agreater free energy of oxidation pergram of oxygen than iron; it occurs asan oxide generally in silicate minerals(i.e. Si, Al, Na, K, Ca, etc. . . (Syno-nym = oxyphile).Lithosphere: External rigid shell of theEarth. Its definition is based on rheo-logical behaviour of rocks. It includescrusts (continental and oceanic) as wellas the upper rigid part of the mantle itsthickness varies between 0 and 250 kmand more or less corresponds to the800�C isotherm.Lithotroph: See chemolithotroph. Liv-ing organism that takes its energy fromthe oxidation of inorganic moleculessuch as NH3, H2S, Fe
++.Low mass star: Star with mass <2Msun.Lsun. (Astronomy): Sun luminosity(3.826 1024 W).LUCA: Last Universal CommonAncestor. Hypothetical microorganismthat stood at the root of all lines lead-ing to the present day living beings.Appeared after a long evolution, itcannot be considered as a primitiveform of live.Lysine (Lys): Proteinic amino acidcontaining six C atoms with an aminogroup in its side chain and which,therefore, is basic and hydrophilic.Lysyl residues are frequently found inthe active site of enzymes.
M
Ma: Mega annum = Mega year = onemillion years (=My)
Macronutrient: Chemical element nec-essary in large amounts for the propergrowth and metabolism of a livingorganism (i.e. C, O, H, N, P, K, S, Ca,Mg. . .). In seawater, the main ma-cronutrients are water, CO2 nitrates andphosphates (sources for H, O, C, N andP respectively). See also micronutrient.Mag: Magnitude.Magma: Molten rock which can becompletely liquid or consist in a mix-ture of liquid and crystals. It is pro-duced by high temperature (>650�Cfor granite; > 1200�C for basalt)melting of pre-existing rocks. Mantlemelting generates basalts whereas oce-anic crust fusion rather generatesadakites or TTG and continental crustgives rise to granites.Magnesiowurstite: Mineral, Oxide.[(Mg,Fe)O]. Magnesiowurstite togetherwith perovskite is probably the maincomponent of the lower terrestrialmantle (depth>660 km).Magnetic anomaly: Difference betweenthe measured and the theoretical valueof the magnetic field intensity of Earth.Magnetic pole: Point where the mag-netic dipole axis of a planet intersectsthe globe surface.Magnetite: Mineral: Iron oxide[FeþþFeþþþ
2O4]. Its ferromagneticproperties make it able to record pastEarth magnetic field characteristics. Itcan also exist in some bacteria called‘‘magneto-tactic’’.Magnitude (Mag) (Astronomy): Mea-sure of brightness of a stellar object ona logarithmic scale. The difference be-tween two successive magnitudes is afactor 2.512. Mag = – 2.5 log10 (I/I0));Less bright is a star, more is its mag-nitude. The magnitude is calculated ona chosen spectral interval (visible, IR)or on the total spectrum (bolometricmagnitude).
345

Major half-axis: For an elliptic orbit,half of the distance aphelia-perihelia.Mantle plume: Ascending column ofhot mantle assumed to be generatednear the mantle-core boundary or atthe upper-lower mantle boundary, (=hot spot). Near surface, this columncan melt giving rise to oceanic islandmagmatism (i.e. Hawaii; La Reunion,etc.)Mars Express: ESA space mission to-wards Mars.Mantle: In a planet, mantle is the shellcomprised between crust and core. OnEarth it represents 82% of the volumeand 2/3 of the mass, it is divided intoupper mantle (until 700~km depth) andlower mantle (until 2900 km depth).Mass loss rate (astronomy): Mass ejec-ted per time unit by a star during itsformation. Ejection takes place throughstellar winds and bipolar jets (typically10-5 to 10-8 solar mass per year).Massive star: Star with mass >2 Msun.Matrix (Chemistry): Parent moleculethat allows the pre-positioning of iso-lated elements thus making possibletheir polymerisation.Maturation (Genetics): Transforma-tion step of mRNAs leading to theirfunctional form. It occurs by splicing‘‘Introns sequences’’.Megaton: Unit of energy equivalent tothe energy released by 109 kg of TNT(trinitrotoluene). Corresponds to 4.21015 J.Mercaptans: Other name of thiols: sul-phur analogues of alcohols.Mesopause: Atmospheric boundarybetween mesosphere and thermosphere.Mesophase: Matter state exhibitingcharacteristics of two phases. Liquidcrystals have the fluidity of liquids butare characterized by an order at shortrange similar to what is observed incrystals.
Mesosphere: Atmospheric layer locatedabove the stratosphere and below thethermosphere, between 45–50 km and80km (in the case of the Earth) or, if thestratosphere is absent, directly abovethe tropopause (as in the case of Marsand Venus).Mesotartric acid: HOOC-CHOH-CHOH-COOH, alpha-beta-di-hydroxysuccinic acid, molecule con-taining two asymmetric carbon ofopposite chirality. This molecule isachiral by internal compensation.Mesozoic (Era): Period of time (Era)ranging from 250 Ma to 65 Ma, it isalso called Secondary Era.Metabolism: All the reactions takingplace in a cell or in an organism.Metabolism is divided into two sub-classes: anabolism and catabolism. Thevery large majority of metabolic reac-tions are catalyzed by proteinicenzymes.Metallicity: In a star, a galaxy or a gascloud, the metallicity is the proportionof heavy elements (heavier thanhelium).Metamorphism: Solid state transfor-mation of a rock due to change inpressure and/or temperature condi-tions. New mineral assemblage, stablein new P-T conditions will appear. Newminerals crystallise perpendicular tooriented pressure thus defining a newplanar structure called foliation. Mostoften metamorphism corresponds todehydration of the rock.Metasediments: Sediments transformedby metamorphism.Metasomatism: Change in rock com-position due to fluid circulation. Forinstance, in a subduction zone, the flu-ids (mainly water) released by dehy-dration of the subducted slab, up-risethrough the mantle wedge. These fluidswhich also contain dissolved elements,
346

not only rehydrate the mantle perido-tite, but also modify its composition.Meteor Crater: Impact crater in Ari-zona. It is about 1.2 km in diameterand 170m deep. The impact which tookplace 50 000 years ago was due to aniron meteorite of about 25 m in diam-eter. Impacts of this kind generally oc-cur every 25,000 year.Meteorite: Extraterrestrial object, frag-ment of an asteroid, of a planet (likeMars) or of the Moon that falls on theEarth surface.Methanogen: Archeobacteria produc-ing methane CH4 from CO2 and H2.Some methanogens are hyperthermo-philic.Methanogen: Methane-producingmicroorganism of the Archaea domain.Methionine (Met): Proteinic aminoacid containing five carbon atoms witha –SCH3 group in its side chain.Methylalanine: Synonymous of alphaaminoisobutyric acid (alpha-AIB).MGS (Mars Global Surveyor): Ameri-can probe that have carried out acomplete cartography of Mars (fromSeptember 1997).MHD: Magnetohydrodynamic.Mica: Mineral family. Phyllosilicate(water-bearing sheet silicate): biotite =black mica [K(Fe,Mg)3Si3AlO10 (OH)2];muscovite = white mica [KAl2Si3AlO10
(OH)2]Microarray: Microarrays are small,solid supports on which thousands ofdifferent substances (antibodies- pro-teins- DNA) can be implanted in spe-cific locations. The supports are usuallyglass microscope slides, but can also besilicon chips or nylon membranes. Thesubstance is printed, spotted, or actu-ally synthesized directly onto the sup-port. Microarrays are used to test large
number of targets quickly or when theonly small quantities of the sample tobe studied are available.Micrometeorite: Very small meteorite(<1 mm). The 50-400lm fraction is themost abundant found on Earth.Micrometeorites constitute more than99% of the extraterrestrial materialable to reach the Earth surface (majorimpacts excepted)Micronutrient: Chemical elementrequired in small amounts for theproper growth and metabolism of aliving organism (i.e. B, Cu, Co, Fe, Mn,Mo, Zn…). See also macronutrient.Microorganism: Organism invisiblewithout a microscope. Includes prok-aryotes and unicellular eukaryotes (i.e.yeasts).Microspheres: Spherical clusters oforganic molecules found in Precambrianrocks or produced in laboratory fromamino acids polymers (proteinoids). To-day, the Fox proteinoids microspheres arenot still considered as plausible models ofprimitive cells.Microsporidia: Parasitic unicellulareukaryotes that have been shown to behighly derived fungi from the fungi.Microsporidia were thought for sometime to be primitive.Migmatite: High-temperature meta-morphic rock affected by partial melt-ing.Milankovitch (theory of): Theory con-necting the Earth climate variations toastronomic variations such as changesof Earth’s orbit or obliquity with time.Miller-Urey (experiment of): One ofthe first experimental simulations ofwhat was considered as atmosphericprebiotic chemistry (1953). Synthesis ofa large variety of organic moleculesincluding few amino acids from a very
347
simple mixture containing reducedsmall molecules (H2, CH4, NH3 andH2O) submitted to an electric dis-charge.Mineral: Solid material defined by bothits chemical composition and crystal-line structure.Minimal protosolar nebula: Minimalmass of gas, necessary for the forma-tion of the solar system planets (=mass of all planets + H + He » 0.04solar mass).Minor planet: Asteroid or planetoid.Mitochondria: Organelles in the cyto-plasm of all eukaryotic cells where ATPsynthesis takes place during aerobicrespiration. Mitochondria have theirown DNA and could have an endo-symbiotic origin.Mitosis: Nucleus division, cell divisionstep including cytokinesis.MM: Micrometeorites.Moho (Mohorovicic): Discontinuity inseismic waves that marks the crust-mantle boundary.Mole: SI unit for amount of substance;it is defined as the number of atoms inexactly 0.012 kg of carbon-12 (1mole ofatoms = 6.02 · 1023 atoms; 1 mole ofmolecules = 6.02 · 1023 molecules).Molecular beacon: Molecular beaconsare single-stranded oligonucleotidehybridization probes that form a stem-and-loop structure. The loop contains aprobe sequence that is complementaryto a target sequence, and the stem isformed by the annealing of comple-mentary arm sequences that are locatedon either side of the probe sequence. Afluorophore is covalently linked to theend of one arm and a quencher iscovalently linked to the end of theother arm. Molecular beacons do notfluoresce when they are free in solution.However, when they hybridize to anucleic acid strand containing a target
sequence they undergo a conforma-tional change that enables them tofluoresce brightly.Molecular clouds: See interstellarclouds.Molecular flow: see bipolar flow.Molecular recognition: Chemical termreferring to processes in which a spe-cific molecule (ligand) adhere in ahighly specific way to another molecule(target), forming a large structure.Monophyly: Term that describes a tax-onomic group sharing a single ancestorand all its descendants (i.e. the mam-mals).Monosaccharides: See oses.Montmorillonite: Mineral. Phyllosili-cate (water-bearing sheet silicate). Claymineral belonging to the smectitegroup.MORB (Mid Ocean Ridge Basalt):Basalt generated in mid oceanic ridgesystems where oceanic crust is created.Most of ocean floor has a MORBcomposition.m-RNA: Messenger RNA. Obtained bytranscription of a DNA segment andable to orient the synthesis of a specificprotein in the ribosome.MS (Mass Spectrometry): Analyticalmethod involving a preliminary ioni-zation of atoms or ionization andfragmentation of molecules followed bymeasures of atomic or molecular mas-ses. These measures can be carried outfrom precise study of ions trajectoriesor time of flight in an electric and/ormagnetic field.MSR (Mars Sample Return): NASA-CNES space mission project for thereturn of Martian soil samples (~1 kg)extracted by automatic probes. Launchexpected between 2009 and 2014, andsamples return three to five years later.Murchison: Carbonaceous chondrite(CM) felt in Australia in 1969. Frag-
348

ments recovered immediately after thefall were (and still are) subjected tomany analyses, mainly chemical. Morethan 500 organic compounds wereidentified, including amino acids andnucleic bases.Muscovite: Mineral. Phyllosilicate (wa-ter-bearing sheet silicate). [KAl2Si3A-lO10 (OH)2]. It belongs to the micagroup and is also called white mica.Mutation: Any change of the geneticmaterial, transmitted to the descen-dants.My:Mega year = one million years (=Ma)Mycoplasma: The simplest and thesmallest known microorganisms, theylive as parasites in animal or vegetalcells. They long be considered as pos-sible analogues of the first cells; nowconsidered as Gram+ bacteria whichlack their rigid cell wall and evolved byreduction.
N
Nanobacteria: Hypothetical bacteria,whose size could be around few nano-metres, smaller than any known bacte-ria. Their existence is very muchdebated.N-carbamoyl-amino acids: A moleculeshowing many similarities with amino-acids except that one of the H atoms ofthe amino group is substituted by thecarbamoyl polyatomic group (-CO-NH2). N-carbamoyl-amino acids couldhave been prebiotic precursors of someamino acids.Neutral (mutations) (Genetic): Termcoming from the neutral theory ofmolecular evolution proposed byKimura. A neutral mutation is amutation leading to sequences selec-tively and functionally equivalent. They
are said neutral in regards of evolution.Neutron star: Remnant of a dead starwith an initial mass greater than~8MSun. When electron degeneratedpressure becomes too low; electronspenetrate into nucleus and are trans-formed into neutron by reacting withprotons (neutralisation). Then they de-velop a neutron degenerated pressure.NGST (Next Generation Space Tele-scope): NASA project of space tele-scope (4m), it must succeed to the HST(Hubble Space Telescope).Nitrification: Microbial oxidation, auto-trophic or heterotrophic, of ammoniumto nitrateNitrile: R-CN where the CN group isthe cyano group (cyano as prefix butnitrile as suffix).Non reducing atmosphere: Atmosphereof CO2, N2, H2O where hydrogen isabsent or in low quantity, either in theform of free H2 or hydrogen-containingcompounds, such as methane orammonia. Also named oxidized orneutral atmosphere according to itscomposition.Non-sense (codon): When a codon(triplet of nucleotides) does not specifyan amino acid but corresponds to atermination codon (Term.). In the« universal code », these codons areUAA, UAG and UGA.Normative (rock composition): Rockmineralogical composition recalculatedfrom its chemical composition.Nuclear pores: Complex structures,highly specialized, embedded in thenuclear membrane. They allow thetransfer of macromolecule betweennucleoplasm and cytoplasm.Nucleation (Astronomy): Mechanism offormation of solid bodies by accretionof planetesimals.Nucleic acid: Long chain polymericmolecule obtained by condensation of
349

nucleotides. DNA and RNAs are nu-cleic acids.Nucleic base: Linked to ribose or des-oxyribose by a hemi-acetal bond, it givesnucleosides. Nucleic bases are purinebases or pyrimidine bases. Nucleosidestogether with a phosphate group are thesub-units of nucleotides. By condensa-tion, nucleotides give the polynucleo-tides (including DNA and all RNAs).Nucleides: Constituents of atomnucleus, i.e. protons and neutrons.Nucleon: Common name for proton orneutron.Nucleoplasm: Protoplasm within thenucleus of eukaryotes.Nucleotide: Molecule made by conden-sation of a base (purine or pyrimidine),an ose and a phosphate group linked tothe ose. Nucleotides are ribonucleotideswhen the ose is ribose or deoxyribo-nucleotide when the ose is deoxyribose.DNA is a polydeoxyribonucleotidewhile RNAs are polyribonucleotides.The symbol of a nucleotide is deter-mined by the base (A for adenine, C forcytosine, G for guanine, T for thymine,U for uracil).Nucleus (Biology): Eukaryote cell sub-structure that contains the chromo-somes.
O
Obduction: Mechanism leading to thethrusting of oceanic lithosphere ontocontinental crust.Obliquity: Angle between the eclipticand the celestial equator, actually, 23.3degrees for theEarth. This angle is>90�if the planet has a retrograde rotation.Ocean resurgence: See upwelling.Oceanic rift: Central depression in amid ocean ridge, this is the place whereoceanic plates are created.
Oligomer: Small polymer, generallycontaining less than 25 monomericunitsOligomerization: Polymerization involv-ing a small number of monomers.Oligopeptides: Small polypeptide (lessthan 25 AA residues even if the defini-tion is not so strict).Olivine: Mineral. Nesosilicate (isolatedSiO4 tetrahedrons). [(Fe, Mg)2SiO4].This mineral which belongs to the per-idot family, is silica-poor is one of themain components of the terrestrial up-per mantle. It is also common inmeteorites.OMZ: See Oxygen Minimum Zone.Oort cloud: Huge spherical collection ofcomets, orbiting the Sun between 10000 and 100000 AU.Ophiolite: Part of oceanic lithospheretectonically emplaced (obducted) on acontinental margin.Optical activity: Orientation change ofthe linearly polarized plane of light afterits passage through a chiral medium.Optical rotatory dispersion: Change ofthe optical power of a chiral mediumwith the wavelength of the linearlypolarized light.Orbital Migration: Change, in course oftime, of a planet-star distance; thishypothesis is proposed in order toexplain the presence of massive planetsclose to their star.Organic molecule: Until the beginningof the 19th century, organic moleculeswere molecules extracted from plantsor animals. Today, any molecule con-taining carbon atoms is called organic.Carbonates, CO and CO2 are border-line cases. Organic molecules generallycontain C atoms with an oxidationnumber lower than 4.Organometallic molecule: Moleculecontaining one or more metal atoms.
350

Organometallic: Organic moleculecontaining one or more metallic atomsbonded by covalent bonds or by coor-dination to the organic moiety of themolecules. Metallic salts of organicacids are not considered as organome-tallic compounds.Orgueil: Large CI carbonaceous chon-drite (very primitive), without chon-dres, which felt in France in1864, nearMontauban.Ornithine: NH2-CH)-COOH-(CH2)3-NH2. Non proteinic amino acid, pre-cursor of arginine.Orogenesis: Mountain chain genesis.Orographic: Related to relief. Inweather science, the presence of a reliefcan induce changes in atmospheric cir-culation resulting in weather changes(i.e. orographic rainfalls).Orthose: Mineral. Tectosilicate (3Dsilicates). Alkali feldspar KAlSi3O8.Oses (or saccharides): Large group ofmolecules of primeval importance inthe living world. Some of them aremonomers like glucose (C6(H2O)6) orribose (C5(H2O)5). Some of them aredimers like lactose or saccharose; someof them are polymers (polysaccharides)like starch or cellulose.Outer membrane: membrane surround-ing the plasma membrane in Gramnegative bacteria (i.e. Escherichia coli).Oxidative phosphorylation: In livingcells,biochemical process that results in ATPsynthesis; energy is provided by protonstransfer across the cell membrane.Oxygen minimum zone (OMZ): Part ofthe water column where the oxygenconsumption due to respiration exceedsits supply by lateral circulation, givingrise to dysoxic or anaerobic conditions.The OMZ areas occur generally wherethe intermediate or deep circulation is
weak, and/or when biological produc-tivity at the surface is high.Oxyphile: See lithophile.
P
P4: Certification for laboratoriesaccredited to analyze high-risk infec-tious agents. Such laboratories must beprotected against any risk of contami-nation by viruses and microorganisms,from inside to outside and from outsideto inside. These two conditions mustabsolutely be realised for extraterres-trial sample analyses.PAH (Polycyclic Aromatic Hydrocar-bons): Organic molecules like naph-thalene or anthracene containingseveral fused aromatic rings.Paleomagnetic scale: Relative strati-graphic scale based on the successiveinversions of the Earth magnetic fieldthrough timePaleo-soil: Fossil soil. These formationsare able to have recorded O2 and CO2
concentration of the primitive terres-trial atmosphere.Paleozoic (Era): Period of time (Era)ranging from 540 Ma to 250 Ma, it isalso called Primary Era.Pangaea: Super-continent that existedat the end of Palaeozoic era (– 225 Ma)and which later broke in two parts:Laurasia (N) and Gondwana (S).Paralogous: Paralogous genes originatein gene duplication events, in contrastto the standard orthologous genes,which originate via speciation events.Parent body: Asteroid or planet fromwhich an object has been extracted,such as for example a meteorite.Parent molecule (in comet): Moleculepresent in the comet nucleus.
351
Parity (violation of): Characterizes anyphysical property that changes whenspace is inverted or, in other words,which is not the same in the mirrorworld. Parity violation is observed inseveral phenomena related to the weakintranuclear interactions like the betaradioactivity. Parity violation is at theorigin of the very small energy differ-ence between enantiomers (PEVD forParity Violation Energy Difference).Parsec (secpar): Unit of astronomicallength of 3·1018 cm (about 200,000 AUor 3.26 light-years); it is based on thedistance from Earth at which stellarparallax is 1 second of arc. Averagedistance between stars in the Sunvicinity is around 1 parsec.Pathfinder: American probe that landedon Mars on July 4th, 1997, formallynamed the Mars Environmental Survey(MESUR). It contained a rover ‘‘So-journer’’ that explored Ares Vallisduring several months. For instance, an‘‘Alpha Proton X-ray Spectrometer’’was used to analyse soil and rocksamples in order to determine theirmineralogy.PCR (Polymerase Chain Reaction):Experimental method which, by suc-cessive molecular duplications, leads toa dramatic increase of a small initialamount of DNA. This result isobtained with an enzyme called DNA-polymerase isolated from thermophilebacteria.Peptide: Polymer obtained by conden-sation of amino acids. In a peptide (orpolypeptide), the number of AA resi-dues is generally lower than 60. With ahigher number of residues, the polymergenerally adopts a well defined confor-mation and is called a protein.Peridot: Mineral family, olivine is aperidot.
Peridotite: Rock made up of olivineand pyroxenes (ortho- and clino-py-roxenes) as well as of an Al-bearingmineral (spinel at low pressure andgarnet at high pressure. Earth mantle ismade up of peridotite.Perihelia: In the case of an object inelliptical motion around a star, thepoint which corresponds to the shortestdistance with respect to the star.Permafost: In arctic regions, perma-nently frozen soil or subsoil.Perovskite: Mineral. [(Mg,Fe)SiO3].Perovskite together with magne-siowurstite is probably the main com-ponent of the lower terrestrial mantle(depth > 660 km).Petrogenesis: Mechanism(s) of forma-tion of rocks.PGE or platinum group elements: Tran-sition metal belonging to the Platinumgroup: Ruthenium (Ru), Rhodium(Rh), Palladium (Pd), Osmium (Os),Iridium (Ir) and Platinum (Pt). Theypossess similar chemical properties(siderophile). In Earth’s crust theirabundance is very low, whereas it can behigh in undifferentiated meteorites. OnEarth, their high concentration in sedi-ments is used as an indication of ameteorite impact, for exmaple at theKT boundary. The elemental ratio be-tween the PGE can provide informationon the nature of the impacted meteorite.pH: Measure of the acidity of anaqueous solution. PH = )log10 (H+)where (H+) is the molar concentrationof hydroxonium ion in solution. pH =7 corresponds to the neutrality while asolution with pH > 7 is basic and asolution with pH < 7 is acidic.Phanerozoic (Aeon): Period of time(Aeon) ranging from 0.54 Ga to today;it followed Precambrian and was char-acterized by metazoa development.
352

Phenetic: Taxonomic system for livingbeings based on overall or observablesimilarities (phenotype) rather than ontheir phylogenetic or evolutionaryrelationships (genotype).Phenotype: The observable character-istics of an organism, i.e. the outward,physical manifestation of an organism.Phenylalanine (Phe): Amino acid con-taining an aromatic phenyl group in itsside chain. Phenylalanine contains nineamino acid residues.Phosphoric acid: H3PO4, dihydrogenphosphate. Molecule which plays animportant role in the living world:nucleotides are esters of phosphoric acid.Photochemistry: Chemistry involvingenergy supply coming from « light »(from IR to UV). When electromag-netic frequency is greater (X-rays, beta-rays or gamma rays), the term radio-chemistry is generally used. Specificprocesses like photo-activation, photo-ionisation, photo-dissociation (includ-ing the production of free radicals), andphotolysis are various aspects of pho-tochemistryPhotodissociation: Dissociation of mol-ecules due to the energy provided byelectromagnetic radiation.Photolysis: See photodissociation.Photosynthesis: Synthesis using pho-tons as energy supply. Photosynthesiscan be performed at laboratory orindustrial level as a sub-domain ofphotochemistry. In biochemistry, theterm « photosynthesis » describes thedifferent biosynthetical pathways lead-ing to the synthesis of molecules underthe influence of light. The photons areabsorbed by cell pigments and theirenergy is converted into chemicalenergy stored in chemical bonds ofcomplex molecules, the starting mate-rial for the synthesis of these complexmolecules being small molecules like
CO2 and H2O. It is important to makea clear distinction between the aerobicphotosynthesis (also called oxygenicphotosynthesis) and the anaerobicphotosynthesis. In the first case, wateris the reductive chemical species and O2
is a by-product of the reaction. It mustbe kept in mind that atmosphericdioxygen as well as oxygen atoms ofmany oxidized molecules on Earthsurface have a biosynthetical origin.Green plants, algae and cyanobacteriaare able to perform aerobic photosyn-thesis; their pigments are chlorophylls.The anoxygenic photosynthesis is notbased on H2O but on reductive specieslike H2S. Finally, some halophilearchaeas contain a pigment calledbacteriorhodopsin and are able to uselight energy supply for ATP synthesis.So, light energy is converted intochemical energy or better, in chemicalfree energy.Phototroph: Organism whose energysource is light (photosynthesis).Phylogenesis: History of the evolutionof a group of organisms.Phylogenic tree: Schematic representa-tion describing the evolutive relation-ships between organisms. It gives animage of the evolution pattern.Phylotype: Environmental sequence,representing an organism. Sequence ofa clone obtained from environment andrepresenting an organism.Phylum (pl. phyla): Group of organismevolutionary connected at high taxo-nomic rank.Pillow lava: Lava extruded under water(ocean, lake) which produces its typicalrounded pillow shape. Pillow lavaforms the upper part of oceanic crust.PIXE (Proton-Induced X-ray Emis-sion): Device that allows the detectionand identification of many elements(metals) in proteins.
353

Plagioclase: Mineral. Tectosilicate (3Dsilicates). Calco-sodic feldspar whosecomposition ranges between a sodic(NaAlSi3O8 = Albite) and a calcic(CaAl2Si2O8 = Anorthite) poles. Theyrepresent about 40% of the Earth crustminerals.Planet: Body formed in circumstellardisks by accretion of planetesimals andmay be of gas.Planetary nebula: This expression is notrelated to planets or to nebula. Aplanetary nebula is the low density andexpanding gaseous envelope of a whitedwarf. The last phase of evolution of astar whose mass is <~8MSun consists inan explosion (nova) and in the ejectionof a gaseous envelope; the star relictsgiving rise to the white dwarf itself.Planetesimals: Small solid bodies(~1–100 km) formed in the protosolarnebula, probably similar to asteroidsand comets. Their collision and accre-tion built the planets.Plankton (plankton): The wholeorganisms living in water and driftingalong ocean and lake currents. Itincludes zooplankton (small animals)and phytoplankton (plants). Fishes andsea mammals, able to swim indepen-dently of current flow, constitute thenekton. Neston refers to organismsdrifting at the air-water interfacewhereas benthos designates organismsliving in or on the aquatic ground.Plasma membrane (or cell membrane):Semi-permeable membrane that sur-rounds contemporary cells. It consistsof a double layer of amphiphilic mole-cules (hydrophobic tail with hydro-philic head), mainly phospholipids,with proteins embedded in it. It mayalso contain some molecules, such ascholesterol or triterpenes, able torigidify the whole.
Plasmid: Extrachromosomic DNAfound in bacteria and yeasts, able toreplicate independently.Plasmon: Electronic cloud of a metal.Plasts: Organites found in photo-trophic Eukaryotes and containingphotosynthetic pigments such as chlo-rophylls.Plate (lithospheric): Piece of the rigidlithosphere that moves over the ductileasthenosphere affected by convection.Plate tectonic: Theory that describesand explains the rigid lithospheric platemotion.Plutonic: Magmatic rock, resulting ofthe slow cooling and crystallisation ofmagma at depth. Its texture is granular(big crystals), e.g. granite.PMS Star: New-born star such that theinternal temperature is yet too low ( <107 K) to initiate nuclear fusion ofhydrogen into helium (i.e. T-Tauristars) and characterized by a low mass.PNA (Peptide Nucleic Acids): Syn-thetic analogues of nucleic acids suchthat the ose-phosphate strand isreplaced by a polypeptide backbone towhich the bases are linked.Polarized light: It is important to dif-ferentiate two limit cases. A linearlypolarized light (or plane polarizedlight) is an electromagnetic radiation,whatever is its frequency, such that theelectric vector and thus also the mag-netic vector oscillate in a plane. If thisradiation travels through a chiralmedium, the plane of polarization isdeviated (optical rotation). A circularlypolarized light is an electromagneticradiation such that its electric vectorand thus also its magnetic vectordescribe, in space, an helix around thepropagation direction. This helix canbe right or left corresponding to thetwo possible circularly polarized lights
354

of a definite frequency. The linearlypolarized light corresponds to thesuperposition of two circularly polar-ized lights of the same frequency.Pole motion: Geographic pole motionat the Earth surface. This motion haslow amplitude, since the pole onlymoves of few metres.Polymerization: Chemical reaction suchthat molecules called monomers arecovalently linked together and form longchain molecules, with or withoutbranching. The polymerization can bethe result of an addition of polymers likein polyethylene or polystyrene (indus-trial polymers) but the polymerizationcan also be the result of condensationreactions involving at each step, theelimination of a small molecule (gener-ally water). Nylon is an industrial con-densation polymer and most ofbiological macromolecules such aspolypeptides, polynucleotides and poly-saccharides are condensation polymers.Polynucleotide: Polymer resulting fromcondensation of nucleotides.Polypeptide: Polymer resulting fromcondensation of amino acids.Polysaccharide: Polymer resulting fromcondensation of oses (in the past, oseswere also called monosaccharides).POM (polyoxymethylene): Polymer offormaldehyde.Population I stars: Stars enriched inheavy elements (O, C, N...). They havebeen formed from the interstellar gasenriched by the previous generation(s)of stars formed over the billions ofyears of lifetime of the Galaxy. Theyare predominantly born inside thegalactic disk. The Sun belongs to pop-ulation I stars. Massive, hot stars arenecessarily young and are thereforealways population I stars.Population II stars: Stars poor in heavyelements (O, C, N...). They have been
formed from low metallicity gas thathas not been enriched by successivegenerations of stars. They are believedto be born in the early ages of theGalaxy. They are actually distributedpredominantly in the halo of the Gal-axy thus confirming that they areprobable remnants of the infancy ofour Galaxy.Poynting-Robertson (effect): Effect ofstellar light on a small orbiting particle.This causes the particle to fall slowlytowards the star. Small particles (below1cm) are more affected because the ef-fect varies as the reciprocal of particlesize.p-p chain: Series of hydrogen burningreactions that produce helium. Thesereactions provide the energy of themain sequence stars whose mass is<1.1 MSun.ppb (part per billion): Relative con-centration in mass = nanogram/gram.ppbv (part per billion in volume): Rela-tive concentration in volume = nano-litre/litre).ppm (part per million): Relative con-centration in mass = microgram/gram.ppmv (part per million in volume):Relative concentration in volume =microlitre/litre)Prebiotic chemistry: All chemical reac-tions which have contributed to theemergence of life.Precambrian: Group of aeons rangingfrom Earth genesis (4.55 Ga) until thebeginning of Palaeozoic era (0.54 Ga).It includes: Hadean, Achaean andProterozoic aeons.Precession (of equinoxes): Motion ofEarth’s rotation axis with respect to thecelestial sphere due to the other bodiesof the Solar system and more particu-larly to the Moon. The terrestrial poledescribes a circle on the celestial spherein 26000 years.
355

Primary structure (of a protein):Sequence of the amino acid residues inthe proteinic chain.Primitive atmosphere: The Earth prim-itive atmosphere refers to the atmo-sphere present when prebioticchemistry occurred, free oxygen con-centration was very low. This atmo-sphere was considered as highlyreductive; today it is rather assumed tohave been made up of carbon dioxide,nitrogen and water vapour (green-house).Primitive Earth: The young Earth fromits formation until 2.5 Ga.Primitive nebula: See protosolar nebula.Prion: Protein able to induce a patho-logical state because its conformation ismodified.p-RNA: Synthetic RNA molecule inwhich the sugar is a pyranose instead ofa furanose.Prokaryote: Microorganism in whichchromosomes are not separated fromthe cytoplasm by a membrane. Bacteriaand Archaea are prokaryotes.Proline (Pro):Amino acid containing sixC atoms with a unique characteristic. Itsside chain links together the alpha atomand the N atom to give a five memberedring containing one N atom and four Catoms ; the amino group is no longer a –NH2 group but a –NH- group. Proline isfrequently observed in protein second-ary structures called beta turnsProper motion (Astronomy): Apparentangular movement of a star on thecelestial sphere during a year (perpen-dicular to the line of sight). Propermotion analysis can lead to detection ofplanets in orbit around this star.Proper motion: Apparent angularmovement of a star on the celestialsphere. The detailed observation andstudy of such motion can lead to thedetection of planets orbiting the star.
Propionaldehyde: CH3-CH2-CHO orpropanal.Protein Scaffold: Protein whose mainfunction is to bring other proteinstogether in order for them to interact.These proteins usually have manyprotein binding domains (like WD40repeats).Proteins: Long chain biological poly-mers obtained by condensation ofamino acids. The degree of polymeri-zation (number of residues) rangesbetween 60 and 4000. Some proteinsform aggregates. For example, haemo-globin is a tetramer containing twoproteinic chains of one type and twoproteins chains of another type; in eachchain, a heme molecule containing aferrous cation is settled in withoutbeing covalently bonded. Structuralproteins are components of muscles orflagella; most enzymes are proteins andproteins are also carriers of other mol-ecules like dioxygen or carbon dioxide.The activity of proteins is extremelydependent on their molecular confor-mation.Proteobacteria: Group of bacteriaincluding Escherichia coli and purplebacteria (photosynthetic bacteria).Mithochondria are relics of proteo-bacteria.Proteome: The complete collection ofproteins encoded by the genome of anorganism.Proteomics: Part of science that studiesproteome. Proteomics not only analy-ses the complete protein collectionsbut also determines their precise loca-tion, modifications, interactions,activities and functions. Consequently,it implies the simultaneous analyse of ahuge amount of proteins in a singlesample.Proterozoic (Aeon): Period of time(Aeon) ranging from 2.5 to 0.54 Ga.
356
This aeon belongs to Precambrian andfollows Achaean. Apparition of oxygenin atmosphere and of metazoa.Proton motive force: Free energy dif-ference (measured in volts) associatedwith proton translocation across amembrane. It depends on the electricalmembrane potential and on the pHdifference between the two reservoirsseparated by the membrane. The pro-ton motive force provides energyrequired for ATP synthesis.Protoplanetary disks: Disk around anew-born star where accretion ofplanets is supposed to take place.Protosolar nebula: Rotating disk of gas,dust and ice, from which the solar sys-tem is originated.Protostar: several similar definitionsexist. 1) new-born star such that half ofits luminosity is due to accretion. 2)Body involved in an accretion processwhich will bring it on the mainsequence. 3) Collapsing interstellarcloud. 4) Young object which is not yetoptically visible. Protostars are rarebecause their time life is short (104 to105 years): « Protostars are the HolyGrail of IR and submillimetric astron-omy ».Psychrophilic organism: Organism thatlives optimally at a temperature lowerthan 10�C. Some psychrophilic organ-isms live at temperatures lower than 0�C.Pulsar : Small neutron star in very fastrotation (one rotation in less than 1s)emitting a highly focalized radiation,circularly polarized and detected asvery regular pulses. Pulsars are rem-nants of supernovae.Purine bases: Guanine and adenine areexamples of purine bases because theirmolecular skeleton corresponds topurine. These bases are found in DNAas in RNA’s.
Purple bacteria: Micro-organisms ofthe bacteria domain able to performanoxic photosynthesis.PVED (Parity Violation Energy Dif-ference): Energy difference betweenenantiomers due to parity violation atthe level of the weak forces.Pyranose: A "pyranose ring" is a cyclicose formed of 5 carbons and an oxygenatom. It is the more stable form of oses.Pyrimidine bases: Thymine, cytosineand uracil are examples of pyrimidicbases because their molecular skeletoncorresponds to pyrimidine. Cytosine isfound in DNA as in the RNAs whilethymine is specific of DNA and uracil isspecific of RNA’s.Pyrite: Mineral. Sulphide [FeS2].Pyrolysis: Thermal degradation of amolecule.Pyroxene: Mineral family. Inosilicate(simple chain silicate). Divided in twofamilies: 1) Orthopyroxene [(Fe,Mg)2-Si2O6] (e.g. enstatite) and 2) Clinopy-roxenes [(Ca,Fe,Mg)2 Si2O6] (e.g.augite, diopside).
Q
Q: Orbital parameter of a planetorbiting a star; distance between planetaphelia and star.q: Orbital parameter; distance betweenplanet perihelia and star.Quartz: Mineral. Tectosilicate (3D sili-cate). It crystallizes in hexagonal orrhombohedric systems. In magma itcharacterizes silica sur-saturation. Therhombohedric crystals are chiral:quartz can therefore exist as D- or L-quartz depending from the helicity ofthe –O-Si-O-Si- chain. A chiral quartzcrystal can induce an enantioselectivityduring a chemical reaction between
357
achiral reactants via a catalytic effect.Quaternary structure (of a protein): Inthe case of protein forming supramo-lecular aggregates like haemoglobins,the quaternary structure corresponds tothe arrangements in space of the sub-units.Quencher: Molecular entity that deac-tivates (quenches) a fluorophore.
R
R: solar radius (0.69 106 km) or 1/200AU; approximately 10 times the Jupiterradius and 100 times the Earth radius.Racemate (crystal): Crystalline form ofa chiral substance such that each unitcell of the crystal contains an equalnumber of molecules of opposite chi-rality.Racemic (mixture): Mixture of enanti-omers containing an equal number ofthe two enantiomers. Such a mixture isdescribed as achiral by external com-pensation.Racemisation: Diminution of the initialenantiomeric excess of a homochiralensemble of molecules or of a non-racemic mixture of enantiomers. Itcorresponds to an equilibration reac-tion: the system evolves spontaneouslytowards a state characterized by higherentropy and therefore, lower freeenergy. The highest entropy and lowerfree energy corresponds to the racemicmixture. Racemisation can be a veryslow process: this is why enantiomers ofamino acids, sugars and many othercomponents of living species can beseparated in many cases.Radial velocity measurement: The line-of-sight velocity of a star or othercelestial object towards or away froman observer. This methods allows todetermine a star movements through
space and consequently to infer theexistence (or not) of an orbitingobject.Radial velocity measurement: The line-of-sight velocity of a star or othercelestial object towards or away froman observer. This methods allows todetermine a star movements throughspace and consequently to infer theexistence (or not) of an orbiting object.Radial velocity: Star velocity compo-nent parallel to the view line. It causesthe frequency shift observed in spectralemission lines (Doppler Effect). Peri-odical change in radial velocity can bean indirect proof that a planet orbitsaround the star (reflex motion).Radiation pressure: Pressure applied byelectromagnetic waves on any atom,molecule or particle.Radioactivity (long lived species):Radioactive elements with long period(109 to 1011 years); they are still presentin the Solar system.Radioactivity (short lived species):Radioactive elements with short period(<107 years). Nowadays they have to-tally disappeared in the Solar system.Raman (spectroscopy): Physical meth-od used for molecular structural anal-ysis. Raman spectroscopy is based oninelastic diffusion of visible or UV lightand gives information about thevibration modes of diffusing molecules.Raman spectroscopy must be consid-ered as a complementary method withrespect to IR spectroscopy.Rare Earth Elements (REE): Chemicalelements with very similar chemicalproperties. This family (lanthanides)ranges from Lanthanum (Z = 57) toLutetium (Z = 71). In geochemistry,they are commonly used as geologicaltracers of magmatic processes. Indeedthey are poorly sensitive to weatheringor metamorphism, but on the opposite
358
they are excellent markers of magmaticprocesses such as melting or crystalli-zation.Rare gases (He, Ne, Kr, Ar, Xe, Rn):Monatomic gases corresponding to the(VIIIA) period of Mendeleyev periodictable (see ‘‘Astrobiological data’’).Their isotopes can be used to tracesome geological events of Earth differ-entiation (e.g. atmosphere and oceanformation).Recovery ratio (%): A sample preparedby adding a known mass of targetanalyte to a specified amount of matrixsample for which an independent esti-mate of target analyte concentration isavailable. Spiked samples are used, forexample, to determine the effect of thematrix on a method’s recovery effi-ciency.Red giant (astronomy): Old star(spectral type K or M) still performingfusion of hydrogen but having alreadya helium core.Reducing atmosphere: Atmosphere withhigh hydrogen content. Carbon, oxy-gen and nitrogen mainly exist as CH4,H2O and NH3.Reduction potential: Measure of thetendency for a molecule or an ion togive an electron to an electron acceptorthat, itself, can be a molecule, an ion oran electrode. A conventional reductionpotential scale for molecules in waterallows to determine, a priori, whatchemical species will be the electronacceptor and what will be the electrondonor when they are mixed together ata well defined concentration.Refractory inclusion: Aggregate ofrefractory minerals incorporated into ameteorite. See CAl.Refractory: A refractory compound is acompound that remains solid over thewhole temperature range undergone by
the host object (i.e. dust in a comet).Antonym: volatile.Refractory: Substance which remainssolid in all temperature conditionsavailable in a particular body of thesolar system (ex. dust particles in acomet). If not refractory a substance issaid volatile.Region (HII region): interstellar cloudsuch that H exists essentially as H+.Ionization is due to intense UV radia-tion coming from OB stars. HII is theold name used by spectroscopists todescribe lines coming from H+ recom-bination.Replication: biochemical process bywhich a DNA strand or a RNAmolecule is copied into the comple-mentary molecule. Replication is dif-ferent from transcription and fromtranslation.Reservoir: In biogeochemistry or geo-chemistry, a reservoir is the availablequantity of one chemical element (orspecies) within one specific compart-ment of the global ecosystem (ocean,atmosphere, biosphere, sediments,etc. . .). Any reservoir may evolvethrough exchanges with the other ones(biogeochemical or geochemical fluxes.Residence time: The average time achemical element or species spends in ageochemical or a biogeochemical res-ervoir (ocean, atmosphere, biosphere,sediments, etc. . .). . Assuming the res-ervoir is in steady state (input flux =output = dQ/dt) and contains anamount Q of one element, the residencetime s = Q/(dQ/dt).Retrotransposons: DNA sequences ableto move from one site to another alongthe chromosome. Retroposons belongsto a transposons family which requiresRNA molecule as intermediate. Themore frequent retrotransposons are the
359
Alu sequences; around one million ofsuch sequences have been identified inthe human genome.Ribose: Aldopentose of major impor-tance in the living world; part of RNAnucleotidesRibosomes: Intracellular structurescontaining many rRNA (ribosomalRNA) molecules together with a com-plex of 60–80 proteins. Synthesis ofproteins takes place in ribosomes bycondensation of amino acids; informa-tion about the correct sequence is givenby a mRNA (messenger RNA) whileeach amino acid is linked to a specifictRNA (transfer RNA).Ribozyme: RNA molecule acting as anenzyme.Ridge (geology): Submarine mountainchain located at divergent lithosphericplate margins. On the Earth the totallength of ridges is 60000 km.Rift: Rift valley limited by faults =graben.Rigid rotator (hypothesis): Molecularsystem frozen at its equilibrium geom-etry. Interatomic distances and bondangles do not vary during rotation.Ringwoodite: Mineral. Nesosilicate (iso-lated SiO4 tetrahedrons). [(Mg,Fe)2SiO4].Also called olivine c phase. In Earthmantle, ringwoodite is stable between 520and 660 km.RNA world: Often considered as anearly hypothetical stage of life evolu-tion, based on a life without proteinand such that RNAs would haveplayed a double role: catalysis andsupport of genetic information. Thistheory is mainly based on the discoveryof catalytic RNAs (ribozymes) and onan increasing knowledge about theimportance of RNAs in contemporarylife. For other scientists, the RNAworld is the stage of evolution thatpreceded the DNA emergence.
RNA: Ribonucleic acid, a class ofnucleic acids containing ribose as abuilding block of its nucleotides. RNAsthemselves are divided into sub-groupslike messenger-RNA (m-RNA), trans-fer-RNA (t-RNA), ribosomal-RNA (r-RNA).Rock: Solid material made up of min-eral assemblage. It constitutes telluricplanets, asteroids and probably thecore of giant planets.Rocky planets: Other name for telluricplanets.Rodinia: Super continent that formedat about 750 Ma ago.Root (Genetics): for a particular genetictree, the last common ancestor of allthe organisms of the tree.Rosetta: ESA mission launched at thebeginning of 2004; it will reach the P/Cheryumov-Gerasimenko comet aftera 10 years trip. An orbiter will followthe comet during one year, and a landerwill perform « in situ » analyses oncomet nucleus surface.Rotatory power: Deviation of thepolarization plane of a radiation ofwell-defined frequency by a chiralmedium.Rovibrational (level): Energy level of amolecule expressed as a rotationalquantum number J associated to agiven vibration level m.r-process (rapid): Nucleosynthethicmechanism that takes place duringexplosion events (i.e. Supernova) andleads to the synthesis of neutron-richnucleus with atomic number >26(Iron). During this process, the atomicnucleus captures a huge amount ofneutrons and is immediately dissoci-ated through b- decay.RRKM: Method of molecular dynam-ics for the calculation of rate constantsof chemical reactions due to Rice,Ramsperger, Kassel & Marcus.
360
r-RNA: Ribosomal RNA. r-RNAs arethe major components of ribosomes.Some of them have catalytic properties.Rubisco (or RuBisCo): Ribulose-1,5biphosphate carboxylase-oxygenase;enzymewhichcatalysesCO2metabolism.It is themost abundant enzymeonEarth.Runaway greenhouse effect: Amplifica-tion of a greenhouse effect due tovaporization of molecules able toabsorb infrared radiation emitted orreceived by the planet and which,themselves, contribute to greenhouseeffect (i.e. Venus).Runaway growth (astronomy):Increasing rate of planetary accretionwith planet growth, it leads to anincreasing size difference between thesmall and large bodies.Runl: Sun radius (0.69·106 km); 1/200AU; ~10 times Jupiter radius, ~100 timeEarth radius.Runoff channels: Kind of channelsobserved on Mars and which seems tooriginate by large water flows over along period of time.
S
Sagduction: Gravity driven rock defor-mation. When high density rocks (e.g.komatiites) emplace over low densityrocks (e.g. TTG), they create an inversedensity gradient that results in the ver-tical sinking of dense rocks in thelighter ones. Sagduction was wide-spread before 2.5 Ga.Sarcosine: (CH3)NH-CH2-COOH,non-proteinic N-methyl amino acid.Schist: Fine grain sedimentary rockcharacterized by a cleavage (slate). Itresults of fine sediment (i.e. mud)metamorphism.Secondary structure (of a protein):Spatial arrangement of the main chain
of a protein. Alpha-helices, beta-sheets,beta-turns are examples of secondarystructuresSedimentary rock: Rock generated onEarth surface. It can consist in theaccumulation of rock particles (detri-tal) or of organic matter (oil, petrol,coal). It can also be produced byphysico-chemical or biogenic precipi-tation of dissolved ions. Detrital parti-cles and ions derived of alteration anderosion of pre-existing rocks.Selenocysteine: Frequently described asthe 21st proteinic amino acid becausesometimes coded by the genetic code. Ithas the structure of the cysteine with aSe atom replacing the S atom.SELEX: (Systematic Evolution ofLigands by Exponential Enrichment)Method that generates high-affinityRNA or DNA ligands through succes-sive in-vitro rounds of directed molec-ular evolution. This process allows toidentify aptamers by iterative enrich-ment for molecules capable of bindinga target.Semi major axis: Orbital parameter.Half of the major axis of an ellipticalorbit.Semi minor axis: Orbital parameter.Half of the minor axis of an ellipticalorbit.Semi-minor axis: Orbital parameter.Small axis of orbital parameter.Sense: DNA strand that is not copiedinto mRNA. Therefore, the sequence ofthe sense strand corresponds to themRNA sequence which, itself, corre-sponds to the transcription of theantisense strand. Sense and antisenseDNA sequences are strictly comple-mentary.Sequence (genetics): Series of directlylinked nucleotides in a DNA or a RNAstrand; series of directly linked aminoacids residues in proteins.
361

Sequence (main sequence) (astronomy):Stage in star evolution when it per-forms hydrogen fusion in its core. In aHR diagram, main sequence stars drawa straight line.Sequencing: Experimental determina-tion of a DNA, RNA or proteinsequence.Serine (Ser): Proteinic amino acid witha -CH2-OH side chain. Being hydro-philic, serine is generally present in theexternal part of the skin and can beused as the proof for human contami-nation of meteoritic samples. Serine isproduced in very small amounts duringsimulation experiments considered asexperimental models of interstellarchemistry.Serpentine: Mineral family. Phyllosili-cate (water-bearing sheet silicate) (i.e.Antigorite [Si4O10Mg6(OH)8]). Theyare generated by olivine (and some-times pyroxene) alteration. They playan important role in internal watercycle.SETH (Search for ExtraterrestrialHomochirality): Search for proofs ofenantiomeric excesses in extraterrestrialobjects.SETI (Search for ExtraterrestrialIntelligence): Search for electromag-netic signals (essentially in theradio-wave domain) that should beintentionally emitted by some livingorganisms and coming from sourceslocated outside the Solar system.Shield (geology): Huge block of old(often Precambrian in age) and verystable continental crust, e.g. Balticshield (includes Finland, Sweden,Norway, and Western part of Russia).Shocked quartz: Quartz crystal whosestructure contains defaults characteris-tic of the high pressures realised bymeteorite impacts.
Shocked quartz: Quartz showing char-acteristic microscopic defects of its crys-talline structure that were generated bythe passage of a high pressure (>5 Gpa)shock wave. The most common modifi-cation is the formation of planar defor-mation features (PDF) consisting of finelamellae of amorphous SiO2 orientedparallel to two (or more) specific crys-tallographic planes. Under even higherpressure the whole quartz crystal can betransformed to glass. Shocked quartz area diagnostic criteria to recognize mete-orite impacts as no other natural processis capable of producing the required highpressure dynamic shock wave.Siderite: Mineral, iron carbonate[FeCO3].Siderophile: Elements frequently asso-ciated to iron (like Au, Pt, Pd, Ni. . .).SIDP (Stratospheric IDP): IDP col-lected in the stratosphere by captorsplaced on airplanes.Silicate:Wide mineral family of siliciumoxides. The structure is based on atetrahedron (SiO4)
4–
Simple sugar: Old name for monosac-charide.Site (active site): For an enzyme, spe-cific locus where the substrate is fixed,ready to react with the reactant.SL (Astronomy): Solar luminosity(3.826·1024 W) or 3.826·1033 erg s-1
SM: Solar mass (2·1030 kg).Small bodies: Comets and asteroids.SMOW (Standard Mean Ocean Wa-ter): Standard reference sample for Hand O isotopic abundance measure-ments.SNC: Family of about 30 meteoriteswhich, based on several experimentalobservations, are considered as having aMartian origin. SNC is the abbreviationfor Shergotty, Nakhla and Chassigny,three meteorites of this family.
362

Snow line: Limit between the regionswhere H2O is gaseous and the regionwhere it is solid. In a protoplanetarydisks, the snow line marks the bound-ary between the region where telluricplanets form from silicates, and theregion where giant planets, made of anicy core surrounded by protoplanetarygases, are generated.Snowball effect (Astronomy): Duringplanetary accretion the larger objectsgrow more rapidly than the smallerones, leading to an increasing differencein size between small and large bodies.This process accelerates (like a rollingsnowball, the growing rate is propor-tional to its size), until the momentwhen the larger objects control thewhole dynamic. See also Runawaygrowth.Solar constant: Total energy deliveredeach second by the Sun and measuredin W.m)2, the surface being placed at1AU of the Sun and perpendicularly tothe light rays. The value of the solarconstant is equal to 1360 W.m)2.Solar type star: Star of G type, similarto the Sun.Solidus: Line which, in composition vs.temperature or pressure vs. tempera-ture diagrams, separates the domainwhere crystals and liquid coexist fromthe field where only crystals (solid)exists.Spallation: Atomic nuclei breaking dueto the collision between two atomicnuclei with energy greater than colum-bic barrier; it leads to the formation ofnew elements, stable or radioactive.Speckle interferometry: Acquisition andstatistical treatment of images tech-nique that consists of the recovery ofpart of the information included inastrophysical images and lost becauseof the atmosphere imperfect transmis-sion. This technique, developed during
the 80ies is not much used any longerand replaced by adaptive optics tech-niques that allow a real time partialcorrection of atmospheric turbulenceeffects.Spectral type: Star classification proce-dure based on electromagnetic spec-trum which, itself, depends on starsurface temperature. The OBAFGKMclassification ranges from surface tem-perature of about 50000 K (O type)until 3500 K (M type = Sun).Spinel: Mineral. Oxide [MgAl2O4].Stable at low pressure (depth <70 km). ).In the mantle, at shallow depth, spinel isthe only aluminium-bearing phase.Spore (biology): a) Resistant, dormant,encapsulated body formed by certainbacteria in response to adverse envi-ronmental conditions. b) Small, usuallysingle-cell body, highly resistant todesiccation and heat and able to de-velop into a new organism.s-process (slow): Nucleosyntheticmechanism that takes place over longperiods of time in environments withmoderated neutron flux (i.e. Red giant).This mechanism leads to the synthesisof atoms with atomic number >26(Iron) that are located in the nuclearstability valley.Star: Celestial object, generally spheri-cal, where thermonuclear reactionstake place (e.g. the Sun) or will takeplace in the future (e.g. the PMS stars)or has taken place in the past (neutronstar)Stellar cluster: Group of few hundredsto several millions of stars. The smallestgroups are named associations. Most ofthe stars are formed in open clusters.Stereoisomers (or stereomers): Isomers(molecules with identical atomic com-position, i.e. the same number of thesame atoms) such that the atoms areidentically interconnected by covalent
363

bonds. If two stereoisomers are differ-ent in the same way that a left hand isdifferent from a right hand, the ste-reoisomers are enantiomers. In allother cases, stereoisomers are calleddiastereoisomers (or diastereomers).Stereoselectivity: When a chemicalreaction leads to the formation of ste-reoisomers and when these latter arenot exactly produced in the sameamount, the reaction is called stereo-selective. Similarly, when two stereoi-somers react at a different rate with areactant, the reaction is stereoselective.In the chemical literature, some authorshave introduced subtle differences be-tween stereoselectivity and stereospeci-ficity.Steric effect: One of the multiple« effects » introduced by organicchemists to explain the relative stabilityor the relative reactivity inside a groupof molecules. The steric effect takes intoaccount the size of each atom or groupsof atoms. For instance, the steric effectof a –C(CH3)3 group is larger than thesteric effect of a CH3 group. The stericeffect can be explained on the basis ofrepulsive term in the Van der Waalsforces.Stony meteorites: Mainly made up ofsilicates, they can contain from 0 to 30% of metal grains and several percentsof sulphides. They can be differentiated(achondrite) or undifferentiated (chon-drite) even if CI undifferentiated chon-drites do not contain chondrules.Stop codon (Genetic): Codon that doesnot code for amino acids but thatindicates the translation end. For theUniversal code, these codons are UAA,UAG and UGA (synonym: termina-tion codons).Stratopause: Atmospheric boundarybetween stratosphere and mesosphere.
Stratosphere: Atmospheric layerlocated above the troposphere and be-low the mesosphere, between 9–17 kmand 50 km. In stratosphere, tempera-ture slightly increases with altitudewhich prevents it of convective move-ments.Strecker (synthesis): Synthetic methodproducing amino acids from aldehyde,HCN, NH3 and water. Frequentlyconsidered as important prebioticreaction.Stromatolite: Sedimentary structureconsisting of laminated carbonate orsilicate rocks and formed by the trap-ping, binding, or precipitating of sedi-ment by colonies of microorganisms(bacteria and cyanobacteria).Strong force: One of the four funda-mental forces in physics which con-tribute to the stability of the atomicnucleus.Subduction: Plate tectonic mechanism,where an oceanic plate sinks under another lithospheric plate (generally acontinental plate, but sometimes alsoan oceanic plate).Sublimation: Direct phase change fromsolid to gas state.Succinic acid: HOOC-CH2-CH2-COOH.Suevite: Rock associated with impactcraters (=impactite). Defined in theRies crater (Bavaria), this brecciatedrock containing melt material (glass)consists of fragments of local impactedlithologies and basement rocks, mixedin a fine-grained clastic matrix.Sun: Star belonging to the mainsequence (in H-R diagram); it is 4.56 Gaold. Sun-Earth distance corresponds to 8light-minutes or 1 astronomic unit (1AU).Supernova: Exploding star which,before explosion, was either a binary
364

star (type I) or a massive star (type II).After explosion, the remnant becomes aneutron star.Surface plasmon resonance (SPR): Abiosensor system used for analyzingligand binding and kinetics of specificmolecules within complex mixtureswithout prior purification. Binding of aligand to a biomolecule immobilized ona membrane (metallic film) results inchanges in membrane surface plasmonresonance.Symbiosis: Prolonged associationbetween two (or more) organisms thatmay benefit each other. In the case ofendosymbiosis, one organism lives intoanother one; their relationship is irre-versible and implies a complete inter-dependence such as the two become asingle functional organism. Mitochon-dria and chloroplasts are remnants ofthe endosymbiosis of photosyntheticbacteria.Synchrotron radiation: Electromagneticwaves covering a large frequencydomain and emitted under vacuum byhigh velocity electrons or ions, whentheir trajectory is altered, as by amagnetic field. Synchrotron radiation isnaturally polarized.Synonymous (codons): Different codonsthat specify the same amino acid; e.g.AAA and AAG specify lysine.
T
T Tauri star: New-born low mass star(lower than two solar masses) whichstarts to become optically observable.Classical T-Tauri are very young (lessthan 1 Ma old) and are not yet on themain sequence (PMS stars). They aresurrounded by a disk, their luminosityis variable with an excess of IR with
respect to UV. T-Tauri stars weobserve today are probably similar tothe young Sun.Talc: Mineral. Phyllosilicate (water-bearing sheet silicate) [Mg3 (Si4O10)(OH)2]. Talc frequently results ofhydrous alteration of magnesian min-erals (i.e. olivine).Taxonomy: Science that classifies livingspecies. Similar species belong to thesame taxon.Tectonic: Science of rock and crustaldeformation.Tektites:Natural glasses formed at veryhigh temperature (>2000�C) by mete-oritic impacts.Telluric planets: Small and dense rockyplanets (density: 3 to 5.5 g. cm–3). Theseplanets (namely Mercury, Venus, Earthand Mars) are silicate rich and wereformed in the inner part of the proto-solar nebula, beyond the dust line.Terraforming: Voluntary transforma-tion of a planetary atmosphere in orderto allow colonization by plants andanimals (including man).Tertiary structure (of a protein):Arrangement of the side chains of theresidues in space, overall conformationof a protein.Theia: Name given by some authors toMars-sized object, which, afterimpacting the young Earth, led to theMoon formation. This cataclysmicevent took place 4.5 to 4.45 years ago.Thermolysis: Thermal degradation of amolecule into smaller fragments (atoms,radicals, molecules and, rarely, ions).Thermonatrite: Mineral. Water bearingsodium carbonate [Na2CO3
.H2O]. Thismineral is water-soluble and primarilyforms in evaporite deposits and indesert soils where it may occur as asurface deposit, or in volcanic fuma-roles
365

Thermonuclear reaction: Reactionleading to formation of heavier nucleiby fusion of lighter nuclei. Thermonu-clear reactions require high T and highP conditions. In natural conditions,these reactions occur spontaneously incores of main sequence stars or ofheavier stars like giant stars. It occursalso during supernovae explosions.Thermopause: Atmospheric boundarybetween thermosphere and exosphere.Thermophile: Organism living opti-mally at high temperatures. They canbe divided in ‘‘moderate thermophiles’’,living optimally between 40 and 60�C,extreme thermophiles, between 60 and80�C, and hyperthermophiles, livingoptimally at temperatures higher than80�C (and up to ~120�C).Thermosphere: Atmospheric layerlocated above the mesosphere andbelow the exosphere. At the top of thethermosphere, at an altitude of about700 km (on Earth) the temperature canbe >1300 K.Thin section (geology): Rock slicegenerally 30 lm-thick. At such athickness most minerals are transparentand can be observed by transmittedlight with a polarizing microscope.Thiocyanate: R-S-CN.Thioester: R-S-CO-R’.Thioester: R-S-CO-R’.Thiol: R-SH.Tholeiite: Relatively silica-rich andalkali-poor basalt.Tholins: Solid mixture of complexorganic molecules obtained by irradia-tion of reduced gases like CH4,NH3. Could be present on Titan.Threonine (Thr): Proteinic amino acidcontaining four C atoms and a –OHgroup in its side chain. Threonine is
described as a hydrophilic amino acid.Thymine (T): Nucleic base belongingto purine and specific of DNA.Titan: The biggest satellite of Saturn(~5000 km in diameter; which isapproximately the same size as Mer-cury). In the solar system, this is theonly satellite which possesses a denseatmosphere. Very probably, organicreactions could have taken place in itsmulti-components hydrocarbon-bear-ing atmosphere.Titus-Bode law: Empirical law givingapproximately the planet-Sun distanced as a function of the planet ranking n(d = (4+3.2(n)2)/10). Mercury is anexception to this law (d = 0.4 AU).Tonalite: Plutonic magmatic rock(granitoid), made up of quartz andcalcic plagioclase feldspar; biotite andsometimes amphibole are minor min-eral phases. Tonalite does not containalkali feldspar. Dacite is its effusiveequivalent.TPF (Terrestrial Planet Finder):NASA project with a similar goal as theESA Darwin project i.e. discovery ofextrasolar terrestrial planets.Transcription: Synthesis of an m-RNAas a copy of an anti-sense DNA singlestrand.Transduction: Transfer of geneticmaterial from one bacteria to anotherthrough viral infection.Transfer of genes (horizontal transfer):Transfer of a gene from one organismto another which does not belong to thesame species. Such transfer can occurthrough viral infection or by directinclusion of genetic material present inthe external medium. Horizontaltransfer is different from verticaltransfer from parents to children.
366

Transferase: Enzyme that catalysestransfer of a chemical group from onesubstrate to another.Transform fault: Boundary betweentwo lithospheric plates which slidewithout any crust creation or destruc-tion.Transit: Motion of a planet in front ofthe disk of its star.Translation: Sequence enzymatic reac-tions such that the genetic informationcoded into a messenger RNA (m-RNA)leads to the synthesis of a specific pro-tein.Trans-neptunian object: (TNO) Solar-system body located beyond the orbitof Neptune, in the Kuiper belt orbeyond.Triangular diagram: Diagram classi-cally used in geology to plot thechemical or mineralogical compositionof a sample. Each apex of the trianglerepresents 100% of one componentwhereas the opposite side correspondsto 0% of the same component.Triple point: In a P-T phase diagram ofa pure compound, it corresponds to theunique P, T value where the threephases (gas, liquid, solid) coexist atequilibrium. For water, P = 6.11 mbarand T = 273.16K.t-RNA synthetase: Enzyme which cat-alyzes, in a very specific way, bondformation between an amino acid andits t-RNA.t-RNA: Transfer RNA.t-RNA: Transfer RNA. Polymer con-taining 70 to 80 ribonucleotides andspecific of each amino acid to which itis linked. Able to recognize a triplet ofnucleotides of m-RNA (codon) by aspecific molecular recognition processinvolving a triplet of nucleotides of thet-RNA (anti-codon). The t-RNA’s playa fundamental role for proteinic syn-thesis.
Trojans: Family of asteroids located atthe Lagrange point on the Jupiter orbit.Their position together with the Sunand Jupiter positions determines anequilateral triangle.Trondhjemite: Plutonic magmatic rock(granitoid), made up of quartz andsodic plagioclase feldspar; biotite is aminor mineral phase. Tonalite andtrondhjemite are similar rocks exceptthat in tonalite plagioclase is calcicwhereas it is sodic in trondhjemite).Tropopause: Atmospheric boundarybetween troposphere and stratosphere.Troposphere: Lowest part of Earthatmosphere, as the temperature at itsbasis is greater than at its top, it is theplace of active convection. On Earth,troposphere thickness ranges between 9km (pole) and 17 km (equator). Mostmeteorological phenomena take placein troposphere.Tryptophane (Trp): Proteinic aminoacid containing eleven C atoms; tryp-tophane contains a heterocycle in itsside chain. It is described as an aro-matic amino acid.TTG: Tonalite, Trondhjemite, Grano-diorite. Rock association typical of thecontinental crust generated during thefirst half of Earth history.Tunguska event: Explosion which tookplace in 1908 (June 30th) in Siberia anddevastated 2000 km2 of forest. It wasprobably due to the explosion in theatmosphere of small (<50 m) asteroidor comet.Tunnel effect: Description of tunneleffect requires the use of quantummechanics because it is a direct conse-quence of the wave properties of par-ticles. When a system A gives anothersystem B while the internal energy of Ais lower than the energy barrier (acti-vation energy) required to cross thebarrier from A to B, it can be said that
367

A gives B by passing « through thebarrier » by a tunnel effect.Turbidite: Sedimentary deposit depos-ited by a turbidity current according toa characteristic fining upward grain sizesequence in deep water at the base ofthe slope and in the abyssal plain.Turbidity current: Also called densitycurrent. Viscous mass of mixed waterand sediment that propagate down-ward along the continental slope (of anocean or a lake) due to its greaterdensity. It may reach high speeds andhas a high erosive power. Such currentare set in motion by earthquakes forexample.Turbulence (parameter) (Astronomy): Inhydrodynamics, the « a model empiri-cally describes the turbulent viscosity ofa flow. It is based on a parameter a:mt ¼ aC2s
X with Cs = local sound speedand W, the keplerian rotationalfrequency.Tyrosine (Tyr): Proteinic amino acidcontaining nine C atoms. Its side chaincontains a phenolic group.
U
Upwelling: Upward movement of cooland nutrient-rich sub-surface seawaterstowards the surface. Upwelling ismainly controlled by local atmospheredynamics (pressure, wind), frontalcontact between water masses withdifferent densities (oceanographicfronts) or by Eckman transport.Uracil (U): Nucleic base belonging topyrimidine family and specific of RNAsUrea (H2N-CO-NH2): First organicmolecule that has been synthesisedfrom a mixture of inorganic molecules(Wohler).UV radiation: Electromagnetic radia-tion characterized by wavelengths
ranging from 0.01 to 0.4 microns(energies from 124 to 3.1 eV).
V
Valine (Val): Hydrophobic proteinicamino acid containing five carbonatoms.Van der Waals forces (V.d.W.): Inter-atomic forces acting between non-bon-ded atoms at the intramolecular levelbut also at the intermolecular levels.Repulsive V.d.W. forces are responsiblefor the no-infinite compressibility ofmatter and for the fact that atoms havesizes. Attractive V.d.W. forces areresponsible for matter cohesion.V.d.W. forces play a major role inbiochemistry: together with H-bondsand electrostatic interactions, theydetermine the preferred conformationsof molecules and they contribute tomolecular recognition phenomena.Vernal point: Sun location on thecelestial sphere at the vernal equinox(spring equinox). It is the origin ofcoordinates in the equatorial system.Vertical tectonic: See sagductionVesicle (geology): Bubble-shaped cavi-ties in volcanic rocks formed byexpansion of gas dissolved in the mag-ma.Vesicle: Small sac, made of hydropho-bic or amphiphile molecules, whosecontent is isolated from the surround-ing environment.Viking: NASA mission to Mars whichstarted in 1976. The two landers(Chryse Planitia and Utopia Planitia)performed a series of very ambitiousexperiments to detect the presence oflife on Mars. Unfortunately, manyresults were ambiguous.Virus: System containing DNA orRNA surrounded by a proteinic enve-
368

lope (capside). When introduced in aliving cell, a virus is able to replicate itsgenetic material by using the host cellmachinery.VLBI (Very Long Baseline Interferom-etry): Technique that allows a veryaccurate determination (50 microarc-sec) of the position of astronomicalsources of radiowaves. This method isbased on interferometry measurementsusing very distant radiotelescopes(large base) located on the same conti-nent or on different continents or evenon Earth and on a satellite.VLT (Very Large Telescope): Groupof four large telescopes (4 to 8 metres)and several smaller telescopes, able towork as interferometers and located inChile. VLT is managed by ESO.Volatile (volatile substance): Moleculeor atom that sublimates at relativelylow temperature (i.e. cometary ices).Volatile: see refractory.Volcanoclastic sediment: Sediment dueto sedimentation in the sea or in a lakeof volcanic products (i.e. ashes).
W
Wadsleyite: Mineral. Nesosilicate (iso-lated SiO4 tetrahedrons). [(Mg,Fe)2-SiO4]. Also called olivine b phase. InEarth mantle, wadsleyite is stablebetween 410 and 520 km.Wall (of a cell): Extracellular mem-brane. In bacteria, cell wall structure iscomplex: the walls of gram-positive andgram-negative bacteria are different.Water triple point: See triple point.Watson-Crick: Canonical model ofDNA (double helix) involving the pair-ing of two polynucleotide strands viaH-bonds between A and T or G and C.
RNA is generally single-stranded butwithin a single strand Watson-Crickpairing canoccur locally.Whenhappens,it involves A—U and G—C pairing.Weak bonds: Intermolecular or intra-molecular bonds involving non-bondedatoms (atoms not bonded by covalent,coordination or electrostatic bonds).H-bonds are well known examples ofweak bonds but Van der Waals forcesand electrostatic interactions also con-tribute to weak bonds. The weak bondsplay a fundamental role in the livingworld: they determine the conforma-tion of molecules and more particularlythe conformation(s) of biopolymers;they are responsible for the specificityof molecular recognition. The inter-molecular association due to weakbonds is generally reversibleWeak force: One of the four funda-mental forces of physics. Parity is vio-lated for these forces. The couplingbetween weak forces and electromag-netic forces is at the origin of the verysmall energy difference between e-nantiomers (PVED for Parity ViolationEnergy Difference).Weathering: See alteration.White dwarf: Relict of a dead star withan initial mass < ~8MSun. Its gravitycollapse is limited by electron degener-acy pressure.Wind (solar or stellar): Flow of ionizedmatter ejected at high velocity (around400 km/s) by a star. Solar wind mainlycontains protons).Wobble (genetics): Describes impreci-sion in base pairing between codonsand anti-codons. It always involvesposition 3 of codon, mainly when thebase is U.
369

X
Xenolith: Inclusion or enclave of for-eign rock or mineral (xenocrystal), in amagmatic rock.
Y
Young sun paradox: Apparent contra-diction between the lower brightness ofthe young Sun, (70% of the present-dayintensity in the visible spectral range)and the early presence of liquid water()4.4 Ga) on Earth. A strong green-house effect due to high concentrationsof atmospheric CO2 could account forthis apparent paradox.YSO (Young Stellar Object): Starwhich has not yet completed the pro-cess of star formation. YSO includesobjects ranging from dense cores, (thatcan be detected in the submillimetric IRfrequency range) to pre-main sequencestars (T Tauri, Herbig AeBe) and HIIregions.YSO: Young Stellar Object.
Z
Z (astronomy): Abundance of « heavyelements » i.e. all elements except Hand He.ZAMS (Zero Age Main Sequence):Ensemble of new-born stars in which Hfusion has just started.Zircon: Mineral. Nesosilicate (isolatedSiO4 tetrahedrons). [ZrSiO4]. Thismineral which also contains traces ofTh and U is extremely resistant toweathering and alteration. These arethe reason why it is commonly used todetermine rock ages. The oldest zirconcrystals so far dated gave an age of 4.4Ga. They represent the oldest knownterrestrial material.Zodiacal light: Diffuse faint lightobserved in a clear sky close to theecliptic. It is due to the diffusion of thesolar radiation by the electrons and theinterplanetary dusts. Also used for anylight diffused by dust particles in aplanetary system.
370