Historical Statistics of Newfoundland and Labrador · I BOSS 1101 111111 ISOMS1 111911 110011...
257
Historical Statistics of Newfoundland and Labrador GOVERNMENT OF NEWFOUNDLAND AND LABRADOR
Transcript of Historical Statistics of Newfoundland and Labrador · I BOSS 1101 111111 ISOMS1 111911 110011...
Historical Statistics of Newfoundland and Labrador
GOVERNMENT
OF
NEWFOUNDLAND AND LABRADOR
I BO
SS
11
01 1
1111
1 IS
OM
S1
1119
11110011
0110081
1111
1011
1111
1101
10
HISTORICAL STATISTICS OF NEWFOUNDLAND AND LABRADOR
CIF
Published under the Authority of
The Honourable Winston Baker President of Executive Council
Prepared by
Newfoundkmd Statistics Agency Executive Council
Government of Newfoundland & Labrador
November 1994 Volume H (VH)
1)1c.or-N-hritAcd
1 11 1
0118S
OS
OO
OO
SO
MO
OM
OO
SO
OM
9
1 111.1 1
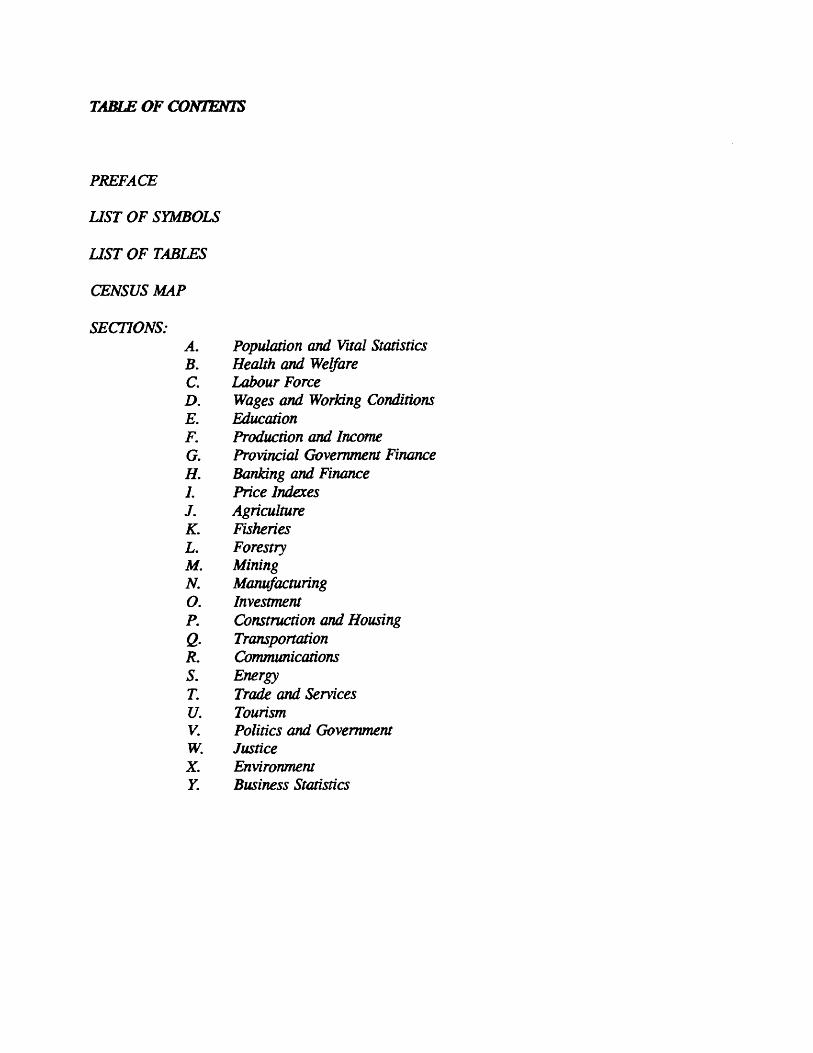
.9 TABLE OF CONIENTS
PREFACE
LIST OF SYMBOLS
LIST OF TABLES
CENSUS MAP
SECTIONS: A. Population and Vital Statistics B. Health and Welfare C. Labour Force D. Wages and Working Conditions E. Education F. Production and Income G. Provincial Government Finance H. Banking and Finance I. Price Indexes J. Agriculture K. Fisheries L. Forestry M. Mining N. Manufacturing O. Investment P. Construction and Housing Q. Transportation R. Communications S. Energy T. Trade and Services U. Tourism V. Politics and Government W. Justice X. Environment Y. Business Statistics
OS
SO
OO
MO
SO
OO
SO
OO
OM
MO
SO
OM
OO
MO
OO
OO
• page iii
PREFACE
This publication is a collection of the commonly used statistical series on Newfoundland and
Labrador. In order to keep the publication at a reasonable size monthly and subprovincial data
are not included. As well only a small number of census tables have been included.
The following should be noted when using the publication:
The publication is arranged into 25 sections and the headings of these sections are given
in The Table of Contents
Each section contains notes and explanations on the tables.
The source of the data is indicated at the foot of each table.
Also at the foot of each table is a heading called "Additional Data". This indicates when
the data are available more frequently than annually (such as monthly); for a smaller
geographic area; or in greater detail.
This volume contains most of the information included in earlier volumes.
Any questions or comments on this publication should be addressed to:
Newfoundland Statistics Agency Executive Council 10th. Floor, East Block Confederation Building St. John's, NF A1B 4J6 Phone: (709) 729-2913

• - page v a a O LIST OF SYMBOLS
O
IIIIS
OO
SS
OO
SO
OS
MO
SS
OS
OO
SS
OS
SM
OS
OO
O
• • •
• •
The following symbols and abbreviations are used in this publication:
figures not available
figures not appropriate or not applicable
nil or zero
Confidential
not elsewhere specified
preliminary figures
revised figures
X
n.e.s.
P
r

1 101101
11 1
111 1
01181 1
1 1O
SO
MO
SS
OO
OM
OO
MO
OS
OM
OS
II
page vii
LIST OF TABLES
A-1 Number and Annual Growth Rate of Population, Newfoundland and Labrador, for Census Years 1836 to 1993
A-2 Births, Deaths, Net Natural Increase, Marriages, Divorces and Rates Per Thousand Population, Newfoundland and Labrador, 1921 to 1992
A-3 Population By Selected Age Groups and Sex, Newfoundland and Labrador, For Selected Years 1935 to 1991.
A-4 Population By Marital Status, Newfoundland and Labrador, For Census Years 1901 to 1991
A-5 Population, By Religious Denomination, Newfoundland and Labrador, For Selected Years 1857 to 1991
A-6 Population, By Census Division and Sex, Newfoundland and Labrador, 1951, 1961, 1971, 1981, 1986 and 1991
A-7 Population, By Federal Electoral District, Newfoundland and Labrador, 1976, 1981, 1986 and 1991
A-8 Households By Type and Number of Persons Per Household, Newfoundland and Labrador, 1966, 1971, 1976, 1981, 1986 & 1991
A-9 Population of Incorporated Cities, Towns and Communities, Newfoundland and Labrador, 1951-1991
A-10 Families By Family Structure, Newfoundland and Labrador, 1976, 1981, 1986 and 1991
A-11 Families By Age Groups of Children at Home, Newfoundland and Labrador, 1976, 1981, 1986 and 1991
B-1 Number of Physicians, Dentists and Registered Nurses, Per 1,000 Population, Newfoundland - Labrador, 1968 to 1991
B-2 Selected Statistics of Operating Hospitals, Newfoundland and Labrador, 1953 to 1991
B-3 Selected Statistics on Social Assistance Cases, Newfoundland and Labrador, For Month of March, 1973 to 1993
B-4 Family Allowance and Child Tax Credit Statistics, Newfoundland and Labrador, Fiscal Years 1949-50 to 1991-92
B-5 Old Age Security and Guaranteed Income Supplement Statistics, Newfoundland, Fiscal Years 1951-52 to 1992-93
B-6 Number of Beneficiaries Under the Canada Pension Plan, By Type of Benefit, Newfoundland and Labrador, For Month of March, 1967 to 1993
page viii
C-1 Labour Force Characteristics, Newfoundland and Labrador, Annual Averages, 1966 to 1993
C-2 Labour Force Characteristics for Males and Females, Newfoundland and Labrador, 1975 to 1993.
C-3 Labour Force, By Age Group and Set, Newfoundland and Labrador, 1951, 1961, 1971, 1976, 1981, 1986 and 1991
C-4 Labour Force By Occupation Group, Newfoundland and Labrador, 1971, 1981, 1986 and 1991
C-5 Labour Force 15 Years and Over by Industry Divisions, Newfoundland and Labrador, 1986 and 1991
C-6 Employed Labour Force by Industry, Newfoundland and Labrador, 1975 to 1993
C-7 Unemployment Rate and Participation Rate, For St. John's CMA and Economic Regions, Newfoundland and Labrador, 1975 to 1993
C-8 Full-Time and Part-Time Employment by Sex, Newfoundland and Labrador, 1975 to 1993
C-9 Duration of Unemployment, Newfoundland and Labrador, 1975 to 1993
C-10 Unemployment & Persons Not in the Labour Force Who Want Work & Are Available for Work by Reason For Not Seeking Work, Newfoundland and Labrador, March 1979 to 1993
C-11 Employment by Class of Worker, Newfoundland and Labrador, 1975 to 1993
D-1 Wages and Salaries Including Retro Active Payments and Supplementary Labour Income, By Industry, Newfoundland and Labrador 1950-1992
D-2 Average Weekly Earnings by Industry, Annual Averages, Newfoundland and Labrador, 1957 to 1992
D-3 Value of Unemployment Insurance Contributions & Benefits and Number of Contributors and Total and Average Number of Beneficiaries, Newfoundland and Labrador, 1949 to 1992
D-4 Minimum Wage Rate for Employees, Newfoundland and Labrador, 1953 to 1991
D-5 Number of Workers Involved and Duration in Person-Days of Strikes and Lockouts, Newfoundland and Labrador, 1950 to 1993
D-6 Basic Union Wage Rates for Major Construction Trades and Index for Wage Composite, St. John's, 1961 to 1992
E-1 Enrolment in Public Schools, By Grade, Newfoundland & Labrador, 1924-25 to 1991-92
E-2 Teachers By Certificate For Selected Years 1955-56 to 1991-92
E-3 Enrolment, Memorial University of Newfoundland, 1949-50 to 1992-93
E-4 Degrees and Diplomas Granted by Memorial University of Newfoundland, 1950 to 1992

SO
INIP
SO
SS
OO
SS
IIS
SO
OM
OS
OS
OS
SO
OS
OS
SO
OO
SO
OS
OS
O
page ix
F-1 Provincial Income and Provincial Gross Domestic Product, Newfoundland - Labrador, For Selected Years 1961 to 1992
F-2 Personal Disposable Income and Personal Income and Its Main Components, Newfoundland and Labrador, in Current Dollars, For Selected Years 1951 to 1992
F-3 Per Capita Personal Disposable Income and Personal Income and Its Main Components, Newfoundland and Labrador, In Current Dollars, For Selected Years 1951 to 1992
F-4 Gross Domestic Product at Factor Cost, By Sector, Newfoundland and Labrador, For Selected Years 1971- 1992
F-5 Percentage Distribution of Census Families by Income Group, Newfoundland and Labrador, For Selected Years, 1971 to 1991
F-6 Gross Domestic Product by Type of Expenditure, Newfoundland and Labrador, 1961 to 1992
F-7 Government Revenue, Expenditure & Surplus or Deficit, By Level of Government, Newfoundland and Labrador, For Selected Yeas 1961 to 1991
G-1 Gross Revenue, Current and Capital Accounts, Government of Newfoundland and Labrador, By Type and Major Source, 1949-50 to 1994-95
G-2 Gross Current and Capital Account Expenditures, Government of Newfoundland and Labrador, By Department, 1993-94 and 1994-95
G-3 Gross Current and Capital Account Expenditures, By Function, Government of Newfoundland and Labrador, For Selected Years, 1949-50 to 1994-95
G-4 Debt Position, Province of Newfoundland, As At March 31, 1950 to 1993
G-5 Rates of Selected Taxes, Government of Newfoundland and Labrador, 1949 to 1994
H-1 Number of Taxpayers, Total Income, Total Tax, By Income Classes, Newfoundland and Labrador, For Selected Years, 1950 to 1990
H-2 Taxable Returns, Sources of Income, Allowable Deductions, and Total Tax Payable, Newfoundland and Labrador, For Selected Years, 1950 to 1990
H-3 Number of Taxpayers, Total Income and Total Tax, By Occupational Classes, Newfoundland and Labrador, For Selected Years, 1950 to 1990
H-41 Taxable Corporation Income, By Industry, Newfoundland and Labrador, For Selected Years 1960 to 1992
OlI
SO
IPO
OM
OSII
IIS
SS
OS
SO
OS
SO
SS
OS
SM
III
SO
SOM
O
page x
1-1 Total and Main Components of the Consumer Price Index, St. John's, By Annual Averages, 1952 to 1993
1-2 Urban FamilyExpenditure, St. John's, For Selected Years 1969 - 1992
1-3 Survey of House Prices, St. John's, April 1974 to April 1994
1-1 Selected Statistics of Census Farms, Newfoundland and Labrador, For Census Years 1951 - 1991
J-2 Census Farms Sales By Total Capital Value, Newfoundland and Labrador, For Census Years 1961 - 1991
J-3 Census Farms By Acreage, Newfoundland and Labrador, For Census Years 1951 - 1991
J-4 Livestock and Poultry on Census Farms, Newfoundland and Labrador, For Census Years 1951 - 1991
J-5 Census Farms With Sales of $2,500 or More, By Type, Newfoundland and Labrador, For Census Years 1961 -1991
J-6 Census Farms By Economic Class, Newfoundland and Labrador, For Census Years 1961 - 1991
J-7 Farm Cash Income, Newfoundland and Labrador, 1972 to 1992
K-1 Quantity of Fish Landings, By Species, Newfoundland and Labraor, For Selected Years, 1955 to 1993
K-2 Value of Fish Landings, By Species, Newfoundland and Labrador, For Selected Years, 1955 to 1993
K-3 Quantity of Fish Products, By Type, Newfoundland and Labrador, For Selected Years, 1960 to 1987
K-4 Value of Fish Products, By Type, Newfoundland and Labrador, For Selected Years, 1960 to 1987
K-5 Value of Fish Products, By Species, Newfoundland and Labrador, For Selected Years, 1955 to 1987
K-6 Amount of Exports and Value of Salted Cod, Newfoundland and Labrador, For Selected Years, 1804 to 1993
K-7 Number of Fishermen, Newfoundland and Labrador, For Selected Years, 1961 to 1993
K-8 Average Price Received by Fishermen, For Selected Species, Newfoundland and Labrador, 1955 to 1993
L-1 Principal Statistics of the Logging Industry, Newfoundland and Labrador, 1963 to 1991
L-2 Estimated Forest Production, Newfoundland and Labrador, For Selected Years, 1949 to 1991
L-3 Number of Sawmills Licenced and Sawmill Production, Newfoundland and Labrador, For Selected Years, 1934 to 1992/93
L-4 Volume and Estimated Value of Newsprint Shipments, Newfoundland and Labrador, 1970 to 1993
L-5 Selected Forestry Revenue, Newfoundland & Labrador, Fiscal Years, 1961-62 to 1992-93
a • page xi
a a O M-1 Quantities and Values of Minerals Shipped By Type, Newfoundland and Labrador, 1949 to 1993
• M-2 Value of Mineral Shipments By Mineral Class, Newfoundland and Labrador, 1949 to 1993
O
III M-3 Principal Statistics of the Mineral Industries (Mining Activity) Newfoundland and Labrador, 1961 to 1991
IIII M-4 Annual Expenditures on Mineral Exploration, Newfoundland and Labrador, 1949 to 1993
III M-5 Employment and Earnings, Mining Industry, Total Activity By Mineral Class, Newfoundland and Labrador,
ID 1949 to 1991
0 O N-1 Selected Statistics, All Manufacturing Industries, Newfoundland and Labrador, 1957 to 1993
• N-2 Selected Statistics of Manufacturing Industries, Total - Food and Beverage Industries, Newfoundland and
III Labrador, 1957 to 1993
• N-3 Selected Statistics of Manufacturing Industries, Fish Products Industries, Newfoundland and Labrador, 1957
III to 1993
0 N-4 Selected Statistics of Manufacturing Industries, Total - Wood Industries, Newfoundland and Labrador , 1957
ID to 1993
. N-5 Selected Statistics of Manufacturing Industries, Sawmills and Planing Mills., Newfoundland and Labrador, . 1957 to 1993
0 N-6 Selected Statistics of Manufacturing Industries, Pulp and Paper Mills, Newfoundland and Labrador, 1957 to 1993
0 al N-7 Selected Statistics of Manufacturing Industries, Total - Printing, Publishing and Allied Industries,
is Newfoundland and Labrador, 1957 to 1993
1111 N-8 Selected Statistics of Manufacturing Industries, Total - Non-Metallic Mineral Proudcts, Newfoundland and Labrador, 1957 to 1993
0
0 N-9 Selected Statistics of Manufacturing Industries, Metal Fabricating Industries, Newfoundland and Labrador,
1967 to 1993
0 0
N-10 Selected Statistics of Manufacturing Industries, Chemicals and Chemical Products Industries, Newfoundland and Labrador, 1967 to 1993
0 N-11 Selected Statistics of Manufacturing Industries, Total - Transportation Equipment Industries, Newfoundland
0 and Labrador, 1957 to 1993
al N-12 Selected Statistics on Interprovincial Trade of Manufactured Goods, Newfoundland and Labrador, 1974,
II 1979, 1984 & 1989
0 0 0 0 e 0 e fa
a e a al 0 0 0 0 0 0 • 0 al 0 0 a 0 a 0 is 0 0 0 al 0 0 0 0 0 0 • is 0 0 • • • 0 a • 0 • 0
page xii
0-1 Private and Public Investment, By Sector, Newfoundland and Labrador, 1991- 1994
0-1A Private and Public Investment, By Sector, Newfoundland and Labrador, For Selected Years 1950-1994
P-1 Principal Statistics of Construction Activity, Newfoundland and Labrador, 1951 to 1993
P-2 Dwelling Starts By Type, Completions and Under Construction, Newfoundland and Labrador, 1949 to 1993
P-3 Occupied Dwellings Showing Period of Construction, Newfoundland and Labrador, 1961, 1971, 1981, 1986 and 1991
P-4 Occupied Dwellings By Type of Structure and Tenure, Newfoundland and Labrador, 1951, 1961, 1966, 1971, 1976, 1981, 1986 and 1991
P-5 Single Detached Owner-Occupied Dwellings, Non-Farm, Non Reserve Dwellings, By Value, Newfoundland and Labrador, 1981, 1986 and 1991
P-6 Occupied Dwellings by Number of Persons Per Room, Newfoundland and Labrador, for Selected Years 1951 to 1991
P-7 Households By Type, Newfoundland and Labrador, 1951 to 1991
Q-1 Highway Kilometers, Newfoundland and Labrador, 1950 to 1993
Q-2 No Longer Available
Q-3 Number of Motor Vehicles and Drivers Licenses Registered, Newfoundland and Labrador, 1966 to 1992
Q-4 No Longer Available
Q-5 Total Air Passengers on Domestic and Transborder Flights, Newfoundland and Labrador, 1970-1992
Q-6 Total Air Passengers on International Chartered & International Scheduled Flights, Newfoundland and Labrador, 1970-1992
Q-7 Tonnage of Selected Commodities Loaded and Unloaded in Coastwise Shipping, Newfoundland and Labrador, 1969-1992
R-1 Telephones in Use, By Type of Service, Newfoundland and Labrador, For Selected Years, 1950 to 1991
R-2 Selected Statistics of the Telephone Industry, Newfoundland and Labrador, For Selected Years, 1950 to 1992
R-3 Number of Post Offices in Operation, Newfoundland and Labrador, For Selected Years, 1950 to 1994

OS
OO
MIP
OO
SO
SO
OO
11
1O
OO
OS
O0101M
OO
MO
11••••
page xiii
S-1 Supply and Disposal of Electric Energy, Newfoundland and Labrador, For Selected Years 1955 to 1993
S-2 Installed Generating Capacity, Electric Utilities and Industrial Establishments, Newfoundland and Labrador, 1956 to 1991
S-3 Selected Statistics of Electric Energy Sold to Residential and Agriculture, Newfoundland and Labrador, 1949 to 1991
S-4 Quantity and Value of Fuel Used by Utilities to Generate Electricity, Newfoundland and Labrador, 1956 to 1991
S-5 Employment and Wages and Salaries, Public and Privately Operated Electric Utilities, Newfoundland and Labrador, 1949 to 1991
S-6 Consumption of Petroleum Products for Energy Use, Electricity and Coal, Newfoundland and Labrador, 1963 to 1992
S-7 Number of Occupied Dwellings by Principal Heating Fuel, Newfoundland and Labrador, 1951 to 1992
T-1 Retail Trade, By Business Group, Newfoundland and Labrador, 1951, 1961, 1966 and 1971 to 1992
T-2 Number and Value of New Motor Vehicle Sales, By Type, Newfoundland and Labrador, 1952 to 1993
T-3 Volume and Value of Sales of Alcoholic Beverages, Newfoundland and Labrador, 1950-1992
T-4 Estimated Restaurant Receipts, Newfoundland and Labrador, by Kind of Business, 1978 to 1993
T-5 Number and Volume of Trade of Wholesale Trade Locations, By Business Group, Newfoundland and Labrador, 1971 & 1981 to 1989
T-6 Exports by Province of Origin (Lading), Newfoundland and Labrador, 1972 to 1992
T-7 Imports by Province of Clearance, Newfoundland and Labrador, 1972 to 1992
T-8 Value of Exports - Imports, Newfoundland and Labrador, 1949 to 1993
U-1 Number of Licenced Tourist Establishments and Number of Accommodation Units, Newfoundland and Labrador, 1984 to 1993
U-2 Inland Fishery, 'Wildlife Hunting, Licences, Newfoundland and Labrador, 1970 to 1992

III
SS
IPO
SS
OS
IS
IDO
SO
SO
SO
SIIM
OI
IIP
OS
OS
OM
OO
1101
01
1
page xiv
V-I Lieutenant-Governors, Newfoundland and Labrador, 1949 to 1991
V-2 Selected Statistics of Provincial Elections, Newfoundland and Labrador, 1949 to 1993
V-3 Selected Statistics of Federal Elections, Newfoundland and Labrador, 1949-1993
V-4 Local Government Employment, Newfoundland and Labrador, 1968 to 1992
V-5 Provincial Government Employment, Newfoundland and Labrador, 1968-1992
V-6 Federal Government Employment, Newfoundland and Labrador, 1968-1992
W-1 Selected Traffic Offences and Traffic Accident Statistics, Newfoundland and Labrador, 1985 to 1992
W-2 Selected Cyfences, Newfoundland and Labrador, 1983 to 1992
X-1 Normal Temperatures for St. John's, Gander and Goose Bay
X-2 Normal Degree Days Below 18°C and Normal Hours of Sunshine for St. John's, Gander and Goose Bay
X-3 Normal Precipitation and Wind Speed for St. John's, Gander and Goose Bay
Y-1 Business Births and Deaths, Newfoundland and Labrador, 1978 to 1992
Y-2 Bankruptcies by Month, Newfoundland, January 1988 to December 1993

1991 CENSUS CONSOLIDATED SUBDIVISION (CCS) BOUNDARIES
• • • • • • • • • • • • • • • • • • • • • • • • • • • • • • • • • • • • • • 0 • • • •
page xv

• • • • • • • • • • • • • • • •
•
• • • • • •
SECTION A
POPULATION AND VITAL STATISTICS
• • • • • • • • • • • • • • • • • • • •
SO
OS
SIIS
SM
OO
SII
IIS
OS
SO
OS
OS
OID
OO
OS
SO
OO
OS
IDO
OO
SO
SECTION 'A"
TABLE A-1
Population
De jure (resident) population as enumerated in Census years.
TABLE A-2
See Table A-1
Births
Infants born alive, i.e. excluding stillbirths.
Deaths
Deaths excluding stillbirths.
Net Natural Increase
Net natural increase is calculated by subtracting births from deaths.
TABLE A-3
See Table A-1
Age
Age classifications in the census are based on a definition which specifies completed years of age at last birthday prior to the census date.
TABLE A-4
See Table A-1

page 2
Marital Status
Refers to the conjugal stains of a person.
Single: Persons who never married (including all persons less than 15 years) and persons whose marriage was annulled.
Married: Persons whose husband or wife is living, unless the couple are separated or a divorce has been obtained; persons living common-law are considered as Wow Married".
Widowed: Persons who have lost their spouse through death and who have not remarried.
Divorced: Persons who have obtained a legal divorce and have not remarried.
Separated: Persons who have been deserted or who have parted because they no longer want to live together, but have not obtained a divorce. They may or may not be legally separated.
TABLE A-5
See Table A-1
TABLE A-6
See Table A-1
Census Division
Statistical areas that have been created as an equivalent for counties and delineated by Statistics Canada in co-operation with the province. There are ten Census Divisions in Newfoundland. See map section.
TABLE A-7
See Table A-1
• s a a • a r 0 a S a S al a al a 0 a a) al 0 • so • s • • al • a a • a a • S a • a • a a
O•
11.
0111
111 •
011
1 111111•1
111M
OO
OM
OID
OM
OO
OM
OO
SS
O
page 3
TABLE A-8
Household
A person or a group of persons occupying one dwelling unit is defined as a household. The number of households will therefore be equal to the number of occupied dwellings. See notes in Table P-2 for definition of "dwelling".
TABLE A-9
See Table A-1
TABLE A-10
Family
Refers to a husband and a wife (with or without children who have never married, regardless of age), or a lone parent of any marital status, with one or more children who have never married, regardless or age, living in the same dwelling. For census purposes, persons living in a common-law type of arrangement are considered as now married, regardless of their legal marital status.
TABLE A-11
See Table A-10
Children
Child refers to sons and daughters (including adopted children and stepchildren) who have never married, regardless of age, and are living in the same dwelling as their parent(s). Sons and daughters who have ever been married are not considered as members of their parents' family, even though they are living in the same dwelling.
OS
O01
111 1
01
19
00.
96
0•1
11
11
11
1O
OM
OO
OO
MO
SO
11
11
011
1111
90
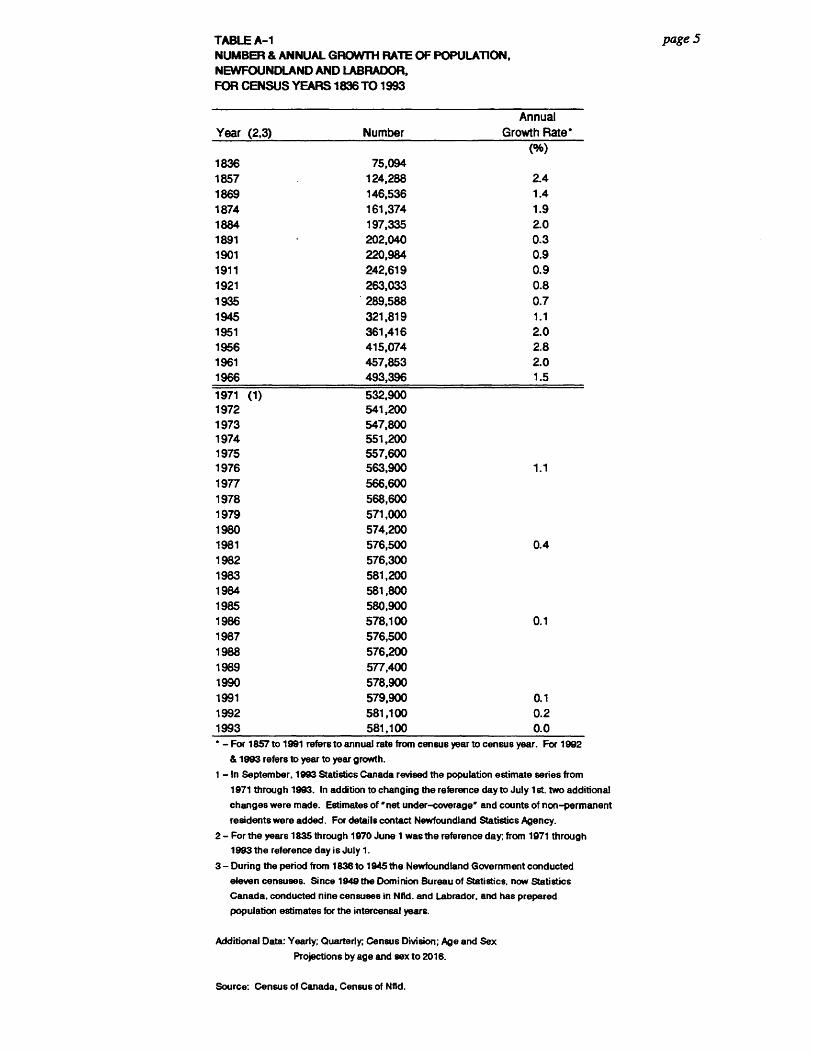
page 5 TABLE A-1 NUMBER & ANNUAL GROWTH RATE OF POPULATION, NEWFOUNDLAND AND LABRADOR. FOR CENSUS YEARS 1836 TO 1993
Annual Year (2,3) Number Growth Rate'
(%) 1836 75,094 1857 124,288 2.4 1869 146,536 1.4 1874 161,374 1.9 1884 197,335 2.0 1891 202,040 0.3 1901 220,984 0.9 1911 242,619 0.9 1921 263,033 0.8 1935 289,588 0.7 1945 321,819 1.1 1951 361,416 2.0 1956 415,074 2.8 1961 457,853 2.0 1966 493,396 1.5
1971 (1) 532,900 1972 541,200 1973 547,800 1974 551,200 1975 557,600 1976 563,900 1.1 1977 566,600 1978 568,600 1979 571,000 1980 574,200 1981 576,500 0.4 1982 576,300 1983 581,200 1984 581,800 1985 580,900 1986 578,100 0.1 1987 576,500 1988 576,200 1989 577,400 1990 578,900 1991 579,900 0.1 1992 581,100 0.2 1993 581,100 0.0 • - For 1857 to 1991 refers to annual rate from census year to census year. For 1992
& 1993 refers to year to year growth.
1 - In September. 1993 Statistics Canada revised the population estimate series from
1971 through 1993. In addition to changing the reference day to July 1st. two additional
changes were made. Estimates of 'net under-coverage" and counts of non-permanent
residents were added. For details contact Newfoundland Statistics Agency.
2 - For the years 1835 through 1970 June 1 was the reference day; from 1971 through 1993 the reference day is July 1.
3 - During the period from 1836 to 1945 the Newfoundland Government conducted
eleven censuses. Since 1949 the Dominion Bureau of Statistics, now Statistics Canada, conducted nine censuses in Nfld. and Labrador, and has prepared population estimates for the intercensal years.
Additional Data: Yearly; Quarterly; Census Division; Age and Sex
Projections by age and sex to 2016.
Source: Census of Canada, Census of Nfld.

911
110
1111
110
1111
1111
1111
SOO
MO
SS
OIS
SID
OS
SO
OM
MO
SS
O
page 6
TABLE A-2 BIRTHS, DEATHS, NET NATURAL INCREASE, MARRIAGES, DIVORCES AND RATES PER THOUSAND POPULATION, NEWFOUNDLAND AND LABRADOR, 1921 TO 1992
Net Natural
Birth Rate Death Rate Net Increase Rate Marriage Rate Divorce Rate
(Per Thousand (Per Thousand Natural (Per Thousand (Per Thousand Ter 100,000
Year Births Population) Deaths Population) Increase Population) Marriages Population) Divorces Population)
1921 7,151 272 3,376 12.8 3,775 14.4 1,522 6.7
1931 6,661 23.3 3,757 13.4 2,794 9.9 1,588 6.6
1936 7,342 252 3,802 13.0 3,540 12.1 1,943 6.6
1937 7,340 25.0 3,967 13.5 3,373 11.5 2,101 7.1
1938 7,343 24.8 3,586 12.1 3,757 12.7 2,172 7.3
1939 8,226 27.5 3,502 11.7 4,724 15.8 2,492 8.3
1940 7,937 26.3 3,547 11.8 4,390 14.6 2,331 7.7
1941 8,268 27.3 3,784 12.5 4,504 14.8 2,684 8.7
1942 8,791 28.6 3,802 12.3 4,989 16.2 3,289 10.6
1943 8,861 28.3 3,581 11.4 5,280 16.9 2,729 8.7
1944 9,295 29.4 3,892 12.3 5,403 17.1 3,000 9.5
1945 11,223 34.9 3,348 10.4 7,877 24.6 3,154 9.8
1946 12,033 36.5 3,427 10.4 8,806 26.1 3,067 9.3
1947 12,646 37.5 3,325 9.9 9,321 27.7 2,917 8.7
1948 11,634 33.8 3,108 9.0 8,526 24.8 2,610 7.6
1949 12,281 35.6 2,868 8.3 9,413 27.0 2,445 7.1 .. ..
1950 13,164 37.5 3,168 9.0 9,996 28.5 2,515 7.2 5 1.4
1951 11,738 32.5 3,004 8.3 8,734 24.2 2,517 7.0 4 1.1
1952 12,561 33.6 2,773 7.4 9,788 26.2 2,730 7.3 3 0.8
1953 12,797 33.4 2,733 7.1 10,064 26.3 2,771 7.2 9 2.3
1954 13,653 34.6 2,916 7.4 10,737 27.2 2,952 7.5 8 2.0
1955 14,757 36.3 3,206 7.9 11,551 28.5 3,211 7.9 1 02
1956 14,541 35.0 3,058 7.4 11,483 27.7 3,073 7.4 5 1.2
1967 15,315 36.1 3,198 7.5 12,117 28.8 3,041 7.2 6 1.4
1958 14,815 34.3 3,122 7.2 11,693 27.1 3,047 7.1 7 1.8
1959 14,826 33.6 3,179 7.2 11,847 26.4 2,893 6.6 1 0.2
1960 15,173 33.9 3,015 6.7 12,158 27.1 3,104 6.9 6 1.3
1961 15,591 34.1 3,038 6.6 12,553 27.4 3,306 7.2 6 1.3
1962 15,064 32.2 3.198 8.8 11,886 25.4 3,274 7.0 0 0.0
1963 15,443 32.4 3,183 6.7 12,280 25.8 3,280 6.9 8 1.7
1964 14,680 30.4 3,083 6.3 11,617 24.1 3,385 7.0 7 1.4
1965 14,740 30.2 3,230 6.6 11,510 23.8 3,412 7.0 3 0.6
1986 14,084 28.5 3,072 6.2 11,012 22.3 3,728 7.6 11 2.2
1967 12,844 25.7 3,117 6.2 9,727 19.5 4,021 8.0 11 2.2
1968 12,820 25.3 3,123 6.2 9,897 19.2 4,242 8.4 15 3.0
1969 13,000 25.3 3,005 6.8 9,996 19.4 4,279 8.3 103 20.0
1970 12,539 24.3 3,294 8.4 9,245 17.9 4,466 8.6 140 27.1
1971 12,767 24.5 3,199 6.1 9,568 18.3 4,685 9.0 150 28.7
1972 12,898 24.3 3,349 8.3 9,549 18.0 5,106 9.6 177 33.3
1973 11,906 22.2 3,405 6.3 9,496 15.8 5,048 9.3 224 41.4
1974 11,504 21.2 3,288 6.1 8,501 15.2 4,276 7.9 301 55.5
1975 11,213 20.4 3,219 5.9 7,994 14.8 4,313 7.8 380 69.2
1976 11,130 20.0 3,323 8.0 7,807 14.0 4,171 7.5 424 76.0
1977 11,110 19.8 3,138 5.8 7,972 14.2 3,895 6.9 456 80.8
1978 10,480 18.4 3,115 5.5 7,365 13.1 3,841 6.8 427 75.0
1979 10,170 17.7 3,138 5.5 7,034 12.5 3,737 6.5 483 84.2
1980 10,332 17.8 3,345 5.8 8,987 12.4 3,783 6.5 555 95.8
1981 10,130 17.8 3,230 5.7 8,900 12.2 3,758 6.6 569 100.2 1982 9,173 16.1 3,385 5.9 5,788 10.2 3,764 6.5 625 109.8
1983 8,929 15.4 3,498 6.1 5,431 9.6 3,778 6.5 711 123.0
1984 8,560 14.8 3,520 6.1 5,040 8.8 3,667 6.2 590 101.8
1985 8,500 ' 14.6 3,557 6.1 4,943 8.8 3,220 5.5 561 96.6
1988 8,100 • 14.2 3,540 8.2 4,680 8.0 3,421 6.0 610 107.3
1987 7,769 • 13.7 3,629 6.4 4,140 7.3 3,481 6.1 1,002 176.3
1988 7,487 ' 13.2 3,591 6.3 3,896 6.8 3,260 6.5 884 155.6
1989 7.762 * 13.6 3,718 6.5 4,044 7.1 3,906 8.8 981 171.8
1990 7,804 • 13.3 3,884 6.8 3,720 6.5 3,791 8.6 1,006 175.6
1991 7,166 12.5 3,798 6.6 3,368 5.9 3,480 6.0
1992 7,510 13.0 3,850 6.7 3,660 6.3 3,350 5.8
* - Adjusted for undercount.
Additional Data: Year of Registration; Provincial Electoral Districts, Census Division, Selected Incorporated Communities; Mortality Rates.
Source: Statistics Canada, 82-548, 82-652, 82-663, 82-003S#17, 91-213
11•
1111
SO
OS
OM
OS
OS
I IM
OS
SO
OM
MO
SS
III I
IIM
OS
O
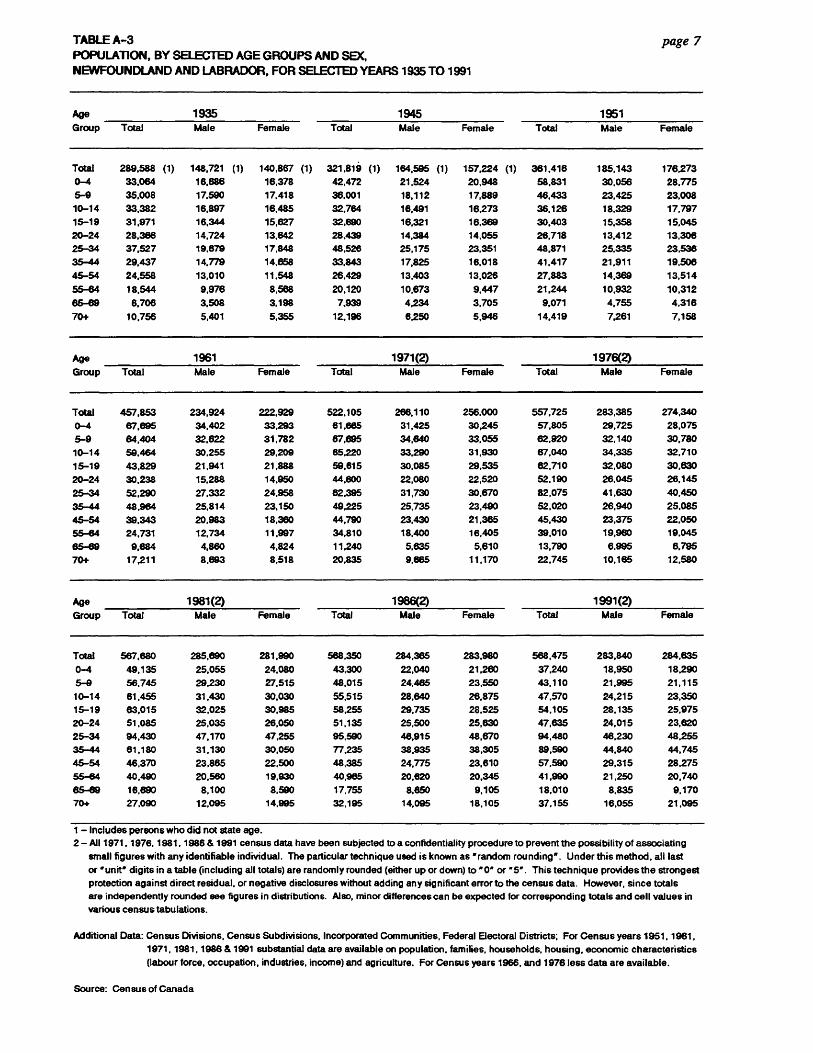
TABLE A-3
page 7 POPULATION, BY SELECTED AGE GROUPS AND SEX, NEWFOUNDLAND AND LABRADOR, FOR SELECTED YEARS 1935 TO 1991
Age 1935 1945 1951 Group Total Male Female Total Male Female Total Male Female
Total 289,588 (1) 148,721 (1) 140,867 (1) 321,819 (1) 164,595 (1) 157,224 (1) 361,416 185,143 176273
0-4 33,064 16,886 16.378 42.472 21,524 20,948 58.831 30,056 28.775
5-9 35,008 17,590 17,418 36,001 18,112 17,889 46,433 23,425 23,008
10-14 33,382 16,897 16,485 32,764 18,491 16,273 36,126 18,329 17,797
15-19 31,971 16,344 15,627 32,690 16,321 16,369 30,403 15,358 15,045
20-24 28,366 14,724 13,642 28,439 14,384 14,055 26.718 13,412 13,306
25-34 37,527 19,679 17,848 48,526 25,175 23,351 48,871 25,335 23,538
35-44 29,437 14,779 14,658 33,843 17,825 16,018 41,417 21,911 19,506
45-54 24,558 13,010 11,548 26,429 13,403 13,026 27,883 14,369 13,514
55-64 18,544 9,976 8,568 20,120 10,673 9.447 21,244 10,932 10,312
85-89 8,706 3,508 3,198 7.939 4,234 3,705 9,071 4,755 4,316
70+ 10,756 5,401 5,355 12,196 6,250 5,946 14.419 7,261 7,158
Age 1961 1971(2) 1976(2) Group Total Male Female Total Male Female Total Male Female
Total 457,853 234,924 222,929 522.105 286,110 256,000 557,725 283,385 274,340
0-4 67,695 34,402 33,293 61,6e5 31,425 30,245 57,805 29,725 28,075
5-9 64,404 32,822 31,782 67,695 34,640 33,055 82,920 32,140 30,780
10-14 59,464 30,255 29,209 85,220 33,290 31,930 87,040 34,335 32,710
15-19 43,829 21,941 21,888 59,615 30,085 29,535 62,710 32,080 30,630
20-24 30,238 15,288 14,950 44,800 22,080 22,520 52,190 26,045 26,145
25-34 52,290 27,332 24,958 62,395 31,730 30.670 82,075 41,630 40,450
35-44 48,964 25,814 23,150 49,225 25,735 23.490 52,020 26,940 25.085
45-54 39,343 20,983 18,360 44,790 23,430 21,385 45.430 23,375 22,050
55-64 24,731 12,734 11,997 34,810 18,400 18,405 39,010 19,960 19,045
65-69 9,884 4,860 4,824 11,240 5,635 5,610 13,790 6,995 6,795
70+ 17,211 8,893 8,518 20,835 9,885 11,170 22,745 10,165 12.580
Age 1981(2) 1986(2) 1991(2) Group Total Male Female Total Male Female Total Male Female
Total 587,680 285,890 281,990 568,350 284,365 283,980 568,475 283,840 284,635
0-4 49,135 25,055 24,080 43,300 22,040 21,260 37,240 18,950 18,290
5-9 56,745 29,230 27,515 48,015 24,465 23,550 43,110 21,995 21,115
10-14 61,455 31,430 30,030 55,515 28,640 26,875 47.570 24.215 23.350
15-19 63,015 32,025 30,985 58,255 29,735 28.525 54,105 28,135 25,975
20-24 51,085 25,035 26,050 51,135 25,500 25,630 47,635 24,015 23,620
25-34 94,430 47,170 47,255 95,590 48,915 48,870 94,480 48,230 48,255
35-44 61,180 31,130 30,050 77,235 38,935 38,305 89,590 44,840 44,745
4.5-54 46,370 23,865 22,500 48,385 24,775 23,610 57,590 29,315 28,275
55-64 40,490 20,560 19,930 40,965 20,820 20,345 41,990 21,250 20,740
65-89 16,690 8,100 8,590 17,755 8,850 9,105 18,010 8,835 9,170
70+ 27,090 12,095 14,995 32,195 14,095 18,105 37,155 16,055 21,095
1 - Includes persons who did not state age.
2 - All 1971, 1978, 1981, 1986 & 1991 census data have been subjected to a confidentiality procedure to prevent the possibility of associating
small figures with any identifiable individual. The particular technique used is known as 'random rounding'. Under this method, all last
or 'unit" digits in a table (including all totals) are randomly rounded (either up or down) to "0" or '5'. This technique provides the strongest
protection against direct residual, or negative disclosures without adding any significant error to the census data. However, since totals
are independently rounded see figures in distributions. Also, minor differences can be expected for corresponding totals and cell values in
various census tabulations.
Additional Data: Census Divisions, Census Subdivisions, Incorporated Communities, Federal Electoral Districts; For Census years 1951, 1961,
1971, 1981, 1988 & 1991 substantial data are available on population, families, households, housing, economic characteristics
(labour force, occupation, industries, income) and agriculture. For Census years 1966, and 1976 less data are available.
Source: Census of Canada

page 8
TABLE A-4 POPULATION BY MARITAL STATUS, NEWFOUNDLAND AND LABRADOR, FOR CENSUS YEARS, 1901 TO 1991
Year Total - Single Married (1) idowed Divorced
1901 219,607 (2) 135,439 73,943 10,225
1911 242,619 145,426 85,690 11,503
1921 263,033 156,041 94,428 12,564
1935 289,588 173,312 102,236 14,040
1945 321,819 (3) 185,187 122,076 14,428 47
1951 361,416 207,622 138,422 15,303 69
1956 415,074 243,415 155,935 15,631 93
1961 457,853 271,855 169,724 16,145 129
1966 493,396 291,514 184,517 17,219 146
1971(4) 522,105 295,615 207,655 18,095 735
1976(4) 557,725 296,945 238,675 20,040 2,065
1981(4) 567,680 286,755 254,365 22,495 4,060
1986(4) 568,350 273,880 263,965 24,310 6,195
1991(4) 568,475 256,365 277,575 25,425 9,110
1 - Includes 'Separated' and "Common Law", which was first included as a separate item on the Census questionnaire in 1981. Until that time, only those who volunteered their common law status by filing in the 'other, please specify blank were considered as such.
2 - Exclusive of 1,377 residents of Labrador not available by marital status. 3 - 81 persons did not give marital status. 4 - See Note 2, Table A-3.
Additional Data: See Table A-3; Marriages and Divorces yearly. Projected Population by Sex and Age Group 2011.
Source: Census of Canada.
S
S
S
•
•
S S S S • • • • • •
• • page 9
• 0
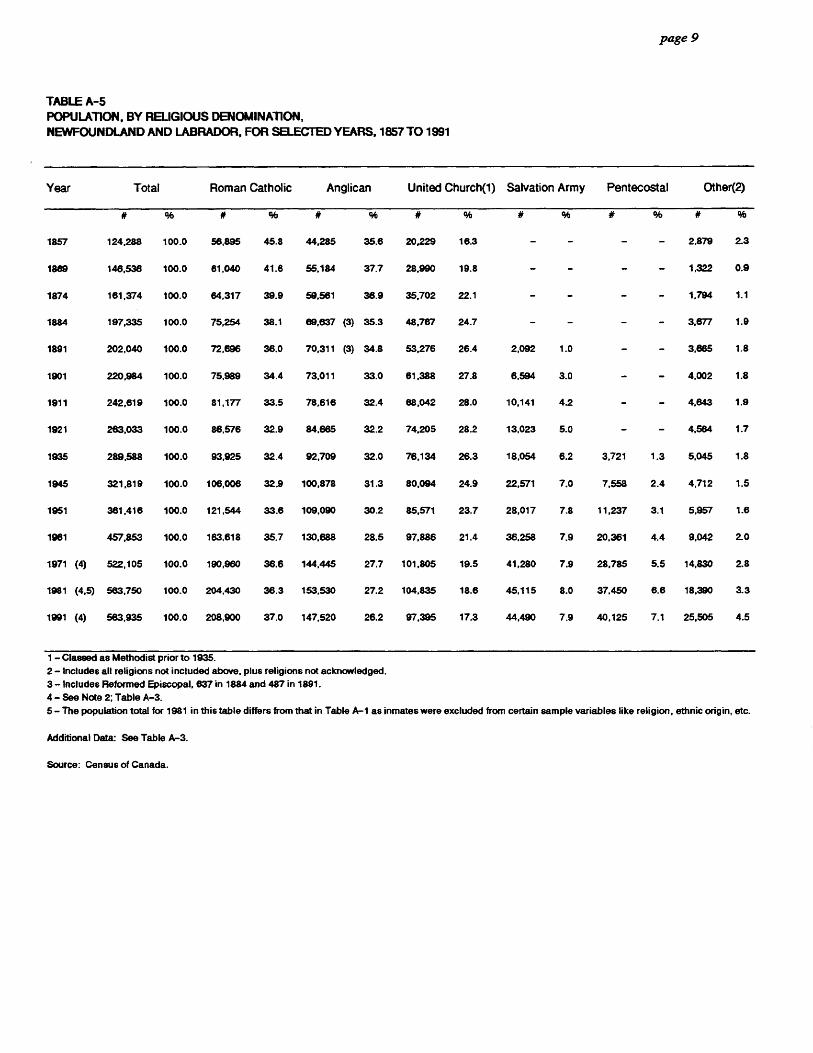
TABLE A-5 • POPULATION, BY RELIGIOUS DENOMINATION,
O NEWFOUNDLAND AND LABRADOR, FOR SELECTED YEARS, 1857 TO 1991
se le Year Total Roman Catholic Anglican United Church(1) Salvation Army Pentecostal Other(2)
0
II II II If/ IIII IIIII II .
III 0
II lb ID ID II II II
1 - Classed as Methodist prior to 1935.
41 2 - Includes all religions not included above, plus religions not acknowledged. 3 - Includes Reformed Episcopal, 637 in 1884 and 487 in 1891. 4 - See Note 2; Table A-3.
11111 5 - The population total for 1981 in this table differs from that in Table A-1 as inmates were excluded from certain sample variables like religion, ethnic origin, etc.
Additional Data See Table A-3.
Source: Census of Canada.
• 11111
•
* % # % # % # % # % # % # %
1857 124,288 100.0 56,895 45.8 44,285 35.6 20,229 16.3 - - - - 2,879 2.3
1889 146,536 100.0 61,040 41.6 55,184 37.7 28,990 19.8 - - - - 1,322 0.9
1874 161,374 100.0 84,317 39.9 59,561 36.9 35,702 22.1 - - - 1,794 1.1
1884 197,335 100.0 75,254 38.1 69,637 (3) 35.3 48,767 24.7 - - - - 3,677 1.9
1891 202,040 100.0 72,696 36.0 70,311 (3) 34.8 53,276 26A 2,092 1.0 - - 3,665 1.8
1901 220,984 100.0 75,989 34.4 73,011 33.0 61,388 27.8 6,594 3.0 4,002 1.8
1911 242,619 100.0 81,177 33.5 78,616 32.4 08,042 28.0 10,141 4.2 - - 4,843 1.9
1921 263,033 100.0 86,576 32.9 84,665 32.2 74,205 28.2 13,023 5.0 - - 4,564 1.7
1935 289,588 100.0 93,925 32.4 92,709 32.0 76,134 26.3 18,054 6.2 3,721 1.3 5,045 1.8
1945 321,819 100.0 106,006 32.9 100,878 31.3 80,094 24.9 22,571 7.0 7,558 2.4 4,712 1.5
1951 361,416 100.0 121,544 33.6 109,090 30.2 85,571 23.7 28,017 7.8 11,237 3.1 5,957 1.6
1961 457,853 100.0 163,818 35.7 130,688 28.5 97,886 21.4 36,258 7.9 20,361 4.4 9,042 2.0
1971 (4) 522,105 100.0 190,960 36.6 144,445 27.7 101,805 19.5 41,280 7.9 28,785 5.5 14,830 2.8
1981 (4,5) 563,750 100.0 204,430 36.3 153,530 27.2 104,835 18.6 45,115 8.0 37.450 6.6 18,390 3.3
1991 (4) 583,935 100.0 208,900 37.0 147,520 26.2 97,395 17.3 44,490 7.9 40,125 7.1 25,505 4.5

IDO
OM
OS
SO
OS
OM
OO
SO
OO
SS
OO
SIIS
OO
OM
OS
OS
OO
SS
page 20
TABLE A-6 POPULATION, BY CENSUS DMSION AND SEX, NEWFOUNDLAND AND LABRADOR, 1951, 1961,1971, 1981, 1986 & 1991
1951 1961 1971(1,2)
Census Division Total Male Female Total Male Female Total Male Female
1. Avalon Peninsula 149.543 74,476 75.067 188.904 95,045 93.859 214,380 107.490 108.890
2. Burin Peninsula 22,366 11,327 11,039 24.779 12,709 12,070 27,320 13.990 13,330
3. South Coast 20,434 10,665 9,789 23.299 12,044 11,255 24,515 12,455 12,060
4. St. George's 15,982 8,533 7,449 24,185 12,504 11,681 28,350 14,485 13,885
5. Humber District 28,089 14,424 13,665 39.086 19,832 19,254 44,880 22,860 22,015
6. Central Newfoundland 27,968 14,646 13,322 38,045 19,590 18,455 40,085 20,370 19,715
7. Bonavista/Trinity 35,294 18,279 17,015 39,652 20,687 18,965 40,575 20,870 19,705
8. Notre Dame Bay 36,799 19.257 17,542 44,659 23,439 21,220 50,690 26,225 24,465
9. Northern Peninsula 17,051 8,964 8,087 21,710 11,431 10,279 23,140 12,070 11,070
10. Labrador 7,890 4,572 3,318 13,534 7,843 5,891 28,165 15,290 12,875
Total 361,416 185,143 176,273 457,853 234,924 222,929 522,105 266.110 255,995
1981(2) 1986(2) 1991(2)
Census Division Total Male Female Total Male Female Total Male Female
1. Avalon Peninsula 239,410 118,710 120.700 246.149 121.520 124.625 253,200 124,605 128,595
2. Burin Peninsula 30,368 15,465 14,905 30,285 15,290 14,995 29,345 14,780 14,570
3. South Coast 26,209 13,335 12,875 25.737 13,080 12,655 24,240 12,310 11,930
4. St. George's 27,749 13,915 13,830 27,278 13,725 13,545 25,690 12,920 12,775
5. Humber District 46,901 23,530 23,370 45,648 22,680 22,970 45,315 22,480 22,855
6. Central Newfoundland 42,008 21,005 21,000 40,714 20,275 20,440 40,235 19,985 20,250
7. Bonavista/Trinity 43,438 22,140 21,305 43,618 22,070 21,550 43,170 21,850 21.320
8. Notre Dame Bay 54,542 27,975 26.565 54,225 27,640 26,585 51,880 26,475 25,405
9. Northern Peninsula 25,738 13,320 12,420 25,954 13,295 12,660 25,025 12,770 12,255
10. Labrador 31,318 16,295 15,020 28.741 14.785 13.955 30,375 15.895 14,680
Total 567,681 285,890 281,990 568,349 284,370 283,980 568,475 283,840 284,635
1 - Census Division boundaries changed between the 1966 and 1971 Census. See 1971 Census Map.
2- See Note 2. Table A-3.
Additional Data: See Table A-3.
Source: Census of Canada.

•S
CI
SO
SII
SS
OS
IIII
SO
SO
OS
IIS
SO
I DO
SS
IIIIM
S•11911•••••
page 11
TABLE A-7 POPULATION, BY FEDERAL ELECTORAL DISTRICT NEWFOUNDLAND AND LABRADOR, 1976,1981, 1986 & 1991
Electoral District 1987 Representation Order(1)
1986 1991
Bonavista-Trinity-Conception 89,907 88,827
Burin-St. George's 83,299 79,263
Gander-Grand Falls 84,928 82,408
Humber-St. Barbe-Baie Verte 80,984 79,398
Labrador 28,741 30,379
St. John's East 106,299 109,064
St. John's West 94,191 99,135
Total 568,349 568,474
1976 Representation Order(1) Electoral District 1976 1981 1986
Bonavista-Trinity-Conception 73,990 76,672 77,449
Burin-St. George's 63,332 64,017 63,485
Gander-Twillingate 76,698 78,160 76,940
Grand Falls-White Bay-Labrador 81,331 78,877 75,874
Humber-Port au Port-St. Barbe 81,282 80,164 78,352
St. John's East 91,861 94,029 96,869
St. John's West 89,231 95,762 99,380
Total 557,725 567,681 568,349
1 - The Representation Order is prepared by the Chief Electoral Officer describing, naming and specifying the population of each electoral district established by the Electoral Boundaries Commission and sent to the Governor in Council. The electoral districts are usually revised every ten years after the results of the decennial census.
Source: Census of Canada.

page 12 • 0 a
TABLE A-8 •
HOUSEHOLDS BY TYPE AND NUMBER OF PERSONS PER HOUSEHOLD, -NEWFOUNDLAND AND LABRADOR, 1966, 1971, 1976, 1981, 1986 & 1991
0
• Average Number mi
IN of Persons
Per Household Ill 5
5.0
5.2 III 5.1
7.3 411 1.5 4111
5 4.6
4.9 5
4.7
7.2 11) 1.5
III
HOUSEHOLDS BY NUMBER OF PERSONS
Type of Household Total 1 2 3 4 5 6 7 8 9 10+
1966 All Households 96,632 4,505 14,571 14,190 15,098 13,378 10,871 7,789 5,465 3,934 6,831
Family households 90,065 13,111 13,812 14,990 13,324 10,842 7,772 5,458 3,930 6,828
One-family households 83,552 13,111 13,812 14,453 12,221 9,536 6,739 4,638 3,360 5,682
Two or more family households 6,513 - - - 537 1,103 1,306 1,033 818 570 1,146
Non-family households 6,567 4,505 1,480 378 108 54 29 17 9 4 3
1971(1) All Households 110,480 6,490 18,810 17,560 18,550 15,160 11,410 8,485 4,980 3,310 5,715
Family households 101,105 - 16,725 17,090 18.370 15,100 11,375 8,460 4,975 3,305 5,705
One-family households 94,485 16,725 17,090 17,800 13,895 9,985 7,285 4,245 2,780 4,670
Two or more family households 6,625 - 570 1,205 1,385 1,175 725 520 1,035
Non-family households 9.370 6,495 2,085 470 180 65 40 30 5 5 5
1976(1) All Households 131,665 8,980 25,075 23,865 25,580 18,365 12,450 6,795 4,340 2,570 3,635
Family households 118,655 - 22,210 23,125 25,305 18,275 12,420 6,785 4,335 2,570 3,635
One-family households 112.865 - 22,205 23,120 24,720 17,105 11,035 5,930 3,880 2,160 2,915
Two or more family households 5,790 - - - 590 1,175 1,385 860 650 405 720
Non-family households 13,010 8,980 2,865 750 270 90 30 10 10
1981(1) All Households 148,420 13,695 29,900 27,080 33,210 21,385 11,610 5,445 2,885 1,530 1,885
Family households 130,14.0 - 26,535 26,205 32,980 21,325 11,580 5,435 2,875 1,530 1,685
One family households 125,280 - 26,535 28,200 32,395 20,240 10,360 4,635 2,395 1,235 1,280
Two or more family households 4,860 - - 580 1.085 1,220 795 480 300 405
Non-family households 18,275 13,700 3,370 880 235 60 30 10 10 5 -
1986(1) All Households 159,080 16,220 33,425 30,580 39,175 22,735 10,035 3,780 1,650 815 690
Family households 137,625 29,610 29,580 38.900 22,655 10,005 3,750 1,645 810 690
One family households 133,240 29,610 29,560 38.290 21,570 8,805 3,075 1.285 590 450
Two or more family households 4,385 - 610 1,085 1,200 875 380 220 240
Non-family households 21,455 16,215 3,815 1,020 275 80 25 10 5
1991(1) All Households 174,495 21,415 42,895 36,450 42,575 20,515 7,135 2.255 770 295 200
Family households 147,080 38,455 35,380 42,260 20.405 7,095 2,245 770 290 195
One family households 143.510 38,455 35,380 41,585 19,390 6,100 1,745 565 190 120
Two or more family households 3,570 - 670 1,015 1,000 500 205 105 75
Non-family households 27,415 21,410 4,440 1.090 315 105 35 5 - -
• 4.1
4.4 5
4.3
6.9 5 1.5
ll
3.8 4111 4.1 - 4.0
6.5 5 1.3
41111
3.5 411 3.9
3.8 .
8.2 - 1.3
4111
3.2 411 3.6
3.5
5.8
1.3 III 1 - See Note 2, Table A-3. 4111 Additional Data: See Table A-3; Projected Households by Marital Status, Sex and Age Group of Head to 2001; Projected Families by Marital Status, Sex and Age Group
III of Head to 2001. 0
Source: Census of Canada. 5 • 41111 II II. 0
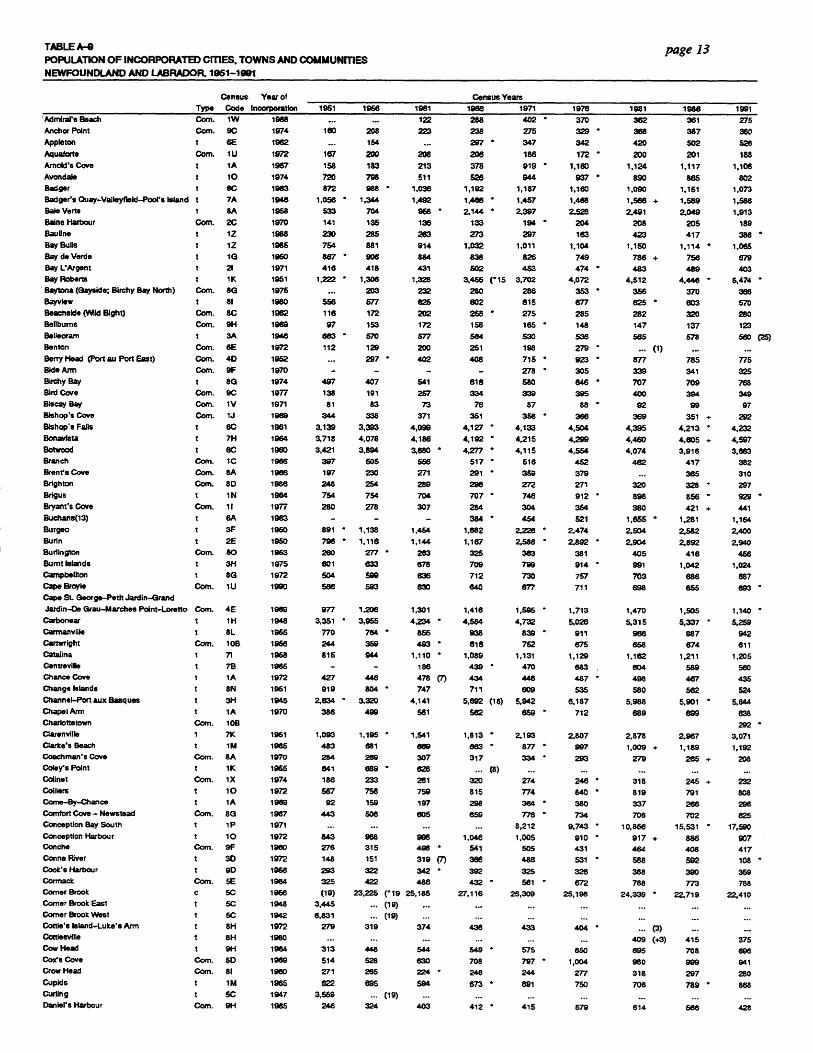
1111 -TABLE A-9 an POPULATION OF INCORPORATED CITIES, TOWNS AND COMMUNITIESNW NEWFOUNDLAND AND LABRADOR, 1951-1991
page 13
a ',Admiral's Beach
..., Anchor Point
up Appleton
Aquaforte ill Arnold's Cove
Avondale . Badger
Badger's Quay-Valleyfield-Pool's Island
0 Bale Verte
Wine Harbour
a. Bauhrie
W. Bay Bulls
as Bay de Verde
IOW Bay L'Argent
Aik Bay Roberts
INV Baytona (Gayside; B1rchy Bay North)
Bayview
. Beachelde (Wild Bight)
Bellbums . Belleoram
Benton
alBerry Head (Port au Port East)
Bide Arm
0 Birehy Bay
Bird Cove Ai Biscay Bay
11111. Bishop's Cove
.Bishop's Falls
Bonavlsta
mk Botwood Mr Branch
•
Brent's Cove
Brighton
Brigus . Bryant's Cove
Buchans(13)
iii Burgeo
Burin
in Burlington
Burnt Islands
s Carnpbeliton
Cape Broyle . Caps St. George-Petit Jardin-Grand
Jardin-De Grau-Marches Point-Loretto 0 .Carbonear
Carmanville
Cartwright
Catalina
Centreville
ill Chance Cove
Change Islands ID Channel-Port aux Basques
Chapel Arm
fp Charlottetown
Ciarenville 0 Clarke's Beach
Coachman's Cove
0 Coley's Point
Collnet
0 Colliers
Come-8y-Chance
• Comfort Cove - Newstead
Conception Bay South . Conception Harbour Conch.
Conne River
al Cook's Harbour
Cormack is Corner Brook
Corner Brook East . Corner Brook West
Cottle's Island-Luke's Arm
0 Cottlesville
Cow Head
al11)
Cox's Cove
Crow Head
Cupids
Curling
IIIDaniel's Harbour
Type
Census
Code
Year of
Incorporation Census Years
1961 1956 1961 1966 1971 1976 1981 1986 1991 Corn. 1W 1968 ... ... 122 288 402 • 370 362 361 275 Corn. 9C 1974 180 208 223 238 275 329 • 368 387 380 t 6E 1962 ... 154 ... 297 ' 347 342 420 502 526 Corn. 1U 1972 167 200 208 206 186 172 • 201 188 t IA 1967 158 183 213 378 919 ' 1,160 1,208124 1,117 1,106 t 10 1974 720 798 511 526 944 937 ' 890 802 t SC 1963 872 988 • 1,036 1,192 1,187 1,180 1,090 8455 1,161 1,073 t 7A 1946 1,056 • 1,344 1,492 1,466 • 1,457 1,488 1,566 + 1,589 1,586 t 8A 1958 533 704 958 • 2,144 • 2,397 2,528 2,491 2,049 1,913 Com. 2C 1970 141 135 136 133 194 • 204 208 205 189 t 1Z 1988 230 285 263 273 297 163 423 417 388 ' t 1Z 1985 754 881 914 1,032 1,011 1,104 1,150 1,114 • 1,065 I 1G 1960 867 ' 906 884 838 826 749 786 + 756 679 t 21 1971 416 418 431 602 453 474 ' 483 489 403 t 1K 1951 1,222 ' 1,306 1,328 3,456 (-15 3,702 4,072 4,512 4,446 ' 5,474 ' Corn. 80 1976 ... 203 232 280 286 353 • 356 370 366 t 81 1980 556 577 625 602 615 677 625 ' 603 570 Corn. 8C 1962 116 172 202 268 ' 275 285 282 320 280 Corn. 9H 1969 97 153 172 158 165 ' 148 147 137 123 t 3A 1948 683 ' 570 577 564 530 536 565 578 560 (25) Corn. 6E 1972 112 129 200 251 198 279 ' ... (1) ... ... Corn. 4D 1952 ... 297 • 402 408 715 • 923 • 877 785 775 Corn. 9F 1970 - - - - 278 ' 305 339 341 325 t 8G 1974 497 407 541 618 580 646 ' 707 709 788 Corn. 9C 1977 138 191 257 334 339 395 400 394 349 Corn. 1V 1971 81 83 73 76 87 88 ' 92 99 97 Corn. 1J 1969 344 338 371 351 356 ' 366 369 292 t 6C 1961 3,139 3,393 4,099 4,127 ' 4,133 4,504 4,395 1 4,213 : 4,232 t 7H 1964 3,718 4,078 4,188 4,192 ' 4,215 4,299 4,460 4,805 + 4,597 t SC 1960 3,421 3,894 3,680 • 4,277 ' 4,115 4,554 4,074 3,916 3,863 Co.rn 1C 1966 397 606 556 517 ' 518 452 462 417 382 Com. 8A 1968 197 230 271 291 • 359 379 ... 365 310 Com. 80 1986 248 254 289 296 272 271 320 328 ' 297 t 1N 1964 754 754 704 707 ' 746 912 • 898 856 ' 929 ' Corn. 11 1977 280 278 307 284 304 364 380 421 + 441 t SA 1963 - - - 384 ' 454 521 1,655 ' 1,281 1,164 t 3F 1950 891 • 1,138 1,454 1,682 2.228 ' 2,474 2,504 2,582 2,400 t 2E 1950 796 ' 1,116 1,144 1,167 2,588 • 2,892 ' 2 . 90 4 2,892 2,940 Coin. 80 1963 260 277 • 263 325 363 381 405
416 456 t 3H 1975 601 633 878 709 799 914 ' 991 1,042 1 ,024 t 80 1972 504 599 636 712 730 757 703 886 687 Corn. 1(1 1990 566 593 630 640 677 711 698 655 693 '
Corn. 4E 1969 977 1,206 1,301 1,416 1,595 ' 1,713 1,470 1,505 1,140 • t 1H 1948 3,351 • 3,955 4,234 ' 4,584 4,732 5,028 5,315 5,337 5,259 t 8L 1965 770 764 • 855 938 839 - 911 966 987 942 Corn. 10B 1958 244 359 493 ' 616 752 675 658 674 811 t 71 1968 816 944 1,110 • 1,089 1,131 1,129 1,162 1,211 1,205 t 78 1966 - - 186 439 ' 470 683 604 589 580
1A 1972 427 446 478 (7) 434 448 487 * 498 467 435 t 8N 1951 919 804 • 747 711 609 535 580 562 524 t 3H 1945 2,634 ' 3,320 4,141 5,692 (18) 5,942 8,187 5.988 5,901 • 5,844 t IA 1970 386 499 561 582 659 712 689 899 638 Corn. 108 292 t 7K 1951 1,093 1,195 • 1,541 1,813 ' 2,193 2,807 2,878 2,967 1 114 483 881 669 683 - 1985 877 ' 997 1,009 + 1,189
3,071
1,192 Com. 8A 1970 284 269 307 317 334 * 293 279 265 + 208 t 1K 1965 841 689 • 628 ... (8) ... ... ... ... ... Corn. 1X 1974 186 233 261 320 274 246 • 318 2 + 232 t 10 1972 567 756 759 815 774 840 • 819 791 808 I 1A 1969 92 159 197 298 364 ' 380 337 266 296 Corn. 80 1967 443 506 605 €59 778 ' 734 702 625 t 1P 1971 ... ... ... ... 8,212 9,743 ' 10 ,8166 15,531 ' 17,590 t Corn.
10 9F
1972 1980
843
276 968 315
998 496 •
1,048 541
1,005 505
910 431
• 4649 + 886
408 907 417
I 30 1972 148 151 319 (7) 388 488 531 • 588 592 108 • t 9D 1956 293 322 342 • 392 325 326 388 390 369 Corn. SE 1964 325 422 486 432 ' 581 ' 672 788 773 788 c t
SC
SC
1958
1948
(19)
3,445
23,225 r19
(19)
25,185
...
27,118
... 26,309
...
25,198
... 24,339
...
- 22,719
...
22,410
... t SC 1942 6,831 (19) ... ... ... ... ... t 8H 1972 279 319 374 436 433 404 • ... (3) ... ... t 8H 1980 ... ... ... ... ... 409 (+3) 415 375 t 9H 1964 313 448 544 saw • 575 650 895 708 696 Corn. 50 1969 514 528 630 708 797 ' 1,004 980 999 941 Corn. 81 1960 271 265 224 246 244 277 318 297 280 1 114 1965 622 695 594 673 • 691 750 706 789 • 888 t SC 1947 3,559 ... (19) ... ... ... ... Com. 9H 1965 246 324 403 412 • 415 579 614 566 428
III

III TABLE A-0 4111 page 14 POPULATION OF INCORPORATED CITIES, TOWNS AND COMMUNITIES NEWFOUNDLAND AND LABRADOR, 1951-1991 41111 - Continued -
Type Census
Cale
Year of
Incorporation Census Years
1951 1956 1961 1966 1971 1976 1981 1986
Daniel's Point(14) Corn. Dark Cove-Middle Brook-Gambo(9) t Davis Inlet Corn. Deer Lake t Dover t Duntara Com. DunvIlle t
Durrell 1 Eastport t
Breton t Embroe t
Englee t
English Harbour East Corn. Fenneuse Corn.
Ferryland Corn.
Flatrock t Fleur de Lys t Flower's Cove t
F090 t
Forteau Corn. Fortune t Fox Cove - Mortier t Fox Harbour Corn.
Frenchman's Cove, Fortune Bay Corn. Freshwater, Placentia Bay t
Gallants Corn.
Gtunbo(4) t Gander t
Garnish t
Gaskiers - Point la Hays Corn. Gauhois t Gillum Corn.
Glenbumle-Ilirchy Head-Shoal Brook Corn.
Glenwood t Glovertown t
Goose Cove East Corn. Goulds t Grand Bank t
Grand Falls t Grand Falls-Windsor t Grand le Pierre Corn.
Great Harbour Deep Corn. Greenspond t
Halfway Point-Benoit's Cove- John's Beach-Frenchman's Cove t Hampden Corn.
Hart's Harbour t Happy Adventure Corn.
happy Valley-Goose Bay t
Harbour Breton t Harbour Breton Grace t
Harbour Grace South Corn. Harbour Main Corn.
Harbour Main-Chapel Cove-Lakeview t Hare Bay, Bonavista Bay t Hawke's Bay Heart's Content t
Heart's Delight - Islington t
Heart's Desire t Hermitage Corn. Hodge's Cove t Hogan's Pond t Holyrood 1 Hopedale Corn. Howley t Hughes Brook Corn. Indian Bay (Parson's Point) Corn. Irishtown Com. Iriehlovm-Summerside Isle aux Morts t Jackson's Arm Corn.
Jacques Fontaine Co.rn Jerseyside t Jos salt's Arm-Barr'd Islands-Shoal Bay t
Keels Corn. King's Cove Corn. King's Point Corn.
1V 7N 10E SA
7B 70 1B 81
7D
71
13F
OF
2.11U 1U
IS 8A
9C 8N
10A
2H 2D 1B
211 1B
4D
7N
6E 211
1W
3C 5F
9A
SE 7D
9D 1Z 211
83
6C 2.1
9F 78
SD
SE 1F
70
10C
313 ll 11
10
10 713
90 1F
1E
1E 3C71.1
1Z10 10E
M 5F
7B 5F
SF 3H 513
21
1B 8N
70 7G 8P
1960
1962 1969 1960 1971
1961 1963
1971 1969
19651971
1948 1974 1967
1971
1975 1967
1961 1948
1971 1946
1970 1964 1974
1950
1966
1980 1964 1971
1970 1962 1971
1978
1962 1964 1971
1971 1943
1961
1989
1971 1951
1971 1959
1970
1980 1975
1952 1945 1975
1966
1977 1964
1956 1967 1972
1971 1963 1971 1971 1962 1969
1958 1975
1971 1970
1966 1981
1975
1950 1972
1966 1966 1967
(10
101
530 89
2,666 395 151 563 939
409
674 171
611
214 538
582
483
368 281
1,078
192 887
330 466
236 810
166
... 3,956
591
247 252
192 413
689 ...
228 ...
2,148
5,064
139
192
712
825 414
453 407
2,416
903 2,331
281 444
... 719
254 594 797
223 396 313
... 523 144
552 -
198 193
864 435
154 544
1,252
228 253 351
•
'
'
'
'
•
126
808
133 3,481
552
161 869
1,007 473
699 442 677
215
524
656
588 437
278 1,184
223 1,194
373 615
262 1,048
133
... 4,938
546
325 403
230 483
1338 604
209
... 2,430
6,064
186
221
784
697 509
522 448
5,152
989
2,545 299 597
... 1,195
203 648 845
231 395 357
... 559 211
498 -
230 212
773 406
164 713
1,455
208 262 411
•
•
'
'
'
150
955
98
3,998 709 181
1,121
1,107 438
678 1398
802
228 311
713
632
457 312
1,152
232 1,380
338 746
258 1,398
182
...
5,725 500
328 497
284 518
1,130
1,197
260
... 2,703 8,605
236
304 728
1,003
682
487 415
5,901
1,076
2,850 281 469
... 1,467
312 607 860
291 417 375
... 789 218
452
- 285 295
884 422 193 923
1,483
185 201 546
'
•
'
'
'
'
•
181
980 146
4,289 839 195
1,622 1,071
437
691 786
941
245 401
723
529
609 338
1,150
248 1,703
3E3 765
251 1,310
203 ...
7,183 519
270 594
358 504
1,000 1,246
325
... 3,143 7,451
257
334
666
1,312 733
482 413
6,579
1,442
2.268111791
... 1,410
327 592 766
315 398
383 ...
1,125
382 395
8
212 411
1,064
450
193
953 1,345
175 213 561
•
(7)
•
'
•
'
•
•
'
•
...
2,586 193
4,421 930
149 1,742
1,076 438
661
814
1,050
217
503 716
680
672 372
1,155
312 2,184
445
685
278 1,562
81
... 7,748
618
300 509 363
450 979
1,915 349
2,2803,476 7,677
294 329
449
1,907 739
522
364 7,024
2,196 2,771
399 652
... 1,485
462 599 731
347 637
391 191
1,282
375 409 28
195 502
1,158 491
182
1,17611 146 271 651
(14)
• '
•
"
• •
•
•
'
'
• •
-
'
•
' '
'
'
•
•
•
...
2,994 274
4,546 960
138 1,909 1,137
567
540 855
989
278 531 780
743
694
436 1,103
465 2,406
469
627
307 1,426
101
... 9,301
678
833 568 491
443 1,128 2,176
339
3,802317 8,729
368
303
382
2.144 780 507
387 8,075
2,317
393 2937...
1,313
1,598
489 634 842
380 830
426 110
1,610 447 404
114
198 707
1,270 482
197
1,027 1,023
142
239 770
34,242
•
' •
•
' • '
'
('17)
•
' •
'
'
' ' •
•
•
•
• '
•
-
' • "
'
'
•
...
... (4)
240 4,348
925
124 1,817
1,145 597
527 + 846
998 316 584 795
808 +
616
1,105459
520 (17) 2,473
489 538
295 1,276
102 2,932 (4)
10,404 761
505 558 488 422 '
1,129
2,166 • 368
+ 3,901
8,766 (24)
381
278 423
2,21483,
542
352 7,103
2,484 2,988
362
- (5) 1,303 (5) 1,520
553
625 899
416 883
(1)
129 1,789 +
425
458
128 192 742
(22) 1,238
618
221 641
1,155 +
129 253 825
...
386 4,233
913 119
1,833
1,060 609
564 838
1,012 299
546
762 884
526 + 417
1,153
580 + 2,370
500 471
275 1,219
78 2,723
10,207 + 756
517 583 512
368 1,038 2,184 373
4,688 3,732
9,121 •
(24)
401 246
480
2,182 875
552 364
7,248
3,053 387 •
... 1,293 + 1,436
547 620
888
405 831
... 139
2,118 + 477 393 141
215
798
(22) 1,203
662 * 210 764
1,232
115 266 923
III
2,432
- 1991
... -
... aes 411
4,327
881 III 102
1,888 - 1,002
801 III 533
848 0 984 288
605 4111 717
1,044 4111 49:3
372 111 1,030
518 - 2,177
484 - 434
229 III 1,037
73 III 2,496
10,339 - 716
608 618 411 496
365 41111 984
2,276 III 373
6,162 411 3,528
• ID (24) 14,693
368 1111 203
435 - 2,104 4111 718
631
323 41111 8,810 - 2,418 3,419 "
- 367 ...
1,278 - 1,387
584 4111 667
878 - 363 756 III ... 133 411 2,075
616 363 411 168
215 4111 (22)
1,660 ' 0 1,148
533 III 200 715 411
1,164 128 a 214 889 s
IIII

-Miles Cove Millertown
.Milltown - Head of Bay d'Espoir(18) Ming's Bight . Morrisville Mount Carmel - Mitchells Brook _
0 St. Catherine's MountMoriah
("Mount Pearl Mouse Island
da Musgrave Harbour W. Musgravetown
WV Nain New Perlican
am Newtown, Bonavista Bay lor Nippers Harbour
Norman's Cove-Long Cove sr Norris Arm
Norris Point
0 North River North West River
0 Northern Arm, Notre Dame Bay Old Perlican
fri Pacquet Paradise
0 Parker's Cove Parson's Pond
alS Pasadena(12) MW Peterview Ali Petty Harbour-Maddox Cove
MIIII Pilley's Island
Pin ware .Placentia
Plate Cove East
Plate Cove West
Point au Gaul
ip Point Lance Point Leamington
0 Point May Point of Bay 4. Pool's Cove Port Anson
da Port an Bras
Mir Port Aux Choix West-Aguathuna-Felix Cove Port au Port
III AmaKippene 1111P'Anse au Clair
L'Anee au Loup
OA Scie Labrador City
alLanudine
Lark Harbour
OW" Lawrence Pond
'IC
illt
...ad ing Tickles West
1.9wires Cove ports
lisBay, Notre Dame Bay Bay East, Fortune Bay
Bay islands *mettle Burnt Bay
Catalina AnkLogy Bay-Middle Cove-Outer Cove gp_on a Harbour-Mount Arlington Heights
Lord's Cove
liVurd" Lumeden
',Lushes Bight-Beaumont-Beaumont North Main Brook
aliMakkovik
w Mary's Harbour
Oilarystown Massey Drive
illaMcIvers IMF Meadows
alk Melrose Mr Merasheen
Middle Arm, Green Bay
0
OrABLE A-O POPULATION OF INCORPORATED CITIES, TOWNS AND COMMUNITIES&
NEWFOUNDLAND AND LABRADOR, 1951-1991
it- Continued -
page 15
•
Type
Census
Code
Year of
Incorporation
Census Years
1951 1956 1961 1986 1971 1976 1981 1988 1991
t 4D 1968 641 799 1,079 1,199 1,383 ' 1,267 1.219 1,556 1,767
Corn. 10A 1970 152 180 202 244 233 • 249 267 279 263
Corn. 10A 1975 268 291 343 400 448 636 • 689 666 830
t 8A 1955 801 702 • 939 1,064 1,255 1,256 1,422 1,429 1.412
t 10D 1961 - - 386 5,037 ' 7,622 12,012 11,538 8,664 9,061
t 2G 1963 590 548 530 644 • 553 543 548 + 514 482
Corn. 50 1974 322 398 335 349 590 771 ' • 783 829 755
t 20 1952 531 634 ' 716 875 1,000 1,025 999 1,015 1,005
t 1P 1970 - - - 11 - ' 11 46 •-• (20) ...
Corn. 8E 1961 73 74 324 496 • 405 594 841 807 564
Com. 2E 1973 160 191 208 252 397 470 ' 507 565 809
t 8F 1946 1,218 * 2,076 2,702 2,892 3,175 3,782 3,963 3.978 3,848
Corn. 8C 1966 206 277 374 319 • 503 375 350 202 154
Corn. 21 1979 230 196 174 198 184 213 202 ' 196 201
Corn. 8C 1955 535 534 ' 426 426 394 422 407 376 261
t 8F 1975 156 255 287 484 509 524 • 482 437 436
t 71 1965 613 727 752 725 • 722 736 750 774
710
t 1Z 1,862
t 1A 1968 409 322 356 356 376 • 675 ' 660 627 522
Corn. 20 1986 383 361 391 418 • 398 409 384 348 329
Com. 4E 1969 602 798 975 936 959 • 987 932 ' 937 • 858
t 8M 1968 581 581 622 616 630 • 597 • 845 636 675
Corn. 813 1988 629 535 553 560 553 ' 470 491 485 397
t OF 1948 455 • 479 577 677 590 551 514 526 458
Corn. 10E 1970 101 100 168 302 292 • 307 347 340 370
Com. 10B 1975 83 212 264 47 134 386 ' 408 463 470
t 2D 1961 1,208 1,480 • 1,691 1,894 4,980 ' 5,915 6,299 8,880 6,739
t 5C 1971 ... ... ... ... 370 381 ' 409 415 819
Com. 5D 1971 355 382 459 550 656 389 " 736 738 725
Corn. SF 1970 307 358 420 419 516 ' 642 656 871 719
Corn. 71 1968 268 308 348 356 378 389 416 406 423
Com. 2L 1962 348 339 291 271 • - (1) - - - -
Corn. 80 1966 300 325 380 442 474 • 555 575 597 622
Corn. 8C 1970 100 138 182 151 156 • 168 202 237 223
Corn. 6A 1959 586 383 365 • 355 316 273 228 214 158
t 30 1969 583 693 972 1,079 1,233 • 1,325 1,376 1,276 1,161
Com. 8A 1970 156 123 285 371 378 ' 412 437 434 456
Corn. 30 1971 122 166 180 211 223 * 217 233 221 201
t 1W 1970 621 725 743 687 674 ' 675 899 851 819
t Sc 1971 483 716 868 635 703 ' 751 + 892 726
t 1Z 1955 ... 1,979 ' 2,785 4,428 7,211 10,193 11,543 20,293 ' 23,889
Corn. 3H 1969 368 563 507 ' ... (18) ... ... ... ... ...
t 8M 1954 934 1,016 • 1,062 1,183 1.232 1,530 ' 1,554 1,527 1,528
t 7E 1974 567 570 597 597 586 641 ' 835 717 726
t 10E 1970 285 222 465 591 708 ' 812 938 1,018 1,069
t 1F 1971 361 386 427 (7) 385 308 325 ' 350 329 281
t 7A 1954 311 590 585 562 513 ' 490 511 529 518
Corn. 80 1964 275 260 236 290 • 275 280 259 234 243
I 1A 1970 659 "a
811 882 850 997 ' 1,155 1,152 1,107 1,054
t 6D 1971 1,126 976 1,226 1,252 1.191 ' 1,342 1,216 1,127 1,089
Corn. 9A 1960 329 669 711 • 885 • 986 1,085 1,033 1,010 927 Corn. 1M 1964 239 298 313 279 * 256 253 245 214 542
I 10C 1958 511 583 753 ' 835 931 1,022 515 ('6) 526 528
t 6C 1972 203 186 181 181 178 232 ' 298 342 381
t 10 1971 631 648 599 648 597 ' 626 709 761 746
Corn. 8A 1962 248 288 328 385 • 429 427 395 336 326
t 1Z 1971 ... ... ... ... 1,697 2,131 ' 2,861 3,346 3,984
Corn. 2C 1986 184 234 289 343 • 405 381 424 428 441
Corn. 9H 1986 220 331 337 392 ' 491 544 805 589 582
t SF 1955 379 468 ' 502 685 964 ' 1,850 2,685 3,268 ' 3,428
I 6C 1962 568 618 726 836 953 1,099 1,119 1,130 1,011
t 1Z 1989 787 842 908 932 940 • 930 ' 853 974 974
Corn. 8D 1975 469 479 478 534 495 544 • 539 528 466
Corn. 10A 1978 74 106 121 156 186 187 201 196 175
t 1B 1945 614 ' 1,233 • 1,610 1,847 2,211 2,209 2,204 2,018 1,964
Corn. 7F 1960 386 429 214 237 209 184 172 173 145
Corn. 7F 1966 386 429 228 255 308 284 302 307 322
Corn. 20 1966 212 201 196 185 • 148 148 140 149 130
Corn. 1C 1971 133 142 154 164 133 135 • 141 153 161
t 8E 1970 602 717 901 896 940 ' 882 848 850 852
Corn. 2G 1962 256 292 316 347 * 334 372 427 456 436
Corn. 8E 1967 127 155 217 231 182 ' 243 252 251 209
Corn. 3A 1989 290 234 263 242 237 • 242 244 259 268
Corn. 8C 1961 391 386 407 201 ' 123 137 154 183 209
Corn. 2E 1971 251 302 342 363 393 395 • 366 363 319
t 9G 1986 190 271 490 369 861 ' 1,141 1,311 1,291 1,260
t 40 1970 342 348 630 639 646 • 1,012 • 938 842 718

411 •
•
i. • • •
• • • •
• • • •
S • • • • • 411
•
•
•
page 16
TABLE A-la POPULATION OF INCORPORATED CITIES, TOWNS AND COMMUNITIES NEWFOUNDLAND AND LABRADOR. 1951-1991 - Continued -
Type
Census
Code
Year of
Incorporation
Census Years
1961 1968 1981 1986 1971 1978 1981 1988 1991
Port Biandford t 7E 1971 567 631 716 711 779 815 • 702 729 876
Port Elizabeth Com. 2C 1982 373 381 384 331 • - - - - -
Port Hope Simpson Corn. 10B 1973 252 311 402 158 232 648 • 581 604 614
Port Kirwan Corn. 1U 1965 147 177 134 153 • 169 140 164 142 120
Port Sexton Com. 7J 1989 449 454 438 404 384 463 ' 489 488 482
Port Saunders I 93 1966 410 522 504 • 642 837 ' 891 789 822 822
Port Union Portugal Cove
t t
71
1S
1961 1977
644 934
673 972
645 1,141
* 833 1,082
578 1 ,411
678 1,527
671 2,361 •
863 2,497
638 2,728
Portugal Cove South Corn. 1V 1963 214 251 304 360 • 371 364 371 375 341
Postville Corn. 10E 1975 80 96 84 100 121 164 ' 223 220 231
Pouch Cove t 1S 1970 1,033 1,181 1,324 1,374 1,483 • 1,643 1,522 + 1,578 1,978
Raleigh Corn. 90 1973 257 296 307 362 292 333 ' 373 390 389
Ramey I 3F 1951 714 • 931 970 1,180 1,208 1,226 1,386 1,380 1,224
Red Bay, Labrador Corn. 10A 1973 183 207 281 293 298 301 • 318 334 288
Red Harbour, Placentia Bay Corn. 2C 1989 ... ... 18 6 180 ' 206 231 283 252
Reidvine Corn. SE 1975 40 83 152 240 248 368 " 413 604 685
Rencontre East Co.rn 3A 1972 306 305 293 296 236 214 ' 230 218 212
Renews-Cappahayden Corn. 1U 1967 518 557 587 507 497 • 528 " 578 587 551
Rigolet Corn. 10C 1977 129 49 108 90 182 238 271 • 317 334
Riverhead, St. Mary's Bay Corn. 1N 1988 317 387 405 381 445 • 426 431 407 398
River of Ponds Corn. 90 1970 120 166 228 288 258 • 290 304 328 341
Roberts Arm
Rocky Harbour
I
Co.rn
8C
9A
1954 1966
406 657
606 ' 814
750 957
993
981
• •
1,044 982
' 1,064
1,267
1,005
1
1,111
1,288
994
1,138
Roddickton 1 9F 1963 892 1,062 • 1,185 1,227 • 1,239 1,234 1,142 1,223 + 1,163
Rose Blanche-Harbour Le Cou I 3J 1971 878 819 787 836 878 984 • 975 967 918
Rushoon Corn. 2C 1988 239 295 336 398 • 508 ' 504 520 605 482
Sally's Cove Corn. 9A 1968 152 191 226 250 298 ' 188 100 58 49
Salmon Cove t 1H 1974 614 883 ess 864 653 733 • 786 778 791
Salvage t 70 1972 181 150 270 255 227 242 ' 244 271 248
Sandringham Corn. 70 1968 156 180 208 225 223 260 271 282 308
Sandy Cove, Bonavbsta Bay Corn. 7D 1956 159 156 156 128 158 168 187 193 174
Sandy Cove, St. Barb. North Corn. 9C 1966 137 176 202 225 255 • 281 ... (1) ...
Seal Cove , Fortune Bay Corn. 3C 1972 356 370 436 443 457 510 • 498 517 467
Seal Cove, White Bay I 8A 1968 285 346 482 ' 561 898 774 751 698 666
Seldom - Unto Seldom t 8N 1972 459 485 589 618 536 522 • 580 833 590
Shoal Harbour 7K 1972 439 488 544 568 715 1,009 • 1,000 1,049 1,402
Small Point - Broad Cove - Blackh*ad - Mame Cove 10 1972 719 724 762 885 669 884 ' 539 ' 500 506
South Brook, Hair s Bay I 8A 1985 305 492 821 743 802 • 828 786 780 720
South Brook, Humber Valley Corn. 5F 1986 225 296 358 398 • 428 446 477 ... (21)
South River t 1M 1986 233 239 416 421 554 • 598 845 720 • 788
Southern Harbour t 1A 1988 95 123 147 192 679 ' 759 772 742 716
Spaniard's Bay 1 1J 1956 1,209 1,411 1.289 773 ' 1,764 • 1,588 • 2,125 • 2,190 2,196
Springdale t 8C 1945 1,543 ' 2,130 2.796 2,773 ' 3,224 3,513 3 3,555 3,545
St. Alban's t 30 1953 1,079 1,334 ' 1,547 1,715 1,941 • 2,040 1:501 968
1,780 1,688
St. Anthony t 9D 1945 1,380 1,761 1,820 2,289 2,593 2.987 3,107 3,182 3,184
St. Bernard's Corn. 21 1987 384 415 481 649 568 ' 611 898 689 852
St. Brendan's Corn. 7D 1963 729 829 816 783 (183 528 488 435 378
St Bride's Corn. 1C 1972 285 358 397 465 598 578 ' 599 601 586
St. George's t 4C 1966 1,276 1,615 1,874 2,048 • 2,082 1,976 1,756 1,852 " 1,678
St Jacques - Coornb's Cove t 3A 1971 1,056 1,068 1,103 1,101 1,099 1,061 • 1.048 994 880
St John's c 1Z 1888 52,873 • 57,078 63,833 79,884 ' 88,102 ' 88,576 ' 83,770 • 96,218 • 96,770
St John's Metro Area 1 1Z 1983 14,876 ' 18,934 ' 24,420 ' 18,849 ' 18,980 • 19,047 ' 24,485 ' 6,254 ' 4,532
St. Joseph's, St. Mary's Bay Corn. 1W 1967 277 287 301 282 305 * 294 282 213 206
St. Joseph's, Placentia Bay Corn. 2C 1970 216 267 278 293 - • - - - -
St. Lawrence I 2F 1949 1,451 • 1,837 2,095 2,130 2,173 2,258 2,012 1,841 1,743
St Lewis (Fox Harbour) Corn. 1013 1981 151 195 232 191 214 288 278 339 " 339
St Lunaire - Griquet Corn. 9D 1968 803 801 729 ' 858 825 921 1,010 1,013 1,020
St. Mary's Corn. 1W 1966 506 611 808 562 445 ' 485 701 712 1337
St. Paul's Co.rn 9H 1968 146 265 305 316 347 • 466 454 497 448
St Phillips 1 1Z 1977 398 384 792 515 573 807 1,365 1,804 1,842
St Shott's Com. 1V 1983 152 182 189 218 • 228 221 239 280 232
St Thomas t 1Z 1977 206 249 435 521 155 461 448 ' 648 763
SL Vincent's-St. Stephens-Peter's River t 1W 1971 516 637 782 797 838 850 ' 796 727 874
Steady Brook Corn. SF 1953 237 172 226 216 288 292 377 + 386 421
Stephenville t 4D 1962 2,800 3,782 • 6,043 5,910 7,770 10,284 • 8,876 7,994 7,621
Stephenville Crossing t 4D 1958 1,462 1,552 2,209 • 2.433 2,129 2,207 2,172 2 ,249 2,172
Summerford t 1W 1971 682 788 878 889 996 1,099 ' 1,198 1,189 1,167
Summerside Corn. 8H 1970 504 523 482 547 803 • 830 848 798 (22) Sunnyside t SF 1970 408 493 533 582 716 ' 726 703 634 622
Terra Nova Corn. 7D 1980 180 202 194 151 107 88 62 47 38
Terrenceville t 2J 1972 424 521 818 882 700 784 ' 796 827 818
Tilt Cove Corn. 80 1969 40 57 394 436 87 • 69 45 28 17
Tilting Corn. 8N 1975 373 401 432 444 406 373 • 427 414 379
Tilton t 1J 1972 340 377 440 506 581 ' 575 588 581
Torbay t IS 1972 1,284 1,512 395 1,445 1,632 2,090 2,908 • 3,394 • 3,730 4,707
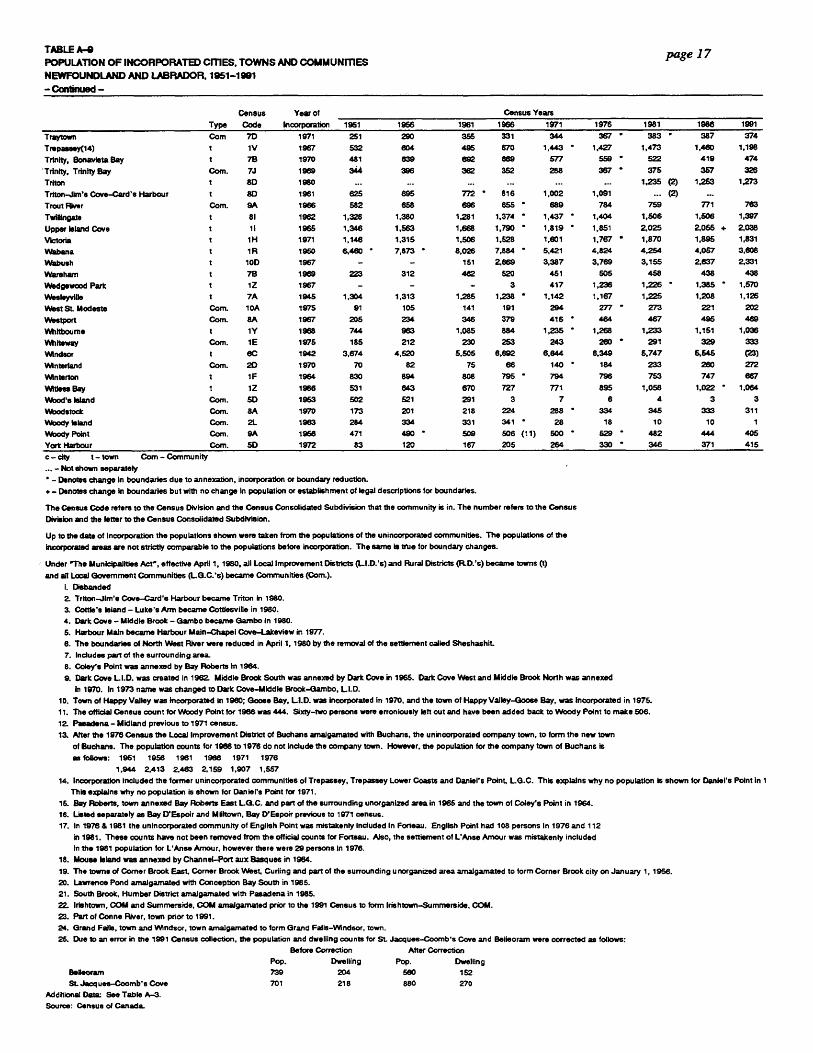
III III TABLE A-9 as POPULATION OF INCORPORATED CITIES, TOWNS AND COMMUNITIES IV NEWFOUNDLAND AND LABRADOR, 1951-1991
is- Continued -
III
Am Traytown gip Trepaseey(14)
Trinity, Bonavista Bay
0 Trinity, Trinity Bay Triton . Triton-Jim's Cove-Cord's Harbour Trout River
iii TwIllingals Upper Island Cove
fjb Victoria Wabana
ila Wabash 1.11F Wareham in 1Nedgewood Park W Wesleyville
West St Modesto IIII Westport milk IMdtbotime IN/ Whlteway
Windsor
0 WInterland WInterion
IIWitless Bay Wood's Island
• V■bodstock Woody Island
fa Woody Point Yort Harbour
MI c - city t - town Corn - Community IIMIF ... - Not shown separately
Mr • - Denotes change In boundaries due to annexation, incorporation or boundary reduction. + - Denotes change in boundaries but with no change In population or establishment of legal descriptions for boundaries.
am. Census Code refers to the Census Division and the Census Consolidated Subdivision that the community is in. The number refers to the Census
Division and the letter to the Census Consolidated Subdivision.
0 Up to the date of Incorporation the populations shown were taken from the populations of the unincorporated communities. The populations of the
incorporated areas are not strictly comparable to the populations before incorporation. The same is true for boundary changes.
III Under 'The Municipalities Act", effective April 1, 1980, all Local Improvement Districts (LI.D.'s) and Rural Districts (R.D.'s) became towns (t)
0 and all Local Government Communities (L.G.C.'s) became Communities (Corn.). I. Disbanded 2. Triton-Jim's Cove-Card's Harbour became Triton in 1980.
411 3. Cottle's Island - Luke's Arm became Cottlesville in 1980. 4. Dark Cove - Middle Brook - Gambo became Gambo in 1980.
III 5. Harbour Main became Harbour Main-Chapel Cove-Lakeview in 1977. 6. The boundaries of North West River were reduced in April 1, 1980 by the removal of the settlement called Sheshashit.
4111 7. Includes part of the surrounding area. 8. Coley's Point was annexed by Bay Roberts In 1964.
0 9. Dark Cove LI.D. was created in 1962. Middle Brook South was annexed by Dark Cove in 1965. Dark Cove West and Middle Brook North was annexed In 1970. In 1973 name was changed to Dark Cove-Middle Brook-Ciambo, LID. 0 10. Town of Happy Valley was incorporated In 1960; Goose Bay, LI.D. was incorporated In 1970, and the town of Happy Valley-Goose Bay, was Incorporated in 1975.
11. The official Census count for Woody Point for 1966 was 444. Sixty-two persons were erroniousty left out and have been added back to Woody Point to make 506.
III 12. Pasadena - Midland previous to 1971 census. 13. After the 1976 Census the Local Improvement District of Buchans amalgamated with Buchans, the unincorporated company town, to form the new town
III of Suctions. The population counts for 1986 to 1976 do not include the company town. However, the population for the company town of Buchans is as follows: 1951 1958 1981 1966 1971 1978
III 1,944 2,413 2,463 2,159 1,907 1,557
14. Incorporation included the former unincorporated communities of Trepassey, Trepaseey Lower Coasts and Daniel's Point, LO.C. This explains why no population is shown for Daniel's Point in 1 This explains why no population is shown for Daniel's Point for 1971.
1111 15. Bay Roberts, town annexed Bay Roberts East LG.C. and part of the surrounding unorganized area in 1965 and the town of Coley's Point in 1964. 16. Listed separately as Bay D'Espoir and Milltown, Bay D'Espoir previous to 1971 census.
III 17. In 1978 & 1981 the unincorporated community of English Point was mistakenly included in Forteau. English Point had 108 persons In 1978 and 112 In 1981. These counts have not been removed from the official counts for Forteau. Also, the settlement of L'Anse Amour was mistakenly included
1111 In the 1981 population for L'Anse Amour, however there were 29 persons in 1976. 18. Mouse Island was annexed by Channel-Port aux Basques in 1964.
ira 19. The towns of Corner Brook East, Corner Brook West, Curling and part of the surrounding unorganized area amalgamated to form Corner Brook city on January 1, 1956. 20. Lawrence Pond amalgamated with Conception Bay South in 1985.
4111 21. South Brook, Humber District amalgamated with Pasadena in 1985. 22. lrishtown, COM and Summerside, COM amalgamated prior to the 1991 Census to form Irishtown-Summerside, COM.
III 23. Part of Conn. River, town prior to 1991. 24. Grand Fails, town and Wndsor, town amalgamated to form Grand Falls-Windsor, town.
III 25. Due to an error in the 1991 Census collection, the population and dwelling counts for St. Jacques-Coomb's Cove and Belleoram were corrected as follows:
Before Correction After Correction
IIIII
Beleoram 739 204 Pop. Dwelling Pop.
580 Dwelling
152 St. Jacq ues-Coomb's Cove 701 218 880 270
el Additional Data: See Table A-3. Source: Census of Canada.
page 17
CenSus Year of Census Years
Type Code Incorporation 1951 1956 1961 1966 1971 1976 1981 1986 1991
Corn 7D 1971 251 290 355 331 344 367 • 383 • 387 374
t 1V 1967 532 804 495 670 1,443 ' 1,427 1,473 1,480 1,198
t 78 1970 481 639 692 869 577 559 • 522 419 474
Corn. 7J 1969 344 396 362 352 288 367 • 375 367 326 t 80 1980 ... ... ... ... ... ... 1,235 (2) 1,263 1,273
t 8D 1961 825 695 772 • 816 1,002 1,091 ... (2) ...
Corn. 9A 1966 582 658 696 655 ' 689 784 759 771 783
t 81 1962 1,328 1,380 1,281 1,374 ' 1,437 • 1,404 1,506 1,506 1,397
t 11 1965 1,346 1,563 1,668 1,790 ' 1,819 • 1,851 2,025 2,055 + 2,038
t 1H 1971 1,146 1,315 1,506 1,528 1,801 1,787 ' 1,870 1,895 1,831
t 1R 1950 6,480 ' 7,873 • 8,026 7,884 * 5,421 4,824 4,254 4,067 3,808
t 100 1967 - - 151 2,869 3,387 3,769 3,155 2,637 2,331
t 7B 1969 223 312 482 520 451 505 458 438 438
t 1Z 1967 - - - 3 417 1,236 1,226 ' 1,385 • 1,570
t 7A 1945 1,304 1,313 1,285 1,238 ' 1,142 1,167 1,225 1,208 1,126
Corn. 10A 1975 91 as
105 141 191 294 277 ' 273 221 202
Corn. 8A 1967 205 234 346 379 416 • 464 467 496 489
t 1Y 1968 744 963 1,085 884 1,235 ' 1,268 1,233 1,151 1,036
Com. 1E 1975 185 212 230 253 243 280 ' 291 329 333 t 8C 1942 3,674 4,520 5,505 8,892 8,844 6,349 6,747 6,545 (23) Com. 2D 1970 70 82 75 66 140 ' 184 233 260 272 t 1F 1964 830 894 808 795 ' 794 796 753 747 667
I 1Z 1986 531 643 670 727 771 895 1,058 1,022 ' 1,064
Corn. SD 1963 502 521 291 3 7 8 4 3 3
Corn. 8A 1970 173 201 218 224 288 ' 334 345 333 311
Corn. 2L 1983 284 334 331 341 • 28 18 10 10 1
Corn. fiA 1966 471 490 • 509 508 (11) 500 ' 629 ' 482 444 405
Corn. 5D 1972 83 120 167 205 264 330 ' 346 371 415
•
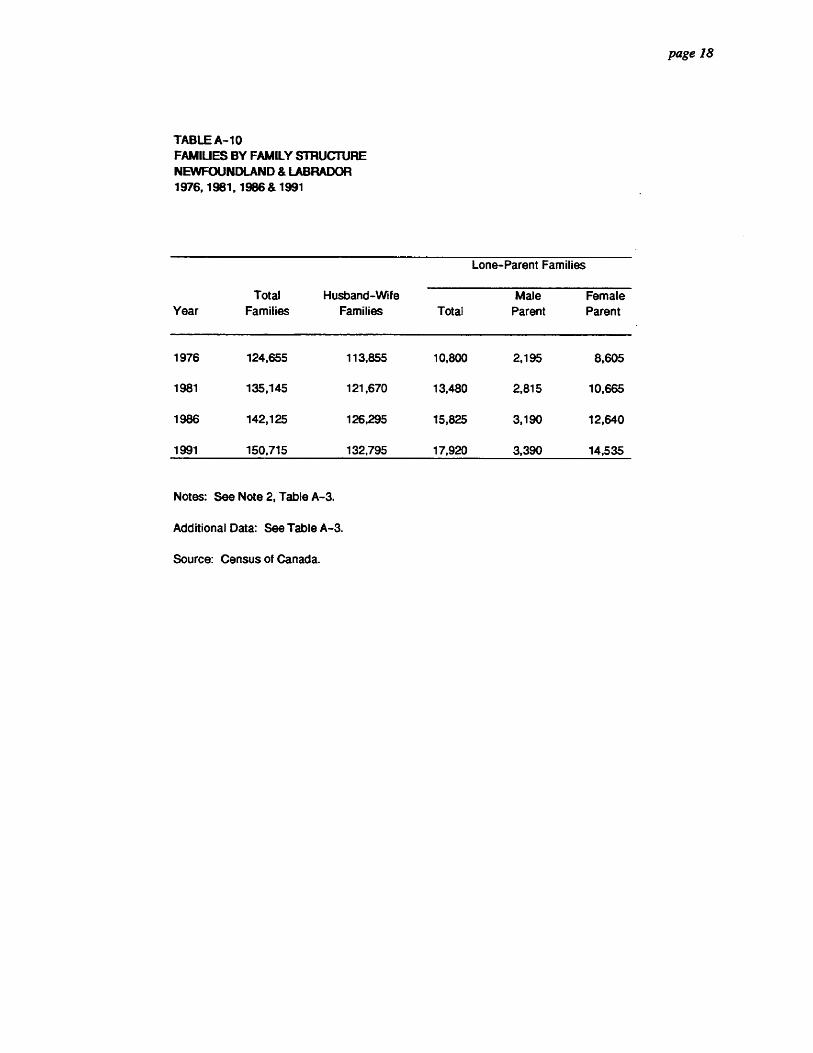
S
S
S
S
S • • S • S •
S • S • •
S S S S • •
page 18
TABLE A-10
FAMIUES BY FAMILY STRUCTURE
NEWFOUNDLAND & LABRADOR
1976,1981. 1986 & 1991
Lone-Parent Families
Total Husband-Wife Male Female Year Families Families Total Parent Parent
1976 124,655 113,855 10,800 2,195 8,605
1981 135,145 121,670 13,480 2,815 10,665
1986 142,125 126,295 15,825 3,190 12,640
1991 150,715 132,795 17,920 3,390 14,535
Notes: See Note 2, Table A-3.
Additional Data: See Table A-3.
Source: Census of Canada.
S
•

page 19
TABLE A-11 FAMIUES BY AGE GROUPS OF CHILDREN AT HOME NEWFOUNDLAND & LABRADOR 1976, 1981, 1986 & 1991
Families with Children at Home
Families with Children 17 Years and Under at Home
With All Some 18 & With All Some Under Some Under 6 to 14 Some Under
Total Children Over & Some Children All All All 6 & Some 6 & Some and 6 & 6-14
Year Families Total 18 &Over 17 & Under Under 17 Under 6 8 to 14 15 to 17 8 to 14 15 to 17 15 to 17 & 15-17
1976 124,655 98,250 12,505 18,945 86,795 23,010 13,285 2,840 17,515 225 7,085 2,845
1981 135,145 106,325 15,720 19,580 71,015 20,705 18,620 3,830 17,685 250 8,295 1,630
1988 142,120 111,435 22,470 19,595 69,375 18.425 21.005 4,170 15.325 335 8,965 1,150
1991 150,715 112,940 28,435 17,695 66,810 17,195 21,125 5,270 12,865 415 8,980 960
Notes: See Note 2, Table A-3.
Additional Data: See Table A-3.
Source: Census of Canada.

610
00
11
90
111900911881111
11O
OO
SOM
OS
101
111
00011•1
1000110
SECTION B
HEALTH AND WELFARE
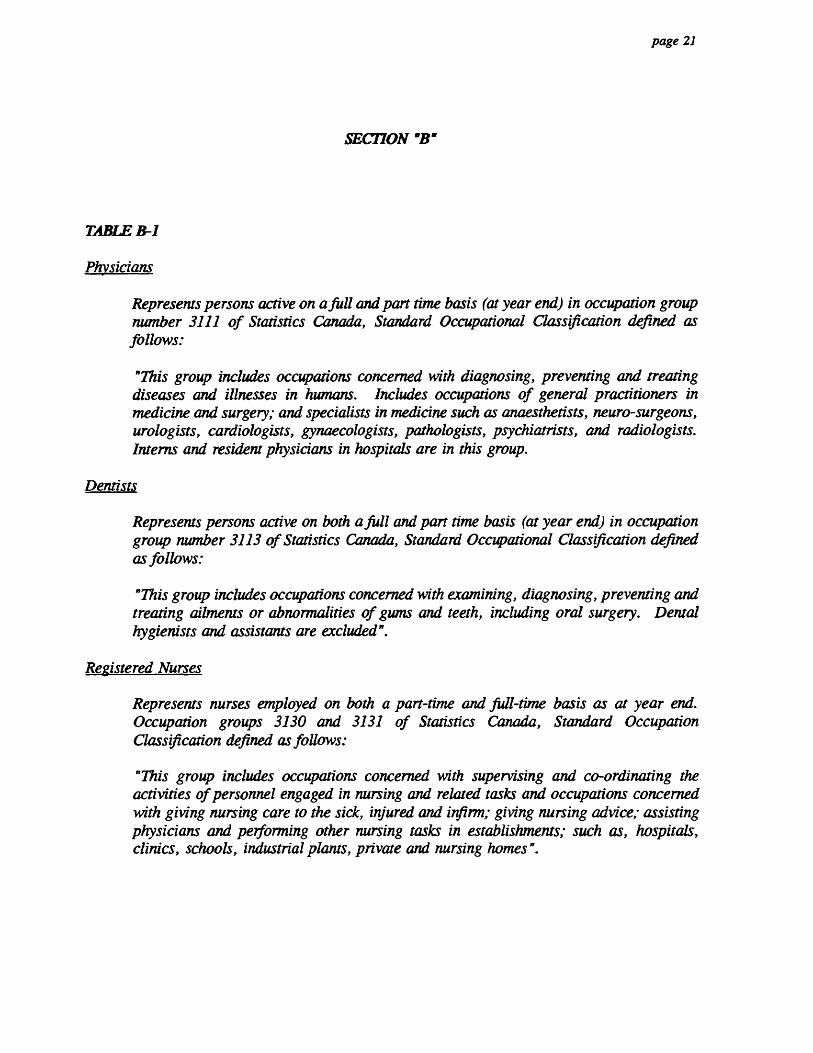
•
• page 21
•
•
• SECTION "B" • • • • TABLE B-1
Physicians
so Represents persons active on a full and part time basis (at year end) in occupation group number 3111 of Statistics Canada, Standard Occupational Classification defined as
ID follows:
"This group includes occupations concerned with diagnosing, preventing and treating diseases and illnesses in humans. Includes occupations of general practitioners in medicine and surgery; and specialists in medicine such as anaesthetists, neuro-surgeons,
• urologists, cardiologists, gynaecologists, pathologists, psychiatrists, and radiologists.
ID Interns and resident physicians in hospitals are in this group.
Dentists
Represents persons active on both a full and part time basis (at year end) in occupation
411 group number 3113 of Statistics Canada, Standard Occupational Classification defined as follows:
• "This group includes occupations concerned with examining, diagnosing, preventing and
• treating ailments or abnormalities of gums and teeth, including oral surgery. Dental hygienists and assistants are excluded".
ID Registered Nurses
Represents nurses employed on both a part-time and full-time basis as at year end. Occupation groups 3130 and 3131 of Statistics Canada, Standard Occupation Classification defined as follows:
"This group includes occupations concerned with supervising and co-ordinating the activities of personnel engaged in nursing and related tasks and occupations concerned with giving nursing care to the sick, injured and infirm; giving nursing advice; assisting
• physicians and performing other nursing tasks in establishments; such as, hospitals, clinics, schools, industrial plants, private and nursing homes".
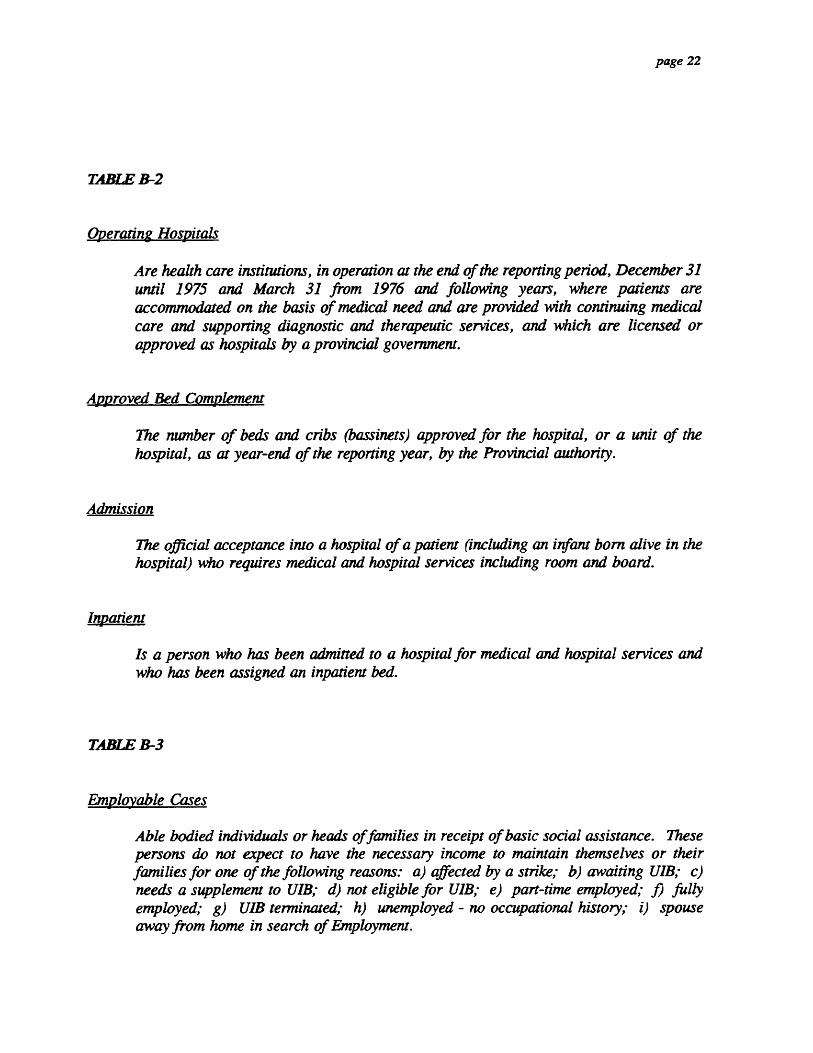
page 22
TABLE B-2
Operating Hospitals
Are health care institutions, in operation at the end of the reporting period, December 31 until 1975 and March 31 from 1976 and following years, where patients are accommodated on the basis of medical need and are provided with continuing medical care and supporting diagnostic and therapeutic services, and which are licensed or approved as hospitals by a provincial government.
Approved Bed Complement
The number of beds and cribs (bassinets) approved for the hospital, or a unit of the hospital, as at year-end of the reporting year, by the Provincial authority.
Admission
The official acceptance into a hospital of a patient (including an infant born alive in the hospital) who requires medical and hospital services including room and board.
Inpatient
Is a person who has been admitted to a hospital for medical and hospital services and who has been assigned an inpatient bed.
TABLE B-3
Employable Cases
Able bodied individuals or heads of families in receipt of basic social assistance. These persons do not expect to have the necessary income to maintain themselves or their families for one of the following reasons: a) affected by a strike; b) awaiting UIB; c) needs a supplement to UIB; d) not eligible for UIB; e) part-time employed,- f) fully employed,- g) UIB terminated; h) unemployed - no occupational history; i) spouse away from home in search of Employment.
0
0
• 0 ID
0 0 0 0 0 0 0 • 0 0 •
0 0 0 0 •
0 •

OS
OO
SO
IPO
OS
•118
1111
1111
0011
911M
OO
MO
IPO
OO
MO
OS
IPO
page 23
Other Cases
a) Persons in receipt of social assistance who do not have the necessary income to maintain themselves or their families for reasons other than unemployment and insufficient earnings, for example: a) attending school; b) illness or disability over 6 months; c) caring for children or expecting a child; d) or age. Therefore some double counting does occur in the "Other Cases" category.
Persons Dependent Upon
Individuals and heads of families and persons in families dependent upon Social Assistance.
TABLE B-6
Canada Pension Plan
The Canada Pension Plan, which started in 1966, is a contributory social insurance program designed to help people who work in Canada build a better future for themselves and their families by providing a basic level of protection against the contingencies of retirement, disability and death. The Plan operates in all parts of Canada, except in the Province of Quebec, which has its own similar pension program. However, the plans are closely co-ordinated so that contributors are protected wherever they may work in Canada. The amounts payable for each type of benefit available under the Plan are adjusted annually in accordance with the Consumer Price Index.
Retirement Pensions
Retirement pensions were first payable in January 1%7 with the pensionable age being lowered gradually to age 65 by 1970. A person must contribute to the Plan for a minimum of ten calendar years to qualify for a full Retirement Pension.
Disability Pension
Disability pensions are available to contributors who have severe and prolonged physical or mental impairment that prevents them from pursuing any substantially gainful occupation. A monthly benefit amount is paid for each dependent child of a disabled contributor (Disabled Contributor's Child's Benefit).

page 24
Survivors Benefit
Survivors benefits include a lump sum Death Benefit payable to the estate of the deceased contributor; a monthly pension payable to the surviving spouse; and monthly benefits for the dependent children of the deceased contributor (orphan's benefits).
Combined Pensions
Applies to a person who receives a survivors pension together with a retirement or a disability pension.

al • page 25
O . 0
TABLE B-1 e NUMBER OF PHYSICIANS, DEN T1STS AND REGISTERED NURSES • PER 1,000 POPULATION, NEWFOUNDLAND - LABRADOR
1968 TO 1991
Year Physicians (1) Dentists (1) Registered Nurses (2)
PER 1,000 POPULATION Registered
Physicians (1) Dentists (1) Nurses (2)
1968 379 46 2,134 0.75 0.09 4.22 1969 428 53 2,218 0.83 0.10 4.32 1970 466 57 2,475 0.90 0.11 4.79 1971 1972
479 504
60 61
2,649 2,558
0.90 0.93
0.11 0.11
4.97 4.73
1973 605 67 2,815 1.10 0.12 5.14 1974 660 63 3,031 1.20 0.11 5.50 1975 732 88 3,504 1.31 0.16 6.28 1976 779 103 3,925 1.38 0.18 6.96 1977 803 106 4,109 1.42 0.19 7.25 1978 809 116 4,314 1.42 0.20 7.59 1979 1980
822 866
111 110
4,485 4,687
1.44 1.51
0.19 0.19
7.85 8.16
1981 892 123 3,507 1.55 0.21 6.08 1982 943 129 4,207 1.64 0.22 7.30 1983 976 128 3,868 1.68 0.22 6.66 1984 981 135 3,868 1.69 0.23 6.65 1985 975 137 4,326 1.68 0.24 7.45 1986 1,042 137 4,836 1.80 0.24 8.37 1987 1,070 135 4,590 1.86 0.23 7.96 1988 1,124 138 4,633 1.95 0.24 8.04 1989 1,165 137 4,959 2.02 0.24 8.59 1990 1,128 146 5,179 1.95 0.25 8.95 1991 1,104 135 5,301 1.90 0.23 9.14
0 1_ Represents Physicians and Dentists active as at year end. • 2 - Data prior to 1981 includes those who are also registered in other Provinces, thereafter
a inter-provincial duplicate registrations have been removed.
0 • Source: Canada Health Manpower Inventory, Health & Welfare Canada
0 • • • • 0
0 . 0 a • ID ID • 11111 III •
ao 0
• •
IIII 0
III ID • ID
0 AD

TABLE B-2 SELECTED STATISTICS OF OPERATING HOSPITALS, NEWFOUNDLAND AND LABRADOR, 1953 TO 1991
Year Operating Hospitals'
Approved Bed Complement'
Approved Bed Complement
Per 1,000 Population'
Annual Admissions"
Annual Admissions Per Bed"
1953 41 1,825 4.77 31,091 17.04 1954 42 1,849 4.68 32,144 17.38 1955 43 1,883 4.64 36,321 19.29 1956 44 1,868 4.50 37,628 20.14 1957 47 1,792 4.23 41,136 22.96 1958 49 1,916 4.44 47,786 24.94 1959 49 1,960 4.44 45,057 22.99 1960 47 1,935 4.32 47,194 24.39 1961 41 1,730 3.78 49,808 28.79 1962 42 1,864 3.98 53,647 28.78 1963 43 2,232 4.69 55,396 24.82 1964 45 2,544 5.27 56,982 22.40 1965 46 2,649 5.43 63,338 23.91 1966 47 3,089 6.27 65,115 21.08 1967 47 3,122 6.24 69,901 22.39 1968 47 2,982 5.89 74,953 25.14 1969 47 2,995 5.83 77,620 25.92 1970 47 2,982 5.77 78,539 26.34 1971 47 2,997 5.62 82,443 27.51 1972 47 3,000 5.54 83,946 27.98 1973 47 3,138 5.73 85,119 27.13 1974 47 3,143 5.70 90,976 28.95 1975 47 3,173 5.69 92,400 29.12 1976-77 47 3,183 5.64 91,508 28.75 1977-78 47 3,195 5.64 89,068 27.88 1978-79 47 3,251 5.72 92,402 28.42 1979-80 47 3,304 5.79 91,947 27.83 1980-81 47 3,311 5.77 92,307 27.88 1981-82 47 3,699 6.42 89,254 24.13 1982-83 46 3,682 6.39 94,044 25.54 1983-84 43 3,569 6.14 91,675 25.69 1984-85 43 3,607 6.21 91,655 25.41 1985-86 42 3,598 6.19 90,691 25.21 1986-87 42 3,636 6.29 86,796 23.87 1987-88 42 3,620 6.28 88,181 24.36 1988-89 42 3,643 6.32 80,967 22.23 1989-90 38 3,489 6.04 83,837 24.03 1990-91 38 3,433 5.93 78,667 22.91
* - At December 31, 1953 to 1975 and at March 31, 1976-77 to 1986-87. ' * - Admissions during calendar year 1953 to 1975 and during fiscal year
(April to March) 1976-77 to 1986-87.
Additional Data: Hospital Statistics relating to facilities; available services provided; personnel employed; educational facilities; and finances.
Source: Statistics Canada 83-217, 83-232 and Health Division, Institutional Statistics Section.
page 26
SIIS
SO
OS
OIS
SO
MM
OO
SO
SO
OM
OS
SO
SIS
SII
SS
OO
SS

1973 1.974 1975 1976 1977 1978 1979 1980 1981 1982 1983
Employable Cases:(1)
Number at March 31 4,791 3,707 4,362, 4,198 4,133 3,817 5,441 6,048 6,340 5,000 5,321
Persons Dependent upon at March 31 .. 20,067 21,070 17,465 19,540
Other Cases:
Number at March 31 18,494 17,628 16,846 15,795 15,585 15,136 14,252 13,536 13,891 14,816 15,256
Persons Dependent upon at March 31 .. 29,169 29,241 31,276 32,059
Total Employable and Other Cases:
Number at March 31 23,285 21,335 21.208 19,993 19,718 18,953 19,693 19,584 20,231 19,816 20,577
Persons Dependent upon at March 31 73,582 65,673 63,638 57,653 53,883 49,752 48,827 49,236 50,311 48,741 51,599
1984 1985 1986 1987 1988 1989 1990 1991 1992 1993
Employable Cases:(1)
Number at March 31 6,487 5,289 5,646 6,777 6.246 5,008 5,946 5,851 7,554 9,646
Persons Dependent upon at March 31 22,591 17,660 18,086 20,679 18,750 14,774 15,378 15,622 18,976 20,634
Other Cases:
Number at March 31 15,054 15,194 13,788 14,303 13,701 14,353 15,337 17,206 20,054 21.928
Persons Dependent upon at March 31 30.133 30,585 28.319 29,131 28,180 29,331 31.620 35,197 40,192 46,342
Total Employable and Other Cases:
Number at March 31 21,541 20,483 19.434 21,080 19,947 19,361 21.283 23,057 27,607 31,574
Persons Dependent upon at March 31 52.724 48,245 46,405 49.810 46,930 44,105 46.998 50,819 59,168 66,976
0 ID
0
0
III 0
III 0 III 0
al • page 27
e • •
TABLE B-3 • SELECTED STATISTICS ON SOCIAL ASSISTANCE CASES Ili NEWFOUNDLAND AND LABRADOR
ID FOR MONTH OF MARCH, 1973 TO 1993
0 0 419 1 - Employable cases includes both short term & long term employable cases from 1984 to 1988.
0 Additional Data: Reason for assistance; kind of assistance; by Welfare District; by occupation and sex.
0 Source: Department of Social Services.
0 al 0 al • is • so

SII
IIS
SM
OS
11
1111
011
11011611
11
1 S
OO
SI IIIS
MO
SO
OO
SID
OS
OS
TABLE B-4 FAMILY ALLOWANCE AND CHILD TAX CREDIT STATISTICS NEWFOUNDLAND AND LABRADOR, FISCAL YEARS 1949-50 TO 1991-92
page 28
Year
FAMILY ALLOWANCE(1) CHILD TAX CREDIT(2)
Families Receiving
Allowance in
March
Children for
Whom Allowances
Paid in March
Average Number
of Children Per
Family in March
Total Payments
During Fiscal
Year
Families
Receiving Child
Tax Credit
Total Payments
During Calendar
Year
($Millions) ($000)
1949-50 50,694 139,571 2.75 9.7
1950-51 51.663 145,230 2.81 10.2
1951-52 52.552 150,995 2.87 10.6
1952-53 53,800 157,280 2.92 11.0
1953-54 55.102 163,292 2.96 11.5
1954-55 56,692 169,760 2.99 12.0
1955-56 58,223 175,474 3.01 12.4
1956-57 59,572 181,237 3.04 12.9
1957-58 80,961 187,035 3.07 14.1
1958-59 62,203 192,030 3.09 15.2
1959-60 63,245 196,447 3.11 15.6
1960-61 64,464 201,512 3.13 16.0
1961-62 65,705 204,855 3.12 18.3
1962-63 66,657 207,120 3.11 16.6
1963-64 67,635 209,180 3.09 16.7
1984-65 68,418 210,016 3.07 16.9
1965-66 69,346 210,512 3.04 16.9
1968-67 70.435 210,082 2.98 17.0
1967-68 72.041 210,812 2.93 17.0
1968-69 73,786 210,938 2.86 17.0
1969-70 74,922 209,866 2.80 17.0
1970-71 76,405 208,804 2.73 17.0
1971-72 78,708 209,340 2.66 17.0
1972-73 80,818 208,470 2.58 16.9
1973-74 86,012 223,540 2.60 29.3
1974-75 88,902 226,492 2.55 55.6
1975-76 91.514 225.904 2.47 60.2
1976-77 93,309 223,839 2.40 61.1
1977-78 94,422 220271 2.33 65.1
1978-79 95.192 215,447 2.26 63.7 81,113 35,170
1979-80 96,285 211,955 2.20 52.7 81,488 37,718
1980-81 97,193 208,189 2.14 56.6 81.851 40,584
1981-82 97,474 203,073 2.08 61.3 78.344 39,437
1982-83 98,035 199,572 2.04 66.3 83,842 55,921
1983-84 98,087 195,386 1.99 68.8 78,516 49,708
1984-85 97,579 190,345 1.95 70.3 77,291 50,657
1985-86 97,054 185,621 1.91 71.1 83,045 55,946
1986-87 96,281 180,452 1.87 89.9 78,270 59,802
1987-88 95,139 175,265 1.84 68.6 75,370 59,351
1988-89 94,108 170,454 1.81 67.6 75,240 69,310
1989-90 93,128 186,311 1.79 66.8 70,760 68,887
1990-91 91,845 161,969 1.76 66.2 67,760 65,902
1991-92 90,045 157,367 1.75 65.9 67,170 65,387
1. Commencing January 1974 Family Allowances were payable on behalf of children under 18 years of age who were wholly or
substantially maintained by a parent or other individual resident in Canada. Prior to that time Family Allowance was paid
on behalf of children under 16 years who had to be not only dependent but also attending school in accordance with provincial law.
The rate structure for Family Allowance Payments changed over time. To September 1973 monthly rates ranged from $5 to $8 per
child depending on the age of the child. Commencing October 1973 a similar allowance was paid to all children regardless
of age increasing from $12.00 per child in October 1973 to $20.00 in January 1974; to $22.08 in January 1975; $23.89 in
January 1977; $25.68 in January 1978; back to $20.00 in January 1979; to $21.80 in January 1980; $23.96 in January 1981;
$26.91 in January 1982; $28.52 in January1983; $29.95 in January 1984; $31.27 in January 1985; $31.58 in January 1986.
$31.93 in January 1987 and to $32.38 in January 1988.
2. Commencing in 1978 Child Tax Credit could be claimed by the person who received Family Allowance as of December of the
tax year. Payments were $200 per eligible child and this amount was reduced by 5% if family net income was over $18,000 in
1978; $218 in 1979 and reduced by 5% if family net income was over $19,620; $238 in 1980 and reduced by 5% if family net
income was over $21.380; $261 in 1981 and reduced by 5% if family net income was over $23,470; $343 in 1982 to 1984 and
reduced by 5% of family net income was over $26,330; $367 in 198.5 and $384 in 1986 and reduced by 5% if Family Net Income
was over $26,330.
3. The Family Allowance Program ended in December 1992 and was replaced in January 1993 by the Child Tax Benefit.
Additional Data: Monthly Accounts changing province of residence; Families receiving Allowance by size of Family.
Source: Income Security Programs Branch, Health and Welfare, Canada. Revenue Canada, Taxation Statistics.

III 1111 IIII iii TABLE B-5
OLD AGE SECURITY AND GUARANTEED INCOME SUPPLEMENT STATISTICS • NEWFOUNDLAND, FISCAL YEARS 1951-52 TO 1992-93
page 29
1111
1111
1 161
111 .
11•1
10
9
GUARANTEED
OLD AGE SECURITY(1) INCOME SUPPLEMENT(2) SPOUSE'S ALLOWANCE(4)
Net Net
Net Pensions Supplements Allowances
Pensioners Paid During Pensioners Paid During Pensioners Paid During
in March Fiscal Year in March Fiscal Year in March Fiscal Year
(#) ($ Minions) (#) ($) (#) ($)
1951-52
1952-53
14,177
14,792
1.7
7.0
-
-
-
-
-
-
-
-
1953-54 15,343 7.2 - -
1954-55 15,693 7.5 - - - -
1955-56 15,973 7.6
1956-57 16,248 7.7 - - - -
1957-58 16,557 9.5 - - - -
1958-59 16,782 11.0 - -
1959-60 17,008 11.1 - -
1960-61 17,379 11.4 - - - -
1961-62 17,801 11.9 - - - -
1962-63 18,184 14.0 - - - -
1963-64 18,905 15.3 - - - -
1984-65 18,886 16.8 - - -
1965-66 21,184 17.6 - - -
1966-67 23,733 19.7 18,037 1.5 -
1967-68 25,865 24.0 21,165 4.9
1968-89 28,702 24.8 23,004 7.6
1969-70 31,628 28.0 24,835 8.4 -
1970-71 32,129 30.6 25,914 9.1 -
1971-72 32,872 31.2 27,485 16.0 -
1972-73 33,441 33.1 28,279 21.3 -
1973-74 34,261 42.1 28,874 22.2 -
1974-75 35,488 48.3 29,266 24.8 - -
1975-76 36,491 55.4 29,713 28.0 2,379 1.7
1976-77 37,595 61.9 30,820 30.7 2,849 5.5
1977-78 39,046 68.6 31,840 33.4 2,904 6.1
1978-79 40,538 77.5 32,809 38.5 3,015 6.7
1979-80 42,448 88.3 34,101 47.6 3,176 7.9
1980-81 43,538 100.3 35,435 61.2 3,358 9.5
1981-82 44,745 115.9 36,252 71.9 3,526 11.7
1982-83 45,942 132.3 36,843 80.5 3,620 12.4
1983-84 47,417 145.6 37,771 86.4 3,558 12.9
1984-85 48,949 156.6 39,286 99.0 3,537 13.4
1985-86 50,174 168.4 40,136 110.2 5,072 17.6
1986-87 51,411 178.5 40,786 114.8 5,183 22.2
1987-88 52,576 191.4 41,325 120.0 5,109 22.5
1988-89 53,515 202.3 41,640 124.5 4,994 22.0
1989-90 54,296 216.7 41,770 130.4 5,009 22.7
1990-91 55,042 229.2 41,839 133.4 4,851 22.5
1991-92 56.252 248.3 42,028 139.8 4,676 22.8 1992-93 57,456 259.5 42,136 143.5 4,682 22.5
II Ill ilb 0 II II III III 11111 • 0
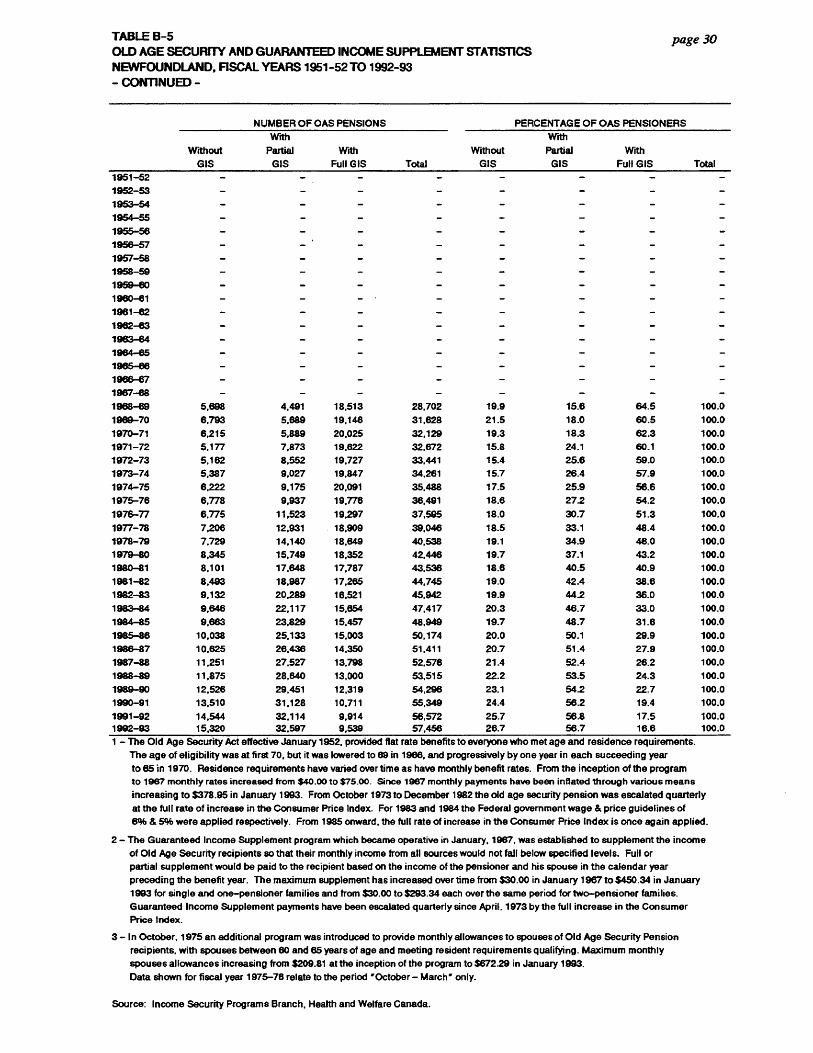
TABLE B-5 page 30 OLD AGE SECURITY AND GUARANTEED INCOME SUPPLEMENT STATISTICS NEWFOUNDLAND, FISCAL YEARS 1951-52 TO 1992-93 41111 - CONTINUED -
NUMBER OF OAS PENSIONS PERCENTAGE OF OAS PENSIONERS
Without GIS
With Partial With
GIS Full GIS Total Without
GIS
With Partial With
GIS Full GIS Total 1951-52 - - - - - - - - 1952-53 - - - - - - - - 1953-54 - - - - - - - - 1954-55 - - - - - - - - 1955-56 - - - - - 1956-57 - - - - - - - - 1957-58 - - - - - 1958-59 - - - - - - - - 1959-60 - - - - 19e0-e1 - - - • - - - - - 1961-62 - - - - - - - -
1982-63 - - - - - - - - 1963-64 - - - - - - - - 1964-65 - - - - - - - - 1985-86 - - - - - - - - 1966-67 - - - - - - - - 1967-88 - - - - - - - - 1968-69 5,698 4.491 18.513 28,702 19.9 15.6 64.5 100.0
1989-70 6,793 5,689 19,14.6 31,628 21.5 18.0 60.5 100.0
1970-71 6,215 5,889 20,025 32,129 19.3 18.3 62.3 100.0 1971-72 5.177 7,873 19,622 32,672 15.8 24.1 60.1 100.0 1972-73 5,162 8,552 19.727 33,441 15.4 25.6 59.0 100.0 1973-74 5,387 9.027 19.847 34.261 15.7 26.4 57.9 100.0 1974-75 6,222 9.175 20,091 35,488 17.5 25.9 56.6 100.0 1975-76 6,778 9,937 19,776 38,491 18.6 27.2 54.2 100.0 1976-77 6.775 11,523 19,297 37,595 18.0 30.7 51.3 100.0
1977-78 7,206 12,931 18,909 39,046 18.5 33.1 48.4 100.0 1978-79 7.729 14,140 18,649 40.538 19.1 34.9 48.0 100.0 1979-80 8,345 15,749 18,352 42.446 19.7 37.1 43.2 100.0 1980-81 8,101 17,648 17,787 43,536 18.8 40.5 40.9 100.0 1981-82 8,4.93 18,987 17,265 44,745 19.0 42.4 38.6 100.0 1982-83 9,132 20,289 18,521 45,942 19.9 44.2 36.0 100.0
1983-84 9,646 22,117 15,854 47,417 20.3 46.7 33.0 100.0 1984-85 9.663 23.829 15,457 48,949 19.7 48.7 31.6 100.0
1985-86 10,038 25,133 15,003 50,174 20.0 50.1 29.9 100.0 1986-87 10,625 26.436 14,350 51,411 20.7 51.4 27.9 100.0 1987-88 11.251 27.527 13.798 52.576 21.4 52.4 28.2 100.0 1988-89 11,875 28,640 13,000 53,515 22.2 53.5 24.3 100.0 1989-90 12,526 29,451 12,319 54,296 23.1 54.2 22.7 100.0 1990-91 13,510 31,128 10,711 55,349 24.4 56.2 19.4 100.0
1991-92 1992-93
14,544 15,320
32,114 32,597
9,914 9,539
58,572 57,456
25.7 26.7
56.8 56.7
17.5 16.6
100.0 100.0
2 - The Guaranteed Income Supplement program which became operative in January, 1967, was established to supplement the income of Old Age Security recipients so that their monthly income from all sources would not fall below specified levels. Full or partial supplement would be paid to the recipient based on the income of the pensioner and his spouse in the calendar year preceding the benefit year. The maximum supplement has increased over time from $30.00 in January 1967 to $450.34 in January 1993 for single and one-pensioner families and from $30.00 to $293.34 each over the same period for two-pensioner families. Guaranteed Income Supplement payments have been escalated quarterly since April, 1973 by the full increase in the Consumer Price Index.
3 - In October, 1975 an additional program was introduced to provide monthly allowances to spouses of Old Age Security Pension recipients, with spouses between 80 and 65 years of age and meeting resident requirements qualifying. Maximum monthly spouses allowances increasing from $209.81 at the inception of the program to $672.29 in January 1993. Data shown for fiscal year 1975-76 relate to the period 'October - March" only.
Source: Income Security Programs Branch, Health and Welfare Canada.
411 ID - ill 4111 II 0
.
II III II III III ID - III III II III
1 - The Old Age Security Act effective January 1952, provided flat rate benefits to everyone who met age and residence requirements. In The age of eligibility was at first 70, but it was lowered to 89 in 1966, and progressively by one year in each succeeding year
to 65 in 1970. Residence requirements have varied over time as have monthly benefit rates. From the inception of the program • to 1967 monthly rates increased from $40.00 to $75.00. Since 1967 monthly payments have been inflated through various means
increasing to $378.95 in January 1993. From October 1973 to December 1982 the old age security pension was escalated quarterly III at the full rate of increase in the Consumer Price Index. For 1983 and 1984 the Federal government wage & price guidelines of 6% & 5% were applied respectively. From 1985 onward, the full rate of increase in the Consumer Price Index is once again applied. •
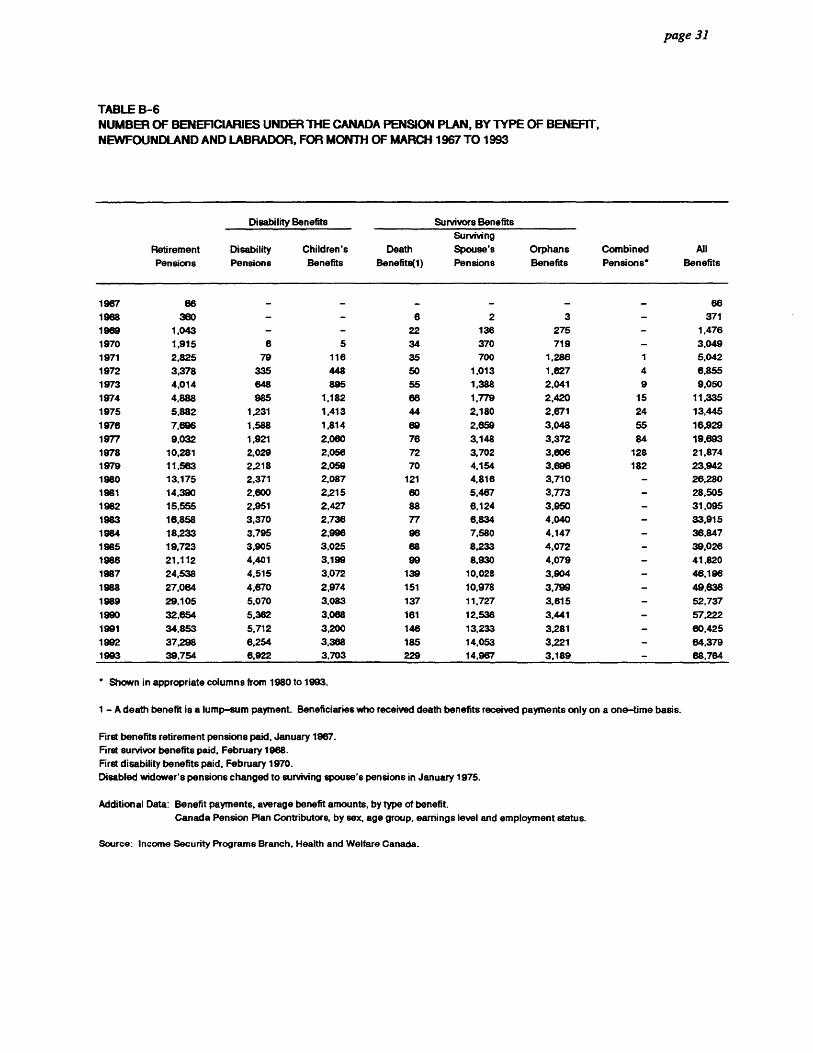
IlO
OS
OO
OS
OS
OS
OM
0119119
0•
1111
0•1
111
11
OS
OS
08
1 11 1
11011118
page 31
TABLE B-6 NUMBER OF BENEFICIARIES UNDER THE CANADA PENSION PLAN, BY TYPE OF BENEFIT, NEWFOUNDLAND AND LABRADOR, FOR MONTH OF MARCH 1967 TO 1993
Disability Benefits Survivors Benefits
Surviving
Retirement Disability Children's Death Spouse's Orphans Combined All
Pensions Pensions Benefits Benefits(1) Pensions Benefits Pensions* Benefits
1967 66 - - - - - - 66
1968 360 - - 6 2 3 - 371
1969 1,043 - - 22 136 275 - 1,476
1970 1,915 6 5 34 370 719 - 3,049
1971 2,825 79 116 35 700 1,286 1 5,042
1972 3,378 335 448 50 1,013 1,627 4 6,855
1973 4,014 648 895 55 1,388 2,041 9 9,050
1974 4,888 985 1,182 66 1,779 2,420 15 11,335
1975 5,882 1,231 1,413 44 2,180 2,671 24 13,445
1976 7,696 1,588 1,814 69 2,659 3,048 55 16,929
1977 9,032 1,921 2,080 76 3,148 3,372 84 19,693
1978 10,281 2,029 2,056 72 3,702 3,606 128 21,874
1979 11,563 2,218 2,059 70 4,154 3,696 182 23,942
1980 13,175 2,371 2,087 121 4,816 3,710 - 26,280
1981 14,390 2,600 2,215 60 5,467 3,773 - 28,505
1982 15,555 2,951 2,427 88 6,124 3,950 - 31,095
1983 16,858 3,370 2,736 77 6,834 4,040 - 33,915
1984 18,233 3,795 2,996 96 7,580 4,147 - 36,847
1985 19,723 3,905 3,025 68 8,233 4,072 - 39,026
1986 21,112 4,401 3,199 99 8,930 4,079 - 41,820
1987 24,538 4,515 3,072 139 10,028 3,904 - 46,196
1988 27,064 4,670 2,974 151 10,978 3,799 - 49,636
1989 29,105 5.070 3,083 137 11,727 3,615 - 52,737
1990 32,654 5,362 3,068 161 12,536 3,441 57,222
1991 34,853 5,712 3,200 148 13,233 3,281 - 60,425
1992 37,298 6,254 3,368 185 14,053 3,221 - 64,379
1993 39,754 6,922 3,703 229 14,967 3,189 - 68,764
* Shown in appropriate columns from 1980 to 1993.
1 - A death benefit is a lump-sum payment. Beneficiaries who received death benefits received payments only on a one-time basis.
First benefits retirement pensions paid, January 1967.
First survivor benefits paid, February 1968.
First disability benefits paid, February 1970.
Disabled widower's pensions changed to surviving spouse's pensions in January 1975.
Additional Data: Benefit payments, average benefit amounts, by type of benefit.
Canada Pension Plan Contributors, by sex, age group, earnings level and employment status.
Source: Income Security Programs Branch, Health and Welfare Canada.

SOM
OO
MO
SS
OO
SIIII IS
MO
SM
OS
OS
O11
11011
MO
OO
S
SECTION C
LABOUR FORCE

SO
SO
OO
1 11 1
11
11
SO
SS
OO
SII
IIM
OS
SO
OS
SO
OM
OS
OS
OM
O
page 33
SECTION 'C'
TABLE C-I
Employed
The employed includes all persons who, during the reference week:
a) did any work* at all b) had a job but were not at work due to:
- own illness or disability - personal or family responsibilities - bad weather - labour dispute - vacation - other reason not specified above (excludes persons on lay-off and persons whose
job attachment was to a job to start a definite date in the future).
* Work includes any work for pay or profit. That is, paid work in the context of an employer - employee relationship, or self-employment. It also includes unpaid family work where unpaid family work is defined as unpaid work which contributed directly to the operation of a farm, business or professional practice owned or operated by a related member of the household.
Labour Force
The civilian labour force is composed of that portion of the civilian non-institutional population 15 years of age and over who, during the reference week, were employed or unemployed.
Not In The Labour Force
The not in the labour force is that portion of the civilian non-institutional population 15 years of age and over who, during the reference week, were neither employed nor unemployed.
Participation Rate
The participation rate represents the labour force as a percentage of the population 15 years of age and over. The participation rate for a particular group (age, sex, marital status, etc.) is the labour force in that group expressed as a percentage of the population for that group.
OS
OS
SO
SO
SO
OM
OO
SID
OO
OO
OO
SS
OO
SS
OM
OO
SS
OO
SO
O
page 34
Unemployed
The unemployed includes those persons who during the reference week:
a) were without work, but actively looked for work in the past four weeks (ending with reference week), and were available' for work
b) had not actively looked for work in the past four weeks but had been on layoff and were available for work
c) had not actively looked for work in the past four weeks but had a new job to start in four weeks or less from the reference week, and were available' for work
1 Persons in this group meeting the following criteria are regarded as available:
i) were full-time students seeking part-time work who also met condition (ii) below. (Full-time students looking for full-time work are classified as not available for work in the reference week)
ii) reported that there was no reason why they could not take a job in reference week, or, if they could not take a job it was because of "own illness or disability" or "personal or family responsibilities" or "already had a job"
2 Persons are classified as being on layoff only when they expect to return to the job from which they were laid of Prior to 1984 the criteria used was "... on layoff for 26 weeks or less". During 1983 this restriction was dropped.
Unemployment Rate
The unemployment rate represents the number of unemployed persons as a percent of the labour force. The unemployment rate for a particular group (age, sex, marital status, etc.) is the unemployment in that group expressed as a percent of the labour force for that group.
Employment/Population Ratio
The Employment/Population Ratio is the number of employed persons as a percent of the population 15 years and over.
1111•
90
00
1191 1
•01111
11O
SS
IIIIS
SO
SIM
OO
OS
SO
SS
OS
I DO
SO
S
page 35
TABLE C-2
See Table C-1
Labour Force
Refers to non-inmates 15 years and over who, in the week prior to enumeration, worked for pay or profit, helped in unpaid family work, looked for work, were on temporary lay-off, or had jobs from which they were temporarily absent because of illness, vacation, strike, etc. Persons doing housework in their own home or volunteer work only, are excluded from the labour force. Also excluded are female farm workers who indicated that they helped without pay in a family farm or business for less than 20 hours.
While the labour force concept has changed only marginally since 1951, the questions asked to measure this concept have changed markedly from census to census. Each set of labour force questions has produced different response problems resulting in data which are not entirely comparable. The major response problems since 1951 are: underenumeration of unpaid family workers (1951), underenumeration of unemployed labour force (1961), and overenumeration of female unpaid family workers (1971).
Age
Age classifications are based on a definition which specifies completed years of age at last birthday prior to the reference date.
TABLE C-4
Labour Force
The Labour Force concept is the same as the one that is used in Table C-3 with the restriction that persons looking for work who last worked prior to January, 1970, or January, 1980 respectively or who never worked are excluded.
Occupation
Refers to the specific kind of work the person did on the job, as determined by the reporting of the kind of work, the description of the most important duties and the job title. Data relate to the respondent's job in the week prior to enumeration if he or she had a job during that week or the job of longest duration since January, of the census year if not employed in that week. Persons with two or more jobs during the reference week were asked to give the information for the one at which they worked the most hours.

SO
SS
OM
OID
OO
SI IO
SSO
MO
SO
OS
SIS
OS
OS
OO
OS
IIS
OO
OS
page 36
TABLE C-5
Industry
The industry classes are based on the general nature of the business carried out in the establishment where the respondent was employed as indicated by the reporting of the name of the employer (or by the business name if self-employed) and the kind of business, industry or service engaged in by this establishment. Persons with two or more jobs were to report the information for the job at which they worked the most hours.
Like those of 1971, the 1981 Census data on industry were compiled in accordance with the 1970 Standard Industrial Classification and as far as feasible the 1971 census definition of the labour force. However, the resulting labour force universe still reflects certain differences. First, women working less than 20 hours per week without pay on a family farm were included in this universe in 1981 after exclusion in 1971. Second, the "looking for work" reference period was increased from one week in 1971 to four weeks in 1981. In addition to these changes, the data for the "unspecified or undefined" category were redistributed among new classes created at the major group level.
TABLE C-6
Employed Labour Force
See "Employed" in Table C-1.
TABLE C-7
See Table C-1
TABLE C-8
See Table C-1
Full-Time Employment
Full-time employment consists of persons who usually work 30 hours or more per week, plus those who usually work less than 30 hours but consider themselves to be employed full-time. Part-time employment consists of all other persons who usually work less than 30 hours per week.
Part-Time Employment
See Full-lime Employment

OS
SO
OO
OS
IIS
SO
OS
OS
IIIIIIM
OS
OO
OS
I III
OS
OS
SO
SO
SO
IM
page 37
TABLE C-1 LABOUR FORCE CHARACTERISTICS, NEWFOUNDLAND AND LABRADOR, ANNUAL AVERAGES, 1966 TO 1993
Year
Population 15 Years of
Age & Over
Labour Force Employed Unemployed
Not in the
Labour Force
Participation
Rate
Unemployment
Rate
Employment/ Population
Ratio
(.000) (.000) (.000) ('000) (,000) (%) (%) (%)
1966 292 131 123 8 161 44.8 5.8 42.2
1967 298 134 126 8 164 45.0 5.9 42.3
1968 306 136 126 10 170 44.3 7.1 41.2
1989 314 137 127 10 177 43.7 7.4 40.5
1970 320 139 129 10 181 43.4 7.3 40.2
1971 327 147 135 12 180 45.0 8.4 41.2
1972 335 154 140 14 181 46.2 92 41.9 1973 341 168 151 17 173 49.2 10.0 44.3
1974 348 171 149 22 177 49.2 13.0 42.8
1975 357 176 152 25 181 49.4 14.0 42.5
1976 366 181 157 24 186 49.4 13.3 42.8
1977 372 188 159 29 184 50.6 15.5 42.7
1978 377 194 162 31 183 51.5 16.2 43.1
1979 383 200 170 30 183 52.3 15.1 44.3
1980 389 205 178 27 184 52.7 13.3 45.7
1981 395 208 179 29 187 52.6 13.9 45.3
1982 399 208 173 35 191 52.2 16.7 43.4
1983 406 212 172 40 194 52.2 18.7 42.4
1984 411 218 174 44 193 53.0 20.2 42.3
1985 414 220 174 46 194 53.2 20.8 42.1 1986 418 221 179 42 194 53.3 19.2 43.0
1987 419 223 183 40 196 53.2 17.9 43.6
1988 423 231 193 38 192 54.6 16.4 45.6
1989 428 238 201 38 190 55.7 15.8 48.9
1990 433 242 201 41 191 56.0 17.1 48.4
1991 436 241 197 44 195 55.3 18.4 45.1
1992 440 236 188 48 204 53.6 20.2 42.8
1993 442 234 186 47 209 52.8 20.2 42.1
1982-93 data are based on the 1986 Census sample; 1977-81 based on the 1981 Census sample; 1972-76 based on the 1976 Census sample; and the 1966-71 on the 1971 Census sample.
Additional Data:
Monthly; Economic Regions, St. John's CMA; seasonally adjusted data, sex, age, marital status, class of worker, education, hours worked
full-time, part-time, family status, industry, occupation, duration of unemployment, unemployed by looking/not looking for work, reason
for leaving last job, unemployed by type of work sought, families with at least one unemployed person by number of employed persons and
persons not in the labour force: by reason for leaving last job, who looked for work in the last 6 months by reason for not looking now ("discouraged workers"), and time lapsed since leaving previous job.
Source: Statistics Canada, 71-529,71-220.

1111
119
1111
•111
911
1111
•110
OO
SO
OS
OO
MO
OM
OS
OO
OM
O0
11e
page 38
TABLE C-2 LABOUR FORCE CHARACTERISTICS FOR MALES & FEMALES NEWFOUNDLAND AND LABRADOR, 1975 TO 1993
MALES
Year
Male
Population
15 and Over
Labour
Force
.
Employed Unemployed
Not in the
Labour Force
Participation
Rate
Unemployment
Rate
Employment/
Population
Ratio
(.000) (,000) (,000) (.000) (,000) (%) (%) (%) 1975 181 121 105 17 59 67.1 13.6 57.9
1976 185 123 107 16 62 66.6 13.2 57.8
1977 187 125 106 20 62 86.8 15.7 56.3
1978 189 127 107 20 62 67.3 16.1 56.5
1979 192 131 112 19 60 68.5 14.7 58.4
1980 195 132 114 17 63 67.7 13.2 58.8
1981 197 132 114 18 65 67.0 13.8 57.8
1982 200 130 107 23 70 65.0 17.3 53.8
1983 205 134 108 26 71 65.4 19.4 52.7
1984 208 135 107 28 73 65.0 20.9 51.4
1985 210 135 106 29 75 64.2 21.4 50.5
1986 213 135 109 26 78 63.5 19.5 51.1
1987 207 131 109 22 76 63.3 16.8 52.7
1988 209 134 114 20 75 64.2 15.2 54.4
1989 211 136 115 21 76 64.2 15.4 54.3
1990 214 137 113 23 77 63.9 17.1 52.9
1991 216 136 110 26 80 62.8 18.9 50.9
1992 217 132 105 27 85 80.9 20.4 48.5
1993 219 131 104 27 88 59.9 20.7 47.5
FEMALES
Year
Female
Population
15 and Over
Labour
Force Employed Unemployed
Not in the
Labour Force
Participation
Rate
Unemployment
Rate
Employment/
Population
Ratio
(,000) (.000) (.000) (.000) (.000) (%) (%) (%)
1975 176 55 47 8 121 31.2 14.7 26.6
1976 181 58 50 8 124 31.8 13.5 27.5
1977 184 63 53 10 121 34.1 15.2 28.9
1978 187 67 56 11 121 35.5 16.6 29.6
1979 191 68 58 11 122 35.9 16.0 30.1
1980 194 73 63 10 121 37.8 13.5 32.5
1981 198 76 65 11 122 38.2 14.0 32.9
1982 201 79 66 13 122 39.2 15.9 33.0
1983 206 80 86 14 126 39.0 18.0 32.0
1984 210 86 89 17 124 41.0 19.9 32.9
1985 212 89 70 19 123 41.8 21.1 33.0
1986 214 91 72 19 123 42.8 20.7 33.8
1987 212 92 74 18 120 43.3 19.6 34.8
1988 214 97 79 18 117 45.3 18.2 37.1
1989 217 103 se 17 114 47.4 16.3 39.7
1990 219 105 87 18 113 48.2 17.0 40.0
1991 221 106 87 19 115 47.9 17.7 39.4
1992 222 103 83 21 119 46.5 19.9 37.2
1993 224 103 83 20 121 as 19.6 36.9
Additional Data: See Table C-1
Source: Statistics Canada, 71-529, 71-001.
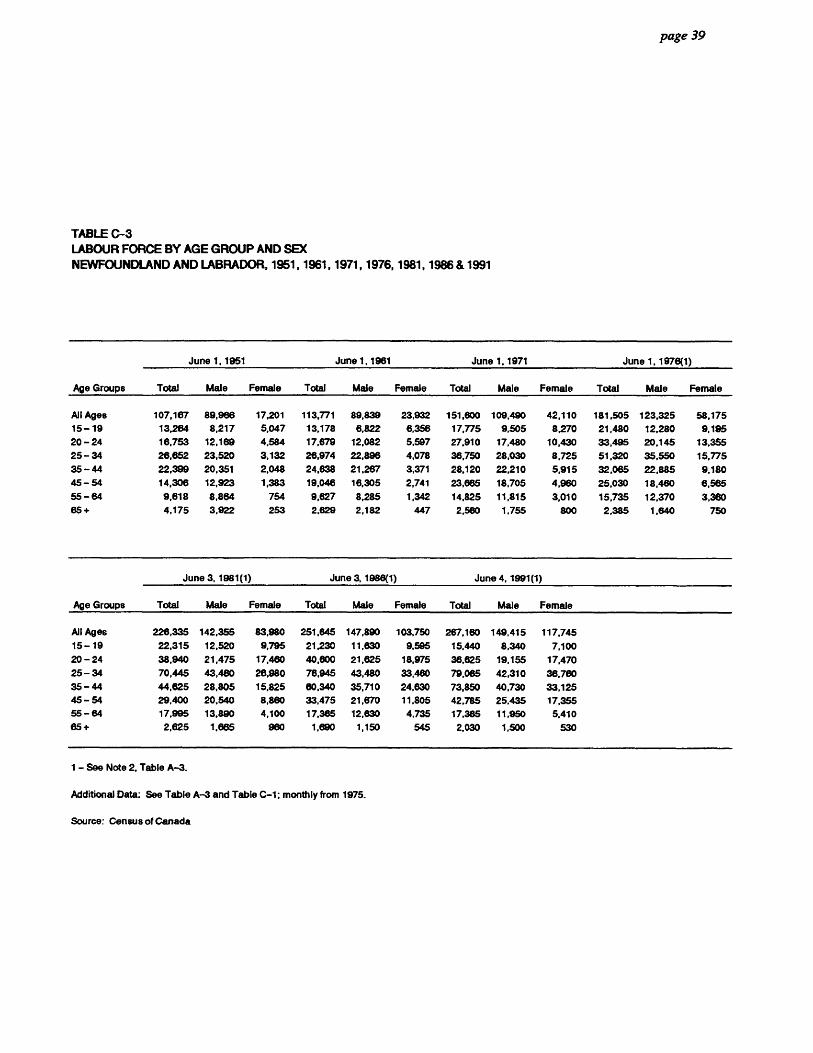
011
1111
911
111 1
1 1O
OO
SO
MO
SO
SIO
SII
OS
OO
MO
SIIIIIIS
II
SO
OS
page 39
TABLE C-3 LABOUR FORCE BY AGE GROUP AND SEX NEWFOUNDLAND AND LABRADOR, 1951, 1961, 1971, 1976, 1981, 1986 & 1991
Age Groups
June 1 1951 June 1, 1961 June 1. 1971 June 1, 1976(1)
Total Male Female Total Male Female Total Male Female Total Male Female
All Ages 107,167 89,966 17,201 113,771 89,839 23,932 151,800 109,490 42,110 181,505 123,325 58,175
15 -19 13,264 8,217 5,047 13,178 6,822 6,356 17,775 9,505 8,270 21,480 12,280 9,195
20 - 24 16,753 12,169 4,584 17,679 12,082 5,597 27,910 17,480 10,430 33,495 20,145 13,355
25 - 34 26,852 23,520 3,132 28,974 22,896 4,078 38,750 28,030 8,725 51,320 35,550 15,775
35 - 44 22.399 20,351 2,048 24.638 21,267 3,371 28.120 22,210 5,915 32,085 22,885 9,180
45 - 54 14,306 12,923 1,383 19,048 16,305 2,741 23,665 18,705 4,960 25,030 18,460 6,565
55 - 64 9,618 8,864 754 9,627 8,285 1,342 14,825 11,815 3,010 15,735 12,370 3,360
65 + 4,175 3,922 253 2,829 2,182 447 2,580 1,755 800 2,385 1,840 750
Age Groups
June 3, 1981(1) June 3, 1988(1) June 4, 1991(1)
Total Male Female Total Male Female Total Male Female
All Ages 226,335 142,355 83,980 251,645 147,890 103,750 267,160 149,415 117,745
15 - 19 22,315 12.520 9,795 21.230 11,630 9,595 15,440 8,340 7,100
20 - 24 38,940 21,475 17,460 40,600 21,625 18,975 38,625 19,155 17,470
25 - 34 70,445 43,480 26,980 76,945 43,480 33,480 79,065 42,310 36,780
35 - 44 44,825 28,805 15,825 60,340 35,710 24,e30 73,850 40,730 33,125
45 - 54 29,400 20,540 8,880 33,475 21,670 11,805 42,785 25,435 17,355
55 - 64 17.995 13,890 4,100 17,365 12,630 4,735 17.365 11,950 5,410
65 + 2,625 1,665 980 1,690 1,150 545 2,030 1,500 530
1- See Note 2, Table A-3.
Additional Data: See Table A-3 and Table C-1; monthly from 1975.
Source: Census of Canada

OS
IIS
OS
SO
OS
OO
OM
OO
SOM
OS
SO
SII
IIS
MO
OM
OS
OS
page 40
TABLE C-4 LABOUR FORCE BY OCCUPATION GROUP, NEWFOUNDLAND AND LABRADOR, 1971, 1981, 1986 & 1991
June 1, June 3, June 3, June 4,
1971(1) 1981(1) 1986(1) 1991(1)
1. All Occupations 147,990 222,475 247,095 267,155
2. Managerial, Administrative & Related Occupations 5,095 11,050 17,965 21,905
3. Occupations in Natural Sciences, Engineering & Mathematics 3,035 4,795 4,995 5,825
4. Occupations in Social Sciences & Related Fields 740 2,345 3,485 4,855
5. Occupations in Religion 620 850 1,045 1,005
6. Teaching and Related Occupations 6,950 11,435 12,795 14,345
7. Occupations in Medicine and Health 5,755 9,695 10,770 13,330
8. Artistic, Literary, Recreational & Related Occupations 785 1,370 2,080 2,845
9. Clerical and Related Occupations 16,905 32,115 35,485 40,200
10. Sales Occupations 13,480 19,280 16,950 20,120
11. Service Occupations 16,245 24,375 29,805 34,230
12. Farming, Horticultural & Animal Husbandary Occupations 1,555 1,915 1,930 2,685
13. Fishing, Hunting, Trapping & Related Occupations 7,260 12,030 13,035 12,690
14. Forestry & Logging Operations 2,275 3,740 3,975 3,575
15. Mining and Quarrying including Oil and Gas Field Operations 2,130 2,280 1,595 1,545
16. Processing Occupations 9,400 21,165 21,375 20,165
17. Machining & Related Occupations 1,995 2,585 2,190 2,535
18. Product Fabricating, Assembling & Repairing Occupations 6,395 9,475 9,660 10,295
19. Construction Trades Occupations 15,040 19,770 21,280 20,415
20. Transport Equipment Operation Occupations 9,440 10,720 9,780 11,145
21. Materials Handling & Related Occupations 4,235 4,445 4,810 4,265
22. Other Crafts and Equipment Operating Occupations 2,165 2,500 2,260 2,365
23. Occupations, Not Elsewhere Classified 1,985 5,285 9,410 8,195
24. Occupations Not Stated 14,500 9,250 10,425 8,625
1 - See Note 2, Table A-3.
Additional Data: See Table A-3 and Table C-1.
Source: Census of Canada
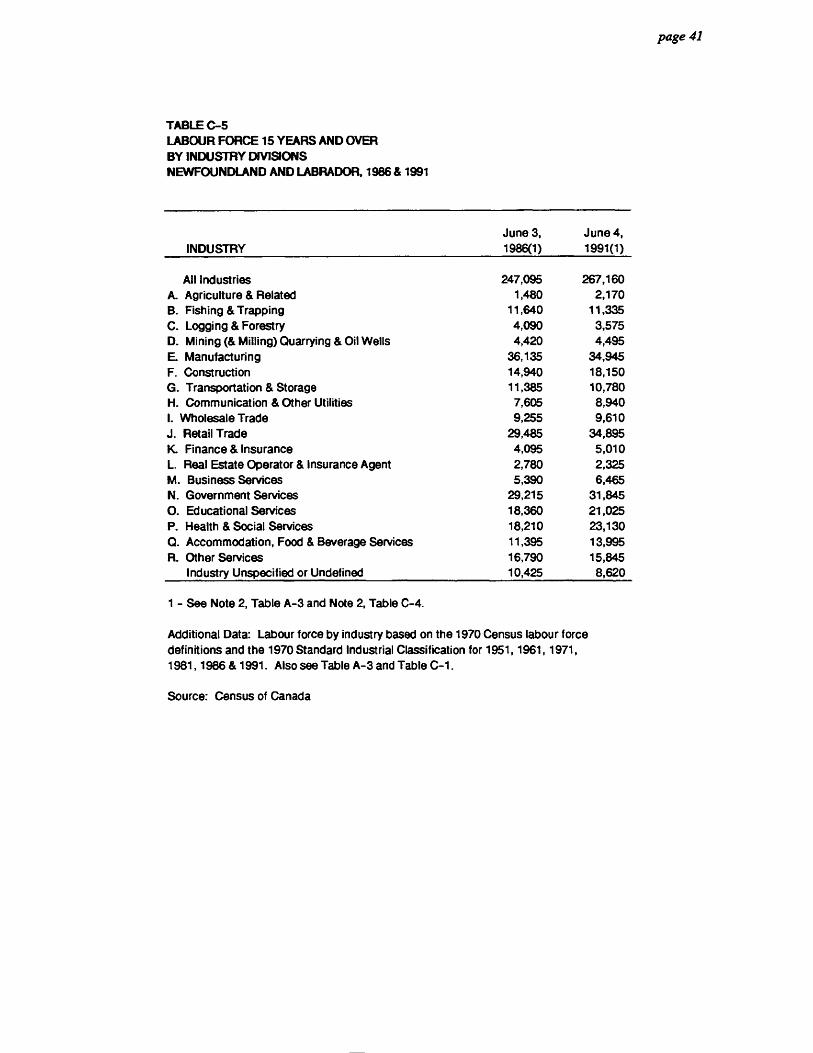
a • • • a s • a a a fa a a a al • a • a • a a • • a • s sr a • • a • • • a
gb
ill
0
fi TABLE C-5
• LABOUR FORCE 15 YEARS AND OVER BY INDUSTRY DIVISIONS NEWFOUNDLAND AND LABRADOR, 1986 & 1991
June 3, June 4, INDUSTRY 1986(1) 1991(1)
All Industries 247,095 267,160 A. Agriculture & Related 1,480 2,170 B. Fishing & Trapping 11,640 11,335 C. Logging & Forestry 4,090 3,575 D. Mining (& Milling) Quarrying & Oil Wells 4,420 4,495 E Manufacturing 36,135 34,945 F. Construction 14,940 18,150 G. Transportation & Storage 11,385 10,780 H. Communication & Other Utilities 7,605 8,940 I. Wholesale Trade 9,255 9,610 J. Retail Trade 29,485 34,895 K. Finance & Insurance 4,095 5,010 L. Real Estate Operator & Insurance Agent 2,780 2,325 M. Business Services 5,390 6,465 N. Government Services 29,215 31,845 0. Educational Services 18,360 21,025 P. Health & Social Services 18,210 23,130 Q. Accommodation, Food & Beverage Services 11,395 13,995 R. Other Services 16,790 15,845
Industry Unspecified or Undefined 10,425 8,620
1 - See Note 2, Table A-3 and Note 2, Table C-4.
Additional Data: Labour force by industry based on the 1970 Census labour force definitions and the 1970 Standard Industrial Classification for 1951, 1961, 1971, 1981, 1986 & 1991. Also see Table A-3 and Table C-1.
Source: Census of Canada
page 41

page 42
TABLE C-6 EMPLOYED LABOUR FORCE BY INDUSTRY, NEWFOUNDLAND & LABRADOR, 1975 TO 1993
Community.
Transportation, Finance, Business
Total Communication Insurance & & Personal Public
Year Total Primary(1) Fishing Manufacturing Construction & Other Utilities Trade Real Estate Services Administration
(.000)
1975 152 14 5 16 13 20 32 5 40 12
1976 157 14 6 19 13 20 30 4 44 12
1977 159 13 4 18 11 23 26 5 47 15
1978 162 12 5 21 11 20 31 6 46 15
1979 170 18 10 23 13 19 31 5 47 15
1980 178 18 11 27 12 18 31 6 50 16
1981 179 20 12 25 11 18 33 7 49 17
1982 173 17 10 22 10 19 29 6 52 19
1983 172 16 10 22 10 17 31 5 52 18
1984 174 17 10 19 11 18 30 6 55 18
1985 174 20 12 19 9 15 31 5 56 18
1986 179 18 12 21 10 16 32 6 56 20
1987 183 19 12 21 11 16 35 6 58 18
1988 193 19 12 24 11 16 36 6 63 18
1989 201 18 10 24 11 18 37 7 67 19
1990 201 19 11 22 10 17 38 6 70 19
1991 197 18 12 19 11 17 37 6 69 19
1992 188 16 10 16 10 17 36 7 69 17
1993 186 17 11 17 9 16 36 6 68 18
1 - Total Primary includes Agriculture; Forestry; Fishing & Trapping; and Mining.
Additional Data: Monthly; More detailed industry data.
Source: Statistics Canada, 71-001,71-529,71-220.

1111
00
1111
OO
OM
OO
MO
SO
11
01
1 10
OO
MO
OM
OO
MO
SO
O
page 43
TABLE C-7 UNEMPLOYMENT RATE AND PARTICIPATION RATE, FOR ST. JOHN'S CMA AND ECONOMIC REGIONS NEWFOUNDLAND AND LABRADOR, 1975 TO 1993
UNEMPLOYMENT RATE
Economic Region
Year St. John's
CMA(1)
I
Avalon Peninsula
II Burin
Peninsula & South
Coast
III West Coast-
Northern Peninsula- Labrador
IV Central
Newfoundland -Northeast
Coast
Total Newfoundland and Labrador
(%) 1975 8.4 10.8 11.0 19.1 16.9 14.0 1976 10.2 12.6 12.5 16.0 13.8 13.3 1977 11.5 14.0 16.0 20.7 14.2 15.5 1978 13.5 15.4 14.6 19.6 15.7 16.2 1979 11.9 13.7 11.7 18.7 16.8 15.1 1980 11.2 12.0 10.3 15.3 15.5 13.3 1981 10.8 12.0 16.1 16.9 13.9 1982 12.5 15.1 19.0 18.8 16.7 1983 13.3 16.2 22.6 20.4 18.7 1984 14.8 18.0 23.5 21.3 22.5 20.2 1985 14.8 17.5 22.0 25.5 22.5 20.8 1986 13.1 16.5 20.7 22.2 21.5 19.2 1987 12.5 15.2 22.3 19.7 17.9 1988 11.3 13.8 19.9 19.6 16.4 1989 10.8 13.3 17.5 18.9 15.8 1990 11.8 14.5 20.7 17.4 20.8 17.1 1991 13.1 15.8 24.9 19.8 20.1 18.4 1992 15.4 17.3 27.4 22.3 21.1 20.2 1993 13.9 17.2 28.2 23.7 20.1 20.2
PARTICIPATION RATE
Economic Region
Year St. John's
CMA(1)
I
Avalon Peninsula
II Burin
Peninsula & South
Coast
III West Coast-
Northern Peninsula- Labrador
IV Central
Newfoundland -Northeast
Coast
Total Newfoundland and Labrador
(%) 1975 59.1 51.3 47.4 52.6 44.1 49.4 1976 59.8 51.8 48.6 49.4 45.1 49.4 1977 58.8 52.9 46.7 52.1 47.6 50.6 1978 60.4 54.9 46.4 54.4 46.4 51.5 1979 62.1 56.0 49.0 55.4 45.1 52.3 1980 63.1 56.4 49.3 54.7 46.4 52.7 1981 63.1 55.9 49.9 55.2 46.0 52.6 1982 62.5 55.3 48.1 54.9 46.3 52.2 1983 62.2 55.5 46.3 54.9 46.1 52.2 1984 63.0 57.2 49.6 53.8 46.1 53.0 1985 63.8 57.3 50.1 56.6 43.8 53.2 1986 63.2 57.7 50.5 55.5 44.4 53.3 1987 62.8 57.0 49.5 58.1 43.3 53.2 1988 65.0 59.0 48.2 56.3 47.7 54.6 1989 63.6 58.5 51.3 57.3 50.9 55.7 1990 66.6 59.9 53.0 55.2 50.7 56.0 1991 66.1 59.4 51.1 55.0 49.7 55.3 1992 63.7 56.5 51.5 53.2 49.6 53.6 1993 63.7 55.9 50.1 51.2 49.7 52.8 1 - CMA = Census Metropolitan Area. Source: Statistics Canada, 71-529, 71-220, 71-001.

SO
OS
OS
SO
OS
SO
OS
SO
OO
SIP
SO
OO
OS
SO
IIIIS
MO
SO
MI
SS
page 44
TABLE C-8 FULL-TIME AND PART-TIME EMPLOYMENT BY SEX NEWFOUNDLAND AND LABRADOR 1975 TO 1993
Year
TOTAL FULL-TIME PART-TIME Both Sexes Male Female
Both Sexes Male Female
Both Sexes Male Female
(,000)
1975 152 105 47 143 102 41 9 6
1976 157 107 50 147 104 43 10 7
1977 159 106 53 148 102 45 11 ' 8
1978 162 107 56 150 103 47 12 4 9
1979 170 112 58 156 109 48 13 4 10
1980 178 114 63 164 111 53 14 4 10
1981 179 114 65 165 110 55 14 4 10
1982 173 107 66 158 103 55 15 4 11
1983 172 107 65 155 102 53 17 5 12
1984 174 106 68 156 101 56 17 5 12
1985 174 104 69 156 99 56 19 5 13
1986 179 107 72 160 102 58 19 5 14
1987 183 109 74 163 103 60 20 6 14
1988 193 113 79 172 107 64 22 6 15
1989 201 115 86 178 108 70 23 7 17
1990 201 113 87 178 107 71 23 7 16
1991 197 110 87 173 103 70 24 7 17
1992 188 105 83 163 97 66 25 8 17
1993 186 104 83 160 95 65 26 9 18 * Too small to be published.
Source: Statistics Canada, 71-529,71-220.
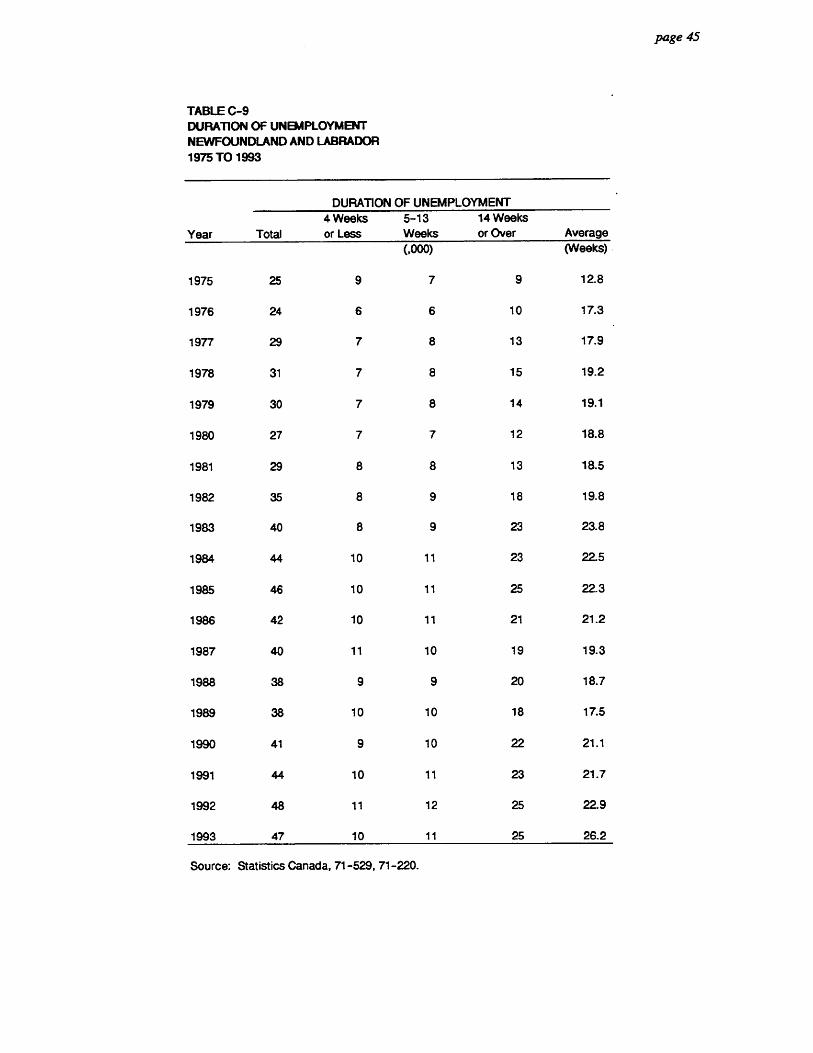
page 45
• TABLE C-9 DURATION OF UNEMPLOYMENT NEWFOUNDLAND AND LABRADOR
• 1975 TO 1993
0 DURATION OF UNEMPLOYMENT
Year Total 4 Weeks or Less
5-13 Weeks
14 Weeks or Over Average
(,000) (Weeks)
1975 25 9 7 9 12.8
1976 24 6 6 10 17.3
1977 29 7 8 13 17.9
1978 31 7 8 15 19.2
1979 30 7 8 14 19.1
1980 27 7 7 12 18.8
1981 29 8 8 13 18.5
1982 35 8 9 18 19.8
1983 40 8 9 23 23.8
1984 44 10 11 23 22.5
1985 46 10 11 25 22.3
1986 42 10 11 21 21.2
1987 40 11 10 19 19.3
1988 38 9 9 20 18.7
1989 38 10 10 18 17.5
1990 41 9 10 22 21.1
1991 44 10 11 23 21.7
1992 48 11 12 25 22.9
1993 47 10 11 25 26.2
• Source: Statistics Canada, 71-529, 71-220.
0
0
0
• •
di
III IIII • • • • SD • • ID II • • 0 0 ID • • II 0 ID • II III • •

page 46
TABLE C-10 UNEMPLOYMENT AND PERSONS NOT IN THE LABOUR FORCE WHO WANT WORK AND ARE AVAILABLE FOR WORK BY REASON FOR NOT SEEKING WORK NEWFOUNDLAND AND LABRADOR MARCH, 1979 TO 1993
Persons Not In The Labour Force Who Want & Are Available For Work
Year(1) Unemployed Total
Personal & Other
Reasons(2)
Labour Market
Reasons(3) (,000)
1979 37 27 7 20 1980 29 29 5 24 1981 30 31 8 23 1982 33 36 6 30 1983 45 37 6 30 1984 48 32 4 27 1985 51 36 5 31 1986 50 32 5 27 1987 50 33 5 29 1988 47 34 7 28 1989 42 35 6 29 1991 52 38 8 30 1992 56 42 7 34 1993 63 46 9 37
1 - As of March.
2 - Includes: 'Own illness or disability', 'Personal or family responsibilities', 'Going to School', 'Other reasons' and
'No reason given'.
3 - Includes: 'Waiting for recall', 'Waiting for replies' and 'Believes no work available'.
Source: Statistics Canada, 71-001.
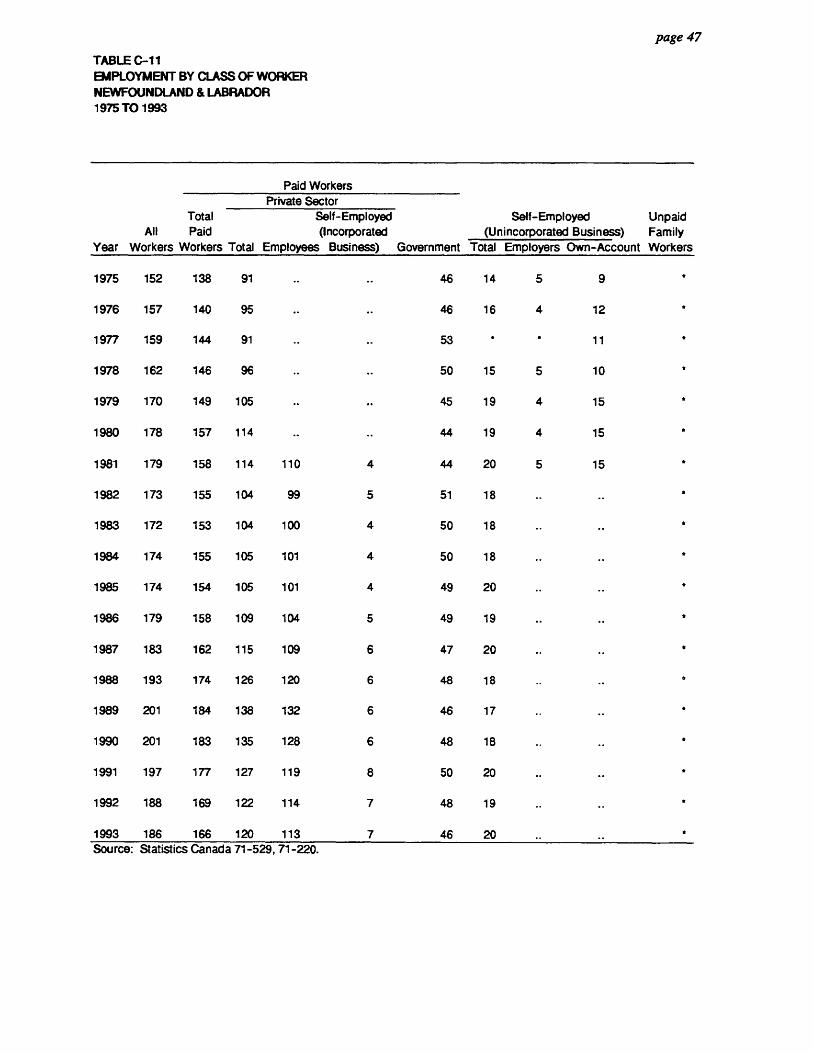
1111
110•
1111
MO
OM
OS
SIN
OO
S00000
11 111110M
OO
SO
SO
M
page 47
TABLE C-11 EMPLOYMENT BY CLASS OF WORKER NEWFOUNDLAND & LABRADOR 1975 TO 1993
Paid Workers Private Sector
Total Self-Employed Self-Employed Unpaid All Paid (Incorporated (Unincorporated Business) Family
Year Workers Workers Total Employees Business) Government Total Employers Own-Account Workers
1975 152 138 91 46 14 5 9 a
1976 157 140 95 46 16 4 12
1977 159 144 91 53 * a 11 a
1978 162 146 96 50 15 5 10
1979 170 149 105 .. 45 19 4 15
1980 178 157 114 44 19 4 15
1981 179 158 114 110 4 44 20 5 15
1982 173 155 104 99 5 51 18
1983 172 153 104 100 4 50 18
1984 174 155 105 101 4 50 18
1985 174 154 105 101 4 49 20 *
1986 179 158 109 104 5 49 19 a
1987 183 162 115 109 6 47 20 *
1988 193 174 126 120 6 48 18
1989 201 184 138 132 6 46 17 a
1990 201 183 135 128 6 48 18 a
1991 197 177 127 119 8 50 20
1992 188 169 122 114 7 48 19
1993 186 166 120 113 7 46 20 a
Source: Statistics Canada 71-529,71-220.
0 0 is 0 0 0 al • so sr • fo e • e 0 0 a al a 0 0 • a 0 0 • • so • • 0 vo a • a • •
• • • a •
SECTION D
WAGES AND WORKING CONDITIONS
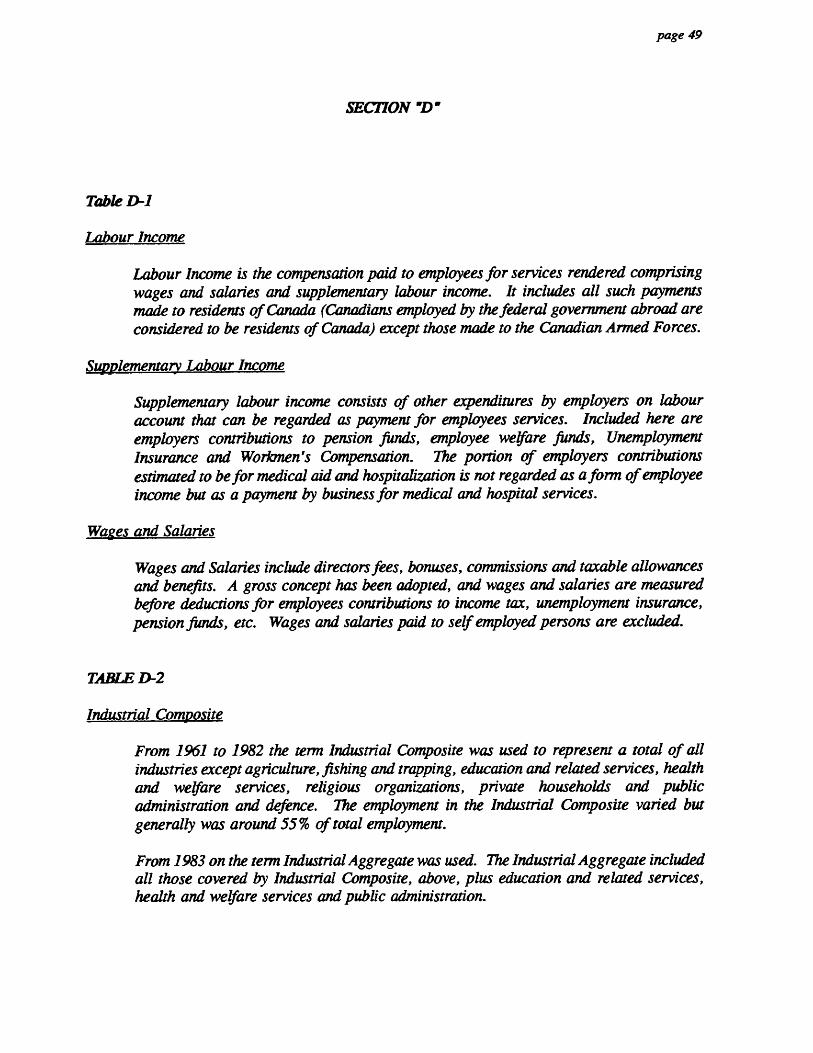
-SO page 49
SECTION 'D"
1111
Table D-1
III Labour Income
Labour Income is the compensation paid to employees for services rendered comprising wages and salaries and supplementary labour income. It includes all such payments made to residents of Canada (Canadians employed by the federal government abroad are
ID considered to be residents of Canada) except those made to the Canadian Armed Forces.
41111 Supplementary Labour Income
II Supplementary labour income consists of other expenditures by employers on labour
a account that can be regarded as payment for employees services. Included here are employers contributions to pension fluids, employee welfare funds, Unemployment
ID Insurance and Workmen's Compensation. The portion of employers contributions • estimated to be for medical aid and hospitalization is not regarded as a fonn of employee
0 income but as a payment by business for medical and hospital services.
• Wages and Salaries
0 al Wages and Salaries include directors fees, bonuses, commissions and taxable allowances
and benefits. A gross concept has been adopted, and wages and salaries are measured a before deductions for employees contributions to income tax, unemployment insurance,
ID pension funds, etc. Wages and salaries paid to self employed persons are excluded.
0
TABLE D-2 0
Industrial Composite
From 1961 to 1982 the term Industrial Composite was used to represent a total of all industries except agriculture, fishing and trapping, education and related services, health
• and welfare services, religious organizations, private households and public administration and defence. The employment in the Industrial Composite varied but generally was around 55% of total employment.
0 From 1983 on the term Industrial Aggregate was used. The Industrial Aggregate included all those covered by Industrial Composite, above, plus education and related services, health and welfare services and public administration.
•
• •
SO
OS
MO
IDO
OS
OS
OO
SO
SOM
MO
OS
SIS
OS
SO
OS
SO
OS
S
page 50
TABLE D-3
Beneficiaries
Beneficiaries represent the number of persons drawing $1.00 or more of unemployment insurance benefit for one week of each month. The week chosen is the same as that used by the Labour Force Survey (See Table C-1).
Contributor
Contributors are persons in insurable employment for whom deductions from earnings are made for unemployment insurance in a given year. Insurable employment refers to all paid workers in the labour force and members of the Armed Forces. The main exceptions are persons working fewer than 15 hours per week or earning less than 20% of the maximum weekly insurable earnings ($710 in 1992).
Persons Who Received Benefits
This represents the number of persons receiving $1.00 or more of unemployment insurance benefit in a given year. It is an unduplicated count of beneficiaries for the calendar year and should not be compared with the average number of beneficiaries per month (above). A beneficiary could be reported several times in the monthly statistics whereas the same person would be shown here only once.

III
• page 51
• TABLE D-1 WAGES AND SALARIES INCLUDING RETRO-ACTIVE PAYMENTS
. AND SUPPLEMENTARY LABOUR INCOME, BY INDUSTRY
• NEWFOUNDLAND AND LABRADOR, 1950 - 1992
• a Industry • II
Agriculture Fishing
• Forestry Mining
. Manufacturing • Construction
Transportation, Communications • & Other Utilities • Trade
Finance, Insurance & Real Estate • Commercial Service
. Education Hospitals and Welfare
• Religion and Domestic Federal Administration
• Provincial Administration • Municipal Administration
Other Administration • Wages & Salaries • Supplementary Labour Income
Total Labour Income
• Agriculture
• Fishing • Forestry
Mining • Manufacturing • Construction
Transportation, Communications,
• & Other Utilities Trade
ID Finance, Insurance & Real Estate • Commercial Service
Education • Hospitals and Welfare • Religion and Domestic
Federal Administration • Provincial Administration • Municipal Administration
Other Administration
• Wages and Salaries Supplementary Labour Income
. Total Labour Income
1950 1955 1960 1965 1970 1975 1980 ($,000,000)
0.5 0.6 0.9 0.8 1.0 2.2 4.9 1.4 2.3 3.3 5.5 8.2 11.0 36.1
11.9 13.6 20.9 18.2 19.5 32.9 39.4 7.7 14.2 18.2 35.8 48.1 103.6 145.7
21.0 28.7 32.8 43.7 74.3 127.9 268.9 5.3 14.9 25.6 41.6 75.7 113.5 122.5
18.6 30.4 41.7 65.0 100.7 216.3 328.0 16.3 27.7 37.3 57.1 81.3 171.4 269.7 1.2 1.8 3.6 7.4 16.2 49.2 100.9 3.4 5.4 8.1 18.0 38.2 92.3 154.3 3.4 7.5 13.4 25.9 59.3 154.9 282.6 2.3 5.3 9.6 18.2 40.6 97.0 190.8 2.8 4.2 5.5 8.2 11.0 16.9 26.3 3.7 6.9 12.7 16.4 28.5 61.0 112.0 4.2 7.4 8.8 14.8 22.1 51.6 102.8 0.1 1.1 1.5 2.9 4.5 17.8 25.9 9.4 16.4 16.0 14.9 10.5 2.1 3.0
113.3 188.5 260.1 394.4 639.6 1,321.7 2,213.9 3.6 7.4 11.4 18.3 36.4 93.7 156.5
116.9 195.9 271.5 412.7 676.0 1,415.4 2,370.4
1985 1988 1989* 1990* 1991* 1992* ($,000,000)
11.4 15.0 14.3 15.3 16.0 16.4 29.7 55.5 49.1 49.8 39.4 25.6 42.5 56.0 55.8 59.3 61.4 62.6
144.3 157.0 173.0 182.3 176.1 164.0 437.0 574.3 606.2 598.4 588.5 518.5 155.5 235.1 252.0 255.2 270.8 267.3
371.8 412.4 454.6 477.3 489.7 495.1 404.8 539.0 575.8 606.4 595.7 573.1 137.2 176.8 196.8 210.1 219.4 226.8 309.2 338.1 360.2 366.6 365.2 427.8 520.4 557.6 574.8 583.8 611.5 301.3 439.3 476.3 506.4 542.4 566.7 45.7 59.2 62.0 68.2 72.4 76.2
206.0 236.2 253.8 282.6 285.5 307.6 167.4 210.2 220.9 233.3 238.4 227.3 41.9 52.8 59.6 61.3 65.3 65.2 4.5 4.8 5.1 5.4 5.6 5.8
3,238.1 4,057.2 4,350.9 4,546.2 4,617.0 4,575.0 318.0 399.6 423.8 469.2 510.4 553.8
3,556.1 4,456.8 4,774.8 5,015.4 5,127.3 5,128.8
e • Industry
II Due to rounding figures may not add to totals.
• Additional Data: Monthly
a Source: Statistics Canada 72-005. al • 0
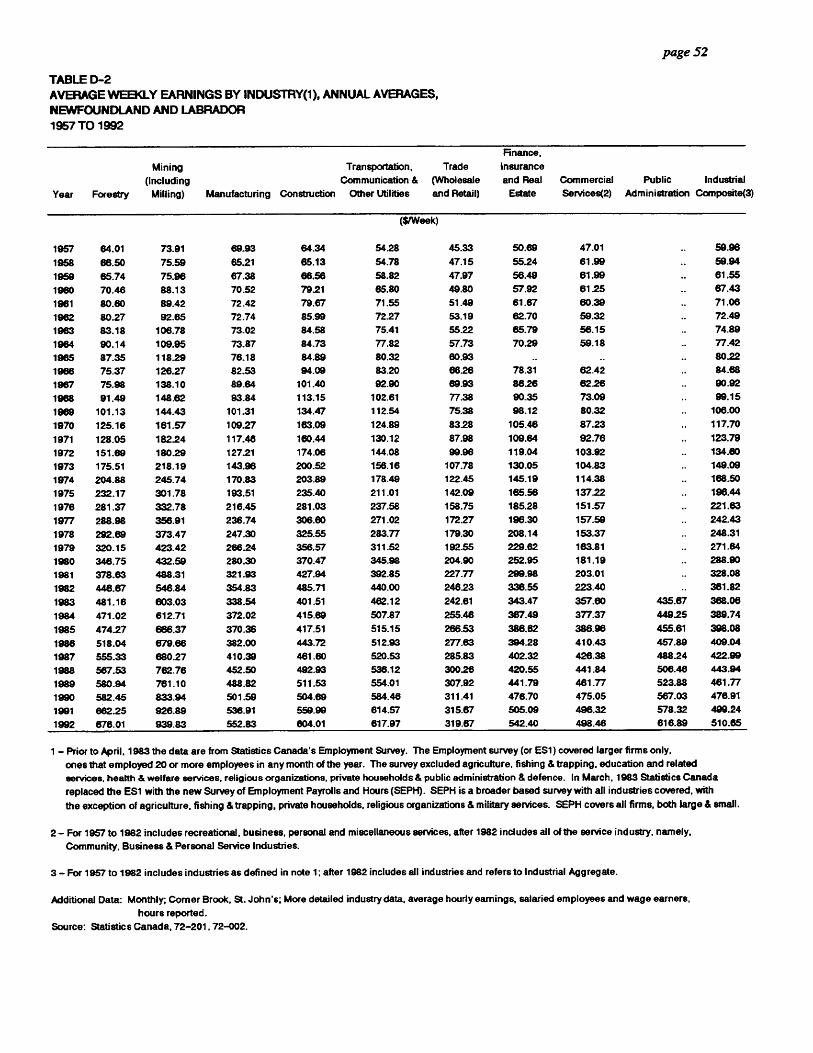
page 52
TABLE D-2 AVERAGE WEEKLY EARNINGS BY INDUSTRY(1), ANNUAL AVERAGES, NEWFOUNDLAND AND LABRADOR 1957 TO 1992
Rnance,
Mining Transportation, Trade insurance
(Including Communication & (Wholesale and Real Commercial Public Industrial
Year Forestry Milling) Manufacturing Construction Other Utilities and Retail) Estate Services(2) Administration Composite(3)
(S/Week)
1957 64.01 73.91 69.93 64.34 54.28 45.33 50.69 47.01 59.96
1958 66.50 75.59 65.21 65.13 54.78 47.15 55.24 61.99 59.94
1959 65.74 75.96 67.38 66.56 58.82 47.97 56.49 61.99 61.55
1960 70.46 88.13 70.52 79.21 65.80 49.80 57.92 61.25 67.43
1961 80.60 89.42 72.42 79.67 71.55 51A9 61.67 6029 71.06
1962 80.27 92.65 72.74 85.99 72.27 53.19 62.70 59.32 72.49
1963 83.18 106.78 73.02 84.58 75.41 55.22 65.79 56.15 74.89
1964 90.14 109.95 73.87 84.73 77.82 57.73 70.29 59.18 77.42
1965 87.35 118.29 76.18 84.89 80.32 80.93 .. .. 80.22
1966 75.37 126.27 82.53 94.09 83.20 66.26 78.31 62.42 84.68
1967 75.98 138.10 89.64 101.40 92.90 e9.93 86.26 62.26 90.92
1968 91.49 148.62 93.84 113.15 102.61 77.38 90.35 73.09 99.15
1969 101.13 144.43 101.31 134.47 112.54 75.38 98.12 80.32 106.00
1970 125.16 161.57 109.27 163.09 124.89 83.28 105.46 87.23 117.70
1971 128.05 182.24 117.48 160.44 130.12 87.98 109.64 92.76 123.79
1972 151.69 180.29 127.21 174.06 144.08 99.96 119.04 103.92 134.80
1973 175.51 218.19 143.96 200.52 156.16 107.78 130.05 104.83 149.09
1974 204.88 245.74 170.83 203.89 178.49 122.45 145.19 114.38 168.50
1975 232.17 301.78 193.51 235.40 211.01 142.09 165.56 137.22 196.44
1976 281.37 332.78 216.45 281.03 237.58 158.75 185.28 151.57 221.63
1977 288.98 356.91 236.74 306.60 271.02 172.27 196.30 157.59 242.43
1978 292.69 373.47 247.30 325.55 283.77 179.30 208.14 153.37 248.31
1979 320.15 423.42 26624 356.57 311.52 192.55 229.62 163.81 271.64
1980 346.75 432.59 280.30 370.47 345.98 204.90 252.95 181.19 288.90
1981 378.63 488.31 321.93 427.94 392.85 227.77 299.98 203.01 328.08
1982 446.67 546.84 354.83 485.71 440.00 24623 336.55 223.40 .. 381.82
1983 481.16 603.03 338.54 401.51 462.12 242.61 343.47 357.60 435.67 368.06
1984 471.02 612.71 372.02 415.69 507.87 255.48 367.49 377.37 449.25 389.74
1985 474.27 666.37 370.36 417.51 515.15 266.53 386.62 386.96 455.61 398.08
1986 518.04 679.66 382.00 443.72 512.93 277.63 394.28 410.43 457.89 409.04
1987 555.33 680.27 410.39 461.60 520.53 285.83 402.32 426.38 488.24 422.99
1988 567.53 762.76 452.50 492.93 536.12 30026 420.55 441.84 506.46 443.94
1989 580.94 761.10 488.82 511.53 554.01 307.92 441.79 481.77 523.88 461.77
1990 582.45 833.94 501.59 504.89 584.46 311.41 476.70 475.05 567.03 476.91
1991 662.25 926.89 536.91 559.99 614.57 315.67 505.09 496.32 578.32 499.24
1992 676.01 939.83 552.83 604.01 617.97 319.67 542.40 498.46 616.89 510.65
1 - Prior to April, 1983 the data are from Statistics Canada's Employment Survey. The Employment survey (or ES1) covered larger firms only,
ones that employed 20 or more employees in any month of the year. The survey excluded agriculture, fishing & trapping, education and related
services, health & welfare services, religious organizations, private households & public administration & defence. In March, 1983 Statistics Canada
replaced the ES1 with the new Survey of Employment Payrolls and Hours (SEPH). SEPH is a broader based survey with all industries covered, with
the exception of agriculture, fishing & trapping, private households, religious organizations & military services. SEPH covers all firms, both large & small.
2 - For 1957 to 1982 includes recreational, business, personal and miscellaneous services, after 1982 includes all of the service industry, namely,
Community, Business & Personal Service Industries.
3 - For 1957 to 1982 includes industries as defined in note 1; after 1982 includes all industries and refers to Industrial Aggregate.
Additional Data: Monthly; Corner Brook, St. John's; More detailed industry data, average hourly earnings, salaried employees and wage earners,
hours reported.
Source: Statistics Canada, 72-201, 72-002.
•
0 0 • •
0 •
• • •
•

ill Year
III 1949
1950
e 1951
1852
• 1953
III 1954
1955
III 1956
1957
III 1958
1959
III 1980
1961
• 1962
41I 1963
1964
III 1965
1986
0 1967
1968
III 1969
1970
III 1971
III 1972
1973
a 1974
1975
III 1976
1977
ID 1978
1979
0 1980
a 1981
1982
1111 1983
1984
111111 1985
1986
111 1987
1988
III 1989
III 1990
0 1992
al • page 53
• TABLE D-3 VALUE OF UNEMPLOYMENT INSURANCE CONTRIBUTIONS & BENEFITS
• AND NUMBER OF CONTRIBUTORS AND TOTAL AND AVERAGE NUMBER OF BENEFICIARIES Ili NEWFOUNDLAND AND LABRADOR
1949 TO 1992
ID II Value of
Employee Contributions Total Value of Unemployment Number of Contributors Total Number of Persons Average Number of
to Unemployment Insurance(3) Insurance Benefits(2) to Unemployment Insurance Who Received Benefits . Beneficiaries per Month
ID
($,000) ($,000)
1,501 (1)
4,986 (1)
1,842 (1)
2,819
4,654
6,893
7,232
8,485
12,144
18,188
15249
18,413
19,951
19,256
19,493
17,911
18,019
17,568
19,864
20,526
23,870
25,347
.. 30,578
4,579
6,392
70,496 163,580
90,595 172,970
86,290
75,250
11,393 114,334 181,980 85,020
13,858 159,059 187,040 94,700
18,362 183,007 188,310 95,360 39,504
18,392 215,875 196,350 103,050 42,330
19,722 250,674 198,200 109,610 46,445
20,088 234,114 199,990 105,070 44,559
21,969 265,484 202,630 103,807 44,158
32,872
243 384,143 120,494 293,725 207,790
32 209,290
107,248 45,438
54,274
48,161 459,921 216,670 125,216 59,061
52,084 498,881 223,020 127,521 63,024
56,965 554,405 228,110 131,588 85,638
60.456 614,276 229,880 136,919 67.363
65,200 651,198 238,630 141,421 67,673
71,400 751,775 247,700 146,034 71,193
63,700 823,752 253,820 150,777 75,902
91.794 987,021
77,400
19
77,400 848,127 251,480 150,765 73,935
248,680 153,956 80,153
1,095,894 155,587 81,432
III 1 - Includes Unemployment Assistance.
2 - From 1949 to 1978 the data are net payments, that is, gross payments after adjustments. After 1978 the data are gross payments.
III 3 - The new Unemployment Insurance Act came into force on June 27, 1971. Under this program coverage was almost universal as of January 2, 1972.
di Additional Data: Monthly; Districts, Census Divisions; age, sex, weeks on claim, type of benefit, occupation.
0 Source: Statistics Canada, 73-001, 73-201.
1111 III • III al

OO
OO
OS
SO
SS
OS
OS
SIO
OS
SO
SO
SS
OO
OS
OS
OS
OM
OS
SO
OO
TABLE D-4 MINIMUM WAGE RATE FOR EMPLOYEES NEWFOUNDLAND AND LABRADOR 1953 TO 1991
page 54
Effective Date Male Femal
($IHour)
February 28, 1953 0.50 May 1, 1953 0.50 June 15, 1955 0.50 0.35 November 1, 1963 0.70 0.50 May 1, 1968 1.10 0.85 July 1, 1970 1.25 1.00 June 1, 1972 1.40 1.10 January 1, 1974 1.80 1.80 July 1, 1974 2.00 2.00 January 1, 1975 2.20 2.20 January 1, 1976 2.50 2.50 June 1, 1979 2.80 2.80 July 1, 1980 3.15 3.15 March 31, 1981 3.45 3.45 January 1, 1983 3.75 3.75 January 1, 1985 4.00 4.00 April 1, 1988 4.25 4.25 April 1, 1991 4.75 4.75
Notes: Domestic employees in a private household are excluded.
Additional Data: Domestic help, younger persons.
Source: Department of Employment & Labour Relations.

SO
SIP
IOO
MO
SS
IIS
SS
OO
SI IS
OS
OO
SS
OO
OS
OS
SO
OO
SS
OS
O
page 55
TABLE D-5 NUMBER OF WORKERS INVOLVED AND DURATION IN PERSON-DAYS OF STRIKES AND LOCKOUTS NEWFOUNDLAND AND LABRADOR 1950 TO 1993
Year
Number of Strikes
& Lockouts
Number of Workers Involved
Person-Days Duration
1950 6 2,636 33,258 1951 6 3,196 24,280 1952 9 1,859 10,330 1953 2 592 2,352 1954 5 519 11,318 1955 5 852 19,060 1956 8 1,272 5,590 1957 6 571 27,454 1958 7 3,081 23,550 1959 3 2,888 177,460 1960 7 2,082 7,490 1961 5 238 1,810 1962 2 199 1,860 1963 9 741 8,490 1964 1 30 1,070 1965 4 774 2,110 1966 10 2,657 22,260 1967 9 1,679 8,660 1968 9 1,850 24,490 1969 8 3,890 168,130 1970 8 881 2,630 1971 36 6,578 177,931 1972 50 11,601 272,422 1973 76 24,887 234,768 1974 88 15,454 88,904 1975 68 13,456 368,504 1976 48 17,045 185,842 1977 44 11,988 128,297 1978 36 15,138 330,609 1979 34 7,472 51,758 1980 37 31,515 852,721 1981 30 5,360 44,931 1982 14 5,096 62,050 1983 21 9,548 177,407 1984 16 3,639 191,984 1985 16 2,933 91,540 1986 18 13,283 229,705 1987 14 4,770 64,382 1988 15 1,512 31,915 1989 17 9,142 255,481 1990 20 11,048 117,191 1991 13 1,892 15,988 1992 6 302 8,241 1993 10 550 35,347 Additional Data: Monthly; data by legality status. Source: 1959 to 1970 Labour Canada; 1971 to 1993
Dept. of Employment & Labour Relations

page 56
TABLE D-6 BASIC UNION WAGE RATES FOR MAJOR CONSTRUCTION TRADES AND INDEX FOR WAGE COMPOSITE, ST. JOHN'S, 1961 TO 1992
Reinforcing Structural Sheet
Cement Steel Steel Metal Composite Year Carpenter Finisher Electrician Labourer Plumber Erector Erector Worker Bricklayer Painter Index
(S PER HOUR) 1961=100
1961 1.92 1.74 2.22 1.48 2.18 1.92 2.33 1.85 2.24 1.70 100.0 1962 1.98 1.84 2.28 1.51 2.27 1.96 2.38 1.86 2.34 1.75 103.0 1963 2.04 1.93 2.40 1.55 2.30 2.00 2.38 2.00 2.44 1.78 105.8 1964 2.09 1.99 2.54 1.59 2.34 2.05 2.45 2.07 2.49 1.83 108.7 1965 2.18 2.06 2.66 1.64 2.42 2.10 2.54 2.17 2.57 1.90 112.9 1966 225 2.13 2.79 1.89 2.45 2.20 2.64 2.27 2.63 1.97 118.4 1967 2.33 2.22 2.92 1.74 2.73 2.28 2.74 2.38 2.71 2.15 122.6 1968 2.50 2.43 3.19 1.86 3.04 2.30 2.77 2.87 2.79 2.22 131.5 1969 2.70 2.61 3.33 1.99 3.31 2.50 3.01 3.05 3.11 2.36 141.5 1970 2.88 2.76 3.56 2.12 3.57 2.94 3.49 3.42 3.26 2.50 151.8 1971 3.10 2.97 3.81 2.48 4.05 3.30 3.93 3.65 3.36 2.75 166.1 1972 3.54 3.40 4.66 2.85 4.52 3.88 4.51 4.02 3.90 3.07 190.3 1973 4.06 4.10 5.67 3.28 5.33 4.55 5.20 4.58 4.60 3.66 223.5
1974 4.91 4.85 6.56 3.81 627 5.44 6.14 5.70 5.35 4.34 262.1 1975 5.90 6.18 7.83 4.95 728 8.58 7.45 7.02 6.53 5.33 312.6
1976 7.24 7.68 9.41 6.00 8.93 7.65 8.67 8.49 7.93 6.33 .. CO 1977 7.83 8.70 10.71 6.80 1023 8.25 9.32 9.87 8.97 6.84 1978 8.32 8.99 11.72 7.16 1125 8.67 9.77 10.85 9.26 7.12 1979 8.79 9.46 12.08 7.52 11.65 9.21 10.31 11.19 9.73 7.55 1980 9.26 10.09 12.56 8.11 12.16 9.74 10.84 11.77 10.34 8.49 1981 10.68 11.69 13.49 9.52 13.33 11.12 12.55 12.84 11.83 10.41 1982 11.55 12.74 14.26 10.56 14.07 11.92 13.35 13.47 12.81 11.14 1983 12.75 14.06 15.54 11.69 15.29 12.90 14.00 14.25 14.09 11.53 1984 12.31 1525 16.63 11.28 16.40 14.07 15.17 15.63 15.25 12.55 1985 10.88 16.30 17.37 9.58 17.35 14.92 16.02 16.50 16.30 13.49 1986 13.89 16.34 17.37 10.64 17.37 14.92 16.02 16.50 16.34 13.51 1987 14.84 16.34 17.37 13.80 17.37 14.92 16.02 16.50 16.34 13.51 1988 14.84 16.34 17.37 13.80 17.37 14.92 16.02 16.50 16.34 13.51 1989 15.11 16.57 17.67 13.88 17.58 15.13 16.24 16.72 16.57 13.62 1990 16.02 17.79 18.85 14.70 18.80 16.21 17.30 17.37 17.79 15.03
1991 16.29 18.06 19.15 15.00 19.09 16.43 17.51 17.37 18.06 15.45 1992 16.76 18.64 19.10 15.00 19.76 16.43 17.51 17.71 18.63 1623
1 - Composite Index discontinued in 1976.
Additional Data: Indexes, and wage rates with supplements.
Source: Statistics Canada 62-006, 62-008. •
0 • 0

OO
SO
SO
OSO
SM
OS
OS
OS
SID
OS
OO
MO
IIII
SS
OS
OS
SO
011e•
SECTION E
EDUCATION

110
911
00
01 1
1111
0111
1OS
OO
SS
OM
OO
OM
OO
MO
OO
11 1
1 119
1 19
page 57
SECTION 'E'
TABLE E-1
Public Schools
Schools which are supported by provincial grants, supplemented by local taxation and administered by a local school board in accordance with the education act of the province.
Special Classes
Those for students with special problems in the regular curricular of the public school system. The majority of these students are in remedial programs, primarily remedial Mathematics and Reading. To a lesser extent this category also includes students with various handicaps (sight, hearing) which are, however, not so serious as to cause these children to be referred to special institutions for their education.
TABLE E-2
Teachers
Teachers employed in Public Schools on a full-time basis only.
TABLE E-3
Full-Time Students
Up to Spring 1982 Students who are registered for the duration of any semester or session in at least four courses. From the Fall Semester 1982 those who are registered in at least 3 courses.
Partial Students
Up to Spring 1982 students registered in fewer than four courses in any semester were termed Partial Students. From Fall 1982 partial students are those registered in fewer than 3 courses in any semester. included are part-time off-campus students.
Graduate Students
Students that are formally admitted by the University to a program of studies leading to a Masters or Doctorate Degree or a Graduate Diploma.

SABLE E-1
Year(1)
.924-25
1926-26 -926-27
1927-28
11)928-29
1929-30
M930-31
w1931-32
M932-33
W1W1
‘11.1933-34
934-36
936-36
936-37
937-38
1938-39
61939-40
1940-41
01941-42
1942-43 1.1943-44
1944-45
libi 945-46
1946-47
.1947-48
1948-49
Mil 949-60
MMV1960-61
imk1951-62
W1952-63
W1963-64
964-66
1965-56 01956-57
1967-68
1111968-69
1969-60 -1 980-61
1981-82
1111see-e3
‘ r 1963-04
affi1984-86
ww1966-ea
AE11986-67
1111111967458
im1968-159
ow 19S9-70
1970-71
11971-72
1972-73 .1973-74 1974-75 .1975-78 1976-77
. 1977-78
1978-79 .1979-80 1960-81
An 1 961 -82
Mir 1982-83
Aft 1983-84
INV 1984-85 .1985-86
1988-87
1987-88
0 1988-89
1989-90
01990-91
1991-92
page 59
Kinder-
garten(2)
Grade
I
Grade
II
Grade
IU
Grade
IV
Grade
V
Grade
VI
Grade
VII
Grade
viii
Grade
ix
Grade
X
Grade
xi
Grade
XII
Special
Classes Unclassified Total
10,523 8,473 7,536 7,759 7,129 4,792 3,073 2.319 891 949 443 180 25 - 6,301 69,393
9,833 7,760 6,777 8,856 6,833 3,880 3,455 2.345 1,011 933 423 229 6 - 8,967 69,088
10,086 8,126 7,016 7,116 6,507 3,883 3,631 2,608 1,125 996 441 300 13 - 8,400 60,288
.. 20,675 8,055 8,428 7,610 4,855 4,155 2,990 1,486 1,436 581 402 38 - - 60,691
20,385 7,995 8,297 7,742 4,484 4,397 3,133 1,348 1,560 725 487 47 - - 80,680
20, 159 7,752 8,193 7,758 4,573 4,704 3,462 1,256 1,599 707 566 30 - - 60,759
19,902 7,715 7,932 7,509 4,406 5,077 3,522 1,226 1,918 785 628 2 - - 60,601
18,992 7,285 7,470 7,418 4,157 5,254 3,294 1,573 1,797 1,107 839 8 - - 59,194
.. 17,935 6,793 6,870 6,398 4,025 4,826 3,144 1,816 1,443 1,200 810 7 - - 56,267
18,196 6,849 7,149 6,039 3,886 4,646 2,944 1,858 1,380 1,153 939 - 15 - 65,054
20,124 7,084 7,064 6,212 3,801 4,795 3,059 1,936 1,427 1,091 977 - 39 - 67,409
21,187 7,631 7,412 6,126 3,558 3,834 2,712 3,086 1,532 1,094 1,043 - 95 - 59,310
22,742 8,490 7,078 6,199 4,331 3,480 2,495 3,127 2,076 1,287 1,084 - 108 - 62,497
20,692 9,140 7,804 6,483 5,473 3,884 2,840 2,867 2,016 1,4.58 1,462 - 153 - 64,272
19,391 9,082 8,181 7,010 5,995 4,722 3,134 2,896 1,876 1,591 1,732 - 287 85,897
18,790 8,936 7,939 7,252 8,213 5,038 3,834 2,983 1,968 1,496 1,898 - 365 - 66,508
18,538 8,413 8,288 7,190 6,504 5,170 3,866 3,425 2,047 1,512 1,826 - 405 - 67,184
18,484 8,251 7,843 7,293 6,134 5,298 3,934 3,021 2,376 1,543 1,569 415 86,181
18,434 8,484 7,788 7,255 6,503 5,177 4,181 3,025 2,129 1,832 1,221 - 410 - 66,439
18,792 8,490 7,855 7,082 6,488 5,509 4,271 3,233 2,425 1,711 1,314 - 491 - 67,641
19,748 8,566 7,932 7,289 6,371 5,655 4,550 3,322 2,880 1,890 1,308 - 446 - 69,737
19,783 8,711 7,963 7,203 6,440 5,470 4,557 3,571 3,023 1,957 1,394 - 388 - 70,460
19,901 8,964 8,126 7,302 6,559 5,746 4,469 3,479 3,124 2,408 1,433 - 409 - 71,920
19,740 8,907 8,555 7,670 6,708 5,616 4,732 3,434 3,304 2,190 1,600 - 484 - 72,940
19,759 9,292 8,527 8,050 7,241 5,967 4,824 3,644 3,273 2,489 1,591 - 429 - 75,086
18,422 10,151 8,923 8,375 7,883 6,838 5,408 4,028 3,631 2,660 1,809 47 428 78,271
17,212 10,417 9,572 8,474 7,774 6,809 5,905 4,185 3,931 2,734 1,849 49 417 - 79,328
.. 18,004 10,218 10,099 9,238 8,057 7,279 6,219 4,801 4,227 3,030 2,160 62 504 - 83,898
297 18,774 10,449 10,047 9,772 8,904 7,631 6,568 5,098 4,432 3,176 2,180 35 450 - 87,813
306 19,104 11,886 10,243 9,867 9,453 8,342 6,943 5,422 4,917 3,245 2,201 47 408 - 92,384
349 19,167 12,554 11,746 10,230 9,571 9,010 7,644 6,980 5,530 3,518 2,110 46 365 - 97,800 3,917 16,108 12,935 12,200 11,808 9,824 9,133 8,344 8,381 6,048 3,489 2,276 32 361 - 102,633
2,375 17,966 13,364 12,750 12,094 11,243 9,444 8,530 7,315 6,394 3,858 2,425 37 313 - 108,108
4,232 16,001 13,629 13,236 12,530 11,882 10,805 8.801 7,615 7,358 3,931 2,807 44 342 - 113,243 4,513 16,014 13,884 13,697 13,112 12,277 11,612 10,223 8,214 7,712 4,887 2,796 73 265 - 119,279
4,865 15,784 14,401 13,784 13,786 12,772 11,858 11,277 9,232 8,371 4,960 3,506 125 346 - 124,867
4,943 15,892 14,226 14,112 13,624 13,153 12,134 11,488 10,058 9,147 5,772 3,772 162 434 - 128,917
5,833 15,792 14,648 14,072 14,052 13,313 12,809 11,781 10,416 10,107 6,469 4,266 73 516 - 133,747
6,008 15,815 14,763 14,498 14,206 13,783 12,893 12,311 11,084 10,349 6,821 4,770 95 504 - 137,700
6,478 15,865 14,908 14,675 14,563 14,122 13,107 12,514 11,275 10,893 6,880 5,210 57 388 - 140,735
7,441 15,128 15,195 14,757 14,837 14,192 13,732 13,269 11,139 11,355 7,310 5,329 68 377 144,129
7,823 15,469 14,516 15,103 14,890 14,586 13,936 13,411 11,909 10,905 7,999 5,750 45 381 146,503 8,239 15,535 14,835 14,441 15,000 14,708 14,023 13,385 12,302 11,273 8,104 6,088 63 376 - 148,352 9,782 15,297 14,986 14,838 14,822 15,041 14,307 13,897 12,384 11,797 8,270 6,404 57 494 - 161,976
11,227 15,164 15,169 15,014 14,975 14,486 14,553 14,053 12,406 11,570 9,882 7,274 34 703 - 156,310
12,205 15,043 14,904 15,073 14,922 14,726 14,093 14,649 12,996 11,883 9,824 8,898 60 1,021 - 1130,097
12,310 14,919 14,523 14,707 14,831 14,643 14,437 14,172 13,351 12,093 9,865 9,124 61 1,879 - 160,915 12,887 14,428 14,745 14,238 14,577 14,471 14,305 14,628 13,112 12,128 10,518 9,610 65 3,108 - 102,818 12,618 14,147 14,179 14,368 14,003 14,418 14,242 14,535 13,458 11,813 10,335 9,481 54 4,082 - 181,723 12,289 13,229 13,804 13,840 14,243 14,056 14,408 14,328 13,524 11,944 9,938 9,169 43 5,020 - 169,831 12,512 12,855 13,025 13,888 13,911 13,916 13,883 14,342 13,212 12,347 10,382 8,861 88 5,414 - 158,014
12,276 12,884 12,593 13,073 13,650 13.907 14,088 14,056 13,207 12,381 10,804 9,143 32 5,882 - 157,758
12,782 12,828 12,598 12,685 12,997 13,508 13,774 14,310 13,179 12,656 10,469 9,303 162 EOM - 157,882
12,521 12,913 12,314 12,714 12,833 12,760 12,367 14,025 13,233 12,585 10,741 9,377 39 6,960 - 156,180
11,814 12,195 12,385 12,181 12,511 12,479 12,811 13,860 13,157 12,726 10,564 9,491 57 6.943 - 153,174
11,457 11,549 11,932 12,415 12,120 12,498 12,402 13,184 13,130 12,379 11,047 9,218 43 7,028 - 150,382 11= 11,318 11,319 11,930 12,381 12,139 12,302 12,698 12,528 12,537 10,930 9,708 37 7,292 194 148,533 10,661 11,019 10,959 11,194 11,895 12,210 11,915 12,519 12,307 11,713 10,887 10,128 59 7,783 156 145,185 10,566 10,534 10,763 10,893 11,091 11,565 12,133 12,272 12,132 11,854 10,300 10,083 78 8,277 158 142,517 9,823 10,448 10,185 10,829 10,740 11,012 11,548 12,523 11,872 11,588 10,311 9,530 8,903 8,533 - 147,803 9,902 9,572 10,045 10,124 10,552 10,486 10,889 12,110 12,026 11,203 10,358 9,590 9,483 (3) 8,796 - 145,116 9,375 9,842 9,298 9,837 9,924 10,374 10,404 11,383 11,839 11,549 10,279 9,728 9,733 (3) 9,171 - 142,332 9,338 9,002 9,272 9,017 9,808 9,722 10,115 10,714 11,047 11,286 10,789 9,677 10,370 (3) 9,441 - 139,378 9,086 8,998 8,588 9,029 8,757 9,416 9,564 10,394 10,619 10,864 10,592 9,974 10,382 (3) 10,165 - 136,221 8,969 8,778 8,543 8,432 8,759 8,828 9,354 9,826 10,157 10,314 10,068 9,852 10,617 10,710 - 132,996 8,755 9,258 9,230 9,367 9,387 9,741 9,715 10,627 10,833 10,848 10,774 9,820 10,762 1,002 (4) 130,109 8,435 8,843 9,118 9,127 9,254 9,288 9,896 9,870 10,577 10,591 10,629 10,035 10,883 885 - 127,029 7,994 8,558 8,813 9,034 9,092 9,220 9,308 9,863 9,863 10,442 10,752 10,112 11,345 737 - 125,133
ROUAENT IN PUBLIC SCHOOLS, BY GRADE, EWFOUNDLAND AND LABRADOR, 1924-25 TO 1991-92 4. School
0 1 - Data for 1924-25 to 1966-67 was collected In June. Commencing in 1967-68 the collection of data was changed to October.
2 - Kindergarten has been included with grade one from 1927-28 to 1951-52
in3 - Includes students who require 4 or more years to complete the High School Program. 4 - Reflects policy changes in Special Education. . Additional Data: For Elementary-Secondary Public Schools
Enrolment by age, sex and grade, by school district, and school; Enrolment in selected subject, by grade. Enrolment In French Language Courses by School Districts.
1111 For Private-Elementary and Secondary Schools
Enrolment by age, sex and grade.
III For Blind and Deaf Schools
Enrolment by age, sex and grade.
0 Source: Statistics Canada, Education Division: Elementary-Secondary Section, and Research Planning and Information Division, Department of Education.
ID
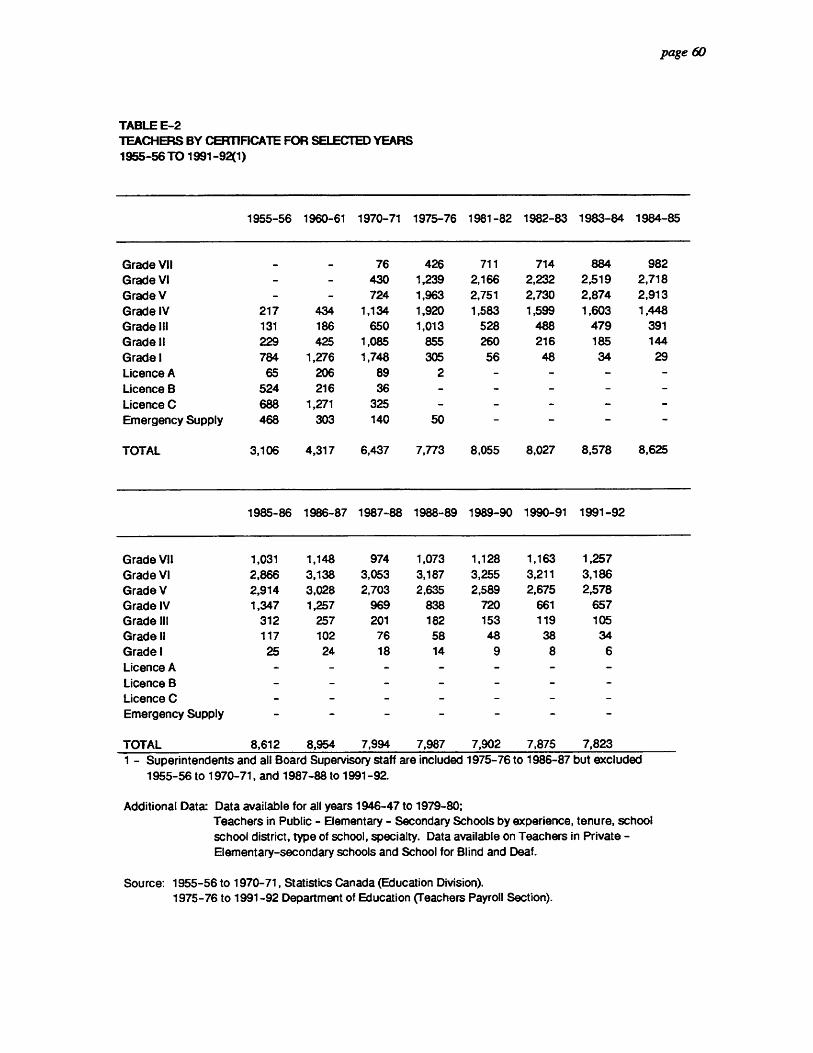
SC
IIIIII III
IIO
SS
OM
OS
OS
OO
OS
OO
OS
OM
MO
OM
OO
IS
page 60
TABLE E-2 TEACHERS BY CERTIFICATE FOR SELECTED YEARS 1955-56 TO 1991-92(1)
1955-56 1960-61 1970-71 1975-76 1981-82 1982-83 1983-84 1984-85
Grade VII - 76 426 711 714 884 982 Grade VI - - 430 1,239 2,166 2,232 2,519 2,718 Grade V 724 1,963 2,751 2,730 2,874 2,913 Grade IV 217 434 1,134 1,920 1,583 1,599 1,603 1,448 Grade III 131 186 650 1,013 528 488 479 391 Grade II 229 425 1,085 855 260 216 185 144 Grade I 784 1,276 1,748 305 56 48 34 29 Licence A 65 206 89 2 - - - Licence B 524 216 36 - Licence C 688 1,271 325 - - Emergency Supply 468 303 140 50 - -
TOTAL 3,106 4,317 6,437 7,773 8,055 8,027 8,578 8,625
1985-86 1986-87 1987-88 1988-89 1989-90 1990-91 1991-92
Grade VII 1,031 1,148 974 1,073 1,128 1,163 1,257 Grade VI 2,866 3,138 3,053 3,187 3,255 3,211 3,186 Grade V 2,914 3,028 2,703 2,635 2,589 2,675 2,578 Grade IV 1,347 1,257 969 838 720 661 657 Grade III 312 257 201 182 153 119 105 Grade II 117 102 76 58 48 38 34 Grade I 25 24 18 14 9 8 6 Licence A - - - Licence B - Licence C Emergency Supply - - -
TOTAL 8,612 8,954 7,994 7,987 7,902 7,875 7,823 1 - Superintendents and all Board Supervisory staff are included 1975-76 to 1986-87 but excluded
1955-56 to 1970-71, and 1987-88 to 1991-92.
Additional Data: Data available for all years 1946-47 to 1979-80; Teachers in Public - Elementary - Secondary Schools by experience, tenure, school school district, type of school, specialty. Data available on Teachers in Private -Elementary-secondary schools and School for Blind and Deaf.
Source: 1955-56 to 1970-71, Statistics Canada (Education Division). 1975-76 to 1991-92 Department of Education (Teachers Payroll Section).

IIIIS
MIIII
III I
SO
OM
II
IIII
SO
OS
SO
OS
OS
OO
SS
OO
OO
SS
OS
OS
Year
1st Year
Students
2nd Year
Students
3rd Year
Students
4th Year
Students
5th Year
Students
Special
Students
Partial
Students
Graduate
Students Total
1949-50 175 83 37 3 - 9 307 1950-51 239 91 34 16 - 20 400
1951-52 211 101 36 27 - 41 416
1952-53 229 102 51 25 - 50 457
1953-54 204 92 51 39 - 14 57 457
1954-55 295 92 59 33 - 3 98 4 584
1955-56 358 119 57 39 - 49 60 3 685
1956-57 400 180 76 39 - 76 82 9 862
1957-58 587 205 140 55 - 6 117 20 1,130 1958-59 572 241 154 92 - - 70 21 1,150
1959-60 543 247 157 112 - 2 102 21 1,184 1960-61 631 318 171 114 - 3 133 30 1,400 1961-82 968 386 245 127 14 4 148 15 1,907 1982-63 1,055 476 264 149 22 4 172 32 2,174 1963-84 1,103 557 313 179 44 3 332 48 2,579
1964-85 1,239 670 424 224 61 6 418 59 3,101
1965-66 1,424 834 473 287 88 10 727 100 3,943
1966-67 1,649 1,040 530 456 159 - 840 88 4,762
1967-68 1,671 1.082 857 516 201 - 1,076 158 5,561 1988-69 1,577 1.228 922 631 205 - 1,263 219 6,045
1989-70 1,768 1,272 926 632 261 - 1,990 390 7.239 1970-71 2,323 1,626 995 786 386 - 2,747 481 9,304 1971-72 1,945 2,098 1,257 856 573 - 3281 640 10,650 1972-73 2,107 1,747 1,425 1,085 802 - 3,240 702 10,908 1973-74 1,497 1,547 1,215 1,077 712 - 3,134 753 9,935
1974-75 1,592 1,252 1,119 976 657 - 3,233 853 9,682 1975-76 1,769 1,376 1,051 845 771 - 2,888 830 9,530 1976-77 2,214 1,468 1,019 751 792 - 2,694 812 9,750 1977-78 2,084 1,711 1,123 671 824 - 2,594 857 9,864 1978-79 1,793 1,648 1,031 606 790 - 2,717 792 9,375
1979-80 1,953 1,721 975 847 811 - 3,179 750 10,036 1980-81 2,166 1.852 1,059 736 986 - 3,184 768 10,751 1981-82 2,507 1.372 1,150 890 1,539 - 3,183 807 11,428 1982-83 2,970 1.931 1.290 845 1,509 3,656 946 13,147 1983-84 1,363 ' 2,366 1,414 984 1.524 - 3,827 964 12,442
1984-85 3,172 1,299 1,710 1,196 1,542 - 4,096 926 13,941 1985-86 3,377 2,642 1,071 1,427 1,553 4,058 890 15,018 1986-87 3,426 2,1334 1,956 889 1,799 - 3,967 1,236 15,907 1987-88 3,548 2.647 1,999 1,321 1,403 - 4,044 1,074 16,034 1988-89 3,659 2,657 1,863 1.436 1,647 - 3,992 1,053 16,307
1989-90 3,799 2,557 1,995 1,387 1,790 - 4,032 1,061 16,621 1990-91 4,070 2,897 2,013 1,594 1,898 - 4,023 1,073 17,568 1991-92 3,951 2,956 2,217 1,586 1,896 - 3,926 1,103 17,635 1992-93 4,256 2,990 2,165 1,706 1,951 - 4,385 1,179 18,632
* - The decrease in enrolment of 1st. year students is mainly due to Grade 12 being introduced in 1983/84.
Additional Data: Enrolment by Faculty of Program of Study.
Source: Office of the Registrar, Memorial University of Newfoundland.
page 61
TABLE E-3 ENROLMENT, MEMORIAL UNIVERSITY OF NEWFOUNDLAND, 1949-50 TO 1992-93

011
1 1O
OS
OO
SO
SS
OS
SO
SO
SS
OS
SO
SO
O11
111 1
1111 1
011O
OS
IIII I
OO
page 62
TABLE E-4 DEGREES AND DIPLOMAS GRANTED BY MEMORIAL UNIVERSITY OF NEWFOUNDLAND, 1950 TO 1992
Degree or Diploma 1950 1955 1960 1965 1970 1975 1980 1981 1982 1983
Bachelor (General)
Arts 4 5 18 60 297 417 307 293 308 363
Science - 2 20 37 150 197 156 172 186 174
Commerce - 2 7 26 66 66 81 76 91
Nursing - - 8 28 33 54 50 43
Social Work - - - 2 18 13 43 37 46
Arts Education 1 26 58 91 327 280 279 214 226 237
Education - 15 99 276 182 184 187 226
Vocational Education - - - - 3 13 12 5 15
Physical Education - 3 16 36 27 30 26 25
Engineering - - 75 58 65 69 69
Medical Science - - - - 57 56 57 55 58
Bachelor of Music - - - - - - 9 18 9
Bachelor of Music Education - - - - - - 7 14 8
Special Education - - 36 37 40
Education (Primary) - - - - - -
Total 5 33 98 213 925 1,453 1,190 1,257 1,294 1,402
Bachelor (Honours) Ms - - 5 16 17 16 16 19 20 17
Science - 5 10 9 19 32 40 34 35
Commerce - 2 2 14 20 27 39 35
Total 10 28 28 49 es 86 93 87
Diplomas
Special Education Diploma - - - 17 15 2 7 8
Engineering 11 16 11 26 64 - - - -
Vocational Education - - - 19 12 22 17 27
Pre-Medical 8 - - -
Industrial Art Diploma _ - 5 9 7 6
Mental Health Nursing - - - 17 17 8 8
Comm. Health Nursing - - - - - 30 25 28 15
Outport Nursing - 5 6 2 1
Nursing Midwifery - - - - 6
School Resource Services - - - - - 19
Native & Northern Education - - 1
Business Administration Adult Teaching Education
Behaviour Modification Total 11 16 19 26 64 38 84 81 69 91
Masters Arts 5 3 24 26 9 13 20 16
Science - 1 7 26 34 23 23 31 28
Engineering - - 4 10 1 5 6
Education - 5 50 65 59 55 71
Physical Education - 1 1 3 3 3
Philosophy - - - 1 - 2 1 -
Social Work - 4 3 3 1
Business Administration - - - - 7 8 12 12
Nursing - _ - - - -
Total - - 6 10 55 116 119 112 130 137
Other Graduate Diploma in Education - 8 9 8 8 3 9
Doctor of Philosophy - - - 2 8 10 7 8 19
Honorary Degrees 1 3 9 12 10 10 11 9
Doctor of Medicine 52 56 53 58 55
Total 1 3 19 81 84 78 80 92
GRAND TOTAL 16 49 134 280 1,091 1,735 1,545 1,614 1,666 1,809
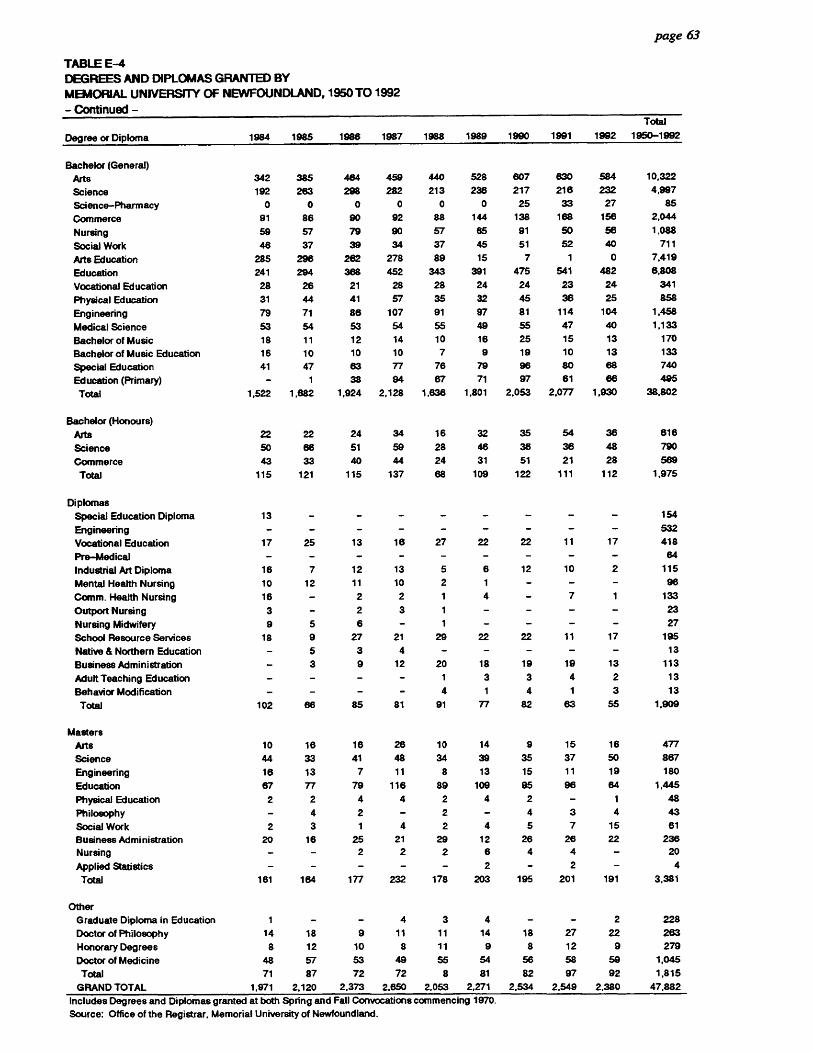
01
0O
OO
OM
MO
SO
O11
118000•0
011
11O
OM
OS
OO
OS
OO
1111
page 63
TABLE E-4 DEGREES AND DIPLOMAS GRANTED BY MEMORIAL UNIVERSITY OF NEWFOUNDLAND, 1950 TO 1992 - Continued -
Total
Degree or Diploma 1984 1985 1986 1987 1988 1989 1990 1991 1992 1950-1992
Bachelor (General) Arts 342 385 464 459 440 528 607 630 584 10,322
Science 192 263 298 282 213 236 217 216 232 4,997
Science-Pharmacy 0 0 0 0 0 0 25 33 27 85
Commerce 91 86 90 92 88 144 138 168 156 2,044
Nursing 59 57 79 90 57 65 91 50 56 1,088
Social Work 48 37 39 34 37 45 51 52 40 711
Arts Ed ucation 285 296 262 278 89 15 7 1 0 7,419
Education 241 294 368 452 343 391 475 541 482 6,808
Vocational Education 28 26 21 28 28 24 24 23 24 341
Physical Education 31 44 41 57 35 32 45 36 25 858
Engineering 79 71 86 107 91 97 81 114 104 1,458
Medical Science 53 54 53 54 55 49 55 47 40 1,133
Bachelor of Music 18 11 12 14 10 16 25 15 13 170
Bachelor of Music Education 16 10 10 10 7 9 19 10 13 133
Special Education 41 47 63 77 76 79 96 80 68 740
Education (Primary) 1 38 94 67 71 97 61 66 495
Total 1,522 1,682 1,924 2,128 1,636 1,801 2.053 2,077 1,930 38,802
Bachelor (Honours)
Arts 22 22 24 34 16 32 35 54 36 616
Science 50 66 51 59 28 46 38 36 48 790
Commerce 43 33 40 44 24 31 51 21 28 569
Total 115 121 115 137 68 109 122 111 112 1,975
Diplomas Special Education Diploma 13 - - - - - - - - 154
Engineering - - - - - - - - - 532
Vocational Education 17 25 13 16 27 22 22 11 17 418
Pre-Medical - - - - - - - - - 64
Industrial Art Diploma 16 7 12 13 5 6 12 10 2 115
Mental Health Nursing 10 12 11 10 2 1 - - - 96
Comm. Health Nursing 16 - 2 2 1 4 7 1 133
Outport Nursing 3 - 2 3 1 - - - - 23
Nursing Midwifery 9 5 8 - 1 - - - - 27
School Resource Services 18 9 27 21 29 22 22 11 17 195
Native & Northern Education - 5 3 4 - - - - - 13
Business Administration - 3 9 12 20 18 19 19 13 113
Adult Teaching Education - - - - 1 3 3 4 2 13
Behavior Modification - - - 4 1 4 1 3 13
Total 102 66 85 81 91 77 82 63 55 1,909
Masters Arts 10 18 16 26 10 14 9 15 16 477
Science 44 33 41 48 34 39 35 37 50 867
Engineering 16 13 7 11 8 13 15 11 19 180
Education 67 77 79 116 89 109 95 96 64 1,445
Physical Education 2 2 4 4 2 4 2 - 1 48
Philosophy - 4 2 - 2 - 4 3 4 43
Social Work 2 3 1 4 2 4 5 7 15 61
Business Administration 20 16 25 21 29 12 26 26 22 236 Nursing - - 2 2 2 6 4 4 - 20
Applied Statistics - - - - - 2 - 2 - 4
Total 161 164 177 232 178 203 195 201 191 3.381
Other Graduate Diploma in Education 1 - - 4 3 4 - - 2 228
Doctor of Philosophy 14 18 9 11 11 14 18 27 22 263
Honorary Degrees 8 12 10 8 11 9 8 12 9 279
Doctor of Medicine 48 57 53 49 55 54 56 58 59 1,045
Total 71 87 72 72 8 81 82 97 92 1,815
GRAND TOTAL 1,971 2,120 2,373 2.650 2,053 2,271 2,534 2,549 2,380 47,882
Includes Degrees and Diplomas granted at both Spring and Fall Convocations commencing 1970. Source: Office of the Registrar. Memorial University of Newfoundland.

10
0O
OS
OO
SS
OO
SIO
SS
IIIM
OS
SO
S0
11
11
1 1110089
118•
1111
08
11
9
SECTION F
PRODUCTION AND INCOME

911
1111
0111
111
111 1
111 1
1111 1
1 111
MO
SO
OS
SO
OO
8110
1111
9111
111
11111
111
1••
page 65
SEC770N 'F'
TABLE F-1
Provincial Gross Domestic Product at Market Prices
Is defined as the market value of the unduplicated total of goods and services produced in the Province in a year. It is measured by summing: (1) the incomes of the various factors of production which are earned within the geographical boundaries of the province and; (2) the non-factor costs of capital consumption allowances (depreciation) and (3) indirect taxes net of subsidies which contribute to the market price of goods and services. Provincial Gross Domestic Product at Market Prices less indirect taxes net of subsidies is known as Provincial Gross Domestic Product at Factor Cost.
For an outline of definitions, concepts and methods related to this table see the source publication or Statistics Canada, Catalogue 13-549E.
TABLE F-2
Personal Income
Personal Income includes all factor incomes of persons such as wages and salaries and net incomes of unincorporated businesses, interest, dividends and various types of investment income of persons, (including investment income accumulated on behalf of persons by life insurance companies, private pension funds, and similar institutions); and all transfer payments received by persons from governments (such as old pensions, mothers' and dependents' allowances, and unemployment insurance benefits) as well as transfers from corporations and non-residents.
Personal Disposable Income
Is the amount left over from Personal Income after payment to government of Personal Direct Taxes (Personal Income Taxes, Succession Duties and estate taxes, and Employer and Employee Contributions to social insurance and government pension funds) and various other fees, licences and permits. This amount is available to be spent on consumer goods and services, transferred to other sectors, or saved.
page 66
Wages. Salaries and Supplementary Labour Income
Wages and salaries cover all of the earnings from employment of Canadian residents paid for work performed, including payments in kind such as free board and lodging. Also included are such payments as commissions, directors' fees, tips and bonuses, and taxable allowances such as cost-of-living allowances and allowances in respect of holdings and sick leave. The estimates do not include earnings from self-employed or partnership, income from independent professional practice, income of farmers from farming operations, or military pay and allowances. Wages and salaries are estimated before tax deductions, and before contributions of employees to unemployment insurance, pensions, and other social insurance schemes.
Supplementary labour income consists of other expenditures by employers on labour account that can be regarded as payment for employees' services. Included here are employers' contributions to pension funds, employee welfare funds, unemployment insurance, and workmen's compensation.
Net Income of Non-Farm Unincorporated Business (Including Rent)
Net Income of non-farm unincorporated business consists of the earnings of working proprietors from their own business in the form of wages and salaries, profits, interest, and rents. Such businesses are "unincorporated' as distinct from the corporate forms of organization. Included in this income category are the earnings of professional practitioners such as doctors, dentists, lawyers and engineers and also earnings of self-employed fishermen.
Also included is the net rental income (gross rents less expenses) of persons and unincorporated business, including imputations for owner-occupied dwellings.
Interest. Dividends & Miscellaneous Investment Income of Persons
Includes incomes received by persons & unincorporated business from corporations, government business enterprises, and non-resident sources in the form of interest and dividends; interest on the public debt paid to persons; and the interest accruing on private pension funds, life insurance funds, and on funds invested by other "associations of individuals".
Government Transfer Payments to Persons
Is comprised of unilateral payments from governments to persons for which there has been no exchange of goods and services, i.e. family and youth allowances; unemployment insurance benefits; veterans' pensions; old age security fund payments; Canada and Quebec Pension Plan benefits; direct relief; workmen's compensation benefits; grants to non-commercial institutions (School boards, post-secondary education institutions and benevolent associations); etc. Excluded is interest on the public debt.
SO
O11
1110
•11
11
11
11
1IM
IDO
MO
OM
OO
MO
OM
OO
MO
INO
page 67
Other Income
Includes Military Pay and Allowances; Net income received by farm operators from farm production; current transfers in the form of capital assistance grants from government to unincorporated business, charitable and other contributions to non-commercial institutions from corporations; and transfers to persons from the non-resident sector such as personal and institutional remittances and pensions received from abroad.
TABLE F-3
See Table F-2
TABLE F-4
Gross Domestic Product at Factor Cost
Is defined as a measure of the unduplicated value of goods and services produced in the province during a year. It is measured by summing (1) the incomes of the various factors of production which are earned within the boundaries of the geographical area and (2) the non-factor cost of capital consumption allowances (depreciation).
For an outline of definitions, concepts and methods related to this table see the source publication or Statistics Canada, catalogue 13-549E.
TABLE F-5
Census Family
See Table P-7
Income
Income is comprised of that received from wages and salaries, business or professional practice, farm operations, family and youth allowances, government old age pensions, unemployment insurance, social assistance, other government payments, retirement pensions from previous employment, bond and bank interest and dividends, other investment sources and other sources.
page 68 •
111 TABLE F-6
lb Gross Domestic Product at Market Prices by Type of Expenditure
lb Provincial Gross Domestic Product at market prices by type of expenditure measures output as the sum of all sales output to final purchasers i.e. to consumers, governments, businesses (on capital account), and export markets. In compiling the Gross Domestic Product by Expenditure series adjustments are made for the following:
1. Unsold output which is not sold to the final purchasers but contributes to inventory stock and; • 2. Imported goods and services which are purchased by the final consumer but not produced within the province.
For an outline of definitions, concepts and methods related to this table see the source publication or Statistics Canada, catalogue 13-549E.
TABLE F-7 SI
Government Sector ID
In the Accounts the government sector is defined to cover three main groups of activity:
1. Departmental activities of the three levels of government - federal; provincial and local - ordinarily included in the so-called "budgetary" transactions of governments;
2. the transactions of many government administered social insurance and trust funds such as the Unemployment Insurance Fund, the Old Age Security Fund, Workmen's Compensation Funds, the Canada Pension Plan, and various government employee pension funds - ordinarily regarded as "extra - budgetary" transactions of governments; SI
3. the transactions of various government agencies, commissions, and boards which are financed out of public funds, and therefore operate on essentially non-commercial basis. i.e. such federal agencies as the National Research Council, the National Film Board etc.; such provincial agencies as hospital and health services commissions, and various municipal boards and agencies including school boards and municipal waterworks authorities.
Specifically excluded from the government sector are certain government agencies whose activities involve the production of goods and services for sale on the open market at a price to the consumer which is intended to compensate wholly or largely for their costs or to yield a profit. Such agencies are classified in the Accounts as Government Business Enterprises.
1111 page 69
•
• Surplus or Deficit on a National Accounts Basis
The saving out of current income and outlay (total revenue less total current expenditure), together with capital consumption allowances, provide the source of financing for the government sector's expenditure in physical assets (gross capital formation). The surplus
• (+) or deficit (-) on these capital financing transactions provides a measure of the overall fiscal position of the government sector.
For an outline of definitions, concepts and methods related to this table see the source • publication or Statistics Canada catalogue 13-549E.
0 0 0 • 0 0 0 0 S S S S • so
S S S S S S •
•
0 S
S S S •

III II page 71
• IIII • TABLE F-1
PROVINCIAL INCOME AND PROVINCIAL GROSS DOMESTIC PRODUCT, all NEWFOUNDLAND - LABRADOR • FOR SELECTED YEARS 1961-1992
II ID • I. Wages, salaries, and supplementary labour income(1,2)
2. Corporation profits before taxes • 3. Interest and miscellaneous investment income
II 4. Accrued net income of farm operators from
farm production
• 5. Net income of non-farm unincorporated business,
IIIIincluding rent
6. Inventory valuation adjustment
• 7. Net Domestic Income at factor cost 8. Indirect taxes less subsidies
II 9. Capital consumption allowances
II 10. Provincial Gross Domestic Product at market prices
• 11. Provincial GDP at Factor Cost
ID Per Capita Provincial Gross Domestic Product
III at market prices ($)
Per Capita Provincial Gross Domestic Product • at factor cost ($) • III • • I. Wages, salaries, and supplementary labour income(1,2) • 2. Corporation profits before taxes
3. Interest and miscellaneous investment income 1111 4. Accrued net income of farm operators from • farm production
5. Net income of non-farm unincorporated business,
III including rent
1111 6. Inventory valuation adjustment 7. Net Domestic Income at factor cost
• 8. Indirect taxes less subsidies 9. Capital consumption allowances
III 10. Provincial Gross Domestic Product at • market prices
11. Provincial GDP at Factor Cost II Per Capita Provincial Gross Domestic Product • at market prices ($)
• Per Capita Provincial Gross Domestic
III Product at factor cost ($)
III
1961 1966 1971 1976 1981 1986
302 476 754 1,629 2,876 3,746 66 119 165 283 533 440 -2 -5 11 6 144 450
2 2 2 7 5 5
50 -1
66 -5
87 -9
130 -33
232 -71
450 -35
417 653 1,010 2,022 3,719 5,056 35 60 100 227 415 664 60 116 196 398 676 1,062
512 829 1,306 2,647 4,810 6,782 477 769 1,206 2,420 4,395 6,118
1,118 1,680 2,451 4,694 8,343 11,732
1,042 1,559 2,263 4,292 7,624 10,583
1988 1989 1990 1991 1992
4,500 4,824 5,071 5,185 5,192 579 562 419 340 285 520 510 593 602 699
10 13 11 14 15
527 511 510 506 493 -36
6,100 -21
6,399 11
6,615 31
6,678 -35
6,649 758 833 869 1,177 1,200
1,180 1,246 1,310 1,356 1,383
8,038 8,478 8,794 9,211 9,232 7,280 7,645 7,925 8,034 8,032
13,950 14,683 15,191 15,884 15,887
12,635 13,240 13,690 13,854 13,822
III 1 - Includes Military Pay & Allowances • 2 - Wages & Salaries were revised back to 1985. Therefore GDP for 1985 to date is not comparable with earlier years.
II Source: Statistics Canada, Provincial Economic Accounts, 13-213
• II

1111
0.0
00
111
1OO
SS
OO
OS
OM
OS
OO
OM
OO
11
01
19
11
OO
MO
S
page 72
TABLE F-2 PERSONAL DISPOSABLE INCOME AND PERSONAL INCOME AND ITS MAIN COMPONENTS, NEWFOUNDLAND AND LABRADOR, IN CURRENT DOLLARS FOR SELECTED YEARS 1951-1992 (Millions of Dollars)
Net Income Interest of Non-Farm Dividends and Governments
Personal Wages, Salaries Unincorporated Miscellaneous Transfer Disposable Personal & Supplementary Business Investment Payments
Year Income Income Labour Income(2,3) (Including Rent) Income of Persons to Persons(1) Other
1951 198 211 137 35 8 26 5
1956 301 328 221 46 10 42 9
1961 426 459 296 50 14 87 12
1966 637 702 470 66 22 130 14
1971 1,001 1,157 748 87 38 267 17
1976 2,182 2,605 1,615 130 103 716 41
1981 3,988 4,684 2,896 232 335 1,174 47
1986 5,588 6,702 3,785 450 474 1,954 39
1988 6,707 8,053 4,595 527 558 2,324 49
1989 7,235 8,673 4,959 511 691 2,433 79
1990 7,661 9,355 5,316 510 801 2,668 60
1991 7,968 9,759 5,420 506 767 3,002 64
1992 8,171 10,009 5,368 493 729 3,354 65
1 - Excludes Interest on the Public Debt and Capital Assistance. 2 - Excludes Military Pay & Allowances 3 - Wages & Salaries were revised back to 1985. Therefore Personal Income for 1985 to date is not comparable to earlier
years. Additional Data: The components of Transfer Income to Persons from Federal & Provincial Governments; and Sources &
Disposition of Personal Income & Personal Savings.
Source: Statistics Canada, 13-201 and 13-213.

• page 73
TABLE F-3 PER CAPITA PERSONAL DISPOSABLE INCOME AND PERSONAL INCOME AND ITS MAIN COMPONENTS NEWFOUNDLAND AND LABRADOR, IN CURRENT DOLLARS
411 FOR SELECTED YEARS 1951-1992
1951 548 584 379 97 22 72 14
1956 725 790 532 111 24 101 22
1961 930 1,002 646 109 31 190 26
1966 1.291 1.423 953 134 45 264 28
1971 1,878 2,171 1,404 167 73 511 33
1976 3,869 4,620 2,864 231 183 1,270 73
1981 6,918 8,125 5,023 402 581 2,036 82
1986 9,666 11,593 6,547 778 820 3,380 67
1988 11,640 13,976 7,975 915 968 4,033 85
1969 12,530 14,986 8,589 885 1,197 4.214 102
1990 13,234 16,160 9,183 881 1,384 4,609 104
1991 13,740 16,829 9,346 873 1,323 5,177 110
1992 14,061 17,224 9,238 848 1.255 5,772 112
III Components of Personal Income may not add to total due to rounding.
II/ 1 - Excludes Interest on the Public Debt & Capital Assistance.
2 - Excludes Military Pay & Allowances.
III 3 - Wages & Salaries were revised back to 1985. Therefore Personal Income for 1985 to date is not comparable to earlier years.
0 Source: Statistics Canada 13-201. 13-213.
• Net Income Interest
0 Of Non-Farm Dividends and Governments
IIIIPersonal
Disposable Personal &WSaugpeps Supplementary
Salaries Unincorporated
Business
Unincorporated Miscellaneous Investment
Transfer
Payments
. Year Income Income Labour Income(2,3) (Including Rent) Income of Persons to Persons(1) Other
(Dollars)
III 111 IIII 0
0
III 0
III III 0
•
0
0
• .
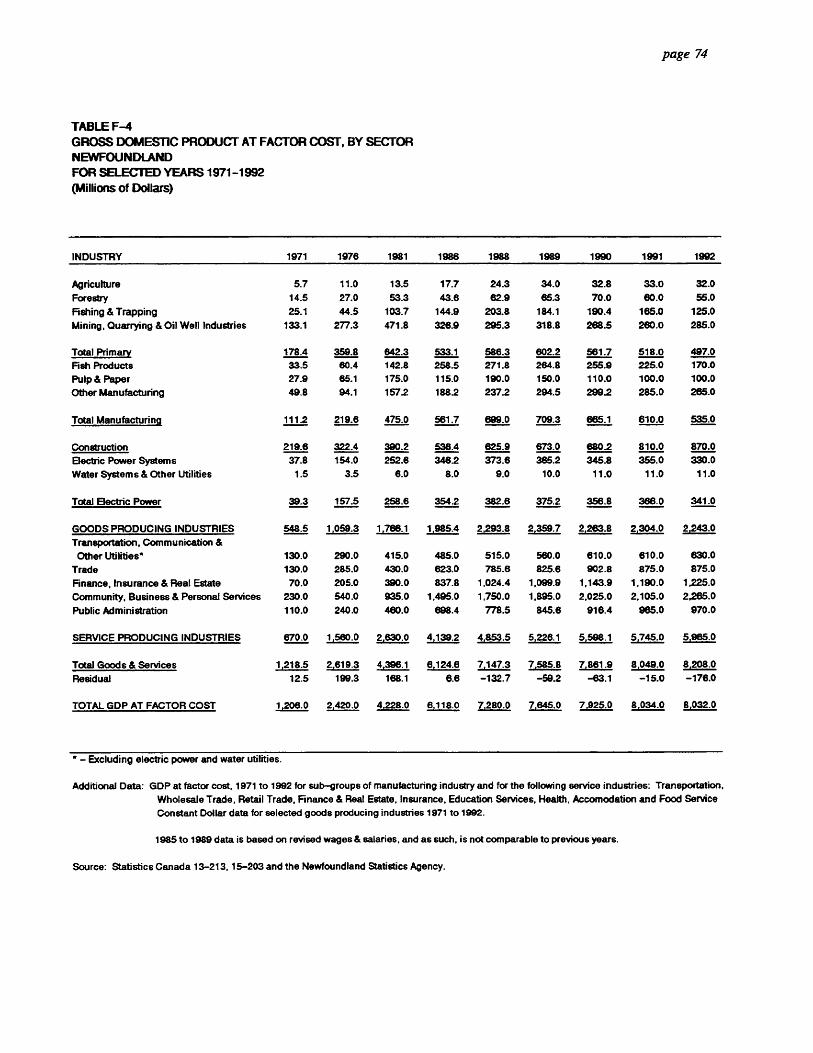
SO
00001IIIIIIM
O0001 1
11•0
00
00
1 1111100000O
lOS
M000
page 74
TABLE F-4 GROSS DOMESTIC PRODUCT AT FACTOR COST, BY SECTOR NEWFOUNDLAND FOR SELECTED YEARS 1971-1992 (Millions of Dollars)
INDUSTRY 1971 1976 1981 1986 1988 1989 1990 1991 1992
Agriculture 5.7 11.0 13.5 17.7 24.3 34.0 32.8 33.0 32.0
Forestry 14.5 27.0 53.3 43.6 62.9 65.3 70.0 60.0 55.0
Fishing & Trapping 25.1 44.5 103.7 144.9 203.8 184.1 190.4 165.0 125.0
Mining, Quarrying & Oil Well Industries 133.1 277.3 471.8 326.9 295.3 318.8 268.5 260.0 285.0
Total Primary 1784 3591 642.3 533.1 586.3 602.2 561.7 518.0 497.0
Fish Products 33.5 60.4 142.8 258.5 271.8 264.8 255.9 225.0 170.0
Pulp & Paper 27.9 65.1 175.0 115.0 190.0 150.0 110.0 100.0 100.0
Other Manufacturing 49.8 94.1 157.2 188.2 237.2 294.5 299.2 285.0 265.0
Total Manufacturing 1112 219.6 475.0 561.7 699.0 709.3 665.1 610.0 535.0
Construction 219.6 322.4 390.2 536.4 625.9 673.0 6802 810.0 870.0
Electric Power Systems 37.8 154.0 252.6 346.2 373.6 385.2 345.8 355.0 330.0
Water Systems & Other Utilities 1.5 3.5 6.0 8.0 9.0 10.0 11.0 11.0 11.0
Total Electric Power 39.3 157.5 258.6 3542 382.6 375.2 356.8 366.0 341.0
GOODS PRODUCING INDUSTRIES 548.5 1,059.3 1,766.1 1,985.4 2,293.8 2,359.7 2,263.8 2,304.0 2,243.0
Transportation, Communication & Other Utilities* 130.0 290.0 415.0 485.0 515.0 560.0 610.0 610.0 830.0
Trade 130.0 285.0 430.0 623.0 785.6 825.6 902.8 875.0 875.0
Finance, Insurance & Real Estate 70.0 205.0 390.0 837.8 1,024.4 1,099.9 1,143.9 1,190.0 1,225.0
Community, Business & Personal Services 230.0 540.0 935.0 1,495.0 1,750.0 1,895.0 2,025.0 2,105.0 2,265.0
Public Administration 110.0 240.0 460.0 698.4 778.5 845.6 916.4 965.0 970.0
SERVICE PRODUCING INDUSTRIES 670.0 1,560.0 2,630.0 4,139.2 4,853.5 5,226.1 5,598.1 5,745.0 5,965.0
Total Goods & Services 1,218.5 2,619.3 4,396.1 6,124.6 7,147.3 7,585.8 7,861.9 8,049.0 8,208.0
Residual 12.5 199.3 188.1 6.6 -132.7 -59.2 -63.1 -15.0 -176.0
TOTAL GDP AT FACTOR COST 1,206.0 2,420.0 4,228.0 6,118.0 7,280.0 7,645.0 7,925.0 8,034.0 8,032.0
* - Excluding electric power and water utilities.
Additional Data: GDP at factor cost, 1971 to 1992 for sub-groups of manufacturing industry and for the following service industries: Transportation,
Wholesale Trade, Retail Trade, Finance & Real Estate, Insurance, Education Services, Health, Accomodation and Food Service
Constant Dollar data for selected goods producing industries 1971 to 1992.
1985 to 1989 data is based on revised wages & salaries, and as such, is not comparable to previous years.
Source: Statistics Canada 13-213,15-203 and the Newfoundland Statistics Agency.

page 75
TABLE F-5 PERCENTAGE DISTRIBUTION OF CENSUS FAMILIES BY INCOME GROUP, NEWFOUNDLAND AND LABRADOR FOR SELECTED YEARS(1) 1971-1991
Income Group 1971 1981 1986 1987 1988 1989 1990 1991
Under $5,000 41.3 4.1 2.6 2.0 0.5
$ 5,000-$ 6,999 18.4 4.7
7,000- 9,999 21.0 9.9 8.4 (6) 6.8 (8) 6.3 (6) 5.5 (6) 4.7 (6) 4.8 (6)
10,000- 11,999 8.0 6.3
12,000-14,999 6.1 8.3 15.5 (7) 12.2 (7) 8.9 (7) 7.0 (7) 6.5 (7) 5.6 (7)
15,000- 19,999 13.1 13.4 11.7 10.6 11.1 11.0 10.6
20,000- 24,999 4.1 (3) 13.4 13.3 10.1 11.3 9.6 9.3 10.5
25,000- 29,999 1.0 (2) 11.4 9.3 10.3 9.3 8.1 10.6 8.1
30,000- 34,999 9.4 8.5 9.4 9.8 10.1 10.0 10.1
35,000- 39,999 6.6 7.8 8.7 9.0 9.5 7.8 7.6
40,000- 44,999 4.3 6.7 7.0 7.5 8.0 6.9 8.6
45,000 & Over 8.5 14.4 21.7 26.9 36.6 33.2 34.1
Total 100.0 100.0 100.0 100.0 100.0 100.0 100.0 100.0
Avg. Income ($) 6,855 23,878 27,887 32,202 34,906 38,141 39,359 40.250
Median Income ($) 5,776 21,096 23,756 28,451 31,564 34,333 33,955 35,185
1 - Nfld. is included in the Atlantic Provinces total for 1983 and not available separately.
2 - $25.000 & Over
3 - $15,000 - $24,999
4 - 535,000 & Over
5 - $ 7,000 - $11,999
6 - $ 5,000 - S 9,999
7 - $10,000 - $14,999
Additional Data: Similar data available for persons not in families and for Economic Families.
Source: Statistics Canada, 1971 Census; and Family Income, Census Families, Catalogue No. 13-208.
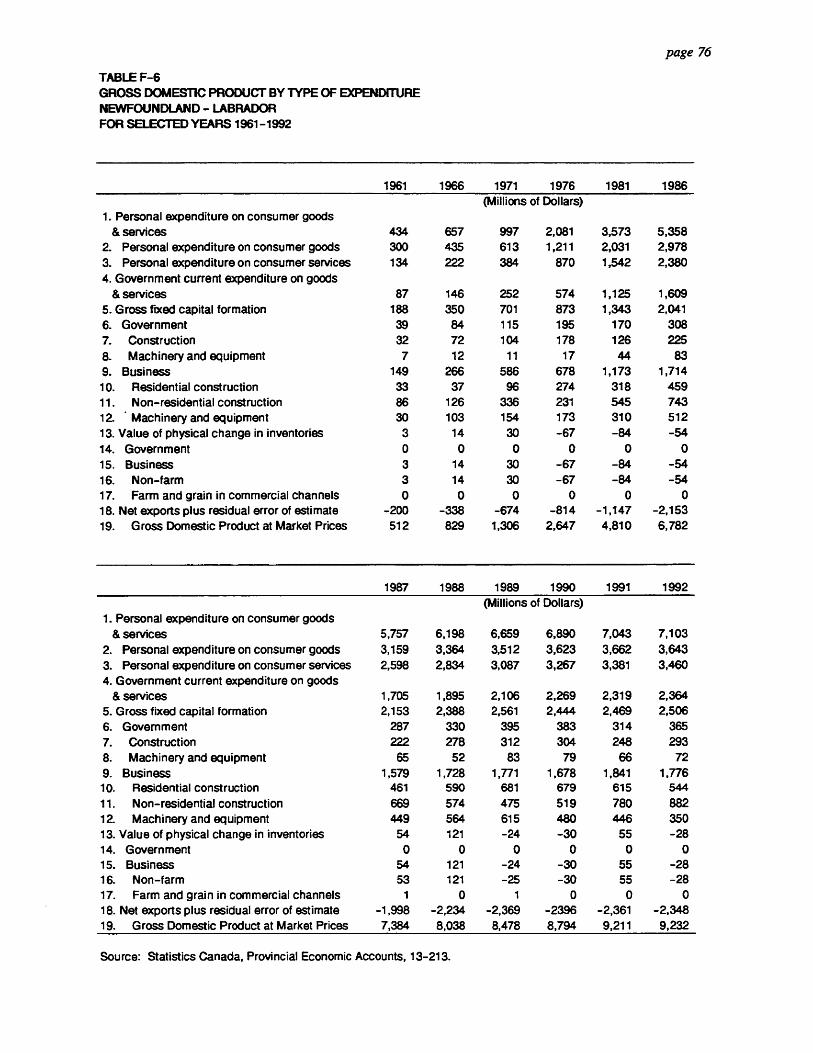
page 76
TABLE F-6 GROSS DOMESTIC PRODUCT BY TYPE OF EXPENDITURE NEWFOUNDLAND - LABRADOR FOR SELECTED YEARS 1961-1992
1961 1966 1971 1976 1981 1986 (Millions of Dollars)
1. Personal expenditure on consumer goods & services 434 657 997 2,081 3,573 5,358
2. Personal expenditure on consumer goods 300 435 613 1,211 2,031 2,978 3. Personal expenditure on consumer services 134 222 384 870 1,542 2,380 4. Government current expenditure on goods
& services 87 146 252 574 1,125 1,609 5. Gross fixed capital formation 188 350 701 873 1,343 2,041 6. Government 39 84 115 195 170 308 7. Construction 32 72 104 178 126 225
8. Machinery and equipment 7 12 11 17 44 83 9. Business 149 266 586 678 1,173 1,714 10. Residential construction 33 37 96 274 318 459 11. Non-residential construction 86 126 336 231 545 743 12. . Machinery and equipment 30 103 154 173 310 512 13. Value of physical change in inventories 3 14 30 -67 -84 -54
14. Government 0 0 0 0 0 0 15. Business 3 14 30 -67 -84 -54 16. Non-farm 3 14 30 -67 -84 -54 17. Farm and grain in commercial channels 0 0 0 0 0 0 18. Net exports plus residual error of estimate -200 -338 -674 -814 -1,147 -2,153 19. Gross Domestic Product at Market Prices 512 829 1,306 2,647 4,810 6,782
1987 1988 1989 1990 1991 1992 (Millions of Dollars)
1. Personal expenditure on consumer goods & services 5,757 6,198 6,659 6,890 7,043 7,103
2. Personal expenditure on consumer goods 3,159 3,364 3,512 3,623 3,662 3,643 3. Personal expenditure on consumer services 2,598 2,834 3,087 3,267 3,381 3,460 4. Government current expenditure on goods
& services 1,705 1,895 2,106 2,269 2,319 2,364 5. Gross fixed capital formation 2,153 2,388 2,561 2,444 2,469 2,506 6. Government 287 330 395 383 314 365 7. Construction 222 278 312 304 248 293 8. Machinery and equipment 65 52 83 79 66 72 9. Business 1,579 1,728 1,771 1,678 1,841 1,776 10. Residential construction 461 590 681 679 615 544
11. Non-residential construction 669 574 475 519 780 882 12. Machinery and equipment 449 564 615 480 446 350 13. Value of physical change in inventories 54 121 -24 -30 55 -28 14. Government 0 0 0 0 0 0 15. Business 54 121 -24 -30 55 -28 16. Non-farm 53 121 -25 -30 55 -28 17. Farm and grain in commercial channels 1 0 1 0 0 0 18. Net exports plus residual error of estimate -1,998 -2,234 -2,369 -2396 -2,361 -2,348 19. Gross Domestic Product at Market Prices 7,384 8,038 8,478 8,794 9,211 9,232
Source: Statistics Canada, Provincial Economic Accounts, 13-213.
O
ar
w
O • •
0
0

li
0 1 2
II 3 4
• 5 s 6
8 a 7 ID 9 10 ell
12 0 13
14 4.15 Am 16
Mr 17
ma 18 Mr 19
in 20 21
a 22 23
0 24
25
0 26
0 27
• 28 0 29
a 30 31
• 32
411 33
••
34 35 36 37
38 . 39
40 0 41
42 0 43 0 44
45
a Current
•0
48 47 48 49
as 50 51
1111 52 53 al 54 55 •
• TABLE F-7 ("GOVERNMENT REVENUE, EXPENDITURE AND SURPLUS OR DEFICIT, BY LEVEL OF GOVERNMENT,
NEWFOUNDLAND - LABRADOR "'FOR SELECTS) YEARS 1981 TO 1991(1)
page 77
1961 1966 1971 1976 1981 1986 1987 1988 1989 1990 1991
(Millions of Dollars)
Revenue
Direct taxes, persons 31 63 152 417 682 1,095 1,205 1,323 1.394 1,667 1,737
Federal 29 41 98 262 396 649 711 770 811 959 1,001
Provincial 2 12 38 118 224 356 389 436 455 580 577
Local - - - - - - - - -
Canada Pension Plan - 10 16 37 62 90 105 117 128 148 159
Direct taxes, corporate & government business enterprises 19 33 40 62 148 146 187 165 181 150 126
Federal Provincial
19 -
26 7
29 11
43 19
102 46
92 54
107
60
103 62
123
58
99
51
85
41
Direct taxes, non-residence, federal - - 1 1 2 3 2 3 3 3 2
Indirect taxes 40 74 133 307 558 794 890 940 1,007 1,066 1,411
Federal 8 13 18 32 78 60 77 77 75 76 384
Provincial 27 52 101 238 401 603 673 715 775 823 872
Local 5 9 14 37 79 131 140 148 157 167 175
Other current transfers from persons 2 2 4 6 14 19 21 23 24 27 27
Federal - - - - - - - - - - - Provincial 2 2 4 6 14 17 19 21 22 25 25
Local - - - 1 1 1 1 1 1 1
Hospitals - - - - - 1 1 1 1 1
Investment Income 1 6 30 64 168 376 429 482 514 563 587
Federal -2 1 6 -7 16 87 123 161 168 194 203
Provincial 3 5 19 55 111 215 217 225 245 262 275
Local - - - - 2 4 6 6 5 5 5
Hospitals - - - 1 2 2 2 2 2 2 2
Canada Pension Plan - - 5 15 37 68 81 88 94 100 102
Current transfers from other levels of government 71 131 308 576 1,026 1,570 1,683 1,843 1,904 2,070 2,296
Provinces: From Canada 58 102 244 410 748 1,108 1,195 1.308 1,336 1,437 1,648
From Local governments - - - - - - - - - - -
Local Governments:
From Canada - 2 2 3 6 20 23 25 32 34 34
From provinces 2 5 12 29 49 73 79 94 101 106 109 Hospitals:
From provinces 11 22 50 134 225 389 386 416 435 493 505
From local governments - - - - - - - - - - - Total revenue less current transfers 93 178 380 857 1,572 2,433 2,714 2,936 3,123 3,476 3,890 Revenue by Level of Government (2)
Federal 54 81 152 331 594 891 1,020 1,114 1,180 1,331 1,855
Provincial 92 180 417 846 1,542 2,353 2,553 2,767 2,891 3,158 3,138 Local 7 16 28 89 138 229 249 274 296 313 324
Hospitals 11 22 50 135 227 372 389 416 435 493 505
Canada Pension Plan - 10 21 52 99 158 186 205 222 248 261
Expenditure:
Current expenditure on goods and services (3) 87 146 252 574 1,125 1,609 1,705 1,895 2,097 2,223 2,277 Federal 32 42 71 161 333 486 506 518 570 632 647 Provincial 42 80 122 242 501 693 716 831 925 968 975 Local 3 4 17 58 76 137 150 156 169 177 190 Hospitals 10 20 42 113 214 312 332 389 431 444 483 Canada Pension Plan - - - - 1 1 1 1 2 2 2
Transfer payments to persons (4) 87 53
130 67 Federal
267 120
716 397
1,174 818
1,954 1,128
2,111 1,183
2,324 1,309
2,500 1,403
2,706 1,484
2,961 1,681
Provincial 34 62 144 298 497 693 763 823 881 984 1,017 Local - 1 1 6 13 26 24 30 31 32 32 Canada Pension Plan - - 2 15 46 107 141 162 185 206 231
Subsidies 5 14 33 80 143 130 165 182 177 203 195 Federal 5 13 12 55 119 66 91 95 91 119 119 Provincial - 1 20 24 21 61 71 83 82 79 70 Local - - 1 1 3 3 3 4 4 5 8
Capital Assistance - 2 12 18 62 423 256 98 89 48 72 Federal - 1 2 8 20 413 230 81 81 42 67 Provincial - 1 10 8 42 10 26 17 8 6 5
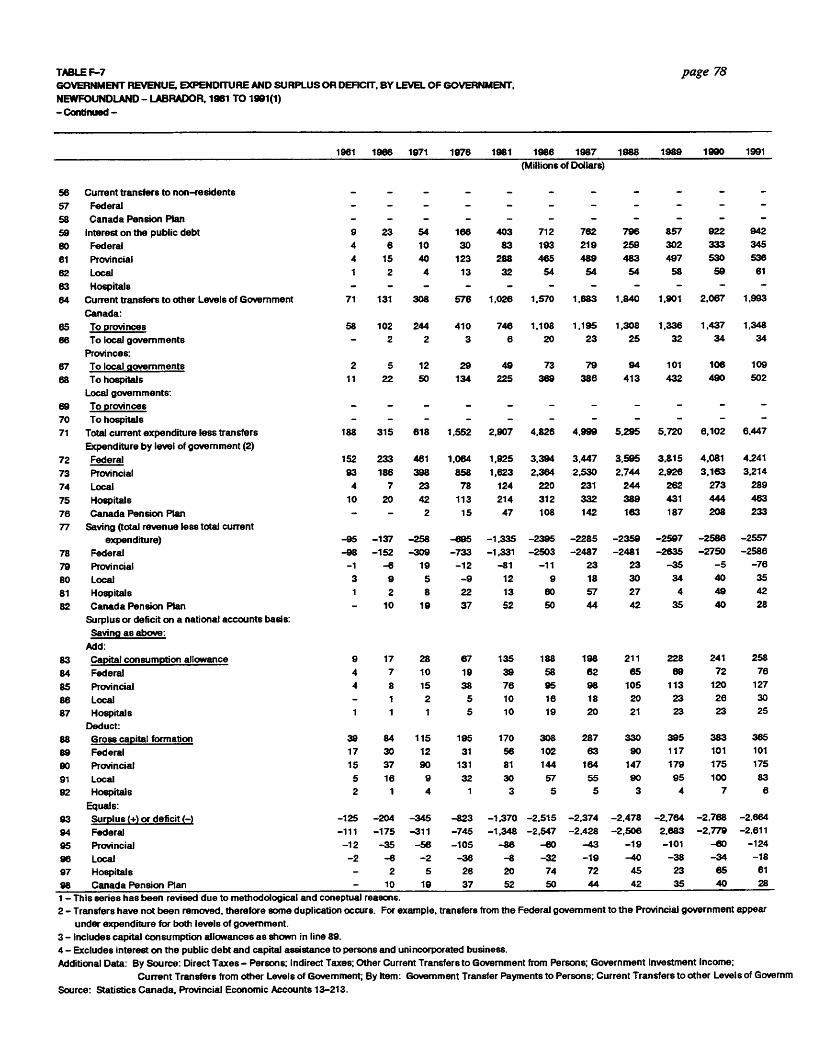
TABLE F-7
page 78 GOVERNMENT REVENUE, EXPENDITURE AND SURPLUS OR DEFICIT. BY LEVEL OF GOVERNMENT.
NEWFOUNDLAND - LABRADOR, 1981 TO 1991(1)
- Continued -
1961 1986 1971 1976 1961 1986 1987 1988 1989 1990 1991
(Millions of Dollars)
56 Current transfers to non-residents - - - - - - -
57 Federal - - - - - - - - - - -
58 Canada Pension Plan - - - - - - - - -
59 Interest on the public debt 9 23 54 166 403 712 762 796 857 922 942
80 Federal 4 6 10 30 83 193 219 259 302 333 345
61 Provincial 4 15 40 123 288 465 489 483 497 530 536
62 Local 1 2 4 13 32 54 54 54 58 59 61
83 Hospitals - - - - - - -
64 Current transfers to other Levels of Government 71 131 308 576 1,026 1,570 1,683 1,840 1,901 2,067 1,993
Canada:
85 To provinces 58 102 244 410 746 1,108 1,195 1,308 1,336 1,437 1,348
66 To local governments - 2 2 3 6 20 23 25 32 34 34
Provinces:
67 To local governments 2 5 12 29 49 73 79 94 101 106 109
68 To hospitals 11 22 50 134 225 369 386 413 432 490 502
Local governments:
69 To provinces - - - - - - - - -
70 To hospitals - - - - - - - - - - -
71 Total current expenditure less transfers 188 315 618 1,552 2,907 4,826 4,999 5,295 5,720 6,102 6,447
Expenditure by level of government (2)
72 Federal 152 233 481 1,064 1,925 3,394 3,447 3,595 3,815 4,081 4,241
73 Provincial 93 186 398 858 1,623 2,364 2,530 2,744 2,928 3,163 3,214
74 Local 4 7 23 78 124 220 231 244 262 273 289
75 Hospitals 10 20 42 113 214 312 332 389 431 444 483
76 Canada Pension Plan - - 2 15 47 108 142 163 187 208 233
77 Saving (total revenue less total current
expenditure) -95 -137 -258 -695 -1,335 -2395 -2285 -2359 -2597 -2586 -2557
78 Federal -98 -152 -309 -733 -1,331 -2503 -2487 -2481 -2635 -2750 -2586
79 Provincial -1 -6 19 -12 -81 -11 23 23 -35 -5 -76
80 Local 3 9 5 -9 12 9 18 30 34 40 35
81 Hospitals 1 2 8 22 13 60 57 27 4 49 42
82 Canada Pension Plan - 10 19 37 52 50 44 42 35 40 28
Surplus or deficit on a national accounts basis:
Saving as above:
Add:
83 Capital consumption allowance 9 17 28 67 135 188 198 211 228 241 258
84 Federal 4 7 10 19 39 58 62 65 69 72 78
85 Provincial 4 8 15 38 76 95 98 105 113 120 127
86 Local - 1 2 5 10 16 18 20 23 26 30
87 Hospitals 1 1 1 5 10 19 20 21 23 23 25
Deduct:
88 Gross capital formation 39 84 115 195 170 308 287 330 395 383 365
89 Federal 17 30 12 31 56 102 63 90 117 101 101
90 Provincial 15 37 90 131 81 144 184 147 179 175 175
91 Local 5 16 9 32 30 57 55 90 95 100 83
92 Hospitals 2 1 4 1 3 5 5 3 4 7 6
Equals:
93 Surplus (+) or deficit (-) -125 -204 -345 -823 -1,370 -2,515 -2,374 -2,478 -2,764 -2,788 -2,684
94 Federal -111 -175 -311 -745 -1,348 -2,547 -2,428 -2,506 2,683 -2,779 -2,811
95 Provincial -12 -35 -56 -105 -86 -60 -43 -19 -101 -60 -124
96 Local -2 -6 -2 -36 -8 -32 -19 -40 -38 -34 -18
97 Hospitals - 2 5 26 20 74 72 45 23 65 61
98 Canada Pension Plan - 10 19 37 52 50 44 42 35 40 28
1 - This series has been revised due to methodological and coneptual reasons. 2 - Transfers have not been removed, therefore some duplication occurs. For example, transfers from the Federal government to the Provincial government appear
under expenditure for both levels of government.
3 - Includes capital consumption allowances as shown in line 89.
4 - Excludes interest on the public debt and capital assistance to persons and unincorporated business.
Additional Data: By Source: Direct Taxes - Persons; Indirect Taxes; Other Current Transfers to Government from Persons; Government Investment Income;
0
0
• ,
si
0 1
0
• Current Transfers from other Levels of Government; By hem: Government Transfer Payments to Persons; Current Transfers to other Levels of Govemm
Source: Statistics Canada, Provincial Economic Accounts 13-213.

SO
OS
IPS
OS
OS
OS
IOS
OS
00
00S
OO
OO
SO
OS
IIO
OS
SO
SO
OS
0010
SECTION G
PROVINCIAL GOVERNMENT FINANCE

soo
se
ss
es
es
ais
sio
lis
iss
lio
sso
se
ss
s i•
ss
•os
s
page 79
SECTION "G"
TABLE G-1
CURRENT ACCOUNT
Tax Equalization or Tax Rental (Federal)
The Equalization Program provides federal cash transfers to the governments of provinces with below-standard fiscal capacities. It is to ensure that provincial governments have sufficient revenues to provide reasonably comparable levels of public services at reasonably comparable levels of taxation. Prior to 1962-63 the Government of Newfoundland rented to the Federal Government its right to impose Corporation Income Tax and Estate Tax. In lieu of these rights the Province received from Ottawa sums of money as stated in Tax Rental Agreements.
Other Subsidies and Fiscal Payments (Federal)
Includes payments on account of various agreements in effect for various periods over time i.e. Entitlement under Terms of Union; Transitional Grant; Atlantic Provinces Adjustment Grant; Statutory Subsidies; Post Secondary Education Grant; the Provinces share of Federal Income Tax on Power Utilities; Revenue Guarantee; Estate Tax; Established Program Financing Grant.
Grants in Aid and Shared Cost Contributors (Federal)
Includes federal contributions on account of specific current account expenditure programmes: i.e. Manpower Training Programmes; Hospital Insurance Plan; Canada Assistance Plan; Medical Care Plan; Regional Economic Expansion Agreements, etc.
Other Provincial Sources
Includes tax on Premium Income of Insurance Companies; Tax on Fire Insurance Premiums; Tobacco Tax; Forestry Management Tax; Pari-Mutuel Tax; Succession Duties; Motor Vehicle and Drivers Licences; Mineral Taxes and Royalties; Other Privileges Licences and Pennits; Sales of Goods and Services; Fines and Penalties; Interest; Other Enterprise Profits; Employee Contributions to Pension Funds; and other taxes and miscellaneous revenue sources.
SM
OS
SO
OO
SII
IPO
OS
SM
I III
IIII
SO
OS
SO
SI I
IIII
SO
SS
OS
SO
S
page 80
CAPITAL ACCOUNT
Federal Grants-In-Aid and Shared Cost Contributions
Includes federal contributions on account of specific capital accowu expenditure programmes: i.e. Health _Resource Fund; Trans Canada Highway; Trunk Roads and Roads to Resources Agreements; Regional Economic Expansion Agreements etc.
Provincial Sources
Sales of Goods and Services; Repayments of Advances; Returns on Investments etc.
TABLE G-4
Debenture Debt
Outstanding debentures issued by the Province less sinking funds; Included are debentures issued in Canadian and Foreign currencies as well as those due to the Government of Canada on account of Canada Pension Plan Borrowings; Federal-Provincial Special Loan Programmes; and borrowings from the Department of Regional Economic Expansion.
Guaranteed Debt and Other Liabilities
Is comprised of outstanding debentures (net of sinking funds) and other obligations of the Newfoundland and Labrador Hydro Electric Corporation; other Crown Corporations and Agencies; Municipalities ; Hospitals; School Boards; and Commercial concerns guaranteed as to payment of principal and interest by the Province. Also included is the long-term debt of the City of St. John's and Provincial housing corporations not guaranteed by the Province but considered as underlying debt, and outstanding debt secured by long term lease arrangements entered into by the Province, its crown corporations and agencies.

991
011
1 1M
OO
MO
OS
SII
IIM
OO
OS
OS
OS
SO
OM
OO
SS
OIP
S
page 81
TABLE 6-1 GROSS REVENUE, CURRENT AND CAPITAL ACCOUNTS, GOVERNMENT OF NEWFOUNDLAND AND LABRADOR BY TYPE AND MAJOR SOURCE, 1949-50 TO 1994-95
CURRENT ACCOUNT REVENUES
Federal Government Sources Provincial Sources Tax Other Grants in
Total Equalization Subsidies Aid & Shared Corporation Personal Retail Gasoline Other Current or & Fiscal Cost Income Income Sales & Fuel Liquor Provincial
Year Revenues Total Tax Rental(1) Payments(4) Contributions Total Tax(1) Tax(1) Tax(7) Oil Tax Profits Sources
(Thousands of Dollars)
1949-50 20,433 14,992 4,860 8,425 1,707 5,441 - - - 1,006 1,789 2,888
1950-51 28,061 20,700 7,220 8,040 5.440 7,361 - - 712 1.252 2,300 3,097
1951-52 30,941 19,973 7,932 8,131 3,910 10,968 - - 3,167 1,514 2,820 3,487
1952-53 35,306 21,900 12,789 7,317 1,794 13,406 - - 4,534 1,795 2.428 4,649
1953-54 38,065 20,199 11,825 6,530 1.844 15,868 - - 5,850 2,138 2,806 5,472
1954-55 38,528 20,350 12,546 5,709 2,095 18,178 - - 6,337 2,599 2,888 8,354
1955-56 39,754 20,534 12.483 4,877 3,174 19,220 - - 6,719 3,362 2,997 8,142
1958-57 44,097 22,079 13,805 4,033 4,241 22,018 - - 7,774 3,921 3,136 8,187
1957-58 49,207 24,106 16,028 3,216 4,862 25,101 - - 7,751 4,096 4,975 8,279
1958-59 75,328 55,367 16,892 23,955 9,520 24,961 - - 8,033 4,895 3,404 8,829
1959-80 75,184 49.187 20,016 17,069 12,102 25,997 - - 9,132 5,029 3,792 8,044
1960-81 79,699 1 50,243 20,480 17,377 12,406 29,456 - - 10,665 5,796 3,685 9,310 1961-62 88,127 51,322 20,078 17,296 13,948 34,805 - - 13,417 6,734 4,880 9,974 1962-63 95,450 50,566 13,801 20,654 18,311 44,884 4,782 3,056 14,308 7,507 4,267 10,964
1963-64 103,532 53,752 14,985 20,628 18,139 49,780 3,858 3,356 16,113 9,043 5,048 12,382
1964-85 119,382 59,271 18,373 20,875 20,023 80,091 5,647 4.123 18,298 9,796 8,139 14,088
1965-88 141,480 68,840 22,163 21.005 25,072 72,620 9,295 6,153 20,033 12,022 7,495 17,622 1988-67 165,370 85,029 29,007 21,657 34,385 80,341 7,573 8,183 21,973 13,806 9,782 19,224
1967-68 221,339 128,599 67,886 12,985 45,748 94,740 5,500 11,763 28,805 13,925 11,262 23,485
1968-69 251,726 136,899 71,779 14,509 50,611 114,827 8,901 13,195 35,125 18,088 11,414 28,124
1969-70 284,516 155,950 84,955 15,577 55,418 128,566 9,463 19,347 36,985 19,673 11,318 31,780
1970-71 313,506 189,079 90,369 18,952 61,758 144,427 7,916 26,673 41,917 21.272 13,819 32,830 1971-72 367,253 207,052 120,551 18,042 68,459 180,201 8,951 28,041 50,315 22,554 15,551 34,789 1972-73 390,767 196,704 114,447 18,831 63,426 194,063 12,053 34,784 58,088 26,722 20,575 41,841 1973-74 484,754 249,291 155,979 17.073 76,239 235,483 16,447 47,286 70,461 30,376 25,800 45,113
1974-75 592,284 301,177 186,631 16,202 98,344 291,107 21,831 60,809 94,659 32,815 26,800 54,193
1975-76 708,955 348,333 192,717 36,485 119,131 360,622 17,859 88,029 120.886 34,161 29,000 70,687
1978-77 828,258 398.203 224,814 37,481 135,928 430,055 28,662 107.815 139,984 37,865 33,000 84,949 1977-78 964,235 464,758 289,345 114,121 81,292 499,477 24,501 128,777 159,497 40,368 34,250 112,084
1978-79 1,084,083 538,389 311,928 147,063 79,398 545,894 23,677 155,277 171,066 41,855 37,000 117,019
1979-80 1215,897 582,747 340,757 161,956 80,034 632,950 37,974 154,713 219,048 44,499 40,500 136,216 1980-81 1,359,209 656,845 388,371 177,501 90,973 702,364 44,148 184,173 246,611 43,934 45,500 137,998 1981-82 1,511,019 756,591 467,635 182,716 106,240 754,428 44,838 213.384 256,745 51,787 52,500 135,174 1982-83 1,652,046 807,161 536,464 163,832 106,885 844,885 34,999 254.344 272,651 58,981 60,000 163,910 1983-84 1,788,484 863,762 522,084 224,625 117,054 904,701 33,595 247,286 327.812 65,343 66,000 164,665
1984-85 1,867,470 919.215 552,135 242,849 124,231 948,255 41,194 251,533 334,734 67,703 65,100 187,991 1985-86 2,072,581 1,016,039 642,660 248,300 125,079 1,056,542 59,880 265,152 359,627 73,183 80,000 218,710 1988-87 2233,339 1,120,863 737,567 248,275 135,021 1,112,475 85,398 283,259 406,067 86,617 73,000 218,144 1987-88 2,424,887 1,171,137 781,826 244,178 145,133 1,253,750 72,629 336,276 456,854 89,231 80,000 238,780 1988-89 2,600,429 1,333.495 874,344 243,921 215,230 1,286,934 57,168 356,090 506,755 73,989 78,000 194,932
1989-90 2,844,162 1,359,626 958,661 241,734 159,231 1,484,536 56,574 406,992 546,957 79,331 79,000 315,682 1990-91 2,872,055 1,318,997 906,706 230,285 182,006 1,553,058 52,585 454,676 544,934 88,154 80,000 332,709 1991-92 2,987,387 1,325,070 885,789 241,526 197,775 1,862,767 49,135 467,679 553,629 108,298 80,500 403,528 1992-93 3,044,401 1,367,284 877,256 275,375 214,653 1,877,117 46,247 476,098 541,893 105,639 73,100 434,140 1993-94(2) 3,061,044 1,390,418 881.625 263,534 245,259 1,670,626 39,300 506,310 543,800 118,400 73250 389,566 1994-95(3) 3,146,616 1,435,437 925,000 268,054 242,383 1,711,179 41,400 510,000 550,000 122,000 76,000 411,779
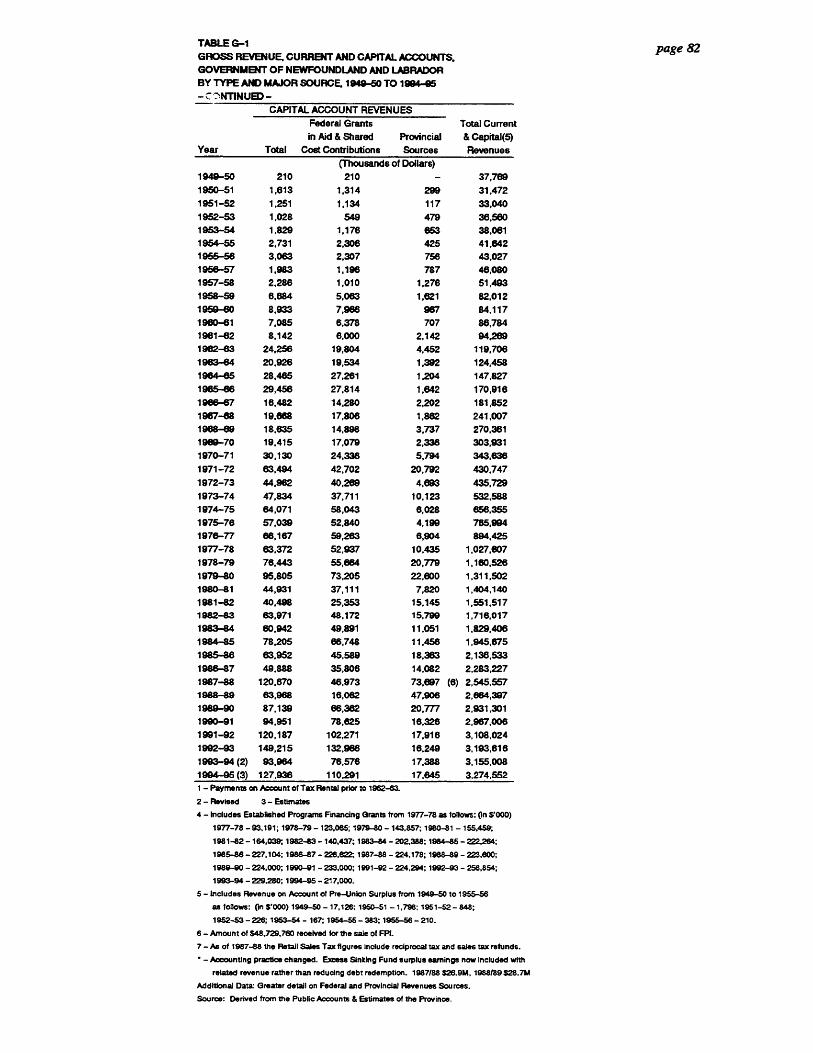
TABLE G-1
GROSS REVENUE, CURRENT AND CAPITAL ACCOUNTS,
GOVERNMENT OF NEWFOUNDLAND AND LABRADOR
BY TYPE AND MAJOR SOURCE. 1949-50 TO 1994-95
- C 'NYTINUED -
CAPITAL ACCOUNT REVENUES
Federal Grants Total Current
in Aid & Shared Provincial & Capital(5)
Year Total cost Contributions Sources Revenues
(Thousands of Dollars)
1949-50 210 210 - 37,769
1950-51 1,613 1,314 299 31,472
1951-52 1,251 1,134 117 33.040
1952-53 1,028 549 479 38,580
1953-54 1,829 1,176 653 38,061
1954-55 2,731 2,306 425 41,642
1956-56 3,063 2,307 756 43,027
1956-57 1,983 1,196 787 46,080
1957-58 2,286 1,010 51,493 1,276
1958-59 6,684 5,063 1,621 82,012
1959-60 8,933 7,966 967 84,117
1960-61 7,085 6,378 707 86,784
1961-62 8,142 6,000 2,142 94,269
1962-63 24,256 19,804 4,452 119,706
1963-64 20,926 19,534 1,392 124,458
1964-65 28,465 27,261 1,204 147,827
1965-66 29,456 27,814 1642 170,916
1966-67 16,482 14,280 2,202 181,852
1967-88 19,868 17,806 1,862 241,007
1968-69 18,635 14,898 3,737 270,361
1969-70 19,415 17,079 2,336 303,931
1970-71 30,130 24,336 5,794 343,636
1971-72 63,494 42,702 20,792 430,747
1972-73 44,962 40,269 4,693 435,729
1973-74 47,834 37,711 10,123 532,588
1974-75 64,071 58,043 6,028 656,355
1975-76 57,039 52,840 4,199 765,994
1976-77 66,167 59,263 6,904 894.425
1977-78 63,372 52.937 10,435 1,027,607
1978-79 76,443 55,664 20,779 1,160,526
1979-80 95.805 73,205 22,600 1,311,502
1980-81 44,931 37,111 7,820 1,404,140
1981-82 40,498 25,353 15,145 1,551,517
1982-83 63,971 48,172 15,799 1,716,017
1983-84 60,942 49,891 11,051 1,829,406
1984-85 78,205 66,748 11,456 1,945,675
1985-86 63,952 45,589 18,363 2,136,533
1986-87 49.888 35,806 14,082 2,283,227
1987-88 120,670 46,973 73,697 (6) 2,545,557
1988-89 63.968 16,062 47,906 2,664,397
1989-90 87,139 66,362 20,777 2,931,301
1990-91 94,951 78,625 16,326 2,967,006
1991-92 120,187 102,271 17,916 3,108,024
1992-93 149,215 132,966 16,249 3,193,616
1993-94 (2) 93,964 76,576 17,388 3,155,008
1994-95 (3) 127,936 110,291 17.645 3,274.552
1 - Payments on Account of Tax Rental prior to 1962-63. 2 - Revised 3 - Estimates 4 - Includes Established Programs Financing Grants from 1977-78 as follows: On S'000)
1977-78 - 93,191; 1978-79 - 123,085; 1979-80 - 143,857; 1980-81 - 155,459; 1981-82 - 164,039; 1982-83 - 140,437; 1983-84 - 202,388; 1984-85 - 222,264; 1985-88 -227,104; 1988-87 - 228,822 1987-88 - 224,178; 1988-89 - 223,800; 1989-90 - 224,000; 1990-91 - 233,000; 1991-92 - 224,294; 1992-93 - 256,854; 1993-94 - 229,280; 1994-95 - 217,000.
6 - Includes Revenue on Account of Pre-Union Surplus from 1949-50 to 1955-56 as follows: (in S'000) 1949-50 - 17,126; 1950-51 - 1,798; 1951-52 - 848; 1952-53 - 226; 1953-54 - 167; 1964-55 - 383; 1955-56 - 210.
8 - Amount of $48,729,780 received for the sale of FPI. 7 - As of 1987-88 the Retail Sales Tax figures Include reciprocal tax and sales tax refunds. • - Accounting practice changed. Excess Sinking Fund surplus earnings now included with
related revenue rather than reducing debt redemption. 1987/88 $26.9M, 1988/89 $28.7M Additional Data Greater detail on Federal and Provincial Revenues Sources. Source: Derived from the Public Accounts & Estimates of the Province.
page 82
I IS
SO
MO
SO
SS
OS
SO
SI P
OO
OM
OS
MO
SO
SIO
SS
OS
SO
SO
S
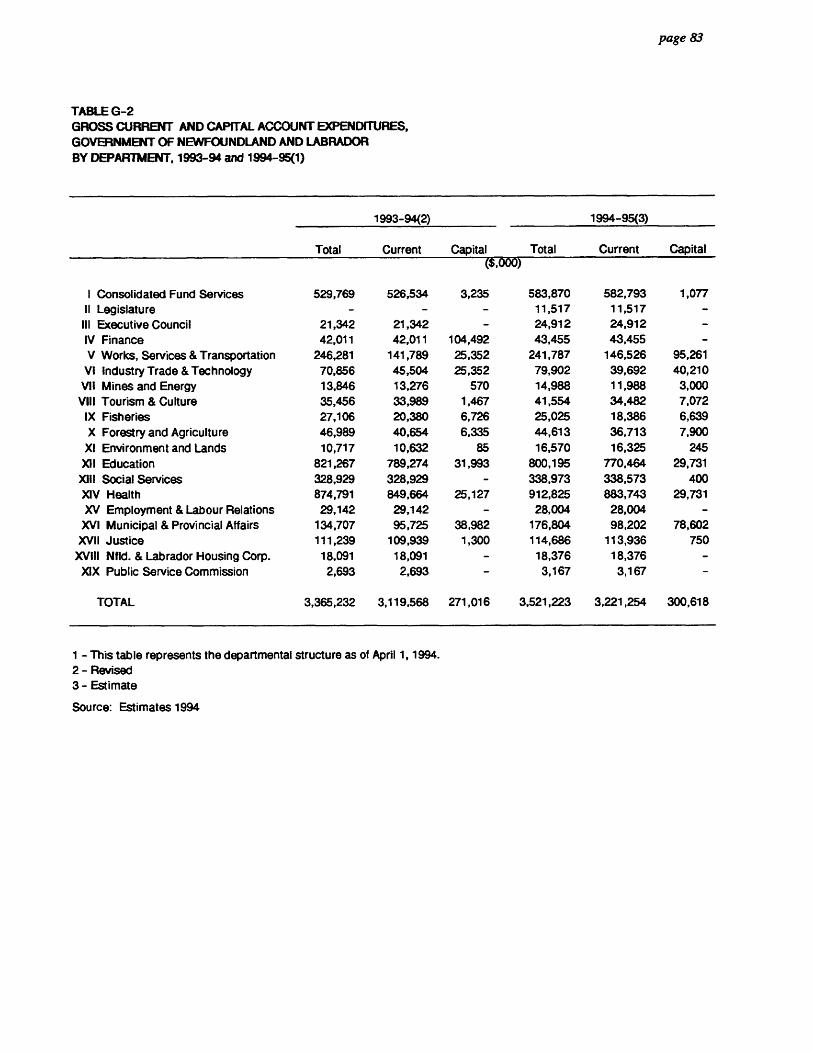
110•11
11
OO
MM
OO
SS
OO
M0
0S
OO
SS
IOS
SIM
MO
SS
011
page 83
TABLE G-2 GROSS CURRENT AND CAPITAL ACCOUNT EXPENDITURES, GOVERNMENT OF NEWFOUNDLAND AND LABRADOR BY DEPARTMENT, 1993-94 and 1994-95(1)
1993-94(2) 1994-95(3)
Total Current Capital Total Current Capital ($,000)
I Consolidated Fund Services 529,769 526,534 3,235 583,870 582,793 1,077 II Legislature - - - 11,517 11,517 - III Executive Council 21,342 21,342 - 24,912 24,912 - IV Finance 42,011 42,011 104,492 43,455 43,455 - V Works, Services & Transportation 246,281 141,789 25,352 241,787 146,526 95,261
VI Industry Trade & Technology 70,856 45,504 25,352 79,902 39,692 40,210 VII Mines and Energy 13,846 13,276 570 14,988 11,988 3,000
VIII Tourism & Culture 35,456 33,989 1,467 41,554 34,482 7,072 IX Fisheries 27,106 20,380 6,726 25,025 18,386 6,639 X Forestry and Agriculture 46,989 40,654 6,335 44,613 36,713 7,900
XI Environment and Lands 10,717 10,632 85 16,570 16,325 245 XII Education 821,267 789,274 31,993 800,195 770,464 29,731
XIII Social Services 328,929 328,929 - 338,973 338,573 400 XIV Health 874,791 849,664 25,127 912,825 883,743 29,731 XV Employment & Labour Relations 29,142 29,142 - 28,004 28,004 -
)VI Municipal & Provincial Affairs 134,707 95,725 38,982 176,804 98,202 78,602 XVII Justice 111,239 109,939 1,300 114,686 113,936 750
XVIII Nfld. & Labrador Housing Corp. 18,091 18,091 - 18,376 18,376 - XIX Public Service Commission 2,693 2,693 - 3,167 3,167 -
TOTAL 3,365,232 3,119,568 271,016 3,521,223 3,221,254 300,618
1 - This table represents the departmental structure as of April 1, 1994. 2 - Revised 3 - Estimate
Source: Estimates 1994

III II
Capital
II 297
5 III 14,818
1,728 III 42 as
IOW - 2,171 ei
999
1,429 0 328
- III - ill - An
NV -
- as 156 MI.
153 III Now
-
- 22,126 IIIII
II II
Capital II 296
278 GI 45.983 0 31,963
284 As W
10.231
33,199 - 27.078
24,484 s 11,807
2,251 gli
2,251 as 111/
- Agi 1,115 W
- MI WI
8,481
- - II
195,431 al 38,089 ma 23,933 Mr
14,156 II 233,520 is
TABLE G-3 page 84 GROSS CURRENT AND CAPITAL ACCOUNT EXPENDITURES, BY FUNCTION(1)
GOVERNMENT OF NEWFOUNDLAND AND LABRADOR. FOR SELECTED YEARS, 1949-50 TO 1994-95
Function
1949-50 1954-55 1959-60
Total Current Capital Total Current Capital Total Current
($000) General Government 3,043 3.034 9 4,771 4,534 237 6,203 5,906 Protection of Persons & Property 1,382 1,310 72 1,933 1,855 78 2,838 2,833 Transportation and Communications 4,016 1,880 2,156 12.059 3,285 8,774 22,292 7,474
Health 6,639 4,145 2,494 8,733 8,315 418 17,248 15,520 Social Welfare 7,766 7,758 8 6,885 6,885 15,328 15,288 Recreation and Culture 63 63 - 39 39 - 48 48 Education 4,252 3,804 448 8,918 7,403 1,515 15,968 13,797 Natural Resources 1,061 977 84 3,888 1,102 2,786 2,396 1,397
Agriculture, Trade, Industry & Tourism 527 491 38 5,111 702 4,409 2,695 1,286
Regional Planning and Development 378 110 288 808 359 449 1,676 1,348
Debt Charges & Other Financial Expenses 253 253 - 1,087 1,087 2,925 2,925
Principal Redemptions & Sinking Contributions(4) - - - - - -
Interest 251 251 897 897 2,746 2,748 Other 2 2 190 190 - 179 179
Environment - - - - - - -
Labour, Employment & Immigration 26 26 77 77 - 76 76
Housing 286 286 449 59 390 213 57
Other 1 1 335 335 - 540 387
Expenditures on Account of Pre-Union Liabilities 5,240 - 38 - - -
Total Expenditures (Budgetary) 34,913 23,831 5,842 55,131 36,037 19,058 90,446 88.320
Non-Budgetary Expenditure(5) 111 111 711 411 300 1,705 1,704
Redemptions - - - 300 300 1 -
Sinking Funds 111 111 - 411 411 1.704 1,704
Total (Budgetary and Non-Budgetary) 35,024 23,942 5,842 55,842 36,448 19,356 92,151 70.024
1984-85 1969-70 1974-75
Function Total Current Capital Total Current Capital Total Current
(soon)
General Government 8,845 8,771 74 13,514 12,708 806 27,284 26,968 Protection of Persons & Property 3,931 3,931 - 8,378 8,123 253 19,298 19,020
Transportation and Communications 55,324 11,915 43,409 52,727 15,859 36,868 84,076 38,093 Health 26,488 24,495 1,991 58,945 57,576 1,389 145,785 113,802 Social Welfare 20,646 20,585 81 39,454 39,393 61 67,105 66,821
Recreation and Culture 248 246 - 3,936 1,879 2,057 16,800 8,569 Education 28,511 25,774 2,737 81,236 75,264 5,972 194,892 181,693
Natural Resources 3,846 3,393 453 10,484 9,952 532 48,577 21,499
Agriculture, Trade, Industry & Tourism 2,459 2,038 421 23,912 8,822 15,290 54,938 30,454 Regional Planning and Development 2,371 2,345 26 9,442 8,887 555 24,220 12,413
Debt Charges & Other Financial Expenses 10,934 7,420 3,514 34,029 32,089 1,960 79,353 77.102 Principal Redemptions & Sinking Contributions(4) 3,514 - 3,514 1,960 1,960 2,251 - Interest 6,788 6,768 - 31,956 31,956 - 73,644 73,844
Other 852 652 113 113 - 3,458 3,458
Environment - - - 2,544 593 1,951 11,889 10,554
Labour, Employment & Immigration 94 94 - 198 198 - 619 619 Housing 282 82 220 1,048 336 712 7,512 1,051 Other 623 620 3 1,338 1,338
Expenditures on Account of Pre-Union Liabilities - - - -
Total Expenditures (Budgetary) 164,598 111,889 52,929 341,885 272,797 88,383 782,079 586,648
Non-Budgetary Expenditure(5) 8.578 3,018 5,558 7,885 - 7,885 38,084 -
Redemptions 5,558 5.558 2 2 23,933 Sinking Funds 3,018 3,018 - 7,883 - 7,883 14,156
Total (Budgetary and Non-Budgetary) 173,174 114,687 58,487 349,065 272,797 78,268 820,168 586,648
•
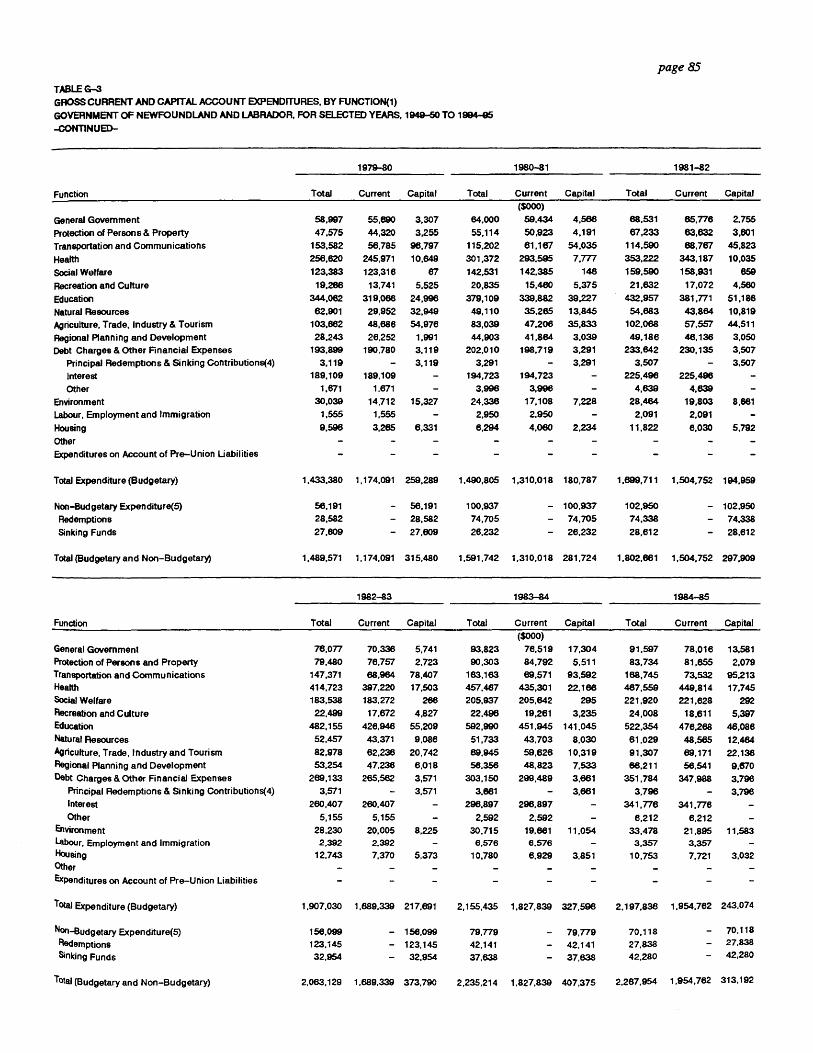
page 85
TABLE G-3
GROSS CURRENT AND CAPITAL ACCOUNT EXPENDITURES, BY FUNCTION(1)
GOVERNMENT OF NEWFOUNDLAND AND LABRADOR, FOR SELECTED YEARS, 1949-50 TO 1994.-95
-CONTINUED-
Function
1979-80 1980-81 1981-82
Total Current Capital Total Current Capital Total Current Capital
($000)
General Government 58,997 55,690 3,307 64,000 59,434 4,566 68,531 65,776 2,755
Protection of Persons & Property 47,575 44,320 3,255 55,114 50,923 4,191 67,233 63,632 3,601
Transportation and Communications 153,582 56,785 96,797 115,202 61,167 54,035 114,590 88,767 45.823
Health 256,620 245,971 10,649 301,372 293,595 7.777 353,222 343,187 10,035
Social Welfare 123,383 123,316 67 142,531 142,385 146 159,590 158,931 659
Recreation and Culture 19,266 13,741 5.525 20,835 15,480 5,375 21,632 17,072 4,560
Education 344.062 319,066 24,996 379,109 339,882 39,227 432,957 381,771 51,186
Natural Resources 62,901 29,952 32,949 49,110 35,285 13,845 54.683 43,864 10,819
Agriculture, Trade, Industry & Tourism 103,662 48,686 54,976 83,039 47,206 35,833 102,068 57,557 44,511
Regional Planning and Development 28.243 26,252 1.991 44,903 41,864 3,039 49,186 48,136 3,050
Debt Charges & Other Financial Expenses 193.899 190,780 3,119 202,010 198,719 3,291 233,642 230,135 3,507
Principal Redemptions & Sinking Contributions(4) 3.119 - 3,119 3,291 - 3,291 3,507 - 3,507
Interest 189,109 189,109 - 194,723 194,723 - 225,496 225,496
Other 1,671 1,671 - 3,996 3,996 - 4,639 4,639 -
Environment 30,039 14,712 15,327 24,336 17,108 7,228 28,464 19,803 8,661
Labour, Employment and Immigration 1.555 1,555 - 2,950 2,950 - 2,091 2,091 -
Housing 9,596 3,265 6,331 6,294 4,060 2,234 11,822 8,030 5,792
Other - - - - - -
Expenditures on Account of Pre-Union Liabilities - - - - - - - -
Total Expenditure (Budgetary) 1,433.380 1,174,091 259,289 1,490,805 1,310,018 180,787 1,699.711 1,504,752 194,959
Non-Budgetary Expenditure(5) 56,191 - 56,191 100,937 - 100,937 102,950 - 102,950
Redemptions 28,582 - 28,582 74,705 - 74,705 74,338 - 74,338
Sinking Funds 27,609 - 27,609 26,232 - 26,232 28,612 - 28,612
Total (Budgetary and Non-Budgetary) 1,489,571 1,174,091 315,480 1,591,742 1,310,018 281,724 1,802,661 1,504,752 297,909
1982-83 1983-84 1984-85
Function Total Current Capital Total Current Capital Total Current Capital
(5000)
General Government 76,077 70,336 5,741 93,823 76,519 17,304 91,597 78,016 13,581
Protection of Persons and Property 79,480 76,757 2,723 90,303 84,792 5,511 83,734 81,655 2,079
Transportation and Communications 147,371 68,964 78,407 163.163 69,571 93,592 168,745 73,532 95,213
Health 414,723 397,220 17,503 457,467 435,301 22,166 487,559 449,814 17,745
Social Welfare 183,538 183,272 286 205,937 205,642 295 221,920 221.628 292
Recreation and Culture 22,499 17,872 4,827 22,496 19,261 3,235 24,008 18,811 5,397
Education 482,155 426,948 55,209 592,990 451,945 141,045 522,354 476,288 48,086
Natural Resources 52,457 43,371 9,086 51,733 43,703 8,030 81,029 48,585 12,484
Agriculture, Trade, Industry and Tourism 82,978 62.236 20,742 69,945 59,626 10,319 91,307 69,171 22,136
Regional Planning and Development 53,254 47.236 6,018 58,356 48,823 7,533 66,211 56,541 9,670
Debt Charges & Other Financial Expenses 269,133 285,562 3,571 303,150 299,489 3,661 351,784 347,988 3,796
Principal Redemptions & Sinking Contributions(4) 3,571 - 3,571 3,661 - 3,661 3,796 - 3,796
Interest 260,407 260,407 - 296,897 296,897 - 341,776 341,776
Other 5,155 5,155 - 2,592 2,592 - 6.212 6.212 -
Environment 28,230 20,005 8,225 30.715 19,661 11,054 33,478 21,895 11,583
Labour, Employment and Immigration 2.392 2.392 - 6,576 6,576 - 3,357 3,357 -
Housing 12,743 7,370 5,373 10,780 6.929 3,851 10,753 7.721 3,032 Other - - - - - - - - -
Expenditures on Account of Pre-Union Liabilities - - - - - - - -
Total Expenditure (Budgetary) 1.907,030 1,689,339 217,891 2,155,435 1,827,839 327,596 2.197,836 1,954,762 243,074
Non-Budgetary Expenditure(5) 158,099 - 156,099 79,779 - 79,779 70,118 - 70,118
Redemptions 123,145 - 123,145 42,141 - 42,141 27,838 - 27,838
Sinking Funds 32,954 - 32,954 37,638 - 37,638 42,280 - 42,280
Total (Budgetary and Non-Budgetary) 2,083,129 1,688339 373,790 2,235,214 1,827,839 407,375 2,267,954 1,954,762 313,192
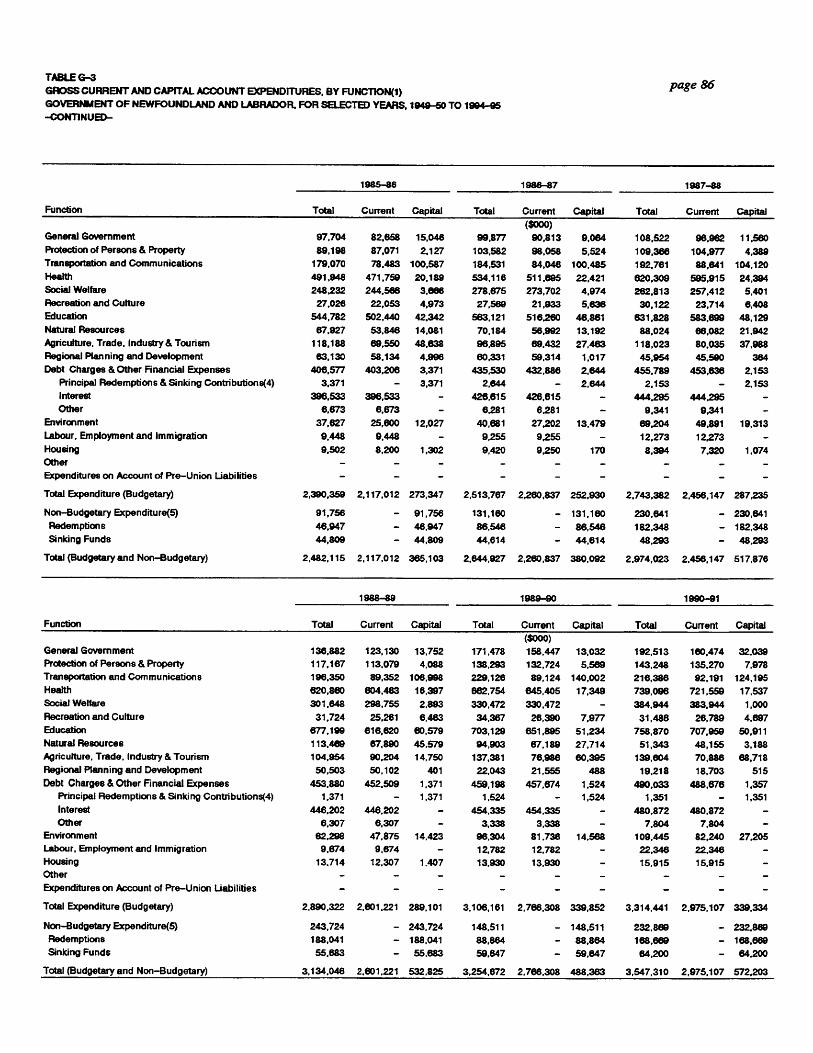
1987-88 III a
Current Capital
96,962
104,977
88,641
595,915
257.412
23.714
583,899
68,082
80,035
45,590
453,638
444295
9,341
49.891
12,273
7.320
11,560
4,389
104,120
24,394
5,401
6,408
48,129
21,942
37,988
364
2,153
2,153
19,313
1,074
1990-91
Current Capital
160,474
135,270
92.191
721.559
383,944
26,789
707,959
48,155
70,886
18,703
488,676
480,872
7,804
82,240
22,346
15,915
32,039
7,978
124,195
17,537
1,000
4,697
50,911
3,188
88,718
515
1,357
1,351
27,205
2,975,107 339,334
- 232.869
- 168,689
- 64,200
2,975,107 572.203
0 • 0 0
0 0 a 0 0 0 • 0 0 e 0 • sr
TABLE G-3 GROSS CURRENT AND CAPITAL ACCOUNT EXPENDITURES. BY FUNCTION(1) GOVERNMENT OF NEWFOUNDLAND AND LABRADOR, FOR SELECTS) YEARS, 1949-50 TO 1994-95 -CONTINUED-
page 86
s •
Function
1985-86 1988-87
Total Current Capital Total Current Capital Total
($000) General Government 97,704 82,658 15,046 99,877 90,813 9,084 108,522 Protection of Persons & Property 89,198 87,071 2,127 103,582 98,058 5,524 109,386 Transportation and Communications 179,070 78.483 100,587 184,531 84,048 100,485 192,781 Health 491,948 471,759 20,189 534,118 511,695 22,421 620,309 Social Welfare 248,232 244,566 3,666 278,675 273,702 4,974 262,813 Recreation and Culture 27,026 22,053 4,973 27,569 21,933 5,636 30,122 Education 544,782 502,440 42,342 563,121 516,280 48,861 831.828 Natural Resources 67,927 53,846 14,081 70,184 56,992 13,192 88,024 Agriculture, Trade, Industry & Tourism 118.188 89.550 48,838 96,895 89.432 27,483 118,023 Regional Planning and Development 63,130 58,134 4,996 60,331 59,314 1,017 45,954 Debt Charges & Other Financial Expenses 406,577 403.206 3,371 435,530 432,886 2,644 455,789
Principal Redemptions & Sinking Contributions(4) 3.371 - 3,371 2,644 - 2,644 2.153 Interest 396.533 396,533 428,615 426,615 444295 Other 6.673 8,873 8,281 6,281 - 9.341
Environment 37,827 25,800 12,027 40,681 27.202 13,479 89,204 Labour, Employment and Immigration 9,448 9,448 9,255 9,255 12,273 Housing 9.502 8,200 1,302 9,420 9,250 170 8,394 Other
Expenditures on Account of Pre-Union Liabilities
Total Expenditure (Budgetary) 2,390,359 2.117,012 273,347 2,513,767 2,280,837 252,930 2,743.382
Non-Budgetary Expenditure(5) 91,756 - 91,756 131,160 - 131,160 230,641 Redemptions 46,947 - 48,947 86,548 - 86,546 182,348 Sinking Funds 44,809 - 44,809 44,814 - 44,614 48,293
Total (Budgetary and Non-Budgetary) 2,482,115 2,117,012 365,103 2,644,927 2,260,837 380,092 2,974,023
2,456,147 287,235
- 230,841
- 182,348
48,293
2,456,147 517,876
Function
1988-89 1989-90
Total Current Capital Total Current Capital Total
($000) General Government 136,882 123,130 13,752 171,478 158,447 13,032 192,513 Protection of Persons & Property 117,167 113,079 4,088 138,293 132,724 5,589 143,248 Transportation and Communications 198,350 89,352 106,998 229,126 89,124 140,002 216,386 Health 620,860 604.463 16,397 882,754 645,405 17,349 739,098 Social Welfare 301,848 298,755 2,893 330,472 330,472 384,944 Recreation and Culture 31,724 25.261 8,483 34,367 26,390 7,977 31,488 Education 677,199 616,620 60,579 703,129 651,895 51,234 758,870 Natural Resources 113.469 67,890 45,579 94,903 87,189 27,714 51,343 Agriculture, Trade, Industry & Tourism 104,954 90,204 14,750 137,381 76,986 60,395 139,804 Regional Planning and Development 50,503 50,102 401 22,043 21,555 488 19,218 Debt Charges & Other Financial Expenses 453,880 452,509 1,371 459,198 457,874 1,524 490,033
Principal Redemptions & Sinking Contributions(4) 1,371 1,371 1,524 - 1,524 1,351 Interest 446,202 448,202 454,335 454,335 480,872 Other 6,307 6,307 3,338 3,338 7,804
Environment 82,298 47,875 14.423 98,304 81,738 14,568 109,445 labour, Employment and Immigration 9,674 9,674 12,782 12,782 22,348 Housing 13,714 12,307 1,407 13,930 13,930 15,915 Other
Expenditures on Account of Pre-Union Liabilities
Total Expenditure (Budgetary) 2,890,322 2,601,221 289,101 3,106,161 2,786,308 339,852 3,314,441
Non-Budgetary Expenditure(5) 243,724 - 243,724 148,511 - 148,511 232,889 Redemptions 188,041 - 188,041 88,864 - 88,864 168,669 Sinking Funds 55,683 - 55,683 59,647 59.647 64,200
Total (Budgetary and Non-Budgetary) 3,134,048 2,601,221 532,825 3,254.872 2,766,308 488,383 3,547,310

TABLE G-3
GROSS CURRENT AND CAPITAL ACCOUNT EXPENDITURES, BY FUNCTION(1)
GOVERNMENT OF NEWFOUNDLAND AND LABRADOR, FOR SELECTED YEARS, 1949-50 TO 1994-05
-CONTINUED-
page 87
Function
1991-92 1992-93 1993-94(2)
Total Current Capital Total Current Capital Total Current Capital ($000)
General Government 173,835 163,275 10,560 183,873 166,859 17,014 177,877 165,792 12,085 Protection of Persons & Property 148,489 139,232 9,257 141.778 138,488 3,290 139,730 137,430 2,300 Transportation and Communications 209,517 95,386 114,131 220,093 104,409 115,684 200,116 97,449 102,667 Health 748,461 730,256 18,205 774,085 758,448 15,637 781,629 757,669 23,960 Social Welfare 418,151 413,510 4,641 437,170 433,711 3,459 427,639 426,479 1,160
Recreation and Culture 28,169 23,517 4,652 26.621 23,560 3,061 22,621 20,405 2,216
Education 759,792 706,688 53,104 786.970 739,025 47,945 790,077 762,447 27,630
Natural Resources 81,522 63,532 17,990 88,051 74,823 13,228 88,946 78,505 10,441
Agriculture, Trade, Industry & Tourism 167,147 64,989 102,158 146,481 68,848 77,615 93,082 60,592 32,490
Regional Planning and Development 13,368 13,203 165 12,190 11,947 243 8,309 7,491 818
Debt Charges & Other Financial Expenses 496,127 495.014 1,113 487,615 486,678 937 503,376 500,070 3,306
Principal Redemptions & Sinking Contributions(4) 1,113 - 1,113 937 - 937 3,306 - 3.306
Interest 487,245 487,245 - 480,693 480,893 - 493,851 493,851 -
Other 7,769 7,769 - 5,882 5,882 - 6,219 6,219 -
Environment 106,268 82,524 23,744 112,523 79,972 32,551 103,467 76,875 26,592
Labour, Employment and Immigration 17,938 17,938 - 19,081 19,081 - 22,634 22,634 -
Housing 15,645 15,645 - 18,257 18,257 - 18,091 18,091 -
Other - - - - - - - - -
Expenditures on Account of Pre-Union Liabilities - - - - - - - - -
Total Expenditure (Budgetary) 3,384,429 3,024,709 359,720 3,454,665 3,124,001 330,664 3,377,494 3,131,929 245,665
Non-Budgetary Expenditure(5) 443,894 - 443,894 196,672 - 196,672 202,454 - 202,454
Redemptions 383,427 - 383,427 140,795 - 140,795 146.767 - 146,767
Sinking Funds 60,487 - 60,467 55,877 - 55,877 55,687 - 55.687
Total (Budgetary and Non-Budgetary) 3,828,323 3.024,709 803,614 3,651,337 3,124,001 527,336 3,580,048 3,131,929 448,119
1994-95(3)
Function Total Current Capital
General Government 216.592 204,012 12,580
Protection of Persons & Property 144,737 142,587 2,150
Transportation and Communications 192,489 99.564 92,925
Health 811,920 788,395 23,525
Social Welfare 443.604 438,054 5.550
Recreation and Culture 22,958 19,638 3,320
Education 771,895 746,582 25,313
Natural Resources 84,939 72.455 12,484
Agriculture, Trade, Industry & Tourism 105,600 54,033 51,567
Regional Planning and Development 43.885 7,772 36,113
Debt Charges & Other Financial Expenses 529,332 525,973 3,359
Principal Redemptions & Sinking Contributions(4) 3,359 3,359
Interest 520,903 520,903
Other 5,071 5,071
Environment 115,083 84,000 31,083
Labour, Employment and Immigration 19,812 19,812
Housing 18,376 18,376
Other
Expenditures on Account of Pre-Union Liabilities
Total Expenditure (Budgetary) 3,471,223 3,171,254 299,989
Non-Budgetary Expenditure(5) 220,458 - 220.458
Redemptions 165,052 - 165,052
Sinking Funds 55.406 - 55,406
Total (Budgetary and Non-Budgetary) 3,691,681 3,171,254 520,427
1 - This table allocates expenditures of Provincial Government Departments on the basis of Functional Classification developed by Statistics Canada in the Canadian
Systems of Financial Management Statistics.
2 - Revised 3 - Estimates 4 - Represents Sinking Fund Expenditure and Principal Redemption, Crown Building Corporation Debentures (Rental Purchase).
S - Represents Sinking Fund Expenditure and Principal Redemption, Provincial Government Debentures.
Additional Data: All years 1949-50 to 1973-74
Source: Derived from the Public Accounts & Estimates of the Province.
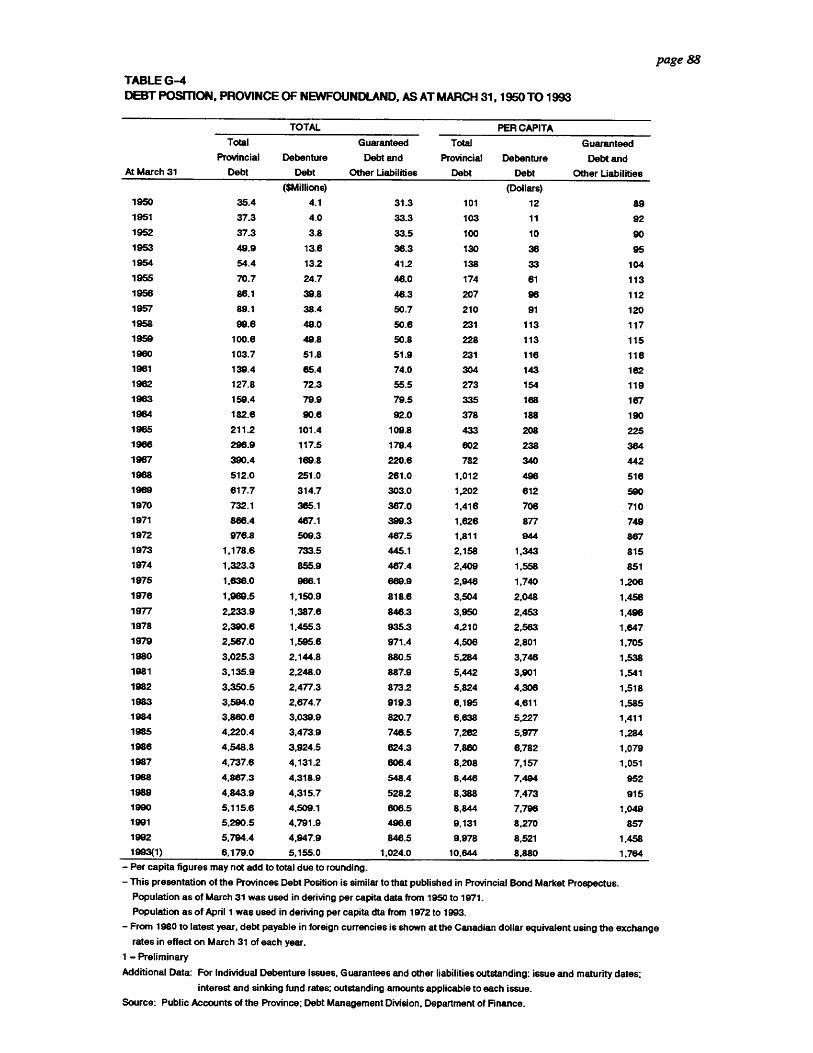
1111
1191
1111
1•0
0111101101 1
1 11
1O
OS
OO
MO
SS
OS
IM
101S
OO
SO
S
page 88
TABLE G-4 DEBT POSITION, PROVINCE OF NEWFOUNDLAND, AS AT MARCH 31, 1950 TO 1993
TOTAL PER CAPITA
Total Guaranteed Total Guaranteed
Provincial Debenture Debt and Provincial Debenture Debt and
At March 31
Debt Debt Other Liabilities Debt Debt Other Liabilities
( Millions) (Dollars)
1950 35.4 4.1 31.3 101 12 89
1951 37.3 4.0 33.3 103 11 92
1952 37.3 3.8 33.5 100 10 90
1953 49.9 13.6 36.3 130 36 95
1954 54.4 13.2 41.2 138 33 104
1955 70.7 24.7 46.0 174 61 113
1956 8e.1 39.8 46.3 207 96 112
1957 89.1 38.4 50.7 210 91 120
1958 99.6 49.0 50.6 231 113 117
1959 100.6 49.8 50.8 228 113 115
1960 103.7 51.8 51.9 231 116 116
1961 139.4 65.4 74.0 304 143 162
1962 127.8 72.3 55.5 273 154 119
1963 159.4 79.9 79.5 335 168 167
1964 182.6 90.6 92.0 378 188 190
1965 211.2 101.4 109.8 433 208 225
1966 296.9 117.5 179.4 602 238 364
1967 390.4 169.8 220.6 782 340 442
1968 512.0 251.0 261.0 1,012 496 516
1969 617.7 314.7 303.0 1,202 612 590
1970 732.1 365.1 367.0 1,416 706 710
1971 886.4 487.1 399.3 1,626 877 749
1972 976.8 509.3 467.5 1,811 944 867
1973 1,178.6 733.5 445.1 2,158 1,343 815
1974 1,323.3 855.9 467.4 2,409 1,558 851
1975 1,636.0 966.1 689.9 2,948 1,740 1,206
1976 1.969.5 1,150.9 818.6 3,504 2,048 1,456
1977 2,233.9 1,387.6 846.3 3,950 2,453 1,4.96
1978 2,390.6 1,455.3 935.3 4,210 2,563 1,647
1979 2,567.0 1,595.6 971.4 4,506 2,801 1.705
1980 3,025.3 2,144.8 880.5 5,284 3,746 1,538
1981 3,135.9 2,248.0 887.9 5,442 3,901 1,541
1982 3,350.5 2,477.3 873.2 5,824 4,306 1.518
1983 3,594.0 2,674.7 919.3 6,195 4,611 1,585
1984 3,860.6 3,039.9 820.7 6,638 5,227 1,411
1985 4,220.4 3,473.9 746.5 7,262 5,977 1,284
1986 4,548.8 3,924.5 624.3 7,860 6,782 1.079
1987 4,737.6 4,131.2 606.4 8,208 7,157 1,051
1988 4,887.3 4,318.9 548.4 8,446 7,494 952
1989 4,843.9 4,315.7 528.2 8,388 7,473 915
1990 5,115.6 4,509.1 606.5 8,844 7,796 1,049
1991 5,290.5 4,791.9 496.6 9,131 8,270 857
1992 5,794.4 4,947.9 848.5 9,978 8,521 1,458
1993(1) 6,179.0 5,155.0 1,024.0 10,644 8.880 1,764
- Per capita figures may not add to total due to rounding.
- This presentation of the Provinces Debt Position is similar to that published in Provincial Bond Market Prospectus.
Population as of March 31 was used in deriving per capita data from 1950 to 1971.
Population as of April 1 was used in deriving per capita dta from 1972 to 1993.
- From 1980 to latest year, debt payable in foreign currencies is shown at the Canadian dollar equivalent using the exchange
rates in effect on March 31 of each year.
1 - Preliminary
Additional Data: For Individual Debenture Issues, Guarantees and other liabilities outstanding: issue and maturity dates;
interest and sinking fund rates; outstanding amounts applicable to each issue.
Source: Public Accounts of the Province; Debt Management Division, Department of Finance.
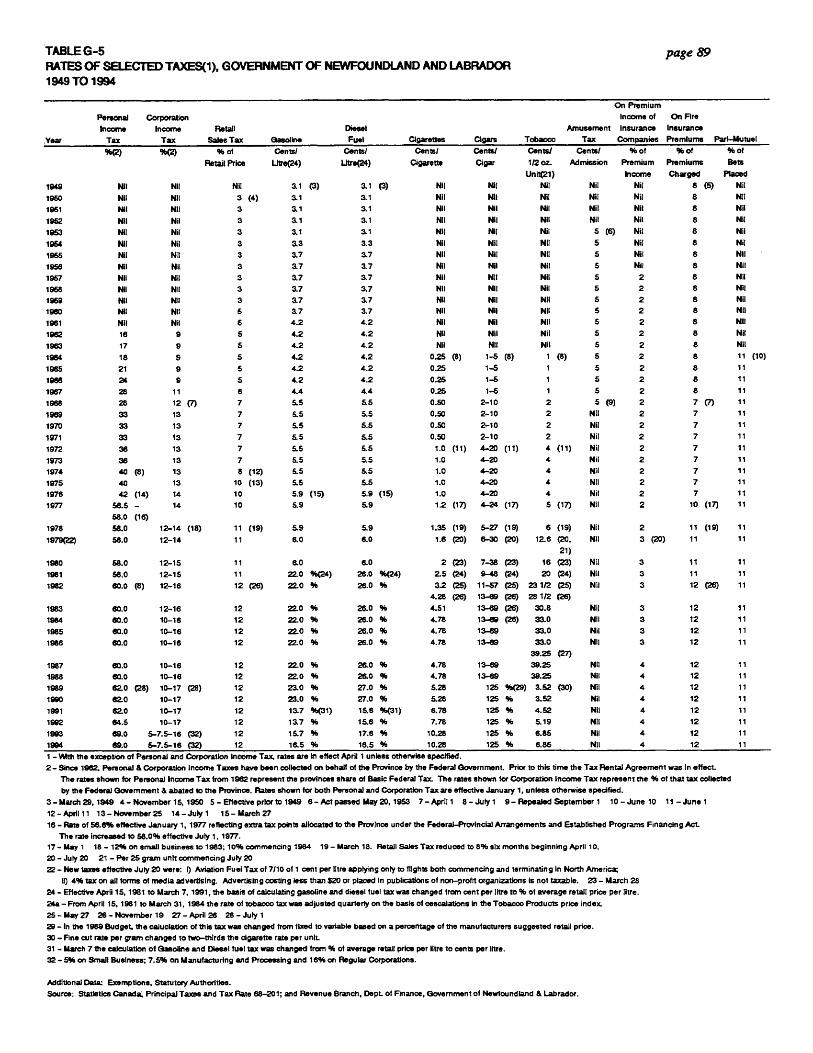
III II1TABLE G-5 page 89 GRAMS OF SELECTED TAXES(1), GOVERNMENT OF NEWFOUNDLAND AND LABRADOR
1949 TO 1994 11111
.Year.Year
. is 1949
1950
in1951
1952
as 1953
111/ 1954
Am 1955
Mr 1958
1957
al1958
1969
0 1980
1981
0 •4. 1982
1983
1964
1985
1968
1967
al1968
1969
Am 1970
11. 1971
iiik 1972
gip 1973
1974 4)1975
1978
111 1977
III Personal
Income
Tax
Corporation
Income
Tax
Retail
Sales Tax Gasoline Fuel
Diesel
Cigarettes Cigars Tobacco
Amusement
Tax
On Premium
Income of
Insurance
Companies
On Fire
Insurance
Premiums Parl-Mutuel
%(2) %(2) % of Cents/ Cents! Cents! Cents/ Cents/ Cents/ % of % of % of
Retail Price Utre(24) Litre(24) Cigarette Cigar 1/2 oz. Admission Premium Premiums Bets
UnIt(21) Income Charged Placed
Nil Nil Nil 3.1 (3) 3.1 (3) Nil Nil Nil Nil Nil 8 (5) Nil
Nil Nil 3 (4) 3.1 3.1 Nil Nil Nil Nil Nil 8 NIl
Nil Nil 3 3.1 3.1 Nil Nil Nil Nil Nil 8 NIl
Nil Nil 3 3.1 3.1 Nil Nil Nil Nil Nil 8 NIl
Nil Nil 3 3.1 3.1 Nil Nil Nil 5 (6) Nil 8 Nil
Nil Nil 3 3.3 3.3 Nil Nil Nil 5 Nil 8 Nil
Nil Nil 3 3.7 3.7 Nil Nil Nil 5 Nil 8 Nit
Nil Nil 3 3.7 3.7 Nil Nil Nil 5 Nil 8 Nil
NII Nil 3 3.7 3.7 Nil Nil Nil 5 2 8 Nil
Nil Nil 3 3.7 3.7 Nil Nil Nil 5 2 8 Nil
Nil Nil 3 3.7 3.7 Nil Nil Nil 5 2 8 NIl
Nil Nil 5 3.7 3.7 Nil Nil Nil 5 2 8 Nil
Nil Nil 6 4.2 4.2 Nil Nil Nil 5 2 8 NII
16 9 5 4.2 4.2 Nil Nil Nil 5 2 8 Nil
17 9 5 4.2 4.2 Nil Nil Nil 5 2 8 Nil
18 9 5 4.2 4.2 0.25 (8) 1-5 (8) 1 (8) 5 2 8 11 (10)
21 9 5 4.2 4.2 0.25 1-5 1 5 2 8 11
24 9 5 4.2 4.2 0.26 1-6 1 5 2 8 11
28 11 6 4.4 4.4 0.25 1-6 1 5 2 8 11
28 12 (7) 7 5.5 5.5 0.50 2-10 2 5 (9) 2 7 (7) 11
33 13 7 5.5 5.5 0.50 2-10 2 NIl 2 7 11
33 13 7 5.5 5.5 0.50 2-10 2 Nil 2 7 11
33 13 7 5.5 5.5 0.50 2-10 2 Nil 2 7 11
38 13 7 5.5 5.5 1.0 (11) 4-20 (11) 4 (11) Nil 2 7 11
36 13 7 5.5 5.5 1.0 4-20 4 Nil 2 7 11
40 (8) 13 8 (12) 5.5 5.5 1.0 4-20 4 Nil 2 7 11
40 13 10 (13) 5.5 5.5 1.0 4-20 4 Nil 2 7 11
42 (14) 14 10 5.9 (15) 5.9 (15) 1.0 4-20 4 Nil 2 7 11
56.5 - 14 10 5.9 5.9 1.2 (17) 4-24 (17) 5 (17) Nil 2 10 (17) 11
58.0 (16)
58.0 12-14 (18) 11 (19) 5.9 5.9 1.35 (19) 5-27 (19) 6 (19) Nil 2 11 (19) 11
58.0 12-14 11 6.0 6.0 1.6 (20) 6-30 (20) 12.8 (20, Nil 3 (20) 11 11
21)
68.0 12-15 11 6.0 8.0 2 (23) 7-38 (23) 16 (23) Nil 3 11 11
58.0 12-15 11 220 %(•24) 26.0 %(24) 2.5 (24) 9-48 (24) 20 (24) Nil 3 11 11
60.0 (8) 12-16 12 (26) 22-0 % 26.0 % 3.2 (25) 11-57 (25) 23 1/2 (25) Nil 3 12 (26) 11
4.28 (28) 13-89 (26) 28 1/2 (26)
60.0 12-16 12 22.0 % 26.0 % 4.51 13-69 (26) 30.8 Nil 3 12 11
60.0 10-16 12 22.0 % 26.0 % 4.78 13-09 (28) 33.0 NIl 3 12 11
60.0 10-16 12 22.0 28.0 % % 4.78 13-89 33.0 Nil 3 12 11
60.0 10-16 12 22.0 % 26.0 % 4.78 13-89 33.0 Nil 3 12 11
39.25 (27)
80.0
60.0
82.0
10-16
10-16
(28) 10-17 (28)
12
12
12
22.0
22.0 23.0
%
%
%
26.0
26.0
27.0
%
%
%
4.78
4.78
5.28
13-69
13-69
125
39.25
39.25
%(29) 3.52
Nil
Nil
(30) Nil
4
4
4
12
12
12
11
11
11
82.0 10-17 12 220 % 27.0 % 5.28 125 % 3.52 Nil 4 12 11
62.0 10-17 12 13.7 %(31) 15.8 %(31) 6.78 125 % 4.52 Nil 4 12 11
64.5 10-17 12 13.7 % 15.6 % 7.78 125 % 5.19 Nil 4 12 11
69.0 5-7.5-16 (32) 12 15.7 % 17.6 % 10.28 125 % 6.85 Nil 4 12 11
69.0 5-7.5-16 (32) 12 16.5 % 16.5 % 10.28 125 % 8.85 NIl 4 12 11
1 - With the exception of Personal and Corporation Income Tax, rates are in effect April 1 unless otherwise specified. 0 2 - Since 1982, Personal & Corporation Income Taxes have been collected on behalf of the Province by the Federal Government. Prior to this time the Tax Rental Agreement was in effect.
The rates shown for Personal Income Tax from 1982 represent the provinces share of Basic Federal Tax. The rates shown for Corporation Income Tax represent the % of that tax collected
by the Federal Government & abated to the Province. Rates shown for both Personal and Corporation Tax are effective January 1, unless otherwise specified. al 3 - March 29, 1949 4 - November 15, 1950 5 - Effective prior to 1949 6 - Act passed May 20, 1953 7- April 1 8 - July 1 9 - Repealed September 1 10 - June 10 11 - June 1
12 - April 11 13 - November 25 14 - July 1 15 - March 27
ii18 - Rate of 58.8% effective January 1, 1977 reflecting extra tax points allocated to the Province under the Federal-Provincial Arrangements and Established Programs Financing Act
The rate increased to 58.0% effective July 1, 1977.
is 17 - May 1 18 - 12% on small business to 1983; 10% commencing 1984 19 - March 18. Retail Sales Tax reduced to 8% six months beginning April 10.
20 - July 20 21 - Per 25 gram unit commencing July 20
0 22 - New taxes effective July 20 were: i) Aviation Fuel Tax of 7/10 of 1 cent per litre applying only to flights both commencing and terminating in North America;
II) 4% tax on all forms of media advertising. Advertising costing less than 120 or placed in publications of non-profit organizations is not taxable. 23 - March 28
0 al
.24 - Effective AprI115, 1981 to March 7, 1991, the basis of calculating gasoline and diesel fuel tax was changed from cent per litre to % of average retail price per litre.
24a - From April 16, 1981 to March 31, 1984 the rate of tobacco tax was adjusted quarterly on the basis of cescalations In the Tobacco Products price index.
25 - May 27 26 - November 19 27 - April 28 28 - July 1
29 - in the 1989 Budget, the caluclation of this tax was changed from fixed to variable based on a percentage of the manufacturers suggested retail price.
30 - Fine cut rate per gram changed to two-thirds the cigarette rate per unit.
31 - March 7 the calculation of Gasoline and Diesel fuel tax was changed from % of average retail price per litre to cents per litre.
al 32 - 5% on Small Business; 7.5% on Manufacturing and Processing and 18% on Regular Corporations.
Additional Data Exemptions, Statutory Authorities.
0 Source: Statistics Canada, Principal Taxes and Tax Rate 88-201; and Revenue Branch, Dept. of Finance, Government of Newfoundland & Labrador.
III 4111
.1978
1979(22)
.1980
Ali 1981
Imp 1982
fp 1983
1984
1985
1986
III 1987 ED 1988
1989 .1990
1991 0 1992
1993
0 1994
••
• • • • • • •
• • • • • • • • • • • • • • • •
SECTION H
BANKING AND FINANCE
• • • • • • • • • • • •
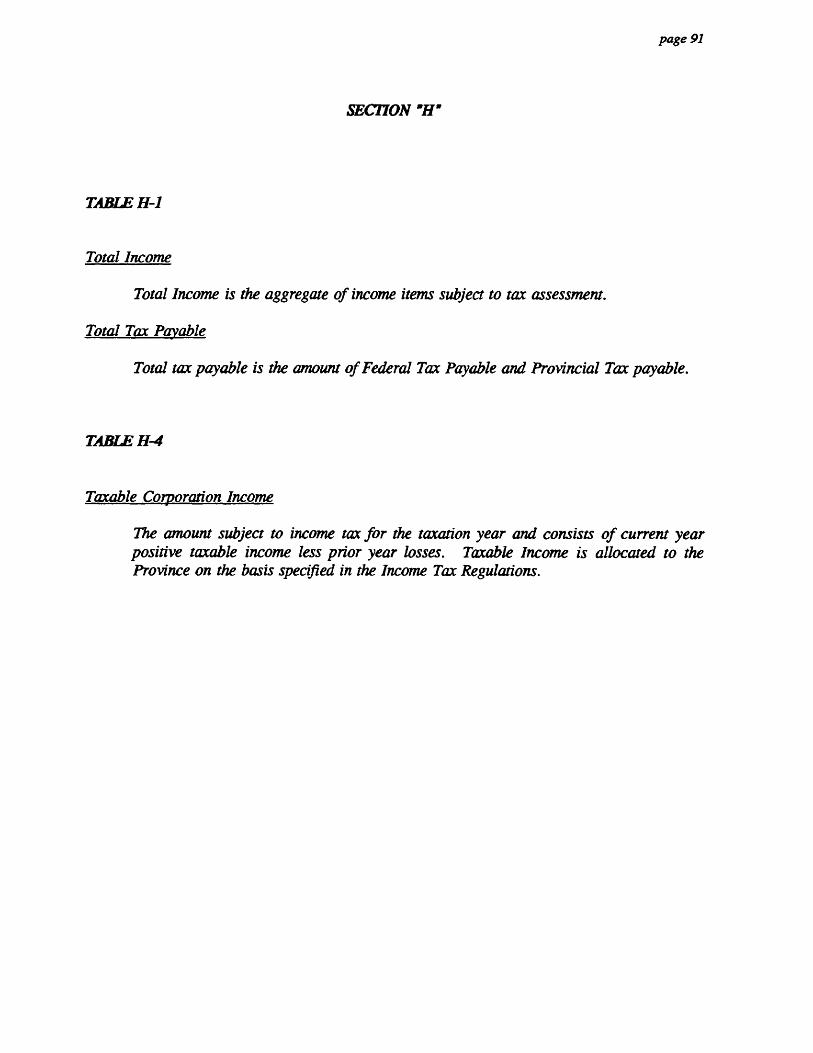
O page 91
0 0 • SECTION 'H'
0
0
0 0 TABLE H-1
0 0 Total Income
in Total Income is the aggregate of income items subject to tax assessment. ii • Total Tax Payable
Total tax payable is the amount of Federal Tax Payable and Provincial Tax payable. 0 0 • a ea • Taxable Corporation Income
• The amount subject to income tax for the taxation year and consists of current year 0 positive taxable income less prior year losses. Taxable Income is allocated to the
ii Province on the basis specified in the Income Tax Regulations. • to • 0 a • a al 0 r • 0 • • • • 0 0
TABLE H-4
al

page 92
111 TABLE H-1 NUMBER OF TAXPAYERS, TOTAL INCOME (8), TOTAL TAX, BY INCOME CLASSES NEWFOUNDLAND AND LABRADOR, FOR SELECTED YEARS, 1950 TO 1990
1950 1955 1960 1965
Number of
Taxpayers
Total
Income
Total
Tax
Number of
Taxpayers
Total
Income
Total
Tax
Number of
Taxpayers
Total
Income
Total
Tax
Number of
Taxpayers
Total
Income
Total
Tax
(S,000) (5,000) (8,000) ($,000) (6,000) (8,000) (6,000) ($,000)
$1,000 (1) 30 15 2 200 101 IIIUnder 6 180 80 8 265 127 12
1,000 - 1,999(2) 4,920 7,157 296 9,540 13,840 608 9,680 14,806 528 11,314 17,171 611
2,000 - 2,999 6,770 17,176 664 12,840 32,853 1,668 10,100 25,517 1,308 12,831 32,219 1,771
3,000 - 3,999 3,970 13,545 701 12,880 44,221 2,498 12,720 44,077 2,252 15,305 53,870 3,266
4,000 - 4,999 1,480 6,504 487 5,020 22,123 1,649 8,300 36,802 2,215 13,587 80,907 3,972
5,000 - 5,999 490 2,681 250 2,090 11,343 1,071 4,780 25,919 2,062 8,820 47,943 3,895
6,000 - 6,999 190 1,197 123 890 5,892 819 2,320 14,901 1,407 4,257 27,507 2.€22
7,000 - 7,999 240 1,807 228 370 2,749 309 1,320 9,757 1,007 2,659 19,852 2,028
8,000 - 8,999 80 696 92 220 1,842 249 660 5,586 649 2,112 17,823 2,100
9,000 - 9,999 130 1,239 176 220 2,106 303 380 3,437 440 979 9,235 1,148
10,000 - 14,999 140 1,826 340 360 4,088 825 684 8,196 1,304 1,841 21,434 3,083
15,000 - 19,999 100 1,840 443 150 2,493 505 289 4,836 1,055 385 8,794 1,380
20,000 - 24,999 30 824 145 50 1,113 273 116 2,591 639 166 3,685 876
25,000 - 29,999 40 1,455 522 50 1,545 503 159 6,034 1,998 277 10,814 3,483
Over 29,999
Total 18,590 57,762 4,449 44,880 146,108 10,886 51,628 202,509 16,871 74,808 329,379 30,227
1970 1975 1980 1981
Number of
Taxpayers
Total
Income
Total
Tax
Number of
Taxpayers
Total
Income
Total
Tax
Number of
Taxpayers
Total
Income
Total
Tax
Number of
Taxpayers
Total
Income
Total
Tax
Under $1,000
1,000 - 1,999
2,000 - 2,999(3)
3,000 - 3,999
4,000 - 4,999
6,000 - 6,999
6,000 - 6,999
7,000 - 7,999
000 - 8,999
9,000 - 9,999
10,000 - 14,999
15,000 - 19,999
20,000 - 24,999
25,000 - 29,999
Over 29,999
Total
245
12,721
15,480
16,805
15,801
12,042
9,834
8,122
5,772
4,108
8,598
1,500
397
893
111,698
($,000)
79
19,640
38,697
58,867
69,870
66,067
62,367
60,800
48,969
38,887
102,612
25,151
8,833
27,988
828,828
8,000
(5,000)
15
767
2,840
4,991
6,888
7,568
7,770
8,449
7,541
6,652
19,967
5,879
2,441
10,487
92,034
338
161
11,137
14,280
14,995
18,421
14,811
14,484
12,700
11,837
40,223
14,403
4,326
3,518
173,614
(5,000)
190
302
28,393
50,059
67,818
90,535
96,487
108,202
107,976
112,499
484,088
245,910
95,487
138,378
1,626,303
(5,000)
2
1
194
1,035
3,083
5,882
8,049
10,742
12,405
14,556
74,812
48,638
21,881
44,297
246,376
••
45
45
7,700
11,688
12,248
11,884
1215 11,729'3
11,511
48,183
31,957
20,478
10,850
10,234
198,645
(8,000)
67
107
27,628
52,523
67,758
77,276
92,361
99,740
109,302
666,010
552,558
456,681
290,257
434,431
2,825,698
(8,000)
..
1
116
610
2,057
3,718
5,639
7,257
9,695
86,740
85,493
83,249
59,012
109,590
433,179
146
.•
4,072
10,870
11,993
12,198
11,336
10,876
47,643
28,388
23,357
14,354
17,814
202,909
10,064
(s,000)
228
.•
15,142
45,465
69,637
77,806
91,583
96,090
103,592
588,516
491,809
520,441
391,867
727,652
3,207,408
(S,000)
2
40
355
1,226
3,013
5,098
6,335
7,988
65,486
73,798
90,816
76,731
178,888
509,754
1982 1983 1984 1985
Number of
Taxpayers
Total
Income
Total
Tax
Number of
Taxpayers
Total
Income
Total
Tax
Number of
Taxpayers
Total
Income
Total
Tax
Number of
Taxpayers
Total
Income
Total
Tax
Under $1,000
1,000 - 1,999
2,000 - 2,999
3,000 - 3,999
4,000 - 4,999(4)
5,000 - 5,999
6,000 - 6,999
7,000 - 7,999
8.000 - 8,999
9,000 - 9,999
10,000 - 14,999
15,000 - 19,999
20,000 - 24,999
25,000 - 29,999
Over 29,999
Total
..
8,752
11,011
10,912
11,653
11,092
11,596
45,456
33,787
23,731
18,256
23,067
209,313
(8,000)
..
38,976
60,891
71,000
87,644
94,187
110,154
564,003
581,082
532,350
502,635
967,073
3,809,794
(8,000)
..
192
897
2,992 4,387
5,985
7,972
57,497
78,517
88,308
94,722
233,539
574,410
••
5,017
9,132
10,459
9,879
10,878
11,078
44,757
33,348
22,307
16,537
28,067
200,055
(8,000)
.•
22,969
50,241
67,806
74,052
92,479
105,190
555,134
575,763
499,102
454,241
1,113,852
3,610,626
(5,000)
.•
..
..
85
386
1,342
2,733
4,812
6,248
49,754
74,647
78,882
82,170
259,072
580,107
..
4,042
10,570
11,606
11,531
8,429
9,350
46,730
34,056
19,990
18,904
30,176
205,387
(8,000)
..
..
18,864
58,215
875„898191 5
71,886
88,712
576,477
583,385
446,245
517,884
1,274,554
3,797,733
(8,000)
..
55
401
2,655
1,246
3,298
5,136
49,595
72,143
67,793
91,422
292,283
586,027
.•
3,785
9,143
10,978
9,919
10,536
10,142
47,052
35,292
24,181
16,605
34,752
212,385
(8,000)
••
17,750
50,827
71,061
74,236
89,485
96,136
582,841
809,007
539,108
4.54,021
1,496,475
4,080,747
(8,000)
41
330
1,374
2,897
5,078
6,042
53,410
78,616
83,528
81,290
343,417
656,023
- III
III III III III II III 11111 III

Under $1,000
III 1,000 - 1,999
2,000 - 2,999
III 3,000 - 3,999
4,000 - 4,999
1111 5,000 - 5,999(5)
6,000 - 6,999
III 7,000 - 7,999
8,000 - 8,999
III 9,000 - 9,999
10,000 -14,999
III 15,000 -19,999
20,000 - 24,999
111111 25,000 - 29,999
Over 29,999
III Total
III
Under $1,000
1,000 - 1,999
2,000 - 2,999
3,000 - 3,999
4,000 - 4,999
_
••
..
(5,000)
..
(5,000)
..
5,000 - 5,999 330 1,010 53
6,000 - 6,999 4,460 29,461 406
7,000 - 7,999 7,370 55,646 2,048
8,000 - 8,999 8,970 76,424 4,019
9,000 - 9,999 9,220 87,536 5,927
10,000 - 14,999 45,870 574,902 55,583
15,000 - 19,999 40,040 698,735 90,718
20,000 - 24,999 34,900 779,706 118,367
25,000 - 29,999 22,290 609,561 101,962
Over 29,999 66,080 3,142,490 nzon
Total 239,530 6,055,471 1,142,162
III Number of Total Total
Taxpayers Income Tax
III
III
e page 93
0
Is TABLE H-1 NUMBER OF TAXPAYERS, TOTAL INCOME (6), TOTAL TAX, BY INCOME CLASSES
III NEWFOUNDLAND AND LABRADOR, FOR SELECTED YEARS, 1950 TO 1990 - Continued -
1986 1987 1988 1989
Number of
Taxpayers
Total
Income
Total
Tax
Number of
Taxpayers
Total
Income
Total
Tax
Number of
Taxpayers
Total
Income
Total
Tax
Number of
Taxpayers
Total
Income
Total
Tax
(5,000) (5,000)
.•
(5,000)
.•
(5,000) (5,000) (5,000) (5,000) (5,000)
••
•• .•
.. .• •. .• _ •• .. .•
2,820 13,068 75 1,930 8,745 57 .. _ .. .. - ..
8,820 48,688 741 7,320 40,328 521 80 419 116 20 52 1
10,130 65,661 2,051 10,300 67,430 1,817 6,810 44,637 882 6,020 39,488 640
12,740 95,895 4,877 10,690 80,130 3,397 8,590 64,399 2,595 8,340 62,687 2,359
9,740 82,965 5,568 10,370 88,284 5,490 8,200 80,652 4,076 9,570 81,243 4,511
10,600 100,828 7,905 10,850 102,602 7,612 10,260 97,542 7,197 10,560 100,157 7,254
49,440 614,540 62,640 48,250 595,475 58,945 46,240 575,841 55,961 46,350
6 06g
39,020 677,178 95,182 40,840 705,922 94,013 42,020 735,810 93,323 41,250 723,003 92,644
23,230 517,886 85,485 26,740 596,082 97,151 29,030 646,418 94,234 32,950 735,140 112,640
18,460 502,815 92,933 20,590 563,505 100,075 20,900 569,484 92,069 20,890 571,087 94,154
38,230 1,669,414 397,531 45,830 2,001,045 474,827 52,830 2,355,260 538,757 59,650 2,775,499 663,983
223,230 4,388,738 754,968 233,510 4,849,548 843,905 224,760 5,159,642 889,210 235,600 5,865,041 1,034,255
III .
1990
III 1 - Under $1,500 in 1975 and 1978.
2 - 51,500 to 2,999 in 1975 and 1976. Under $2,000 from 1977 to 1981.
Ill 3 - 51,000 - 2,999 for 1981.
4 - Under $5,000 from 1982 to 1987.
III 6 - Under $6,000 from 1988 to 1990.
6 - Income items qualifying for tax assessment have varied over time the most significant additions being Unemployment insurance Benefits and Family Allowance
IIII payments in 1972 and 1974 respectively.
Additional Data: For all years after 1949
III For all returns (taxable and non-taxable)
By Census Division, Census sub-division and incorporated communities.
III Source: Taxation Statistics, Revenue Canada, Taxation.
III
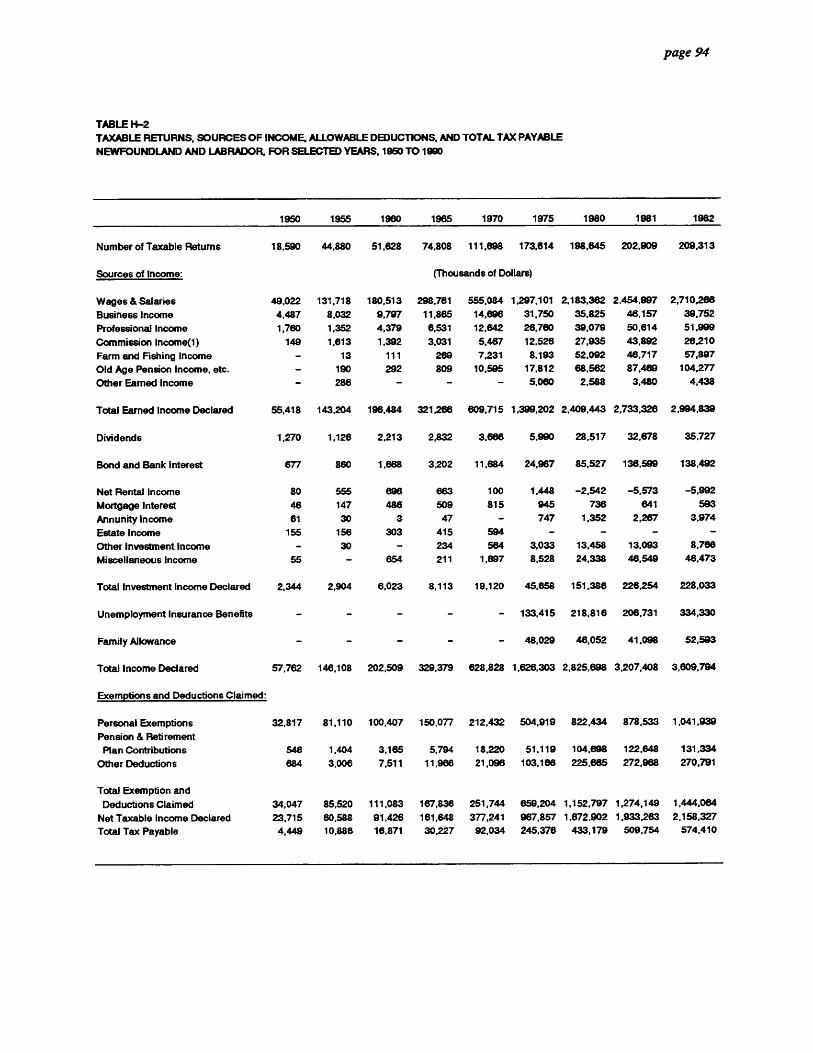
page 94
TABLE H-2
TAXABLE RETURNS, SOURCES OF INCOME, ALLOWABLE DEDUCTIONS, AND TOTAL TAX PAYABLE
NEWFOUNDLAND AND LABRADOR, FOR SELECTED YEARS, 1950 TO 1990
1950 1955 1960 1965 1970 1975 1980 1981 1982
Number of Taxable Returns 18,590 44,880 51,628 74,808 111,698 173,614 198,645 202,909 209,313
Sources of Income: (Thousands of Dollars)
Wages & Salaries 49,022 131,718 180,513 298,761 555,084 1,297,101 2,183,362 2,454,997 2,710,266
Business Income 4,487 8,032 9,797 11,865 14,696 31,750 35,825 46.157 39,752
Professional Income 1,760 1,352 4,379 6,531 12,642 26,760 39,079 50,614 51.999
Commission Income(1) 149 1,613 1,392 3,031 5.467 12,526 27,935 43,892 26,210
Farm and Fishing Income 13 111 269 7,231 8,193 52,092 46,717 57,897
Old Age Pension Income, etc. 190 292 809 10.595 17,812 68,562 87,489 104,277
Other Earned Income 286 5,060 2,588 3,480 4,438
Total Earned Income Declared 55,418 143.204 196,484 321,266 609,715 1,399,202 2,409,443 2,733,326 2,994,839
Dividends 1,270 1,126 2,213 2,832 3,666 5,990 28,517 32,678 35.727
Bond and Bank Interest 677 860 1,668 3,202 11,684 24,967 85,527 136,599 138,492
Net Rental Income 80 555 896 663 100 1,448 -2,542 -5,573 -5,992
Mortgage Interest ae 147 486 509 815 945 736 641 593
Annunity Income 61 30 3 47 - 747 1,352 2,267 3,974
Estate Income 155 156 303 415 594
Other Investment Income 30 234 564 3,033 13,458 13,093 8,766
Miscellaneous Income 55 654 211 1,697 8,528 24,338 46,549 46,473
Total Investment Income Declared 2,344 2,904 6,023 8,113 19,120 45,658 151,386 226,254 228,033
Unemployment Insurance Benefits - 133,415 218,816 206,731 334,330
Family Allowance 48,029 46,052 41,098 52,593
Total Income Declared 57,762 146,108 202,509 329.379 628,828 1,626,303 2,825,698 3,207,408 3,609,794
Exemptions and Deductions Claimed:
Personal Exemptions 32,817 81,110 100,407 150,077 212,432 504,919 822,434 878,533 1,041,939
Pension & Retirement
Plan Contributions 546 1,404 3,165 5,794 18,220 51,119 104,898 122.648 131.334
Other Deductions 684 3,006 7,511 11,966 21,096 103,166 225,665 272,968 270,791
Total Exemption and
Deductions Claimed 34,047 85,520 111,083 167,836 251,744 659,204 1,152,797 1,274,149 1,444,064
Net Taxable Income Declared 23,715 60,588 91,426 161,648 377,241 967,857 1,672,902 1,933,263 2,158,327
Total Tax Payable 4,449 10,886 16,871 30,227 92,034 245,376 433,179 509,754 574,410
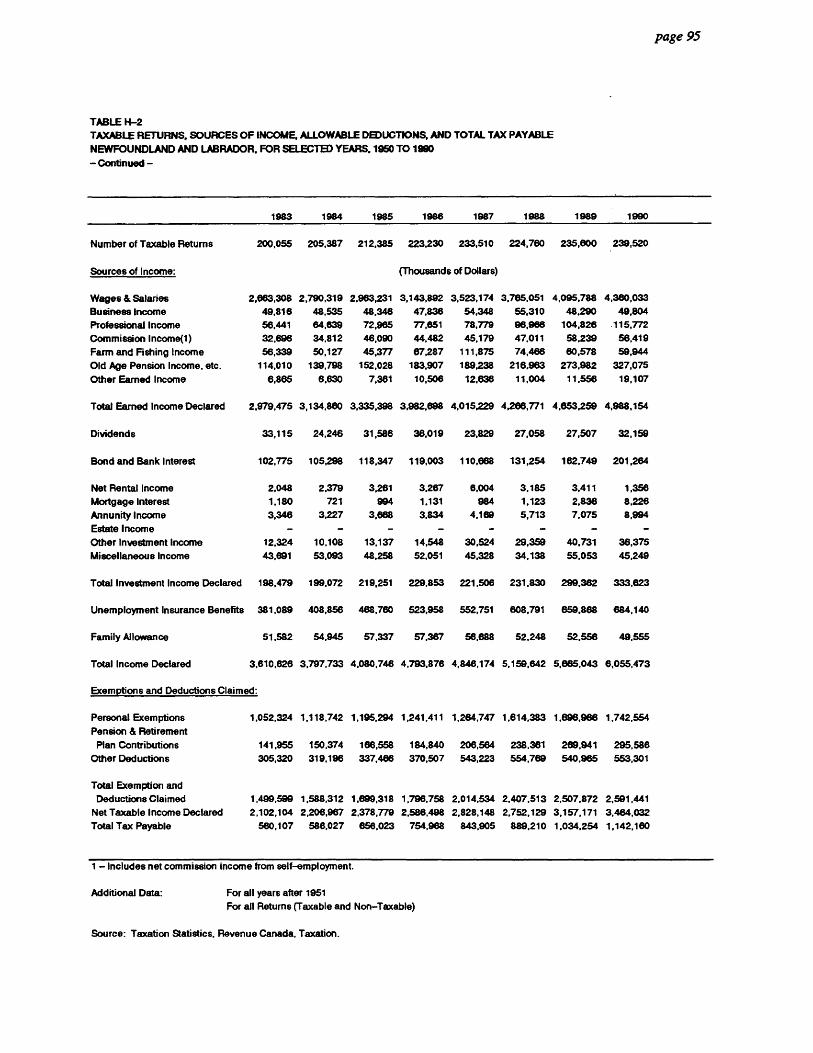
•
• • •
page 95
TABLE H-2
TAXABLE RETURNS, SOURCES OF INCOME, ALLOWABLE DEDUCTIONS, AND TOTAL TAX PAYABLE
NEWFOUNDLAND AND LABRADOR, FOR SELECTED YEARS.1950 TO 1990
11111 _ Continued -
1983 1984 1985 1986 1987 1988 1989 1990
Number of Taxable Returns 200,055 205,387 212,385 223,230 233,510 224,760 235,800 239,520
Sources of Income: (Thousands of Dollars)
Wages & Salaries
Business Income
2,663,308
49,816
2,790,319
48,535
2,963,231
48,348
3,143,892
47,836
3,523,174
54,348
3,765,051
55,310
4,095,788
48,290
4,380,033
49,804
Professional Income
Commission Income(1)
56,441
32,696
64,639
34,812
72,965
46,090
77,651
44,482
78,779
45,179
96,966
47,011
104,826
58,239
.115,772
56,419
Farm and Fishing Income 56,339 50,127 45,377 67,287 111,875 74,486 60,578 59,944
Old Age Pension Income, etc. 114,010 139,798 152,028 183,907 189,238 216,963 273,982 327,075
Other Earned Income 6,865 6,630 7,361 10,506 12,636 11,004 11,556 19,107
Total Earned Income Declared 2,979,475 3,134,860 3,335,398 3,982,698 4,015.229 4,266,771 4,653,259 4,988,154
Dividends 33,115 24,246 31,586 36,019 23,829 27,058 27,507 32,159
Bond and Bank Interest 102,775 105,298 118,347 119,003 110,668 131,254 162,749 201,264
Net Rental Income 2,048 2,379 3,261 3,267 6,004 3,185 3,411 1,356
Mortgage Interest 1,180 721 994 1,131 984 1,123 2,836 8,226
Annunity Income 3,346 3,227 3,668 3,834 4,169 5,713 7,075 8,994
Estate Income - - - - - - - -
Other Investment Income 12,324 10,108 13,137 14,548 30,524 29,359 40.731 36,375
Miscellaneous Income 43,691 53,093 48,258 52,051 45,328 34,138 55,053 45,249
Total Investment Income Declared 198,479 199,072 219,251 229,853 221,506 231,830 299,362 333,623
Unemployment Insurance Benefits 381,089 408,856 468,760 523,958 552,751 608,791 659,868 684,140
Family Allowance 51,582 54,945 57,337 57,367 56,688 52,248 52,556 49,555
Total Income Declared 3,610,626 3,797,733 4,080,746 4,793,876 4,846,174 5,159,642 5,665,043 6,055,473
and Deductions Claimed:
Personal Exemptions 1,052,324 1,118,742 1,195,294 1,241,411 1,264,747 1,614,383 1,696,966 1.742,554
Pension & Retirement
Plan Contributions 141,955 150,374 166,558 184,840 206,564 238,361 269,941 295,586
Other Deductions 305,320 319,196 337,466 370,507 543,223 554,769 540,965 553,301
Total Exemption and
Deductions Claimed 1,4.99,599 1,588,312 1,699,318 1,796,758 2,014,534 2.407,513 2.507,872 2,591,441
Net Taxable Income Declared 2,102,104 2,206,967 2,378,779 2,588,498 2,828,148 2,752,129 3,157,171 3,484,032
Total Tax Payable 560,107 586,027 856,023 754,968 843,905 889,210 1,034,254 1,142,160
•
1 - Includes net commission income from self-employment.
• Additional Data: For all years after 1951
• For all Returns (Taxable and Non-Taxable)
• Source: Taxation Statistics, Revenue Canada, Taxation.
•
•
•
4111 4111 II II III II 11111 III III ill
ill • III III III III III IIII III Exemptions
III III III 411 III
•
•

• •
• • • • • • • • •
• • • • • • •
• • • • • • • • • • • •
page 96
TABLE H-3 NUMBER OF TAXPAYERS, TOTAL INCOME AND TOTAL TAX(1), BY OCCUPATIONAL CLASSES, NEWFOUNDLAND AND LABRADOR, FOR SELECTED YEARS, 1950 TO 1990
Occupations
1950 1955 1980
Number of
Taxpayers
Total
Income
Total
Tax
Number of
Taxpayers
Total
Income
Total
Tax
Number of
Taxpayers
Total
Income
Total
Tax
($'000) ($'000) ($'000) (3'000) ($'000) ($'000)
Fishermen and Farmers ' a * • * a 61 148 6
Business Employees 12.250 37,461 2,635 29,650 94,466 6,429 32,285 123,614 9,418
Federal Government Employees 1,870 4,350 240 2,800 9,155 603 3,743 15,828 1,120
Provincial Government Employees 1,510 3,501 219 2,840 7,738 572 7,065 21,750 1,581
Municipal Government Employees 60 140 3 320 1,103 65 341 1.388 96
Accountants a • * ' * • 40 467 87
Medical Doctors, Surgeons 100 1,216 322 • • • 120 2,308 601
Dentists 40 317 44 • a - 38 484 94
Lawyers and Notaries 30 159 17 • * a 100 1,157 268
Business Proprietors 970 4,516 441 2,030 10,720 1,480 1,917 10,512 1,213
Pensioners 30 57 1 • a a 200 743 41
All Other Occupations(2) 1,930 6,045 527 7,240 22,926 1,737 5,738 24,134 2,346
Total All Occupations 18,590 57,762 4,449 44,880 148,108 10,886 51,628 202,509 18,871
Occupations
1965 1970 1975
Number of
Taxpayers
Total
Income
Total
Tax
Number of
Taxpayers
Total
Income
Total
Tax
Number of
Taxpayers
Total
Income
Total
Tax
(x'000) ($'000) (r000) (3'000) (3'000) ($000)
Fishermen and Farmers 91 349 21 1,549 7,876 931 2,826 15,621 872
Business Employees 48,038 209,769 18.415 69,653 393,361 55,867 92,444 919,574 144,759
Federal Government Employees 4,448 21,985 1,805 5,067 36,981 5,887 6,444 76,768 12,649
Provincial Government Employees 6,883 26,487 2,186 10,205 53,157 7,015 16,074 170,691 28,212
Municipal Government Employees 992 4,189 275 2,024 9,762 1,085 4,291 38,880 5,151
Accountants 40 477 94 49 749 190 72 2,513 776
Medical Doctors, Surgeons 182 3,567 934 191 8,372 3,382 283 13,773 5,079
Dentists 42 700 147 40 1,053 336 62 2,438 799
Lawyers and Notaries 54 1,446 435 72 1,807 635 100 5,321 2,089
Business Proprietors 3,053 17,804 2,027 3.339 19,977 2,920 4,625 48,034 7,400
Pensioners 508 1,687 104 2,785 8,735 884 1,747 12,577 834
All Other Occupations(2) 10,499 41,119 3,804 16,724 87,015 12,901 44,646 320,113 38,777
Total All Occupations 74,808 329,379 30,227 111,698 628,828 92,034 173,614 1.826.303 245,378
1980 1985 1986
Occupations
Number of
Taxpayers
Total
Income
Total
Tax
Number of
Taxpayers
Total
Income
Total
Tax
Number of
Taxpayers
Total
Income
Total
Tax
($'000) ($'000) ($'000) ($'000) ($'000) ($'000)
Fishermen and Farmers 9,253 88,654 8,383 7,983 95,188 8,943 8,520 120,443 15,521
Business Employees 99,882 1,488,915 232,735 81,746 1.687,068 290,784 87,310 1,837,391 335,434
Federal Government Employees 8,269 172,596 32,021 8,086 237,455 46,134 7,670 233,527 48,531
Provincial Government Employees 19,517 338,848 56,517 18,035 432,423 76.367 16,720 396,135 73,912
Municipal Government Employees 4,302 49,271 5,802 4,240 83,120 12,733 4,250 85,253 13,826
Accountants 92 3,401 820 90 6,386 4,470 90 8,236 1,837
Medical Doctors, Surgeons 331 20,453 7,076 478 47,453 14.226 440 46,509 15,003
Dentists 82 4,465 1,337 78 6,718 1,533 90 7,196 1,934
Lawyers and Notaries 158 7,187 2,211 199 14,051 3,512 200 15,142 4,042
Business Proprietors 5,062 88,537 8,953 4,546 81,428 11,767 4.680 80,900 11,893
Pensioners 5,411 85,536 5,481 8,966 148,937 15,501 11,150 185,555 20,391
All Other Occupations(2) 48,286 566,837 71,843 77,938 1,240,580 170,053 82,110 1,374,451 212,844
Total All Occupations 198,645 2,825,698 433,179 212,385 4,080,747 656,023 223,230 4,388,738 754,988
• • • • • • • •
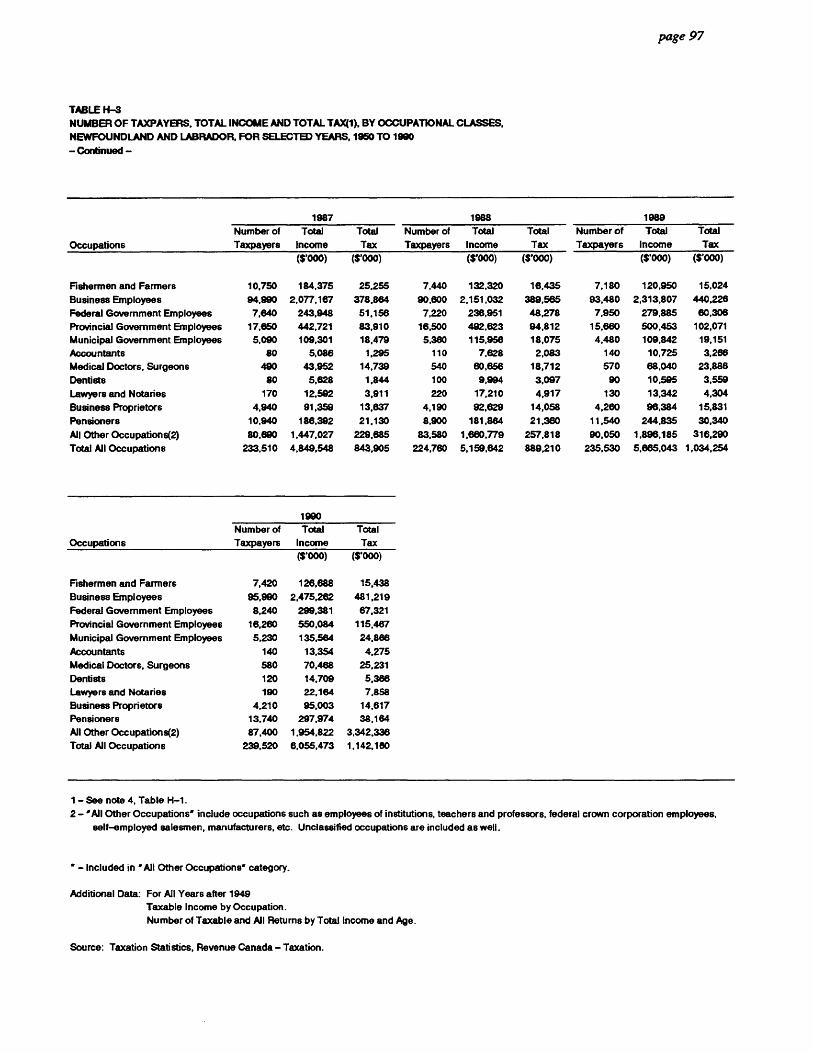
to •
III
III
411
III
ill
III
III • III 1111
III III
III
a e page 97
a • ID
TABLE H-3
NUMBER OF TAXPAYERS, TOTAL INCOME AND TOTAL TAX(1), BY OCCUPATIONAL CLASSES,
al NEWFOUNDLAND AND LABRADOR, FOR SELECTED YEARS, 1950 TO 1900
0 - Continued -
a Number
Occupations
1987 1988 1989
of
Taxpayers
Total
Income
Total
Tax
Number of
Taxpayers
Total
Income
Total
Tax
Number of
Taxpayers
Total Income
Total
Tax
Fishermen and Farmers
Business Employees
Provincial Government Employees Municipal Government Employees Accountants Medical Doctors, Surgeons
Dentists
Lawyers and Notaries
Business Proprietors
Pensioners
All Other Occupations(2) Total All Occupations
10,750
94,990
7,640
17,650
5,090 80
490
80
170
4,940
10,940
80,690 233,510
($.000)
184,375
2,077,167
243,948
442,721 109,301
5,086 43,952
5,628
12,592
91,359
188,392
1,447,027
4,849,548
($.000)
25,255
378,864
51,156
83,910
18,479 1,295
14,739
1,844
3,911
13,637
21,130
229,685
843,905
Federal Government
Employees
7,440
90,600 7,220
16,500 5,360
110
540
100
220
4,190
8,900
83,580
224,760
($.000)
132,320
2,151,032 238,951
492,623 115,956
7,628
80,656 9,994
17,210
92,629
181,864
1,660,779
5,159,642
($.000)
16,435
389,565 48,278
94,812
18,075
2,083 18,712
3,097
4,917
14,058
21,360
257,818
889,210
7,180
93,480 7,950
15,660 4,480
140
570
90 130
4,260
11,540
90,050
235,530
(vow)
120,950
2,313,807 279,885
500,453 109,842
10,725 68,040
10,595
13,342
96,384
244,835
1,896,185
5,865,043
4'000)
15,024
440,226 60,306
102,071 19,151
3,266 23,886
3,559
4,304
15,831
30,340
316,290
1,034,254
III Number
Occupations
1990 of
Taxpayers
Total
Income
Total
Tax
Fishermen and Farmers
Business Employees
Federal Government Employees
Provincial Government Employees
Municipal Government Employees
Accountants
Medical Doctors, Surgeons
Dentists Lawyers and Notaries
Business Proprietors Pensioners
All Other Occupations(2)
Total All Occupations
7,420
95,990
8,240
16,280
5,230
140
580 120
190
4,210 13,740
87,400
239,520
(r000)
126,688
2,475,262
299,381
550,084
135,564
13.354 70,468
14,709
22,164 95,003
297,974
1,954,822
6,055,473
($'000)
15.438
481,219
67,321
115,487
24,886
4,275 25,231
5,386
7,858
14,617 38,184
3,342,336 1,142,180
1 - See note 4, Table H-1.
1111 2 -'All Other Occupations" include occupations such as employees of institutions, teachers and professors, federal crown corporation employees,
self-employed salesmen, manufacturers, etc. Unclassified occupations are included as well.
III
III - _ Included in "All Other Occupations' category.
III Additional Data: For All Years after 1949
III Taxable Income by Occupation.
Number of Taxable and All Returns by Total Income and Age.
III Source: Taxation Statistics, Revenue Canada - Taxation.

page 98
TABLE H-4
TAXABLE CORPORATION INCOME. BY INDUSTRY
NEWFOUNDLAND AND LABRADOR
FOR SELECTED YEARS 1980 TO 1902
Industry 1960 1965 1970 1975 1980 1983 1984 1985 1986 1987 1988 1989 1990 1991 1992
($Millions)
Agriculture, forestry and fishing: 0.1 0.2 * 2.0 1.4 1.5 2.0 2.7 52 4.1 3.9 3.6 5.0
Agriculture - * 0.2 0.5 0.5 0.4 0.6 0.6 1.4
Forestry ' 0.1 0.4 0.6 0.5 0.7 0.8 1.6
Fishing and trapping - " a 1.1 0.3 0.6 0.7 1.3 22
Mining 1.9 7.3 0.6 0.9 16.7 48.1 104.6 121.9 62.6 46.3 100.6 67.1 33.1 12.0
Manufacturing: 16.0 16.0 10.1 47.5 115.9 43.7 60.5 74.6 73.5 92.3 69.6 58.3 57.1 53.0 57.6
Food 2.9 5.6 7.5 10.5 11.5 12.1 13.7 22.5 22.0
Beverages 1.2 0.9 1.4 2.7 9.3 6.0 • 2.1 5.1
Wood Industries 0.1 " a 0.3 0.3 0.4 0.6 0.4 *
Paper and Allied Industries 8.2 0.1 14.7 55.4 2.0 • 22.7 17.2 22.8
Printing, publishing and allied industries 0.2 0.4 2.2 2.6 3.6 4.5 5.5 52 2.1
Primary metals - 0.1 0.2 1.1 * 1.3 * " 1.1
Metal fabricating 0.2 0.5 1.4 1.2 0.4 0.7 0.7 • a
Machinery 0.4 0.5 0.6 0.6 0.7 ' 0.7 * 0.7
Electrical Products 0.4 0.4 3.6 1.4 1.4 1.7 2.4 3.6 4.2
Non-Metallic Mineral Products 0.4 " 0.2 0.7 0.8 2.1 1.4 1.8 2.9
Petroleum and Coal Products 0.4 0.2 10.6 28.8 3.8 8.4 15.5 11.0 22.0
Chemicals and Chemical Products 0.5 0.8 2.8 7.2 6.5 7.7 4.7 3.8 4.0
Other 0.1 0.6 2.3 3.4 3.4 15.6 6.7 5.9 5.4
Construction(2) 3.5 4.4 5.7 11.5 11.7 16.9 13.7 13.2 14.8 18.0 30.3 30.6 32.2 28.8 29.2
Transportation, Communication and Other Utiliti 13.0 22.0 23.7 • 48.6 76.3 99.6 98.7 99.5 104.0 91.6 155.9 87.6 81.8 124.1
Transportation .. 15.3 ' 2.7 3.4 a 28.6 30.0 32.1 36.3
Communication .. 1.3 2.0 a 15.7 30.1 35.6 38.0 33.9 40.8
Public Utilities 2.5 5.3 7.9 4.5 29.3 40.7 34.9 32.4 33.3 26.6
Other (Storage) - * * 0.2 ' 0.6 0.4 0.1 0.3 ..
Trade: 7.8 12.8 13.4 40.3 51.3 52.8 50.5 51.1 55.9 72.0 54.7 60.3 57.8 50.9 36.4
Wholesale .. 6.8 8.7 21.5 24.9 24.4 23.7 23.1 27.6 35.8 22.0 27.2 27.2 25.8 17.0
Retail 8.0 6.7 18.8 26.4 28.4 26.8 28.0 29.8 36.2 32.7 33.1 30.6 25.1 19.4
Finance(2) 5.3 5.5 20.0 39.3 20.3 25.9 37.9 38.2 40.3 47.0 39.6 82.0 70.0 56.3 38.2
Services: 0.5 2.0 2.8 8.0 14.1 18.9 17.1 18.9 16.8 19.2 22.5 19.8 21.1 19.4 18.1
Services to business management 1.2 0.9 3.4 5.9 6.5 6.6 8.0 5.9 6.1
Government, personal and miscellaneous sery 0.9 1.9 4.6 8.2 12.4 10.5 10.9 10.8 13.2 ..
Other Non-Financial .. 14.7 17.1 14.0 13.5 10.5
Total - All Industries 48.1 70.0 76.5 156.6 280.6 283.9 385.4 418.7 367.5 404.1 427.6 498.9 376.4 320.6 315.2
1 - Agriculture, forestry and fishing are included with mining.
2 - Prior to 1988 Real Estate was included under Finance. For 1988 to 1992, Real Estate is included under Construction.
• - Restricted
Source: Taxation Statistics, Department of National Revenue. 1957 to 1964;
Statistics Canada, Corportation Taxation Statistics, 1965 to 1989;
Statistics Canada, Financial and Taxation Statistics for Enterprises, 1990 to 1992.

1111
1111
•011
1011
OO
MO
OM
SO
SSM
OO
O
SO
SO
SO
OS
00
011
9
SECTION I
PRICE INDEXES

•
0011000
11M
OS
OO
SO
SIO
SO
MO
SS
IM
PO
SO
OM
O
page 99
SECTION 7'
TABLE 1-1
Consumer Price Index
The Consumer Price Index measures the percentage change through time in the cost of purchasing a constant "basket" of goods and services representing the purchases by a particular population group in a specified time period. The "basket" is an unchanging or equivalent quantity and quality of goods and services, consisting of items for which there are continually measurable market prices over time.
TABLE 1-2
Family
The family or spending unit is defined as a group of persons dependent on a common or pooled income for the major items of expense and living in the same dwelling or one financially independent individual living alone. Never married sons or daughters living with their parents are considered as part of their parents spending unit. In the great majority of cases members of spending units with two or more persons are related by blood, marriage or adoption, and are thus consistent with the "economic family" definition employed in surveys of consumer finance.
TABLE 1-3
House 1
This is a basic detached wood-frame bungalow with clapboard, metal or patent siding (rarely brick) five to eight years old with 3 bedrooms, 1 1/2 bathrooms, fireplace and one car garage in full basement but no recreation room or appliances. The total area of the house using outside dimensions but not including the garage is 1,200 square feet and the house is situated on a fully serviced 5,500 square foot lot. The house is typical of others in the neighbourhood. The neighbourhood itself is average and within average commuting distance of the city centre.
0110
1011
011
0S
OM
OO
SO
OM
OO
MO
011
110
91 1
91 1
00
.11
0911
11
page 100
House 2
This is a detached 2 storey wood-frame house with stone or brick veneer, front, patent siding elsewhere, five to eight years old with 4 bedrooms, 2 1/2 bathrooms, main floor family room, 1 fireplace, 2 car attached garage and full basement but no recreational room and no appliances. The total area of the house using outside dimensions but not including the garage is 2,000 square feet and the house is situated on a fully serviced 7,500 square foot lot. The house is typical of others in the community. The location is prime residential and is within average commuting distance of the city centre.
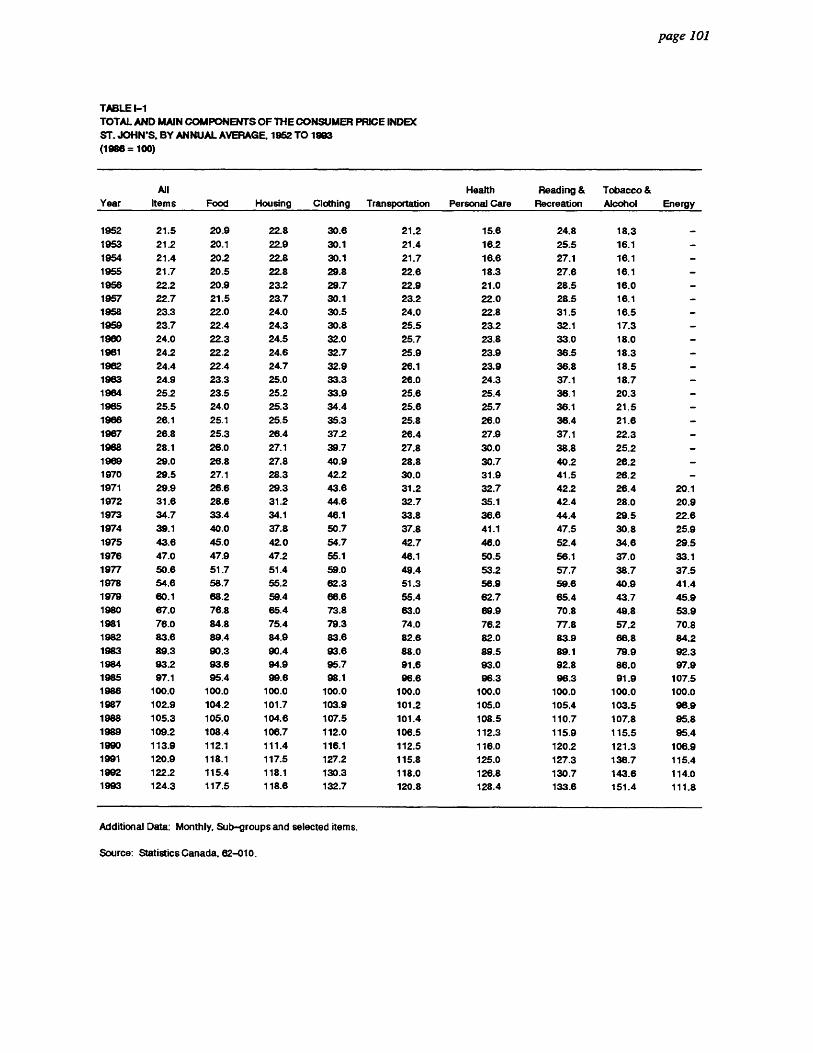
•
page 101
• • TABLE I-1
TOTAL AND MAIN COMPONENTS OF THE CONSUMER PRICE INDEX
• ST. JOHN'S. BY ANNUAL AVERAGE, 1952 TO 1993
• (1986 =100)
All Health Reading & Tobacco &
Year Items Food Housing Clothing Transportation Personal Care Recreation Alcohol Energy
1952 21.5 20.9 22.8 30.6 21.2 15.6 24.8 18.3
1953 21.2 20.1 22.9 30.1 21.4 16.2 25.5 16.1
1954 21.4 20.2 22.8 30.1 21.7 16.6 27.1 16.1
1955 21.7 20.5 22.8 29.8 22.6 18.3 27.6 16.1
1956 22.2 20.9 23.2 ill
29.7 22.9 21.0 28.5 16.0
1957 22.7 21.5 23.7 30.1 23.2 22.0 28.5 16.1
1958 23.3 22.0 24.0 30.5 24.0 22.8 31.5 16.5
1959 23.7 22.4 24.3 30.8 25.5 23.2 32.1 17.3
1960 24.0 22.3 24.5 32.0 25.7 23.8 33.0 18.0
1961 24.2 22.2 24.6 32.7 25.9 23.9 36.5 18.3
1962 24.4 22.4 24.7 32.9 26.1 23.9 36.8 18.5
1963 24.9 23.3 25.0 33.3 26.0 24.3 37.1 18.7
1964 25.2 23.5 25.2 33.9 25.6 25.4 36.1 20.3 1965 25.5 24.0 25.3 34.4 25.6 25.7 36.1 21.5
1966 26.1 25.1 25.5 35.3 25.8 26.0 36.4 21.6
1967 26.8 25.3 26.4 37.2 26.4 27.9 37.1 22.3 1968 28.1 26.0 27.1 39.7 27.8 30.0 38.8 25.2
1969 29.0 26.8 27.8 40.9 28.8 30.7 40.2 26.2 1970 29.5 27.1 28.3 42.2 30.0 31.9 41.5 26.2 - 1971 29.9 26.6 29.3 43.6 31.2 32.7 42.2 26.4 20.1 1972 31.6 28.6 31.2 44.6 32.7 35.1 42.4 28.0 20.9 1973 34.7 33.4 34.1 46.1 33.8 36.6 44.4 29.5 22.6
1974 39.1 40.0 37.8 50.7 37.8 41.1 47.5 30.8 25.9
1975 43.6 45.0 42.0 54.7 42.7 46.0 52.4 34.6 29.5
1976 47.0 47.9 47.2 55.1 46.1 50.5 56.1 37.0 33.1
1977 50.6 51.7 51.4 59.0 48.4 53.2 57.7 38.7 37.5 1978 54.6 58.7 55.2 62.3 51.3 56.9 59.6 40.9 41.4
1979 60.1 68.2 59.4 66.6 55.4 62.7 65.4 43.7 45.9 1980 67.0 76.8 65.4 73.8 63.0 69.9 70.8 49.8 53.9
1981 76.0 84.8 75.4 79.3 74.0 76.2 77.8 57.2 70.8 1982 83.6 89.4 84.9 83.6 82.6 82.0 83.9 66.8 84.2 1983 89.3 90.3 90.4 93.6 88.0 89.5 89.1 79.9 92.3 1984 932 93.6 94.9 95.7 91.6 93.0 92.8 86.0 97.9 1985 97.1 95.4 99.6 98.1 96.6 96.3 96.3 91.9 107.5 1986
1987
100.0
102.9
100.0
104.2
100.0
101.7
100.0
103.9
100.0
101.2
100.0
105.0
100.0
105.4
100.0
103.5
100.0
96.9 1988 105.3 105.0 104.6 107.5 101.4 108.5 110.7 107.8 95.8
1989 109.2 108.4 106.7 112.0 106.5 112.3 115.9 115.5 95.4
1990 113.9 112.1 111.4 116.1 112.5 116.0 120.2 121.3 106.9 1991 120.9 118.1 117.5 127.2 115.8 125.0 127.3 136.7 115.4 1992 122.2 115.4 118.1 130.3 118.0 126.8 130.7 143.6 114.0 1993 124.3 117.5 118.6 132.7 120.8 128.4 133.6 151.4 111.8
• Additional Data: Monthly, Sub-groups and selected items.
• Source: Statistics Canada, 62-010.
•
•
•
•
•
•
5 • 110 III fra
5 III II 411 0 411 111111 is III 0
III III II IIIIII III II III 1111
•
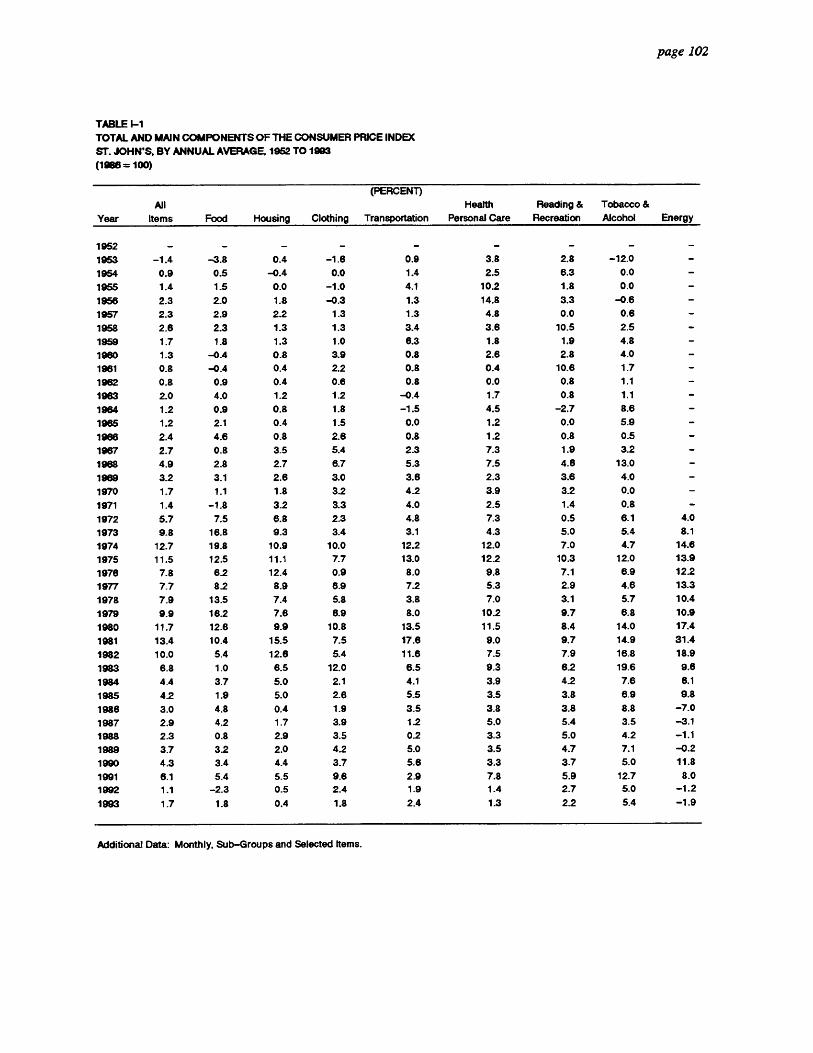
page 102
TABLE I-1 TOTAL AND MAIN COMPONENTS OF THE CONSUMER PRICE INDEX ST. JOHN'S. BY ANNUAL AVERAGE, 1952 TO 1993 (19136 = 100)
(PERCENT)
All Health Reading & Tobacco &
Year Items Food Housing Clothing Transportation Personal Care Recreation Alcohol Energy
1952 - - - - - - - -
1953 -1.4 -3.8 0.4 -1.6 0.9 3.8 2.8 -12.0
1954 0.9 0.5 -0.4 0.0 1.4 2.5 6.3 0.0 -
1955 1.4 15 0.0 -1.0 4.1 10.2 1.8 0.0
1956 2.3 2.0 1.8 -0.3 1.3 14.8 3.3 -0.6 -
1957 2.3 2.9 2.2 1.3 1.3 4.8 0.0 0.6 -
1958 2.6 2.3 1.3 1.3 3.4 3.6 10.5 2.5
1959 1.7 1.8 1.3 1.0 6.3 1.8 1.9 4.8
1960 1.3 -OA 0.8 3.9 0.8 2.6 2.8 4.0 -
1961 0.8 -0.4 0.4 2.2 0.8 0.4 10.6 1.7 -
1962 0.8 0.9 0.4 0.6 0.8 0.0 0.8 1.1 -
1963 2.0 4.0 1.2 1.2 -0.4 1.7 0.8 1.1
1964 1.2 0.9 0.8 1.8 -1.5 4.5 -2.7 8.6
19e5 1.2 2.1 0.4 1.5 0.0 1.2 0.0 5.9 -
1966 2.4 4.6 0.8 2.6 0.8 1.2 0.8 0.5
1967 2.7 0.8 3.5 5.4 2.3 7.3 1.9 3.2 -
1968 4.9 2.8 2.7 6.7 5.3 7.5 4.6 13.0
1969 3.2 3.1 2.6 3.0 3.6 2.3 3.6 4.0 -
1970 1.7 1.1 1.8 3.2 4.2 3.9 3.2 0.0 -
1971 1.4 -1.8 3.2 3.3 4.0 2.5 1.4 0.8 -
1972 5.7 7.5 6.8 2.3 4.8 7.3 0.5 6.1 4.0
1973 9.8 16.8 9.3 3.4 3.1 4.3 5.0 5.4 8.1
1974 12.7 19.8 10.9 10.0 12.2 12.0 7.0 4.7 14.6
1975 11.5 12.5 11.1 7.7 13.0 12.2 10.3 12.0 13.9
1976 7.8 6.2 12.4 0.9 8.0 9.8 7.1 6.9 12.2
1977 7.7 8.2 8.9 8.9 7.2 5.3 2.9 4.6 13.3
1978 7.9 13.5 7.4 5.8 3.8 7.0 3.1 5.7 10.4
1979 9.9 16.2 7.6 6.9 8.0 10.2 9.7 6.8 10.9
1980 11.7 12.6 9.9 10.8 13.5 11.5 8.4 14.0 17.4
1981 13.4 10.4 15.5 7.5 17.6 9.0 9.7 14.9 31.4
1982 10.0 5.4 12.6 5.4 11.6 7.5 7.9 16.8 18.9
1983 8.8 1.0 8.5 12.0 6.5 9.3 62 19.6 9.6
1984 4.4 3.7 5.0 2.1 4.1 3.9 4.2 7.6 6.1
1985 4.2 1.9 5.0 2.6 5.5 3.5 3.8 6.9 9.8
1986 3.0 4.8 0.4 1.9 3.5 3.8 3.8 8.8 -7.0
1987 2.9 4.2 1.7 3.9 1.2 5.0 5.4 3.5 -3.1
1988 2.3 0.8 2.9 3.5 0.2 3.3 5.0 4.2 -1.1
1989 3.7 3.2 2.0 4.2 5.0 3.5 4.7 7.1 -0.2
1990 4.3 3.4 4.4 3.7 5.8 3.3 3.7 5.0 11.8
1991 6.1 5.4 5.5 9.6 2.9 7.8 5.9 12.7 8.0
1992 1.1 -2.3 0.5 2.4 1.9 1.4 2.7 5.0 -1.2
1993 1.7 1.8 0.4 1.8 2.4 1.3 2.2 5.4 -1.9
Additional Data: Monthly. Sub-Groups and Selected Items.

00
00
01
10
60
00
00
00
11
00
1100
01
10
0000110001100O
OM
OO
O
page 103
TABLE 1-2 URBAN FAMILY EXPENDITURE, ST. JOHN'S FOR SELECTED YEARS 1969 - 1992
All Families and Unattached individuals
1969 1972 1974 1976 1978 1982 1984 1986 1990 1992
Number of Households in Sample 311 205 355 286 265 281 242 292 286 278
Average
Household Size 3.46 3.71 3.49 3.65 3.35 3.37 3.16 3.25 3.06 2.88
No. of Children under 5 0.44 0.44 0.38 0.32 0.34 0.26 0.24 0.18 0.22 0.18
No. of Children 5-15 0.87 0.96 0.78 0.84 0.76 0.73 0.60 0.66 0.48 0.48
No. of Adults 18-17 0.11 0.18 0.13 0.15 0.12 0.13 0.09 0.12 0.11 0.07
No. of Adults 18-64 1.92 1.96 2.05 2.08 1.96 2.00 1.97 2.06 1.96 1.93
No. of Adults 65 and Over 0.18 0.23 0.21 0.34 0.23 0.24 0.25 0.23 0.28 0.23
No. of Full-time Earners 0.90 0.95 1.03 0.92 0.78 0.92 0.81 0.96 0.90 0.83
Age of Head 42.7 45.4 43.7 48.6 45.1 43.8 45.0 43.0 47.0 45.00
Net Income before taxes 6,843.4 9,367.8 14,810.5 17,889.7 18,257.5 29,972.8 31,933.0 35,108.0 45,301.0 47,217.0
Other money receipts 156.6 117.5 224.9 487.2 577.2 423.5 700.0 256.0 1,151.0 637.0
Net change in assets & liabilities 292.0 95.6 571.3 1,158.1 974.8 1,7062 1,129.0 1,006.0 1,509.0 2,314.0
Percentage
Home Owners 62.3 66.3 70.2 71.6 67.9 65.8 64.9 89.8
Car or truck owners 63.9 78.2 79.6 73.6 80.6 79.0 82.7 80.2 80.4
With Head Canadian-born 98.2 96.8 95.5 ..
With Wife employed full-time 11.5 18.1 16.2 19.9 16.4 20.8 24.4 26.1
Average Dollar Expenditure(1)
Food 1,459.8 1,854.6 2,454.7 2,933.3 3,348.4 4,895.8 4,935.0 5,319.0 6,199.0 6,085.0
Shelter 984.3 1,480.7 2,229.3 2,554.0 2,799.0 4,545.9 5,173.0 5,966.0 6,883.0 7,344.0
Rented living quarters 354.8 408.0 495.0 446.7 519.2 881.3 1,139.0 1,584.0 1,764.0 1,567.0
Owned living quarters 302.1 594.2 1,092.9 1,238.3 1,291.2 2,092.1 2,118.0 2,367.0 2,972.0 3,065.0
Other housing 37.9 60.4 97.8 92.7 93.3 199.1 295.0 242.0 323.0 531.0
Water, Fuel and Electricity 289.7 418.0 543.5 776.2 895.3 1,373.5 1,621.0 1,774.0 1,824.0 2,181.0
Household Operation 285.0 334.7 500.7 665.6 797.7 1 .407.7 1,496.0 1,553.0 1,999.0 1,986.0
Furnishings and Equipment 249.2 341.9 606.2 691.0 741.1 972.5 1,050.0 1241.0 1,565.0 1,315.0
Furniture .. .. 180.4 266.8 502.6 536.0 414.0 835.0 456.0
Household appliances 65.9 83.1 160.4 177.5 169.2 427.7 (1) 465.0 331.0 295.0 237.0
Other 183.3 278.9 445.8 333.1 305.1 42.3 (2) 48.0 73.0 40.0 52.0
Clothing 873.4 819.1 1,018.3 1221.9 1,238.3 1,944.9 2,180.0 2,485.0 2,784.0 2,452.0
Personal Care 152.1 170.1 213.4 249.7 285.6 580.3 683.0 778.0 941.0 926.0
Medical and Health Care 123.6 136.5 175.1 218.8 229.2 452.4 574.0 582.0 805.0 842.0
Smoking and Alcoholic Beverages 335.7 427.6 639.7 882.3 731.8 1,308.6 1,225.0 1,368.0 1,722.0 1,748.0
Travel and Transportation 780.1 1,357.5 2,095.3 2,213.2 2,217.5 3,749.4 4,191.0 4,122.0 5,598.0 5,415.0
Automobile (and truck) 623.6 1,136.9 1,777.6 1,800.2 1,988.7 3,395.7 (3) 3,792.0 3,728.0 4,947.0 4.791.0
Purchase 259.7 839.0 943.0 784.9 894.7 .. 2,174.0 1,888.0
Operation 363.9 498.0 834.6 1,015.3 1,094.0 .. .. 2,674.0 2,782.0
Other 156.4 220.6 317.7 413.1 228.9 353.7 (4) 398.0 394.0 650.0 624.0
Recreation 197.3 323.8 449.0 515.0 759.8 1,078.7 1,193.0 1,398.0 1,773.0 2,158.0 Reading 40.6 47.6 95.1 93.2 98.3 170.4 192.0 186.0 249.0 256.0
Education 100.8 85.3 139.0 125.3 126.8 270.6 319.0 488.0 461.0 924.0
Miscellaneous Expenses 89.6 163.4 301.6 332.6 369.2 822.1 768.0 831.0 1,215.0 1,262.0
Total Current Consumption 5,471.5 7,976.9 10,918.2 12,555.9 13.740.7 22,199.5 23,978.0 26,296.0 32,174.0 32,710.0 Personal taxes 829.7 1,592.6 2,572.1 3,096.0 2,823.6 4,898.4 5,530.0 5,872.0 9,256.0 9,610.0
Security 285.7 616.9 649.0 899.7 727.7 1,387.2 1,589.0 1,753.0 2,255.0 2,500.0
Gifts and Contributions 207.8 253.6 319.5 412.4 545.5 771.5 969.0 749.0 1,294.0 1.017.0
Total Expenditure 6,794.7 10,440.0 14,458.8 16,964.0 17,837.4 29,256.6 32,067.0 34,671.0 44,979.0 45,836.0
I

OSO
MO
SS
OO
SO
OS
SO
OS
OS
OOM
MO
SO
SO
OM
00
01
10
page 104
TABLE 1-2 URBAN FAMILY EXPENDITURE, ST. JOHN'S FOR SELECTED YEARS 1969 - 1992 - CONTINUED -
All Families and Unattached Individuals
1969 1972 1974 1976 1978 1982 1984 1986 1990 1992
Percentage Distribution
Food 21.5 19.8 17.0 17.6 18.8 16.7 15.4 15.3 13.8 13.3
Shelter 14.5 15.8 15.4 15.1 15.7 15.5 16.1 17.2 15.3 16.0
Rented living quarters 5.2 4.4 3.4 2.6 2.9 3.0 3.6 4.6 3.9 3.4
Owned living quarters 4.4 6.3 7.6 7.3 7.2 7.2 6.6 6.8 6.6 6.7
Other Housing 0.6 0.6 0.7 0.5 0.5 0.7 0.9 0.7 0.7 12
Water, Fuel and Electricity 4.3 4.5 3.8 4.6 5.0 4.7 5.1 5.1 4.1 4.8
Household Operation 4.2 3.6 3.5 3.9 4.5 4.8 4.7 4.5 4.4 4.3
Furnishings and Equipment 3.7 3.7 4.2 4.1 4.2 3.3 3.3 3.6 3.5 2.9
Furniture .. .. .. 1.1 1.5 1.7 1.7 1.8 1.4 1.0
Household appliances 1.0 0.7 1.1 1.0 0.9 1.5 (2) 1.5 1.7 0.7 1.0
Other 2.7 3.0 3.1 2.0 1.7 0.1 (3) 0.2 0.1 0.1 0.1
Clothing 9.9 8.7 7.0 7.2 6.9 6.6 6.8 7.1 6.1 5.3
Personal Care 22 1.8 1.5 1.5 1.6 2.0 2.1 2.2 2.1 2.0
Medical and Health Care 1.8 1.5 1.2 1.3 1.3 1.5 1.8 1.7 1.8 1.8
Smoking and Alcoholic Beverages 4.9 4.6 4.4 4.0 4.1 4.5 3.8 3.9 3.8 3.8
Travel and Transportation 11.5 14.5 14.5 13.0 12.4 12.8 13.1 11.9 12.4 11.8
Automobile (and truck) 9.2 12.1 12.3 10.6 11.1 11.6 (4) 11.8 10.8 11.0 10.5
Purchase 3.8 sit 6.5 4.6 5.0 4.8 4.1
Operation 5.4 5.3 5.8 6.0 6.1 5.9 6.1
Other 2.3 2.4 2.2 2.4 1.3 1.2 (5) 1.2 1.1 1.4 1.4
Recreation 2.9 3.5 3.1 3.0 4.3 3.7 3.7 4.0 3.9 4.7
Reading 0.6 0.5 0.7 0.5 0.6 0.6 0.6 0.5 0.6 0.6
Education 1.5 0.9 1.0 0.7 0.7 0.9 1.0 1.4 1.0 2.0
Miscellaneous Expenses 1.3 1.7 2.1 2.0 2.1 2.8 2.4 2.4 2.7 2.8
Total Current Consumption 80.5 80.5 75.5 74.0 77.0 75.9 74.8 75.8 70.4 71.4
Personal taxes 12.2 12.6 17.8 18.3 15.8 16.7 17.2 16.9 22.5 21.0
Security 4.2 4.6 4.5 5.3 4.1 4.7 5.0 5.1 5.0 5.5
Gifts and Contributions 3.1 2.2 2.2 2.4 3.1 2.6 3.0 2.2 2.9 2.2
Total Expenditure 100.0 100.0 100.0 100.0 100.0 100.0 100.0 100.0 100.0 100.0
1 - Average dollar expenditure is based on all households, whether or not if they all actually purchased a particular good or service. The average
expenditure for a commodity calculated by summing the amount of dollars spent and dividing it by the number of households in the region.
2 - Household Equipment
3 - Services
4 - Private Transportation
5 - Public Transportation
Additional Data: Summary and detailed Average Family Expenditures, All Families and unattached individuals, family type, family income.
Source: Statistics Canada, 62-555

IIIIIP
OS
SO
SS
OS
SO
MO
OS
IPS
OO
OS
OM
OO
OO
OO
SO
SI
SS
OO
page 105 TABLE I-3
SURVEY OF HOUSE(1) PRICES, ST. JOHN'S, APRIL 1974 TO APRIL 1994
Date
HOUSE 1(2)
St. John's East End West End Mount Pearl
1974 April 45,000 - - - August 44,000 - - - December 44,000 - - -
1975 April 45,000 - - - August 46,000 - - - December 45,500 - - -
1976 April 45,000 - - - August 44,500 - - - December 43,800 - -
1977 June 44,500 - - October 45,800 - - -
1978 February 46,200 - - - June 47,600 - - - October 49,400 - - -
1979 February 49,500 - - - June 52,750 - - - October 55,300 - - -
1980 February 59,800 - - June 63,500 - - - October 65,500 - -
1981 February 68250 - - - June 73,000 - - - October - 72,500 70,000 68,000
1982 February - 69,500 69,000 86,800 April - 72,500 64,500 62,000 July - 69,500 83,500 60,000 October - 89,500 63,500 60,000
1983 January - 70,500 65,500 65,500 April - 72,500 66,000 65,500 July 73,500 68,500 67,500 October 75,000 70,000 67,500
1984 January - 76,500 70,000 67,500 July - 79,500 75,500 76,500 October - 79,500 76,500 76,500
1985 February - 80,500 77,800 77,300 April - 83,500 80,500 79,500 July - 87,500 86,500 85,500 October - 92,000 86,500 87,000
1986 January - 92,000 86,500 87,000 April - 92,900 89,200 87,300 July - 91,000 87,500 86,800 October - 91,800 88,300 87,000
1987 January - 90,900 88,200 86,400 April - 89,500 87.800 86,100 July - 92,800 89,200 88,500 October - 92,500 88,500 87,600
1988 January - 92,400 88,200 85,200 April - 91,000 88,100 84.800 July - 93,500 91,500 89,500 October 95,300 92,900 90,600
1989 January - 98,500 97,500 96.500 April - 102,600 99,900 98,300 July - 103,500 99,900 98,300 October - 102,700 98,900 96.700
1990 January - 101,300 97,400 95.600 April - 101,200 97,400 95,600 July - 102,700 97,500 96,000 October - 103,400 98,100 96,200
1991 January - 103,300 98,100 95,400 April - 101,500 97,300 94,500 July - 102,200 98,000 95,300 October - 108,000 102,900 99,100
1992 January - 106,600 102.000 98,500 April - 106,600 102,000 98,000 July - 106,200 101,100 97,600 October - 106,000 101,000 96,500
1993 January 105,900 99,900 95,200 April - 104,700 98,800 94,700 July - 104,000 97,000 93,800 October - 102,300 97,000 91,800
1994 January - 101,200 96,600 90,500 April - 101,500 96,500 90,800
1 - See Definition Section 2 - Prices for HOUSE 2 are also available from August 1974 to April 1994.
Additional Data: For Other Housing Types. Source: Royal Trust Survey of House Prices.

• • • • • • • • • •
• • • • • • • •
• • • • • • • •
• • • • • • • • • • • • •
SECTION J
AGRICULTURE
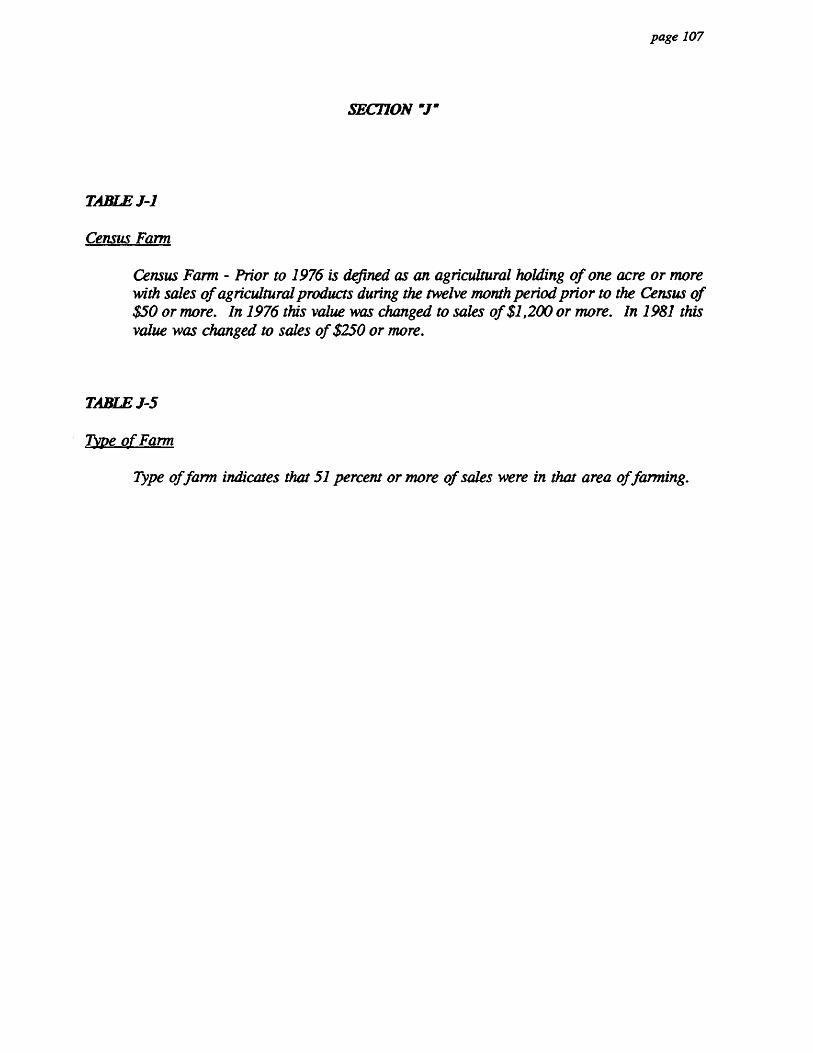
•
• page 107 • • • SECTION ".1-
• • • • TABLE J-1
Census Farm • • Census Farm - Prior to 1976 is defined as an agricultural holding of one acre or more
with sales of agricultural products during the twelve month period prior to the Census of $50 or more. In 1976 this value was changed to sales of $1,200 or more. In 1981 this value was changed to sales of $250 or more. • •
• TABLE J-5
• 7ype of Farm • Type of farm indicates that 51 percent or more of sales were in that area of farming.
• •
•
• • •
• • •
•
•
•
• • • • •

0011
8•1
101
10011
111 1
08010
OO
MO
SS
OO
MO
SO
SO
OS
OS
IIS
O
page 109
TABLE J-1 SELECTED STATISTICS OF CENSUS FARMS(1) NEWFOUNDLAND AND LABRADOR FOR CENSUS YEARS 1951 - 1991
Item Unit 1951 1981 1986 1971 1976 1981 1986 1991
Population
Total Population Number 361,416 457,853 493,396 522,104 557,725 567,681 568,349 568,475
Farms
Total Number of Farms Number 407 464 437 402 275 384 415 525
Non-Resident Farms Number 22 27 37 70 31 62 72 131
Areas
Total Land Area Acres 91,833,600 91,833,600 91,833,600 91,833,600 91,833,600 91,833,600 91,833,600 91,833,600
Area in Farms Acres 24,192 27,973 30,752 52,274 23,880 72,094 57,279 109,201
Percent of Total Land Area Percent 0.026 0.030 0.033 0.057 0.026 0.079 0.062 0.119
Use of Farm Land
Improved Land Acres 8,814 11,492 12,144 15,104 11,802 21,845 20,966 25,122 (3)
Under Crops (2) Acres 5,518 6,982 7,103 6,683 7,322 10,057 10,082 14,245
Pasture Acres 2,344 2,248 3,652 6,645 2,984 8,683 6,524 10,557
Summer Fallow Acres - 81 196 410 289 807 851 320
Other Improved Land Acres 952 2,181 1,193 1,366 488 930 3,509
Unimproved Land Acres 15,378 18,481 18,608 37,170 12,078 50,250 38,313 84,079 (3)
Wood Land Acres 10,492 9,757 8,534 8,191 6,621 12,962 7,815
Other Unimproved Land Acres 4,886 6,724 10,074 28,979 2,208 15,090 16,907
Capital
Total Capital Value Dollars 12,822,500 17,615,400 24,049,900 46,154,696 94,429,040 90,907,724 158,005,498
Value of Land and Buildings Dollars 9,618,500 13,276,400 17,746.500 37,810,150 76,967,755 65,750,826 117,634,531
Value of Machinery and Equipment Dollars 1,978,600 2,287,300 3,179,100 4,613,927 10,066,607 13,080,936 25,661,956
Value of Livestock and Poultry Dollars 1,225,400 2,051,700 3,122,730 3,730,619 8,394,678 12,075,962 14,709,011
1 - For the years 1951 to 1971 the data are for census farms with sales of $1,200 or more. For the years 1976, 1981, 1986 and 1991 the data are for
census farms with sales of $2,500 or more.
2 - Included Field, Vegetable, Fruit and Nursery Crop Land.
3 - In 1991 the questions concerning land use were changed, the question on 'Other Improved Land" was not asked, and the detail for 'Unimproved Land'
changed to 'unimproved pasture' 33,023 acres and 'other land' 51.058 acres.
Additional Data: Available by Census Division and Sub-Division.
Source: Census of Agriculture.
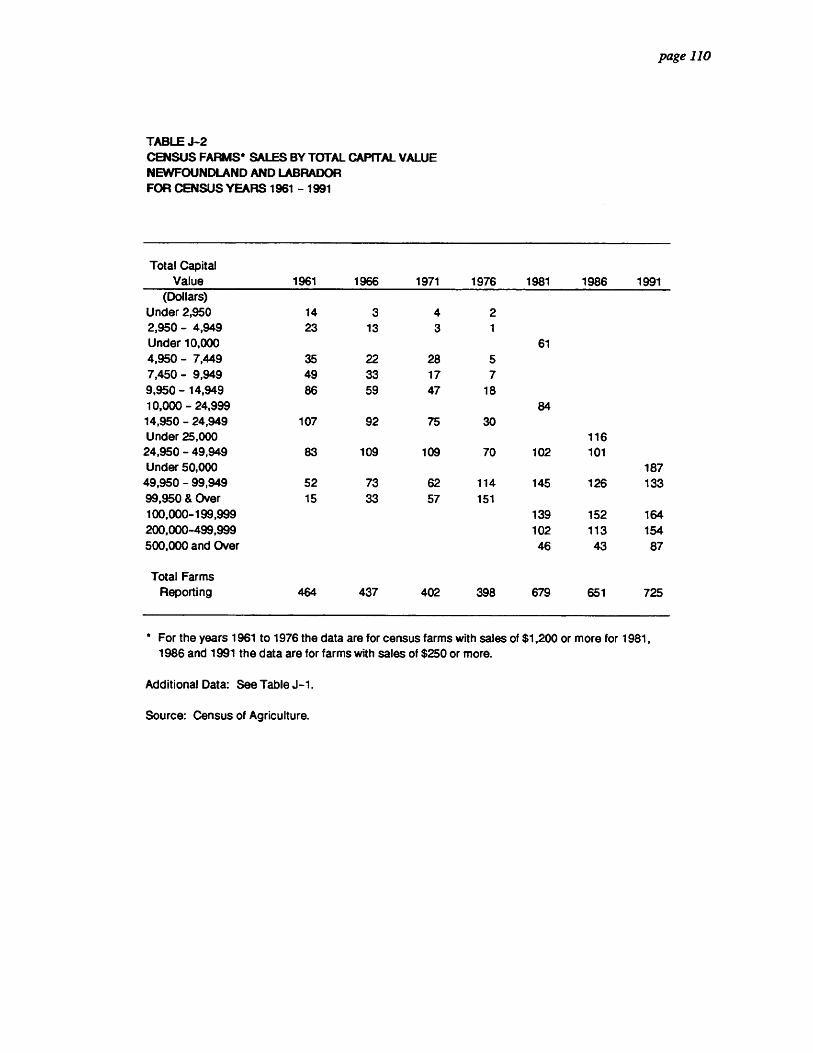
page 110
TABLE J-2 CENSUS FARMS* SALES BY TOTAL CAPITAL VALUE NEWFOUNDLAND AND LABRADOR FOR CENSUS YEARS 1961 - 1991
Total Capital Value 1961 1966 1971 1976 1981 1986 1991
(Dollars) Under 2,950 14 3 4 2 2,950 - 4,949 23 13 3 1 Under 10,000 61 4,950 - 7,449 35 22 28 5 7,450 - 9,949 49 33 17 7 9,950 - 14,949 86 59 47 18 10,000 - 24,999 84 14,950 - 24,949 107 92 75 30 Under 25,000 116 24,950 - 49,949 83 109 109 70 102 101 Under 50,000 187 49,950 - 99,949 52 73 62 114 145 126 133 99,950 & Over 15 33 57 151 100,000-199,999 139 152 164 200,000-499,999 102 113 154 500,000 and Over 46 43 87
Total Farms Reporting 464 437 402 398 679 651 725
• For the years 1961 to 1976 the data are for census farms with sales of $1,200 or more for 1981, 1986 and 1991 the data are for farms with sales of $250 or more.
Additional Data: See Table J-1.
Source: Census of Agriculture.
•
0 S S S •
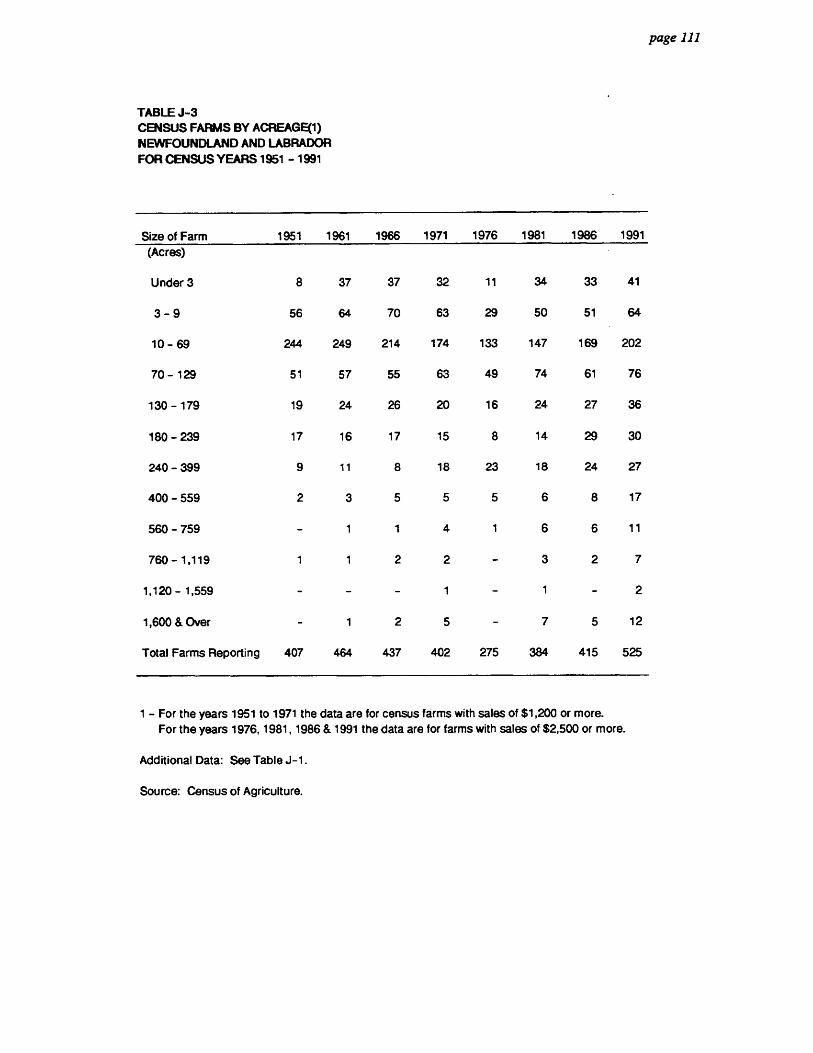
SO
OS
SO
SS
OO
SO
I DO
OM
OS
SO
OS
OM
OIP
OO
SO
OM
OS
OS
O
page 111
TABLE J-3 CENSUS FARMS BY ACREAGE(1) NEWFOUNDLAND AND LABRADOR FOR CENSUS YEARS 1951 - 1991
Size of Farm 1951 1961 1966 1971 1976 1981 1986 1991
(Acres)
Under 3 8 37 37 32 11 34 33 41
3 - 9 56 64 70 63 29 50 51 64
10 - 69 244 249 214 174 133 147 169 202
70 - 129 51 57 55 63 49 74 61 76
130 - 179 19 24 26 20 16 24 27 36
180 - 239 17 16 17 15 8 14 29 30
240 - 399 9 11 8 18 23 18 24 27
400 - 559 2 3 5 5 5 6 8 17
560 - 759 - 1 1 4 1 6 6 11
760 - 1,119 1 1 2 2 - 3 2 7
1,120 - 1,559 - - - 1 - 1 - 2
1,600 & Over - 1 2 5 - 7 5 12
Total Farms Reporting 407 464 437 402 275 384 415 525
1 - For the years 1951 to 1971 the data are for census farms with sales of $1,200 or more.
For the years 1976, 1981, 1986 & 1991 the data are for farms with sales of $2,500 or more.
Additional Data: See Table J-1.
Source: Census of Agriculture.

MO
SII
SS
OO
OS
SII
SO
SS
OS
OO
SO
SII
SS
OO
MM
IP
OO
SS
01
1
page 112
TABLE J-4 LIVESTOCK AND POULTRY ON CENSUS FARMS(1),
NEWFOUNDLAND AND LABRADOR FOR CENSUS YEARS 1951 - 1991
1951 1961 1966 1971 1976 1981 1986 1991 (N u mber)
Livestock
Cattle 3,376 4,207 5,356 5,126 4,593 5,831 6,917 8,179
Hogs 1,081 1,361 6,777 14,014 15,204 18,980 16,170 15,559
Sheep 2,757 4,054 3,491 3,025 2,551 4,152 6,863 (2) 6,791
Poultry
Hens & Chicken 35,993 204,413 407,111 804,747 908,358 930,834 1,284,942 1,294,999
Turkeys 1,502 2,452 3,100 2,250 1,723 8,765 (2) 4,915 (2)
Ducks 267 236 259 267 590 900
Geese 73 344 893 1,917 142 435 .
Other 1,683 (2) 636 (2)
1 - For the years 1951 to 1971 data are for census farms with sales of $1,200 or more. For the years 1976
to 1991 the data are for census farms with sales of $2,500 or more.
2 - Data is for all census farms. (See note for Table J-1 at beginning of Section).
Additional Data: See Table J-1.
Source: Census of Agriculture.
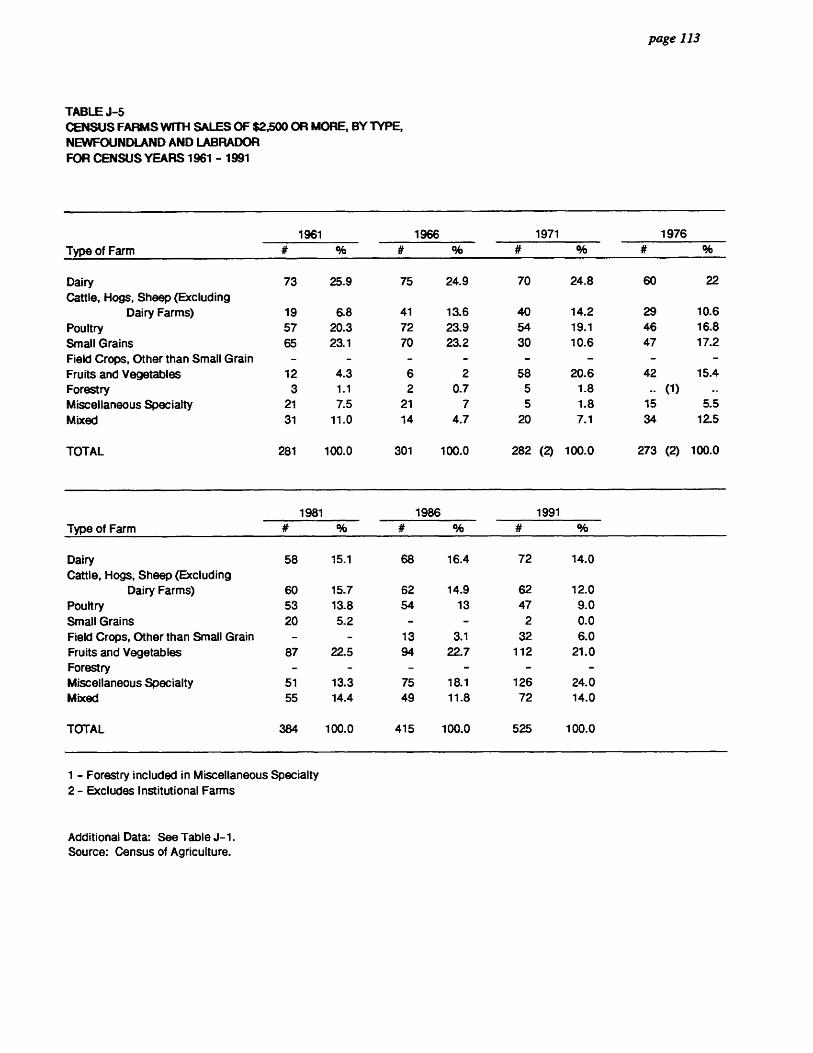
SO
MO
SI II
SS
OO
OS
SO
SO
OS
SM
OO
SI II III
MO
OS
SM
OS
II
page 113
TABLE J-5 CENSUS FARMS WITH SALES OF $2,500 OR MORE, BY TYPE, NEWFOUNDLAND AND LABRADOR FOR CENSUS YEARS 1961 - 1991
1961 1966 1971 1976 Type of Farm # gib # 0.6 # 0/0
Dairy 73 25.9 75 24.9 70 24.8 60 22 Cattle, Hogs, Sheep (Excluding
Dairy Farms) 19 6.8 41 13.6 40 14.2 29 10.6 Poultry 57 20.3 72 23.9 54 19.1 46 16.8 Small Grains 65 23.1 70 23.2 30 10.6 47 17.2 Field Crops, Other than Small Grain - - - - Fruits and Vegetables 12 4.3 6 2 58 20.6 42 15.4 Forestry 3 1.1 2 0.7 5 1.8 .. (1) .. Miscellaneous Specialty 21 7.5 21 7 5 1.8 15 5.5 Mixed 31 11.0 14 4.7 20 7.1 34 12.5
TOTAL 281 100.0 301 100.0 282 (2) 100.0 273 (2) 100.0
1981 1986 1991 Type of Farm 0/0 0/0
Dairy 58 15.1 68 16.4 72 14.0 Cattle, Hogs, Sheep (Excluding
Dairy Farms) 60 15.7 62 14.9 62 12.0 Poultry 53 13.8 54 13 47 9.0 Small Grains 20 5.2 - - 2 0.0 Field Crops, Other than Small Grain - - 13 3.1 32 6.0 Fruits and Vegetables 87 22.5 94 22.7 112 21.0 Forestry - - - - Miscellaneous Specialty 51 13.3 75 18.1 126 24.0 Mixed 55 14.4 49 11.8 72 14.0
TOTAL 384 100.0 415 100.0 525 100.0
1 - Forestry included in Miscellaneous Specialty 2 - Excludes Institutional Farms
Additional Data: See Table J-1. Source: Census of Agriculture.
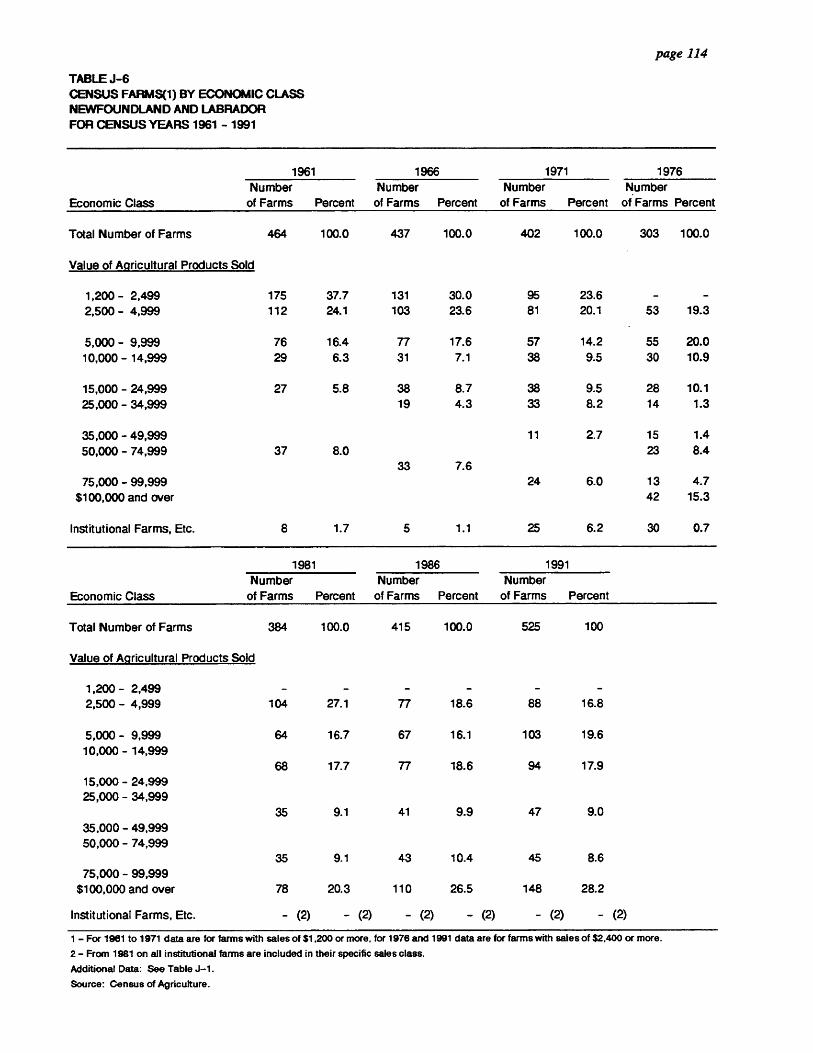
0
II 11111 II
page 114 0
TABLE J-6 CENSUS FARMS(1) BY ECONOMIC CLASS NEWFOUNDLAND AND LABRADOR FOR CENSUS YEARS 1961 - 1991
Economic Class
1961 1966 1971 1976 Number
of Farms Percent Number of Farms Percent
Number of Farms
Number Percent of Farms Percent
Total Number of Farms 464 1 oa 0 437 100.0 402 100.0 303 100.0
Value of Agricultural Products Sold
1,200 - 2,499 175 37.7 131 30.0 95 23.6 2,500 - 4,999 112 24.1 103 23.6 81 20.1 53 19.3
5,000 - 9,999 76 16.4 77 17.6 57 14.2 55 20.0 10,000 - 14,999 29 6.3 31 7.1 38 9.5 30 10.9
15,000 - 24,999 27 5.8 38 8.7 38 9.5 28 10.1 25,000 - 34,999 19 4.3 33 8.2 14 1.3
35,000 - 49,999 11 2.7 15 1.4 50,000 - 74,999 37 8.0 23 8.4
33 7.6 75,000 - 99,999 24 6.0 13 4.7
$100,000 and over 42 15.3
Institutional Farms, Etc. 8 1.7 5 1.1 25 6.2 30 0.7
1981 1986 1991 Number Number Number
Economic Class of Farms Percent of Farms Percent of Farms Percent
Total Number of Farms 384 100.0 415 100.0 525 100
Value of Agricultural Products Sold
1,200 - 2,499 2,500 - 4,999 104 27.1 77 18.6 88 16.8
5,000 - 9,999 64 16.7 67 16.1 103 19.6 10,000 - 14,999
68 17.7 77 18.6 94 17.9 15,000 - 24,999 25,000 - 34,999
35 9.1 41 9.9 47 9.0 35,000 - 49,999 50,000 - 74,999
35 9.1 43 10.4 45 8.6 75,000 - 99,999
$100,000 and over 78 20.3 110 26.5 148 28.2
Institutional Farms, Etc. - (2) - (2) - (2) - (2) - (2) - (2)
1 - For 1961 to 1971 data are for farms with sales of $1200 or more, for 1976 and 1991 data are for farms with sales of $2,400 or more.
2 - From 1981 on all institutional farms are included in their specific sales class.
Additional Data: See Table J-1.
Source: Census of Agriculture.
0
II IIII IIII 11111 S III
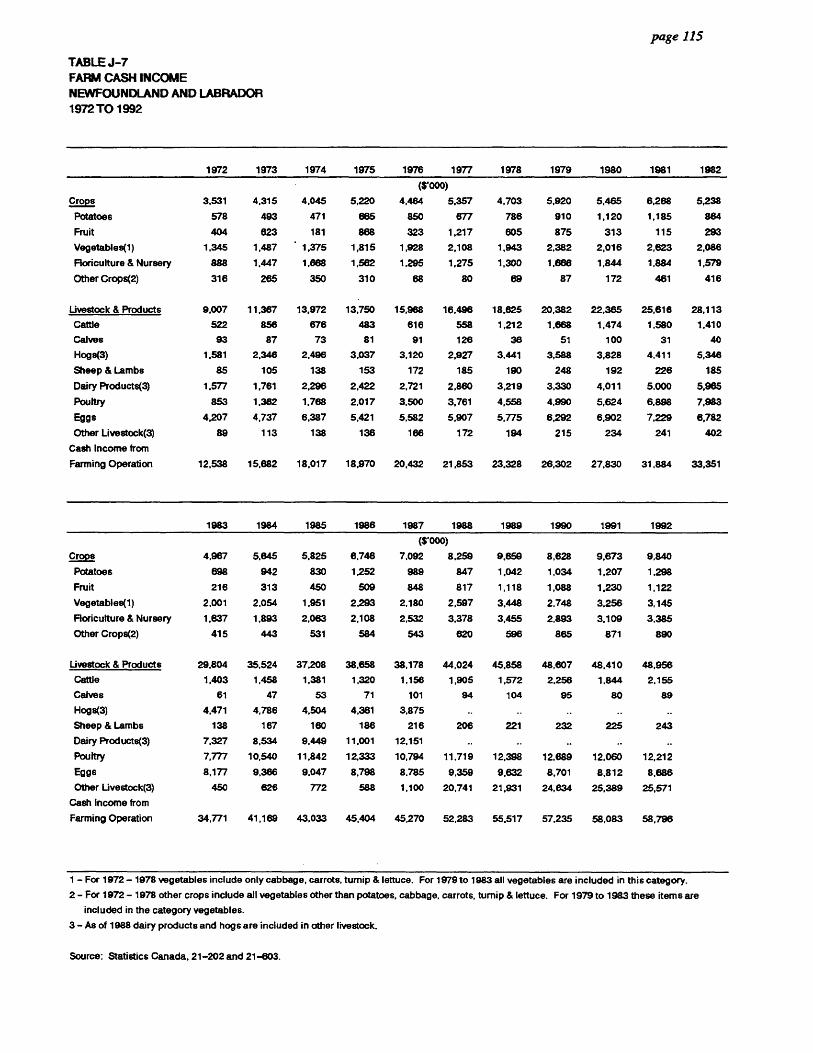
• • page 115
TABLE J-7 FARM CASH INCOME NEWFOUNDLAND AND LABRADOR
• 1972 TO 1992
•
1972 1973 1974 1975 1976 1977 1978 1979 1980 1981 1982
(s.000) 92.2212
Potatoes
Fruit
3,531
578
404
4,315
493
623
4.045
471
181
5,220
865
868
4,464 5.357
850 677
323 1,217
4.703
786
605
5,920
910
875
5,465
1,120
313
6,268
1,185
115
5,238
884
293
Vegetables(1) 1,345 1,487 • 1.375 1,815 1,928 2,108 1,943 2,382 2,016 2,623 2,086
Floriculture & Nursery 888 1,447 1,668 1,562 1,295 1.275 1,300 1,866 1,844 1,884 1,579
Other Crops(2) 316 265 350 310 68 80 69 87 172 481 416
Livestock & Products 9,007 11,367 13,972 13,750 15,968 16,496 18,825 20,382 22,365 25,616 28.113
Cattle 522 856 676 483 616 558 1,212 1,668 1,474 1,580 1,410
Calves 93 87 73 81 91 126 36 51 100 31 40
Hogs(3) 1,581 2,346 2,496 3,037 3,120 2,927 3,441 3,588 3,828 4,411 5,346
Sheep & Lambs 85 105 138 153 172 185 190 248 192 226 185
Dairy Products(3) 1 ,577 1,761 2,296 2,422 2,721 2,860 3,219 3,330 4,011 5,000 5,965
Poultry 853 1,362 1,768 2,017 3,500 3,761 4,558 4,990 5,624 6,898 7,983
Eggs 4,207 4,737 6.387 5,421 5,582 5,907 5,775 6,292 6,902 7,229 6,782
Other Livestock(3) 89 113 138 136 166 172 194 215 234 241 402
Income from
Farming Operation 12,538 15,682 18,017 18,970 20,432 21,853 23,328 26,302 27,830 31,884 33,351
1983 1984 1985 1986 1987 1988 1989 1990 1991 1992
4.000) Crops 4,967 5,645 5,825 6,746 7,092 8,259 9,659 8,628 9,673 9,840
Potatoes 898 942 830 1,252 989 847 1,042 1,034 1,207 1,298
Fruit 216 313 450 509 848 817 1,118 1,088 1,230 1,122
Vegetables(1) 2,001 2,054 1.951 2,293 2,180 2,597 3,448 2,748 3,256 3,145
Floriculture & Nursery 1,837 1,893 2,063 2,108 2,532 3,378 3,455 2.893 3,109 3,385
Other Crops(2) 415 443 531 584 543 620 596 865 871 890
Livestock & Products 29,804
1,403
35.524
1,458
37,208
1,381
38,858
1,320
38,178 44,024
1,156 1,905
45,858
1,572
48,607
2,256
48,410
1,844
48,956
2,155 Cattle
Calves 61 47 53 71 101 94 104 95 80 89
Hogs(3) 4,471 4,786 4,504 4,361 3,875 ..
Sheep & Lambs 138 167 160 186 216 206 221 232 225 243
Dairy Products(3) 7,327 8,534 9.449 11.001 12,151 .. .. ..
Poultry 7,777 10,540 11.842 12,333 10,794 11,719 12,398 12,689 12,060 12,212
Eggs 8,177 9,366 9.047 8,798 8.785 9.359 9,632 8,701 8,812 8,686
Other Livestock(3) 450 626 772 588 1,100 20,741 21,931 24,634 25,389 25,571
Cash Income from
Farming Operation 34,771 41,169 43.033 45,404 45,270 52,283 55,517 57,235 58,083 58,796
1 - For 1972 - 1978 vegetables include only cabbage, carrots, turnip & lettuce. For 1979 to 1983 all vegetables are included in this category.
2 - For 1972 - 1978 other crops include all vegetables other than potatoes, cabbage, carrots, turnip & lettuce. For 1979 to 1983 these items are
5 included in the category vegetables.
3 - As of 1988 dairy products and hogs are included in other livestock.
IIII • Source: Statistics Canada, 21-202 and 21-603.
S
S
III
411
0
5
II
0
0 • 5
0
0
0

SECTION K
FISHERIES
• • • • • • • • • • • • •

1111 • page 117
• 0 • SECTION 'IC"
III • • TABLE K-1
0
• Groundfish •
fli Fish that generally feed and dwell near the bottom of the sea, e.g. cod, haddock, redfish,
4111 flounder, halibut, etc.
• Molluscs and Crustaceans
III Fish that usually live in water close to the bottom, have hard shells, joined appendages • and generally travel limited distances, e.g. crab, shrimp, squid, etc. II • Pelagic
• Species that feed in mid-water or near the surface e.g. herring, capelin, mackerel, etc. II • Roundweight
• The weight of the fish when taken out of the water, i.e. live weight. 0
• TABLE K1 AND K2
• • A moratorium on commercial fishing for northern cod was established in July, 1992. The
prospects for reopening this fishery in the foreseeable future are bleak. In 1993
0 additional moratoria were put in place on the South Coast of the Province and there were • quota reductions on cod in the Gulf of St. Lawrence.
A • TABLE K-7 • •
ID Fishermen
Engaged in the Fishery is defined to cover the time spent preparing for, actually fishing, • and storing boats and gear away after the season. Time spent on repairing boats or gear
• in the off-season is not included but such time spent in the fishing season is included.
0

page 118
Before 1%9 "Engaged in the Fishery" included not only time spent in catching fish, but also time spent on shore preparing boats and fishing equipment, processing fish, repairing shore installations, and performing other unpaid activities connected with the fishery, and also time spent receiving unemployment insurance payments if such payments were earned as a result of fishing activities.
Casual - those who are engaged in the fishery for less than five month.
Full-time - those who are engaged in the fishery for over 10 months of the year.
Part-time - those who are engaged in the fishery for a period of over five and up to 10 months.
Beginning with 1980 there is not a set number of months for the province that a person has to fish to be considered full-time and part-time. If a person fishes consistently for the fishing season set out in his area then he is considered full-time, the length of the fishing season varies from Area to Area.

1111
1 11 1
011M
OS
OO
OS
OM
MO
OM
OO
100111101 1
SO
MI D
O
TABLE K-1
OUANTITY(1) OF FISH LANDINGS, BY SPECIES
NEWFOUNDLAND AND LABRADOR
FOR SELECTED YEARS, 1955 TO 1993
page 119
Species 1955 1960 1965 1970 1975 1980
(Metric Tons)
Total Landings"(2) 301,305 299,742 312.798 477,192 256,058 500,191
Seafish, Total 289,937 287,168 304.467 474,854 255,576 499,199
Groundfish, Total 250,923 265,034 275.472 306,597 193,977 380,575
Catfish 146 261 959 1,092 1,527 2,184
Cod 205,018 221,174 187,901 152,930 77,523 250,056 Haddock 28,085 13,946 3,346 2,071 288 . 2,375 Halibut 229 243 405 431 373 371
Plaice & Greysole 8,694 19,893 44,684 94,869 64,288 71,985
Redfish 7,939 8,625 30,279 41,602 40,932 18,235
Turbot 722 626 7.463 12,930 8,100 33,360
Other 90 466 435 672 946 2,010
Pelagic & Esturial, Total 29,313 14,927 19278 164,934 53.309 67,761
Capelin 13.904 7,012 4.781 3,34.8 4,589 20,683
Herring 13.081 6,831 12,926 158,778 42,474 35,504
Mackerel 1,477 1 191 924 3,867 7,206
Salmon 795 947 1,162 1,588 2,044 2,102
Trout .. 73 132 186 29 39
Other 56 63 86 110 306 2,273 Molluscs & Crustaceans, Total 9,701 7,207 9,717 3,323 8,290 50,863
Lobster 2,498 2,044 1.696 1,455 1,696 2,452
Scallops 184 93 219 512 8 1,197
Squid 7.019 5,067 7,802 76 3,202 33,978
Crabs - - - 890 2,011 9,427
Shrimp - - 159 1,372 3,808
Other - 3 - 231 1 1
Viscera, Total 11,368 12,574 8,331 2,338 482 993 Whales (NumberX4) 6,628 1,970 1,558 662 - -
Seals (Number) 55,561 37,559 79,954 93,286 73,490 122,223
Species 1985 1989p 1990p 1991p 1992p 1993p (Metric Tons)
Total Landings*(2) 468,497 - - - - -
Seafish. Total 488,219 519.079 543,814 422,177 281,237 234,737 Groundfish, Total 386,313 347,651 336,705 270,024 155,471 97,284
Catfish 1,728 1,131 880 739 361 392
Cod 270,693 262,044 245,983 178,577 74,637 37,005 Haddock 2,879 3.730 1,944 1.092 998 791
Halibut 792 289 303 376 142 153 Plaice & Greysole 63,743 48,259 41,485 42,585 27,740 21,891
Redfish 28,338 15,981 26,786 28,738 33,971 26.331 Turbot 14,763 12,227 16.733 13,874 13,728 8,019
Other 3,377 4,010 2.831 4,045 3,893 2,702
Pelagic & Esturial, Total 64,005 128,251 159,848 103,609 68,546 74,887 Capelin 35,535 90,297 126,550 49,602 31,199 43,829 Herring 11.577 30,582 27,975 44,752 26,757 21,092 Mackerel 15,749 6,016 4,238 8,375 9,930 9,383 Salmon 879 861 812 442 204 114 Trout(3) 194 - - - - -
Other 71 496 472 438 456 469 Molluscs & Crustaceans, Total 17,901 43,177 47,062 48,544 57,221 62,566
Lobster 2,920 3.118 2,914 3,035 3,201 2,489
Scallops 3,018 673 959 1,350 6,842 2,255 Squid 400 3,102 4.450 1,724 924 261 Crabs 7,984 8.357 11,056 16,093 16,443 20,908
Shrimp 3,579 26,203 20,000 21,735 22,029 23,127 Other - 1,723 7,882 4,807 7,781 13,528
Viscera, Total 278 - - - - - Whales (NumberX4) - - - - - - Seals (Number) - - - - - -
- Includes viscera. 1 - All quantities based on round weight
2 - Figures may not add to totals due to rounding
3 - Includes Char from 1984 on. 4 - A ban was placed on whale hunting, effective 1973
Additional Data: By Fishing Area, Monthly.
Source: Fisheries Statistics & Systems Branch, Dept. of Fisheries & Oceans, St. John's.
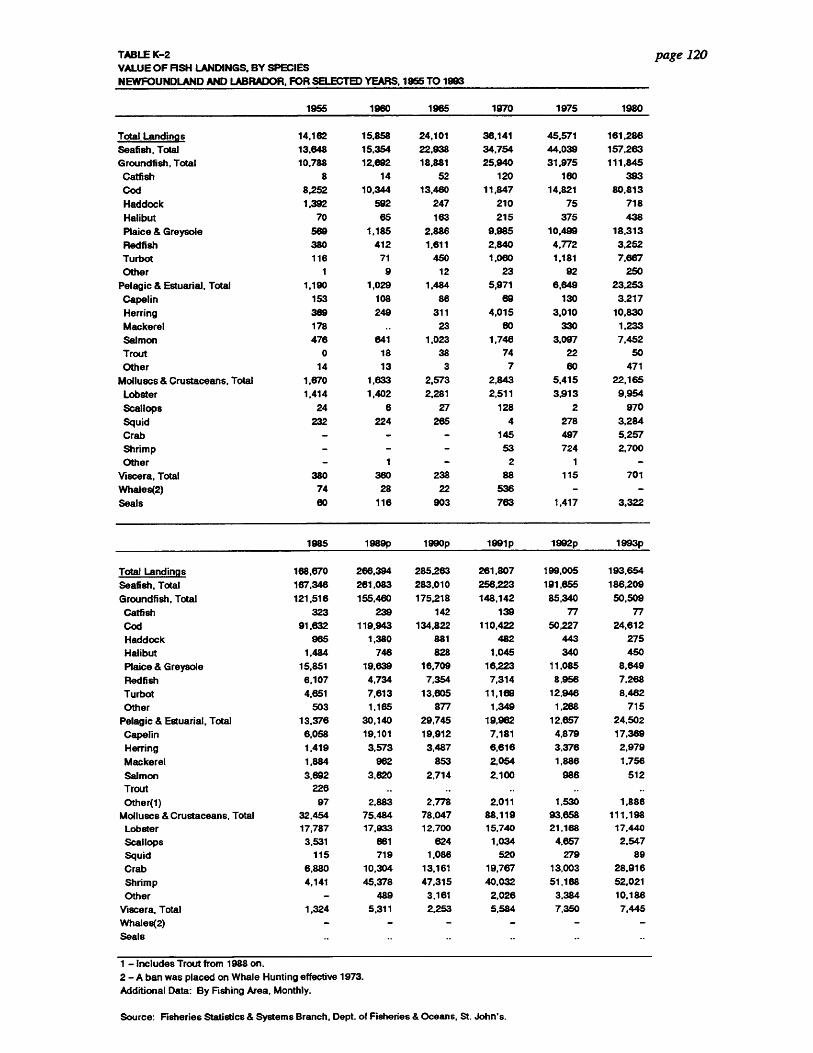
OO
SO
IIII
MO
II
IIII
I III
IIII
SM
OS
O11
011
1 111
1111
M111
01111
011
011
TABLE K-2
VALUE OF FISH LANDINGS, BY SPECIES
NEWFOUNDLAND AND LABRADOR, FOR SELECTED YEARS, 1955 TO 1993
page 120
1955 1960 1965 1970 1975 1980
Total Landings 14,162 15,858 24,101 36,141 45,571 181,286
Seafi8h, Total 13,648 15,354 22,938 34,754 44,039 157,263
Groundfish, Total 10,788 12,692 18.881 25,940 31,975 111,845
Catfish 8 14 52 120 160 393
Cod 8,252 10,344 13,460 11,847 14,821 80,813
Haddock 1.392 592 247 210 75 718
Halibut 70 65 163 215 375 438
Plaice & Greysole 569 1,185 2,886 9,985 10,499 18,313
Redfish 380 412 1.611 2,840 4,772 3,252
Turbot 116 71 450 1,060 1.181 7,667
Other 1 9 12 23 92 250
Pelagic & Estuarial, Total 1,190 1,029 1,484 5,971 6,649 23,253
Capelin 153 108 86 69 130 3,217
Herring 389 249 311 4,015 3,010 10,830
Mackerel 178 23 60 330 1,233
Salmon 476 641 1,023 1,746 3,097 7,452
Trout 0 18 38 74 22 50
Other 14 13 3 7 60 471
Molluscs & Crustaceans, Total 1,670 1,633 2,573 2,843 5.415 22,165
Lobster 1,414 1,402 2,281 2,511 3,913 9,954
Scallops 24 6 27 128 2 970
Squid 232 224 265 4 278 3,284
Crab - 145 497 5,257
Shrimp - 53 724 2,700
Other - 1 2 1 -
Viscera, Total 380 360 238 88 115 701
Whales(2) 74 28 22 536 - -
Seals 60 116 903 783 1,417 3,322
1985 1989p 1990p 1991p 1992p 1993p
Total Landings 168,670 266,394 285,263 261,807 199,005 193,654
Seafish, Total 187,348 261,083 283,010 256,223 191,655 186,209
Groundfish, Total 121,516 155,480 175,218 148,142 85,340 50,509
Catfish 323 239 142 139 77 77
Cod 91,632 119,943 134,822 110,422 50,227 24,812
Haddock 965 1,380 881 482 443 275
Halibut 1,484 746 828 1,045 340 450
Plaice & Greysole 15,851 19,639 16,709 16,223 11,085 8,849
Redfish 6,107 4,734 7,354 7,314 8,956 7,268
Turbot 4,651 7,613 13,605 11,189 12,946 8,482
Other 503 1,165 877 1,349 1,288 715
Pelagic & Estuarial, Total 13,376 30,140 29,745 19,982 12,657 24,502
Capelin 6,058 19,101 19,912 7,181 4,879 17,369
Herring 1,419 3,573 3,487 6,616 3,376 2,979
Mackerel 1,884 962 853 2,054 1,886 1,756
Salmon 3,692 3.620 2.714 2,100 986 512
Trout 226 .. .. .. ..
Other(1) 97 2,883 2,778 2,011 1,530 1,886
Molluscs & Crustaceans, Total 32,454 75.484 78,047 88,119 93,658 111,198
Lobster 17,787 17,933 12,700 15,740 21,168 17,440
Scallops 3,531 861 624 1,034 4,657 2.547
Squid 115 719 1,086 520 279 89
Crab 6,880 10,304 13,161 19,767 13,003 28,916
Shrimp 4,141 45,378 47,315 40,032 51,168 52,021
Other 489 3,161 2,026 3,384 10,186
Viscera, Total 1,324 5,311 2,253 5,584 7,350 7,445
Whales(2)
Seals
1 - Includes Trout from 1988 on.
2 - A ban was placed on Whale Hunting effective 1973.
Additional Data: By Fishing Area, Monthly.
Source: Fisheries Statistics & Systems Branch, Dept. of Fisheries & Oceans, St. John's.

IIII
IIS
SO
SO
SS
OO
OM
MO
SS
OS
OO
SO
OO
SIO
SS
OS
OO
OS
OS
S
page 121
TABLE K-3 QUANTITY OF FISH PRODUCTS, BY TYPE, NEWFOUNDLAND AND LABRADOR, FOR SELECTED YEARS, 1960 TO 1987
Item 1960 1965 1970 1975
Fresh, Round or Dressed (Metric Tons) 5,344 5,813 1,969 4,290
Frozen, Round or Dressed (Metric Tons) 367 1,922 1,442 3,777 Fresh Fillets (Metric Tons) 690 736 3,877 1,102 Frozen Fillets (Metric Tons) 10,806 15,695 39,590 36,052 Frozen Blocks and Sticks (Metric Tons) 15,251 31,538 25,928 12,307 Smoked, Round or Dressed (Metric Tons) 367 188 34 151 Smoked Fillets (Metric Tons) 23 - 26 14
Green Salted (Metric Tons) 37,870 20,906 1,647 - Dried Salted (Metric Tons) 11,092 6,500 9,438 4,795 Boneless Salted (Metric Tons) - - 23 - Pickled and Vinegar - Cured Dressed (Barrels) 13,366 9,534 58,847 18,889 Pickled and Vinegar - Cured Fillets (Barrels) 6,675 14,926 49,301 43,547 Other Pickled and Cured (Barrels) - - - 11,643
Canned (Cases) 4,055 748 11,879 24,210
Bait (Metric Tons) 8,180 12,578 3,905 6,681 Meal (Metric Tons) 7,217 15,718 45,509 16,537 Oil (Gallons) 902,543 511,574 3,053,598 872,714 In Shell - Fresh and Frozen (Metric Tons) - 1,640 1,229 1,770 Shucked - Fresh and Frozen (Metric Tons) - 26 159 673
Items 1980 1985 1986 1987
Fresh, Round or Dressed (Metric Tons) 7,996 11,897 6,636 9,593 Frozen, Round or Dressed (Metric Tons) 32,891 26,944 43,126 29,520 Fresh Fillets (Metric Tons) 3,643 2,120 6,739 7,370 Frozen Fillets (Metric Tons) 47,823 51,079 62,502 61,042 Frozen Blocks and Sticks (Metric Tons) 43,051 43,601 46,570 44,151 Smoked, Round or Dressed (Metric Tons) 1,572 103 296 374 Smoked Fillets (Metric Tons) 50 65 185 186 Green Salted (Metric Tons) 7,462 9,193 11,591 11,570 Dried Salted (Metric Tons) 10,132 935 778 906 Boneless Salted (Metric Tons) - - - - Pickled and Vinegar - Cured Dressed (Barrels) 43,512 47,208 27,906 108,624 Pickled and Vinegar - Cured Fillets (Barrels) 42,593 25,280 20,077 48,511 Other Pickled and Cured (Barrels) 8,952 5,977 10,288 5,889 Canned (Cases) 107,714 24,653 56,050 18,240 Bait (Metric Tons) 8,555 5,994 4,111 6,356 Meal (Metric Tons) 25,805 24,796 26,603 24,046 Oil (Gallons) 758,213 359,067 351,173 264,623 In Shell - Fresh and Frozen (Metric Tons) 4,260 4,333 5,742 11,291 Shucked - Fresh and Frozen (Metric Tons) 1,994 1,953 2,421 1,102
Source: Fisheries Statistics & Systems Branch, Department of Fisheries & Oceans, St. John's

TABLE K-4 VALUE OF FISH PRODUCTS, BY TYPE, NEWFOUNDLAND AND LABRADOR, FOR SELECTED YEARS, 1960 TO 1987
Item 1960 1965 1970 1975 ($000)
Fresh, Round or Dressed 4,077 2,613 2,544 5,764 Frozen, Round or Dressed 346 1,612 1,536 4,144 Fresh Fillets 321 469 3,619 1,747 Frozen Fillets 5,915 9,527 30,331 58,727 Frozen Blocks & Sticks 6,626 17,302 14,996 13,505 Smoked, Round or Dressed 115 57 36 247 Smoked Fillets 14 - 25 35 Green Salted or (Wet Salted) 8,825 8,257 1,111 Dried Salted 4,030 3,711 6,081 8,065 Boneless Salted - 28 Pickled & Vinegar - Cured Dressed 407 366 1,970 1,300 Pickled & Vinegar - Cured Fillets 214 406 1,946 3,599 Other Pickled and Cured 883 Canned 128 70 480 618 Bait 872 1,028 207 1,176 Meal 762 2,534 8,759 4,970 Oil 722 390 2,228 1,314 In Shell - Fresh & Frozen 3,279 3,280 5,936 Shucked - Fresh & Frozen 39 406 3,329 Other Products 1,189 5,549 5,394 TOTAL VALUE OF FISH PRODUCTS(1) 52,849 85,102 120,753
Item 1980 1985 1986 1987 ($000)
Fresh, Round or Dressed 9,375 12,449 9,762 11,862 Frozen, Round or Dressed 35,117 27,607 74,560 37,247 Fresh Fillets 6,840 6,343 17,581 39,035 Frozen Fillets 129,553 196,260 299,987 319,621 Frozen Blocks & Sticks 99,468 121,933 159,396 188,829 Smoked, Round or Dressed 8,541 587 1,207 1,434 Smoked Fillets 156 201 826 791 Green Salted or (Wet Salted) 15,101 9,829 44,057 50,278 Dried Salted 28,638 1,687 3,281 4,177 Boneless Salted Pickled & Vinegar - Cured Dressed 5,111 3,848 3,805 9,733 Pickled & Vinegar - Cured Fillets 8,021 3,802 2,807 8,273 Other Pickled and Cured 1,319 91 153 119 Canned 4,703 727 676 262 Bait 3,671 2,165 1,541 2,865 Meal 10,763 7,024 11,536 13,654 Oil 1,134 469 804 774 In Shell - Fresh & Frozen 13,854 21,001 35,781 64,480 Shucked - Fresh & Frozen 14,976 25,411 41,581 15,337 Other Products 8,315 23,281 22,657 53,010 TOTAL VALUE OF FISH PRODUCTS(1) 404,656 464,715 731,998 821,781
1 - Figures may not add to totals because of rounding.
Source: Statistics & Systems Branch, Department of Fisheries & Oceans, St. John's.
page 122
MO
SO
IDOS
SO
OM
IIIS
S11
1111
11•1
111
1101 1
11S
OO
MO
OO
MO
S
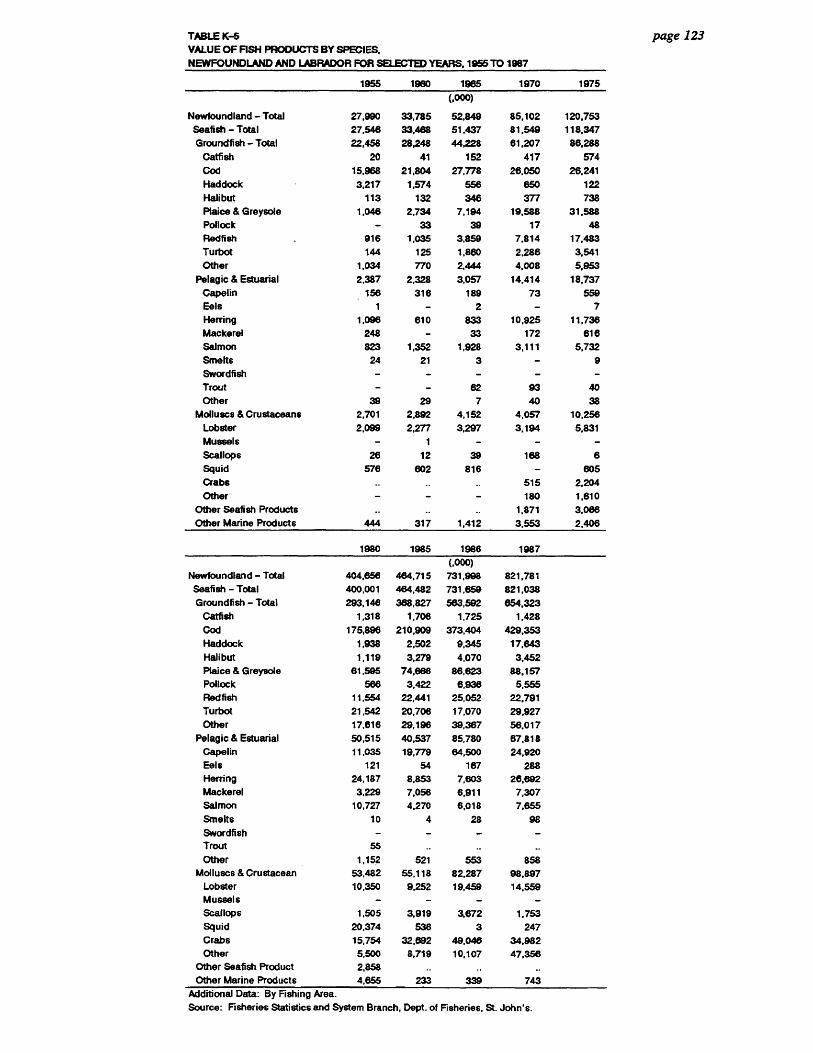
SO
OS
OO
SO
MO
MO
SO
OO
OS
OM
SO
MO
OM
OS
00
00
11
page 123 TABLE K-5
VALUE OF FISH PRODUCTS BY SPECIES, NEWFOUNDLAND AND LABRADOR FOR SELECTED YEARS, 1955 TO 1987
1955 1960 1965 1970 1975
(.000)
Newfoundland - Total 27,990 33,785 52,849 85,102 120,753
Seafish - Total 27,546 33,468 51,437 81,549 118,347
Groundfish - Total 22,458 28,248 44,228 61,207 86,288
Catfish 20 41 152 417 574
Cod 15,968 21,804 27,778 26,050 26,241
Haddock 3,217 1,574 556 650 122
Halibut 113 132 346 377 738
Plaice & Greysole 1.046 2,734 7,194 19,588 31,588
Pollock - 33 39 17 48
Redfish 918 1,035 3,859 7,814 17,483
Turbot 144 125 1,860 2,286 3,541
Other 1,034 770 2,444 4,008 5,953
Pelagic & Estuarial 2,387 2,328 3,057 14,414 18,737
Capelin 156 316 189 73 559
Eels 1 - 2 - 7
Herring 1,096 610 833 10,925 11,736
Mackerel 248 - 33 172 616
Salmon 823 1,352 1,928 3,111 5,732
Smelts 24 21 3 - 9
Swordfish - - - - -
Trout - - 62 93 40
Other 39 29 7 40 38
Molluscs & Crustaceans 2,701 2,892 4,152 4,057 10,256
Lobster 2,099 2,277 3,297 3,194 5,831
Mussels - 1 - - -
Scallops 26 12 39 168 6
Squid 576 602 816 - 605
Crabs 515 2,204
Other - - - 180 1,610
Other Seafish Products 1,871 3,086
Other Marine Products 444 317 1,412 3,553 2,406
1980 1985 1986 1987
(.000)
Newfoundland - Total 404,656 464,715 731,998 821,781
Seafish - Total 400,001 464,482 731,659 821,038
Groundfish - Total 293,146 368,827 563,592 654,323
Catfish 1,318 1,706 1,725 1,428
Cod 175,896 210,909 373,404 429,353
Haddock 1,938 2,502 9,345 17,643
Halibut 1,119 3,279 4,070 3,452
Plaice & Greysole 61,595 74,686 86,623 88,157
Pollock 566 3,422 6,936 5,555
Redfish 11,554 22,441 25,052 22,791
Turbot 21542 20,706 17,070 29,927
Other 17,616 29,196 39,367 56,017
Pelagic & Estuarial 50,515 40,537 85,780 67,818
Capelin 11,035 19,779 64,500 24,920
Eels 121 54 167 288
Herring 24,187 8,853 7,603 26,692
Mackerel 3,229 7,056 6,911 7,307
Salmon 10,727 4,270 6,018 7,655
Smelts 10 4 28 98
Swordfish - - -
Trout 55 ..
Other 1,152 521 553 858
Molluscs & Crustacean 53,482 55,118 82,287 98,897
Lobster 10,350 9,252 19,459 14.559 Mussels - - - -
Scallops 1,505 3,919 3,672 1,753
Squid 20,374 536 3 247
Crabs 15,754 32,892 49,046 34,982
Other 5,500 8,719 10,107 47,356
Other Seafish Product 2,858 ..
Other Marine Products 4,655 233 339 743
Additional Data: By Fishing Area.
Source: Fisheries Statistics and System Branch, Dept. of Fisheries, St. John's.
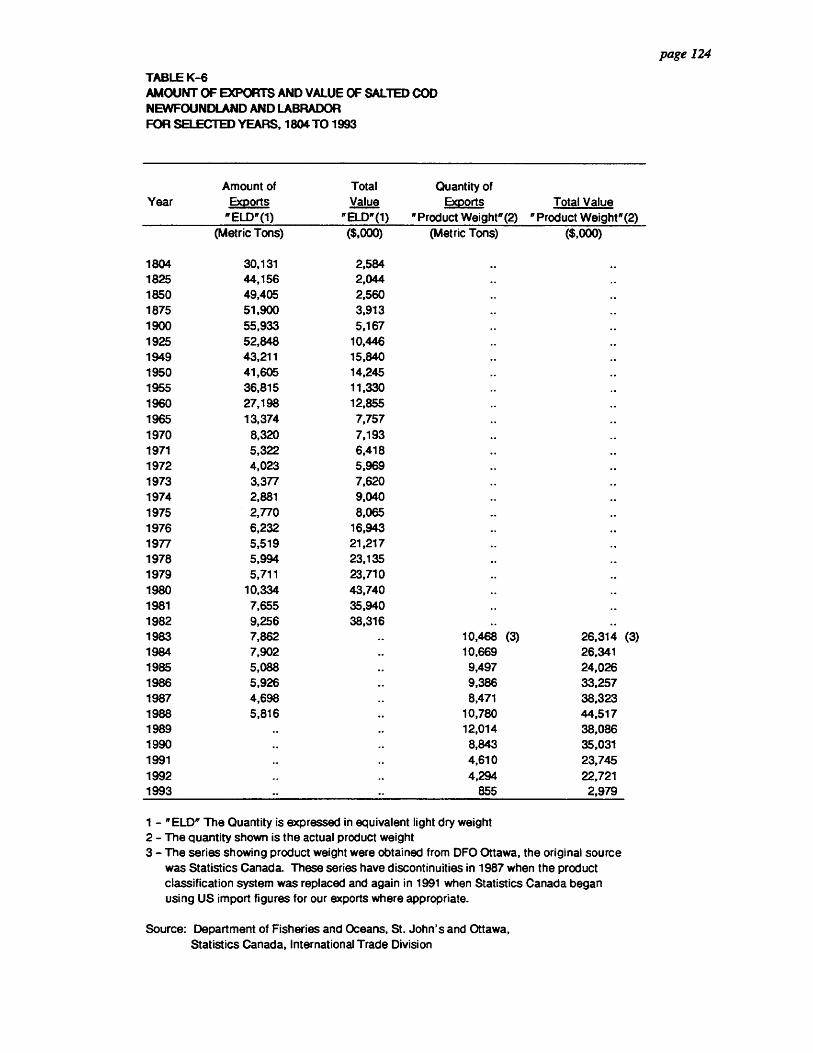
TABLE K-6 AMOUNT OF EXPORTS AND VALUE OF SALTED COD NEWFOUNDLAND AND LABRADOR FOR SELECTED YEARS, 1804 TO 1993
Year Amount of
Exports Total Value
Quantity of Exports Total Value
n'ELD"(1) "ELD"(1) "Product Weight"(2) "Product Weight" (2) (Metric Tons) ($,000) (Metric Tons) ($,000)
1804 30,131 2,584 1825 44,156 2,044 1850 49,405 2,560 1875 51,900 3,913 1900 55,933 5,167 1925 52,848 10,446 1949 43,211 15,840 1950 41,605 14,245 1955 36,815 11,330 1960 27,198 12,855 1965 13,374 7,757 1970 8,320 7,193 1971 5,322 6,418 1972 4,023 5,969 1973 3,377 7,620 1974 2,881 9,040 1975 2,770 8,065 1976 6,232 16,943 1977 5,519 21,217 1978 5,994 23,135 1979 5,711 23,710 1980 10,334 43,740 1981 7,655 35,940 1982 9,256 38,316 1983 7,862 10,468 (3) 26,314 (3) 1984 7,902 10,669 26,341 1985 5,088 9,497 24,026 1986 5,926 9,386 33,257 1987 4,698 8,471 38,323 1988 5,816 10,780 44,517 1989 12,014 38,086 1990 8,843 35,031 1991 4,610 23,745 1992 4,294 22,721 1993 .. 855 2,979
1 - "ELD" The Quantity is expressed in equivalent light dry weight 2 - The quantity shown is the actual product weight 3 - The series showing product weight were obtained from DFO Ottawa, the original source
was Statistics Canada. These series have discontinuities in 1987 when the product classification system was replaced and again in 1991 when Statistics Canada began using US import figures for our exports where appropriate.
Source: Department of Fisheries and Oceans, St. John's and Ottawa, Statistics Canada, international Trade Division
• e page 124
GI a • is a • • so a al • e • • ID II II • • e al 41 III • III • II ID • e a • e a • a a a e • •
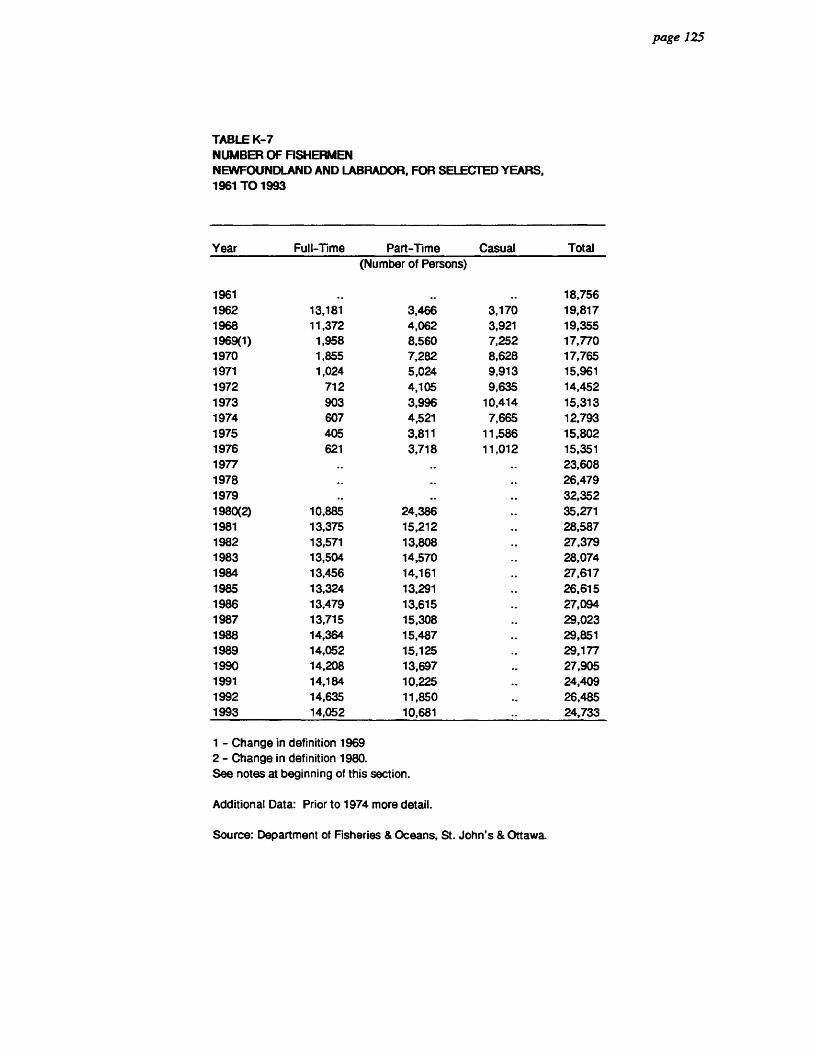
OM
OS
OM
OO
OM
OO
OS
IIII
IIM
OS
OO
MO
OM
MO
O
page 125
TABLE K-7 NUMBER OF FISHERMEN NEWFOUNDLAND AND LABRADOR, FOR SELECTED YEARS, 1961 TO 1993
Year Full-Time Part-Time Casual Total
(Number of Persons)
1961 18,756 1962 13,181 3,466 3,170 19,817 1968 11,372 4,062 3,921 19,355 1969(1) 1,958 8,560 7,252 17,770 1970 1,855 7,282 8,628 17,765 1971 1,024 5,024 9,913 15,961 1972 712 4,105 9,635 14,452 1973 903 3,996 10,414 15,313 1974 607 4,521 7,665 12,793 1975 405 3,811 11,586 15,802 1976 621 3,718 11,012 15,351 1977 23,608 1978 26,479 1979 32,352 1980(2) 10,885 24,386 35,271 1981 13,375 15,212 28,587 1982 13,571 13,808 27,379 1983 13,504 14,570 28,074 1984 13,456 14,161 27,617 1985 13,324 13,291 26,615 1986 13,479 13,615 27,094 1987 13,715 15,308 29,023 1988 14,364 15,487 29,851 1989 14,052 15,125 29,177 1990 14,208 13,697 27,905 1991 14,184 10,225 24,409 1992 14,635 11,850 26,485 1993 14,052 10,681 24,733
1 - Change in definition 1969 2 - Change in definition 1980. See notes at beginning of this section.
Additional Data: Prior to 1974 more detail.
Source: Department of Fisheries & Oceans, St. John's & Ottawa.

TABLE K-8 AVERAGE PRICE RECEIVED BY FISHERMEN FOR SELECTED SPECIES NEWFOUNDLAND AND LABRADOR 1955 -1993
(CENTS PER KILOGRAM, UNLESS OTHERWISE STATED)
Year Cod Greysole Redfish Salmon Lobster Seal ($ per pelt)
1955 4.9 6.6 4.9 60.0 56.7 1.07 1956 4.9 5.1 4.5 60.4 59.0 0.83 1957 4.8 6.1 4.7 61.7 59.9 1.90 1958 4.7 6.2 4.5 57.0 59.7 3.01 1959 5.1 6.0 4.6 61.7 72.0 1.78 1960 5.5 6.0 4.9 67.7 68.6 3.08 1961 6.2 6.0 5.1 69.7 70.3 3.22 1962 6.4 6.0 5.1 82.2 77.8 3.80 1963 7.1 6.2 5.3 83.3 86.2 4.28 1964 8.2 6.6 5.7 80.2 104.1 18.85 1965 8.6 6.4 5.3 88.0 134.7 11.29 1966 9.3 6.4 5.3 89.1 138.2 10.66 1967 9.7 7.5 5.5 92.2 145.3 8.68 1968 8.2 7.1 5.3 94.6 134.0 4.28 1969 7.7 8.6 5.3 98.1 143.3 6.93 1970 9.0 10.8 6.8 111.8 171.3 8.18 1971 11.7 .10.6 7.7 108.9 176.8 8.15 1972 13.4 11.7 8.2 125.9 259.0 10.42 1973 19.0 14.8 10.1 151.5 235.9 10.25 1974 21.7 16.5 10.7 154.7 239.5 14.04 1975 22.9 16.3 11.7 151.5 230.8 20.87 1976 24.6 17.9 12.0 180.5 233.9 15.82 1977 29.2 20.3 13.1 242.6 261.2 19.80 1978 33.0 21.0 13.7 296.3 364.0 19.08 1979 35.4 23.1 15.4 327.8 351.0 22.22 1980 38.8 25.4 17.8 354.5 406.0 27.18 1981 40.8 25.6 17.6 350.3 450.3 25.42 1982 40.3 27.4 18.4 355.4 487.7 25.41 1983 40.8 27.1 19.3 345.4 496.7 12.65 1984 41.2 29.2 18.7 443.2 559.5 11.41 1985 41.9 26.7 21.8 488.3 609.4 10.00 1986 41.7 31.9 30.0 384.5 605.8 14.82 1987 77.7 36.6 32.4 381.2 686.3 13.56 1988 51.8 38.0 34.8 416.8 568.1 13.28 1989 49.1 43.7 29.6 420.5 575.2 12.75 1990 60.4 46.6 27.4 442.9 435.6 9.63 1991 72.1 40.0 25.5 474.4 518.5 8.90 1992 82.7 38.9 26.3 483.6 661.2 8.73 1993 72.9 44.9 27.6 447.6 697.5 10.44 1 Kilogram equals 2.2046 pounds.
Source: Fisheries Statistics and Systems Branch, Department of Fisheries and Oceans, St. John's.
page 126
OM
OIN
OO
SO
SO
1111
110000011
01
10
0O
SS
OO
OO
SO
OO
MM
O

e 0 0 0 e al e • al 0 0 0 s a is • 0 • SECTION L 0 0 FORESTRY e a a a a e a • a al a a a • • e a a al • • a •
SO
INO
SII
IIO
OS
OO
OO
MO
OM
11
O0
1 100110
011001 1
00OO
M
page 127
SECTION 'L"
TABLE L-1
A logging establishment is a unit which is engaged in logging and related activities (such as felling, bucking, skidding, hauling, trucking, booming, towing, etc.). In most cases the establishment coincides with the firm. However, firms that have more than one establishment are requested to submit a separate census of logging report for each logging establishment which can meet the reporting requirements under the definition of an 'establishment's .
The number of establishments represents the number of operating units that are principally engaged in logging activities. These units do not represent the total number engaged in logging operations. Numerous logging operations are conducted by establishments classified to other industries (e.g. the sawmill industry) and by farmers and other individuals.
TABLE L-5
Timber Royalties - is the charge that the government levies on timber cut on crown lands.
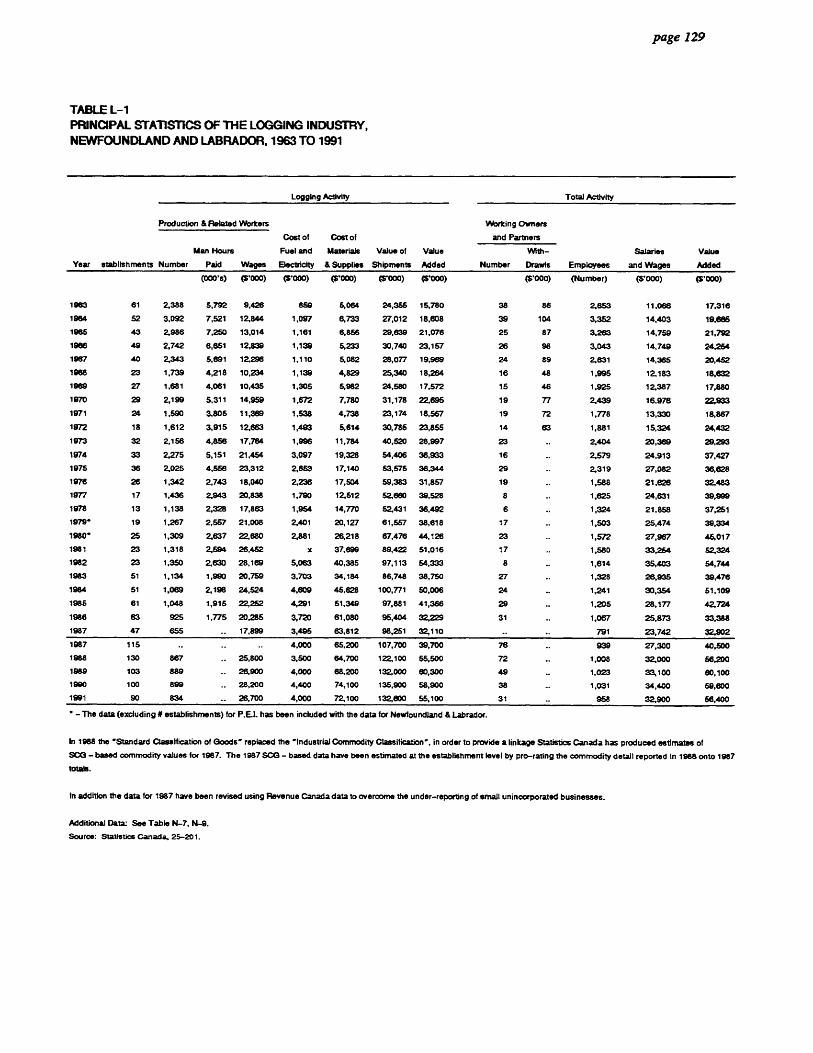
11111 page 129
111 • TABLE L-1
PRINCIPAL STATISTICS OF THE LOGGING INDUSTRY, 1111 NEWFOUNDLAND AND LABRADOR, 1963 TO 1991
411
III II
11111
in
411
III IIII
111111
4111 a . _ The data (excluding # establishments) for P.E.I. has been included with the data for Newfoundland & Labrador.
4111 In 1988 the 'Standard Classification of Goods- replaced the industrial Commodity Classification', in order to provide a linkage Statistics Canada has produced estimates of
SCA - based commodity values for 1987. The 1987 SCO - based data have been estimated at the establishment level by pro-rating the commodity detail reported in 1988 onto 1987
IIII totals.
III In addition the data for 1987 have been revised using Revenue Canada data to overcome the under-reporting of small unincorporated businesses.
III 1965
III 1968
ill 1974
III 1979'
III 1981
s 1983
III 1986
III 1987
III 1989
• Additional Data See Table N-7, N-9.
Source: Statistics Canada. 25-201.
1111
41111
Year III Man
etablishments
Logging Activity Total Activity
Production & Related Workers
Cost of
Fuel and
Electricity
Cost of
Materials
& Supplies
Value of
Shipments
Value
Added
Working Owners
and Partners
Employees
Salaries
and Wages
Value
Added Number
Hours
Paid Wages Number
With-
Drawls
III (000's) ($'000) (8'000) (5'000) (5000) (6'000) ($'000) (Number) ($4000) (3'000)
1963 61 2,388 5,792 9,428 659 5,084 24,355 15,780 38 88 2,653 11,068 17,318
1964 52 3,092 7,521 12,844 1,097 6,733 27,012 18,608 39 104 3,352 14,403 19,686
43 2,986 7,250 13,014 1,161 6,856 29,839 21,076 25 87 3,283 14,759 21,792
1986 49 2,742 6,651 12,839 1,139 5,233 III
30,740 23,157 26 98 3,043 14,749 24,264
1967 40 2,343 5,891 1,110 5,082 28,077 19,986 12, 298
24 89 2.831 14,365 20,452
23 1,739 4,218 10,234 1,139 4,829 25,340 18,264 16 48 1,995 12,183 18,632
1969 27 1,681 4,061 10,435 1,305 5,982 24,580 17,572 15 46 1,925 12,387 17,880
1970 29 2,199 5,311 14,959 1,672 7,780 31,178 22,695 19 77 2,439 16,976 22,933
1971 24 1,590 3,805 11,389 1,538 4,738 23,174 18,567 19 72 1,778 13,330 18,867
1972 18 1,612 3,915 12,863 1,493 5,614 30,785 23,855 14 63 1,881 15,324 24,432
1973 32 2,156 4,856 17,784 1,996 11,784 40,520 28,997 23 2,404 20,389 29,293
33 2,275 5,151 21,454 3,097 19,328 54,406 38,933 16 2,579 24,913 37,427
1975 36 2,025 4,558 23,312 2,653 17,140 53,575 38,344 29 2,319 27,082 36,828
1976 26 1,342 2,743 18,040 2,236 17,504 59,383 31,857 19 1,588 21,828 32,483
1977 17 1,436 2,943 20,838 1,790 12,512 52,880 39,528 8 1,825 24,631 39,999
1978 13 1,138 2,328 17,863 1,954 14,770 52,431 36,492 6 1,324 21,858 37,251
19 1,267 2,557 21,008 2,401 20,127 61,557 38,618 17 1,503 25,474 39,334
1980* 25 1,309 2,637 22,880 2,881 28,218 67,476 44,126 23 1,572 27,987 45,017
23 1,318 2,594 26,452 x 37,899 89,422 51,016 17 1,580 33,254 52,324
1982 23 1.350 2,830 28,189 5,063 40,385 97,113 54,333 8 1,614 35,403 54,744
51 1,134 1,990 20,759 3,703 34,184 86,748 38,750 27 1,328 26,935 39,476
1984 51 1,089 2,198 24,524 4,609 45,828 100,771 50,006 24 1,241 30,354 51,109
1985 61 1,048 1,915 22,252 4,291 51,349 97,881 41,366 29 1,205 28,177 42,724
83 925 1,775 20,285 3,720 61,080 95,404 32,229 31 1,067 25,873 33,388
1987 47 655 17,899 3,495 63,812 98,251 32,110 791 23,742 32,902
115 4,000 65,200 107,700 39,700 78 939 27,300 40,500
1988 130 867 25,800 3,500 84,700 122,100 55,500 72 1,008 32,000 58,200
103 889 26,900 4,000 88,200 132,000 80,300 49 1,023 33,100 80,100
1990 100 899 28,200 4,400 74,100 135,900 58,900 38 1,031 34,400 59,800
1991 90 834 28,700 4,000 72,100 132,800 55,100 31 958 32,900 58,400
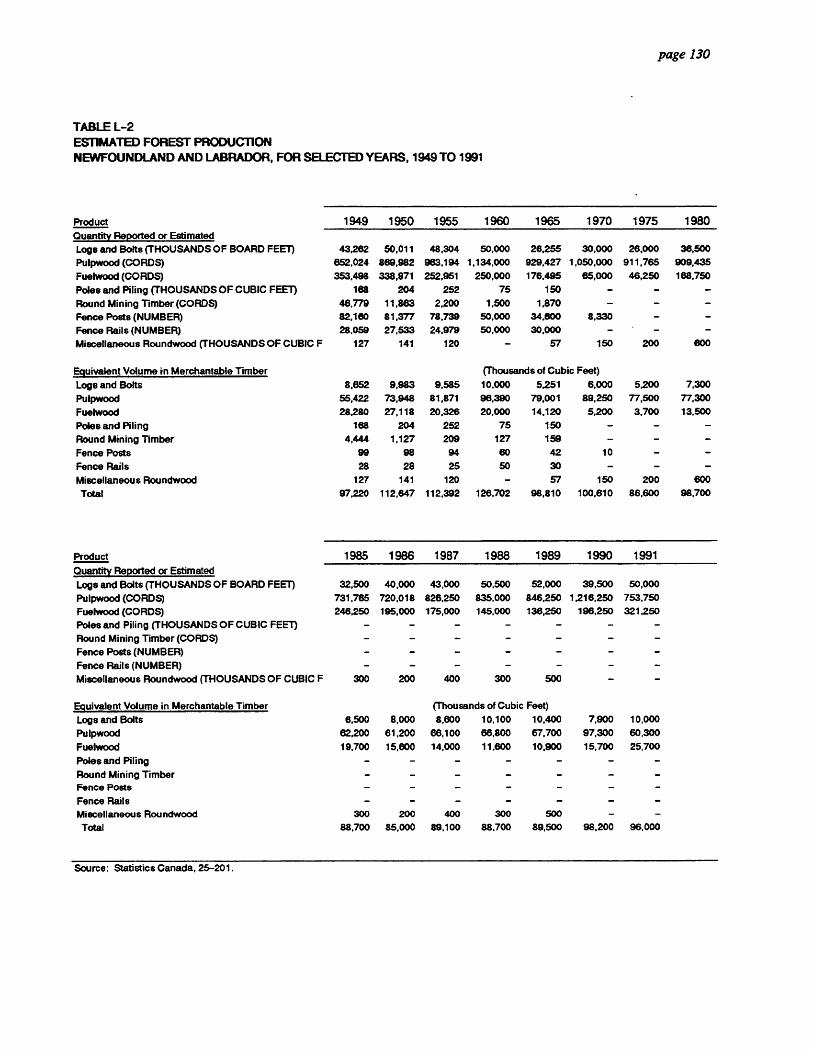
page 130
TABLE L-2 ESTIMATED FOREST PRODUCTION NEWFOUNDLAND AND LABRADOR, FOR SELECTED YEARS, 1949 TO 1991
Product 1949 1950 1955 1960 1965 1970 1975 1980 Quantity Reported or Estimated Logs and Bolts (THOUSANDS OF BOARD FEET) 43,262 50,011 48,304 50,000 26,255 30,000 26,000 36,500
Pulpwood (CORDS) 652,024 889,982 963,194 1,134,000 929,427 1,050,000 911,765 909,435
Fuelwood (CORDS) 353,498 338,971 252,951 250,000 176,495 65,000 46,250 168,750
Poles and Piling (THOUSANDS OF CUBIC FEET) 188 204 252 75 150
Round Mining Timber (CORDS) 48,779 11,883 2,200 1,500 1,870 Fence Posts (NUMBER) 82,160 81.377 78,739 50,000 34,600 8,330
Fence Rails (NUMBER) 28,059 27,533 24,979 50,000 30,000
Miscellaneous Roundwood (THOUSANDS OF CUBIC F 127 141 120 57 150 200 600
Equivalent Volume in Merchantable Timber (Thousands of Cubic Feet)
Logs and Bolts 8,652 9,983 9,585 10,000 5,251 6,000 5200 7,300
Pulpwood 55,422 73,948 81,871 96,390 79,001 89,250 77,500 77,300
Fuelwood 28,280 27,118 20,326 20,000 14,120 5,200 3,700 13,500
Poles and Piling 168 204 252 75 150 -
Round Mining Timber 4,444 1,127 209 127 159
Fence Posts 99 98 94 60 42 10
Fence Rails 28 28 25 50 30 -
Miscellaneous Roundwood 127 141 120 - 57 150 200 600
Total 97,220 112,647 112,392 126,702 98,810 100,610 86,600 98,700
Product 1985 1986 1987 1988 1989 1990 1991 Quantity Reported or Estimated Logs and Bolts (THOUSANDS OF BOARD FEET) 32,500 40,000 43,000 50,500 52,000 39,500 50,000
Pulpwood (CORDS) 731,785 720,018 826.250 835,000 846.250 1,216,250 753,750
Fuelwood (CORDS) 246,250 195,000 175,000 145,000 136,250 196,250 321,250
Poles and Piling (THOUSANDS OF CUBIC FEET) - - -
Round Mining Timber (CORDS) Fence Posts (NUMBER)
Fence Rails (NUMBER) Miscellaneous Roundwood (THOUSANDS OF CUBIC F 300 200 400 300 500
Equivalent Volume in Merchantable Timber (Thousands of Cubic Feet)
Logs and Bolts 8,500 8,000 8,600 10,100 10,400 7,900 10,000
Pulpwood 62,200 61,200 66,100 66,800 67,700 97,300 60,300
Fuelwood 19,700 15,600 14,000 11.600 10,900 15,700 25,700
Poles and Piling
Round Mining Timber Fence Posts
Fence Rails - - -
Miscellaneous Roundwood 300 200 400 300 500
Total 88,700 85,000 89,100 88,700 89,500 98,200 96,000
Source: Statistics Canada, 25-201.

page 131
TABLE L-3 NUMBER OF SAWMILLS UCENCED AND SAWMILL PRODUCTION, NEWFOUNDLAND AND LABRADOR,
• FOR SELECTED YEARS, 1934 TO 1992/93
•
Production • Sawmills
Year Crovin Land Private Land Total Licenced (Thousands of Board Feet)
a •
•
•
a •
•
is • .
0 • •
•
O
•
a •
0
0 Source: Department of Forest Resources and Lands.
• 0 ID is is 0 • 0 0 0
1934 1939
14,655 30,866
1944 38,752 17,942 56,694 1949 27,975 18,286 46,261 1950 33,479 13,119 46,598 1955 1960
34,500 26,337
8,500 9,860
43,000 36,196
1,419 1,353
1965 18,369 7,871 26,240 1,128 1970 18,846 15,848 34,694 1,010 1971 18,946 12,269 31,215 1,006 1972 24,696 5,919 30,615 1,085 1973 36,114 13,029 49,143 1,310 1974 26,728 9,923 43,100 1,387 1975/76 25,599 2,984 28,583 1,385 1976/77 31,930 5,320 37,250 1,443 1977/78 38,867 3,633 42,500 1,468 1978/79 38,660 10,009 48,669 1,600 1979/80 36,717 12,084 48,802 1,703 1980/81 31,173 8,057 39,230 1,780 1981/82 26,730 6,650 33,381 1,741 1982/83 27,107 5,730 32,837 1,824 1983/84 30,406 7,399 37,805 1,839 1984/85 32,464 5,830 38,294 1,995 1985/86 35 ,150 9,160 44,309 2,013 1986/87 35,957 9,523 44,481 2,057 1987/88 37,612 11,122 48,734 2,087 1988/89 35,581 13,690 49,270 2,016 1989/90 34,934 13,385 48,318 1,945 1990/91 30,806 11,838 42,644 1,783 1991/92 29,039 9,721 38,760 1,771 1992/93 35,197 12,566 47,763 1,833

OS
SO
OS
SO
SO
SS
110
111
119
011
1111
1SS
IO
SS
MO
SIIII
SS
OO
OS
S
page 132
TABLE L-4 VOLUME AND ESTIMATED VALUE OF NEWSPRINT SHIPMENTS NEWFOUNDLAND AND LABRADOR 1970 TO 1993
Year Newsprint Shipments
Annual Average List Price
Annual Average Transaction Price
Annual Average Exchange Rates
Estimated Value of Newsprint Shipments
(tonnes) ($US per tonne) ($US per tonne) ($US to $Can) ($ Millions)
1970 619,081 1971 486,261 1972 526,872 1973 624,967 . 1974 571,487 1975 432,379 1976 465,826 1977 558,389 1978 561,436 1979 605,894 1980 589,326 1981 674,077 1982 619,049 494.75 456.75 1.2337 349 1983 576,356 484.25 475.00 1.2324 337 1984 646,306 517.50 510.00 1.2951 427 1985 599,701 535.00 505.00 1.3655 414 1986 613,139 543.75 516.88 1.3895 440 1987 660,168 590.00 555.00 1.3260 486 1988 646,388 650.00 605.75 1.2307 482 1989 644,152 650.00 564.33 1.1840 430 1990 630,408 670.42 556.04 1.1668 409 1991 635,989 693.33 537.08 1.1457 391 1992 666,587 685.00 433.33 1.2087 349 1993 703,881 685.00 461.25 1.2901 419
Newsprint prices are annual averages of list and transaction prices delivered in the eastern United States. The value shown is the product of the transaction price times the exchange rate times the tonnes shipped. The exchange rate used is the annual average of the monthly USA Noon Spot Rate (dollar) in Canadian dollars.
Source: Dept. of Forest Resources & Lands. Pulp and Paper Week Magazine, Statistics Canada.
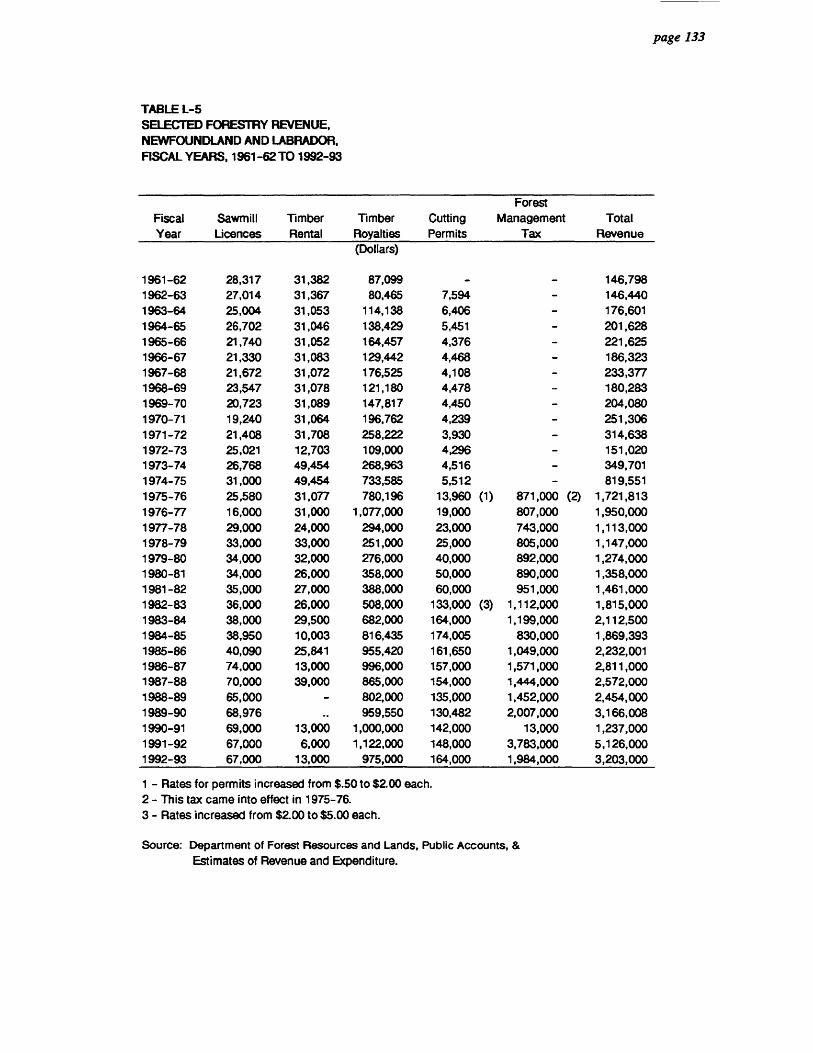
• • • • • • • • • • • • • I • • • • I • • • • • • • • • • • •
• • • • • • • • TABLE L-5 SELECTED FORESTRY REVENUE, NEWFOUNDLAND AND LABRADOR, FISCAL YEARS, 1961-62 TO 1992-93
page 133
Fiscal Year
Sawmill Licences
Timber Rental
Timber Royalties
Cutting Permits
Forest Management
Tax Total
Revenue (Dollars)
1%1-62 28,317 31,382 87,099 146,798 1962-63 27,014 31,367 80,465 7,594 - 146,440 1963-64 25,004 31,053 114,138 6,406 176,601 1964-65 26,702 31,046 138,429 5,451 201,628 1965-66 21,740 31,052 164,457 4,376 221,625 1966-67 21,330 31,083 129,442 4,468 - 186,323 1967-68 21,672 31,072 176,525 4,108 - 233,377 1968-69 23,547 31,078 121,180 4,478 180,283 1969-70 20,723 31,089 147,817 4,450 204,080 1970-71 19,240 31,064 196,762 4,239 - 251,306 1971-72 21,408 31,708 258,222 3,930 314,638 1972-73 25,021 12,703 109,000 4,296 151,020 1973-74 26,768 49,454 268,963 4,516 - 349,701 1974-75 31,000 49,454 733,585 5,512 - 819,551 1975-76 25,580 31,077 780,196 13,960 (1) 871,000 (2) 1,721,813 1976-77 16,000 31,000 1,077,000 19,000 807,000 1,950,000 1977-78 29,000 24,000 294,000 23,000 743,000 1,113,000 1978-79 33,000 33,000 251,000 25,000 805,000 1,147,000 1979-80 34,000 32,000 276,000 40,000 892,000 1,274,000 1980-81 34,000 26,000 358,000 50,000 890,000 1,358,000 1981-82 35,000 27,000 388,000 60,000 951,000 1,461,000 1982-83 36,000 26,000 508,000 133,000 (3) 1,112,000 1,815,000 1983-84 38,000 29,500 682,000 164,000 1,199,000 2,112,500 1984-85 38,950 10,003 816,435 174,005 830,000 1,869,393 1985-86 40,090 25,841 955,420 161,650 1,049,000 2,232,001 1986-87 74,000 13,000 996,000 157,000 1,571,000 2,811,000 1987-88 70,000 39,000 865,000 154,000 1,444,000 2,572,000 1988-89 65,000 - 802,000 135,000 1,452,000 2,454,000 1989-90 68,976 959,550 130,482 2,007,000 3,166,008 1990-91 69,000 13,000 1,000,000 142,000 13,000 1,237,000 1991-92 67,000 6,000 1,122,000 148,000 3,783,000 5,126,000 1992-93 67,000 13,000 975,000 164,000 1,984,000 3,203,000
1 - Rates for permits increased from $.50 to $2.00 each. 2 - This tax came into effect in 1975-76. 3 - Rates increased from $2.00 to $5.00 each.
Source: Department of Forest Resources and Lands, Public Accounts, & Estimates of Revenue and Expenditure.
• • • • • •

a a • • a a e al • 0 0 0 0 0 0 • • a al 0 0 0 • 0 al 0 al • 0 • e • 0 al • s 0 a so • • 0 0
SECTION M
MINING
ID II page 135
It IS II SECTION 'AP
ID III fib fib TABLE M-2
• Metallic Minerals
ID al Includes: Cadmium, copper, gold, iron ore, lead, silver and zinc.
• Non-Metallic Minerals 0 ID Includes: Asbestos, fluorspar, gypsum, quartz and pyrophyllite.
• Structural Materials • It Includes: Clay products, cement, sand and gravel, and stone.
• II TABLE M-3
lb Cost of Materials and Supplies. Fuel and Electricity ID O Generally, consumption of purchased items, only, at laid down cost. Includes, inter-
() company and intracompany transfers, contract work by others and fuels used by vehicles.
• Establishment. Mining 0 a Beginning with the 1%1 Census of Mines, Quarries and Oil Wells, the establishment is
defined as the smallest unit which is a separate operating entity capable of reporting all a the following: materials and supplies used goods purchased for resale as such; fuel and • power used; number of employees and their pay; man-hours; inventories; and shipments
lb or sales.
• Value Added 0 lb Net output as measured by gross output less purchased commodity input used and contract
II work by others.
ID a) Value added, mining activity: Value of shipments plus net change in inventory of
IIII goods and process and finished goods, less cost of materials and supplies used,
II fuel and electricity.
SSIIIII
SSIIII
IPO
SS
IMM
OO
SS
OO
SS
OO
SS
OS
SO
OM
OS
OO
page 136
b) Value added, total activity: Consists of (1) value added, mining activity and (2) value added, non-mining activity. The latter is calculated by subtracting relevant commodity inputs from non-mining revenues or outputs; these commodity inputs are net of the change in inventories of goods purchased for resale. Non-mining revenues includes depreciable fixed assets produced by own work force for own use, revenue from product rentals, etc. , but exclude non-operating revenue such as real property rentals, dividends and interest.

OS
OM
OO
OO
OM
OO
SO
OS
O0
11
e
IIM
OIM
O011
page 137
TABLE M-1 QUANTITIES AND VALUES OF MINERALS SHIPPED BY TYPE, NEWFOUNDLAND AND LABRADOR, 1949 TO 1993
Year
Cadmium Copper Gold Iron Ore
Quantity Value Quantity Value Quantity Value Quantity Value
(k9) (Dollars) (M.T.) (Dollars) (Grams) (Dollars) (M.T.) (Dollars)
1949 .. 3,281 1,444,837 288,267 333,684 1,504,011 7,947,914
1950 .. 2,922 1,508,910 287,832 352,115 1,060,993 5,851,488
1951 2,830 1,806,283 264,846 313,778 1,564,886 9,145,960
1962 2,684 1,68%079 267,334 294,551 1,500,373 8,668,192
1953 2,553 1,684,862 238,066 263,451 2,437,135 14,201,842
1964 3,158 2,029,876 203,044 222,409 3,409,677 21,749,304
1955 2,769 2,250,672 197,103 218,753 6,537,974 45,701,801
1956 2,820 2,574,274 255,453 282,938 7,878,023 55,620,755
1957 4,114 2,625,986 303,414 327,280 7,416,035 57,898,102
1958 13,382 7,499,372 416,196 454,686 4,890,429 38,226,828
1969 13,598 8,878,670 417,129 450,207 5,539,106 42,974,837
1980 12.576 8,398,362 420,364 458,834 6,904,914 54,673,717
1961 14,290 9,195,817 448,792 511,652 6,904,891 59,889,125
1962 15,702 10,731,154 434,391 522,468 7,245,803 67,753,153
1963 12,711 8,827,797 383,133 465,004 8,784,273 99,801,987
1964 12,351 9,095,013 519,957 631,067 11,578,920 137,038,680
1966 13,447 11,147,108 735,815 892,555 13,154,828 156,888,970
1966 17,594 17,415,394 798,333 967,903 15,010,450 188,803,269
1967 19,926 20,897,555 847,819 1,028,989 15,405,418 207,408,843 1968 21,136 22,413,551 242,700 294,251 17,876,362 246,608,466 1989 18,586 21,409,062 279,371 338,532 13,350,325 194,971,157
1970 13,783 17,839,532 211,848 249,010 21,372,715 292,582,028
1971 .. .. 12,682 14,762,654 228,331 259,480 19,846,442 289,912,168 1972 72,030 401,764 8,630 9,689,977 437,595 810,487 16,394,405 235,249.411
1973 23,813 191,093 7,844 11,031,913 446,179 1,397,375 22,133,101 314,838,803
1974 2,575 22,573 5,654 9,864,523 360,956 1,802,489 22,026,637 372,188,155
1975 4,923 37,041 7,501 10,541,388 404,096 2,127,843 22,585,445 488,800.400
1976 53,795 311,320 7,427 11,197,883 431,405 1,707,494 26,756,991 631,272,828
1977 75,557 524,708 9,119 13,972,817 447,786 2.261,453 26,658,063 742,132,236
1978 66,858 411,972 11,533 18,964,123 548,728 3,888,420 18,782,158 564,113,772 1979 70,000 497,652 8,223 19,495,298 396,000 4,579,857 30,220,000 963,943,018
1980 30,000 218,000 4,879 12,867,000 234,000 5,381,000 24,620,000 896,658.000 1981 16,000 78,000 5,154 11,404,000 209,000 3,707,000 25,886,000 886,843,000
1982 10,000 30,000 3,731 7,220,000 141,000 2,108,000 15,808,000 572,386,000 1983 2,000 6,000 0 0 - - 18,405,000 711,727,000 1964 - - 1,146 2,169,000 35,000 527,000 21,184,000 851,420,000 1986 - - - - - - 20,192,000 774,802,000 1988 - - - - - 19,184,000 761,328,000
1987 - - - x 7,092,000 18,423,000 880,526,000
1988 73,000 1,388,000 - - x x 20,507,000 895,759,000 1989 63,000 1,035,000 - - x x 20,862,000 722,527,000 1990 38,000 332,000 - - x x 18,989,000 708,387.000
1991 - - - - x x 19,799,000 714,885,000
1992 - - x x 17,692,000 645,333,000 1993p - - 350 881,000 x x 17,647,000 836,989,000

page 138
TABLE M-1 QUANTITIES AND VALUES OF MINERALS SHIPPED BY TYPE, NEWFOUNDLAND AND LABRADOR, 1949 TO 1993 - CONTINUED -
Year
Lead Silver Zinc Fluorspar
Quantity Value Quantity Value Quantity Value Quantity Value (M.T.) (Dollars) (k9) (Dollars) (11.T.) (Dollars) (M.T.) (Dollars)
1949 16,881 5,880,191 18,196 434,382 28,947 8,454,091 52,687 1,405,033 1960 16,255 5,178,320 17,901 485,138 27,705 9,558,647 50,435 1,290,361 1961 14,918 6,051,427 16,625 505,388 25,827 11,330,799 61,621 1,966,477 1962 16,383 5,847,571 19,860 533,295 27,685 10,656,475 73,739 2,484,943 1963 16,059 4,576,214 20,167 544,712 25,403 6,698,029 79,554 2,631,898 1964 16,807 4,939,054 23,082 817,867 27,217 7,188,595 107,107 2,948,896 1966 16,198 5,135,085 21,828 618,840 25,978 7,817,635 115,561 2,678,841 1966 20,673 7,068,813 29,770 858,350 31,461 10,293,055 126,825 3,355,061 1967 22,237 6,843,665 37,213 1,045,307 32,385 9,831,847 .. 1,662,802 1968 21,754 5,448,339 39,410 1,099,960 30,726 7,370,102 1,483,368 1969 20,373 4,765,328 34,995 987,822 28,734 7,753,838 1,749,903 1980 21,792 5,131,091 39,536 1,130,158 31,033 9,133,517 1,820,789 1961 19,929 4,485,938 36,617 1,079,376 31,423 8,722,020 1,961,800 1982 22,979 5,025,529 36,753 1,376,620 29,521 7,874,889 1,870,184 1963 21,221 5,146,264 30,513 1,367,711 31,284 8,814,473 1,976,006 1964 23,056 6,831,452 33,895 1,525,647 35,364 11,047,407 2,254,060 1985 19,882 6,793,882 33,809 1,521,7e9 32,828 10,928,579 2,677,443 1968 19,735 8,500,156 34,134 1,535,298 30,989 10,316,464 1,890,788 1967 18,089 5,583,296 33,379 1,858,701 31,616 10,099,901 2,097,391 1968 17,158 5,084,119 27,880 2,071,768 33,320 10,357,709 2,802,230 1969 20,145 6,737,575 31,870 1,977,553 29,849 10,022,171 3,036,931 1970 18,084 5,609,750 24,678 1.467,794 27,137 9,530,344 4,595,522 1971 12,230 3,639,735 17,530 879,222 24,342 6,970,821 2,819,091 1972 11,069 3,765,175 17,820 956,790 24,115 10,138,934 5,432,151 1973 7,680 2,725,614 17,820 1,447,191 7,888 4,199,158 4,620,382 1974 14,052 6,414,818 17,284 2,572,284 19,092 14,689,531 7,119,090 1975 5,219 2,331,396 13,841 2,005,188 32,198 26,619,174 - (1) 1976 12,886 6,435,294 17,994 2,486,483 42,498 35,251,008 2,934,996 1977 11,098 7,702,122 17,910 2,833,029 51,908 44,660,642 8,885,119 1978 8,888 7,214,909 16,378 3,249,513 47,715 38.561,788 6,685,119 (3) 1979 7,013 9,265,343 15,461 5,942,561 52,446 50,546,842 - 1980 4,537 4,729,000 9,000 7,185,000 44,073 42,801,000 1981 2,749 2,699,000 7,000 2,899,000 39,971 47,797,000 1982 1,180 855,000 3,000 928,000 28,139 30,194,000 1983 - - - 35,358 40,637,000 1984 4,845 3,580,000 7,000 2,502,000 42,820 59,967,000 1985 - - - - 32,730 41,043,000 1986 5,712 6.940,000 1987 7,643 9,737,000 x x 1988 x x 31,817 52,594,000 x x 1989 x x 27,362 58,882.000 x x 1990 x x 18,483 31,724,000 x x
1991 x x - - - - 1992 x x 1993p x x
SO
OS
SO
OO
OO
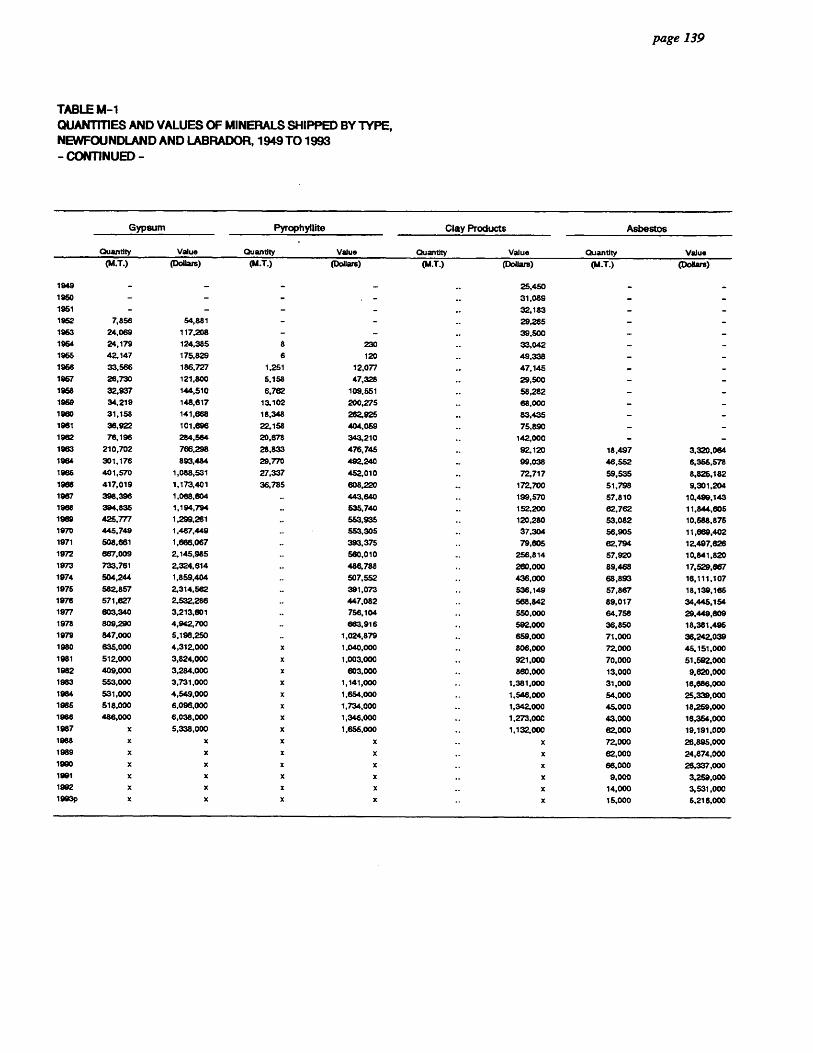
page 139
•
• TABLE M-1 QUANTITIES AND VALUES OF MINERALS SHIPPED BY TYPE, NEWFOUNDLAND AND LABRADOR, 1949 TO 1993
• - CONTINUED -
11111
• Gypsum PYroPhYllite Clay Products Asbestos
Quantity Value Quantity Value Quantity Value Quantity Value
1949 1950
1951
(M.T.)
-
-
-
(Dollars)
-
-
-
(M.T.)
-
-
(Dollars)
-
. -
-
(.T.) M (Dollars)
25,450
31,089
32,183
(M.T.)
-
-
(Dollars)
-
-
- 1952 7,856 54,881 - - 29,285 - -
24,069 117,208 - - 39,500 - - 1964 24,179 124,385 8 230 33,042 - -
42,147 175,829 6 120 48,338 - 1966 33,566 186,727 1,251 12,077 47,145 - -
26,730 121,800 5,158 47,328 29,500 - 1958 32,937 144,510 6,762 109,551 58,282 - 1969 34,219 148,617 13.102 200,275 68,000 - -
1960 31,158 141,668 18,348 262,925 83,435 - - 1961 36,922 101,696 22,158 404,059 75,890 - -
1962 76,196 284,564 20,678 343,210 142,000 - - 210,702 766,298 28,833 476,745 92,120 18,497 3,320,064
1964 301,176 893,484 29,770 492,240 99,038 48,552 6,365,578 1966 401,570 1,088,531 27,337 452,010 72,717 59,535 8,825,182
1966 417,019 1,173,401 36,785 608,220 172,700 51,798 9,301,204 1987 398,396 1,068,804 443,640 199,570 57,810 10,499,143 1988 394,835 1,194,794 535,740 152,200
82,762 11,844,605 1989 425,777 1,299,261 553.935 120,280 53,082 10,588,875 1970 445,749 1,487,449 553,305 37,304 56,905 11,669,402 1971 508,861 1,666,067 393,375 79,605 62,794 12,497,626 1972 667,009 2,145,985 560,010 256,814 57,920 10,841,820 1973
1974
733,751
504,244
2,324,614
1,859,404
486,788
507,552
280,000
436,000
89,468
68,893
17,529,667
16,111,107 1975
1976
582,857
571,627
2,314,562
2.532,286 .•
391,073
447,082
536,149
568,842
57,867
89,017
18,139,166
34,445,154 1977 803,340 3,213,801 756,104 550,000 64,758 29.449,809
809,290 4,942,700 663,916 592,000 36,850 18,381,496 1979 847,000 5,198,250 1,024,879 659,000 71,000 36,242,039
635,000 4,312,000 x 1,040,000 806,000 72,000 45,151,000 1981 512,000 3,824,000 x 1,003,000 921,000 70,000 51,692,000 1982 409,000 3,284,000 x 803,000 860,000 13,000 9,820,000 1983 553,000 3,731,000 x 1,141,000 1,381,000 31,000 16,686,000
531,000 4,54.9,000 x 1,654,000 1,546,000 54,000 25,339,000 1985 518,000 6,096,000 x 1,734,000 1,342,000 45,000 18,259,000 1986 486,000 6,038,000 x 1,34.6,000 1,273,000 43,000 16,364,000 1987 x 5,338,000 x 1,655,000 1,132,000 62,000 19,191,000
x x x x x 72,000 26,895,000 1989 x x x x x e2,000 24,874,000
x x x x x 66,000 26,337,000 1991 x x x x x 9,000 3,259,000 1992 x x x x x 14,000 3,531,000 1993p x x x x x 15,000 5,216,000

page 140
TABLE M-1 QUANTITIES AND VALUES OF MINERALS SHIPPED BY TYPE, NEWFOUNDLAND AND LABRADOR, 1949 TO 1993 - CONTINUED -
Year
Cement Sand and Gravel Stone Quartz
Quantity Value Quantity Value Quantity Value Quantity Value (14.T.) (Dollars) (M.T.) (Dollars) (M.T.) (Dollars) (M.T.) (Dollars)
1949 - 1,284,757 999,598 355,855 835,975 1960 1,469,085 780,315 426,060 787,228 1961 - - 1,346,218 648,346 423,147 792,319
1962 20,020 529,750 1,500,911 936,013 431,551 788,326
1953 62,842 1,345,073 1,731,078 1,023,622 355,283 647,469
1964 64,061 1,330,018 1,910,097 1,096,883 325,997 619,474
1956 74,303 1,492,990 2,850,579 1,680,984 302,983 595,655 •• 1966 76,115 1,660,300 2,259,416 1,886,320 297,505 604,094 1967 52,868 1,185,078 2,536,736 1,881,394 316,039 582,374
1968 46,259 1,079,071 3,685,878 1,484,160 256,224 536,535 1959 64,640 1,291,516 4,377,823 2,306,884 319,539 583,419
1983 84,513 1,688,664 3,549,390 3,069.395 345,495 644,588 1981 78,516 1,789,980 3,069,663 2,777,393 292,857 633,963 1962 87,921 1,985,524 3,856,390 3,504,594 206,572 445,091
1983 83,878 1,848,347 4,210,238 4,276,626 348,780 827,465 1964 82,058 1,883,743 4,225,428 3,501,894 258,872 553,553 1966 85,073 1,987,220 3,863,408 3,785,071 158,744 496,590 1968 67,643 1,632,982 3,285,340 3,584,261 138,799 318,000
1967 74,586 1,744,284 2,852.133 3,086,688 217,724 300,496
1968 .. 1,922,895 3,458,191 3,632,018 795,391 1,097,848 ..
1969 .. 1,896,229 3,589,750 3,742,412 172,301 338,703 95,152 263,261 1970 2,875,978 3,932,646 4,474,000 165,470 282,800 170,000 1971 2,932,090 5,047,576 5,827,000 185,148 577,021 215,653 1972 2,709,000 4,928,735 8,829,000 185,288 531,910 339,832 1973 3,659,981 5,866,180 8,370,503 357,713 971,537 383,443
1974 4,024,604 6,143,822 8,727,772 616,728 2,043,999 375,000 1976 4,678,129 6,236,797 9,587,488 878,842 2,889,457 160,000 1976 5,250,927 7,963,826 8,686,713 365,350 1,282,914 218,000 1977 5,175,483 4,467,459 7,022,954 616,779 2,205,701 - - (2) 1978 5,685,020 4,783,548 7,452,175 654,895 2,163,580 742,502
1979 6,784,000 8,962,000 15,708,513 1,262.000 2,922,962 1,710,233 1980 .. 6,415,000 3,279,000 8,086,000 948,000 2,688,000 636,000 1981 x 5,580,000 2,818,000 9,074,000 619,000 2,074,000 x 768,000 1982 x 6,321,000 2.839,000 9,317,000 357,000 1,763,000 x 1,213,000 1983 x 10,034,000 4,057,000 18,389,000 279,000 1,431,000 x 1,445,000 1984 x 7,675,000 3,123,000 11,637,000 558,000 3,329,000 x 2,138,000
1986 x 8,779,000 2,568,000 12,589,000 e00,000 3,192,000 x 1,584,000 1988 x 8,530,000 2,343,000 11,112,000 476,000 2.712,000 x 1,526,000
1987 x 9,722,000 3,319,000 16,451,000 931,000 8,535,000 x x 1988 x 10,791,000 5,374,000 19,446,000 1,127,000 7,488,000 x x
1989 x x 4,241,000 18,039,000 862,000 5,384,000 x x 1990 x x 3,016,000 14,456,000 1,501,000 9,952,000 x x 1991 x x 2,535,000 11,398,000 1,270,000 7,691,000 - -
1992 x x 3,537,000 17,610,000 1,000,000 4,758,000 - - 1993p x x 3,551,000 17,477,000 2,367,000 9.508,000 -
• - Tons 2000 lbs.
The value of production in this table and in Table f4-2 differs from the value of production in Table M-3. For the mostpart the difference is caused by the transfer of iron ore from Labrador
to Quebec for shipment to purchasers. In this table and in table M-2 the value added in Quebec and the transportation costs through Quebec are included whereas in Table M-3
these costs have been removed.
1 - Shipments of flourspar in 1975 were curtailed due to labour dispute.
2 - The needs of the ERCO plant for silica (Quartz) in 1977 were met from existing inventories. Production continued in 1978
3 - The fluospar mine at St. Lawrence closed in February 1978.
4 - Production values for Quartz have been Included in Sand and Gravel.
Additional Data: Iron Ore Shipments Monthly.
Source: Statistics Canada, 26-202.
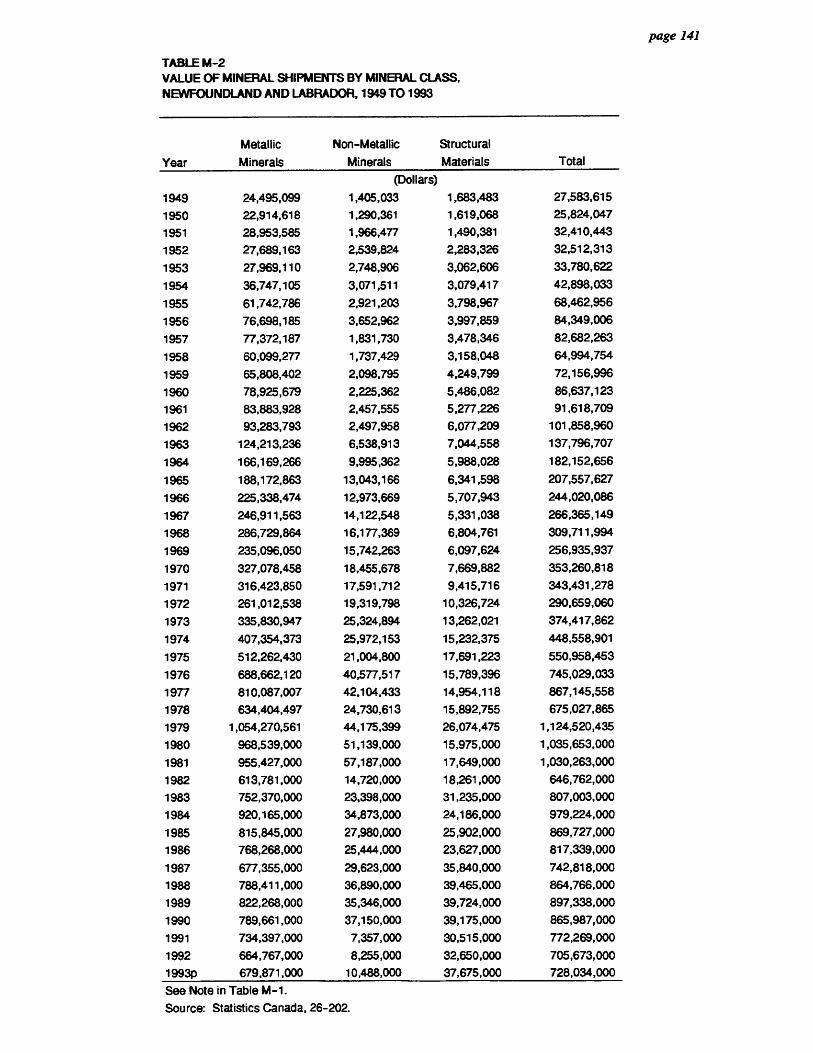
0
0 page 141
• TABLE M-2 VALUE OF MINERAL SHIPMENTS BY MINERAL CLASS,
• NEWFOUNDLAND AND LABRADOR, 1949 TO 1993
Year
Metallic
Minerals
Non-Metallic
Minerals
Structural
Materials Total
(Dollars)
1949 24,495,099 1,405,033 1,683,483 27,583,615
1950 22,914,618 1,290,361 1,619,068 25,824,047
1951 28,953,585 1,966,477 1,490,381 32,410,443
1952 27,689,163 2,539,824 2,283,326 32,512,313
1953 27,969,110 2,748,906 3,062,606 33,780,622
1954 36,747,105 3,071,511 3,079,417 42,898,033
1955 61,742,786 2,921,203 3,798,967 68,462,956
1956 76,698,185 3,652,962 3,997,859 84,349,006
1957 77,372,187 1,831,730 3,478,346 82,682,263
1958 60,099,277 1,737,429 3,158,048 64,994,754
1959 65,808,402 2,098,795 4,249,799 72,156,996
1960 78,925,679 2,225,362 5,486,082 86,637,123
1961 83,883,928 2,457,555 5,277,226 91,618,709
1962 93,283,793 2,497,958 6,077,209 101,858,960
1963 124,213,236 6,538,913 7,044,558 137,796,707
1964 166,169,266 9,995,362 5,988,028 182,152,656
1965 188,172,863 13,043,166 6,341,598 207,557,627
1966 225,338,474 12,973,669 5,707,943 244,020,086
1967 246,911,563 14,122,548 5,331,038 266,365,149
1968 286,729,864 16,177,369 6,804,761 309,711,994
1969 235,096,050 15,742,263 6,097,624 256,935,937
1970 327,078,458 18,455,678 7,669,882 353,260,818
1971 316,423,850 17,591,712 9,415,716 343,431,278
1972 261,012,538 19,319,798 10,326,724 290,659,060
1973 335,830,947 25,324,894 13,262,021 374,417,862
1974 407,354,373 25,972,153 15,232,375 448,558,901
1975 512,262,430 21,004,800 17,691,223 550,958,453
1976 688,662,120 40,577,517 15,789,396 745,029,033
1977 810,087,007 42,104,433 14,954,118 867,145,558
1978 634,404,497 24,730,613 15,892,755 675,027,865
1979 1,054,270,561 44,175,399 26,074,475 1,124,520,435
1980 968,539,000 51,139,000 15,975,000 1,035,653,000
1981 955,427,000 57,187,000 17,649,000 1,030,263,000
1982 613,781,000 14,720,000 18,261,000 646,762,000
1983 752,370,000 23,398,000 31,235,000 807,003,000
1984 920,165,000 34,873,000 24,186,000 979,224,000
1985 815,845,000 27,980,000 25,902,000 869,727,000
1986 768,268,000 25,444,000 23,627,000 817,339,000
1987 677,355,000 29,623,000 35,840,000 742,818,000
1988 788,411,000 36,890,000 39,465,000 864,766,000
1989 822,268,000 35,346,000 39,724,000 897,338,000
1990 789,661,000 37,150,000 39,175,000 865,987,000
1991 734,397,000 7,357,000 30,515,000 772,269,000
1992 664,767,000 8,255,000 32,650,000 705,673,000
1993p 679,871,000 10,488,000 37,675,000 728,034,000
• IIIII • III • • IIII • II II 4111 1111 . II GI • • • UP 1111 ID • IIII • II • • ft II • II • • • • ID • See Note in Table M-1.
• Source: Statistics Canada, 26-202.
II

• •
• • • • • • •
• • • • •
• • • • • • • • • • •
• • • • • • •
• • • • •
page 142
TABLE M-3 PRINCIPAL STATISTICS OF THE MINERAL INDUSTRIES (MINING ACTIVITY) NEWFOUNDLAND AND LABRADOR, 1961 TO 1991
Year Establishments Production &
Related Workers Salaries
& Wages
Cost of Fuel and
Electricity
Cost of Materials
& Supplies Value of
Production Value
Added (Number) (Number) ($'000) ($'000) ($1000) ($'000) ($'000)
1961 14 3,319 16,704 2,494 19,928 76,387 53,965 1962 16 3,049 16,103 3,536 22,487 80,222 54,199 1963 16 3,535 20,509 7,539 34,827 117,016 74,649 1964 14 3,906 23,618 11,610 40,372 147,362 95,380 1965 16 5,167 31,910 18,658 55,435 172,330 98,237 1966 15 4,645 33,093 19,179 69,673 206,313 117,461
1967 16 4,555 34,527 21,661 64,711 219,504 133,132 1968 14 4,589 38,067 19,224 89,572 269,798 161,002 1969 15 4,204 39,022 17,029 76,703 254,445 160,713 1970 13 4,577 41,347 19,435 87,103 292,774 186,235 1971 14 4,149 37,699 21,926 90,898 291,136 178,312 1972 13 3,859 37,151 18,915 97,900 247,578 130,763 1973 12 4,420 49,340 24,908 149,548 339,327 164,872 1974 11 5,270 64,631 32,777 194,031 437,860 211,052 1975 12 5,135 76,286 40,799 207,934 543,548 294,815 1976 12 5,176 83,796 45,730 257,729 688,020 384,560 1977 13 5,275 103,341 52,449 270,722 757,746 434,575 1978 11 3,640 80,002 45,026 223,302 601,581 333,253 1979 11 4,466 101,409 65,676 286,148 973,674 621,849 1980 11 4,295 100,806 69,596 328,719 961,271 562,955 1981 11 4,473 122,124 88,082 326,069 974,933 560,785 1982 11 3,128 85,661 65,323 210,564 663,870 387,983 1983 10 2,365 72,766 72,836 213,909 622,319 335,574
1984 11 2,475 82,038 89,798 238,851 771,200 442,551
1985 10 2,354 82,366 90,381 237,968 736,771 408,422 1986 13 2,146 81,846 71,300 152,045 553,831 330,486 1987 14 2,398 89,689 64,219 150,901 535,215 320,093 1988 14 2,666 113,383 68,036 207,487 655,067 379,544
1989 13 2,846 124,887 69,139 195,897 671,434 406,396 1990 13 2,857 136,348 69,008 192,252 640,415 379,154 1991 12 2,346 132,882 58,045 165,530 570,101 346,526
See Note in Table M-1. Additional Data: More Detail. Source: Statistics Canada, 26-201.
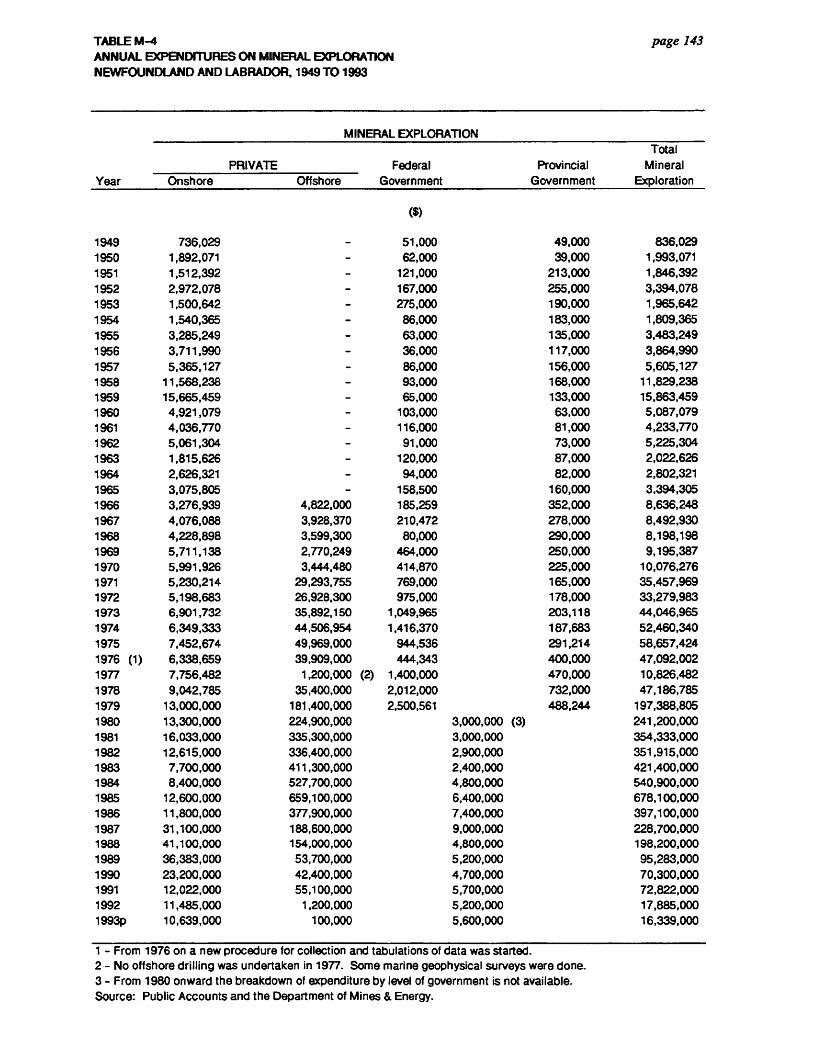
• TABLE M-4 page 143 ANNUAL EXPENDITURES ON MINERAL EXPLORATION NEWFOUNDLAND AND LABRADOR, 1949 TO 1993
SI •
fra MINERAL EXPLORATION Total
• PRIVATE Federal Provincial Mineral
41111 Year Onshore Offshore Government Government Exploration
• m
1949 736,029 - 51,000 49,000 836,029 1950 1,892,071 - 62,000 39,000 1,993,071 1951 1,512,392 - 121,000 213,000 1,846,392 1952 2,972,078 - 167,000 255,000 3,394,078 1953 1,500,642 - 275,000 190,000 1,965,642 1954 1,540,365 - 86,000 183,000 1,809,365 1955 3,285,249 - 63,000 135,000 3,483,249 1956 3,711,990 - 36,000 117,000 3,864,990 1957 5,365,127 - 86,000 156,000 5,605,127 1958 11,568,238 - 93,000 168,000 11,829,238 1959 15,665,459 - 65,000 133,000 15,863,459 1960 4,921,079 - 103,000 63,000 5,087,079 1961 4,036,770 - 116,000 81,000 4,233,770 1962 5,061,304 - 91,000 73,000 5,225,304 1963 1,815,626 - 120,000 87,000 2,022,626 1964 2,626,321 - 94,000 82,000 2,802,321 1965 3,075,805 - 158,500 160,000 3,394,305 1966 3,276,939 4,822,000 185,259 352,000 8,636,248 1967 1968
4,076,088 4,228,898
3,928,370 3,599,300
210,472 80,000
278,000 290,000
8,492,930 8,198,198
1969 5,711,138 2,770,249 464,000 250,000 9,195,387 1970 5,991,926 3,444,480 414,870 225,000 10,076,276 1971 5,230,214 29,293,755 769,000 165,000 35,457,969 1972 5,198,683 26,928,300 975,000 178,000 33,279,983 1973 6,901,732 35,892,150 1,049,965 203,118 44,046,965 1974 6,349,333 44,506,954 1,416,370 187,683 52,460,340 1975 7,452,674 49,969,000 944,536 291,214 58,657,424 1976 (1) 6,338,659 39,909,000 444,343 400,000 47,092,002 1977 7,756,482 1,200,000 (2) 1,400,000 470,000 10,826,482 1978 1979
9,042,785 13,000,000
35,400,000 181,400,000
2,012,000 2,500,561
732,000 488,244
47,186,785 197,388,805
1980 13,300,000 224,900,000 3,000,000 (3) 241,200,000 1981 16,033,000 335,300,000 3,000,000 354,333,000 1982 12,615,000 336,400,000 2,900,000 351,915,000 1983 7,700,000 411,300,000 2,400,000 421,400,000 1984 8,400,000 527,700,000 4,800,000 540,900,000 1985 12,600,000 659,100,000 6,400,000 678,100,000 1986 11,800,000 377,900,000 7,400,000 397,100,000 1987 31,100,000 188,600,000 9,000,000 228,700,000 1988 41,100,000 154,000,000 4,800,000 198,200,000 1989 1990
36,383,000 23,200,000
53,700,000 42,400,000
5,200,000 4,700,000
95,283,000 70,300,000
1991 12,022,000 55,100,000 5,700,000 72,822,000 1992 11,485,000 1,200,000 5,200,000 17,885,000 1993p 10,639,000 100,000 5,600,000 16,339,000
11111 1 - From 1976 on a new procedure for collection and tabulations of data was started. • 2 - No offshore drilling was undertaken in 1977. Some marine geophysical surveys were done. • 3 - From 1980 onward the breakdown of expenditure by level of government is not available.
Source: Public Accounts and the Department of Mines & Energy.
411 • • • 0
Ili 0
0 • 410 a 0 a • ill • • 0 • 0 • 1111 • 11) 0 • 0 • li
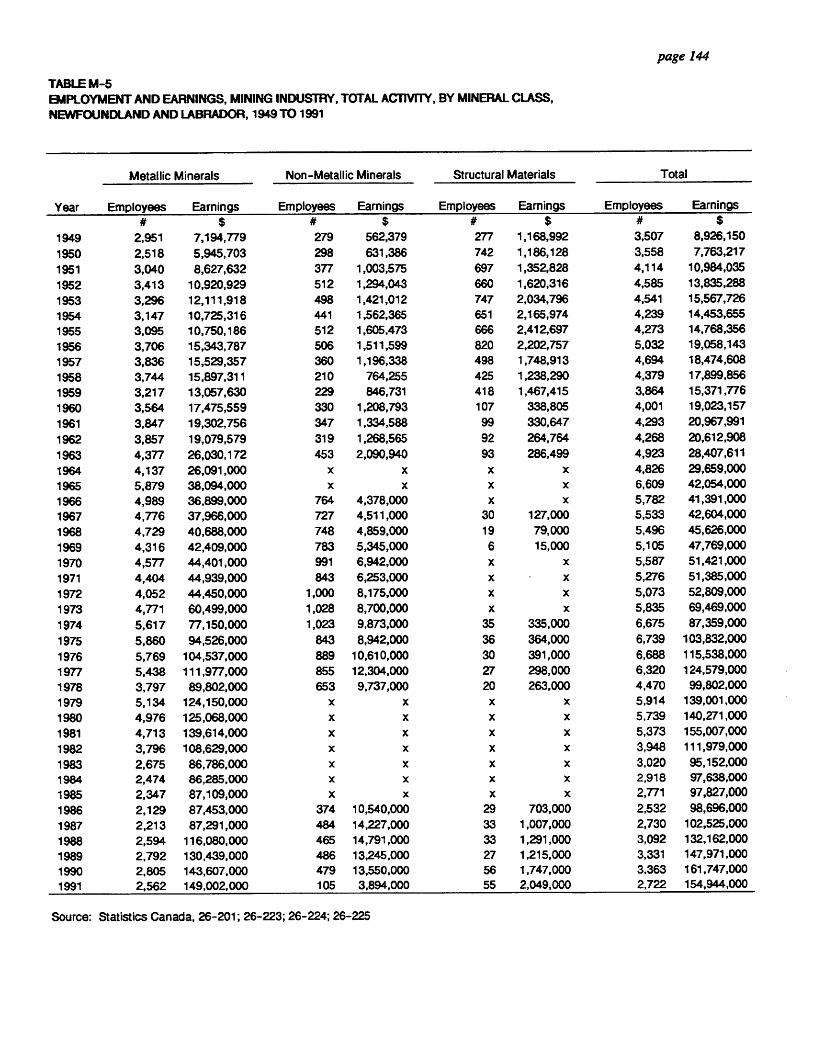
page 144
TABLE M-5 EMPLOYMENT AND EARNINGS, MINING INDUSTRY, TOTAL ACTIVITY, BY MINERAL CLASS, NEWFOUNDLAND AND LABRADOR, 1949 TO 1991
Year
Metallic Minerals Non-Metallic Minerals Structural Materials Total
Employees Earnings Employees Earnings Employees Earnings Employees Earnings
# $ # $ # $ # $
1949 2,951 7,194,779 279 562,379 277 1,168,992 3,507 8,926,150
1950 2,518 5,945,703 298 631,386 742 1,186,128 3,558 7,763,217
1951 3,040 8,627,632 377 1,003,575 697 1,352,828 4,114 10,984,035
1952 3,413 10,920,929 512 1,294,043 660 1,620,316 4,585 13,835,288
1953 3,296 12,111,918 498 1,421,012 747 2,034,796 4,541 15,567,726
1954 3,147 10,725,316 441 1,562,365 651 2,165,974 4,239 14,453,655
1955 3,095 10,750,186 512 1,605,473 666 2,412,697 4,273 14,768,356
1956 3,706 15,343,787 506 1,511,599 820 2,202,757 5,032 19,058,143
1957 3,836 15,529,357 360 1,196,338 498 1,748,913 4,694 18,474,608
1958 3,744 15,897,311 210 764,255 425 1,238,290 4,379 17,899,856
1959 3,217 13,057,630 229 846,731 418 1,467,415 3,864 15,371,776
1960 3,564 17,475,559 330 1,208,793 107 338,805 4,001 19,023,157
1961 3,847 19,302,756 347 1,334,588 99 330,647 4,293 20,967,991
1962 3,857 19,079,579 319 1,268,565 92 264,764 4,268 20,612,908
1963 4,377 26,030,172 453 2,090,940 93 286,499 4,923 28,407,611
1964 4,137 26,091,000 x x x x 4,826 29,659,000
1965 5,879 38,094,000 x x x x 6,609 42,054,000
1966 4,989 36,899,000 764 4,378,000 x x 5,782 41,391,000
1967 4,776 37,966,000 727 4,511,000 30 127,000 5,533 42,604,000
1968 4,729 40,688,000 748 4,859,000 19 79,000 5,496 45,626,000
1969 4,316 42,409,000 783 5,345,000 6 15,000 5,105 47,769,000
1970 4,577 44,401,000 991 6,942,000 x x 5,587 51,421,000
1971 4,404 44,939,000 843 6,253,000 x x 5,276 51,385,000
1972 4,052 44,450,000 1,000 8,175,000 x x 5,073 52,809,000
1973 4,771 60,499,000 1,028 8,700,000 x x 5,835 69,469,000
1974 5,617 77,150,000 1,023 9,873,000 35 335,000 6,675 87,359,000
1975 5,860 94,526,000 843 8,942,000 36 364,000 6,739 103,832,000
1976 5,769 104,537,000 889 10,610,000 30 391,000 6,688 115,538,000
1977 5,438 111,977,000 855 12,304,000 27 298,000 6,320 124,579,000
1978 3,797 89,802,000 653 9,737,000 20 263,000 4,470 99,802,000
1979 5,134 124,150,000 x x x x 5,914 139,001,000
1980 4,976 125,068,000 x x x x 5,739 140,271,000
1981 4,713 139,614,000 x x x x 5,373 155,007,000
1982 3,796 108,629,000 x x x x 3,948 111,979,000
1983 2,675 86,786,000 x x x x 3,020 95,152,000
1984 2,474 86,285,000 x x x x 2,918 97,638,000
1985 2,347 87 ,109,000 x x x x 2,771 97,827,000
1986 2,129 87,453,000 374 10,540,000 29 703,000 2,532 98,696,000
1987 2,213 87,291,000 484 14 ,227,000 33 1,007,000 2,730 102,525 ,000
1988 2,594 116,080,000 465 14,791,000 33 1,291,000 3,092 132,162,000
1989 2,792 130 ,439,000 486 13,245 ,000 27 1,215,000 3,331 147,971,000
1990 2,805 143,607,000 479 13,550,000 56 1,747,000 3,363 161,747,000
1991 2,562 149,002,000 105 3,894,000 55 2,049,000 2,722 154,944,000
Source: Statistics Canada, 26-201; 26-223; 26-224; 26-225

40
0O
SO
OM
O0
11
ielillO
OO
SO
OS
OS
IDSM
OS
OO
SO
OO
SII
SO
SECTION N
MANUFACTURING
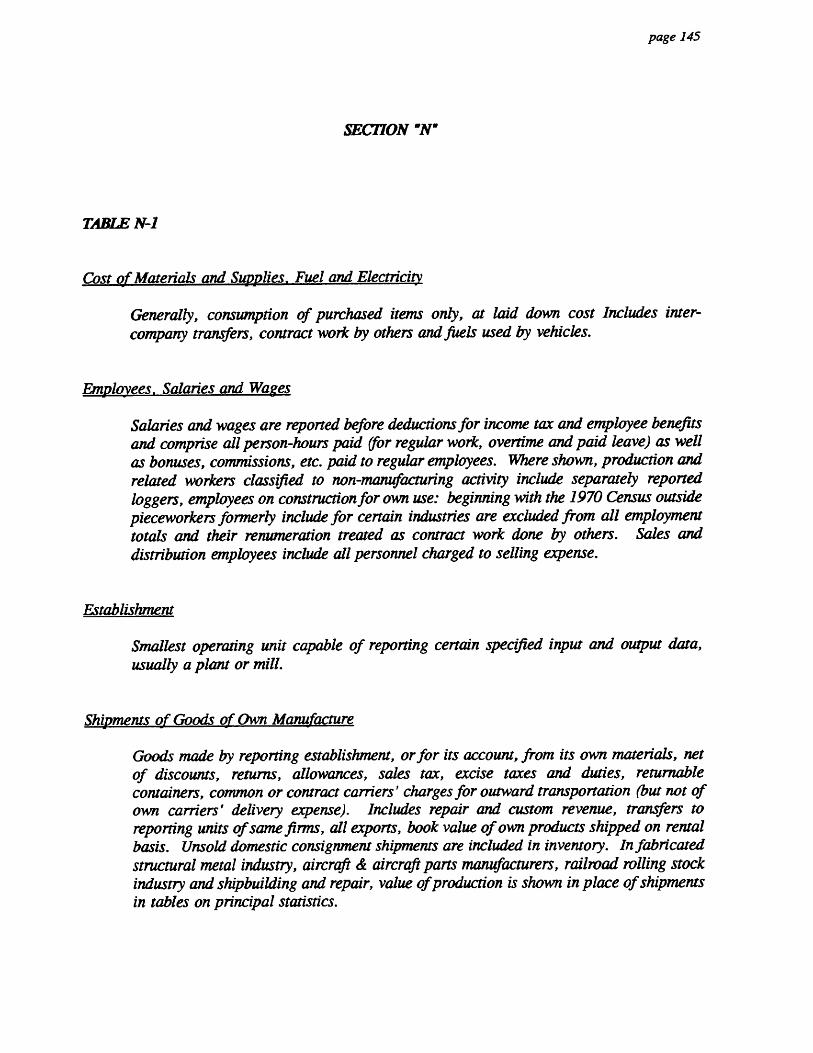
SO
OO
OO
MO
OS
OO
OO
OO
OS
OO
MO
SM
OO
MO
DO
SS
000
page 145
SECTION
TABLE N-1
Cost of Materials and Supplies. Fuel and Electricity
Generally, consumption of purchased items only, as laid down cost Includes inter-company transfers, contract work by others and fuels used by vehicles.
Employees. Salaries and Wages
Salaries and wages are reported before deductions for income tax and employee benefits and comprise all person-hours paid (for regular work, overtime and paid leave) as well as bonuses, commissions, etc. paid to regular employees. Where shown, production and related workers classified to non-manufacturing activity include separately reported loggers, employees on construction for own use: beginning with the 1970 Census outside pieceworkers formerly include for certain industries are excluded from all employment totals and their renumeration treated as contract work done by others. Sales and distribution employees include all personnel charged to selling expense.
Establishment
Smallest operating unit capable of reporting certain specified input and output data, usually a plant or mill.
Shipments of Goods of Own Manufacture
Goods made by reporting establishment, or for its account, from its own materials, net of discounts, returns, allowances, sales tax, excise taxes and duties, returnable containers, common or contract carriers' charges for outward transportation (but not of own carriers' delivery expense). Includes repair and custom revenue, transfers to reporting units of same firms, all exports, book value of own products shipped on rental basis. Unsold domestic consignment shipments are included in inventory. In fabricated structural metal industry, aircraft & aircraft parts manufacturers, railroad rolling stock industry and shipbuilding and repair, value of production is shown in place of shipments in tables on principal statistics.

page 146
Value Added
Net output as measured by gross output less purchased commodity input used and contract work by others.
a) Value added, manufacturing activity: Value of Shipments of goods of own manufacture plus net change in inventory of goods in process and finished goods, less cost of materials and supplies used, fuel and electricity.
b) Value added, total activity: Consists of (1) value added, manufacturing activity and (2) value added, non-manufacturing activity. The latter is calculated by subtracting relevant commodity inputs from non-manufacturing revenues or outputs; these commodity inputs are net of the change in inventories of goods purchased for resale. Non-manufacturing revenues includes depreciable fixed assets produced by own work force for own use, revenue from product rentals, etc. , but exclude non-operating revenue such as real property rentals, dividends interest.
TABLE N-2
See Table N-1
Food and Beverage Industries
includes: Meat and Poultry Products Industries; Fish Products Industries; Fruit and Vegetable Processing Industries; Dairy Products Industry; Flour and Breakfast Cereal Products Industry; Feed Industry; Bakery Products Industry; Miscellaneous Food Industries; and Beverage Industries. Due to changes in industry, classification, figures for 1987 to date include food industries only.
TABLE N-3
See Table N-1
Fish Products Industry
Includes: establishments primarily engaged in canning, filleting, freezing, curing or otherwise processing fish, molluscs or crustaceans. Establishments primarily engaged in the production offish meal or oil or marine oil, or in the harvesting and drying of marine vegetable products are also included.

page 147
0
0 TABLE N-4
See Table N-1 • 0
Wood Industries
• Includes: Sawmills, Planing Mills and Shingle Mills; Veneer and Plywood Mills; Sash, Door and other Millwork Plants; Wooden Box Factories; Coffin and Casket Industries; and Miscellaneous Wood Industries.
ED TABLE N-5
See Table N-1
0 41111 Sawmills and Planing Mills
Includes: establishments primarily engaged in sawing and planing lumber and those producing ties, spoolwood, lath and other mill products such as cooperage stock and box shooks from round wood.
lb TABLE N-6
• See Table N-1
ID • Pulp and Paper Mills
Includes: pulp mills producing chemical and mechanical pulp, and combined pulp and paper mills and paper mills manufacturing newsprint, book and writing paper, kraft paper, paper-board, and building and insulation board.
TABLE N-7 0
See Table N-1
0 Printing. Publishing and Allied Industries
Includes: Commercial Printing; Platemaldng; Typesetting and Trade Binder)? Industry; Publishing Only; and Publishing and Printing.
• • •

II e a III a al 0 0 0 • 0 al • 0 se 0 • 0 a 0 0 Is a • S o 0 a • • a 0 a S • • is al al • S a S
page 148
TABLE N-8
See Table N-1
Non-Metallic Mineral Products
Includes: Clay Products Manufacturers; Cement Manufacturers; Stone Product Manufacturers; Concrete Products Manufacturers; Ready-Mix Concrete Manufacturers; Glass and Glass products Manufacturers; Abrasives Manufacturers; Lime Manufacturers; and Miscellaneous Non-Metallic Mineral Products Industries.
TABLE N-9
See Table N-1
Metal Fabricating Industries
Metal Fabricating Industries (except Machinery and Transportation Equipment Industries) includes: Boiler and Plate Works; Fabricated Structural Metal Industry; Ornamental and Architectural Metal Industry; Wire and Wire Products Manufacturers; Hardware, Tool and Cutlery Manufacturers; Heating Equipment Manufacturers; Machine Shops; and Miscellaneous Metal Fabricating Industries.
TABLE N-10
See Table N-1
Chemicals and Chemical Products Industries
Includes: Manufacturers of Mixed Fertilizers; Manufacturers of Plastics and Synthetic Resins; Manufacturers of Pharmaceuticals and Medicines; Paint and Varnish Manufacturers; Manufacturers of Soap and Cleaning Compounds; Manufacturers of Toilet Preparations; Manufacturers of Industrial Chemicals; and Miscellaneous Chemical Industries.

111 1
OO
OS
OO
MO
SO
SO
OO
SO
SO
SO
OS
SO
MM
OS
OO
OO
OS
S
page 149
TABLE N-11
See Table N-I
Transportation Equipment Industries
Includes: Aircraft and Aircraft Parts Manufacturers; Motor Vehicle Manufacturers; Truck Body and Trailer Manufacturers; Motor Vehicle Parts and Accessories Manufacturers; Railroad Rolling Stock Industry,- Shipbuilding and Repair; Boatbuilding and Repair; and Miscellaneous Vehicle Manufacturers.
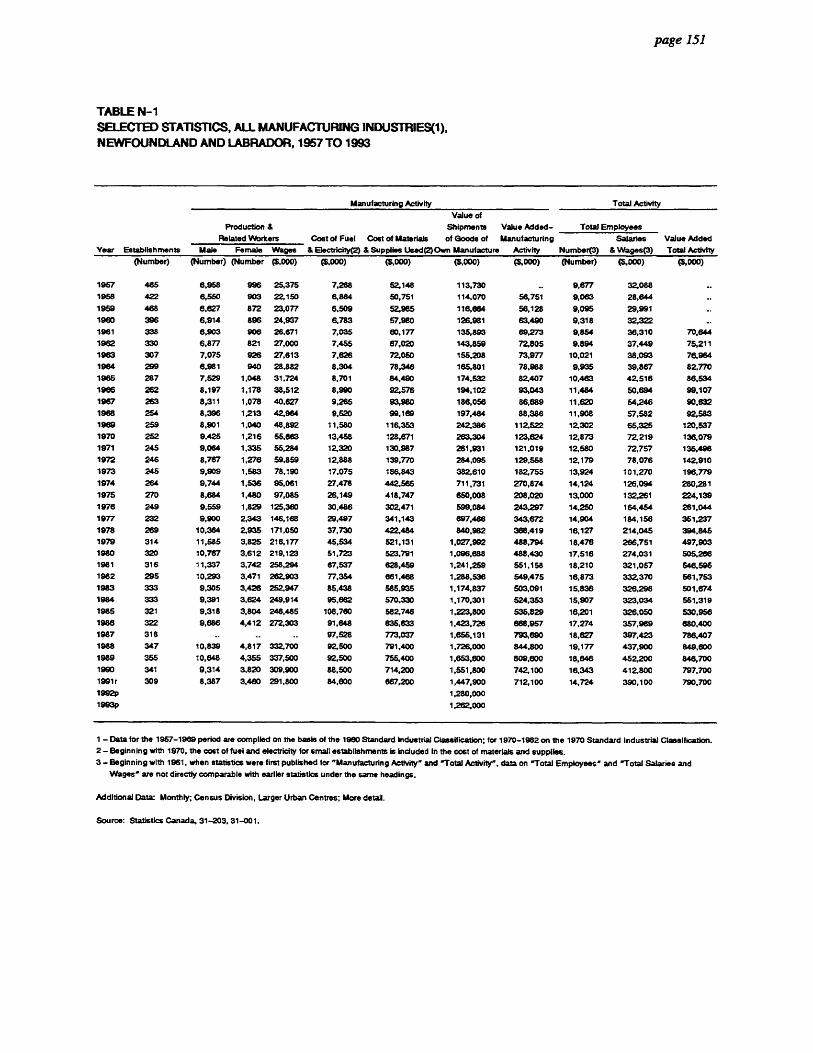
IIS
SO
SO
OS
OS
IIS
I II IIIS
SM
OS
SO
MM
OS
OS
SO
SS
OS
OO
S
page 151
TABLE N-1 SELECTED STATISTICS, ALL MANUFACTURING INDUSTRIES(1), NEWFOUNDLAND AND LABRADOR, 1957 TO 1993
Year Establishments
Manufacturing Activity Total Activity
Production &
Related Workers
Value of
Shipments
Cost of Fuel Cost of Materials of Goods of
& Electricity(2) & Supplies Used(2)Own Manufacture
Value Added-
Manufacturing
Activity
Total Employees
Value Added
Total Activity
Salaries
Number(3) & Wages(3) Male Female Wages
(Number) (Number) (Number ($,000) (3,000) (5,000) (3,000) (3,000) (Number) (3,000) (3,000)
1957 485 6,958 996 25,375 7,268 52,148 113,730 .. 9,677 32,088 1958 422 6,550 903 22,150 6,884 50,751 114,070 56,751 9,063 28,644 1959 468 6,627 872 23,077 6,509 52,985 116,684 56,128 9,095 29,991 1960 396 6,914 896 24,937 6,783 57,980 126,981 63,490 9,318 32,322 .. 1961 338 6,903 906 26,671 7,035 60,177 135,893 69,273 9,854 36,310 70,644 1962 330 6,877 821 27,000 7,455 67,020 143,859 72,805 9,894 37,449 75,211 1963 307 7,075 926 27,613 7,626 72,050 155,208 73,977 10,021 38,093 76,964 1964 299 6,981 940 28,882 8,304 78,346 165,801 78,988 9,935 39,867 82,770 1965 287 7,529 1,048 31,724 8,701 84,490 174,532 82,407 10,463 42,516 86,534 1966 262 8,197 1,178 38,512 8,990 92,576 194,102 93,043 11,484 50,694 99,107 1967 263 8,311 1,078 40,627 9,265 93,980 188,056 86,689 11,620 54,246 90,832 1968 254 8,396 1,213 42,964 9,520 99,169 197,464 88,386 11,908 57,582 92,583 1969 259 8,901 1,040 48,892 11,580 116,353 242,386 112,522 12,302 65,325 120,537 1970 252 9,425 1,216 55,663 13,458 128,671 283,304 123,624 12,873 72,219 136,079 1971 245 9,064 1,335 56,284 12,320 130,987 261,931 121,019 12,580 72,757 136,496
1972 246 8,767 1,276 59,859 12,888 139,770 284,095 129,558 12,179 78,076 142,910 1973 245 9,909 1,583 78,190 17,075 186,843 382,610 182,755 13,924 101,270 196,779 1974 264 9,744 1,536 95,061 27,478 442,565 711,731 270,874 14,124 126,094 280,281 1975 270 8,684 1,480 97,085 26,149 418,747 650,008 208,020 13,000 132,261 224,139
1976 249 9,559 1,829 125,360 30,486 302,471 599,084 243,297 14,250 164,454 281,044 1977 232 9,900 2,343 146,168 29,497 341,143 697,466 343,672 14,904 184,156 361,237 1978 269 10,384 2,935 171,050 37,730 422,484 840,982 368,419 16,127 214,045 394,846 1979 314 11,585 3,825 216,177 45,534 521,131 1,027,992 488,794 18,476 266,751 497,903 1980 320 10,767 3,612 219,123 51,723 523,791 1,096,688 488,430 17,516 274,031 505,266 1981 316 11,337 3,742 258,294 67,537 628,459 1,241,259 551,158 18,210 321,057 646,596 1982 295 10,293 3,471 262,903 77,354 861,468 1,288,536 549,475 16,873 332,370 561,753 1983 333 9,305 3,426 252,947 85,438 585,935 1,174,837 503,091 15,836 326,298 501,874 1984 333 9,391 3,624 249,914 95,682 570,330 1,170,301 524,353 15,907 323,034 551,319 1985 321 9,318 3,804 246,4.85 108,760 582,746 1,223,800 536,829 16,201 326,050 530,956 1986 322 9,686 4,412 272,303 91,648 835,633 1,423,726 868,957 17,274 357,969 680,400 1987 318 97,528 773,037 1,655,131 793,690 18,627 397,423 786,407 1988 347 10,839 4,817 332,700 92,500 791,400 1,726,000 844,800 19,177 437,900 849,600 1989 355 10,648 4,355 337,500 92,500 755,400 1,653,800 809,600 18,846 452,200 848,700 1990 341 9,314 3,820 309,900 88,500 714,200 1,551,800 742,100 16,343 412,800 797,700 1991r 309 8,387 3,480 291,800 84,600 667,200 1,447,900 712,100 14,724 390,100 790,700 1992p 1,280,000 1993p 1,262,000
1 - Data for the 1957-1989 period are complied on the basis of the 1960 Standard Industrial Classification; for 1970-1982 on the 1970 Standard Industrial Classification.
2 - Beginning with 1970, the cost of fuel and electricity for small establishments is Included In the cost of materials and supplies.
3 - Beginning with 1961, when statistics were first published for "Manufacturing Activity' and "Total Activity", data on 'Total Employees' and "Total Salaries and
Wages' are not directly comparable with earlier statistics under the same headings.
Additional Data: Monthly; Census Division, Larger Urban Centres; More detail.
Source: Statistics Canada, 31-203, 31-001.

Food Industries Only:
1987 126 .. .. .. 17,961 415,312 821,379 397,863 12,243 207,378 383,279
1938 136 5,842 4,449 172,800 17,000 408,900 799,700 371,500 12,140 220,700 376,700
1989 137 5,396 3,954 167,600 15,500 369,200 703,900 319,100 11,116 216,100 347,800
201,600 345,900 1990 134 4,894 3,486 156,600 15,200 377,400 896,800 304,100 9,998
369,900 1991r 123 4,112 3,134 142,200 14,900 352,600 657,200 298,800 8,707 184,700
1992p 528,000
1993p 462.000
page 152
TABLE N-2 SELECTED STATISTICS OF MANUFACTURING INDUSTRIES, TOTAL - FOOD AND BEVERAGE INDUSTRIES(1), NEWFOUNDLAND AND LABRADOR, 1957 TO 1993
Manufacturing Activity Total Activity
Value of
Production & Shipments Value Added- Total Employees
Related Workers Cost of Fuel Cost of Materials of Goods of Manufacturing Salaries Value Added
Year Establishment Male Female Wages & Electricity(2) & Supplies Used(2) Own Manufacture Activity Number(3) & Wages(3) Total Activity
(Number) (Number) (Number) (1,000) (1,000) (1,000) (3,000) (1,000) (Number) (1,000) (1,000)
1967 72 2,469 634 5,450 903 17,307 32,733 .. 3,545 7,174
1968 71 2,500 596 5,420 763 16,158 33,569 16,061 3,514 8,999
1959 71 2,443 835 5,553 846 17,725 34,769 16,238 3,506 7,246
1980 73 2,767 631 6,537 970 20,864 39,222 18,206 3,895 8,590 ..
1961 65 2,787 656 6,426 1,064 20,818 40,646 18,536 4,191 9,330 19,166
1962 73 2,731 640 6,775 1,089 23,964 44,776 20,495 4,231 10,095 21,521
1963 80 2,889 733 7,637 1,387 28,666 48,894 20,862 4,475 11,072 21,627
1964 90 2,925 710 8,080 1,336 30,511 66,171 23,115 4,480 11,766 24,438
1986 98 3,567 824 10,284 1,502 36,212 65,994 29,741 5,214 14,296 30,423
1966 94 3,863 964 12,166 1,578 37,431 69,920 32,805 6,720 16,679 34,017
1967 98 3,807 893 12,640 1,709 40,117 70,297 30,019 5,694 17,749 31,410
1968 96 4,108 1,064 15,009 2,128 43,243 81,415 34,606 8,197 20,580 36,902
1969 97 4,451 910 16,820 2,739 51,272 100,733 45,789 6,392 22,763 52,980
1970 98 4,736 1,077 19,100 2,781 54,019 106,861 50,458 6,762 25,114 67,660
1971 95 4,727 1,175 20,918 2,590 57,141 113,536 53,745 6,809 27,043 80,900
1972 93 4,429 1,119 21,702 3,181 67,179 116,018 56,610 6,456 28,266 62,613
1973 92 4,874 1,389 29,619 3,477 73,199 146,706 71,684 7,262 37,575 82,099
1974 101 4,141 1,370 32,432 5,511 78,799 148,696 68,000 6,596 42,509 74,186
1975 105 3,667 1,299 36,081 6,118 97,353 175,251 68,596 6,984 47,295 81,336
1976 103 4,624 1,662 54,936 6,903 128,083 233,175 100,805 7,451 88,592 114,928
1977 102 5,341 2,202 73,405 7,848 164,252 309,834 141,650 8,749 89,219 145,848
1978 109 5,750 2,745 88,225 9,734 202,109 369,259 186,737 9,845 106,940 171,162
1979 120 6,429 3,596 117,780 16,009 260,744 466,922 207,438 11,509 140,135 211,361
1980 127 5,637 3,386 113,287 17,969 269,758 482,278 176,671 10,620 138,761 190,790
1981 123 6,007 3,480 138,105 20,461 305,948 561,691 222,926 11,082 168,574 219,742
1962 115 5,283 3,244 135,780 17,143 325,632 593,384 248,677 10,115 168,376 262,362
1983 133 4,929 3,218 132,861 18,292 311,065 591,526 269,370 9,781 168,373 267,670
1984 126 5,251 3,395 134,636 17,375 303,212 595,785 269,982 10,195 169,126 310,871
1985 122 5,371 3,554 132,949 20,293 317,887 618,973 276,147 10,827 173,427 289,080
1986 128 5,781 4,412 154,967 19,433 361,861 747,708 367,075 11,783 374,406 374,406
1 - See Note 1, Table N-1
2 - See Note 2, Table N-1
3 - See Note 3, Table N-1
Additional Data See Table N-1
Source: Statistics Canada, 31-203, 31-001.
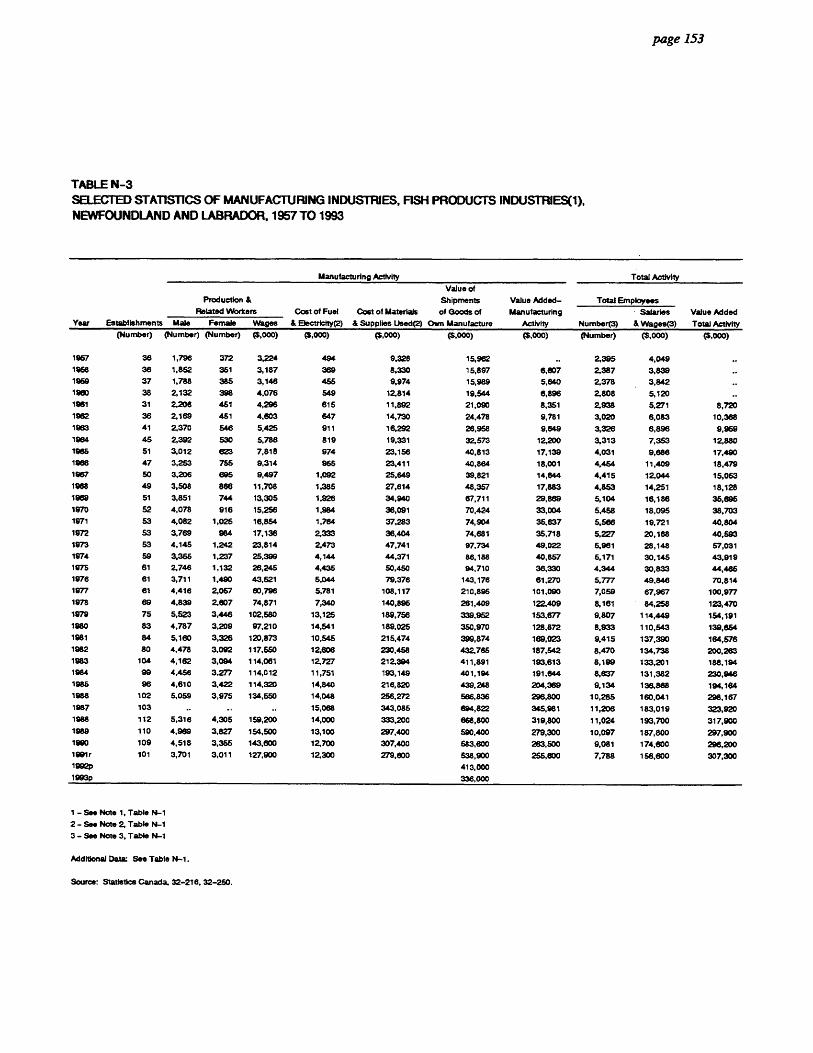
SO
OM
OO
OS
SO
MO
SS
OO
MO
SO
OS
O0
1111
1111
1 1•1
111
1 111
1101
1 page 153
TABLE N-3 SELECTED STATISTICS OF MANUFACTURING INDUSTRIES, FISH PRODUCTS INDUSTRIES(1), NEWFOUNDLAND AND LABRADOR, 1957 TO 1993
Year Establishments
Manufacturing Activity Total Activity
Production &
Related Workers Cost of Fuel
& Electrielty(2)
Value of
Shipments
Cost of Materials of Goods of
& Supplies Used(2) Own Manufacture
Value Added-
Manufacturing
Activity
Total Employees
Value Added
Total Activity
Salaries
Number(3) & Wages(3) Male Female Wages
(Number) (Number) (Number) (3,000) (3,000) (6,000) (3,000) (6,000) (Number) (3,000) (3,000)
1957 36 1,796 372 3,224 494 9,328 15,962 .. 2.395 4,049 1968 38 1,852 351 3,187 369 8,330 15,897 6,607 2,387 3,839 - 1969 37 1,788 385 3,148 456 9,974 15,989 5,840 2,378 3,842
1960 38 2,132 398 4,076 549 12,814 19,544 6,896 2,808 5,120 ..
1961 31 2,206 461 4,296 615 11,892 21,090 8,351 2,938 5,271 8,720
1962 36 2,169 451 4,603 647 14,730 24,478 9,781 3,020 6,083 10,368 1963 41 2,370 546 5,425 911 16,292 26,958 9,649 3,326 6,896 9,969 1964 45 2,392 530 5,786 819 19,331 32,573 12,200 3,313 7,353 12,880 1966 51 3,012 MG 7,818 974 23,156 40,813 17,139 4,031 9,886 17,490 1966 47 3,253 755 9,314 965 23,411 40,864 18,001 4,464 11,409 18,479
1967 50 3,206 695 9,497 1,092 25,649 39,821 14,644 4,415 12,044 15,063 1968 49 3,508 866 11,708 1,385 27,614 48,357 17,883 4,853 14,251 18,125
1969 51 3,851 744 13,305 1,926 34,940 67,711 29,869 5,104 16,186 36,696 1970 52 4,078 916 15,256 1,984 36,091 70,424 33,004 5,458 18,095 38,703 1971 53 4,082 1,025 16,854 1,764 37,283 74,904 35,637 6,566 19,721 40,804
1972 53 3,769 984 17,136 2,333 36,404 74,681 35,718 5.227 20,1e8 40,593
1973 53 4,145 1,242 23,814 2,473 47,741 97,734 49,022 6,961 28,148 67,031 1974 59 3,366 1,237 25,399 4,144 44,371 86,188 40,857 6,171 30,14.5 43,919 1975 61 2,746 1,132 26,246 4,436 50,450 94,710 36,330 4,344 30,833 44,466 1976 61 3,711 1,490 43,521 5,044 79,376 143,176 61,270 5,777 49,846 70,814 1977 61 4,416 2,067 60,796 5,781 108,117 210,896 101,090 7,059 67,967 100,977 1978 89 4,839 2,607 74,871 7,340 140,896 261,409 122,409 8,161 84,258 123,470 1979 75 5,523 3,446 102,580 13,125 189,756 339,962 153,677 9,807 114,449 154,191 1980 83 4,787 3,209 97,210 14,541 189,025 350,970 128,872 8,933 110,543 139,664 1981 84 5,160 3,326 120,873 10,545 215,474 399,874 169,023 9,415 137,390 164,576 1982 80 4,478 3,092 117,650 12,606 230,458 432,765 187,542 8,470 134,738 200,283 1983 104 4,182 3,094 114,081 12,727 212,394 411,891 193,613 8,199 133,201 188,194 1984 99 4,456 3,277 114,012 11,751 193,149 401,194 191,644 8,637 131,382 230,946 1986 96 4,610 3,422 114,320 14,840 216,820 439,248 204,3ee 9,134 136,868 194,164 1986 102 5,059 3,975 134,650 14,048 256,272 566,836 296,800 10,285 160,041 298,167 1987 103 .. .. 15,068 343,085 694,822 345,981 11,206 183,019 323,920 1988 112 5,316 4,305 159,200 14,000 333,200 668,800 319,800 11,024 193,700 317,900
1989 110 4,969 3,827 154,500 13,100 297,400 590,400 279,300 10,097 187,800 297,900 1990 109 4,518 3,355 143,800 12,700 307,400 583,600 283,500 9,081 174,600 296,200 1991r 101 3,701 3,011 127,900 12,300 279,800 538,900 255,800 7,788 156,800 307,300 1992p 413,000 1993p 338,000
1 - See Note 1, Table N-1
2 - See Note 2, Table N-1
3 - See Note 3, Table N-1
Additional Data. See Table N-1.
Source: Statistics Canada, 32-216, 32-250.
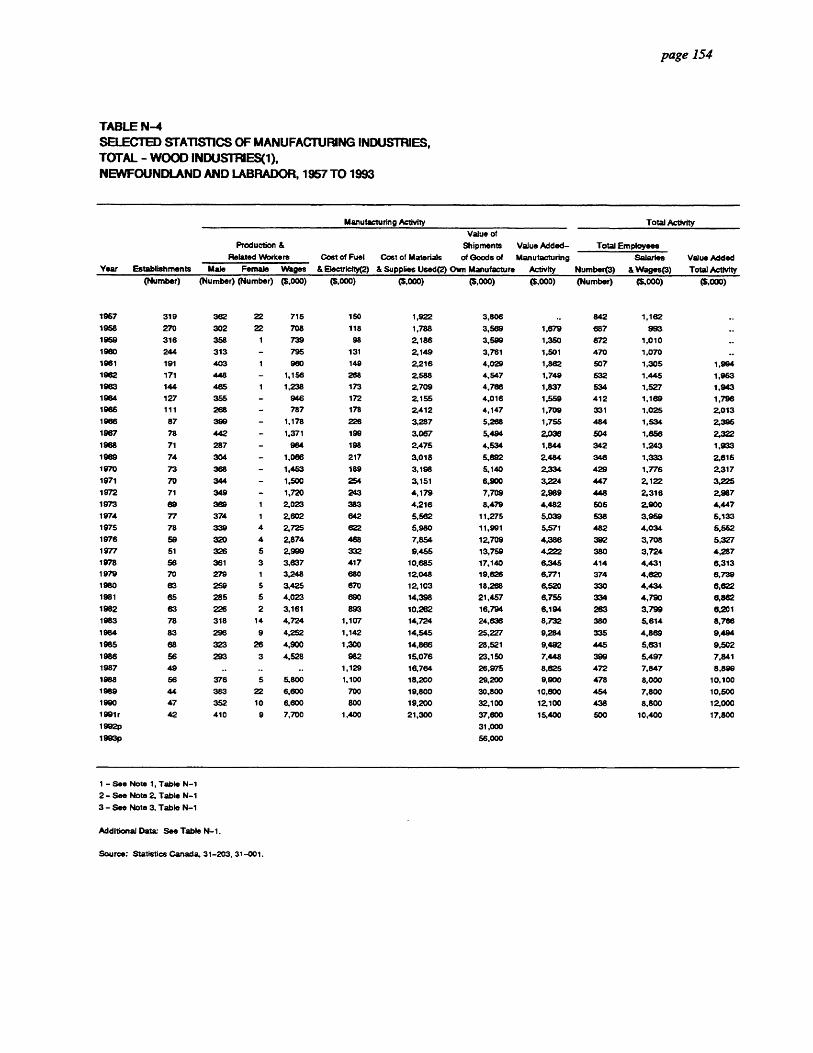
a
a a a a a a • a a a a
page 154
TABLE N-4 SELECTED STATISTICS OF MANUFACTURING INDUSTRIES, TOTAL - WOOD INDUSTRIES(1), NEWFOUNDLAND AND LABRADOR, 1957 TO 1993
Manufacturing Activity Total Activity Value of
Production & Shipments Value Added- Total Employees Related Workers Cost of Fuel Cost of Materials of Goods of Manufacturing Salaries Value Added
Year Establishments Male Female Wages & Electricity(2) & Supplies Used(2) Own Manufacture Activity Number(3) & Wages(3) Total Activity (Number) (Number) (Number) (3,000) (3,000) (3,000) (3,000) (3,000) (Number) (5,000) (3,000)
1967 319 362 22 715 150 1,922 3,806 .. 842 1,182 1958 270 302 22 708 118 1,788 3,569 1,679 687 993 .. 1969 316 358 1 739 98 2,186 3,599 1,350 672 1,010 1960 244 313 - 795 131 2,149 3,761 1,501 470 1,070 .. 1961 191 403 1 960 149 2,216 4,029 1,862 507 1,305 1,994 1962 171 448 - 1,156 268 2.588 4,547 1,749 532 1,445 1,963 1963 144 465 1 1,238 173 2,709 4,766 1,837 534 1,527 1,943 1964 127 355 - 946 172 2,155 4,016 1,559 412 1,169 1,796 1966 111 268 787 178 2,412 4,147 1,709 331 1,025 2,013 1966 87 399 - 1,178 228 3,287 5,268 1,755 484 1,534 2,395 1987 78 442 1,371 199 3,067 5,494 2,036 504 1,656 2.322 1968 71 287 964 198 2,475 4,534 1,844 342 1,243 1,933
1969 74 304 1,066 217 3,018 5,692 2,484 348 1,333 2,616
1970 73 368 - 1,463 189 3,198 5,140 2,334 429 1,776 2,317 1971 70 344 1,500 254 3,151 8,900 3,224 447 2.122 3,225 1972 71 349 - 1,720 243 4,179 7,709 2,989 448 2,316 2,987 1973 89 389 1 2,023 383 4,216 8,479 4,482 605 2,900 4,447 1974 77 374 1 2,802 642 5,562 11,275 5,039 538 3,959 5,133 1975 78 339 4 2,725 622 5,980 11,991 5,571 482 4,034 6,662 1976 59 320 4 2,874 468 7,854 12,709 4,386 392 3,708 5,327 1977 51 326 5 2,999 332 9,455 13,759 4,222 380 3,724 4,287 1978 58 361 3 3,837 417 10,685 17,140 6,345 414 4,431 8,313 1979 70 279 1 3,248 680 12,048 19,626 6,771 374 4,620 6,739 1980 63 259 5 3,425 670 12,103 18,288 8,520 330 4,434 0,622 1981 65 285 5 4,023 890 14,398 21,457 6,756 334 4,790 6,862 1982 63 226 2 3,161 893 10,262 16,794 6,104 263 3,799 6,201 1983 78 318 14 4,724 1,107 14,724 24,636 8,732 380 5,614 8,766 1984 83 296 9 4,252 1,142 14,545 25,227 9,284 335 4,889 9,494
1985 68 323 26 4,900 1,300 14,886 28,521 9,492 445 5,631 9,502
1986 56 293 3 4,528 982 15,076 23,150 7,448 399 5,497 7,841 1987 49 .. .. 1,129 16,764 26,975 8,625 472 7,847 8,899 1988 56 376 5 5,800 1,100 18,200 29,200 9,900 478 8,000 10,100
1989 44 383 22 6,600 700 19,800 30,800 10,600 454 7,800 10,500 1990 47 352 10 6,600 800 19,200 32,100 12,100 438 8,800 12,000 1991r 42 410 9 7,700 1,400 21,300 37,600 15,400 500 10,400 17,800 1992p 31,000
1993p 56,000
- See Note 1, Table N-1
2 - See Note 2, Table N-1
3 - See Note 3, Table N-1
Additional Data See Table N-1.
Source: Statistics Canada, 31-203, 31-001.

III
Year
III III 1967
1968
11111 1969 1960
ill 1961 1962
ID 1963 1964
III 1966 1986
III 1967 1968
III 1989 1970 1971
IP 1972 1973
III 1974 1976
III 1976 1977
III 1978 1979
III 1980 1981
III 1982 1983
III 1984 1985
0 1986 1987
0 1988 1989
0 1990 1991r
page 155
TABLE N-5 IN SELECTED STATISTICS OF MANUFACTURING INDUSTRIES
SAWMILLS AND PLANING MILLS(1),
1111 NEWFOUNDLAND AND LABRADOR, 1957 TO 1993
III Related Establishments
Production & Workers Cost of Fuel
& Bectricity(2) Male Female Wages
(Number) (Number)
277 120
234 84
278 132
210 66
162 197
143 179
117 178
100 129
87 124
68 173 58
50 227 84
67 113
56 212
55 180
56 136
55 201
65 162
66 153
48 142
42 171
44 201
56 121
48 90
47 x
48 x
57 198
62 191
50 207
40 176
30 ..
33 199
19 148 21
20 117 180
(Number)
- - - 1 - - - - - - - -
- - 1 1 3 4 4 2 1 4 x x 9 5
19 2
- - 1 1
(3,000)
184 163 178 130 482 460 474 331 333 475 704 261 362 789 745 610
1,058 1,119 1,133 1,053 1,353 1,860 1,197
989 x x
2,729 2,428 2,771 2,447
..
2,800 2,300 2,100 3,200
(3,000)
51 37 37 31 59 65 59 54 59 64 42 47 66 72
118 60
169 225 200
81 41 75
175 x x x
479 484 865 641 715 800 300 300 600
Value of Shipments Value Added- Total Employees
Cost of Materials of Goods of Manufacturing Salaries Value Added
& Supplies Used(2) Own Manufacture Activity Number(3) & Wages(3) Total Activity (3,000) (3,000) (3,000) (Number) (3,000) (3,000)
796 1,704 491 376 790 1,431
.. 800 370 206
820 1,489
1,280 632 383
162 281
707 542
220 .. 1,462 2,880
2,510 1,203 266 642
612 1,307
1,406 996 226 1,162 1,271 2.289
1,888 952 218 615
439 1,036
919 816 160 997 1,387 2,154
1,427 873 159 444
612 1,119
589 797 214 1,341 617 2,015 1,150 246 773 1,365 364 1,108 610 93 483 1,367 833 124
1,212 2,080 1,198 243 704 2,850 1,824 255 848 2,192 1,309 204
1,018 3,857 2,958 303 996 3,557 2,212 291
1,152 3,447 2,308 252 1,758 3,496 1,644 171 2,727 4,708 2,030 180 2,807 5,567 2,764 207 2,347 5,942 3,408 189 1,507 4,306 2,461 121
x x
4,913 4,201 5,184 5,726 5,480 5,800 6,200 6,300 7,800
x x
10,003 9,174
11,387 11,054 10,957 11,800 10,000 10,300 14,500
x x
4,771 4,504 5,300 4,599 4,857 5,100 3,500 3,800 6,300
x x
232 199 297 247 266 273 152 137 202
x x
3,154 2,505 2,999 2,685 4,229 4,400 2,400 2,500 3,700
x x
4,778 4,502 5,300 4,599 4,857 5,200 3,500 3,800 6,200
Manufacturing Activity Total Activity
296 634
403 970 913 1,190
1,163 1,839
977 1,334
1,659 2,940
2,083 2,312
1,873 2,300
1,258 1,632
1,418 2.040
1,723 2.765
1,789 3,408
1,324 2,482
UP 1992p 1993p
x x
III 1 - See Note 1, Table N-1 2 - See Note 2, Table N-1 3 - See Note 3, Table N-1
Additional Data See Table N-1.
• Source: Statistics Canada. 35-204.
0
•
•

page 156
TABLE N-6 SELECTED STATISTICS OF MANUFACTURING INDUSTRIES, PULP AND PAPER MILLS(1), NEWFOUNDLAND AND LABRADOR, 1957 TO 1993
Manufacturing Activity • Total Activity Value of
Production & Shipments Value Added- Total Employees
Related Workers Cost of Fuel Cost of Materials of Goods of Manufacturing Salaries Value Added- Yea Establishments Male Female Wages & Electricity(2) & Supplies Used(2) Own Manufacture Activity Number(3) & Wages(3) Total Activity
(Number) (Number) (Number) (5,000) (5,000) (3,000) (3,000) (5,000) (Number) (5,000) (3,000)
1967 2 2,958 22 15,307 5,597 27,829 83,303 .. 3,419 18,428 1968 2 2,531 22 12,019 5,355 26,736 81,003 29,702 2,971 15,098 1969 2 2,829 25 12,644 4,888 26,808 62,508 29,784 3,085 15,943 1960 2 2,832 23 13,449 5,038 28,774 67,986 34,503 3,082 16,859 .. 1981 2 2,648 24 15,236 5,171 29,893 73,725 39,225 3,305 19,808 39,369 1982 2 2,459 13 14,325 5,331 27,815 88,427 36,507 3,127 18,769 36,882 1963 2 2,439 12 13,864 5,271 27,876 70,436 36,502 2,988 18,015 36,731 1984 2 2,484 13 14,880 5,957 30,200 75,475 39,115 3,015 19,192 39,513
1966 2 2,508 13 15,525 5,923 30,819 74,115 37,680 2,970 19,394 37,802 1986 2 2,815 14 18,906 6,054 33,621 83,056 42,138 3,142 23,260 42,296 1967 2 2,628 14 19,749 6,259 32,040 73,387 36,348 3,152 24,405 38,554 1968 2 2,388 11 18,394 5,865 31,957 89,014 31,820 2,889 22,901 31,742
1989 2 2,283 11 20,182 5,872 32,507 74,361 35,041 2,747 24,904 35,175 1970 2 2,368 11 22,064 6,613 37,039 78,670 35,921 2,823 26,872 36,070 1971 2 2,127 11 19,847 5,253 29,402 84,943 31,655 2,568 24,757 31,782 1972 2 1,961 11 20,748 5,188 30,035 69,777 33,105 2,341 25,286 33,179 1973 3 2,580 10 29,434 8,764 60,394 119,959 54,308 3,151 36,645 Kew 1974 3 2,653 12 35,137 14,288 70,093 189,725 104,831 3,328 44,159 104,422 1975 3 2,287 12 31,821 13,426 59,498 146,880 73,736 2,903 41,121 73,898 1976 3 2,822 12 42,104 15,870 78,258 170,380 74,955 3,252 52,384 74,383 1977 2 2,218 12 41,486 12,996 x 202,451 2,624 48,047 x 1978 2 2,140 12 46,068 16,942 70,220 226,817 x 142,182 535 53,071 141,801 1979 2 2,188 12 x x x 261,945 161,984 2,611 x 161,075 1980 2 2,259 7 x x x 280,214 164,454 2,657 x 163,479 1981 3 2,539 6 x x x x 196,825 2,981 x 194,049 1982 3 2,398 6 x x x x 167,338 2,842 x 183,922 1983 3 x x x x x x 88,167 2,299 x 86,101 1984 3 1,816 - x x x x 121,111 2,202 x 119,810 1986 3 1,493 x x x x 123,329 1,936 x 123,584 1986 3 x x x x x x 139,296 1,941 x 141,700 1987 3 .. x x x 187,714 1,991 x 188,091 1988 3 x x x x x x 225,800 1,973 x 223,800 1989 3 1,596 1 x x x x 178,800 1,978 x 174,998 1990 3 1,431 1 x x x x 141,000 1,762 x 137,100 1991r 3 1,437 1 x x x x 118,700 1,771 x 116,400 1992p x 1993p x
1 - See Note 1, Table N-1 2 - See Note 2, Table N-1 3 - See Note 3, Table N-1
Additional Data: See Table N-1.
Source: Statistics Canada, 31-203, 36-204.

• page 157
0 • TABLE N-7
SELECTED STATISTICS OF MANUFACTURING INDUSTRIES TOTAL - PRINTING, PUBUSHING AND ALLIED INDUSTRIES(1)
fp NEWFOUNDLAND AND LABRADOR, 1957 TO 1993
0
•
Year
III III 1967
1968
0 1969
1980
1961
1982
0 1983
1964
0 1966
1988
al 1967
1968
1989
1111 1970
1971
1111 1972
1973
III 1974
1975
III 1976
1977
IIII 1978
1979
III 1980
1981
0 1982
1983
1. 1984
1986
a 1986
1987
0 1988
1989
a 1990
1991r
41,
1992p
1993p
Manufacturing Activity Total Activity
III Related
III Value
Production &
Workers Cost of Fuel
& Electricity(2)
Cost of Materials
& Supplies Used(2)
of
Shipments
of Goods of
Own Manufacture
Value Added-
Manufacturing
Activity
Total Employees
Value Added-Total Activity
Salaries
Number(3) & Wages(3) Establishments Male Female Wages
(Number) (Number)
25 210
27 208
28 211
28 199
28 206
27 216
27 223
24 213
23 227
25 226
26 224
26 233
26 239
25 242
20 x
22 x
24 225
23 189
22 195
19 185
17 183
23 x
24 x
24 282
28 274
26 x
35 211
35 181
33 199
39 270
35 ..
29
30
216
255
30
26
243
213
(Number)
48
38
39
37
40
36
32
36
54
43
38
39
27
50
x
x
73 67
67
60
52
x
x
67
94
x 61
72
84
119
..
134
146
130
116
(5,000)
731
724
749
708
798
851
880
898
1,039
1,085
1,157
1,262
1,369
1,540
x
x
2,094
2,006
2,366
2,625
2,733
x
x
4,804
6,082
x
4,945
4,627
5,652
7,979
..
7,800
9,600
9,300
9,100
(5,000)
62
65
85
66
70
70
69
75
77
81
84
95
112
72
x
x
71
105
119
125
157
x
x
203
x
x
300
327
345
341
337
300
400
400
400
($,000)
677
599
611
626
861
654
723
716
762
901
940
1,072
1,326
1,137
x
x
1,700
2,371
2,791
3,224
3,857
x
x
8,004
7,270
x
7,468
8,450
9,572
11,398
10,111
12,300
13,800
12,100
13,100
(3,000)
2,896
3,017
3,038
3,170
3,164
3,481
3,487
3,578
3,899
4,400
4,700
5,128
5,917
5,844
x
x
8,363
10,400
11,942
13,409
14,585
x
x
23,359
28,339
x
30,852
32,557
37,500
42,811
41,215
45,100
52,500
53,700
51,000
51,000
(3,000)
..
2,351
2,378
2,488
2,438 2,738
2,694
2,786
3,057
3,415
3,689
3,962
4,505
4,842
x
x
6,631
7,947
8.998
10,160
10,754
x
x
17,092
20,903
x
23,224
23,786
27,630
31,057
30,804
32,500
38,200
41,300
38,300 51,800
(Number)
419
412
418
407
421
421
429
436
448
465
455
504
530
482
x
x
423
448
4.54
4.48
445
x
x
567
595
x
527
493
491
606
655
755
733
680
576
(SAO
1,254
1,290
1,325
1,293
1,388
1,462
1,540
1,577
1,697
1,868
2,063
2,332
2,700
2,540
x
x
3,015
3,448
4,153
4,e8e
6,023
x
x
7,668
9,513
x
9,876
9,849
10,267
12,853
13,516
15,200
19,000
19,800
19,400
(5.000)
..
2,427
2,699
2,877
2,771
3,041
3,399
3,885
3,929
4,469
4,817
x
x
6,593
7,919
8,949
10,114
10,704
x
x
16,790
20,457
x
23,104
23,648
27,487
31,921
32,027
33,900
39,300
42,400
39,100
s 1-See Note 1, Table N-1
IIII 2 - See Note 2, Table N-1
3 - See Note 3, Table N-1
III 4- Excludes 'Publishing Only" for reasons of confidentiality.
III Additional Data See Table N-1.
0 Source: Statistics Canada, 31-203, 31-001.
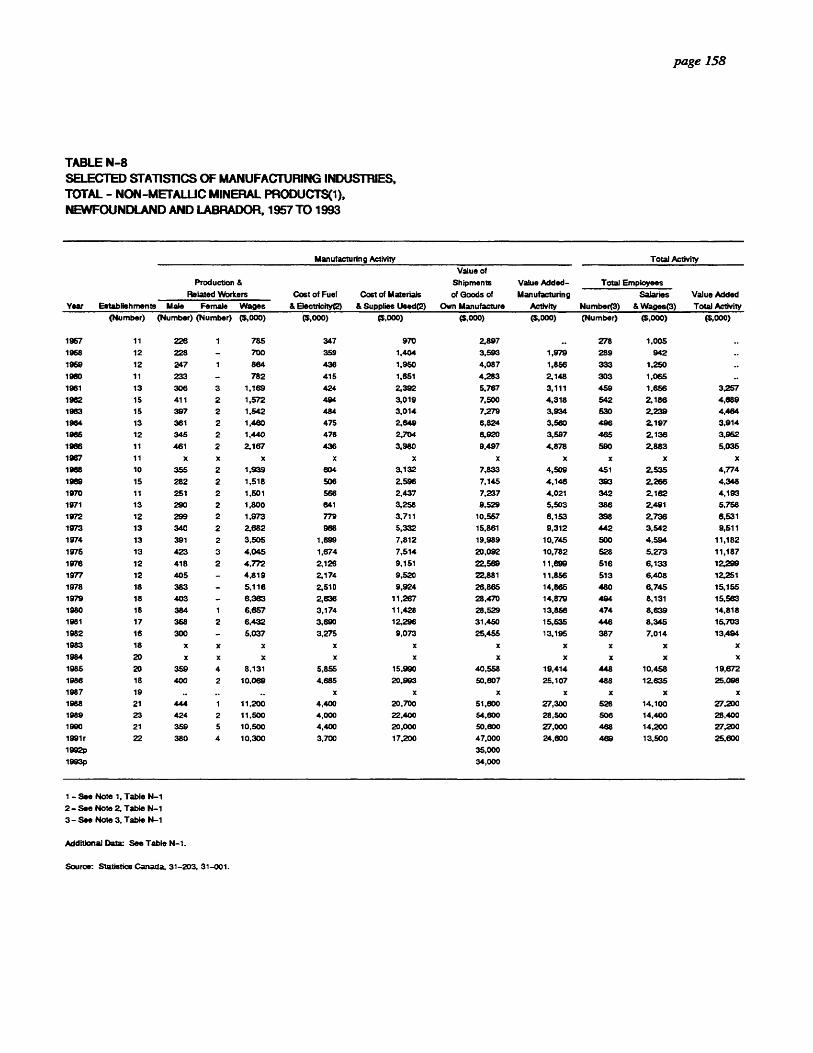
page 158
TABLE N-8 SELECTED STATISTICS OF MANUFACTURING INDUSTRIES, TOTAL - NON-METALLIC MINERAL PRODUCTS(1), NEWFOUNDLAND AND LABRADOR, 1957 TO 1993
Year
Manufacturing Activity Total Activity
Production &
Related Workers Cost of Fuel
& Beetricity(2)
Cost of Materials
& Supplies Used(2)
Value of
Shipments
of Goods of
Own Manufacture
Value Added-
Manufacturing
Activity
Total Employees
Value Added
Total Activity
Salaries
Number(3) & Wages(3) Establishments Male Female Wages
(Number) (Number) (Number) (6,000) (3,000) (3,000) (6,000) (5,000) (Number) (s,coo) (5,000)
1967 11 226 1 785 347 970 2,897 .. 278 1,005
1968 12 228 - 700 359 1,404 3,593 1,979 289 942
1969 12 247 1 884 436 1,950 4,087 1,856 333 1,250
1980 11 233 - 782 415 1,651 4,283 2,148 303 1,065 ..
1961 13 306 3 1,169 424 2,392 5,767 3,111 459 1,656 3,257
1962 15 411 2 1,572 494 3,019 7,500 4,318 542 2,186 4,889
1963 15 397 2 1,542 484 3,014 7,279 3,934 530 2,239 4,484
1984 13 361 2 1,480 475 2,649 6,824 3,580 496 2,197 3,914
1986 12 345 2 1,440 476 2,704 6,920 3,597 485 2,136 3,962
1988 11 461 2 2,167 436 3,980 9,497 4,878 590 2,883 5,035
1967 11 x x x x x x x x x x
1968 10 355 2 1,939 804 3,132 7,833 4,509 451 2,535 4,774
1989 15 282 2 1,518 506 2,598 7,145 4,148 393 2.286 4,348
1970 11 251 2 1,501 566 2,437 7,237 4,021 342 2,182 4,193
1971 13 290 2 1,800 641 3,258 9,529 5,503 386 2,491 5,768
1972 12 299 2 1,973 779 3,711 10,557 8,153 398 2,736 6,531
1973 13 340 2 2,682 988 5,332 15,861 9,312 442 3,542 9,511
1974 13 391 2 3,505 1,699 7,812 19,989 10.745 500 4,594 11,182
1975 13 423 3 4,045 1,674 7,514 20,092 10,782 528 5,273 11,187
1978 12 418 2 4,772 2,128 9,151 22,589 11,899 516 6,133 12,299
1977 12 405 - 4,819 2,174 9,520 22,881 11,856 513 6,408 12,251
1978 18 383 5,116 2,510 9,924 26,865 14.865 480 6,745 15,155
1979 18 403 - 8,383 2,636 11,267 28,470 14,879 494 8,131 15,583
1980 18 384 1 6,657 3,174 11,428 28,529 13,858 474 8,639 14,818
1981 17 358 2 6,432 3,690 12,296 31,450 15,535 448 8,345 15,703
1982 16 300 - 5,037 3,275 9,073 25,4.55 13,195 387 7,014 13,494
1983 18 x x x x x x x x x x
1964 20 x x x x x x x x x x
1985 20 359 4 8,131 5,855 15,990 40,558 19,414 448 10,458 19,672
1986 18 400 2 10,069 4,685 20,993 50,807 25,107 488 12,635 25,098
1987 19 .. .. x x x x x x x
1988 21 444 1 11,200 4,400 20,700 51,800 27,300 528 14,100 27,200
1989 23 424 2 11,500 4,000 22,400 54,600 28,500 506 14,400 28,400
1990 21 359 5 10,500 4,400 20,000 50,800 27,000 488 14,200 27,200
1991r 22 380 4 10,300 3,700 17,200 47,000 24,600 489 13,500 25,800
1992p 35,000
1993p 34,000
1 - See Note 1, Table N-1
2 - See Note 2, Table N-1
3 - See Note 3, Table N-1
Additional Data See Table N-1.
Source: Statistics Canada, 31-203, 31-001.

4111 page 159
•
• • TABLE N-9
SELECTED STATISTICS OF MANUFACTURING INDUSTRIES, METAL FABRICATING INDUSTRIES(1), NEWFOUNDLAND AND LABRADOR, 1967 TO 1993
ID 0 1111 1111 SI Year
0 1967
1968
41111 1989
1970
II 1971
1972
III 1973
1974
GI 1976
1976
III 1977
1978
GI 1979
1980
411 1961
1982
III 1963
1984
411 1985
1988
IIII 1967
1988
4111 1969
1990
11111 1991r
1992p
1993p
41111
Establishments
Manufacturing Activity Total Activity
Production &
Related Workers Cost of Fuel
& Electricity(2)
Cost of Materials
& Supplies Used(2)
Shipments
of Goods of
Own Manufacture
Value Added-
Manufacturing
Activity
Value of
Total Employees Total Employees
Value Added
Total Activity Number(3)
Salaries
& Wages(3) Male Female Wages
(Number) (Number)
12 265
12 365
10 350
9 276
10 294
10 339
11 476
10 383
10 347
14 321
13 x
19 367
23 298
23 315
20 258
17 312
18 285
17 184
21
23
193
188
24
26 292
29 458
27 380
24 273
(Number)
4
4
5
7
8 10
19
15
12
10
x
13
13
9
13
7
8
12
10
17
..
12
27
4
13
(3,000)
1,211
1,942
1,822
1,785
2.238
2,456
3,775
4,094
4,414
4,437
x
5,930
5,502
6.990
5,547
7,566
8,453
4,316
4,705
.. 6,400
10,800
10,200
7,700
4,8 .88
(3,000)
61
86
84
86
118
131
127
181
238
223
x
300
411
462
374
738
672
368
449
405
410
500
700
500
400
($,000)
2,601
3,523
3,757
2,870
3,149
3,415
4,514
5,613
6,184
5,714
x
7,415
11,500
12,261
10,623
12,284
9,361
6,241
9,287
10,347
10,677
12,300
19,700
20,500
13,600
(6,000)
5,134
7,210
7,310
6,667
7,539
8,009
10,852
13,138
14,209
13,245
16,000
18,053
24,534
26,400
23,793
34,340
25,575
16,216
19,041
19,448
22,991
25,000
37,100
40,200
25,900
19,000
19,000
(6,000)
2,518
3,638
3,528
3,598
4,428
4,431
6,458
7,612
8,257
7,017
x
10.303
2.883
13,405
12,853
21,283
15,241
8,556
9,241
8,647
11,898
12,900
16,400
20,000
12,000
(Number)
348
454
438
356
379
425
579
482
440
424
x
485
421
408
323
404
367
237
233
248
285
342
538
466
327
(6,000)
1,650
2,499
2,387
2.357
2,900
3,098
4,526
5,057
5,538
5,794
x
7,598
7,450
7,582
6.593
9,846
10,341
5,923
5,205
5,713
6,318
7,300
12,400
12,700
9,000
(3,000)
2,698
3,800
3,660
3,850
5,075
5,044
7,128
9,066
9,731
8,211
x
11,462
13,695
14,210
13,826
22,082
16,021
9,416
9,519
8,802
12,139
13,800
16,500
20,300
12,300
1 - See Note 1, Table N-1
2 - See Note 2, Table N-1
• 3 - See Note 3, Table N-1
4 - Estimated by Nfld. Statistics Agency.
Additional Data See Table N-1
Source: Statistics Canada, 31-203, 31-001.
•
• • • • • • • • • •

• • • • • • • • • • • • • • • • • • • • • • • • • • • • • • • • • • • • • • • • • • •
page 160
TABLE N-10 SELECTED STATISTICS OF MANUFACTURING INDUSTRIES, CHEMICALS AND CHEMICAL PRODUCTS INDUSTRIES(1), NEWFOUNDLAND AND LABRADOR, 1967 TO 1993
Year Establishments
Manufacturing Activity Total Activity
Production &
Related Workers Cost of Fuel
& Electricity(2)
Cost of Materials
& Supplies Used(2)
Value of
Shipments
of Goode of
Own Manufacture
Value Added-
Manufacturing
Activity
Total Employees
Value Added
Total Activity
Salaries
Number(3) & Wages(3) Male Female Wages
(Number) (Number) (Number) (8,000) (5,000) (8,000) (6,000) (8,000) (Number) (3,000) (3,000)
1967 3 x x x x x x x x x x
1968 4 x x x x x x x x x x
1989 5 401 10 2,871 1,582 7,001 19,210 10,590 547 4,039 9,832
1970 6 613 5 4,453 2,404 9,706 25,730 13,978 789 5,790 16,948
1971 6 510 8 3,517 2,689 10,244 23,136 10,482 703 5,283 15,301
1972 6 477 6 4,634 2,650 11,642 23,819 10,105 691 6,737 14,818
1973 5 432 5 3,890 2,967 13,681 35,204 17,474 667 6,323 19,628
1974 6 480 7 4,286 3,747 15,655 36,849 17,258 731 7,421 18,492
1976 5 423 6 4,526 2,462 14,750 16,309 572 639 7,420 1,596
1976 5 400 7 5,347 4,074 24,673 46,817 16,809 635 9,190 12,666
1977 5 434 4 6,719 4,344 31,181 59,346 24,076 684 11,059 25,872
1978 7 392 6 6,879 5,065 46,176 57,261 6,773 646 11,204 7,819
1979 7 488 4 9,005 4,814 39,994 58,461 17,818 709 12,971 22,336
1980 8 360 2 7,907 4,947 43,023 85,564 40,489 582 12,364 42,572
1981 5 381 6 9,956 6,454 40,165 66,613 20,968 610 15,085 21,969
1982 4 x x x x x x x x x x
1983 4 x x x x x x x x x x
1984 4 x x x x x 88,000 a x x x x
1985 4 x x x x x 103,000 e x x x x
1986 4 x x x x x 95,000 e x x x x
1967 4 .. .. .. 12,880 45,801 87,538 27,732 398 16,025 32,660
1988 5 265 10 10,700 13,800 44,700 90,500 32,100 369 15,900 33,800
1989 5 260 12 8,800 9,200 30,300 103,800 60,400 358 13,600 66,200
1990 3 34 3 1,100 300 5,700 15,400 9,800 77 2,400 18,000
1991r 3 27 3 1,000 200 4,800 13,500 8,800 66 2,300 11,400
1992p 15,000
1993p 15,000
1 -See Note 1, Table N-1
2 - See Note 2, Table N-1
3 - See Note 3, Table N-1
Additional Data See Table N-1
Source: Statistics Canada, 31-203, 31-001.

a • page 161
•
•
0 TABLE N-11
• SELECTED STATISTICS OF MANUFACTURING INDUSTRIES,
IIII TOTAL - TRANSPORTATION EQUIPMENT INDUSTRIES(1), NEWFOUNDLAND AND LABRADOR, 1957 TO 1993
ID
III III Year
IIIII 1967
1968
0 1969
1960
1961
III 1962
1963
III 1964
1966
IIII 1986
1967
III 1968
1969
III 1970
1971
ID 1972
1973
III 1974
1975
III 1976
1977
III 1978
1979
1111 1980
1961
IIIIII 1982
1983
1984 III 1985
1986
III 1987
1988
III 1989
1990
• 1991r
1992p
III 1993p
III
Establishments Male
III Manufacturing Activity Total Activity
Production &
Value of
& Electricity(2)Supplies & Used(2) Own Manufacture
Related Workers Cost of Fuel Cost of Materials of Goods of Manufacturing Salaries Value Added
Shipments Value Added- Total Employees
Activity Number(3) & Wages(3) Total Activity Female Wages
III(Number) (Number) (Number) (6,000) (1,000) (5,000) (1,000) (5,000) (Number) (1,000) (6,000)
4 x x x x x x x x x x
$ x x x x x x x x x x
5 x x x x x x x x x x
5 x x x x x x x x x x
3 x x x x x x x x x x
2 x x x x x x x x x x
3 89 - 185 3 126 354 224 75 209 224
3 57 159 6 129 350 216 64 187 216
3 47 152 5 137 340 198 51 174 198
5 34 - 99 6 181 438 255 39 118 255
e 9
7
7
7
9
10 9
10
10
10
12
18
17
18
15
10
10
14
14
12
16
20
19
15
x
x
x
x
x
x
x x
405
394
436
x
x
924
889
837
x
x
x
x
x
x
x
x
x
x
x
x
x
x
x
x x
5
-
-
x
x
3
3
-
x
x
x
x
x
x
x
x
x
x
x
x
x
x
x
x x
3,693
4,853
5,800
x
x
17,344
18,384
19,912
x
x
x
x
x
x
x
x
x
x
x
x
x
x
x
x
x
337
313
355
x
x
x
842
1,0x
x
x
x
x
x
x
x
x
x
x
x
x
x
x
x
x
6,725
9,074
11,173
x
x
20,716
16,810
29,771
x
x
x
x
x
x
x
x
x
x
x
x
x
x
x
x
x
15,447
19,153
10,436
x
x
51,961
54,382
63,371
x
x
x
x
x
x
x
x
x
x
x
x
x
x
x
x
x
x
x
8,313
9,771
8,463
x
x
28,029
33,938
34.066
x
x
x
x
x
x
x
x
x
x
x
x
x
x
x
x
x
519
501
556
x
x
1,141
1,091
1,005
x
x
x
x
x
x
x
x
x
x
x
x
x
x
x
x
x
6,124
6,510
7,798
x
x
22,331
23,682
25,200 x
x
x
x
x
x
x
x
x
x
x
x
x
x
x
x
x
8,301
9,767
8,507
x
x
27,867 33,182
33,667
x
x
x
x
x
x
x
x
x
1 - See Note 1, Table N-1
111 2 - See Note 2, Table N-1
3 - See Note 3, Table N-1
III Source: Statistics Canada. 31-203. III - - - 11. III III
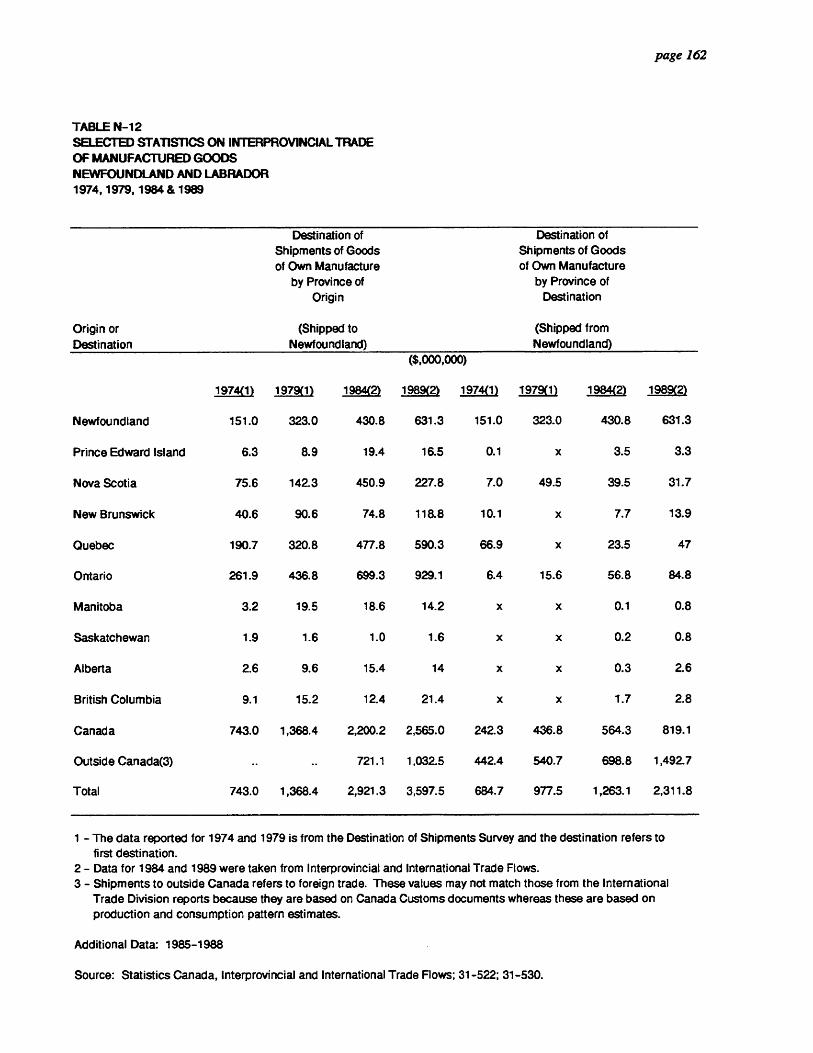
SO
MO
OS
SO
SO
OS
OO
1111
11•9
11S
OO
OM
OS
SO
MO
SO
INI P
OS
page 162
TABLE N-12 SELECTED STATISTICS ON INTERPROVINCIAL TRADE OF MANUFACTURED GOODS NEWFOUNDLAND AND LABRADOR 1974,1979, 1984 & 1989
Destination of Destination of Shipments of Goods Shipments of Goods of Own Manufacture of Own Manufacture
by Province of by Province of Origin Destination
Origin or (Shipped to (Shipped from Destination Newfoundland) Newfoundland)
19741) 1979(1) 1984(2)
($,000,000)
1989(2) 1974(1) 1979(1) 1984(2) 1989(2)
Newfoundland 151.0 323.0 430.8 631.3 151.0 323.0 430.8 631.3
Prince Edward Island 6.3 8.9 19.4 16.5 0.1 x 3.5 3.3
Nova Scotia 75.6 142.3 450.9 227.8 7.0 49.5 39.5 31.7
New Brunswick 40.6 90.6 74.8 118.8 10.1 x 7.7 13.9
Quebec 190.7 320.8 477.8 590.3 66.9 x 23.5 47
Ontario 261.9 436.8 699.3 929.1 6.4 15.6 56.8 84.8
Manitoba 3.2 19.5 18.6 14.2 x x 0.1 0.8
Saskatchewan 1.9 1.6 1.0 1.6 x x 0.2 0.8
Alberta 2.6 9.6 15.4 14 x x 0.3 2.6
British Columbia 9.1 15.2 12.4 21.4 x x 1.7 2.8
Canada 743.0 1,368.4 2,200.2 2,565.0 242.3 436.8 564.3 819.1
Outside Canada(3) 721.1 1,032.5 442.4 540.7 698.8 1,492.7
Total 743.0 1,368.4 2,921.3 3,597.5 684.7 977.5 1,263.1 2,311.8
1 - The data reported for 1974 and 1979 is from the Destination of Shipments Survey and the destination refers to first destination.
2 - Data for 1984 and 1989 were taken from Interprovincial and International Trade Flows. 3 - Shipments to outside Canada refers to foreign trade. These values may not match those from the International
Trade Division reports because they are based on Canada Customs documents whereas these are based on production and consumption pattern estimates.
Additional Data: 1985-1988
Source: Statistics Canada, Interprovincial and International Trade Flows; 31-522; 31-530.

1111
11S
OM
O1
111
11111
1111
11S
SO
SO
SIIM
OS
SO
OO
SO
SS
OOM
OS
SECTION 0
INVESTMENT

IIIIIIM
OS
OS
OSS
OMM
OO
SS
OO
SS
OO
MO
SS
00
011
1111
0 page 163
SECTION "0"
TABLE 0-1
Capital Expenditures
Includes the cost of procuring, constructing and installing new durable plant and machinery, (which normally have a life of more than one year) whether for replacement of worn or obsolete assets, or as net additions to existing assets. Included are all capitalized costs such as architectural, legal and engineering fees, as well as the value of work on capital assets undertaken by firms with their own labour force. Gross outlays are reported without any deduction for scrap or trade-in value of old assets. Excluded are expenditures made for the acquisition of previously existing structures, for used machinery and equipment unless imported and for land since outlays of this type involve only the transfer of property and not the creation of a capital asset.
Construction
Includes building construction and all types of engineering construction such as roads, dams, transmission lines and pipelines, as well as oil drilling and mine development. The machinery and equipment category takes into account the purchase of all such items which are used either in producing goods or providing services but does not cover durable goods purchased for personal use. Included, as well as industrial machinery, are transportation equipment, agricultural implements, professional and scientific equipment, office and store furnishings and other similar capital goods. Excluded for the purpose of this report, are outlays for machinery and equipment by the Department of National Defence.
Housing
Housing is not generally considered a capital expenditure in the sense mentioned above but it has been included because it forms a large proportion of construction expenditures and has cyclical fluctuations similar to those which characterize business, institutional and government capital expenditures.
The Repair Expenditures
Represent the non-capitalized outlays made to maintain the operating efficiency of the existing stock of durable physical assets. These repairs and maintenance expenditures exclude, however, the routine care of assets such as in oiling and cleaning of machinery. Where the repair costs are large enough to materially lengthen the expected serviceable life of the assets, increase its capacity or otherwise raise its productivity, they are treated as capital expenditures on new construction or on new machinery and equipment.

SO
OM
OS
IIIIO
SO
SS
OM
OO
SS
OS
OS
OS
OIS
SO
1111
0•
1111
11•
11
page 165
TABLE 0-1 PRIVATE AND PUBLIC INVESTMENT, BY SECTOR, NEWFOUNDLAND AND LABRADOR 1991-1994 (Millions of Dollars)
CAPITAL EXPENDITURE
REPAIR EXPENDITURE CAPITAL & REPAIR EXPENDITURE
Machinery & Machinery &
Construction quipment Sub-Total Construction Equipment
Machinery &
Sub-Total Construction Equipment Sub-Total
Agriculture & Related 1991 2.9 2.7 5.6 0.9 1.4 2.3 3.8 4.1 7.9
Service Industries 1992 2.9 3.0 5.9 0.8 1.4 2.3 3.7 4.5 8.2
1993 2.8 3.0 5.8
1994 2.8 2.8 5.6
Fishing & Trapping Industries 1991 171 24.4 42.2 14.4 18.4 32.8 32.2 42.8 75.0
1992 12.0 16.5 28.5 9.7 12.4 22.1 21.7 28.9 50.6
1993 10.0 13.7 23.7
1994 7.6 10.5 18.1
Logging & Forestry Industries 1991 x x x x x x x x x
1992 x x x x x x x x x
1993 x - x
1994 x x x
Mining, Quarrying & Oil Well 1991 x x x x x x 504.1 208.0 712.1
Industries 1992 x x 634.2 x x x x x x
1993 966.1 5.9 972.0
1994 1,412.3 23.3 1,435.7
Manufacturing Industries 1991 40.4 76.7 117.0 10.3 68.8 79.1 50.6 145.5 196.1
1992 12.2 60.9 73.1 x x 55.2 x x 128.4
1993 15.2 52.6 67.8
1994 15.6 72.8 88.4
Construction Industries 1991 x x x x x x x x x
1992 5.2 26.8 32.0 1.5 24.7 26.2 6.7 51.5 58.2
1993 5.0 29.5 34.5
1994 5.3 31.3 38.6
Transportation & Storeage 1991 3.5 55.3 58.9 5.7 84.7 90.5 9.3 140.1 149.3
Industries 1992 x x 63.8 3.3 65.4 68.7 x x 132.4
1993 2.7 42.2 44.8
1994 4.9 31.1 36.0
Communications & Other 1991 105.3 128.4 233.7 19.7 54.0 73.7 125.0 182.4 307.4
Utility Industries 1992 95.1 112.6 207.7 19.6 56.0 75.6 114.7 168.6 283.3
1993 103.1 106.2 209.4
1994 106.4 92.1 198.5 ..
Wholesale Trade Industries 1991 1.0 4.7 5.7 1.0 2.7 3.8 2.0 7.4 9.4
1992 2.7 6.7 9.4 0.8 2.4 3.2 3.5 9.0 12.5
1993 1.1 7.2 8.3
1994 2.3 6.3 8.7
Retail Trade Industries 1991 12.2 27.2 39.4 7.6 10.7 18.3 19.7 37.9 57.6
1992 7.7 29.4 37.2 4.0 14.6 18.6 11.7 44.0 55.7
1993 14.2 27.7 41.9
1994 8.2 34.2 42.4

page 166
TABLE 0-1 PRIVATE AND PUBUC INVESTMENT, BY SECTOR, NEWFOUNDLAND AND LABRADOR 1991-1994 - CONTINUED -
CAPITAL EXPENDITURE REPAIR EXPENDITURE CAPITAL & REPAIR EXPENDITURE
Machinery & Machinery &
Construction quipment Sub-Total Construction Equipment
Machinery &
Sub-Total Construction Equipment Sub-Total
Finance & Insurance 1991 x x x x x x x x x
Industries 1992 2.6 45.9 48.5 0.7 1.0 1.7 3.3 46.9 50.2
1993 4.7 47.1 51.8
1994 4.3 50.9 55.2
Real Estate Operator & 1991 36.8 7.9 44.7 x x 10.2 x x 54.9
Insurance Agent Industries 1992 45.5 4.9 50.4 x x 6.4 x x 56.8
1993 47.3 8.2 55.5
1994 37.9 7.3 45.2
Business Service Industries 1991 0.1 0.9 1.1 x x 2.1 x x 3.1
1992 - x x x x x x x x
1993 - x x
1994 x x x
Government Service Industrie 1991 223.2 56.5 279.6 68.0 44.7 112.6 291.2 101.1 392.3
1992 235.6 60.6 296.2 65.8 39.8 105.8 301.4 100.3 401.8
1993 216.6 53.6 270.2
1994 222.7 50.8 273.5
Educational Service Industrie 1991 53.0 4.1 57.1 15.7 0.4 162 68.7 4.5 73.2
1992 47.9 1.6 49.6 x x 16.0 x x 65.5
1993 29.1 3.4 32.5
1994 362 22 38.5
Health & Social Service 1991 x x x x x x x X X
Industries 1992 13.6 12.1 25.7 7.5 1.8 9.3 21.1 13.9 35.0
1993 28.0 2.9 30.9
1994 34.5 3.4 37.9
Accommodation, Food and 1991 3.3 1.9 5.1 2.3 6.4 8.7 5.6 8.2 13.8
Beverage Service industries 1992 2.8 2.3 5.1 1.9 3.0 4.9 4.7 5.3 10.0
1993 2.6 1.7 4.3
1994 5.9 5.9 11.8
Other Service Industries 1991 4.8 24.0 28.8 2.1 3.1 5.2 6.9 27.1 34.1
1992 0.7 30.9 31.6 x x x x x x
1993 x x 45.0
1994 x x 35.3
Housing 1991 527.9 527.9 80.9 60.9 588.8 588.8
1992 469.0 489.0 76.0 76.0 545.0 545.0
1993 467.6 467.6
1994 484.8 484.8
Total 1991 1,553.8 544.8 2,098.7 242.5 512.2 754.7 1,796.3 1,057.1 2,853.3
1992 1.574.9 505.4 2,080.2 227.7 403.8 631.5 1,802.6 909.2 2,711.7
1993 1,922.5 448.7 2,371.1
1994 2,401.9 456.7 2,858.6 1 - Preliminary 2 - Intentions Additional Data: Earlier years are available but the sector groupings are different. Capital Expenditures in Construction and Machinery and
Equipment by type of asset; and Total Private and Total Public Investment by Capital Expenditures in Construction and
Machinery and Equipment and Repair Expenditures in Construction and Machinery & Equipment.
Source: Statistics Canada, Private & Public Investment in Canada, 61-205.

00
1111
00•1
1011
111 1
OO
OM
OO
SM
OO
SS
OO
SS
OS
OO
OS
OID
OO
O
page 167
TABLE 0-1A PRIVATE & PUBLIC INVESTMENT, BY SECTOR NEWFOUNDLAND & LABRADOR FOR SELECTED YEARS 1950-1994
(MIWONS OF DOLLARS)
REPAIR EXPENDITURE CAPITAL & REPAIR EXPENDITURE
Machinery & Machinery & Machinery &
Construction Equipment Sub-Total Construction Equipment Sub-Total Construction Equipment Sub-Total
Grand Total -
All Industries
(Total Items 1,4,8.12,15 & 16)
1950 31.1 14.7 45.8 13.9 11.0 24.9 45.0 25.7 70.7
1955 66.1 22.7 88.8 14.0 13.5 27.5 80.1 36.2 116.3
1960 113.4 33.4 146.8 24.6 18.3 42.9 140.2 51.4 191.6
1965 159.2 75.6 234.8 30.6 53.2 83.8 186.9 128.9 315.8
1970 379.6 134.1 513.7 39.6 93.3 132.9 415.0 227.4 642.4
1975 565.5 186.5 752.0 78.6 165.8 244.4 616.6 352.3 968.9
1980 768.2 377.4 1,145.6 122.0 284.8 406.8 849.9 662.2 1.512.1
1981 949.8 361.2 1,311.0 137.4 330.5 467.9 1,034.0 691.7 1,725.7
1982 1,128.6 511.5 1,640.1 139.5 299.3 438.8 1,164.2 810.8 1,975.0
1983 1,396.6 393.5 1,790.1 148.4 280.6 429.0 1,466.9 674.1 2,141.0
1984 1,539.8 383.2 1,923.0 175.5 324.7 500.2 1,615.1 707.9 2,323.0
1985 1,539.6 416.0 1,955.6 184.7 319.0 503.7 1,724.3 735.0 2,459.3
1986 1,409.3 617.1 2,026.4 202.1 347.3 549.4 1,611.4 964.4 2,575.8
1987 1,310.0 534.4 1,844.4 230.4 372.1 602.5 1,540.4 906.5 2,446.9
1988 1,295.5 627.1 1,922.6 251.1 410.5 661.6 1,546.6 1,037.6 2.584.2
1989 1,404.2 695.7 2,099.9 254.2 432.3 686.5 1,658.4 1,128.0 2,786.4
1990 1,4.51.1 580.5 2,031.6 267.4 423.5 690.9 1,718.5 1,0040 2,722.5
1991 1,551.2 551.8 2,103.0 225.3 449.3 674.6 1,776.5 1,001.1 2,777.6
1992 (1) 1,635.8 458.8 2,094.6 237.1 411.0 648.1 1,872.9 869.8 2,742.7
1993 (2)(3) 2,033.4 446.4 2,479.8 240.9 402.2 643.1 2274.3 848.6 3,122.9
1991 1,553.8 544.8 2,098.7 242.5 512.2 754.7 1,796.3 1,057.1 2,853.3
1992 1,574.9 505.4 2,080.2 227.7 403.8 631.5 1,802.6 909.2 2,711.7
1993 (1) 1,922.5 448.7 2,371.1
1994 (2X4) 2,401.9 456.7 2,858.6
1 - Preliminary
2 - Intentions
3 - Data from 1950 to 1993 based on 1970 SIC Classification.
4 - Data from 1991 to 1994 based on 1980 SIC Classification.
Additional Data: New Capital and Repair Expenditures in Construction by type of structure; Capital Expenditures in Construction and Machinery & Equipment
by type of asset; and Total Private and Total Public Investment by Capital Expenditures in Construction and Machinery and Equipment,
and Repair Expenditures in Construction and Machinery and Equipment.
Source: Statistics Canada, Private & Public Investment in Canada, Catalogue #'s 61-205 & 61-206.
CAPITAL EXPENDITURE

1111
1100
011
011
1111
OO
MO
SOO
MO
IDO
OS
OM
OO
OS
OO
OO
SO
O
SECTION P
CONSTRUCTION AND HOUSING

page 169
11111 • SECITON "P.
TABLE P-1 • ED Construction Activity
IA Consists of the output of the construction industry plus the output of the construction activity carried out in other industries. Also included are related construction costs which are capitalized during the creation of a structure. Examples are pre-construction,
• planning and design, management, legal and real estate fees, interest during construction, etc.
• TABLE P-2
Apartment 0 An apartment is a dwelling unit in an apartment building (multi dwelling structure other than a double house or row house), or in a house that has been converted into apartments. These houses include two-apartment houses (since 1989) triplexes,
411
quadruplexes, etc. or apartments in a non-residential building such as a school, or over a store. (Prior to 1989, CMHC categorized two apartment houses as single detached).
lb Duplex Dwelling It/
A duplex is one of two dwelling units located one above the other in a building adjoining • no other structure.
• Dwelling 0
A dwelling is a structurally separate set of living premises with a private entrance either outside the building or from a common hall, lobby, vestibule or stairway inside the building. The entrance must be one that can be used without passing through anyone else's living quarters.
Row Dwelling
A row dwelling is a one family dwelling unit in a row of three or more attached dwellings separated by common or party walls extending from ground to roof.
Semi-Detached Dwelling 0
A semi-detached dwelling is one of two dwellings located side-by-side in a building, adjoining no other structure and separated by a common or party wall extending from ground to roof.
0 0 • • •

IIS
MIIIIS
SO
SO
MO
OO
MO
SS
OM
OS
OS
SI B
OS
IIS
SO
OS
O
page 170
,Single-Detached Dwelling
A single detached dwelling is a building containing only one dwelling unit, which is completely separated on all sides from any other dwelling or structure.
TABLE P-3
See Table P-2
TABLE P4
See Table P-2
TABLE P-5
See Table P-2
TABLE P4
See Table P-2
TABLE P-7
Family (Census Family)
Refers to a now-married couple (with or without never-married sons and/or daughters of either or both spouses), a couple living common-law (again with or without never married sons and/or daughters of either or both partners), or a lone parent of any marital status, with at least one never married son or daughter living in the same dwelling.
Household
Refers to a person or group of persons (other than foreign residents), who occupy the same dwelling and do not have a usual place of residence elsewhere in Canada. It may consist of a family group (census family) with or without other non-family persons, of two or more families sharing a dwelling, of a group of unrelated persons, or of one person living alone. Household members who are temporarily absent on Census Day (e.g.temporary residents elsewhere) are considered as part of their usual household. For census purposes, every person is a member of one and only one household. Unless otherwise specified, all data in household reports are for private households only.

0
ID page 171
• TABLE P-1 PRINCIPAL STATISTICS OF CONSTRUCTION ACTIVITY,
0 NEWFOUNDLAND AND LABRADOR, 1951 TO 1993(1)
0 sr • III • • so • • • • e • 0 • • 0 • 0
•
0 • • •
• 0 • 0
0 • flp •
III a 1_ Actual 1951 to 1991, preliminary 1992, intentions 1993.
2 - Estimate of total number of persons, employees, own account and paid workers in 0 construction activity, expressed in terms of equivalent man years.
0 3 - Gross payroll. Additional Data: Value of Work by Type. See 0-1.
• Source: Statistics Canada, 64-201.
0
41/
Year
Labour Content Value of Work Performed
Number(2) Value(3) Cost of
Materials Used Total New Repair
1951 1952 1953 1954 1955 1956 1957 1958 1959 1960 1961 1962 1963 1964 1965 1966 1967 1966 1969 1970 1971 1972 1973 1974 1975 1976 1977 1978 1979 1980 1981 1982 1983 1984 1985 1986 1987 1988 1989 1990 1991 1992 1993
8,428 9,771 9,014 9,778
10,022 11,155 9,875 9,226
11,382 11,817 13,462 14,458 12,200 12,578 13,402 15,117 14,421 16,136 16,038 18,095 22,598 16,995 17,077 19,827 17,528 17,470 13,799 13,830 17,337 15,696 13,875 16,674 16,318 15,904 18,650 16,464 17,797 17,729 17,980 18,784 18,922 18,139 21,800
19,316 25,154 27,799 26,639 28,324 35,308 32,377 30,999 38,881 47,882 55,022 66,775 55,651 56,125 58,913 73,418 76,424 94,173
109,166 147,751 185,580 152,719 181,307 214,880 219,267 265,162 228,292 239,482 321,893 298,230 303,831 355,330 379,439 382,452 442,904 414,519 462,986 494,530 524,524 545,738 631,419 680,673 854,270
($000)
26,152 37,932 30,298 30,702 35,710 32,623 43,113 41,504 43,363 64,053 77,575 88,623 85,950 76,896 79,319 97,226
120,726 149,437 140,818 153,187 214,438 160,001 170,829 238,600 239,373 268,614 233,420 246,706 320,089 336,048 435,816 479,824 604,519 665,721 716,601 647,940 606,883 654,033 695,060 720,582 671,494 695,189 832,238
49,947 74,370 68,118 67,372 77,659 82,376 90,393 95,682
105,065 138,508 169,491 199,734 183,443 182,605 186,586 255,572 271,175 308,657 324,341 415,095552,762 458,966 497,998 606,969 617,082 733,028 623,115 642,842 862,857 850,160
1,034,458 1,164,502 1,467,262 1,615,541 1,724,351 1,611,595 1,540,358 1,546,452 1,658,539 1,718,477 1,776,538 1,872,656 2,274,756
49,565 49,611 63,243 66,297 68,359 80,000 84,064
113,536 144,648 176,805 157,193 154,836 152,360 221,881 232,880 265,914 283,823 368,097 511,197 413,462 441,268 519,782 527,830 636,284 511,549 533,695 733,972 09,888
877,855 1,005,812 1,297,065 1,417,138 1,539,841 1,409,192 1,310,051 1,295,666 1,404,264 1,450,882 1,551,194 1,635,682 2,033,756
14,416
18,553 17,761
16,079 22,034 15,682 21,001 24,972 24,843 22,929 26,250
43 83 33 42 72:, 6 92 2 6:2 946 3591 40,518 46,998 41,565 45,504 56,730 87,187 89,253 96,744
111,566 109,147 128,885 140,272 156,603 158,690 170,197 198,403 184,510 202,403 230,307 250,786 254,275 267,595 225,344 236,974 241,000

81 1
00881 1
11081 1
111168811111
01
11 1
MO
OS
OS
SIIIIS
SO
MS
SIS
TABLE P-2
page 172 DWELLING STARTS BY TYPE, COMPLETIONS AND UNDER CONSTRUCTION NEWFOUNDLAND AND LABRADOR, 1949 TO 1993
Starts
Completions Under
Construction
Total Starts
Single- Detached
Semi-Detached
and Duplex Row Apartment(2)
1949 1,000 700 1,334 1950 2,090 1,716 1,688 1951 1,101 941 1,993 1952 1,579 1,131 2,570 1953 1,782 1,480 2,858 1954 1,345 1,160 2,906 1955 (1) 1,613 1,599 6 - 8 1,284 3,057 1956 1,652 1,584 8 60 1,510 3,148 1957 1,145 1,143 2 - 1,183 3,106 1958 1,309 1,301 4 4 - 1,205 3,195 1959 1,553 1,545 4 - 4 1,215 2,379 1960 2,026 2,022 4 2,222 2,170 1961 1,854 1,854 - 1,579 2,421 1962 1,570 1,570 - 1,432 2,529 1963 1,807 1,795 2 - 10 2,224 2,083 1964 2,032 1,994 32 - 6 2,381 1,628 1965 1,664 1,536 72 36 20 2,076 1,210 1966 2,144 1,328 246 232 338 1,386 1,955 1967 2,767 1,809 188 148 622 1,960 2,759 1968 2,933 2,278 105 241 309 3,079 2,686 1969 2,507 2,212 54 211 30 2,935 2,135 1970 2,636 2,204 76 184 172 2,207 2,535 1971 3,658 2,783 286 201 388 3,429 2,705 1972 3,901 3,229 171 167 334 3,432 3,435 1973 4,831 4,246 189 59 337 4,478 3,737 1974 4,911 4,037 134 561 179 4,446 4,173 1975 5,342 3,727 34 1,064 517 4,831 5,107 1976 5,709 4,233 119 691 666 5,850 4,537 1977 3,719 2,531 140 85 963 4,292 2,878 1978 2,865 2,322 143 123 277 3,561 3,483 1979 2,999 2,658 65 88 188 2,611 2,850 1980 3,848 3,128 78 180 462 2,986 3,736 1981 3,210 2,345 112 278 475 3,936 2,966 1982 2,793 2,175 208 240 170 2,331 3,373 1983 3,281 2,776 201 100 204 3,176 3,494 1984 2,720 2,401 162 39 118 3,134 3,000 1985 2,854 2,632 50 28 144 1,852 3,348 1986 2,883 2,637 96 160 2,400 3,823 1987 2,682 2,530 72 4 76 2,390 3,631 1988 3,168 2,839 101 33 195 3,220 3,491 1989 3,536 2,932 98 53 453 3,783 3,168 1990 3,245 2,468 74 36 667 3,127 3,204 1991 2,836 2,135 34 140 527 3,219 2,867 1992 2,271 1,611 42 84 534 2,556 2,464 1993 2,405 1,559 62 95 689 2,457 2,378
I - Starts by type are not available previous to 1955 2 - 'Apartment" includes dwellings not elsewhere classified. This includes, for example apartments
above stores or shops. Since January 1989, Singles with basement apartments are also included. Additional Data: Monthly, sub-provincial (St. John's, Corner Brook, Wabush-Labrador City, Grand Falls-
Windsor) Starts by Type of Financing, Construction Expenditures, Building Permits. Source: Central Mortgage and Housing, Canada Housing Statistics.
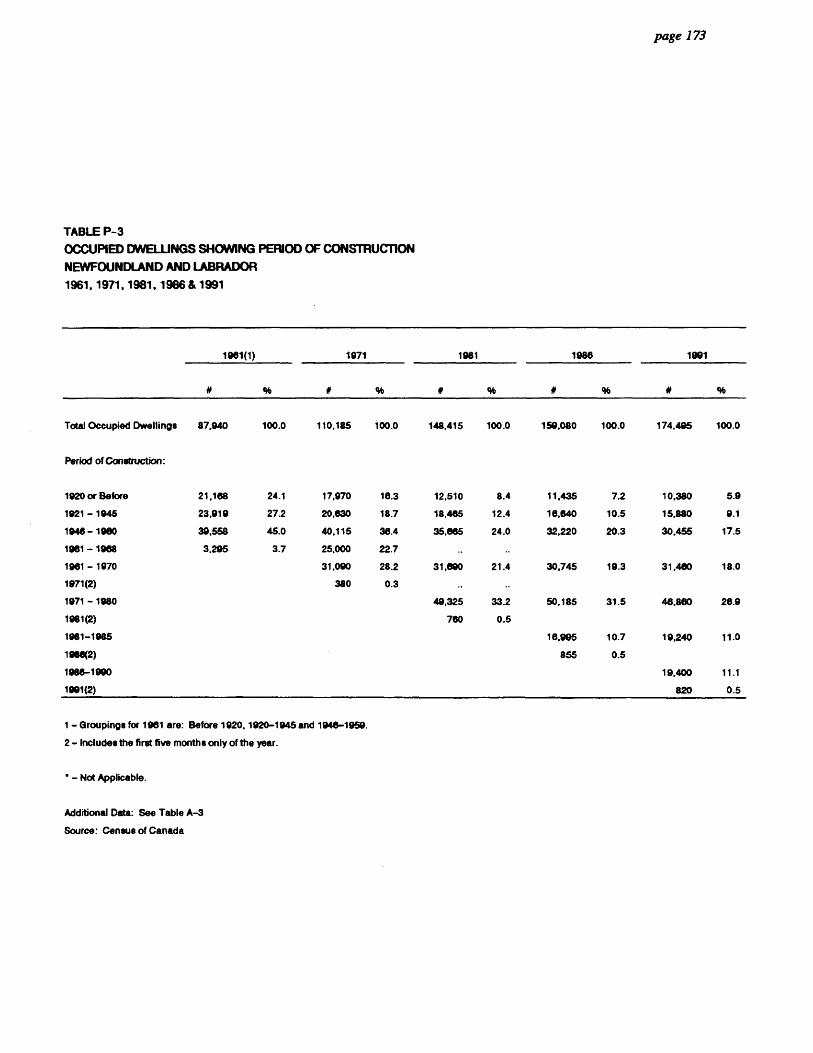
page 173
• TABLE P-3
e OCCUPIED DWELLINGS SHOWING PERIOD OF CONSTRUCTION
NEWFOUNDLAND AND LABRADOR
• 1961, 1971, 1981, 1986 & 1991
0
0
Total Occupied Dwellings 87,940 100.0 110.185 100.0 148,415 100.0 159,080 100.0 174,495 100.0
Period of Construction:
1920 or Before 21,168 24.1 17,970 18.3 12,510 8.4 11,435 7.2 10,380 5.9
1921 - 1945 23,919 27.2 20,630 18.7 18,445 12.4 18,640 10.5 15,880 9.1
1946 -1960 39,558 45.0 40,115 38.4 35,665 24.0 32,220 20.3 30,455 17.5
1981 - 1968 3,295 3.7 25,000 22.7
1961 - 1970 31,090 28.2 31,690 21.4 30,745 19.3 31,480 18.0
1971(2) 380 0.3
1971 - 1980 49,325 33.2 50,185 31.5 46,880 26.9
1981(2) 760 0.5
1981-1985 18,995 10.7 19,240 11.0
1986(2) 855 0.5
1986-1990 19.400 11.1
1991(2) 820 0.5
e 1_ Groupings for 1961 are: Before 1920, 1920-1945 and 1948-1959.
0 2 - Includes the first five months only of the year.
III • _ Not Applicable.
41111 III Additional Data: See Table A-3
IIISource: Census of Canada
• III ao III IIIII III a • III IIII • III
ill 1961(1) 1971 1981 1988 1991
• # % # % # % 0 % # % •
ID

a a a a a a a a GI a a a a a a a a a • so 0 a 0 a a a 0 a a a a 0 • a a a a a a a a a 0
page 174
TABLE P-4 OCCUPIED DWELLINGS BY TYPE OF STRUCTURE AND TENURE NEWFOUNDLAND AND LABRADOR, 1951, 1961, 1966, 1971, 1976, 1981, 1986 & 1991
Year
All Dwellings(1) Single-Detached
Total Owned Rented Total Owned Rented
1951 70,980 61,540 9,440 59,340 55,655 3,685 1961 87,940 76,691 11,249 73,738 69,140 4,598 1966 96,632 81,276 15,356 78,119 72,705 5,414 1971 110,440 88,335 22,110 85,970 78,460 7,510 1976 131,665 106,180 25,485 95,925 89,390 6,535 1981 148,420 119,695 28,725 116,395 106,240 10,155 1986 159,080 127,355 31,725 123,040 113,770 9,275 1991 174,495 137,180 37,295 133,070 122,695 10,360
Year
Single-Attached(3) Apartment or Flat(2X3)
Total Owned Rented Total Owned Rented
1951 7,210 4,890 2,320 4,320 895 3,425 1961 8,886 5,872 3,014 5,170 1,576 3,594 1966 9,546 5,684 3,862 8,551 2,624 5,927 1971 11,665 6,050 5,610 12,100 3,225 8,875 1976 13,360 6,775 6,585 18,095 6,145 11,955 1981 14,885 7,385 7,500 11,300 1,605 9,690 1986 1991
1 - Includes all mobile homes, on wheels or blocks. 2 - Includes duplex; 2,321 in 1961; 2,728 in 1966; 5,830 in 1971; 8,570 in 1981. The number of
duplex is not available for 1951. 3 - Counts of single-attached and apartment dwellings are not available from the 1986 and 1991
Census.
Additional Data: See Table A-3.
Source: Census of Canada.
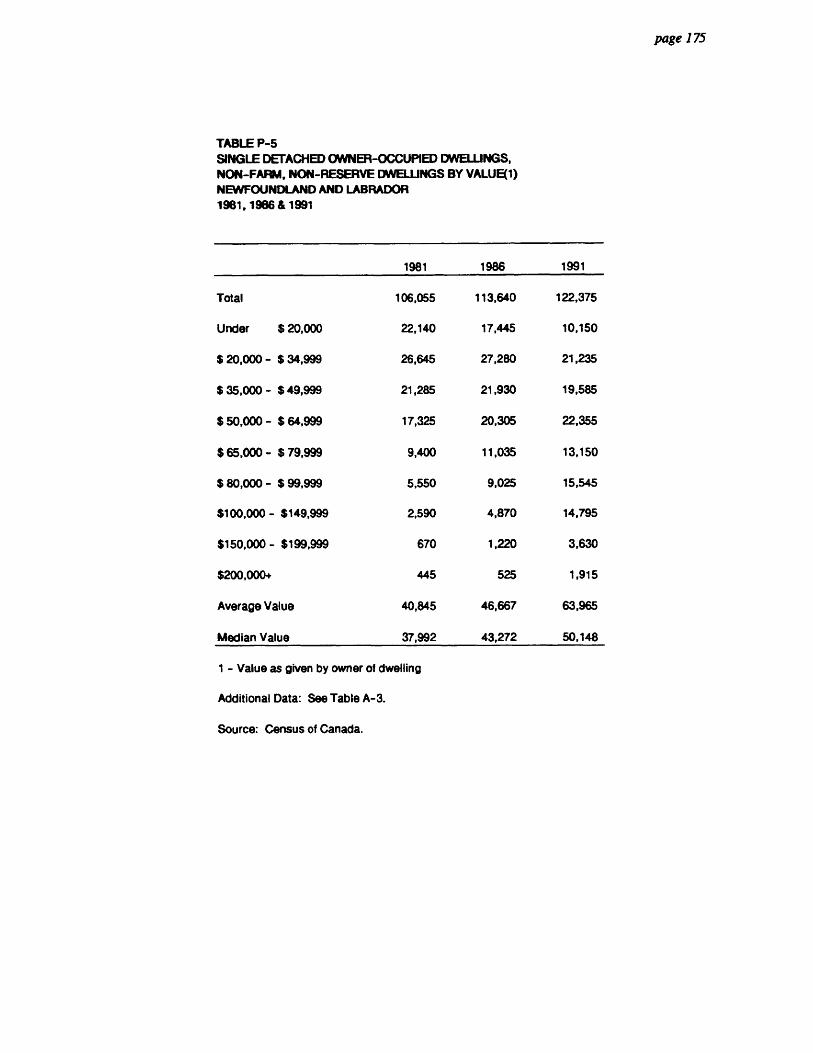
• • page 175
0
Ilb
III
• TABLE P-5
fli SINGLE DETACHED OWNER-OCCUPIED DWELLINGS, NON-FARM, NON-RESERVE DWELLINGS BY VALUE(1)
• NEWFOUNDLAND AND LABRADOR
• 1981,1986 & 1991
• Under $ 20,000
• $ 20,000 - $ 34,999
11111 $ 35,000 - $ 49,999
0
II $ 50,000 - $ 64,999
• $ 65,000 - $ 79,999
• $ 80,000 - $ 99,999
IIIII $100,000 - $149,999
• ID
$150,000 - $199,999
411 $200,000+
• Average Value
ill
• • 1 - Value as given by owner of dwelling
• Additional Data: See Table A-3.
III Source: Census of Canada.
III
• is III • e • ID • • IIIIII 0
Ili
• • II • Total
Median Value
1981 1986 1991
106,055 113,640 122,375
22,140 17,445 10,150
26,645 27,280 21,235
21,285 21,930 19,585
17,325 20,305 22,355
9,400 11,035 13,150
5,550 9,025 15,545
2,590 4,870 14,795
670 1,220 3,630
445 525 1,915
40,845 46,667 63,965
37,992 43,272 50,148
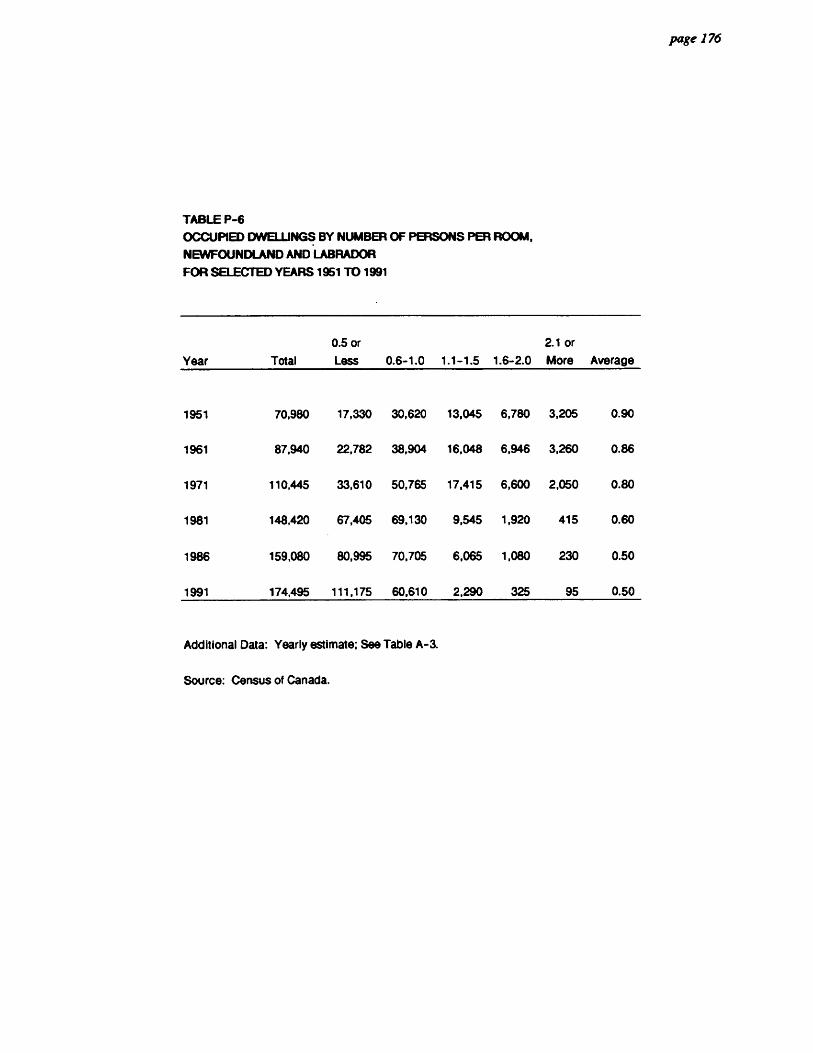
TABLE P-6 OCCUPIED DWELLINGS BY NUMBER OF PERSONS PER ROOM, NEWFOUNDLAND AND LABRADOR FOR SELECTED YEARS 1951 TO 1991
Year Total
0.5 or Less 0.6-1.0 1.1-1.5 1.6-2.0
2.1 or
More Average
1951 70,980 17,330 30,620 13,045 6,780 3,205 0.90
1961 87,940 22,782 38,904 16,048 6,946 3,260 0.86
1971 110,445 33,610 50,765 17,415 6,600 2,050 0.80
1981 148,420 67,405 69,130 9,545 1,920 415 0.60
1986 159,080 80,995 70,705 6,065 1,080 230 0.50
1991 174,495 111,175 60,610 2,290 325 95 0.50
Additional Data: Yearly estimate; See Table A-3.
Source: Census of Canada.
page 176
SIIS
OS
OS
OIN
OS
SM
OS
IIIII IS
OIS
SIO
SS
MO
SO
SIP
OS
SO
IDO
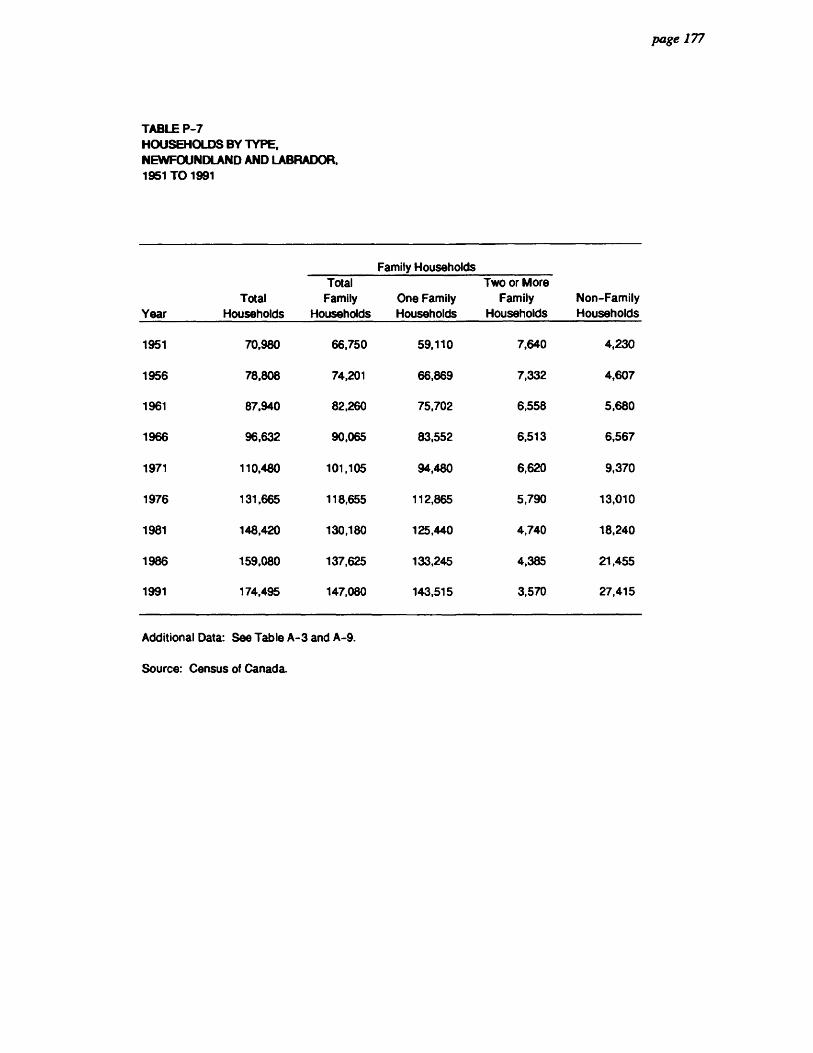
SO
MO
SS
OO
OM
MO
SS
OS
SO
OS
OO
SS
OO
SO
SS
IIII
OO
M
page 177
TABLE P-7 HOUSEHOLDS BY TYPE, NEWFOUNDLAND AND LABRADOR, 1951 TO 1991
Family Households Total Two or More
Total Family One Family Family Non-Family Year Households Households Households Households Households
1951 70,980 66,750 59,110 7,640 4,230
1956 78,808 74,201 66,869 7,332 4,607
1961 87,940 82,260 75,702 6,558 5,680
1966 96,632 90,065 83,552 6,513 6,567
1971 110,480 101,105 94,480 6,620 9,370
1976 131,665 118,655 112,865 5,790 13,010
1981 148,420 130,180 125,440 4,740 18,240
1986 159,080 137,625 133,245 4,385 21,455
1991 174,495 147,080 143,515 3,570 27,415
Additional Data: See Table A-3 and A-9.
Source: Census of Canada.
SO1
1.11
••••••••••••
1101
111•
911.
1011
SO
MO
OS
OSO
OM
S
SECTION Q
TRANSPORTATION
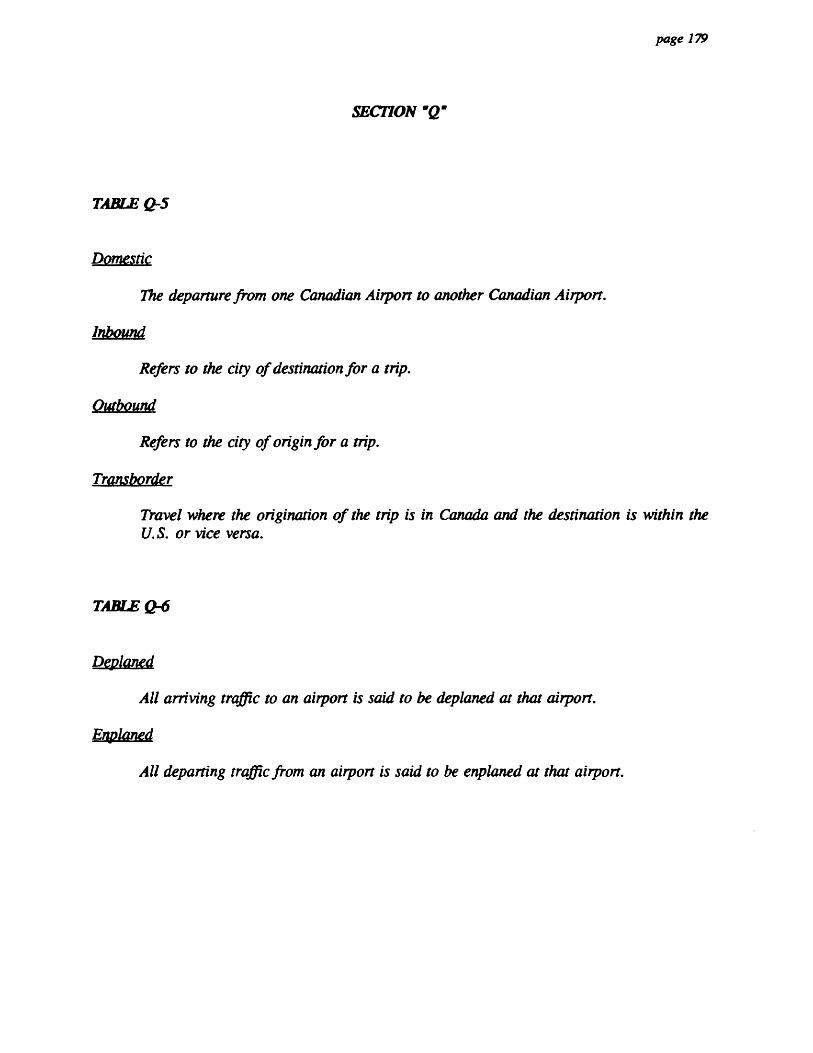
• page 179
a a • SECTION "Q"
• a a •
TABLE Q-5
• a Domestic
The departure from one Canadian Airport to another Canadian Airport. II • Inbound
fib Refers to the city of destination for a trip.
ID • Outbound
II Refers to the city of origin for a trip.
III • Transborder
ft Travel where the origination of the trip is in Canada and the destination is within the
• U.S. or vice versa. 0 ID O TABLE Q-6 II ID lb
Deplaned
fra All arriving traffic to an airport is said to be deplaned at that airport.
41111 Enplaned
fib • All departing traffic from an airport is said to be enplaned at that airport.
ID • • fib III II 1111 0

1199
11
11
SO
00
0S
OO
OS
OS
SID
OO
MO
SO
MO
SIIS
SII
IIIIM
SS
page 181 TABLE Q-1
HIGHWAY KILOMETERS NEWFOUNDLAND AND LABRADOR, 1950 TO 1993
Surfaced Year Pavement Gravel Earth Totals
1950 195 2,897 7,049 10,141 1951 204 2,897 7,068 10,169 1952 204 3,701 6,341 10,246 1953 204 3,846 6,341 10,391 1954 209 3,299 7,081 10,589 1955 209 3,444 7,081 10,734 1956 195 4,353 6,880 11,428 1957 200 5,142 4,828 10,170 1958 351 5,457 4,828 10,636 1959 447 5,750 4,863 11,060 1960 612 5,774 4,860 11,246 1961 652 5,987 4,847 11,486 1962 827 6,053 4,854 11,734 1963 1,006 6,125 4,838 11,969 1964 1,178 6,279 1,212 8,669 1965 1,624 6,069 888 8,581 1966 1,648 6,180 906 8,734 1967 1,806 6,614 1,394 9,814 1968 1,802 6,353 1,368 9,523 1969 2,010 6,094 1,368 9,472 1970 2,152 6,033 1,368 9,553 1971 2,771 6,149 354 9,274 1972 3,064 5,320 8,384 1973 3,344 5,077 8,421 1974 3,734 5,021 8,753 1975 4,192 4,611 8,803 1976 4,546 (1) 4,408 (2) .. 8,954 1977 4,821 4,155 8,977 1978 5,123 3,852 8,975 1979 5,249 3,662 8,911 1980 5,250 3,660 8,910 1981 5,367 3,346 .. 8,713 1982 5,367 3,346 8,712 1983 5,510 3,219 8,729 1984 5,533 3,180 8,713 1985 5,533 3,180 8,713 1986 5,574 3,044 8,618 1987 5,671 2,567 8,238 1988 5,716 2,652 8,368 1989 5,887 2,202 8,088 1990 6,192 2,157 8,349 1991 6,192 2,157 8,349 1992 6,192 2,157 8,349 1993(3) 6,356 2,539 8,895 1 - Beginning in 1976 this includes 63 kilometers of
paved road in the National Parks. 2 - Beginning in 1976 this includes 257 kilometers of
gravel road in Labrador and 55 kilometers of gravel roads in Gros Morns National Park.
3 - The Trans-Labrador Highway was officially opened during the summer of 1992.
Additional Data: By Provincial Electoral Districts.
Source: Department of Work, Services & Transportation.

TABLE Q-2
NO LONGER AVAILABLE
page 182
SO
OS
OO
SS
MO
SS
OO
11
11
110
1111
0•0
011
1 19
1 111
01
1•0
011
11O
SO
OS
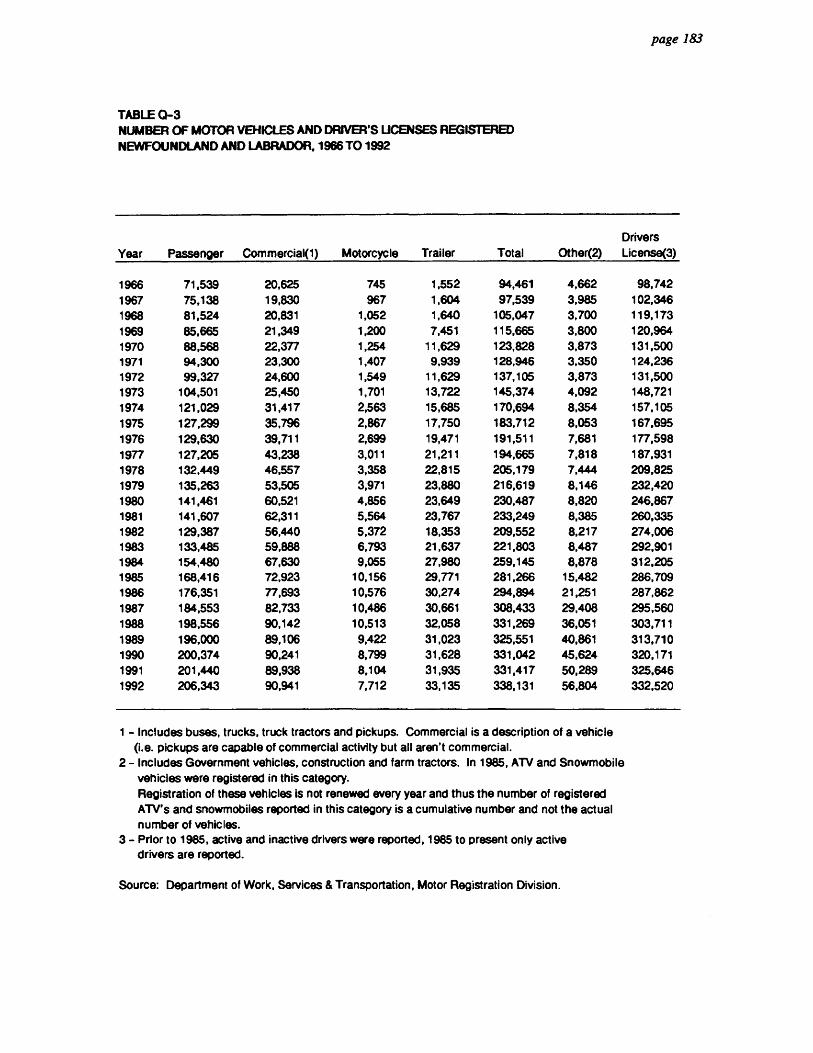
• page 183
a a a TABLE CI-3
NUMBER OF MOTOR VEHICLES AND DRIVER'S LICENSES REGISTERED . NEWFOUNDLAND AND LABRADOR, 1966 TO 1992
Year Passenger Corn mercial(1) Motorcycle Trailer Total Other(2) Drivers License(3)
1966 71,539 20,625 745 1,552 94,461 4,662 98,742 1967 75,138 19,830 967 1,604 97,539 3,985 102,346 1968 81,524 20,831 1,052 1,640 105,047 3,700 119,173 1969 85,665 21,349 1,200 7,451 115,665 3,800 120,964 1970 88,568 22,377 1,254 11,629 123,828 3,873 131,500 1971 94,300 23,300 1,407 9,939 128,946 3,350 124,236 1972 99,327 24,600 1,549 11,629 137,105 3,873 131,500 1973 104,501 25,450 1,701 13,722 145,374 4,092 148,721 1974 121,029 31,417 2,563 15,685 170,694 8,354 157,105 1975 1976
127,299 129,630
35,796 39,711
2,867 2,699
17,750 19,471
183,712 191,511
8,053 7,681
167,695 177,598
1977 127,205 43,238 3,011 21,211 194,665 7,818 187,931 1978 132,449 46,557 3,358 22,815 205,179 7,444 209,825 1979 135,263 53,505 3,971 23,880 216,619 8,146 232,420 1980 141,461 60,521 4,856 23,649 230,487 8,820 246,867 1981 141,607 62,311 5,564 23,767 233,249 8,385 260,335 1982 129,387 56,440 5,372 18,353 209,552 8,217 274,006 1983 133,485 59,888 6,793 21,637 221,803 8,487 292,901 1984 154,480 67,630 9,055 27,980 259,145 8,878 312,205 1985 168,416 72,923 10,156 29,771 281,266 15,482 286,709 1986 1987
176,351 184,553
77,693 82,733
10,576 10,486
30,274 30,661
294,894 308,433
21,251 29,408
287,862 295,560
1988 198,556 90,142 10,513 32,058 331,269 36,051 303,711 1989 196,000 89,106 9,422 31,023 325,551 40,861 313,710 1990 200,374 90,241 8,799 31,628 331,042 45,624 320,171 1991 201,440 89,938 8,104 31,935 331,417 50,289 325,646 1992 206,343 90,941 7,712 33,135 338,131 56,804 332,520
41111 1 - Includes buses, trucks, truck tractors and pickups. Commercial is a description of a vehicle
IIII (i.e. pickups are capable of commercial activity but all aren't commercial.
0 2 - Includes Government vehicles, construction and farm tractors. In 1985, ATV and Snowmobile
vehicles were registered in this category.
0 Registration of these vehicles is not renewed every year and thus the number of registered ATV's and snowmobiles reported in this category is a cumulative number and not the actual
0 number of vehicles. • 3 - Prior to 1985, active and inactive drivers were reported, 1985 to present only active
drivers are reported. Ili 0
Source: Department of Work, Services & Transportation, Motor Registration Division.
111 0 III 0 III ID
0 0 0 0 •

TABLE Q-4
NO LONGER AVAILABLE
page 184
OS
OS
SO
MO
SO
SIS
SO
OM
OS
IOS
OM
MO
SO
OM
OO
SS
O
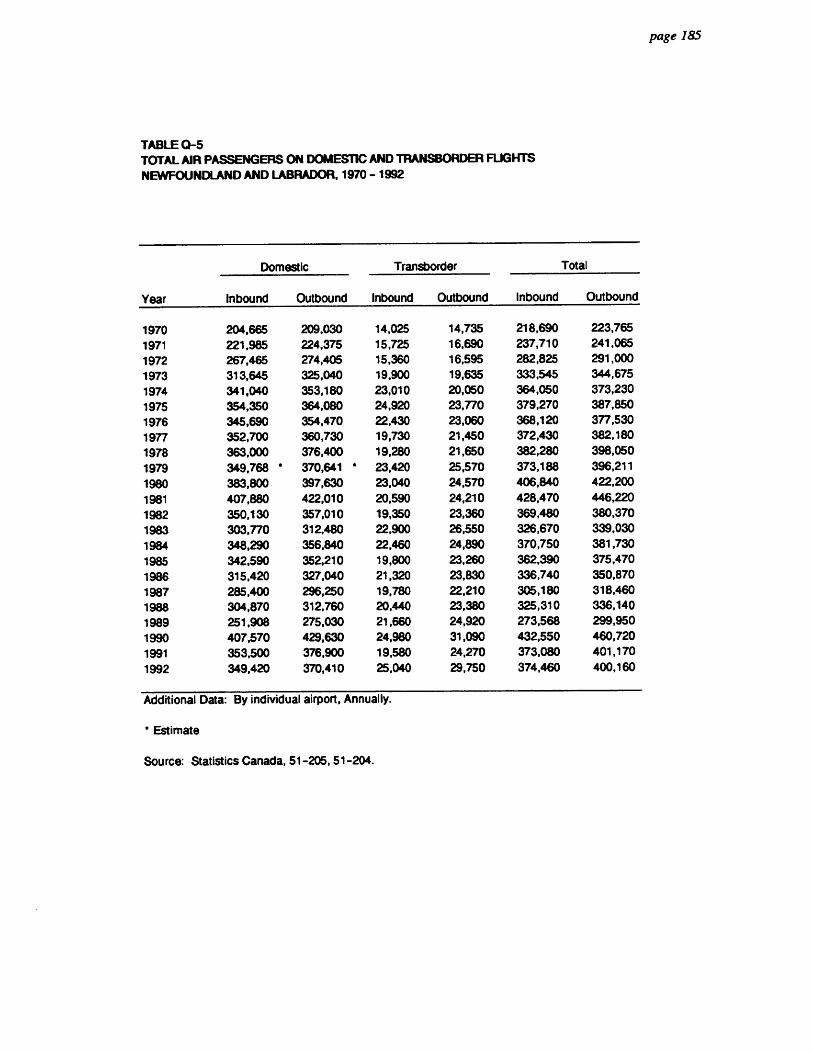
SO
SO
SOO
MO
OO
SS
OM
OO
OS
OOS
OM
OS
OS
SO
OS
OO
110
11
page 185
TABLE 0-5 TOTAL AIR PASSENGERS ON DOMESTIC AND TRANSBORDER FLIGHTS NEWFOUNDLAND AND LABRADOR, 1970 - 1992
Year
Domestic Transborder Total
Inbound Outbound Inbound Outbound Inbound Outbound
1970 204,665 209,030 14,025 14,735 218,690 223,765 1971 221,985 224,375 15,725 16,690 237,710 241,065 1972 267,465 274,405 15,360 16,595 282,825 291,000 1973 313,645 325,040 19,900 19,635 333,545 344,675 1974 341,040 353,180 23,010 20,050 364,050 373,230 1975 354,350 364,080 24,920 23,770 379,270 387,850
1976 345,690 354,470 22,430 23,060 368,120 377,530 1977 352,700 360,730 19,730 21,450 372,430 382,180
1978 363,000 376,400 19,280 21,650 382,280 398,050
1979 349,768 ' 370,641 • 23,420 25,570 373,188 396,211
1980 383,800 397,630 23,040 24,570 406,840 422,200
1981 407,880 422,010 20,590 24,210 428,470 446,220 1982 350,130 357,010 19,350 23,360 369,480 380,370 1983 303,770 312,480 22,900 26,550 326,670 339,030 1984 348,290 356,840 22,460 24,890 370,750 381,730 1985 342,590 352,210 19,800 23,260 362,390 375,470
1986 315,420 327,040 21,320 23,830 336,740 350,870 1987 285,400 296,250 19,780 22,210 305,180 318,460 1988 304,870 312,760 20,440 23,380 325,310 336,140 1989 251,908 275,030 21,660 24,920 273,568 299,950 1990 407,570 429,630 24,980 31,090 432,550 460,720 1991 353,500 376,900 19,580 24,270 373,080 401,170
1992 349,420 370,410 25,040 29,750 374,460 400,160
Additional Data: By individual airport, Annually.
• Estimate
Source: Statistics Canada, 51-205, 51-204.
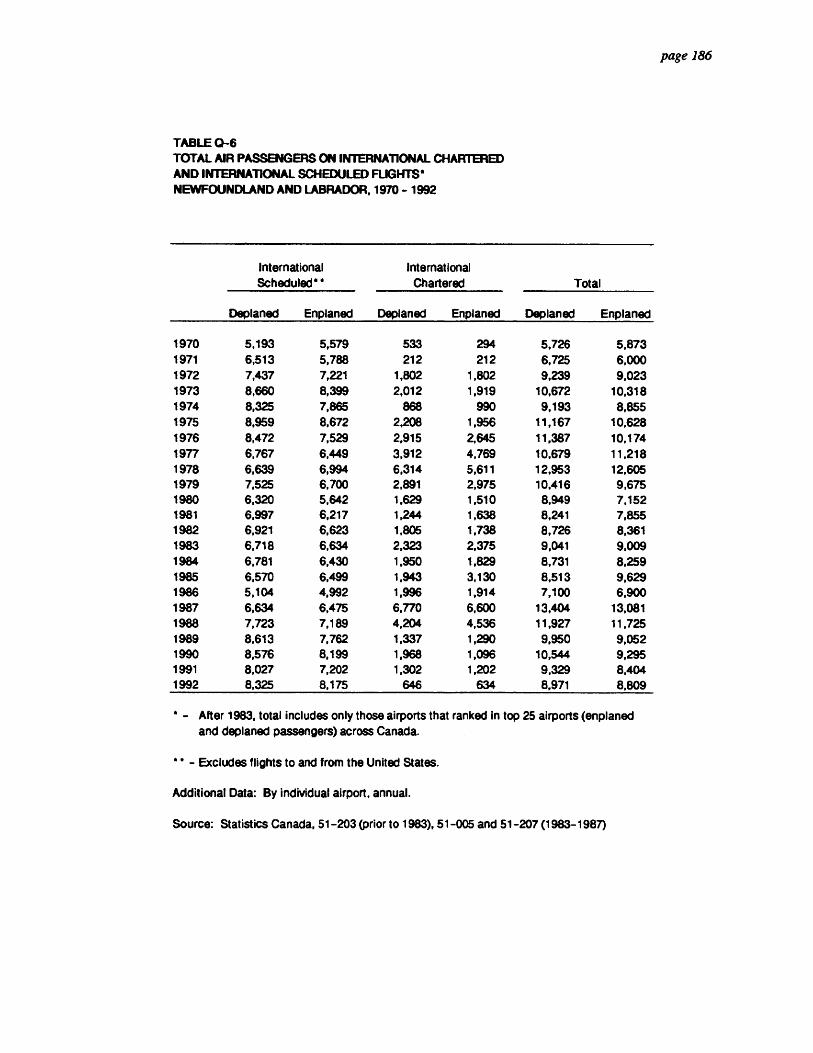
TABLE 0-6 TOTAL AIR PASSENGERS ON INTERNATIONAL CHARTERED AND INTERNATIONAL SCHEDULED FLIGHTS' NEWFOUNDLAND AND LABRADOR, 1970 - 1992
International Scheduled' •
International
Chartered Total
Deplaned Enplaned Deplaned Enplaned Deplaned Enplaned
1970 5,193 5,579 533 294 5,726 5,873 1971 6,513 5,788 212 212 6,725 6,000 1972 7,437 7,221 1,802 1,802 9,239 9,023 1973 8,660 8,399 2,012 1,919 10,672 10,318 1974 8,325 7,865 868 990 9,193 8,855 1975 8,959 8,672 2,208 1,956 11,167 10,628 1976 8,472 7,529 2,915 2,645 11,387 10,174 1977 6,767 6,449 3,912 4,769 10,679 11,218 1978 6,639 6,994 6,314 5,611 12,953 12,605 1979 7,525 6,700 2,891 2,975 10,416 9,675 1980 6,320 5,642 1,629 1,510 8,949 7,152 1981 6,997 6,217 1,244 1,638 8,241 7,855 1982 6,921 6,623 1,805 1,738 8,726 8,361 1983 6,718 6,634 2,323 2,375 9,041 9,009 1984 6,781 6,430 1,950 1,829 8,731 8,259 1985 6,570 6,499 1,943 3,130 8,513 9,629 1986 5,104 4,992 1,996 1,914 7,100 6,900 1987 6,634 6,475 6,770 6,600 13,404 13,081 1988 7,723 7,189 4,204 4,536 11,927 11,725 1989 8,613 7,762 1,337 1,290 9,950 9,052 1990 8,576 8,199 1,968 1,096 10,544 9,295 1991 8,027 7,202 1,302 1,202 9,329 8,404 1992 8,325 8,175 646 634 8,971 8,809
* - After 1983, total includes only those airports that ranked in top 25 airports (enplaned and deplaned passengers) across Canada.
11 * - Excludes flights to and from the United States.
Additional Data: By individual airport, annual.
Source: Statistics Canada, 51-203 (prior to 1983), 51-005 and 51-207 (1983-1987)
page 186
OS
OO
SS
OM
OS
SIP
OO
SO
OO
SS
OO
OO
SO
SS
OS
OS
OM
OS
IIIIS
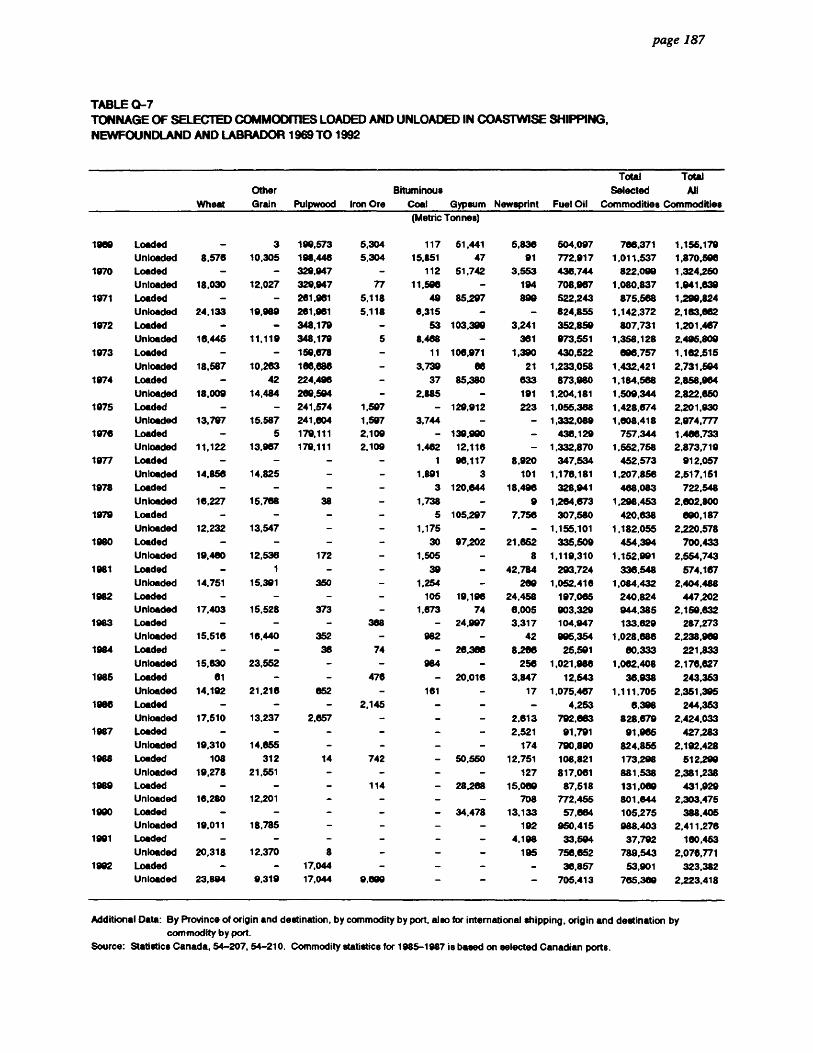
iim
os
iis
sio
ss
es
sii
essesso
sesse
ss
es
se
ss
os
ose
page 187
TABLE 0-7 TONNAGE OF SELECTED COMMODMES LOADED AND UNLOADED IN COASTWISE SHIPPING, NEWFOUNDLAND AND LABRADOR 1969 TO 1992
Wheat
Other
Grain Pulpwood
Bituminous
Iron Ore Coal Gypsum Newsprint Fuel Oil
Total Total
Selected All
Commodities Commodities
(Metric Tonnes)
1989 Loaded - 3 199.573 5,304 117 51,441 5,836 504,097 788,371 1,155,179 Unloaded 8,576 10,305 198,448 5,304 15.851 47 91 772,917 1,011,537 1,870,596
1970 Loaded - - 329.947 - 112 51,742 3,553 436,744 822,099 1.324.250
Unloaded 18.030 12,027 329,947 77 11,598 - 194 708,967 1.080.837 1,941,839
1971 Loaded - - 261.961 5,118 49 85,297 890 522,243 875,588 1.290,824 Unloaded 24,133 19,989 281,961 5,118 8,315 - - 824,855 1,142,372 2,163,862
1972 Loaded - - 348.179 - 53 103,399 3,241 352,859 807,731 1201,467
Unloaded 16,445 11,119 348.179 5 8.468 - 381 973.551 1,358,128 2,495,809
1973 Loaded - - 159,678 - 11 108,971 1,390 430,522 896.757 1.182,515
Unloaded 18.587 10,263 186,886 - 3,739 se 21 1,233,058 1,432,421 2,731,504 1974 Loaded - 42 224,496 - 37 85,380 833 873,980 1,184,568 2.858,984
Unloaded 18,009 14,484 288,594 - 2,885 - 191 1,204,181 1,509,344 2,822,650 1975 Loaded - - 241,574 1,597 - 129,912 223 1.055,388 1,428,674 2.201.930
Unloaded 13,797 15,587 241,004 1,597 3,744 - - 1,332,089 1,008,418 2,974,777 1976 Loaded - 5 179,111 2.109 - 139,990 - 436,129 757.344 1,486,733
Unloaded 11,122 13,987 179,111 2,109 1,482 12,118 - 1,332,870 1.552,758 2,873,719 1977 Loaded - - - - 1 98,117 8,920 347,534 452,573 912,057
Unloaded 14,856 14,825 - 1,891 3 101 1,176,181 1.207,858 2,517,151 1978 Loaded - - - - 3 120,644 18,498 328,941 488,083 722,548
Unloaded 18,227 15,768 38 1.738 - 9 1,264,673 1,298,453 2,002,800 1979 Loaded - - - - 5 105,297 7,756 307,580 420,638 e00,187
Unloaded 12,232 13,547 - - 1,175 - - 1,155,101 1,182,055 2,220,578 1980 Loaded - - - - 30 97,202 21,662 335,509 454,394 700,433
Unloaded 19,480 12,536 172 - 1,505 - 8 1,119,310 1,152,991 2,554,743 1981 Loaded - 1 - 39 - 42,784 293,724 338,548 574,167
Unloaded 14,751 15,391 350 - 1,254 - 209 1,052,418 1,084,432 2.404,488 1982 Loaded - - - - 105 19,196 24,458 197,065 240,824 447,202
Unloaded 17,403 15,528 373 - 1,673 74 6.005 903,329 944.385 2.158.832 1983 Loaded - - - 388 - 24,997 3.317 104,947 133,829 287,273
Unloaded 15,518 16,440 352 - 982 - 42 905,354 1,028,886 2,238,909 1984 Loaded - - 36 74 - 26.386 8.286 25,501 80,333 221,833
Unloaded 15,630 23,552 - - 984 - 258 1.021,986 1,062,408 2.178,827 1985 Loaded 81 - - 476 - 20,016 3.847 12,543 38,938 243,363
Unloaded 14,192 21,218 052 - 181 - 17 1,075.467 1,111,705 2,351,395 1986 Loaded - - - 2,145 - 4,253 6,398 244,353
Unloaded 17.510 13,237 2,657 - - - 2,813 792,083 828,679 2,424,033 1987 Loaded - - - - - - 2,521 91,791 91.985 427,283
Unloaded 19,310 14,655 - - - - 174 790,890 824,855 2,192,428 1988 Loaded 108 312 14 742 - 50,550 12,751 108,821 173.298 512,290
Unloaded 19,278 21,551 - - - 127 817,061 881,538 2.381,238 1989 Loaded - - - 114 - 28,288 15,009 87,518 131.089 431,929
Unloaded 16,280 12,201 - - - - 708 772,455 801,844 2,303,475 1900 Loaded - - 34,478 13,133 57,684 105.275 388,405
Unloaded 19,011 18.785 - - - - 192 950,415 988.403 2,411,276 1901 Loaded - - - - - - 4,198 33,504 37.792 180,453
Unloaded 20,318 12,370 8 - 195 756,652 789,543 2,076,771 1902 Loaded 17,044 - - - - 38.857 53,901 323,382
Unloaded 23,894 9,319 17,044 9,699 - - - 705,413 765.369 2,223,418
Additional Data: By Province of origin and destination, by commodity by port, also for international shipping, origin and destination by commodity by port.
Source: Statistics Canada, 54-207, 54-210. Commodity statistics for 1985-1987 is based on selected Canadian ports.

• •
• • • • • • SECTION R
COMMUNICATIONS
• • • • • • • • • • • • •
SI page 189
• SECTION 7'
• TABLE R-1
•
Access Lines 0
lb A communication channel between a telephone or PBX and the central office which serves it.
0 ID TABLE R-2
0 Capital Stock
Stated value of common and preferred issued capital stock plus the premium on capital stock. •
Employees 0
Represents the number of full-time employees on strength on the last pay period of each month.
GI 0
Property and Equipment
Includes: buildings outside plant (poles, wires and cables), machinery and equipment and plants under construction.
411 Salaries and Wages 0
Represents all monies paid to employees before any deductions for both full-time and part-time employees.
• r.
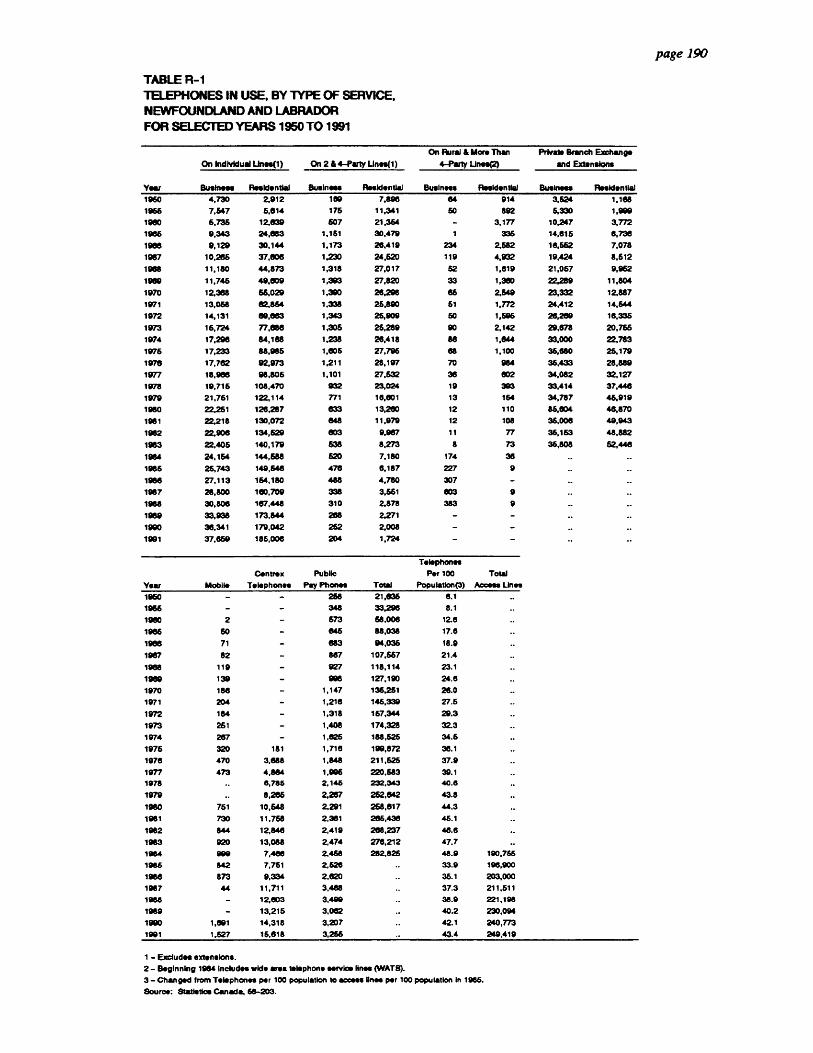
TABLE R-1 TELEPHONES IN USE, BY TYPE OF SERVICE, NEWFOUNDLAND AND LABRADOR FOR SELECTED YEARS 1950 TO 1991
Year
On Individual Unes(1) On 2 &4-Putt' Unes(1)
On Rural & More Than
4-Party Unes(2)
Private Branch Exchange
and Extensions
Business Residential Business Residential Business Residential Business Residential
1960 4,730 2.912 180 7,896 64 914 3,624 1,168
1966 7,547 5,814 176 11,341 50 892 5,330 1,990
1980 5,735 12,639 607 21,364 - 3,177 10,247 3,772
1986 9,343 24,883 1,161 30,479 1 336 14,616 6,736
1906 9,129 30,144 1,173 26,419 234 2,582 16,652 7,078
1957 10,266 37,606 1,230 24,620 119 4,932 19,424 8,612
1968 11,180 44,873 1,318 27,017 62 1,619 21,057 9,962
1989 11,746 49,039 1,393 27,820 33 1,380 22,289 11,804
1970 12,368 56,029 1,390 26,295 66 2,649 23,332 12,887
1971 13,058 82,854 1,338 25,890 61 1,772 24,412 14,644
1972 14,131 69,663 1,343 25,909 60 1,696 28,289 16,336
1973 15,724 77,e86 1,306 26,289 90 2,142 29,878 20,756
1974 17,296 84,188 1,238 26,418 66 1,644 33,000 22,783
1975 17,233 88,955 1.605 27,796 68 1,100 36,680 25,179
1976 17,762 92,973 1,211 28,197 70 984 36,433 28,889
1977 18,986 98,806 1,101 27,532 36 802 34,032 32,127
1978 19,716 108,470 932 23,024 19 393 33,414 37.448
1979 21,751 122,114 771 15,601 13 164 34,787 46,919
1980 22,251 126,287 633 13,250 12 110 86,634 48,870
1961 22,218 130,072 848 11.979 12 108 36,006 49,943
1952 22,908 134,529 003 9.987 11 77 36,153 48,882
1963 22,406 140,179 638 8,273 8 73 35,808 62,446
1984 24,154 144,658 620 7,180 174 38 .. ..
1956 26,743 149,646 476 8,187 227 9
1986 27,113 164,180 488 4,780 307 -
1987 28,800 180,709 338 3,661 803 9
1968 30,806 187,445 310 2,878 383 9
1989 33,938 173,844 255 2,271 - -
1990 30,341 179,042 252 2,008
1991 37,869 186,006 204 1,724
Telephones
Centrex Public Per 100 Total
Year Mobile Telephones Pay Phones Total Population(3) Access Unes
1960 - 258 21,836 6.1
1966 - 348 33,296 8.1
1980 2 673 68,006 12.5
1966 60 845 85,038 17.6
1938 71 883 94,036 18.9
1967 82 887 107,667 21.4
1968 119 927 118,114 23.1
1969 139 998 127,190 24.6
1970 156 1,147 135,261 26.0
1971 204 1,216 146,339 27.6
1972 184 1,318 167,344 29.3
1973 251 1,408 174,328 32.3
1974 267 - 1,826 188,525 34.5
1976 320 181 1,718 190,872 38.1
1978 470 3,888 1,848 211,625 37.9
1977 473 4,884 1,906 220,583 39.1
1978 .. 8,786 2,146 232,343 40.8
1979 .. 8,266 2,287 262,042 43.8
1980 751 10,548 2,291 268,617 44.3
1981 730 11,758 2,351 286,438 46.1
1982 844 12,846 2,419 268,237 48.8
1983 920 13,088 2,474 276,212 47.7 ..
1984 999 7,4e6 2,458 252,826 48.9 190,765
1956 842 7,761 2,528 33.9 196,900
1966 673 9,334 2,620 36.1 203,000
1987 44 11,711 3,468 37.3 211,511
1985 - 12,603 3,499 38.9 221,198
1989 - 13,215 3,062 40.2 230,094
1990 1,891 14,318 3,207 42.1 240,773
1991 1,627 16,818 3,266 43.4 249,419
1 - Excludes extensions.
2 - Beginning 1984 includes wide area telephone service lines (WATS).
3 - Changed from Telephones per 100 population to access lines per 100 population in 1986.
Source: Statistics Canada, 68-203.
page 190
1111
0111
1111
1•1
111
1111
1101
111
1101
1111
1116
1111 1
•01
10
.91
11
1
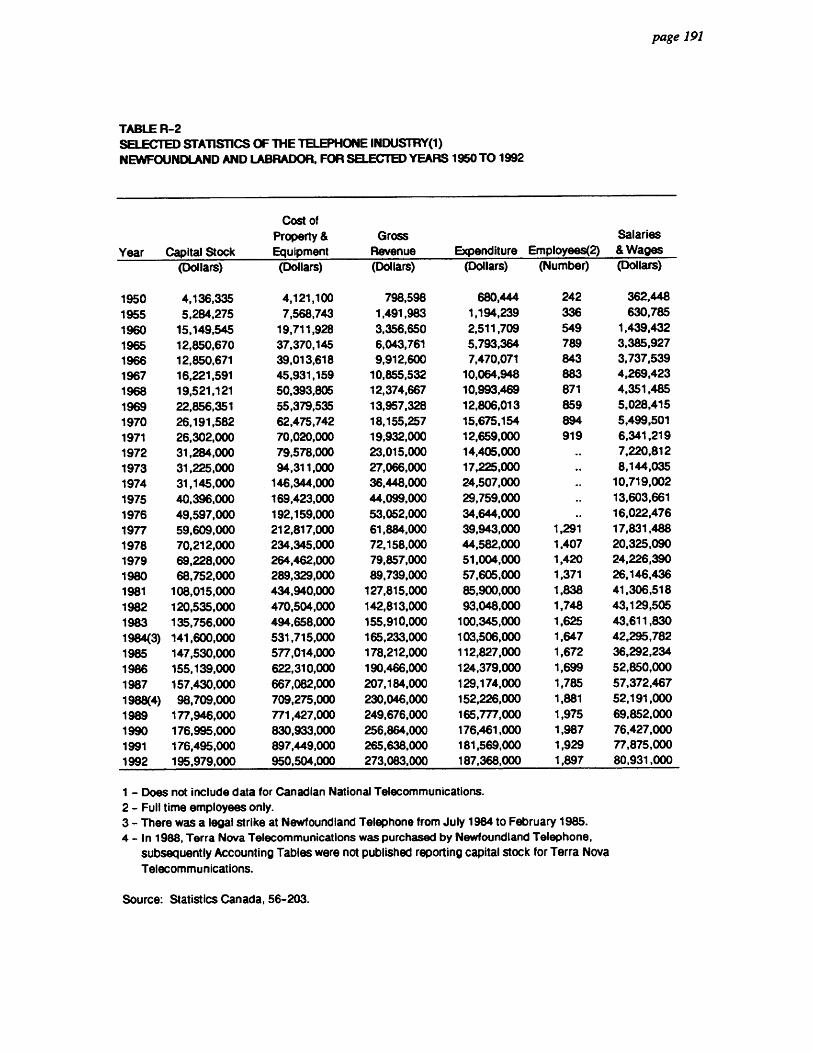
SO
SS
OM
OS
SOM
OO
SO
SS
OIN
OS
OO
SO
OO
OM
O
page 191
TABLE R-2 SELECTED STATISTICS OF THE TELEPHONE INDUSTRY(1) NEWFOUNDLAND AND LABRADOR, FOR SELECTED YEARS 1950 TO 1992
Year Capital Stock
Cost of Property & Equipment
Gross Revenue Expenditure Employees(2)
Salaries & Wages
(Dollars) (Dollars) (Dollars) (Dollars) (Number) (Dollars)
1950 4,136,335 4,121,100 798,598 680,444 242 362,448
1955 5,284,275 7,568,743 1,491,983 1,194,239 336 630,785
1960 15,149,545 19,711,928 3,356,650 2,511,709 549 1,439,432
1965 12,850,670 37,370,145 6,043,761 5,793,364 789 3,385,927
1966 12,850,671 39,013,618 9,912,600 7,470,071 843 3,737,539
1967 16,221,591 45,931,159 10,855,532 10,064,948 883 4,269,423
1968 19,521,121 50,393,805 12,374,667 10,993,469 871 4,351,485
1969 22,856,351 55,379,535 13,957,328 12,806,013 859 5,028,415
1970 26,191,582 62,475,742 18,155,257 15,675,154 894 5,499,501
1971 26,302,000 70,020,000 19,932,000 12,659,000 919 6,341,219
1972 31,284,000 79,578,000 23,015,000 14,405,000 7,220,812
1973 31,225,000 94,311,000 27,066,000 17,225,000 8,144,035
1974 31,145,000 146,344,000 36,448,000 24,507,000 . 10,719,002
1975 40,396,000 169,423,000 44,099,000 29,759,000 13,603,661
1976 49,597,000 192,159,000 53,052,000 34,644,000 16,022,476
1977 59,609,000 212,817,000 61,884,000 39,943,000 1,291 17,831,488
1978 70,212,000 234,345,000 72,158,000 44,582,000 1,407 20,325,090
1979 69,228,000 264,462,000 79,857,000 51,004,000 1,420 24,226,390
1980 68,752,000 289,329,000 89,739,000 57,605,000 1,371 26,146,436
1981 108,015,000 434,940,000 127,815,000 85,900,000 1,838 41,306,518
1982 120,535,000 470,504,000 142,813,000 93,048,000 1,748 43,129,505
1983 135,756,000 494,658,000 155,910,000 100,345,000 1,625 43,611,830
1984(3) 141,600,000 531,715,000 165,233,000 103,506,000 1,647 42,295,782
1985 147,530,000 577,014,000 178,212,000 112,827,000 1,672 36,292,234
1986 155,139,000 622,310,000 190,466,000 124,379,000 1,699 52,850,000
1987 157,430,000 667,082,000 207,184,000 129,174,000 1,785 57,372,467
1988(4) 98,709,000 709,275,000 230,046,000 152,226,000 1,881 52,191,000
1989 177,946,000 771,427,000 249,676,000 165,777,000 1,975 69,852,000
1990 176,995,000 830,933,000 256,864,000 176,461,000 1,987 76,427,000
1991 176,495,000 897,449,000 265,638,000 181,569,000 1,929 77,875,000
1992 195,979,000 950,504,000 273,083,000 187,368,000 1,897 80,931,000
1 - Does not include data for Canadian National Telecommunications. 2 - Full time employees only. 3 - There was a legal strike at Newfoundland Telephone from July 1984 to February 1985. 4 - In 1988, Terra Nova Telecommunications was purchased by Newfoundland Telephone,
subsequently Accounting Tables were not published reporting capital stock for Terra Nova
Telecommunications.
Source: Statistics Canada, 56-203.
a • 4, • a
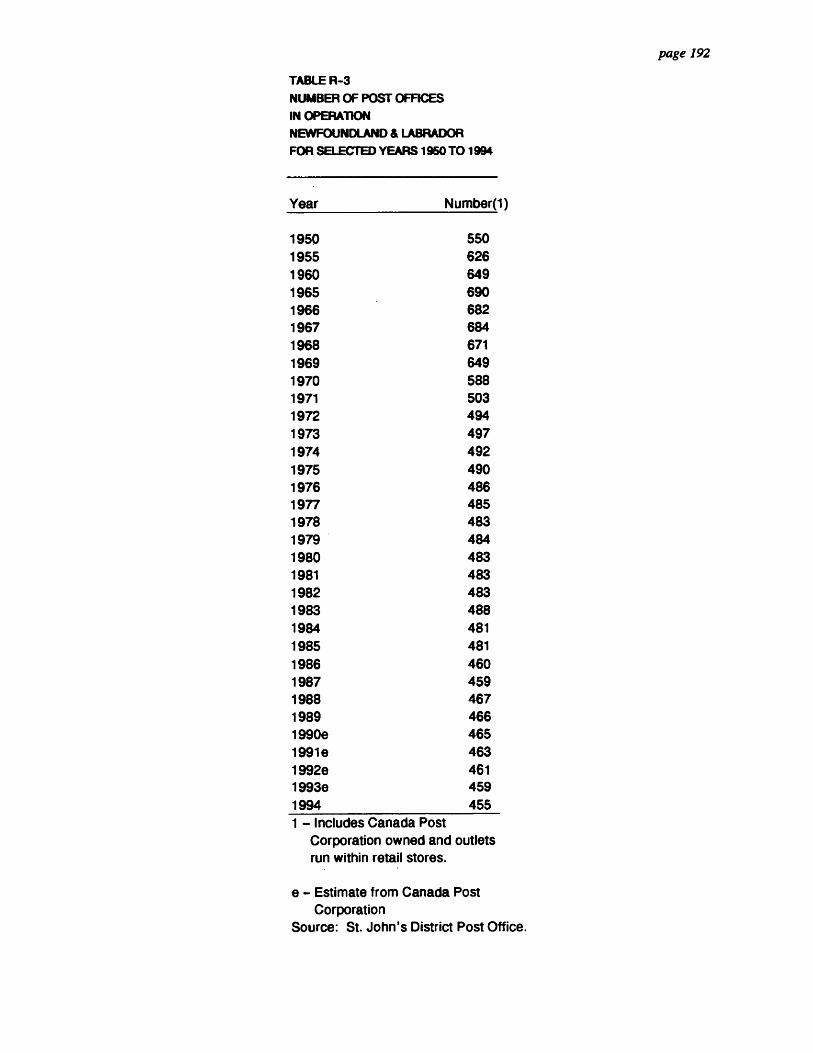
TABLE R-3 NUMBER OF POST OFFICES IN OPERATION NEWFOUNDLAND & LABRADOR FOR SELECTED YEARS 1950 TO 1994
Year Number(1)
1950 550 1955 626 1960 649 1965 690 1966 682 1967 684 1968 671 1969 649 1970 588 1971 503 1972 494 1973 497 1974 492 1975 490 1976 486 1977 485 1978 483 1979 484 1980 483 1981 483 1982 483 1983 488 1984 481 1985 481 1986 460 1987 459 1988 467 1989 466 1990e 465 1991e 463 1992e 461 1993e 459 1994 455 1 - Includes Canada Post
Corporation owned and outlets run within retail stores.
e - Estimate from Canada Post Corporation
Source: St. John's District Post Office.
page 192
SO
OS
OO
SS
OM
OO
OO
OM
OO
11
00
0111
1S
OO
MS
O

isli
ss
iiss
es
silio
se
ssem
so
soo
ss
es
SECTION S
ENERGY
• • • •

II II page 193
II IIII IP SECTION 7'
II lib II lb TABLE S-1
0 Commercial Rates • a Includes users of electricity that pay a commercial rate as defined by the seller. Retail
stores, schools and hospitals are included in commercial rates. II • Domestic
II Includes users of electricity that pay a domestic rate as defined by the seller. Usually O includes residential use, such as private homes, apartments and cottages. Large 0 apartments with one meter i.e. bulkmetered apartments may be classified under general
ID service. Domestic also includes farm. In 1980 the categories were changed, under the new format the categories of Residential and Agriculture approximate the Domestic
fl category. 0 ID Farm
a Includes users of electricity that pay a farm rate as defined by the seller. II III Industries
0 Includes establishments engaged in the generation, transmission and distribution of II electricity not classified as utilities.
fli Power Rates (General Service Rates) ell
• Includes users of electricity that pay a power rate as defined by the seller. Large farms
ID and bulk-metered apartments are included in power rates.
• Utilities II et Includes establishments primarily engaged in the generation, transmission and distribution
IP of electricity, whether owned by governments or not.
II Watt-Hour
I/1 0
A watt-hour is a unit of work equal to the power of one watt operating for one hour.
0 0 SO 0 • II

OM
OO
SS
OO
SO
OO
1101
111
80
•01
10
011
1181
10
911
0110000
111 1
1111
9
page 194
TABLE S-2
Installed Generating Capacity
Installed generating capacity is the nameplate rating of a generator. It is the capacity as designed.
Kilowatt
A kilowatt equals one thousand watts. A watt is the meter-kilogram-second unit of power, equivalent to one joule per second and equal to the power in an electrical circuit in which a current of one ampere flows across a potential difference of one volt.
TABLE S-6
B. T. U. (British Thermal Unit)
The B.T.U. is the amount of heat required to raise the temperature of one pound of water one degree Fahrenheit.
Aviation Gasoline
Aviation gasoline includes all gasoline type fuels used in piston-type aircraft engines.
Aviation Turbo Fuel
Aviation turbo fuel includes all fuels used in turbo-jet or straight jet aircraft engines.
Diesel Fuel Oil
Diesel fuel oil includes all grades of distillate fuel sold for diesel engine use.
Heavy Fuel Oil
Heavy fuel oil includes all grades of residual type fuels (including low sulphur) for both steam and diesel engines; Bunker fuel oil (including Bunker A, B, and C); fuel oils nos. 4, 5, or 6: and residual fuel oil.
Light Fuel Oil
Light fuel oil includes all distillate type fuels for power burners; fuel oil No. 2 (heating oil No. 2); fuel oil No. 3 (heating oil No. 3); furnace fuel oil; gas oils; and light industrial fuel.
SO
OO
SS
OO
MO
OM
OSM
OS
SO
SO
OS
SO
OO
MO
OO
OO
SO
page 195
Motor Gasoline
Motor gasoline includes all gasoline type fuels used in internal combustion engines other than aircraft.
Stove Oil and Kerosene
Stove oil and kerosene includes distillate type kerosene; kerosene; mineral lamp oil; No. 1 fuel oil; and stove oil (including all vaporizing burner oil).
TABLE S-7
Occupied Dwelling
Refers to a dwelling in which a person or group of persons is permanently residing.

IPS
OS
SO
SO
OS
OO
OO
SS
I OO
MM
OS
IIIIIO
SI O
OS
SM
OS
O
page 197
TABLE S-1 SUPPLY AND DISPOSAL OF ELECTRIC ENERGY, NEWFOUNDLAND AND LABRADOR FOR SELECTED YEARS 1955 TO 1993
1955 1960 1965 1970 1975 1980 SUPPLY OF ENERGY
Hydro Generation: (Thousands of Killowatt-Hours)
Utilities 704,797 1,036,514 2,074,947 4,244,541 34,977,897 44,382,278 Industries 561,130 388,163 423,018 414,064 372,111 491,038 Total 1,265,927 1,424,677 2,497,965 4,658,605 35,350,008 44,873,316
Thermal Generation: Utilities 6,658 47,198 190,152 187,180 431,603 1,456,921 Industries 30,910 39,684 80,392 8,191 21,711 43,428 Total 37,568 86,882 270,544 195,371 453,314 1,500,349
Total Generation 1,303,495 1,511,559 2,768,509 4,853,976 35,803,322 46,373,665 Received from Other Provinces Total Supply of Energy 1,303,495 1,511,559 2,768,509 4,853,976 35,803,322 46,373,665
DISPOSAL OF ENERGY Domestic and Farm(2) 103,400 169,481 250,397 504,419 1,277,115 Residential & Agriculture(2) 1,762,801
Total Manufacturing Consumption 969,733 953,905 1,058,696 1,999,871 1,363,718 2,200,671 Mining Consumption 73,438 118,300 1,101,267 1,460,215 1,932,673 2,333,162
Total Industrial Consumption 1,043,171 1,072,205 2,159,963 3,460,086 3,296,391 4,533,833
Commercial and Other Consumption: At Power Rates(4) 47,574 41,955 48,773 55,637 At Commercial Rates 29,271 50,429 93,546 459,610 745,578 1,041,955 Street Lighting 4,411 5,065 8,493 17,774 32,082 40,835 Total Commercial & Other Consumption 81,256 97,449 150,812 533,021 777,660 1,082,844
Losses and Unaccounted For(3) 75,668 103,924 106,805 263,774 773,902 Energy used in own Plant by Utilities(3) Producer Consumption(3) 19,921 21,975 66,925 1,165,324 Residual Error of Estimate -16,214 -3,461 -13,267 13,964
Total Provincial Disposal 1,303,495 1,426,845 2,684,437 4,770,008 6,205,957 8,544,802 Delivered to Other Provinces 94,714 84,072 83,968 29,597,365 37,828,863
Total Disposal of Energy 1,303,495 1,511,559 2,768,509 4,853,976 35,803,322 46,373,665

OS
OO
SSIIII
SO
SS
OS
S1 1
811
11
111O
SS
OO
OS
SO
SO
SO
OO
OS
I PS
OS
S
page 198
TABLE S-1 SUPPLY AND DISPOSAL OF ELECTRIC ENERGY, NEWFOUNDLAND AND LABRADOR FOR SELECTED YEARS 1955 TO 1993 - CONTINUED -
1985 1989 1990 1991 1992 1993 SUPPLY OF ENERGY (Thousands of Kilowatt-Hours)
Hydro Generation: Utilities 39,249,029 32,357,797 34,322,467 34,916,505 34,374,649 38,676,571 Industries 397,943 460,132 386,659 492,798 498,989 520,025 Total 39,646,972 32,817,929 34,709,126 35,409,303 34,873,638 39,196,596
Thermal Generation: Utilities 1,825,094 2,119,274 1,977,798 1,533,399 1,781,799 1,649,627 Industries 22,099 2,780 1,921 - - - Total 1,847,193 2,122,054 1,979,719 1,533,399 1,781,799 1,649,627
Total Generation 41,494,165 34,940,125 36,688,918 36,942,702 36,679,414 40,846,223 Received from Other Provinces Total Supply of Energy 41,494,165 34,940,125 36,688,918 36,942,702 36,679,414 40,846,223
DISPOSAL OF ENERGY Domestic and Farm(2) .•
Residential & Agriculture(2) 2,183,209 2,639,525 2,776,873 2,906,447 3,039,667
Total Manufacturing Consumption 2,848,058 2,756,010 2,432,865 2,509,795 2,527,059 Mining Consumption 2,026,804 2,465,280 2,375,613 2,242,407 2,054,660
Total Industrial Consumption 4,874,862 5,221,290 4,808,478 4,752,202 4,581,715
Commercial and Other Consumption: At Power Rates At Commercial Rates 1,450,554 1,700,245 1,757,658 1,787,593 1,860,562 Street Lighting 43,268 44,509 45,116 44,952 48,028 Total Commercial & Other Consumption 1,493,822 1,744,754 1,802,774 1,832,545 1,908,590
Losses and Unaccounted For(3) Energy used in own Plant by Utilities(3) Producer Consumption(3) 1,024,592 963,965 1,137,756 1,084,965 1,053,022 Residual Error of Estimate
Total Provincial Disposal 9,657,917 10,569,534 10,525,881 10,576,159 10,694,632 10,904,371 Delivered to Other Provinces 31,836,248 24,370,591 26,163,037 26,366,543 25,984,782 29,941,852
Total Disposal of Energy 41,494,165 34,940,125 36,688,918 36,942,702 36,679,414 40,846,223
• - Includes 'No value energy'. No value energy is the energy which is inadvertently exchanged and for which there is no financial settlement.
1 - For the years previous to 1964 " Energy used in our plant by utilities" is included with Residual error of estimate. 2 - In 1980 some of the categories for disposal of energy were changed. Under the new format the categories of
Residential and Agriculture approximate the category of Domestic & farm in the old format. 3 - Producer Consumption approximates the 2 categories of "Losses & Unaccounted For" and "Energy used in own
plant by utilities' of the old format. 4 - From 1974 to present power rates are included with commercial rates.
Additional Data: Monthly; more detail on generation and disposal. Source: Statistics Canada, 57-202,57-001,57-003.

SO
OS
SO
IS
OS
OS
SO
SO
SS
OS
IIS
SII
IIO
SII
I IM
OS
SO
SI
OIP
OS
S
page 199
TABLE S-2 INSTALLED GENERATING CAPACITY, ELECTRIC UT1LMES AND INDUSTRIAL ESTABLISHMENTS NEWFOUNDLAND AND LABRADOR, 1956 TO 1991
1956 1957 1958 1959 1960 1961 1962 1963
(kilowatts)
Hydro 206,120 218,670 245,530 244,830 257,430 259,210 352,810 452,570 Thermal 28,549 29,433 34,196 29,427 56,264 63,027 65,327 60,477 Total Installed Generating Capacity 234,669 248,103 279,726 274,257 313,694 322,237 418,137 513,047
1964 1965 1966 1967 1968 1969 1970 1971
(Kilowatts)
Hydro 452,770 461,445 466,726 691,726 819,526 825,116 974,116 1,924,816 Thermal 60,190 69,185 122,226 97,690 116,137 121,570 273,902 428,641 Total Installed Generating Capacity 512,960 530,630 588,952 789,416 935,663 946,686 1,248,018 2,353,457
1972 1973 1974 1975 1976 1977 1978 1979
(Kilowatts)
Hydro 2,874,816 4,299,816 6,205,766 6,205,766 6,205,766 6,375,766 6,375,766 6,369,256 Thermal 429,520 444,091 456,340 462,164 542,461 595,050 598,429 743,997 Total Installed Generating Capacity 3,304,336 4,743,907 6,662,106 6,667,930 6,748,227 6,970,816 6,974,295 7,113,253
1980 1981 1982 1983 1984 1985 1986 1987
(Kilowatts)
Hydro 6,444,256 6,210,256 6,210,256 6,212,705 6,212,705 6,559,655 6,643,801 6,643,801 Thermal 750,419 748,244 752,271 751,736 756,060 756,660 757,796 757,205 Total Installed Generating Capacity 7,194,675 6,958,500 6,962,527 6,964,441 6,968,765 7,316,315 7,401,597 7,401,006
1988 1989 1990 1991
(Kilowatts)
Hydro 6,651,811 6,656,481 6,649,786 6,649,786 Thermal 773,965 808,556 811,838 796,820 Total Installed Generating Capacity 7,425,776 7,465,037 7,461,624 7,446,606
Additional Data: More Detail.
Source: Statistics Canada, 57-202; 57-206

TABLE S-3 SELECTED STATISTICS OF ELECTRIC ENERGY SOLD TO RESIDENTIAL AND AGRICULTURE NEWFOUNDLAND AND LABRADOR 1949 TO 1991
Kilowatt Average Revenue Per Kilowatt Hours Per Revenue Annual Kilowatt
Year Customers Hours Sold Customer Received Bill Hour (Number) (Thousands) (Number) ($1000) (Dollars) (Cents)
1949 28,725 31,906 1,111 759 26.44 2.38 1950 30,311 40,051 1,321 835 27.57 2.09 1951 34,457 48,258 1,401 1,162 33.74 2.41 1952 38,560 61,577 1,597 1,488 38.59 2.42 1953 40,855 71,977 1,762 1,767 43.24 2.45 1954 44,199 87,089 1,970 1,997 45.18 2.29 1955 46,475 103,400 2,225 2,515 54.12 2.43 1956 48,906 121,714 2,489 2,944 60.20 2.42 1957 51,187 132,678 2,592 3,194 62.40 2.41 1958 53,614 138,766 2,588 3,424 63.86 2.47 1959 55,571 160,820 2,894 3,602 64.82 2.24 1960 59,929 169,481 2,828 3,901 65.09 2.30 1961 63,195 179,761 2,845 4,232 66.97 2.35 1962 66,498 195,367 2,938 4,624 69.54 2.37 1963 69,521 207,773 2,989 5,004 71.98 2.41 1964 71,932 226,661 3,151 5,493 76.36 2.42 1965 74,289 250,397 3,371 6,069 81.69 2.42 1966 81,387 272,725 3,351 6,648 81.68 2.44 1967 88,963 315,369 3,545 7,100 79.81 2.25 1968 97,531 390,322 4,002 8,044 82.42 2.06 1969 101,877 438,860 4,308 8,826 86.63 2.01 1970 105,278 504,419 4,791 10,276 97.61 2.04 1971 108,223 586,923 5,423 11,745 108.53 2.00 1972 117,222 722,666 6,165 13,800 117.73 1.91 1973 120,298 854,633 7,104 15,676 130.31 1.83 1974 123,899 1,042,197 8,412 18,811 151.83 1.80 1975 130,077 1,277,115 9,818 26,006 199.03 2.04 1976 137,345 1,474,026 10,732 35,682 259.80 2.42 1977 141,933 1,559,584 10,988 43,787 308.50 2.81 1978 146,029 1,634,707 11,194 54,573 373.71 3.34 1979 149,366 1,642,134 10,994 63,368 424.25 3.86 1980 152,733 1,755,367 11,493 72,497 474.66 4.13 1981 156,927 1,753,169 11,172 78,380 499.47 4.47 1982 160,165 1,909,557 11,922 102,039 637.09 5.34 1983 162,899 1,936,541 11,888 106,974 656.69 5.52 1984 166,984 2,057,292 12,320 122,798 735.39 5.97 1985 169,773 2,183,209 12,860 153,217 902.48 7.02 1986 172,398 2,205,940 12,796 152,688 885.67 6.92 1987 176,144 2,256,260 12,809 154,893 879.35 6.87 1988 180,266 2,402,996 13,330 165,840 919.97 6.90 1989 186,364 2,520,765 13,526 172,970 928.13 6.86 1990 190,320 2,707,693 14,227 194,540 1,022.17 7.18 1991 195,064 2,823,015 14,472 217,220 1,113.58 7.69
1 - In 1980 the categories of Domestic and farm were changed to Residential and Agriculture under the new format the category of Residential & Agriculture approximate the previous category.
Additional Data: Average Number of Domestic and Commercial Customers, Consumption, Number of electrically Heated Homes, Minimum Net Bill for Selected Communities.
Source: Statistics Canada, 57-202.
page 200
1101
1••••••••••
1111
0110
11M
OO
SO
SS
IIS
I DO
SIO
SO
SO
OS
SO
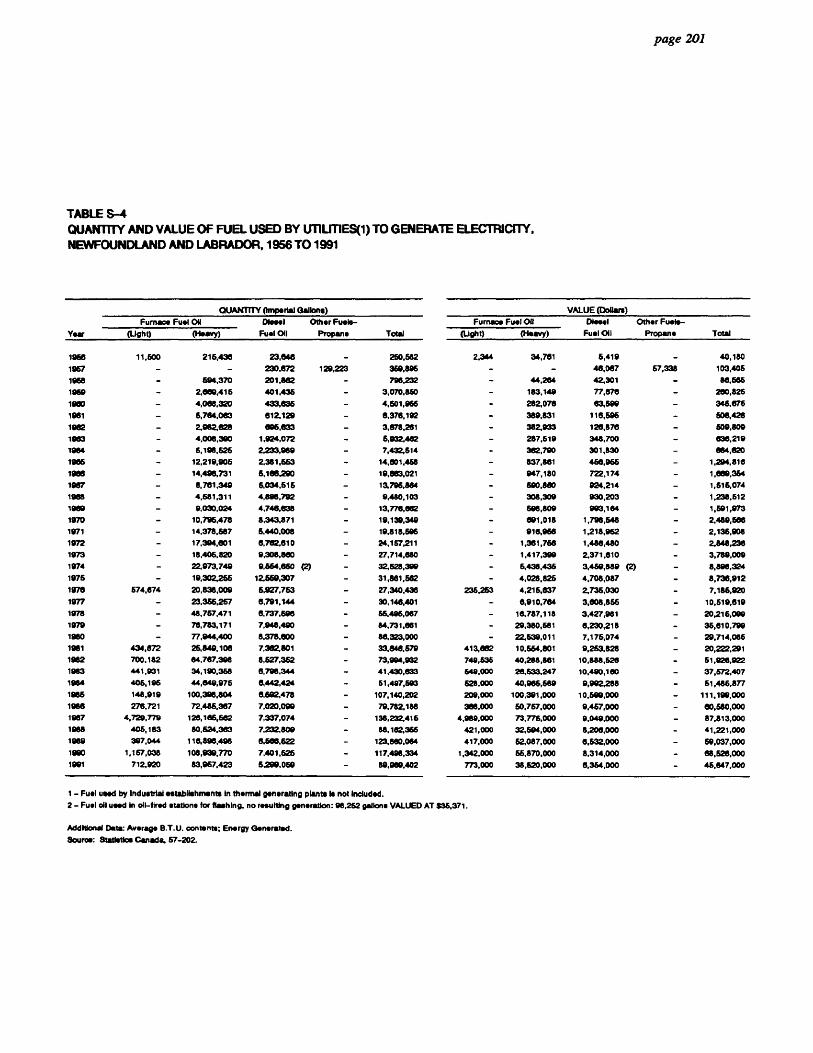
•
page 201
•
• TABLE S-4 QUANTITY AND VALUE OF FUEL USED BY UT1LIT1ES(1) TO GENERATE ELECTRICITY, NEWFOUNDLAND AND LABRADOR, 1956 TO 1991
•
OUANTTTY (Imperial Gallons) VALUE (Dollars)
Furnace Fuel Oil Dlosol Other Fuels- Furnace Fuel 041 Diesel Other Fuels-
,. Yoar (Light) (Heavy) Fuel Oil Propane Total (Light) (Heavy) Fuel Oil Propane Total
• 1958 11,600
-
215,436 23,648 250,562
359,896
2,344 34,761 5,419
48,067 57,338
40,180
1967 - 230,872 129,223 - - 103,405
III 1966
1959 -
594,370
3,
089,415
201,862
- 11
401,435
-
796,232 - 44,264 42,301 - 86,586
070,60 183,149 77,878 2, 250,825
III 1900 -
-
4,088,320 433,635 -
-
4,501,956
6,376,192
282,076 63,599
1115,596
- 346,676
1961 5,764,083 612,129 389,831 506,426
• 1962
- 2.062.028 695,633 3,878,261 382,933 126,876
1983 - 4.008,3610 1,924,072 5,932,442 287,519
346,700 -
509,809
636,219
fra 1964
1965 -
6,196,526 2,233,989 - 7,432,514
1 2,219,905 2,381,653 - A
4,60156 -
362,790 301,830 - 504,520
837,861 466,955 1 - 1,294,816
1988 - 14,498,731 5,186,290 - 19,883,021 947,180 722,174 - 1,689,354
IIII 1967 - 8,761,349 6,034,616 - 13,796,864 590,860 924,214 1,516,074
1968 - 4,581,311 4,898,792 - 9,460,103 308,309 930,203 1,238,512
III 1989 - 9,030,024 4,746,638 - 13,776,662 - 511115,809 993,164 1,591,973
1970 - 10,795,478 8,343.871 - 19,139,349 091,018 1,796,548 2,489,586
II 1971 - 14,378,587 5,440,008 - 19,818,506 - 916,966 1,218,962 - 2,135,908
1972 - 17.394,601 6,762,810 - 24,157,211 1,361,756 1,486,480 - 2,848,236
III 1973 - 18,406,820 9,308,860 - 27,714,680 - 1.417,399 2,371,810 3,789,009
1974 - 22,973,749 9,664,650 (2) - 32,528,399 6,438,436 3,459,889 (2) 3,896,324
IIII 1976 - 19,302,256 12,669,307 - 31,861,562 4,028,826 4,708,067 8,738,912
1978 674,674 20,838,009 6,927,753 - 27,340,436 235,263 4,216,637 2,736,030 7,186,920
III 1977 - 23,366.267 6,791,144 - 30,146,401 6,910,764 3,804,656 10,619,619
1978 - 48,757,471 6,737,5915 66,495,067 - 18,787,118 3,427,981 20,216,099
III 1979 - 76,783,171
1980 -
77,944,400
7,6148,490 84,731,861
8,378,800
86,323,000
29,380,5151 6,230,218 36,610,799
- 22,539,011
7,176,074 - 29,714,065
II
1961 434,672 25,849,108 7,362,801
- 33,848,579
413,882 10,564,801 9,253,828
749,535 40,288,861 10,688,628
20,322,291
1962 700,162 84,767,398 8,527,362 73,994,932 61,926,922
• 16163 441,9
1964
01 34,190,358 6,796,344 - 41,430,63
406,196 44,069,975 842,424 -
3 549,000 2
51,497,593
6,633,247 10,490,160 - 37,672,407
628,000 40,966,589 9,992.288 4 61,486,877
• 1985
1966
148,919 100,396,804
72,485,367
5,592,476
-
107,140,202
209,000 100,391,000 10,599,000
386,000 50,757,000 9,467,000 -
111,199,000
276,721 7,020,099 79,782,186 80,680,030 • 1967
1968
4,729,779
405,183
126,188,682
80,524,383 7,232,809 88,182,356 421,000 32,594,000
7,337,074 - 138,232,416
4,969,000 73,776,000 9,049,000
8,206,000 -
87,813,000
41,221,000
III 1969
1990
397,044
1,167,038
116,898,498
108,939,770
6,505,622
7,401,626
- 123,860,084
117,496,334
417,000 52,087,000
1,342,000 55,870,000
8,532,000
8,314,000
- 59,037,000
68,526,000
1991 712,920 83,957,423 5,299,060 - 89,9861,402 773,000 38,520,000 6,364,000 45,647,000
ID • 1 - Fuel used by Industrial establishments in thermal generating plants Is not included.
2 - Fuel oil used In oil-tired stations for flashing, no resulting generation: 98,262 gallons VALUED AT $36,371.
II Addldonal Data: Average B.T.U. contents; Energy Generatod.
411 Souros: Statistics Canada, 57-202.
III III II • III ID 411 III III • • III
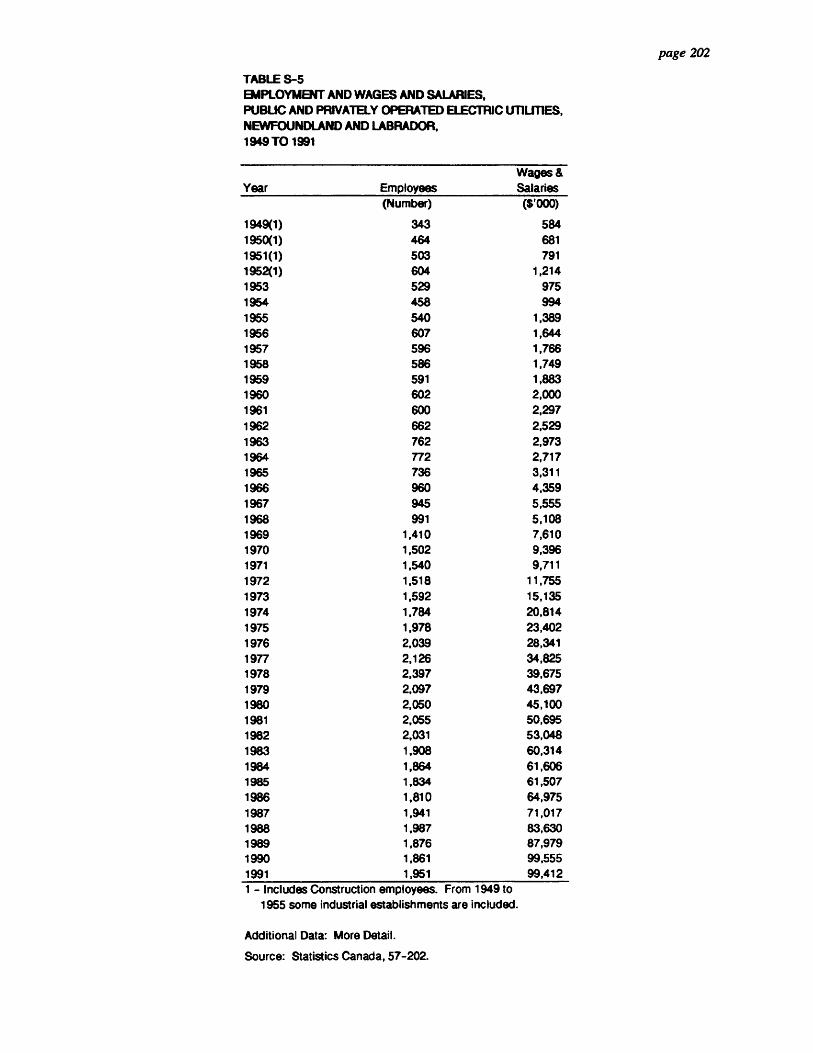
TABLE S-5 EMPLOYMENT AND WAGES AND SALARIES, PUBLIC AND PRIVATELY OPERATED ELECTRIC UTILITIES, NEWFOUNDLAND AND LABRADOR, 1949 TO 1991
Year Employees Wages & Salaries
(Number) ($'000)
1949(1) 343 584 1950(1) 464 681 1951(1) 503 791 1952(1) 604 1,214 1953 529 975 1954 458 994 1955 540 1,389 1956 607 1,644 1957 596 1,766 1958 586 1,749 1959 591 1,883 1960 602 2,000 1961 600 2,297 1962 662 2,529 1963 762 2,973 1964 772 2,717 1965 736 3,311 1966 960 4,359 1967 945 5,555 1968 991 5,108 1969 1,410 7,610 1970 1,502 9,396 1971 1972
1,540 1,518
191 :775511
1973 1,592 15,135 1974 1,784 20,814 1975 1,978 23,402 1976 2,039 28,341 1977 2,126 34,825 1978 2,397 39,675 1979 2,097 43,697 1980 2,050 45,100 1981 2,055 50,695 1982 2,031 53,048 1983 1,908 60,314 1984 1,864 61,606 1985 1,834 61,507 1986 1,810 64,975 1987 1,941 71,017 1988 1.987 83,630 1989 1,876 87,979 1990 1,861 99,555 1991 1,951 99,412 1 - Includes Construction employees. From 1949 to
1955 some industrial establishments are included.
Additional Data: More Detail.
Source: Statistics Canada, 57-202.
page 202
SO
OS
IPO
OS
OS
OM
OS
SO
OO
SS
I DO
OO
SS
OO
MO
OS
OS
OO
SO
S
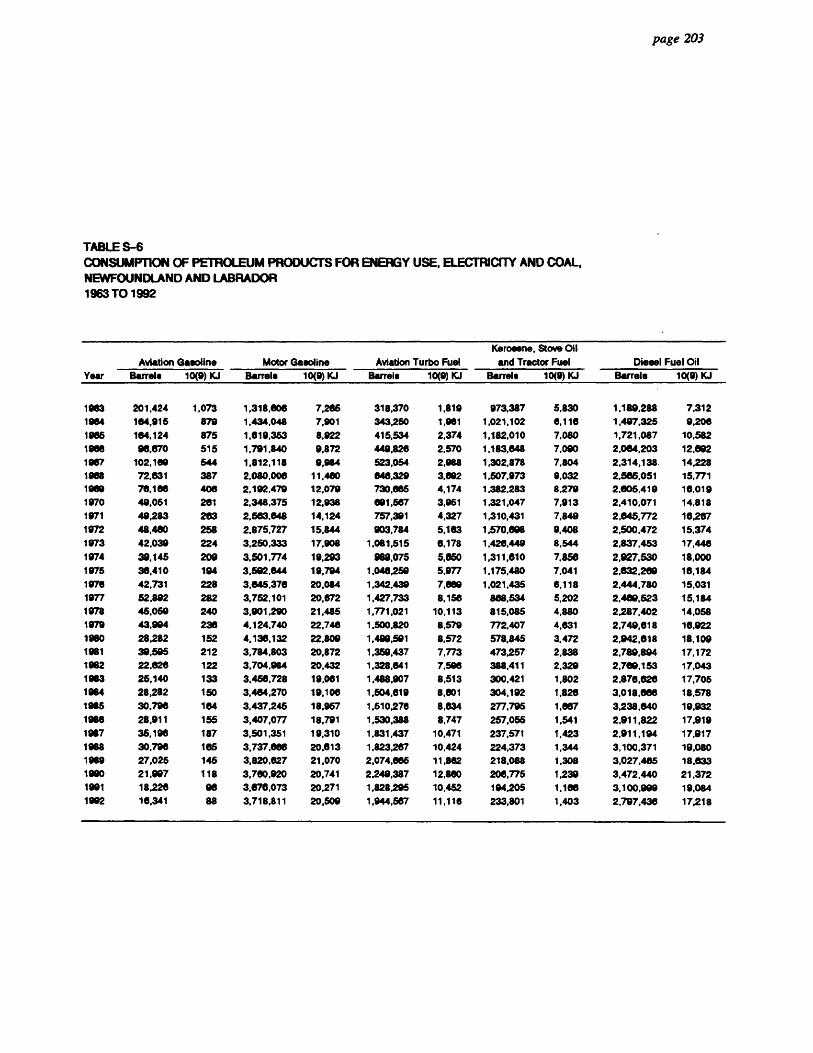
page 203
0
0 TABLE S-6 CONSUMPTION OF PETROLEUM PRODUCTS FOR ENERGY USE, ELECTRICITY AND COAL,
IV NEWFOUNDLAND AND LABRADOR fa 1963 TO 1992
IIII Year
0 1063
1964
4, 1985
1966 . 1987
1968 fp 1969
1970 al 1971
ma 1972
MP 1973
is 1974
1975
0 1976
1977 49 1978
1979
1980
1081 WIll 1982
•1963
1964
• 1985
1966
0 1967
1068
II 1989
Am 1990
IN 1091 . 1992
Aviation Gasoline Motor Gasoline Aviation Turbo Fuel
Kerosene, Stove Oil
and Tractor Fuel Diesel Fuel Oil
Barrels 10(9) KJ Barrels 10(9) KJ Barrels 10(9) KJ Barrels 10(9) KJ Barrels 10(9) KJ
201,424 1,073 1,318,606 7,265 318,370 1,819 973,387 5,830 1.189,288 7.312
MP
184,915 879 1,434,048 7,901 343,250 1,981 1,021,102 6,116 1,497,325 9,206
164,124 875 1,619,353 8,922 415,534 2,374 1,182,010 7,080 1.721,087 10,582
mom 515 1,791,840 9,872 449,826 2.570 1,183,648 7,090 2,064,203 12,892
102,169 544 1,812,118 9,984 523,054 2,988 1,302,878 7,804 2,314,138. 14,228
72,631 387 2,080,006 11,400 848,329 3,692 1,507,973 9,032 2,565,051 15,771
76,168 406 2,192,479 12,079 730,685 4,174 1,382283 8,279 2,605,419 16,019
49,051 261 2,348,375 12,938 891,587 3,951 1,321,047 7,913 2,410,071 14,818
49,283 283 2,503,648 14,124 757,391 4,327 1,310,431 7,849 2,645,772 16,267
48,480 258 2,875,727 15,844 903,784 5,183 1,570,0:18 9,408 2,500,472 15.374
42,039 224 3,250,333 17,908 1.081,515 6,178 1.426,449 8,544 2,837,453 17,446
39,145 209 3,501.774 19,293 989,075 5,850 1,311,610 7,858 2,927,530 18,000
36,410 194 3,592,644 19,794 1,046,259 6,977 1,175,480 7,041 2,632,269 16,184
42,731 228 3,645,376 20,084 1.342,439 7,069 1,021,435 6,118 2,444,780 15,031
52.892 282 3,752,101 20,672 1,427,733 8,158 888,534 5,202 2,409,523 15,184
45,058 240 3,901,290 21,485 1,771,021 10.113 815,085 4,880 2,287.402 14,058
43.994 238 4,124,740 22,748 1,500,820 8,579 772,407 4,631 2,749,618 16,922
28.282 152 4,136.132 22,809 ip 1,490,591 8,572 578,845 3,472 2,942,818 18,109
39,595 212 3,784,803 20,872 Am
1,359,437 7,773 473,257 2,838 2,789,894 17,172
22,626 122 3,704,984 20,432 1.328,641 7,596 388,411 2,329 2,789,153 17,043
25,140 133 3,456,728 19,061 1.488,907 8,513 300,421 1,802 2,876,626 17,705
28,282 150 3,464,270 19,106 1,504,619 8,801 304,192 1,826 3,018,868 18,578
30,796 164 3,437,245 18,957 1,510,276 8,834 277,795 1,887 3238,640 19,932
28,911 155 3,407,077 18,791 1,530,388 8,747 257,055 1.541 2,911,822 17,919
35,196
30,796
187
185
3,501,351
3,737,808
19,310
20,613
1,831,437
1,823267
10,471
10,424
237,571
224,373
1,423
1,344
2,911,194
3,100,371
17,917
19,080
27,025 145 3,820,627 21,070 2.074,006 11,882 218,088 1,308 3,027,485 18,633
21,997 118 3,780,920 20,741 2.249,387 12,8e0 208,775 1,239 3,472,440 21,372
18,226 98 3,676,073 20,271 1,828,295 10,452 194.205 1.186 3,100,999 19,084
18,341 88 3,718,811 20,509 1,944,587 11,118 233,801 1,403 2,797,436 17,218
•
• • 0 •
•

is 0 al al a 0 al • 0 e 0 • 0 al a a 0 • so so 0
0
0 0 • s al 0 •
is so S a
page 204
TABLE S-6 CONSUMPTION OF PETROLEUM PRODUCTS FOR ENERGY USE, ELECTRICITY AND COAL, NEWFOUNDLAND AND LABRADOR 1963 TO 1992 - CONTINUED -
Year
Light Fuel Oil Heavy Fuel Oil
Total
Petroleum Consumption' Electricity Coal
Total
Consumption'
Barrels 10(9) KJ Barrels 10(9) KJ Barrels 10(9) KJ M.W.H. 10(9) KJ Tons 10(9) KJ 10(9) KJ
1983 1,297,711 7,979 2,190,768 14,533 7,489,542 45,811 1,996,398 7,194 85,097 2,280 55.266
1984 1.496.535 9.195 2,489,385 16,514 8,445.500 51,772 2,339028 8,420 83,886 2,223 62,415
1966 1.097.082 10,434 3,138,883 20,809 9.936.073 61,078 2,684.437 9,864 86,642 2.289 73,029
1988 1.578,696 9,706 2.789,315 18,503 9,954.200 80,948 2,843,549 10,238 57,041 1.510 72.094
1967 1,849,388 11,371 2,980,425 19,638 10,884.150 86,557 3,122,314 11,240 62,248 1.382 79,179
1988 2.140,937 13,183 3,377,270 22,403 12.390,197 75,908 3,733,187 13,439 40,810 1.080 90,427
1988 2.149,653 13,217 4.427,687 29,372 12,584,352 83,546 4,085,847 14,638 29,150 770 98,962
1970 2,578,297 15,852 5,987,951 39,722 15,386,359 96,455 4,770,008 17,171 18,496 487 113.113
1971 2,564,040 15,703 5.611,442 37,224 15,492,007 95,757 4,770,954 17,175 10,036 461 113,393
1972 3.188.784 19,006 3,400,793 22,580 14,488,718 88,213 4,889,793 17,603 10,157 209 108,086
1973 3,304,709 20,319 4,112,025 27,278 16,054,523 97,897 5,864,623 21,076 3,770 99 119,072
1974 3,503,517 21,541 5.722,002 37,957 17,904.853 110,506 6,580.380 23,688 1,593 42 134,236
1975 3,286,438 20,206 4,102,398 27,214 15,871,898 96,810 6,205.957 22,341 1,651 44 118,996
1976 3.178,968 19,546 3,857,892 24,264 15.333.441 92,940 7.150,582 25,740 1,219 32 118.712
1977 2,927,903 18,002 4.806030 30,500 18,105,576 06,058 7,499,047 26,997 1,871 50 125,105
1978 3,036,380 18.861 3.785.948 26,104 15,842.165 94,541 7,588,119 27.317 1,988 53 121.911
1979 2,739,582 16,861 4,004,700 28,589 15,935,841 96,584 8,364,384 30,075 1,764 47 126,080
1980 2,608.258 18,053 6,293,131 41,785 18,088,857 110,962 8,544,802 30,761 2.094 se 141,789
1981 2,216,077 13,038 4,381,240 29,091 15.044,309 91,596 8,825,991 31,774 1,764 48 123,418
1962 2,557,350 15,740 2.756,965 18,297 13.527.120 81,559 8,561,542 30.822 1.984 52 112,433
1983 2,037,584 12,541 3,800,025 23,903 13.785.431 83,658 8,926,886 32,133 1,323 34 115,825
1984 1.845.893 11,359 3,915,530 25,997 14.081.453 85,817 9,635,881 34,688 882 23 120.328
1985 1,801,898 11,090 5,308,906 35,251 15,006,184 05,895 9,857,917 34,768 772 21 130.484
1966 1,713,280 10,545 5,016.666 33,309 14.866,188 91,007 9,834,014 35,402 551 15 126,426
1987 1,747,847 10,757 6,806.906 44,458 16,980,503 104,523 9.861,156 35,501 556 15 140,324
1988 1,735.906 10.882 5,594,243 37,145 16,248,822 99,453 10,520,809 37,874 9 0 137,327
1989 2.040,727 12,580 7,096,348 47,119 18,304.948 112,897 10,589.722 38,051 7 0 150,748
1990 2,033,813 12,518 6053,680 48,170 18,090,013 115,018 10,526,833 37,893 524 17 152,928
1991 1,931,997 11,889 6.383.006 42,381 17,132,801 105,339 10,576,111 38,074 546 17 143,430
1992 1,976,620 12,184 6.087,612 40,418 16,775,187 102,918 10,694.444 38,500 1,293 41 141,457
Barrel so 36 Canadian Gallons
- 0.15911 cu.m.
M.W.H. Mega Watt-Hours - 1.000.000 Watt-Hours KJ kilojoule (1kj - 0.947813 B.T.U.)
Diesel Fuel Oil and Heavy Fuel Oil includes fuel used to generate electricity.
• - Consumption of lubricating oils and greases and sales of asphalts has been omitted.
Additional Data: Monthly; Consumption of Energy by Type and Industry, Production, Value.
Source: Statistics Canada, 57-202, 45-002, 57-003.

90
1191
10
11111
•111
111•
1 1O
SO
SS
000
0S
1111
1111
118
0•9
801
1M
OO
SO
page 205
TABLE S-7 NUMBER OF OCCUPIED DWELLINGS BY PRINCIPAL HEATING FUEL NEWFOUNDLAND AND LABRADOR, 1951 TO 1992
Year
Total Occupied Dwellings
Oil or Other Liquid Fuel
(Including Kerosene) Coal
or Coke Wood Electricity
1951 70,980 7,015 33,255 30,495 100 1955 83,000 12,000 39,000 32,000 1956 78,808 14,000 40,000 33,000 1957 87,000 24,000 29,000 34,000 1958 86,000 24,000 29,000 33,000 1959 87,000 31,000 17,000 38,000 1960 92,000 28,000 27,000 37,000 1961 87,940 35,684 24,454 27,230 270 1962 90,000 36,000 19,000 35,000 1963 92,000 42,000 19,000 31,000 1964 94,000 51,000 20,000 23,000 1965 96,000 60,000 10,000 25,000 1966 96,632 62,000 14,000 20,000 1967 98,000 71,000 9,000 17,000 1968 100,000 73,000 10,000 16,000 1969 102,000 78,000 7,000 16,000 1970 103,000 86,000 5,000 9,000 4,000 1971 110,185 90,710 2,885 11,570 4,815 1972 114,000 97,000 • 8,000 6,000 1973 118,000 100,000 • 6,000 10,000 1974 121,000 96,000 ' 7,000 17,000 1975 124,000 97,000 • 6,000 21,000 1976 131,665 91,000 • 5,000 32,000 1977 133,000 89,000 • 6,000 37,000 1978 136,000 91,000 • 6,000 38,000 1979 138,000 87,000 • 9,000 42,000 1980 142,000 76,000 • 17,000 48,000 1981 148,420 76,290 50,100 1982 150,000 69,000 • 26,000 54,000 1983 152,000 70,000 . 29,000 53,000 1984 154,000 65,000 • 36,000 53,000 1985 157,000 56,000 . 38,000 62,000 1986 159,085 48,145 95 46,455 63,835 1987 163,000 53,000 . 42,000 67,000 1988 166,000 58,000 . 38,000 69,000 1989 167,000 61,000 . 36,000 70,000 1990 173,000 55,000 . 38,000 79,000 1991 177,000 59,000 • 41,000 76,000 1992 177,000 59,000 • 37,000 80,000 • Too small to be published.
.. Not available
For the years 1951, 1961, 1971, 1981 and 1986 Census data were used. Counts of the total occupied dwellings for the years 1956, 1966 and 1976 were taken from the Census.
Additional Data: Crossclassifications from 1971 and 1981 census, Statistics Canada 57-202.
Source: Statistics Canada 64-202, Census of Canada.

SO
11.1
1•
1111
OS
SIIM
IIM
OS
OS
OM
IPO
SO
118
110
11O
SO
SS
OO
SECTION T
TRADE AND SERVICES

1111
11O
OSO
MM
OS
SO
1111
1111
0•11
1111
11O
OS
OS
SII
SS
OS
SII
IIS
II
page 207
SECTION 'r
TABLE T-2
Passenger Cars
Denotes all vehicles whose principal function is to carry passengers, including those used for commercial purposes. (i.e. taxis, rented automobiles and limousines, and other fleets).
Commercial Vehicles
This term limited solely to "trucks" and "buses", this designation applies regardless of the use to which such vehicles are put.
TABLE T-3
Alcoholic Beverages
Volume and value of alcoholic beverages (Canadian and Imported products) sold (i) by liquor authorities to final consumers and to holders of licences to resell; (ii) by wineries and breweries to holders of licences to resell and (iii) by wineries and brewers' retail outlets. Value figures do not represent the final retail selling price of alcoholic beverages as mark-ups by licensees are not included.
TABLE T-4
Licensed Restaurants
Establishments primarily engaged in preparing and serving meals for consumption on the premises, with a licence to serve alcoholic beverages.
Unlicensed Restaurants
Establishments primarily engaged in preparing and serving meals for consumption on the premises but without a licence to serve alcoholic beverages. Included are establishments referred to as "Drive-Ins", where food is consumed either in the customers' motor vehicles or at tables in or about the premises.

OM
OO
OO
OM
OO
OS
SO
OO
OS
OO
MO
SO
SO
OS
SO
OS
SI D
OO
O
page 208
Take-Out Food Services
Establishments primarily engaged in preparing and selling packaged or wrapped food to the public, mostly for consumption away from the premises. Such establishments usually concentrate on certain lines of food such as chinese, pizza, chicken, etc. with more than one line often being offered. Refreshment stands, frequently seasonal, selling such foods as hot dogs, hamburgers, chips and ice cream, are included here.
Caterers (Industrial. Social and Mobile)
Establishments primarily engaged in preparing and serving food and beverages under contract on others' premises, such as schools, factories and offices, etc. They may also prepare food on their own premises for delivery to parties, receptions, etc., and may also serve the food and provide bar-tending services (social caterers). Mobile caterers who drive to changing locations carrying prepared food, are also included here.
Taverns. Bars and Night Clubs
Establishments primarily engaged in selling alcoholic beverages for consumption on the premises. Food may be sold in minor quantities and entertainment may be provided.
TABLE T-6
Province of lading indicates the province in which the goods were first laden aboard a carrier for export, which may not in all cases represent the province in which the goods were grown, extracted or manufactured.
TABLE T-7
Province of clearance indicates the province in which the goods were cleared by Customs either for immediate consumption or for entry into a bonded Customs Warehouse. This may not always coincide with the province in which the goods are consumed or enter the productive process. Goods are usually cleared at the first Canadian port but they can be bonded and travel to destination point for clearance. Therefore, total domestic imports represents only those goods that have been cleared in Newfoundland and for example, not goods that have been cleared in New Brunswick and travelled to Newfoundland at a later date.

•
III III • •
• • 1111 • III • • III •
II • 1111 •
al • page 209
a a • TABLE T-1
RETAIL TRADE BY BUSINESS GROUP • NEWFOUNDLAND AND LABRADOR, 1951, 1961, 1966 AND 1971 TO 1992 0
Year Food General
Merchandise
New Motor Vehicle Dealers
Service Stations
Clothing Stores
Furniture, Appliances & Hardware
Pharmacies & Cosmetic
Stores Jewellery
Stores Other Retail Total
(MILLIONS OF DOLLARS)
1951 51.9 69.3 11.8 2.0 6.0 3.6 1.7 0.7 12.7 159.8 1961 72.8 99.9 21.4 14.1 13.1 9.2 5.2 1.2 48.8 285.6 1966 112.4 111.4 68.3 20.7 16.8 12.2 9.8 1.6 52.3 405.6 1971 158.0 144.4 103.7 44.6 25.6 15.6 14.9 2.3 74.1 583.1 1972 145.0 172.4 119.9 50.1 27.9 12.3 20.6 2.5 87.0 637.7 1973 161.4 195.6 144.3 48.2 30.4 13.4 23.3 3.2 97.2 717.1 1974 195.1 246.1 157.6 50.9 32.1 18.4 27.4 3.8 112.0 843.5 1975 238.1 251.0 182.3 58.5 37.7 31.9 33.1 5.5 133.8 971.9 1976 1977
271.0 278.5
240.0 255.6
184.9 194.8
78.9 105.1
44.0 46.2
24.9 27.0
39.8 46.1
5.7 6.4
159.1 176.6
1,048.4 1,136.4
1978 310.6 273.0 249.4 120.9 52.9 35.4 52.8 7.1 193.1 1,295.2 1979 364.6 290.7 260.4 129.0 68.0 40.6 57.1 7.7 217.2 1,435.4 1980 378.7 298.0 270.1 134.5 77.6 37.4 63.5 7.0 230.9 1,497.7 1981 453.5 327.0 247.4 157.2 79.5 35.2 79.0 7.0 252.3 1,638.1 1982 476.0 339.8 248.1 190.3 88.9 40.7 92.0 7.4 277.9 1,761.2 1983 560.6 332.2 295.7 207.9 106.4 45.9 97.9 9.5 314.4 1,970.5 1984 580.9 336.3 324.3 221.1 104.2 59.9 95.6 9.2 339.6 2,071.1 1985 640.7 350.6 375.8 213.9 116.4 56.9 115.6 8.9 375.4 2,254.1 1986 675.6 364.1 413.4 174.5 132.0 77.8 142.9 11.2 414.9 2,406.6 1987 732.0 385.3 504.9 287.9 141.0 83.8 161.1 11.8 447.4 2,755.2 1988 843.6 408.0 559.7 322.6 142.0 102.0 192.7 14.9 488.4 3,073.6 1989 906.2 516.1 639.5 364.0 146.7 123.7 208.3 451.5 3,356.0 1990 976.5 551.4 610.8 417.1 153.1 116.4 224.6 477.5 3,527.4 1991 1,024.3 551.1 529.9 453.7 137.8 108.8 234.2 354.2 3,394.0 1992 1,070.9 455.7 536.9 348.5 137.3 106.7 239.9 463.2 3,359.1
III The data is not comparable in that 1951 and 1961 data are based on kind of business catagories employed in the 1981 Census • of Merchandising and Services, 1971 to 1988 data is based on 1966 Census of Business categories and 1989 to 1992 data
is based on a new Retail Trade Survey implemented in 1990 which utilizes the 1980 Standard Industrial Classification. • Data for 1989 and 1990 is not comparable with 1991 and 1992 due to the introduction of the Goods and Services Tax (GST) in 1991.
IIII In 1989 and 1990, the Federal Sales Tax was in effect and is included in the retail trade data. In 1991 and 1992, the GST was in effect and is not included in the retail trade data. It is estimated that the FST accounted for 4.2% of retail trade at the Canada
• level in 1990.
• Additional Data: Additional business group categories. • Source: Statistics Canada, Merchandising and Services Division;
a • • a • a • a
Catalogue 63-005 and Census Catalogues 97-501, 97-602, 97-702.
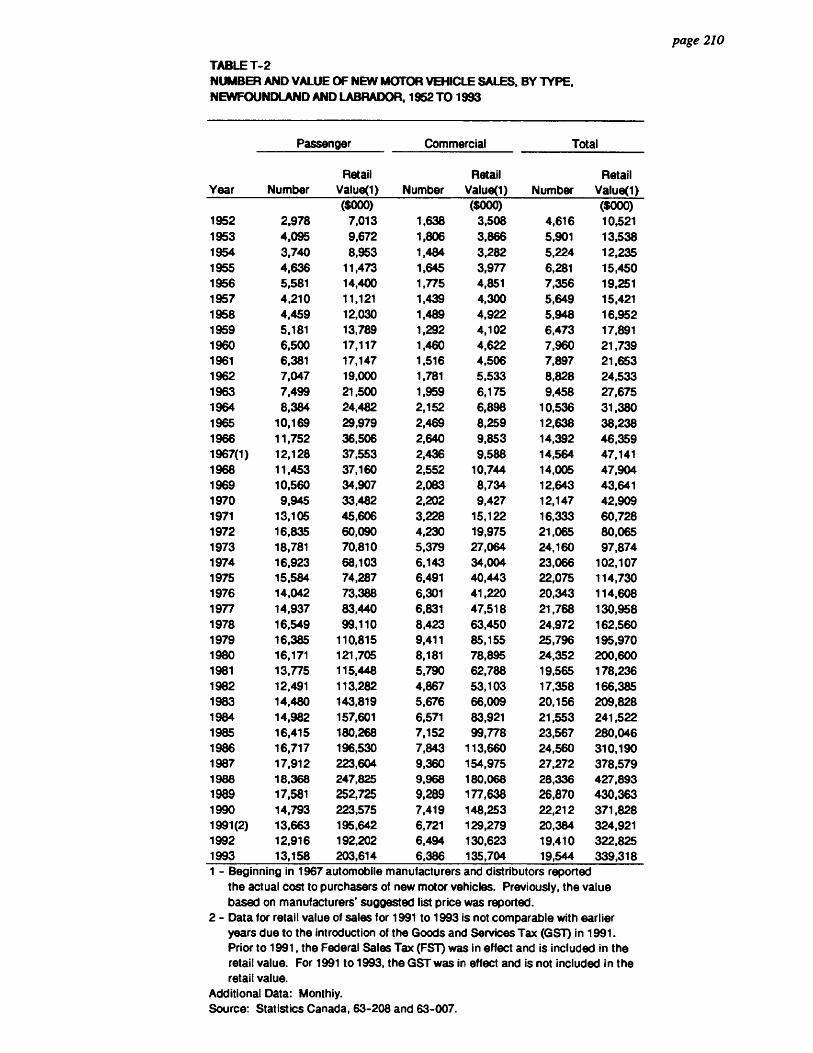
TABLE T-2 NUMBER AND VALUE OF NEW MOTOR VEHICLE SALES, BY 'TYPE, NEWFOUNDLAND AND LABRADOR, 1952 TO 1993
Year
Passenger Commercial Total
Number Retail
Value(1) Number Retail
Value(1) Number Retail
Value(1) ($000) ($000) ($000)
1952 2,978 7,013 1,638 3,508 4,616 10,521 1953 4,095 9,672 1,806 3,866 5,901 13,538 1954 3,740 8,953 1,484 3,282 5,224 12,235 1955 4,636 11,473 1,645 3,977 6,281 15,450 1956 5,581 14,400 1,775 4,851 7,356 19,251 1957 4,210 11,121 1,439 4,300 5,649 15,421 1958 4,459 12,030 1,489 4,922 5,948 16,952 1959 5,181 13,789 1,292 4,102 6,473 17,891 1960 6,500 17,117 1,460 4,622 7,960 21,739 1961 6,381 17,147 1,516 4,506 7,897 21,653 1962 7,047 19,000 1,781 5,533 8,828 24,533 1963 7,499 21,500 1,959 6,175 9,458 27,675 1964 8,384 24,482 2,152 6,898 10,536 31,380 1965 10,169 29,979 2,469 8,259 12,638 38,238 1966 11,752 36,506 2,640 9,853 14,392 46,359 1967(1) 12,128 37,553 2,436 9,588 14,564 47,141 1968 11,453 37,160 2,552 10,744 14,005 47,904 1969 10,560 34,907 2,083 8,734 12,643 43,641 1970 9,945 33,482 2,202 9,427 12,147 42,909 1971 13,105 45,606 3,228 15,122 16,333 60,728 1972 16,835 60,090 4,230 19,975 21,065 80,065 1973 18,781 70,810 5,379 27,064 24,160 97,874 1974 16,923 68,103 6,143 34,004 23,066 102,107 1975 15,584 74,287 6,491 40,443 22,075 114,730 1976 14,042 73,388 6,301 41,220 20,343 114,608 1977 14,937 83,440 6,831 47,518 21,768 130,958 1978 16,549 99,110 8,423 63,450 24,972 162,560 1979 16,385 110,815 9,411 85,155 25,796 195,970 1980 16,171 121,705 8,181 78,895 24,352 200,600 1981 13,775 115,448 5,790 62,788 19,565 178,236 1982 12,491 113,282 4,867 53,103 17,358 166,385 1983 14,480 143,819 5,676 66,009 20,156 209,828 1984 14,982 157,601 6,571 83,921 21,553 241,522 1985 16,415 180,268 7,152 99,778 23,567 280,046 1986 16,717 196,530 7,843 113,660 24,560 310,190 1987 17,912 223,604 9,360 154,975 27,272 378,579 1988 18,368 247,825 9,968 180,068 28,336 427,893 1989 17,581 252,725 9,289 177,638 26,870 430,363 1990 14,793 223,575 7,419 148,253 22,212 371,828 1991(2) 13,663 195,642 6,721 129,279 20,384 324,921 1992 12,916 192,202 6,494 130,623 19,410 322,825 1993 13,158 203,614 6,386 135,704 19,544 339,318 1 - Beginning in 1967 automobile manufacturers and distributors reported
the actual cost to purchasers of new motor vehicles. Previously, the value based on manufacturers' suggested list price was reported.
2 - Data for retail value of sales for 1991 to 1993 is not comparable with earlier years due to the introduction of the Goods and Services Tax (GST) in 1991. Prior to 1991, the Federal Sales Tax (FST) was in effect and is included in the retail value. For 1991 to 1993, the GST was in effect and is not included in the retail value.
Additional Data: Monthly. Source: Statistics Canada, 63-208 and 63-007.
page 210
OM
SO
OO
OO
SO
SO
OOO
MO
OS
OS
OO
SS
OS
OO
OS
SO
SS
OS
OO

SIIII
IIO
SS
IMO
SS
OS
S11
1111
1111
1111
1181
1M
IIIIO
SS
OS
OO
SS
IOS
O
page 211
TABLE T-3 VOLUME AND VALUE OF SALES OF ALCOHOLIC BEVERAGES NEWFOUNDLAND AND LABRADOR, 1950-1992(1)
Year VALUE VOLUME
Total Spirits Wines Beer Total Spirits Wines Beer thousands of dollars thousands of litres
1950 4,453 3,388 181 884 - - 1955 12,218 4,029 364 7,825 11,560 768 209 10,583 1960 16,429 5,602 540 10,287 14,779 891 318 13,570 1961 16,936 5,662 574 10,700 15,370 886 336 14,147
1962 18,029 5,911 571 11,547 16,438 927 332 • 15,179 1963 19,625 6,353 620 12,652 17,720 941 327 16,452 1964 20,782 6,683 635 13,464 18,998 982 318 17,698 1965 22,480 7,421 631 14,428 17,916 982 259 16,675 1966 24,915 8,570 626 15,719 19,416 1,168 250 17,998 1967 29,113 11,210 677 17,226 21,662 1,527 259 19,875 1968 31,759 12,362 730 18,667 23,285 1,655 264 21,366 1969 33,009 13,239 834 18,936 22,275 1,577 268 20,430 1970 35,853 13,956 964 20,933 24,566 1,677 300 22,589 1971 39,794 15,085 1,173 23,536 27,581 1,832 373 25,376 1972 47,782 17,963 1,640 28,179 33,145 2,132 546 30,467 1973 57,359 21,398 2,230 33,731 39,782 2,523 705 36,554 1974 68,992 25,183 3,124 40,685 50,978 2,841 918 47,219 1975 77,184 29,288 3,811 44,085 49,447 3,214 1,082 45,151 1976 87,595 32,157 4,096 51,342 53,029 3,178 1,023 48,828 1977 97,494 38,154 4,803 54,537 51,207 3,692 1,237 46,278 1978 103,661 40,687 5,005 57,969 52,698 3,837 1,273 47,588 1979 110,819 42,509 5,436 62,874 54,098 3,864 1,337 48,897 1980 122,881 46,016 6,333 70,532 57,754 3,973 1,462 52,319 1981 138,364 49,728 7,825 80,811 55,444 4,018 1,613 49,813 1982 163,748 55,542 8,876 99,930 55,067 3,981 1,658 49,428 1983 184,883 61,645 9,874 113,364 56,266 3,956 1,685 50,625 1984 197,901 64,686 10,905 122,310 54,610 3,893 1,619 49,098 1985 211,661 64,507 11,050 136,104 56,302 3,651 1,628 51,023 1986 198,691 75,248 12,396 111,047 45,134 4,094 1,827 39,213 1987 225,770 69,602 11,777 144,391 54,925 3,706 1,691 49,528 1988 238,851 74,153 12,846 151,852 57,085 3,827 1,760 51,498 1989 255,212 77,850 13,151 164,211 57,832 3,917 1,613 52,302 1990 257,148 79,702 13,073 164,373 55,403 3,983 1,586 49,834 1991 261,685 81,338 13,245 167,102 54,383 3,936 1,543 48,904 1992 263,990 80,506 14,594 168,890 53,136 3,649 1,732 47,755
1 - Year reported signifies Fiscal Year ending March 31.
Additional Data: Data available for all years 1950-1992. More detailed breakdown by type also available. Similar breakdown available for sales of Canadian and Imported Beverages.
Source: Statistics Canada, The Control and Sale of Alocholic Beverages in Canada, 63-202.

TABLE T-4 ESTIMATED RESTAURANTS RECEIPTS, NEWFOUNDLAND AND LABRADOR, BY KIND OF BUSINESS, 1978 TO 1993
Year Restaurants,
Licensed Restaurants, Unlicensed Take-Outs Caterers Taverns Total
(Millions of Dollars)
1978 17.7 16.0 27.6 17.0 33.9 112.2 1979 18.9 16.6 29.5 18.2 36.4 119.6 1980 20.8 18.4 32.6 20.1 40.2 132.1 1981 21.6 18.2 33.6 20.8 40.7 134.8 1982 18.2 23.0 32.4 22.1 41.5 137.2 1983 23.2 26.6 27.8 23.3 39.7 140.7 1984 20.4 28.2 18.3 24.8 38.3 129.9 1985 23.2 25.6 19.4 19.0 35.1 122.3 1986 24.3 26.4 26.9 21.8 36.1 135.4 1987 22.9 29.3 37.1 20.1 35.5 145.0 1988 28.8 30.7 42.7 20.4 40.6 163.3 1989 40.2 43.1 49.8 17.8 40.7 190.9 1990 43.4 42.2 44.3 20.7 35.8 186.4 1991 41.3 45.5 43.8 27.2 37.2 195.0 1992 47.4 45.3 49.3 32.1 34.5 208.7 1993p 48.3 46.7 54.1 35.2 35.3 219.6
A minor break in the series occurs between 1988 and 1989 because of modifications to the normal estimation process.
Source: Statistics Canada, Catalogue #63-011 and Merchandising and Services Division.
page 212
INS
OIS
OO
1111
011
1111
1100
91 1
110•1
111
11O
SO
SS
I IM
OS
SO
OS
SO
1 111
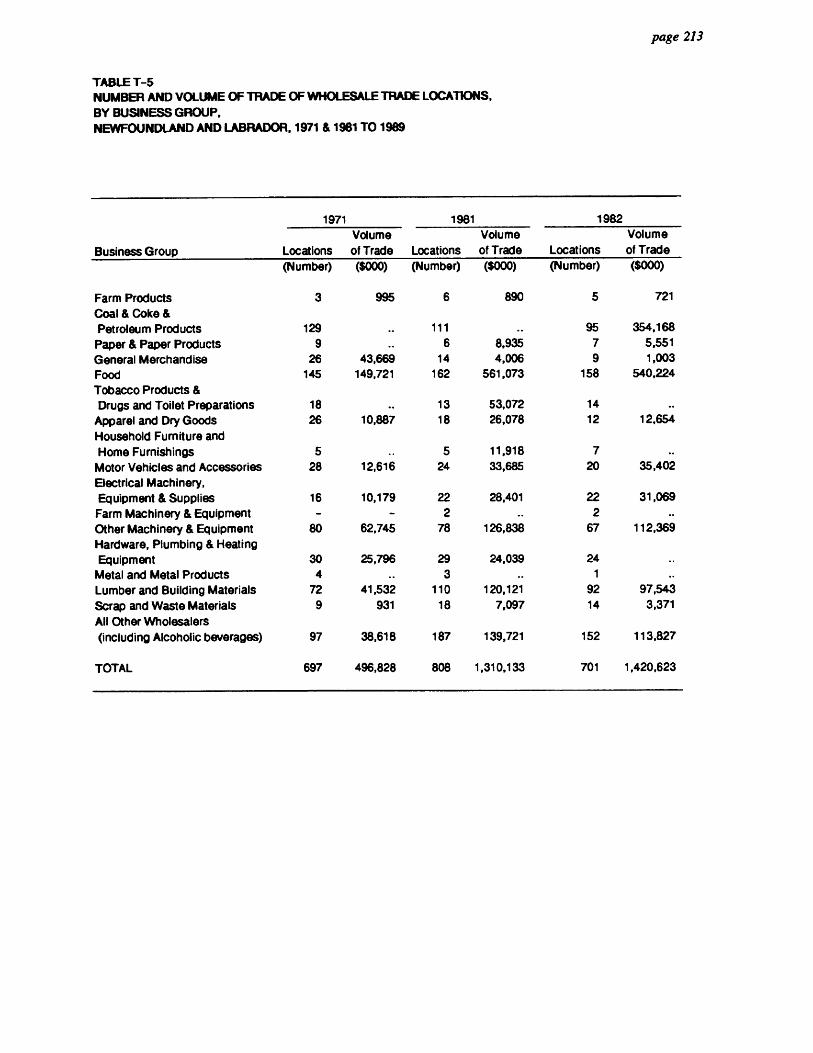
SO
IDO
OSO
MO
MO
MO
SS
O11
110•1
1•1
111O
MO
MO
SIISII
page 213
TABLE T-5 NUMBER AND VOLUME OF TRADE OF WHOLESALE TRADE LOCATIONS, BY BUSINESS GROUP, NEWFOUNDLAND AND LABRADOR, 1971 & 1981 TO 1989
Business Group
1971 1981 1982
Locations Volume of Trade
Volume Locations of Trade Locations
Volume of Trade
(Number) ($000) (Number) ($000) (Number) m ber) ($000)
Farm Products 3 995 6 890 5 721 Coal & Coke & Petroleum Products 129 111 95 354,168 Paper & Paper Products 9 6 8,935 7 5,551 General Merchandise 26 43,669 14 4,006 9 1,003 Food 145 149,721 162 561,073 158 540,224 Tobacco Products & Drugs and Toilet Preparations 18 13 53,072 14 Apparel and Dry Goods 26 10,887 18 26,078 12 12,654 Household Furniture and Home Furnishings 5 5 11,918 7
Motor Vehicles and Accessories 28 12,616 24 33,685 20 35,402 Electrical Machinery, Equipment & Supplies 16 10,179 22 28,401 22 31,069 Farm Machinery & Equipment - - 2 2 Other Machinery & Equipment 80 62,745 78 126,838 67 112,369 Hardware, Plumbing & Heating Equipment 30 25,796 29 24,039 24
Metal and Metal Products 4 3 1 Lumber and Building Materials 72 41,532 110 120,121 92 97,543 Scrap and Waste Materials 9 931 18 7,097 14 3,371 All Other Wholesalers (including Alcoholic beverages) 97 38,618 187 139,721 152 113,827
TOTAL 697 496,828 808 1,310,133 701 1,420,623
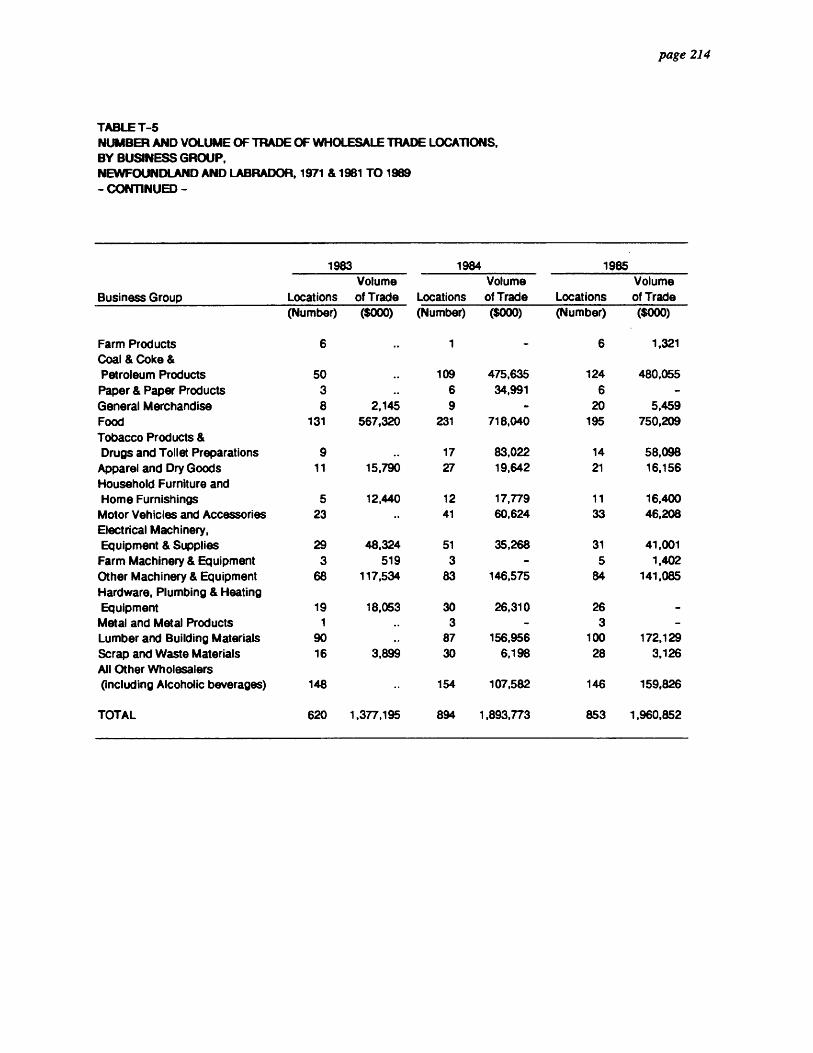
al a a • Ill in • o a et a • is a • a I) S se s al a III • S S i • a al Is al • • • • a a • a • a
page 214
TABLE T-5 NUMBER AND VOLUME OF TRADE OF WHOLESALE TRADE LOCATIONS, BY BUSINESS GROUP, NEWFOUNDLAND AND LABRADOR, 1971 & 1981 TO 1989 - CONTINUED -
Business Group
1983 1984 1985 Volume
Locations of Trade Volume
Locations of Trade Locations Volume of Trade
(Number) ($000) (Number) ($000) (Number) ($000)
Farm Products 6 1 - 6 1,321 Coal & Coke & Petroleum Products 50 109 475,635 124 480,055
Paper & Paper Products 3 6 34,991 6 General Merchandise 8 2,145 9 - 20 5,459 Food 131 567,320 231 718,040 195 750,209 Tobacco Products & Drugs and Toilet Preparations 9 17 83,022 14 58,098
Apparel and Dry Goods 11 15,790 27 19,642 21 16,156 Household Furniture and Home Furnishings 5 12,440 12 17,779 11 16,400
Motor Vehicles and Accessories 23 41 60,624 33 46,208 Electrical Machinery, Equipment & Supplies 29 48,324 51 35,268 31 41,001
Farm Machinery & Equipment 3 519 3 5 1,402 Other Machinery & Equipment 68 117,534 83 146,575 84 141,085 Hardware, Plumbing & Heating Equipment 19 18,053 30 26,310 26
Metal and Metal Products 1 3 3 Lumber and Building Materials 90 87 156,956 100 172,129 Scrap and Waste Materials 16 3,899 30 6,198 28 3,126 All Other Wholesalers (including Alcoholic beverages) 148 154 107,582 146 159,826
TOTAL 620 1,377,195 894 1,893,773 853 1,960,852

•
0
ao
0 0 0
0
•
• •
page 215
TABLE T-5 NUMBER AND VOLUME OF TRADE OF WHOLESALE TRADE LOCATIONS, BY BUSINESS GROUP, NEWFOUNDLAND AND LABRADOR, 1971 & 1981 TO 1989 - CONTINUED -
Business Group
1986 1987 1988 1989 Volume
Locations of Trade Volume
Locations of Trade Locations Volume of Trade
Volume Locations of Trade
(Number) - ($000) (Number) ($000) (Number) ($000) (Number) ($000)
Farm Products 4 534 1 2 2
Coal & Coke & 98 481,666 123 504,643
Petroleum Products 125 123 Paper & Paper Products 7 6 8 46,720 7 32,228
General Merchandise 6 2,768 3 1,695 6 - 53 4,824
Food 206 812,814 174 754,706 178 918,772 186 883,012
Tobacco Products & 16 - 21 95,664
Drugs and Toilet Preparations 16 67,858 16 85,683 Apparel and Dry Goods 24 16,368 20 14,249 16 12,752 12 15,972
Household Furniture and 9 19,434 8
Home Furnishings 8 17,495 8 17,058 Motor Vehicles and Accessories 45 45,997 41 61,173 41 76,820 39 49,728
Electrical Machinery, 42 52,555 42 118,971
Equipment & Supplies 51 40,391 35 45,670 Farm Machinery & Equipment 4 1,619 2 3 3,154 4
Other Machinery & Equipment 86 165,957 88 113 188,773 114 266,682 Hardware, Plumbing & Heating 20 25 21,752
Equipment 24 25,929 19 34,364 Metal and Metal Products 3 3 1 - 1 -
Lumber and Building Materials 96 166,320 90 197,637 99 219,601 94 287,420
Scrap and Waste Materials 33 3,571 27 3,920 23 12,977 24 8,517
All Other Wholesalers 204 187,227 200 248,174
(including Alcoholic beverages) 192 138,785 183 169,756
TOTAL 930 1,825,152 839 1,934,227 972 2,407,314 955 2,581,277
The above Business Groups are based on the 1970 Standard Industrial Classification.
Additional Data: Similar data available for 1951 and 1961 based on kind of business definitions in effect in those census years
The following data is available for 1971 for the above kind of business groupings and sub-groupings: Inventory at end of year; Number of Working Proprietors; Number of Paid Employees and Total Payroll for year. All data is available for census metropolitan areas, and census divisions, and incorporated places of 5,000 population and over and by size of business.
Source: Statistics Canada, 97-722 & 63-226.
0
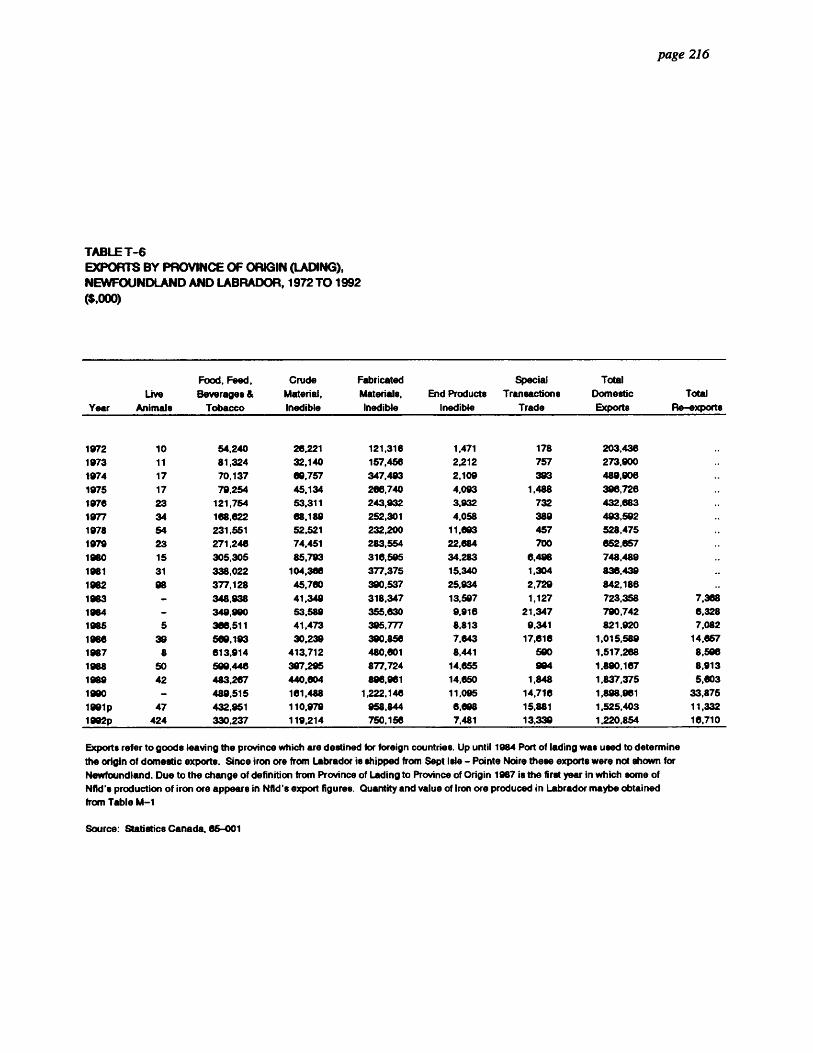
1111
1111
0•
11
•111
1111
1111
OOM
OO
SO
SO
SO
OO
SO
S010.
sO
SS
OS
OS
page 216
TABLE T-6 EXPORTS BY PROVINCE OF ORIGIN (LADING), NEWFOUNDLAND AND LABRADOR, 1972 TO 1992 ($,000)
Year Live
Animals
Food, Feed,
Beverages &
Tobacco
Crude
Material,
Inedible
Fabricated
Materials,
Inedible
End Products
Inedible
Special
Transactions
Trade
Total
Domestic
Exports
Total
Re-exports
1972 10 54,240 26,221 121,316 1,471 178 203,436
1973 11 81,324 32,140 157,456 2,212 757 273,900
1974 17 70,137 60,757 347,493 2,109 393 489,906
1975 17 79,254 45,134 268,740 4,093 1,488 396,726
1976 23 121,754 53,311 243,932 3,932 732 432,683
1977 34 168,622 68,189 252,301 4,058 389 493,592
1978 54 231,551 52,521 232,200 11,693 457 528,475
1979 23 271246 74,451 283,554 22,684 700 852,657
1980 15 305,305 85,793 316,595 34283 6,498 748,489
1981 31 338,022 104,368 377,375 15,340 1,304 838,439
1982 98 377,128 45,760 390,537 25,934 2,729 842,188 ..
1983 348.938 41,349 318.347 13,597 1,127 723,358 7.368
1984 - 349,990 53,589 355,630 9,916 21,347 790,742 6,328
1985 5 366,511 41,473 395,777 8,813 9,341 821,920 7,082
1986 39 569,193 30,239 390,856 7,643 17,616 1,015,589 14,657
1987 8 613,914 413,712 480,801 8,441 590 1,517,268 8,596
1988 50 599,446 397,295 877,724 14,655 994 1,890.167 8,913
1989 42 483,267 440,604 896.961 14,650 1,848 1,837,375 5,603
1990 - 489,515 161,488 1,222.146 11,095 14,716 1,898,961 33,875
1991p 47 432,951 110,979 958,844 8,098 15,881 1,525,403 11,332
1992p 424 330,237 119,214 750.156 7,481 13,339 1.220.854 16,710
Exports refer to goods leaving the province which are destined for foreign countries. Up until 1984 Port of lading was used to determine
the origin of domestic exports. Since iron ore from Labrador is shipped from Sept Isle - Pointe Noire these exports were not shown for
Newfoundland. Due to the change of definition from Province of Lading to Province of Origin 1987 is the first year in which some of
Mid's production of iron ore appears in NM's export figures. Quantity and value of iron ore produced in Labrador maybe obtained
from Table M-1
Source: Statistics Canada, 65-001
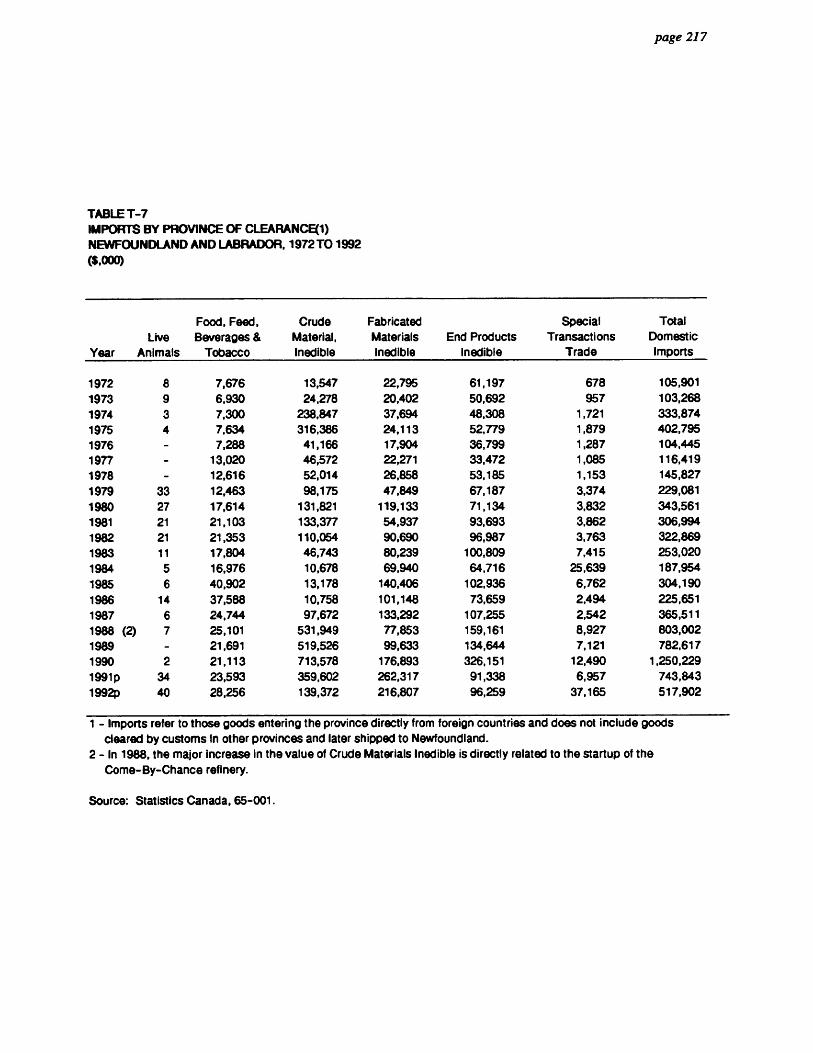
a • page 217
0 . 0
TABLE T-7 Ill IMPORTS BY PROVINCE OF CLEARANCE(1) • NEWFOUNDLAND AND LABRADOR, 1972 TO 1992
• ($,000)
Year Live
Animals
Food, Feed, Beverages &
Tobacco
Crude Material, Inedible
Fabricated Materials Inedible
End Products Inedible
Special Transactions
Trade
Total Domestic Imports
1972 1973 1974 1975 1976 1977 1978 1979 1980 1981 1982 1983 1984 1985 1986 1987 1988 (2) 1989 1990 1991p 1992p
8 9 3 4
-
33 27 21 21 11
5 6
14 6 7
2 34 40
7,676 6,930 7,300 7,634 7,288
13,020 12,616 12,463 17,614 21,103 21,353 17,804 16,976 40,902 37,588 24,744 25,101 21,691 21,113 23,593 28,256
13,547 24,278
238,847 316,386 41,166 46,572 52,014 98,175
131,821 133,377 110,054 46,743 10,678 13,178 10,758 97,672
531,949 519,526 713,578 359,602 139,372
22,795 20,402 37,694 24,113 17,904 22,271 26,858 47,849
119,133 54,937 90,690 80,239 69,940
140,406 101,148 133,292 77,853 99,633
176,893 262,317 216,807
61,197 50,692 48,308 52,779 36,799 33,472 53,185 67,187 71,134 93,693 96,987
100,809 64,716
102,936 73,659
107,255 159,161 134,644 326,151 91,338 96,259
678 957
1,721 1,879 1,287 1,085 1,153 3,374 3,832 3,862 3,763 7,415
25,639 6,762 2,494 2,542 8,927 7,121
12,490 6,957
37,165
105,901 103,268 333,874 402,795 104,445 116,419 145,827 229,081 343,561 306,994 322,869 253,020 187,954 304,190 225,651 365,511 803,002 782,617
1,250,229 743,843 517,902
III 1 - Imports refer to those goods entering the province directly from foreign countries and does not include goods • cleared by customs in other provinces and later shipped to Newfoundland.
• 2 - In 1988, the major increase in the value of Crude Materials Inedible is directly related to the startup of the
Come-By-Chance refinery.
III 1111
Source: Statistics Canada, 65-001.
.
III III • fib III III III III III III II III
. • ID 1111 ID
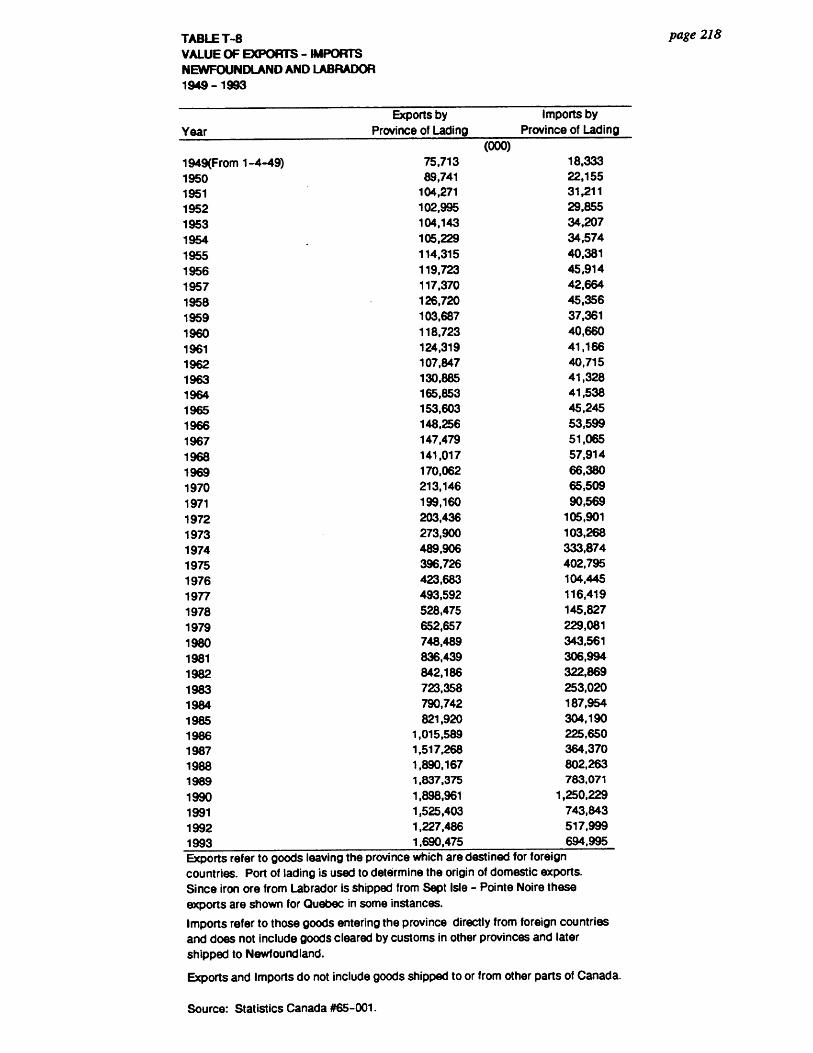
TABLE T-8 VALUE OF EXPORTS - IMPORTS NEWFOUNDLAND AND LABRADOR 1949 -1993
Year Exports by
Province of Lading Imports by
Province of Lading (000)
1949(From 1-4-49) 75,713 18,333 1950 89,741 22,155 1951 104,271 31,211
1952 102,995 29,855 1953 104,143 34,207
1954 105,229 34,574
1955 114,315 40,381 1956 119,723 45,914 1957 117,370 42,664 1958 126,720 45,356
1959 103,687 37,361
1960 118,723 40,660 1961 124,319 41,166
1962 107,847 40,715 1963 130,885 41,328 1964 165,853 41,538 1965 153,603 45,245 1966 148,256 53,599 1967 147,479 51,065
1968 141,017 57,914
1969 170,062 66,380
1970 213,146 65,509
1971 199,160 90,569
1972 203,436 105,901
1973 273,900 103,268 1974 489,906 333,874 1975 396,726 402,795 1976 423,683 104,445 1977 493,592 116,419
1978 528,475 145,827
1979 652,657 229,081
1980 748,489 343,561 1981 836,439 306,994 1982 842,186 322,869 1983 723,358 253,020 1984 790,742 187,954 1985 821,920 304,190 1986 1,015,589 225,650 1987 1,517,268 364,370 1988 1,890,167 802,263 1989 1,837,375 783,071
1990 1,898,961 1,250,229 1991 1,525,403 743,843 1992 1,227,486 517,999 1993 1,690,475 694,995 Exports refer to goods leaving the province which are destined for foreign countries. Port of lading is used to determine the origin of domestic exports. Since iron ore from Labrador is shipped from Sept Isle - Pointe Noire these exports are shown for Quebec in some instances.
Imports refer to those goods entering the province directly from foreign countries and does not include goods cleared by customs in other provinces and later shipped to Newfoundland.
Exports and Imports do not include goods shipped to or from other parts of Canada.
page 218
•
• •
•
• •
• •
•
• • • •
Source: Statistics Canada #65-001.

OO
110
00
1111
000•
1111
011
OOO
MO
OS
SOO
MM
OS
SO
1101160
SECTION U
TOURISM

OO
SO
MO
OO
OO
SS
OO
OM
MO
OS
OS
OO
MO
OM
OO
1100
page 219
SEC770N -U*
TABLE U-1
Licensed Tourist Establishment
Licensed tourist establishments include hotels, motels, motor-hotels, inns, cabins, hospitality homes.
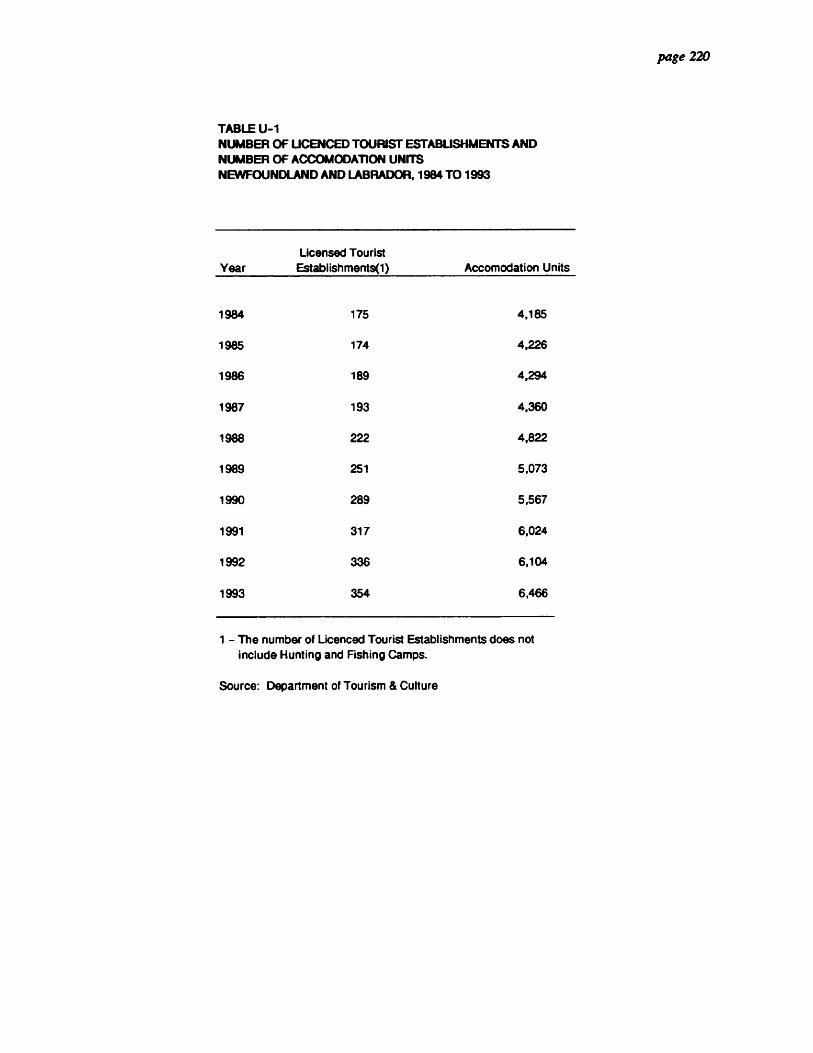
TABLE U-1 NUMBER OF UCENCED TOURIST ESTABUSHMENTS AND NUMBER OF ACCOMODATION UNITS NEWFOUNDLAND AND LABRADOR, 1984 TO 1993
Year Licensed Tourist
Establishments(1) Accomodation Units
1984 175 4,185
1985 174 4,226
1986 189 4,294
1987 193 4,360
1988 222 4,822
1989 251 5,073
1990 289 5,567
1991 317 6,024
1992 336 6,104
1993 354 6,466
1 - The number of Licenced Tourist Establishments does not include Hunting and Fishing Camps.
Source: Department of Tourism & Culture
page 220
001
10
•11
110111
0O
OO
SO
OM
OS
SOM
OO
SO
011
0111
1111
1110
011
011

OO
SO
MO
OS
OO
SO
OS
OO
MM
OO
MO
SS
IPO
OS
OS
SO
SS
O
page 221
TABLE U-2 INLAND FISHERY, VVILDLIFE HUNTING, LICENCES, NEWFOUNDLAND AND LABRADOR, 1970 TO 1992
Total Inland Fishing Licences
Issued
Total Small
Game Licences Issued
Total Big
Game Licences Issued
Total Licences
1970 17,810 48,623 24,559 90,992 1971 17,329 40,212 27,457 84,998 1972 17,782 37,648 25,684 81,114 1973 17,983 37,716 15,329 71,028 1974 25,168 39,025 16,335 80,528 1975 20,765 61,474 16,499 98,738 1976 22,651 79,146 11,797 113,594 1977 23,884 85,569 13,265 122,718 1978 21,692 74,644 15,384 111,720 1979 24,119 79,319 14,820 118,258 1980 21,431 62,772 14,632 98,835 1981 23,394 55,672 13,695 92,761 1982 25,113 61,070 12,649 98,832 1983 24,037 52,500 12,936 89,473 1984 22,247 54,203 15,166 91,616 1985 20,941 48,850 16,502 86,293 1986 23,919 41,987 17,664 83,570 1987 23,422 41,103 20,029 84,554 1988 27,122 47,070 22,378 96,570 1989 23,873 47,837 23,605 95,315 1990 22,808 41,227 28,954 92,989 1991 22,591 29,808 34,460 86,859 1992 22,302
Additional Data: By type of licence, small game, big game for resident and non-resident.
Source: Department of Tourism & Culture

• • • • • • • • • • • • • • • • • • • • • • • • • • • • • • • • • • • • • • • • • • •
SECTION V
POLITICS AND GOVERNMENT

• page 223
•
SEC770N 'V'
TABLE V-2 AND TABLE V-3 • • Registered Voters
Registered voters are all those persons who have been enumerated as qualifying voters at a time prior to an election.
Persons Voting
Persons voting are all those persons who cast a ballot at an election. A persons casting
• a ballot need not be a registered voter because the Election Act provides that any person qualified to be a voter but who is not a registered voter may vote in an election after first taking the approximate oath. Therefore it is possible that the total persons voting could exceed the total registered voters in a provincial election.
•
TABLE V-5
• Provincial Government Enterprises
A provincial government enterprise is an organized entity, usually corporate, which (a) is established by a political decision-making body to produce goods and/or services for sale on the open market at a price related to costs, (b) maintains an independent system
• of accounts that permits the charging of specific elements of costs against the revenue derived from its sale of goods and/or services, (c) has a relatively autonomous management in the conduct of day-to-day operations, and (d) is staffed by personnel not normally subject to the statutory requirements governing employment in the general public
• service.
As of 1983 the Provincial Government Enterprises were as follows:
• Newfoundland Liquor Licensing Board; Auditor General; Newfoundland & Labrador Housing Corporation - St. John's Housing Corporation; Board of Commissioners of Public Utilities; Churchill Falls (Labrador) Corporation; Fisheries Loan Board; Newfoundland and Labrador Hydro Corporation; Newfoundland Medical Care Commission; Welfare Institutions Licensing & Inspection Authority; C.A. Pippy Park Commission; Public Service Commission; Institute of Fisheries and Marine Technology; Cabot Institute of Applied Arts & Technology; Newfoundland Liquor Corporation; Marystown Shipyard Limited; Enterprise Newfoundland & Labrador Corporation; Newfoundland & Labrador Computer Services; Agricultural Products Marketing Board; Economic Recovery Commission; Newfoundland Farm Products Corporation; Worker's Compensation Board. •
411 •
•

ID NEWFOUNDLAND AND LABRADOR, 1949 TO 1991
• • • ft • • 41111 IIII IIII • • II II • • III ID ID
Source: Department of Justice.
IIII III • II II • 41111 • • - • • II • IIII IIIII 0 •
Term of Commission Lieutenant-Governor
Date of Commission
1949 Sir Albert Joseph Walsh April 1, 1949
1949-1957 Lt. Col. Sir Leonard Outerbridge September 5, 1949
1957-1963 Hon. Campbell L. Macpherson December 16, 1957
1963-1969 Hon. Fabian O'Dea March 1, 1963
1969-1974 Hon. E. John A. Harnum April 1, 1969
1974-1981 Hon. Dr. Gordon A. Winter July 2, 1974
1981-1986 Hon. W. Anthony Paddon C.M.,M.D. July 10, 1981
1986-1991 Hon. James A. McGrath September 5, 1986
1991- Hon. Frederick William Russell November 5, 1991
-• page 225
a a 0
TABLE V-1 • LIEUTENANT-GOVERNORS,

• page 227
0
• 0
0
Date of Elections
June 27, 1949
• August 10.1953
June 10. 1957
III March 31, 1958 June 18, 1902
ID April 8, 1963
III September 8, 1965
June 25.19x8
II October 30, 1972
July 8. 1974
• May 22, 1979
February 18,1980
III September 4, 1984
November 21, 1988 s October 25, 1993
Number of
Registered
Voters
Number of
Persons
Voted
Percentage
of Persons
Voting
Number of
Rejected
Ballots
Number of
Valid
Ballots
Total
Percent
Valid
Ballots(1)
Liberals
Number
of
Votes
Percent
of
Total
Number
of
Seats
182,439 105,190 57.7 555 104,835 9047 75,235 71.9 5
194,715 111,768 57.4 1.185 110,583 98.94 74,357 67.4 7
179,073 92,986 51.9 877 92,109 99.06 56,993 61.9 5
204,778 160,928 78.6 1,183 150,745 99.28 86,900 ' 54.4 5
215,565 155,263 72.0 1,223 154,040 99.21 90,896 59.0 8 221,321 152,976 69.1 801 152,175 99.48 97,576 64.1 7
226,082 148.392 65.6 1,347 147,045 90.09 94,291 64.1 7
237,594 161,570 68.0 1,370 100.200 99.15 68,549 42.8 1
289,294 182.482 83.0 7,436 175,048 95.93 78,505 44.8 3
304,329 175,505 57.7 1,538 173,967 99.12 81,318 46.7 4
338,730 203,238 80.0 1,539 201,090 99.24 81,881 40.6 4
348,281 204,306 59.0 1.047 203,259 99.49 95,354 46.9 5
385,157 242,314 86.4 1,329 240,985 99.45 87,678 38.4 3
5 384,236 257,793 67.1 1.082 256,731 90.59 115,588 44.8
419.835 231.424 55.1 834 230,590 99.64 155,237 67.1 7
TABLE V-3 SELECTED STATISTICS OF FEDERAL ELECTIONS, NEWFOUNDLAND AND LABRADOR, 1949 TO 1993
IIII Progressive Conservative New Democratic Party(2) Other
0 Number Percent Number Number Percent Number Number Percent Number Total
of of of of of of of of of Number
411 Date of Elections Votes Total Seats Votes Total Seats Votes Total Seats of Seats
III June 27, 1949
August 10. 1953 0 June 10. 1967
. March 31, 1958 June 18,1082
1111 April 8,1963
September 8, 1985
411 June 25, 1968
October 30, 1972
III July 8. 1974
May 22, 1979 III February 18, 1980
ill September 4, 1984
November 21, 1988
II October 25, 1993
29,203 27.9 2 197 0.2 - - - 7
31,080 28.1 - 707 0.1 - 4,459 4.0 - 7
34,795 37.8 2 321 - - - - - 7
72,282 45.2 2 240 - - 263 0.2 7
55,396 38.0 1 7,590 4.9 - 158 - - 7
45,491 29.9 6,384 4.2 1.943 1.3 7
47,838 32.4 - 1,742 1.2 - 3,374 2.3 - 7
84,483 52.7 8 7,042 4.4 126 - - 7
85,857 49.0 4 8,165 4.8 - 2,519 1.4 - 7
75,780 43.6 3 16,439 9.4 - 430 0.3 - 7
59,893 29.7 2 59,978 29.7 1 - - 7
72,009 35.9 2 33.943 16.7 - - 7
138,794 57.6 4 13,992 5.8 - 521 0.2 7
108,349 42.0 2 31,769 12.3 - 1,025 0.4 - 7 61,488 26.6 - 8.080 3.5 - 6,619 2.9 - 7
III 1 - Totals may not add because of rounding.
2 - Data for the election prior to 1962 refers to the Co-operative Commonwealth Federation (C.C.F.)
III Additional Data: Electoral district; same as above, name, address and occupation by polling division.
Source: Federal Electoral Office.
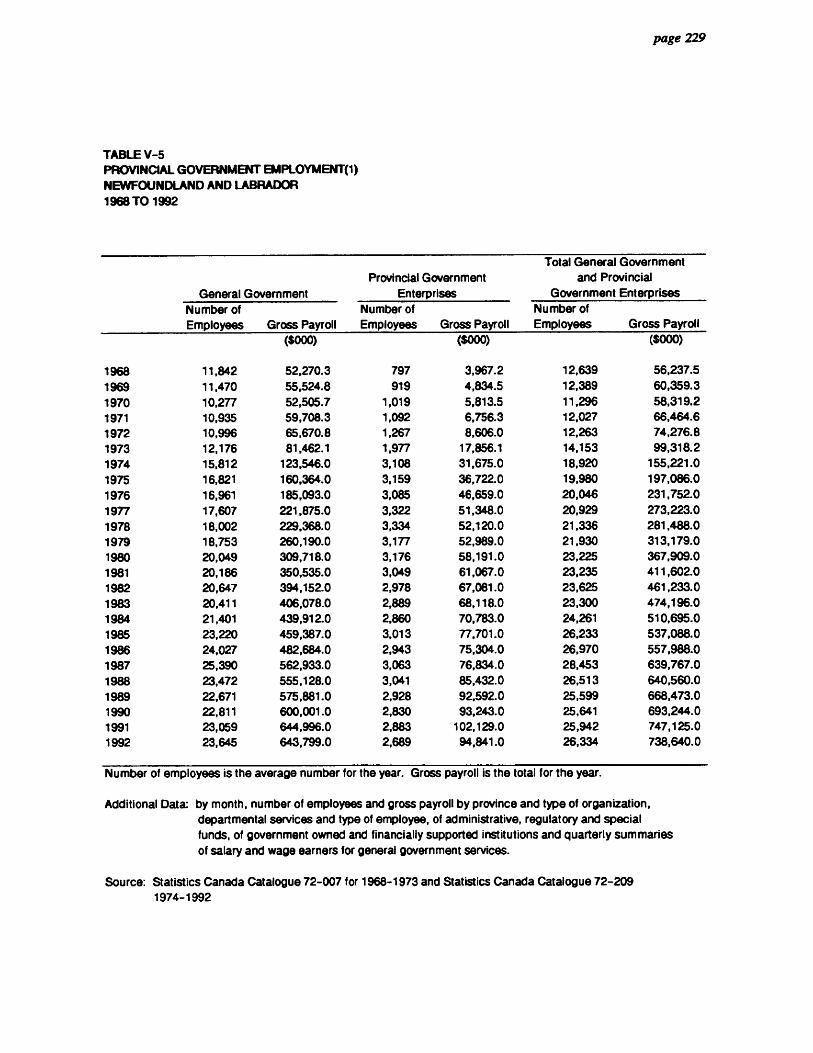
General Government Number of
Provincial Government Enterprises
Number of
1111
SO
OS
IIII
1111
111 1
11••••••••••11
0011M
OS
SO
SO
SOS
OM
page 229
TABLE V-5 PROVINCIAL GOVERNMENT EMPLOYMENT(1) NEWFOUNDLAND AND LABRADOR 1968 TO 1992
Total General Government and Provincial
Government Enterprises Number of
Employees Gross Payroll Employees Gross Payroll Employees Gross Payroll ($000) ($000) ($000)
1968 11,842 52,270.3 797 3,967.2 12,639 56,237.5
1969 11,470 55,524.8 919 4,834.5 12,389 60,359.3
1970 10,277 52,505.7 1,019 5,813.5 11,296 58,319.2
1971 10,935 59,708.3 1,092 6,756.3 12,027 66,464.6
1972 10,996 65,670.8 1,267 8,606.0 12,263 74,276.8
1973 12,176 81,462.1 1,977 17,856.1 14,153 99,318.2
1974 15,812 123,546.0 3,108 31,675.0 18,920 155,221.0
1975 16,821 160,364.0 3,159 36,722.0 19,980 197,086.0
1976 16,961 185,093.0 3,085 46,659.0 20,046 231,752.0
1977 17,607 221,875.0 3,322 51,348.0 20,929 273,223.0
1978 18,002 229,368.0 3,334 52,120.0 21,336 281,488.0
1979 18,753 260,190.0 3,177 52,989.0 21,930 313,179.0
1980 20,049 309,718.0 3,176 58,191.0 23,225 367,909.0
1981 20,186 350,535.0 3,049 61,067.0 23,235 411,602.0
1982 20,647 394,152.0 2,978 67,081.0 23,625 461,233.0
1983 20,411 406,078.0 2,889 68,118.0 23,300 474,196.0
1984 21,401 439,912.0 2,860 70,783.0 24,261 510,695.0
1985 23,220 459,387.0 3,013 77,701.0 26,233 537,088.0 1986 24,027 482,684.0 2,943 75,304.0 26,970 557,988.0 1987 25,390 562,933.0 3,063 76,834.0 28,453 639,767.0
1988 23,472 555,128.0 3,041 85,432.0 26,513 640,560.0
1989 22,671 575,881.0 2,928 92,592.0 25,599 668,473.0 1990 22,811 600,001.0 2,830 93,243.0 25,641 693,244.0
1991 23,059 644,996.0 2,883 102,129.0 25,942 747,125.0
1992 23,645 643,799.0 2,689 94,841.0 26,334 738,640.0
Number of employees is the average number for the year. Gross payroll is the total for the year.
Additional Data: by month, number of employees and gross payroll by province and type of organization, departmental services and type of employee, of administrative, regulatory and special funds, of government owned and financially supported institutions and quarterly summaries of salary and wage earners for general government services.
Source: Statistics Canada Catalogue 72-007 for 1968-1973 and Statistics Canada Catalogue 72-209 1974-1992

IIIIS
SIM
ISS
IPO
SS
MO
SO
SS
OS
SOO
OM
OO
SO
SII
I IS
OS
OS
S
SECTION W
JUSTICE
• page 231
0
0 SECTION W'
0 0 0
TABLE W-2
0 ID Criminal Code
Under Section 91 of the B. N.A. Act the Parliament of Canada has the exclusive legislative • authority on the subject of criminal law, except the Constitution of Courts of Criminal fib Jurisdiction, but including the procedure in criminal matters. Within this authority, the
ID Parliament of Canada passed an Act Respecting the Criminal Law R. S. C. 1970 c. C-34. The short title of the Act is the Criminal Code.
0 lb Federal Statute
A valid federal statute is the written will of the Parliament of Canada, so long as the • purpose of the legislation is within the jurisdiction of Parliament. A federal statute is
assented to by the Governor General of Canada.
ID Provincial Statute
A valid provincial statute is one passed by the provincial legislature (in Newfoundland this fa
is the House of Assembly) and assented to by the Lieutenant-Governor of Newfoundland. The purpose of provincial legislation must be within the jurisdiction of that legislative body.
• • Municipal By-Law
Ilb Municipal by-laws are a form of subordinate legislation made by local governments who derive their power from the provincial legislature.
• 0 • • 0 • 0 0 • • • •

• • page 233
0 0 s
TABLE W-1 • SELECTED TRAFFIC OFFENCES AND TRAFFIC ACCIDENT STATISTICS,
ft NEWFOUNDLAND AND LABRADOR, 1985 TO 1992
•
ID
Year
Criminal Negligence
Offences
Driving While Impaired Offences
Refusing the Breathalizer
Blood Alcohol Over .08
Driving Without Dangerous Due Care
Driving and Control
1985 4 109 487 1,977 67
1986 3 113 334 1,662 31
1987 3 49 362 1,951 16
1988 1 26 638 2,680 32
1989 4 97 688 2,578 51 556
1990 0 87 405 1,886 49 472
1991 5 66 140 1,975 40 317
1992 0 125 165 1,130 74 253
• Source: Dept. of Works, Services and Transportation. • IIII IIII II ID II 0 II ID II ID IIII III ID
GI 4111 ID ID • • 11 II • • • ID II ID
• lb

OO
MO
SS
OS
SO
OS
ISIIII
IIS
SO
OM
OS
OS
OO
SS
IISID
OS
OO
SS
SECTION X
ENVIRONMENT

ess
soo
ses
ss
iis
se
sessi
ss
eiiso
os
sos
es
os
eseso
s
page 235
SECTION "X'
Normals
All normals are based on a thirty year period and are updated every ten years. The current normals are based on the period 1%1 to 1990.
TABLE X-1
Maximum temperature represents the average highest recorded temperature per day for a given month.
Minimum temperature represents the average lowest recorded temperature per day for a given month.
TABLE X-2
Degree days is the difference of the daily mean temperature from 18°C which is a heating degree standard. For example if the daily mean temperature on a given day in January is 1°C then 17 degree day units are required to attain the standard of 18°C.
Sunshine is recorded as hours and tenths of bright sunshine.
TABLE X-3
Precipitation levels of rain and snow not additive to give total precipitation. This is because snow (CM) is melted down to give water content (MM) and thus the standard ratio of 10:1 does not necessarily hold true depending on the quality of snow.
Wind direction is the direction (true north) from which wind is blowing.
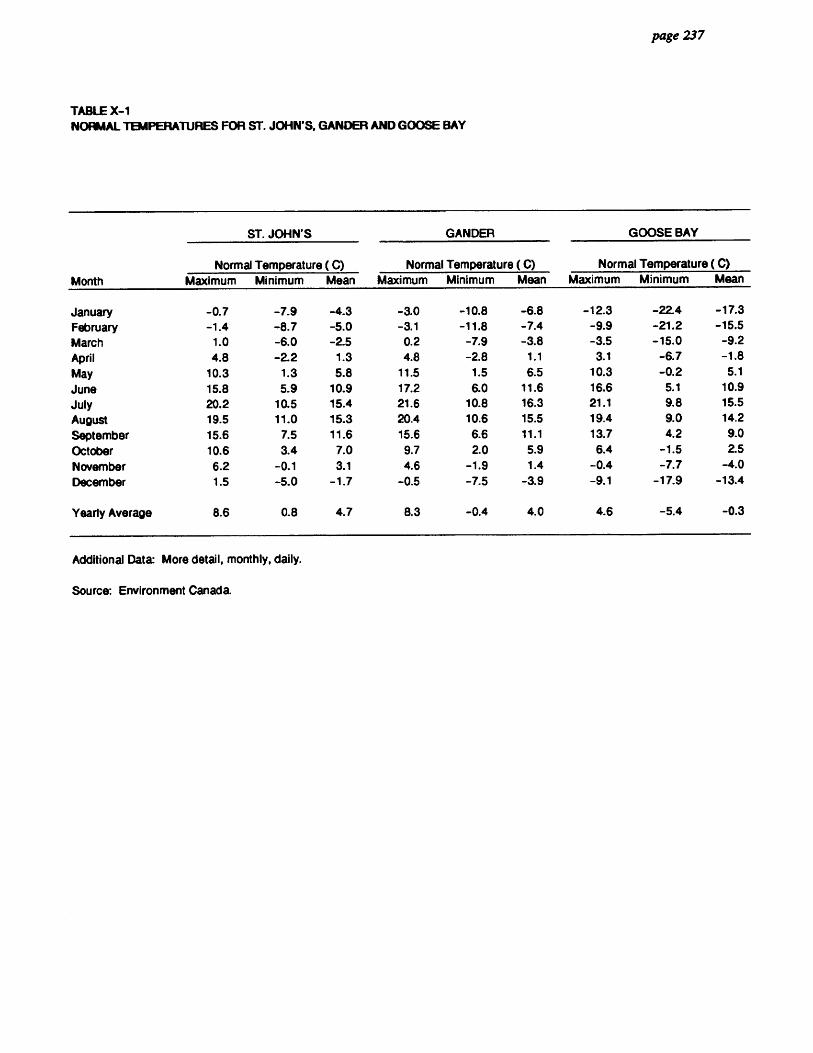
1101
111
•SO
MO
O11
1111
118
1111
111110011
00
11
SO
MM
OS
OO
MO
page 237
TABLE X-1 NORMAL TEMPERATURES FOR ST. JOHN'S, GANDER AND GOOSE BAY
Month
ST. JOHN'S GANDER GOOSE BAY
Normal Temperature ( C) Normal Temperature ( C) Normal Temperature ( C) Maximum Minimum Mean Maximum Minimum Mean Maximum Minimum Mean
January -0.7 -7.9 -4.3 -3.0 -10.8 -6.8 -12.3 -22.4 -17.3
February -1.4 -8.7 -5.0 -3.1 -11.8 -7.4 -9.9 -21.2 -15.5 March 1.0 -6.0 -2.5 0.2 -7.9 -3.8 -3.5 -15.0 -9.2 April 4.8 -2.2 1.3 4.8 -2.8 1.1 3.1 -6.7 -1.8
May 10.3 1.3 5.8 11.5 1.5 6.5 10.3 -0.2 5.1
June 15.8 5.9 10.9 17.2 6.0 11.6 16.6 5.1 10.9 July 20.2 10.5 15.4 21.6 10.8 16.3 21.1 9.8 15.5
August 19.5 11.0 15.3 20.4 10.6 15.5 19.4 9.0 14.2
September 15.6 7.5 11.6 15.6 6.6 11.1 13.7 4.2 9.0 October 10.6 3.4 7.0 9.7 2.0 5.9 6.4 -1.5 2.5 November 6.2 -0.1 3.1 4.6 -1.9 1.4 -0.4 -7.7 -4.0 December 1.5 -5.0 -1.7 -0.5 -7.5 -3.9 -9.1 -17.9 -13.4
Yearly Average 8.6 0.8 4.7 8.3 -0.4 4.0 4.6 -5.4 -0.3
Additional Data: More detail, monthly, daily.
Source: Environment Canada.

OO
SO
SO
OO
OS
SO
OO
SO
OM
OO
SS
OO
SO
SO
SO
OO
SS
OS
OID
OS
O
page 239 TABLE X-3 NORMAL PRECIPITATION AND WIND SPEED FOR ST. JOHN'S, GANDER AND GOOSE BAY
Month
ST. JOHN'S Normal Precipitation Wind Speed
Rain
(Millimetres)
Snow
(Centimetres)
Total (Millimetres)
Normal Average (Kilometres
Per Hour) Direction
January 09.3 83.0 147.8 28.0 W
February 69.2 68.8 133.8 27.0 W
March 73.8 54.0 126.7 26.0 W
April 79.6 26.8 110.4 24.0 W
May 91.4 7.8 100.9 22.0 W
June 95.3 1.4 96.9 22.0 SW
July 77.9 0.0 77.9 21.0 SW
August 121.8 0.0 121.8 21.0 SW
September 125.0 0.0 125.0 21.0 W
October 147.4 4.0 151.7 23.0 W
November 121.6 21.5 144.7 25.0 W December 91.0 54.7 1442 27.0 W
Total 1,163.1 322.1 1,481.7 -
Average - - - 24.0 W
Month
GANDER Normal Precipitation Wind Speed
Rain
(Millimetres)
Snow
(Centimetres)
Total
(Millimetres)
Normal Average (IGlometres
Per Hour) Direction
January 28.5 90.0 112.9 25.0 W
February 23.6 85.9 108.1 24.0 W
March 40.8 75.2 116.4 23.0 W
April 43.4 49.0 97.0 21.0 W May 64.7 13.4 79.9 20.0 SW
June 78.3 3.2 81.8 19.0 SW
July 73.2 0.0 73.2 17.0 SW
August 95.6 0.0 95.6 17.0 SW
September 89.5 0.1 89.7 18.0 SW
October 91.3 12.0 105.0 20.0 W November 70.9 37.1 108.6 22.2 W
December 37.9 77.9 113.4 23.0 W
Total 737.9 443.8 1,181.6 -
Average - - - 21.0 W
Month
GOOSE BAY Normal Precipitation Wind Speed
Rain
(Millimetres)
Snow
(Centimetres)
Total (Millimetres)
Normal Average (Kilometres Per Hour) Direction
January 1.3 80.5 64.9 17.0 W February 3.9 62.4 57.0 16.0 W March 4.1 70.8 68.6 17.0 W April 14.7 45.9 57.1 16.0 NE
May 46.0 20.2 66.4 15.0 NE June 97.0 3.4 100.9 15.0 NE
July 119.4 0.0 119.4 14.0 W
August 98.3 0.0 98.3 14.0 W September 87.2 3.1 90.6 18.0 W
October 57.7 21.5 78.8 16.0 W
November 21.0 65.9 79.9 17.0 W December 6.0 84.2 77.6 18.0 W
Total 557.3 463.8 959.5 -
Average - - - 16.0 W
Additional Data: More detail, monthly, daily. Source: Environment Canada.
OO
SS
IIS
SIO
OS
OS
OO
SO
OO
OM
OS
OS
OS
SO
OS
SIIS
OO
SS
OO
O
SECTION Y
BUSINESS STATISTICS
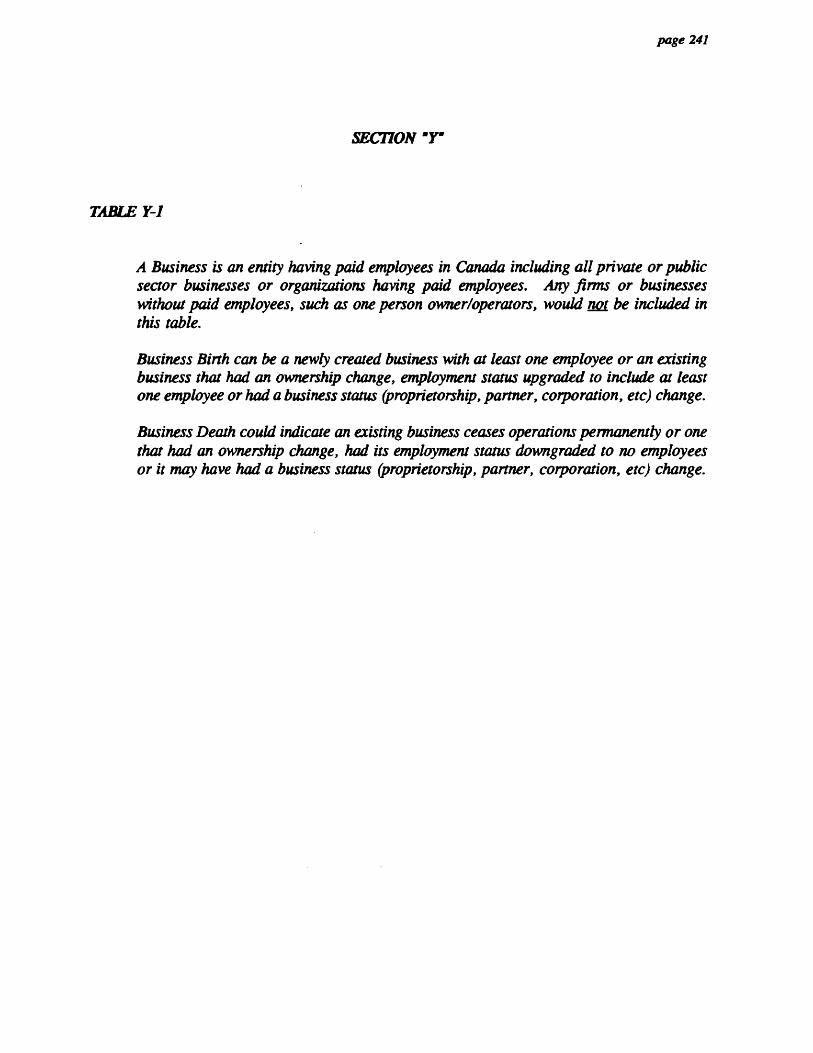
ao a page 241
a II a O SEC770N -r 0 al • TABLE Y-1 0
• A Business is an entity having paid employees in Canada including all private or public • sector businesses or organizations having paid employees. Any firms or businesses at without paid employees, such as one person owner/operators, would mt be included in
a this table.
• Business Birth can be a newly created business with at least one employee or an existing ID business that had an ownership change, employment status upgraded to include at least
0 one employee or had a business status (proprietorship, partner, corporation, etc) change.
• Business Death could indicate an existing business ceases operations permanently or one a that had an ownership change, had its employment status downgraded to no employees
0 or it may have had a business status (proprietorship, partner, corporation, etc) change.
0 al 0 0 0 0 0 al al 0 0 al 0 0 0 is 0 0 0 • 0 0 0
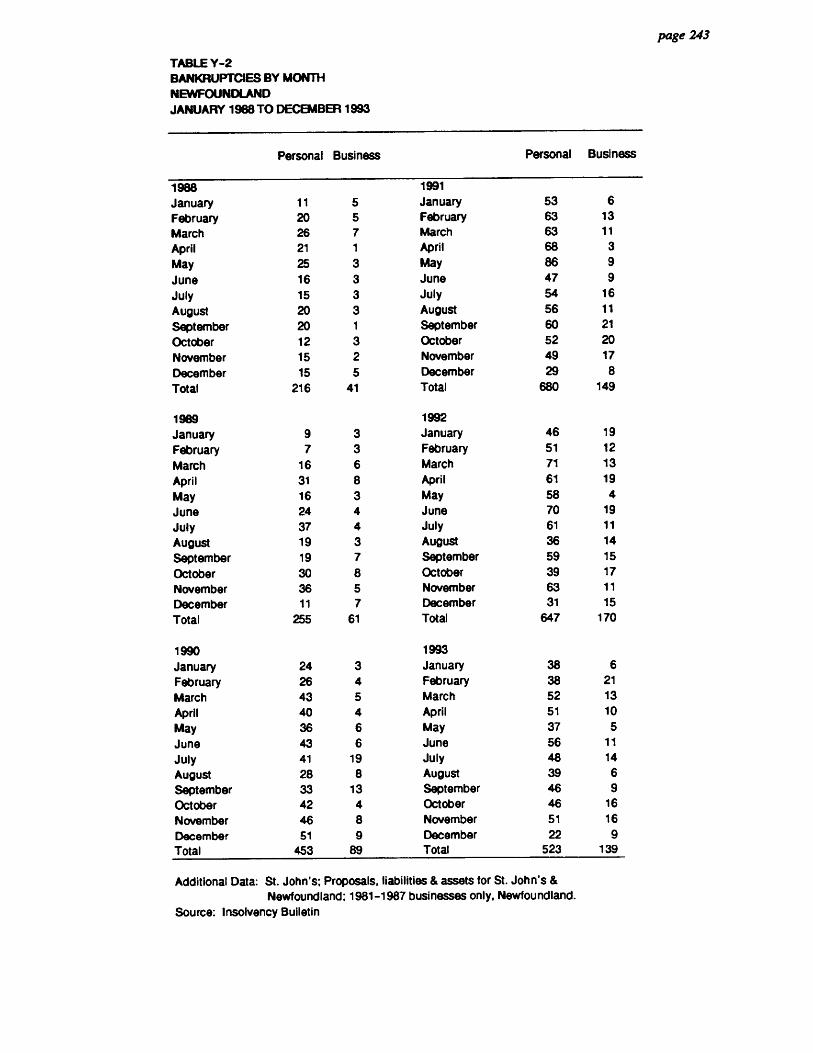
0
0 page 243
• TABLE Y-2 BANKRUPTCIES BY MONTH
e NEWFOUNDLAND • JANUARY 1988 TO DECEMBER 1993
Personal Business Personal Business
1988 1991 January 11 5 January 53 6 February 20 5 February 63 13 March 26 7 March 63 11 April 21 1 April 68 3
May 25 3 May 86 9
June 16 3 June 47 9
July 15 3 July 54 16
August 20 3 August 56 11
September 20 1 September 60 21
October 12 3 October 52 20
November 15 2 November 49 17
December 15 5 December 29 8
Total 216 41 Total 680 149
1989 1992 January 9 3 January 46 19
February 7 3 February 51 12
March 16 6 March 71 13
April 31 8 April 61 19
May 16 3 May 58 4
June 24 4 June 70 19 July 37 4 July 61 11
August 19 3 August 36 14
September 19 7 September 59 15
October 30 8 October 39 17 November 36 5 November 63 11
December 11 7 December 31 15 Total 255 61 Total 647 170
1990 1993 January 24 3 January 38 6 February 26 4 February 38 21 March 43 5 March 52 13 April May
40 36
4 6
April May
51 37
10 5
June 43 6 June 56 11 July 41 19 July 48 14 August 28 8 August 39 6 September 33 13 September 46 9 October 42 4 October 46 16 November 46 8 November 51 16 December 51 9 December 22 9 Total 453 89 Total 523 139
IIIII Additional Data: St. John's; Proposals, liabilities & assets for St. John's &
ID Newfoundland: 1981-1987 businesses only, Newfoundland.
III Source: Insolvency Bulletin • al 111 • •
III II • III •
II • • • • III • • • • • •
0 • al • • •
• ID • • •
•
0
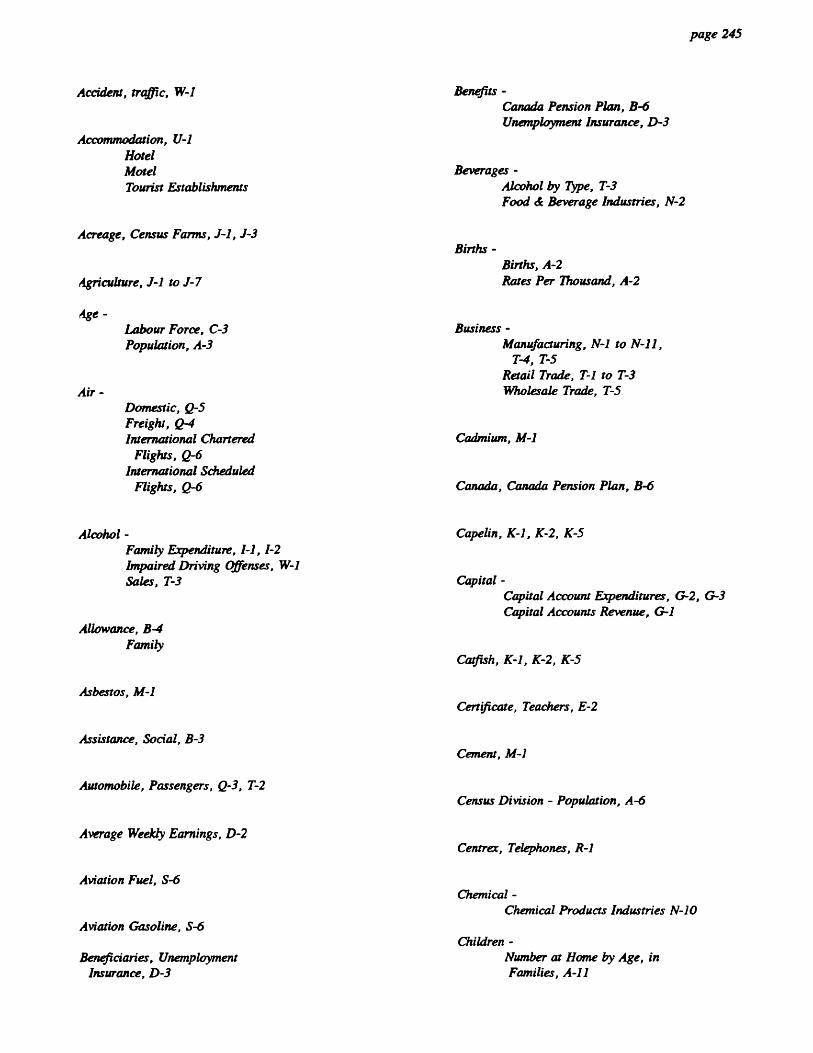
page 245
Alcohol - Family Expenditure, 1-1, 1-2 Impaired Driving Offenses, W-1 Sales, T-3
Accident, traffic, W-1
Accommodation, U-1 Hotel Motel Tourist Establishments
Acreage, Census Farms, J-1,1-3
Agriculture, J-1 to J-7
Age - Labour Force, C-3 Population, A-3
Air - Domestic, Q-5 Freight, Q-4 International Chartered
Flights, Q-6 International Scheduled
Flights, Q-6
Allowance, B-4 Family
Asbestos, M-1
Assistance, Social, B-3
Automobile, Passengers, Q-3, T-2
Average Weekly Earnings, D-2
Aviation Fuel, S-6
Aviation Gasoline, S-6
Beneficiaries, Unemployment Insurance, D-3
Benefits - Canada Pension Plan, B-6 Unemployment Insurance, D-3
Beverages - Alcohol by TYpe, T-3 Food & Beverage Industries, N-2
Births - Births, A-2 Rates Per Thousand, A-2
Business - Manufacturing, N-1 to N-11,
T-4, T-5 Retail Trade, T-1 to T-3 Wholesale Trade, T-5
Cadmium, M-1
Canada, Canada Pension Plan, B-6
Capelin, K-1, K-2, K-5
Capital - Capital Account Expenditures, G-2, G-3 Capital Accounts Revenue, G-1
Catfish, K-1, K-2, K-5
Certificate, Teachers, E-2
Cement, M-1
Census Division - Population, A-6
Centrex, Telephones, R-1
Chemical - Chemical Products Industries N-10
Children - Number at Home by Age, in Families, A-11
IIM
SS
IIII
OS
SO
OO
SS
IOS
SIS
SO
SO
SS
IIS
OO
OS
SI I
IIM
OS
SII
page 247
Division, Census, See Map
Divorces - Divorces, A-2 Divorce Rate, A-2
Duration of Unemployment, C-9
Dwelling - Apartment, P-2, P-4 Completions, P-2 Construction, P-2 Duplex, P-2 Occupied, P-3 Period of Construction P-3 Persons Per Room, P-6 Row, P-2 Semi-Detached, P-2, P-4 Single Detached, P-2, P-4, P-5 Starts, P-2 Tenure, P-4 7)71e, P-4 Urban, P-3 Value, P-5
Earnings - Average Weekly Earnings, D-2 By Government Employee,
V-4, V-5, V-6
Earnings Cont'd - By Industry, D-1, D-2, L, M-3,
M-5, S, T By Manufacturing Industries,
N-1 to N-11
Electricity - Cost of, in Manufacturing Industries, N-1 to N-11
Electric Power - Gross Domestic Product, F-4
Electric Utilities - Consumption of Electricity, S-6 Employment, S-5 Installed Generating Capacity, S-2 Power Sold, S-3 Quantity & Value of Fuel, S-4 Supply & Disposal, S-1
Employment - Construction Industry, P-1 By Industry, C-6 Electric Utilities, S-5 Federal Government, V-6 Female, C-2 Fisheries, K-7 Full-Time, C-8 Male, C-2 Manufacturing Industries
N-1 to N-11 Mining Industry, M-3, M-5 Municipal government, V-4 Part-Time, C-8 Physicians, Dentists, Nurses, B-1
Detached, Dwellings, P-5
Diesel Fuel, S-4, S-6
Diplomas, Memorial University of Newfoundland, E-4
Disposable - Income, F-2 Per Capita Income, F-3
Disposal, Electrical Energy, S-1
Districts - Federal Electoral, A-7
Economic, Regions, C-7
Education, E-1 to E-4
Elections - Federal, V-3 Provincial, V-2
Electoral - Population by Federal Electoral District, A-7

SO
SO
OS
SO
OS
SII
MS
OS
SO
IIS
SO
SO
SS
SID
OS
SO
SO
SS
SO
SS
O
page 249
Fines, Wildlife Violations, U-2
Fish, Prices, K-8
Fish Products- Manufacturing, N-3
Fish - By Species, K-1, K-2, K-5
Fisheries - Gross Domestic Product, F-4 Inland, U-2 Products Industry, N-3 Quantity Landings, K-1 Quantity Products, K-3 Value Landings, K-2 Value Products, K-4, K-5
Flights - Domestic, Q-5 International Chartered, Q-6 International Scheduled, Q-6 Transborder, Q-5
Fluorspar, M-1
Food - Expenditure, 1-1, 1-2 Manufacturing Industries, N-2
Forestry - Average Weekly Earnings, D-2 Employment, C-6 Gross Domestic Product, F-4 Logging Industry, L-1 Production, L-2 Revenue, L-5
Freight - Air, Q-4 Rail, Q-2
Fuel - Aviation, 8-4, S-6 Cost of, in Manufacturing
Industries, N-1 to N-11
Fuel Cont'd - Diesel & Furnace, S-4, S-6 Light, S-4, S-6 Tractor, S-4, S-6
Full-Time, Employment, C-8
Furnace Fuel, S-4
Furnishings, 1-2
Gasoline, S-6 Aviation Motor
Generation - Capacity, S-2 Fuel Used by Utilities, S-4
Gold, M-1
Governors, Lieutenant Governors, V-1
Government - Deficit, F-7 Expenditures, F-7, G-2, G-3, F-7 Federal, V-3, V-6 Level of, F-7 Municipal, F-7, V-4 Provincial, F-7, V-2, V-5 Revenue, G-1, F-7 Surplus, F-7
Graduates - Memorial University of
Newfoundland, E-4
Greysole, K-1, K-2, K-3
Gross - Domestic Product, F-1, F-4 Expenditures, G-2, G-3 Revenue, G-1 Domestic Expenditure, F-6
Growth - Growth Rate of Population, A-1

page 251
Industry Cont'd - Wages & Salaries, D-1 Wood Industries, N-4
Inland, Fishing, U-2
Insurance, Unemployment Insurance, D-3
International - Chartered Flights, Q-6 Scheduled Flights, Q-6 Transborder Flights, Q-5
Interprovincial Trade, N-12
Investment - 0-1 Private Public
Iron Ore, M-1
Kerosene, S-6
Kilometres, Highway, Q-1
Labour Force - By Age Group & Sex, C-3 Labour Force, C-1 Labour Force, Female, C-2 Labour Force, By industry, C-5 Labour Force, Male, C-2 Labour Force By Occupation, C-4 Not in the Labour Force, C-1, C-2 Labour Income, D-1
Labour Income, D-1
Land - L-3 Crown Private
Landings - Quantity of Fish Landings by
Species, K-2 Value of Fish by Species, K-2
Lead, M-1
Licensed - Sawmills, L-3 Tourist Establishments, U-1
Licences, U-2 Inland Fishery Wildlife Hunting
Light Fuel, S-6
Livestock, Census Farm, J-4
Lockouts, D-5 Duration Workers Involved
Logging, Industry, L-1
Lone-Parent Families, A-10
Mackerel, K-1, K-2, K-5
Male - Employed, C-2, C-8 Labour Force, C-2, C-3, N-1 to N-11 Population, A-3 Population 15 Years & Over, C-2 Unemployed, C-2 Unemployment Rate, C-2
Manufacturing - All Manufacturing Industries, N-1 Average Weekly Earnings, D-2 Census Value Added, F-4 Chemical & Chemical Products, N-10 Employment, C-6 Fish Products, N-3 Food and Beverage, N-2

OO
OS
SO
OS
OO
SS
MO
OS
SO
SIP
OS
OS
SIS
MO
SO
OS
ISIO
OO
Nurses, B-1 Per 1,000 Population Registered
Occupation - Labour Force, C-4 Taxpayers, H-3
Offenses - Impaired Driving, W-1 Selected Offenses, W-1 Traffic, W-1
Offices, Post, R-3
Oil, S-6 Heavy Fuel Light Fuel Stove
Old - Age Security, B-5
Paper - Pulp and Paper Mills, N-6 Value, L-4
Part-Time, Employment, C-8
Participation Rate - Female Participation Rate, C-2 Male Participation Rate, C-2 Participation Rate, C-1, C-7
Passengers - Air Domestic, Q-5 International, Q-6 Transborder, Q-5
Payments, Unemployment Insurance Benefit, D-3
Payrolls - By Industry, D-1 Federal Government, V-6 Manufacturing Industries, N-1 to N-11 Municipal Government, V-4 Provincial Government, V-5
page 253
Pension, Canada Pension Plan, B-6
Personal - Care - Expenditures, 1-1, 1-2 Disposable Income, F-2 Income, F-2 Per Capita Personal Disposable
Income, F-3
Person-Days, Strikes and Lockouts, D-5
Petroleum, Consumption, S-6
Petroleum Products, S-4, S-6 Aviation Gasoline Aviation Fuel Furnace Fuel Diesel Fuel Heavy Fuel Oil Kerosene Light Fuel Oil Motor Gasoline Stove Oil Tractor Fuel
Physicians, B-1 Per 1,000 Population
Physicians
Plaice, K-1, K-2, K-5
Planing Mills, N-5
Population Newfoundland & Labrador - Age, A-3 By Census Division, A-6 By Federal Electoral District, A-7 Female, A-3, A-6 Incorporated Cities, A-9 Male, A-3, A-6 By Marital Status, A-4 Province, 1836 to 1986, A-1 By Religious Denomination, A-5 By Selected Age Groups, A-3 Sex, A-3, A-6 Towns, A-9 Working Age, C-1
Post Offices, R-3

a • page 255
al al ill Salmon, K-1, K-2, K-5 Species -
a Fish Landings, K-1, K-2
• Fish Products, K-5
Salted - Cod, K-6
0 Starts, Dwelling, P-2 a Sand & Gravel, M-1
Stove Oil, S-6 • Sawmills - • Licensed, L-3
Production, L-3 Strikes, D-5 • Sawmills & Planing Mills N-5 Duration
ak Workers Involved
• Schools -
Teachers, E-2 Students -
School E-1 s Enrolment, E-1
• University E-3
• Service - • Telephones, R-1 Sulphite, L-4
ID • Service Industries - Supplement, B-5
Average Weekly Earnings, D-2 Guaranteed Income • Employment, C-6 Old Age Security • Labour Force, C-5
Wages & Salaries, D-1 • Supplementary Labour Income, D-1
• seT e Labour Force, C-2, C-3 Tax, Total Tax, H-1, H-2, H-3
O Population, A-3 Population by Census Division, A-6
• Taxable -
• Shelter, 1-1, 1-2 Corporation Income, H-4 Returns, II-2
III • Shipments - Taxes, Rates, G-5
4111 Value of, in Manufacturing Industries, N-1 to N-11
IP Taxpayers • •
By Income Classes, H-1 Shipping, Q-7 By Occupation, H-3
O Coastwise Number, H-1
• • Silver, M-1 Teachers -
a By Certificate Held, E-2 Single-Detached Dwellings, P-5
• • Social, Social Assistance, B-3
0 0 •
a

e 0 III 0 II ID Vehicle -
Commercial, Q-3 O Motor Vehicle Sales, T-2
• Passenger, Q-3 Registered, Q-3
al III Violations, U-2
IS Hunting
II Inland Fishing
ID Wages -
11111 Average Weekly Earnings, D-2
a By Government Employees, V-4, V-5, V-6 Manufacturing Industries, N-1 to N-11
II Minimum Wage, D-4
al Union Wage Rates, D-6, M-3 Wages and Salaries, D-1, F-3, H-2, S-5
a II Weather, X-1 to X-3 0 ID Wholesale, Trade, T-5
0
ID 1111
Wood, Industries, N-4 49 11111 Youth, Allowance, B-4 0 II Zinc, M-1 0
al a ID ID ID ID 0 II ID • 0 IIII
IP Wildlife, U-2
a Hunting Licences Violations