Historical Overview of Algal Biofuel Technoeconomic ... · PDF fileBOC BP Chevron Eastman...
23
NREL is a national laboratory of the U.S. Department of Energy, Office of Energy Efficiency and Renewable Energy, operated by the Alliance for Sustainable Energy, LLC. DOE Algal Biofuels Workshop Philip T. Pienkos NREL December 9, 2008 National Algal Biofuels Technology Roadmap Workshop University of Maryland NREL/PR-510-45622 Historical Overview of Algal Biofuel Technoeconomic Analyses
Transcript of Historical Overview of Algal Biofuel Technoeconomic ... · PDF fileBOC BP Chevron Eastman...
NREL is a national laboratory of the U.S. Department of Energy, Office of Energy Efficiency and Renewable Energy, operated by the Alliance for Sustainable Energy, LLC.
DOE Algal BiofuelsWorkshop
Philip T. PienkosNREL
December 9, 2008
National Algal BiofuelsTechnology Roadmap Workshop
University of MarylandNREL/PR-510-45622
Historical Overview of Algal Biofuel Technoeconomic Analyses
National Renewable Energy Laboratory Innovation for Our Energy Future
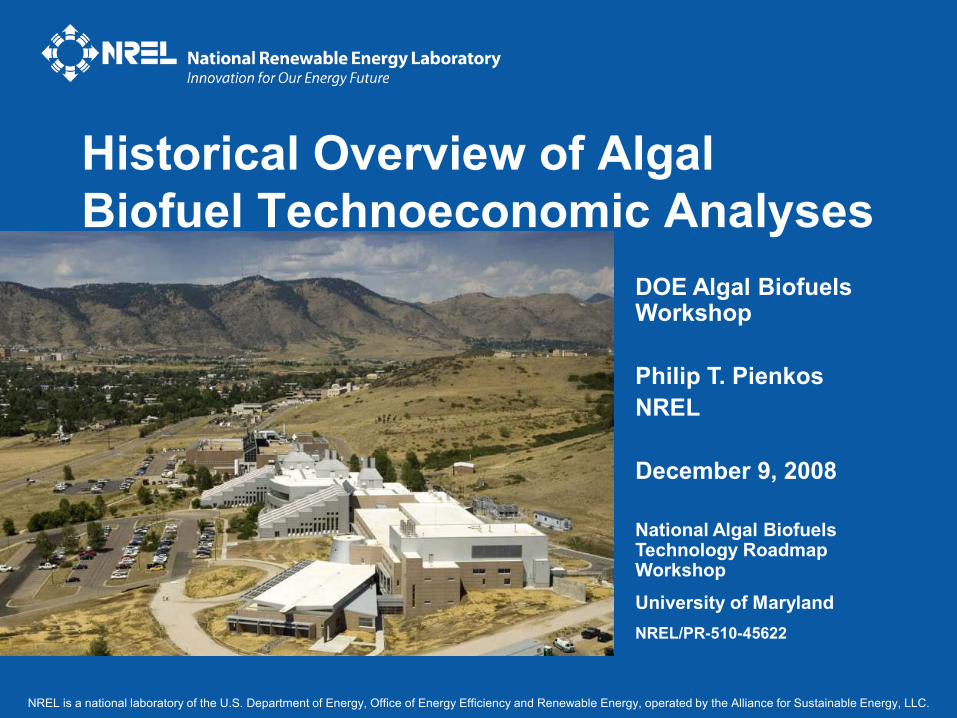
You Are Here
Patents approved; prepare to collect
royalties.
Sell stake to
oil company.
Low cost feedstock becomes
available; begin process
development. Algal biofuels make up
significant proportion of
renewable fuel portfolio..

National Renewable Energy Laboratory Innovation for Our Energy Future
Technoeconomic Modeling for Workshop• Discussions began in August as part of workshop
planning process (SNL/NREL/DOE)• Work began in earnest with meeting at SNL in
October (SNL/NREL/NMSU/CSU)• Establish goal to capture and consolidate all publicly
available algal biofuel models• Use information to help guide roadmappping effort
– Current state of technology– Identify known knowns, known unknowns, and unknown
unknowns– Provide focus on critical path elements– Estimate time and cost to achieve technical milestones
National Renewable Energy Laboratory Innovation for Our Energy Future
Cast of Characters
• NREL– Al Darzins– David Humbird– Phil Pienkos
• NMSU– Pete Lammers– Meghan Starbuck
• CSU– Bryan Willson
• SNL– Katherine Dunphy-Guzman– Ray Finley– Geoff Klise– Len Malczynski– Ron Pate– Amy Sun– Cecelia Williams

National Renewable Energy Laboratory Innovation for Our Energy Future
Acknowledgements
These people did most of the heavy lifting, consolidating information from a variety of models and providing key slides for this presentation:
–Amy Sun–Katherine Dunphy-Guzman–Cecelia Williams–Ron Pate
•Finley
National Renewable Energy Laboratory Innovation for Our Energy Future
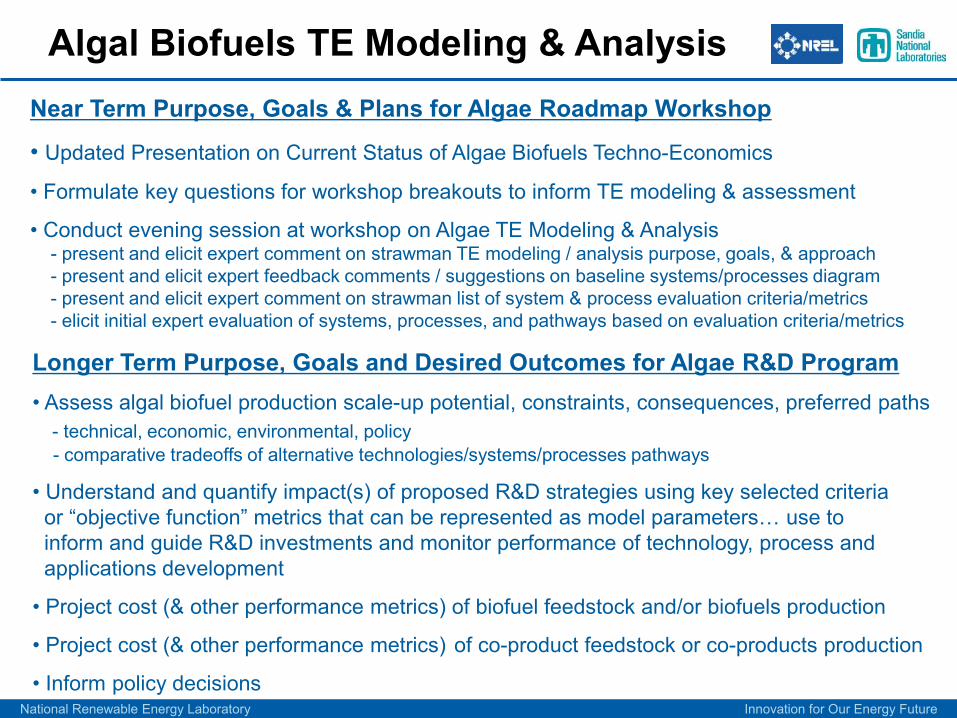
Longer Term Purpose, Goals and Desired Outcomes for Algae R&D Program• Assess algal biofuel production scale-up potential, constraints, consequences, preferred paths
- technical, economic, environmental, policy- comparative tradeoffs of alternative technologies/systems/processes pathways
• Understand and quantify impact(s) of proposed R&D strategies using key selected criteria or “objective function” metrics that can be represented as model parameters… use to inform and guide R&D investments and monitor performance of technology, process and applications development
• Project cost (& other performance metrics) of biofuel feedstock and/or biofuels production
• Project cost (& other performance metrics) of co-product feedstock or co-products production
• Inform policy decisions
Algal Biofuels TE Modeling & AnalysisNear Term Purpose, Goals & Plans for Algae Roadmap Workshop
• Updated Presentation on Current Status of Algae Biofuels Techno-Economics
• Formulate key questions for workshop breakouts to inform TE modeling & assessment
• Conduct evening session at workshop on Algae TE Modeling & Analysis- present and elicit expert comment on strawman TE modeling / analysis purpose, goals, & approach - present and elicit expert feedback comments / suggestions on baseline systems/processes diagram- present and elicit expert comment on strawman list of system & process evaluation criteria/metrics- elicit initial expert evaluation of systems, processes, and pathways based on evaluation criteria/metrics
National Renewable Energy Laboratory Innovation for Our Energy Future
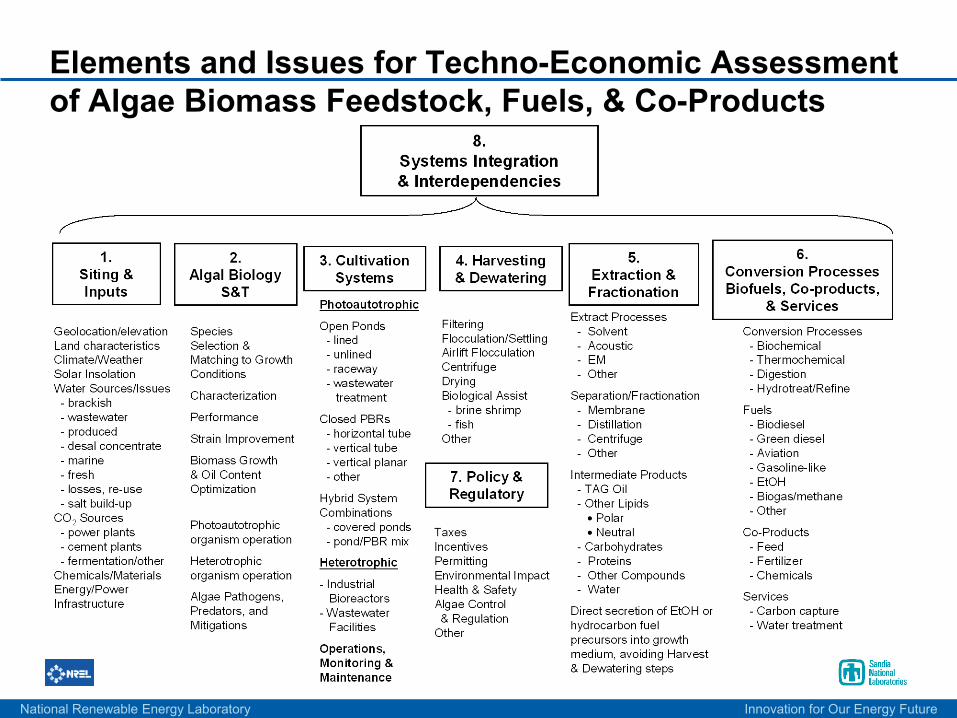
Elements and Issues for Techno-Economic Assessmentof Algae Biomass Feedstock, Fuels, & Co-Products

National Renewable Energy Laboratory Innovation for Our Energy Future
Process Flow Diagram
1.0
Siting
2.1 Algal speci es
3.0 C ultivation
1.5.3 Water Treatment
4.0 H arvesting / D e-watering
5.0 Extraction & Separation
6.1 C onversion to
Biofuels
6.2 C onversion to
Co-products
10.0 Water Captur e
3.4 Wast ewater Photoautotrophic & Heterotrophic;Co-generati on
3.2 Open syst ems
3.1 Closed systems
3.3 H ybrid systems
1.2 CO2
1.5 Water
2.2 N utrients (NPK)
1.1 Land
1.3 F acilities
2.3 Pathogens, predators
1.4 Primar y Energ y
4.6 Wet algal or biological assi st derivati ve biomass
8.0 Algal biomass
10.1 Water disposal
4.7.1 Solar
4.7.2 Fuel-Fired
4.7 Dr ying
4.4 C entrifuge
4.2 Airlift floccul ation
4.1 Flocc ulati on & settling
4.3 Filtering
9.0 R enewabl es
5.3 Protei ns
5.1 Lipids
5.2 C arbohydrates
5.1.1 TAG
5.1.2 Fatty acids
5.4 Other metabolites
6.1.3 Bi ochemical
6.1.1 Chemical
6.1.2 Thermochemical
6.2.3 Chemicals
6.2.1 Feed
6.2.2 Fertilizer
6.2.4 Materials
6.3.3 Avi ation
6.3.1 Bi odiesel
6.3.2 Green diesel
6.3.4 Gasoline-like
6.3.7 H ydrogen
6.3.5 Bi ogas/Methane
6.3.6 Ethanol
2.0 Algal speci es sel ection
3.5 Biological Assi st- brine shri mp- fish- etc .
4.5 Biological Assi st Harves ting (shrimp, fish excrement, etc.)
1.5.1 Primar y water source (saline/br ackish/was tewater)
1.5.2 Fresh water source
OUTPUT
INPUT
PROCESS CATEGORY
PROCESS
National Renewable Energy Laboratory Innovation for Our Energy Future
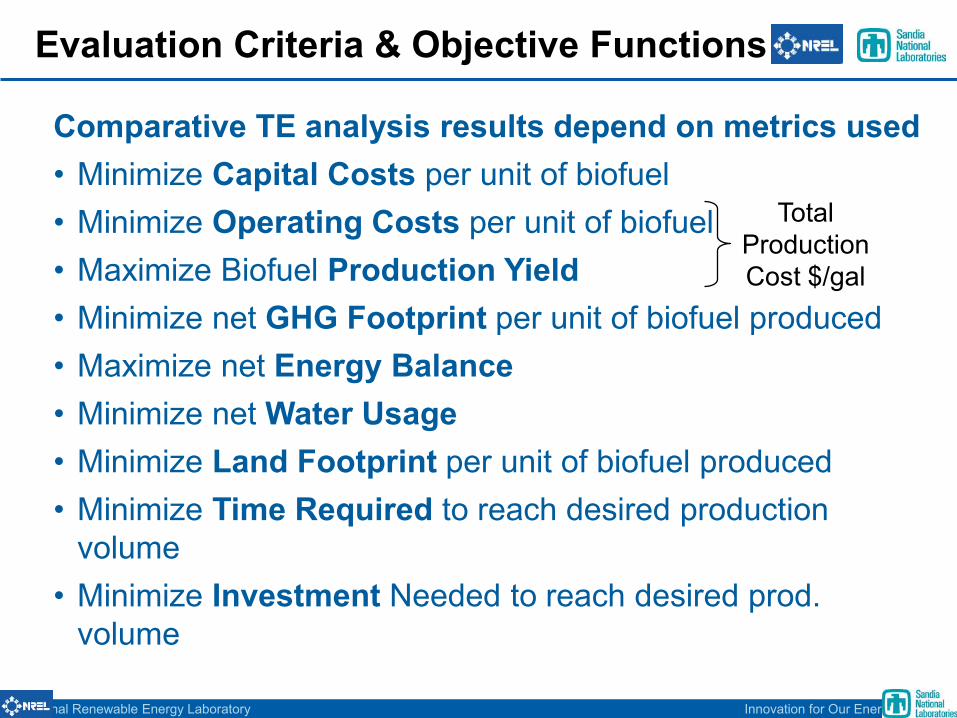
Comparative TE analysis results depend on metrics used• Minimize Capital Costs per unit of biofuel• Minimize Operating Costs per unit of biofuel• Maximize Biofuel Production Yield• Minimize net GHG Footprint per unit of biofuel produced • Maximize net Energy Balance• Minimize net Water Usage• Minimize Land Footprint per unit of biofuel produced• Minimize Time Required to reach desired production
volume• Minimize Investment Needed to reach desired prod.
volume
Evaluation Criteria & Objective Functions
Total Production Cost $/gal

National Renewable Energy Laboratory Innovation for Our Energy Future
Precedent for DOE: H2A• President Bush launched the Hydrogen Fuel Initiative in
February, 2003 to help ensure U.S. energy security and to reduce greenhouse gas and other harmful emission.
• In response, DOE established the Hydrogen, Fuel Cells and Infrastructure Program– Set research priorities and make other important program direction
decisions informed by sound analysis – Evaluate costs, energy and environmental tradeoffs – Consider various pathways toward a hydrogen economy.
• A review of the public information available in this area led to these conclusions:– Many excellent analyses had been conducted. – Many analyses of the same or similar routes to produce hydrogen
appeared to yield different results. Principal discrepancies lie in the basis and assumptions used in the analysis.
National Renewable Energy Laboratory Innovation for Our Energy Future
H2A Objectives
• Establish a standard format and list of parameters for reporting analysis results for central production, distributed (forecourt) production, and delivery.
• Seek better validation of public analyses through dialog with industry.
• Enhance understanding of the differences among publicly available analyses and make these differences more transparent.
• Establish a mechanism for facile dissemination of public analysis results.
• Work to reach consensus on specific analysis parameters for production and delivery.
National Renewable Energy Laboratory Innovation for Our Energy Future
H2A Participants
Core MembersDaryl Brown: PNNL Jerry Gillette: ANL
Brian James: Directed Technologies Steve Lasher: TIAX
Johanna Levene: NREL Margaret Mann: NREL
Dan Mears: Technology Insights Marianne Mintz: ANL
Joan Ogden: UC, Davis Marylynn Placet: PNNL
Matt Ringer: NREL Mike Rutkowski: Parsons
Harry Stone: Battelle Michael Wang: ANL
Key Industry CollaboratorsAEPBOCBP
ChevronEastman Chemical
EntergyExxonMobil
FercoFramatome
General ElectricPraxair
Stuart EnergyThermochem

National Renewable Energy Laboratory Innovation for Our Energy Future
H2A Analyses• Original source(s) of all the data (i.e., report title, authors, etc.) • Basic process information (feedstock and energy inputs, size of plant,
co-products produced, etc.) • Process flowsheet and stream summary (flowrate, temperature,
pressure, composition of each stream) • Technology performance assumptions (e.g., process efficiency and
hydrogen product conditions) • Economic assumptions (after tax internal rate of return, depreciation
schedule, plant lifetime, income tax rate, capacity factor, etc.) • Calculation of the discounted cash flow (the calculation procedure is
built into the standardized spreadsheet so that all technologies use the same methodology)
• Results (plant-gate hydrogen selling price and cost contributions in $/kg H2, operating efficiency, total fuel and feedstock consumption, and emissions)
• Sensitivity of the results to assumptions (e.g., feedstock cost, co-product selling price, capital cost, operating costs, internal rate of return, conversion efficiencies, etc.)
• Quantification of the level of uncertainty in the analysis

National Renewable Energy Laboratory Innovation for Our Energy Future
H2A Production Technologies
• Central Production of Hydrogen – Coal Gasification: Hydrogen Production – Coal Gasification: Hydrogen and Electricity Production – Natural Gas Hydrogen Production – Biomass Gasification Hydrogen Production – Nuclear Energy Hydrogen Production – Wind Electrolysis Hydrogen Production
• Forecourt Production of Hydrogen – Natural Gas Reforming – Electrolysis – Reforming of Ethanol sourced from biomass – Reforming of Methanol sourced from biomass

National Renewable Energy Laboratory Innovation for Our Energy Future
Not As Bad As We Thought
1.0
Siting
2.1 Algal speci es
3.0 C ultivation
1.5.3 Water Treatment
4.0 H arvesting / D e-watering
5.0 Extraction & Separation
6.1 C onversion to
Biofuels
6.2 C onversion to
Co-products
10.0 Water Captur e
3.4 Wast ewater Photoautotrophic & Heterotrophic;Co-generati on
3.2 Open syst ems
3.1 Closed systems
3.3 H ybrid systems
1.2 CO2
1.5 Water
2.2 N utrients (NPK)
1.1 Land
1.3 F acilities
2.3 Pathogens, predators
1.4 Primar y Energ y
4.6 Wet algal or biological assi st derivati ve biomass
8.0 Algal biomass
10.1 Water disposal
4.7.1 Solar
4.7.2 Fuel-Fired
4.7 Dr ying
4.4 C entrifuge
4.2 Airlift floccul ation
4.1 Flocc ulati on & settling
4.3 Filtering
9.0 R enewabl es
5.3 Protei ns
5.1 Lipids
5.2 C arbohydrates
5.1.1 TAG
5.1.2 Fatty acids
5.4 Other metabolites
6.1.3 Bi ochemical
6.1.1 Chemical
6.1.2 Thermochemical
6.2.3 Chemicals
6.2.1 Feed
6.2.2 Fertilizer
6.2.4 Materials
6.3.3 Avi ation
6.3.1 Bi odiesel
6.3.2 Green diesel
6.3.4 Gasoline-like
6.3.7 H ydrogen
6.3.5 Bi ogas/Methane
6.3.6 Ethanol
2.0 Algal speci es sel ection
3.5 Biological Assi st- brine shri mp- fish- etc .
4.5 Biological Assi st Harves ting (shrimp, fish excrement, etc.)
1.5.1 Primar y water source (saline/br ackish/was tewater)
1.5.2 Fresh water source
OUTPUT
INPUT
PROCESS CATEGORY
PROCESS

National Renewable Energy Laboratory Innovation for Our Energy Future
Source Material for TE ModelsSource Authors Year Reference
Matt RingerBob WallacePhil Pienkos
Meghan StarbuckPete Lammers
Solix Bryan Willson 2008 2nd Bundes-Algen-Stammtisch
Seambiotics Ami Ben-Amotz, Israel 2007-2008 Algae Biomass Summit
Sandia Ben Wu 2007 Analysis completed for this exercise
Bayer Ulrich Steiner 2008European White Biotechnology Summit
General Atomics David Hazlebeck 2008 Algae Biomass Summit
California Polytechnic Institute Tryg Lundquist 2008 Algae Biomass Summit
E. Molina GrimaE. BelarbiF. FernandezA. MedinaY. Chisti
P. TapieA. Bernard
John BenemannWilliam Oswald 1996
Association pour la Recherche en Bioenergie
NREL
NMSU
University of Almeria
PETC Final ReportUniversity of California
2008 Analysis completed for this exercise
2008 Analysis completed for this exercise
2003 Biotechnol. Adv. (2003) 20:491-515
1988 Biotech. Bioeng. (1988) 32:873-885

National Renewable Energy Laboratory Innovation for Our Energy Future
Standardized Cost Comparison•Average = $109 USD/gal•Variability is wide, Std. Dev. = $301 USD/gal
PER GALLON Triglyceride Production Cost
$0
$10
$20
$30
$40
$50
$60
Benem
ann (
1996
), 30g
/m2/d
Benem
ann (
1996
), 60g
/m2/d
NREL - cu
rrent
NREL - ag
gress
ive
NREL - m
ax
NMSU - 1ac
, curr
ent
NMSU - 1ac
, bes
t
NMSU -200
0ha,c
urren
t
NMSU -200
0ha,b
est
Solix -
curre
nt
Solix -
PI
Solix -
PII
NBT Ltd.,
Israe
l
Seambio
tic/IE
C, Israe
l
Bayer
AG, "WOS"
Genera
l Atom
ics-lo
w
Genera
l Atom
ics-hi
gh
Cal Poly
, Cas
e1
Sandia
- Rac
eway
Sandia
- PBR
Molina
Grim
a et a
l. (20
03)
Tapie
& Bern
ard (1
987)
Tapie
& Bern
ard (1
987)
USD
/gal
NMSU1 acre,currentvs.best NMSU
2,000 hacurrentvs.best
NRELcurrent,aggressive,max yield
Solix:current,Phase IPhase II Seambiotic/IEC:
waste-heatcoupling
Bayer:"WOS"PBR
GeneralAtomics:low vs. high
$1,127/gal
Cal Poly:WWT+algal oil
$990/gal
Sandiapondvs.PBR
France,ground tubes vs.doubletubes

National Renewable Energy Laboratory Innovation for Our Energy Future
SCENARIO Reactor Type Lipid yield (wt% of dry mass)
Areal Dry Algae Mass Yield (g/m2/day)
Loan Period (yrs)
Benemann per ha basis open pond 50% 30 5
Benemann per ha basis open pond, max 50% 60 5
NREL Current Case open pond 25% 20 15
NREL Aggressive Case open pond 50% 40 15
NREL Maximum Case open pond 60% 60 15NMSU current yield open pond 35% 35 20NMSU highest yield open pond 60% 58 20Solix Current hybrid 16% - 47% 0 - 24.5 unkSolix Q2, 2009 hybrid 16% - 47% 30-40 unk
NBT, Israel Dunaliella open 35%* 2 unkSeambiotic/IEC, Israel Best Yield open 35%* 20 unk
Sandia Raceway&PBR both 35% 30 20Bayer Tech Services Germany PBR 33% 52 10Bayer Tech Services El Paso, TX PBR 33% 110 10
General Atomics 100 acres open/hybrid unk unk unk
Molina-Grima et al. 26.2 metric ton/annum 75 0.8 m^3 outdoor T-PBRs 10% unk 10
Cal Poly, Case1 100 ha wastewater treatment + digester 25% 20 8
Tapie & Bernard 10 ha T-PBR 35%* 20 5* Assumed quantity required to convert from weight-basis to oil-basis
Inherent Assumptions Vary Widely
National Renewable Energy Laboratory Innovation for Our Energy Future
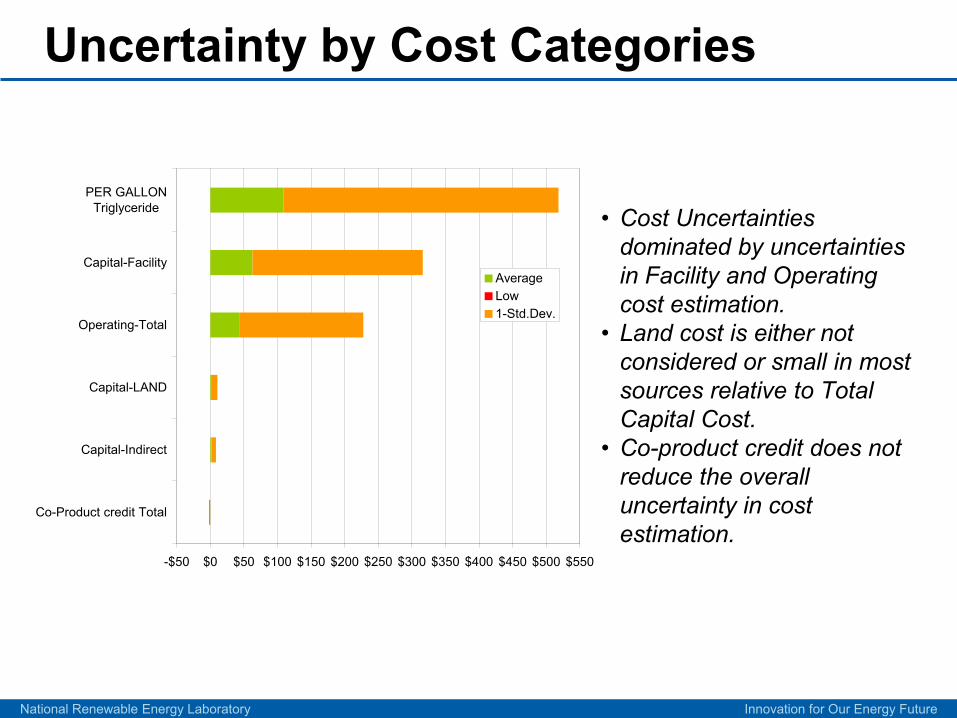
-$50 $0 $50 $100 $150 $200 $250 $300 $350 $400 $450 $500 $550
Co-Product credit Total
Capital-Indirect
Capital-LAND
Operating-Total
Capital-Facility
PER GALLONTriglyceride
AverageLow1-Std.Dev.
• Cost Uncertainties dominated by uncertainties in Facility and Operating cost estimation.
• Land cost is either not considered or small in most sources relative to Total Capital Cost.
• Co-product credit does not reduce the overall uncertainty in cost estimation.
Uncertainty by Cost Categories

National Renewable Energy Laboratory Innovation for Our Energy Future
Cost Reductions (NREL)
NREL Cost Breakdown
-$2
$0
$2
$4
$6
$8
$10
$12
Current Case Aggressive Case Maximum Case
USD/
gal
Co-Product credit TotalOperating-TotalCapital-IndirectCapital-FacilityCapital-LAND
25% oil20 g/m2/d
60% oil60 g/m2/d
50% oil40 g/m2/d
National Renewable Energy Laboratory Innovation for Our Energy Future
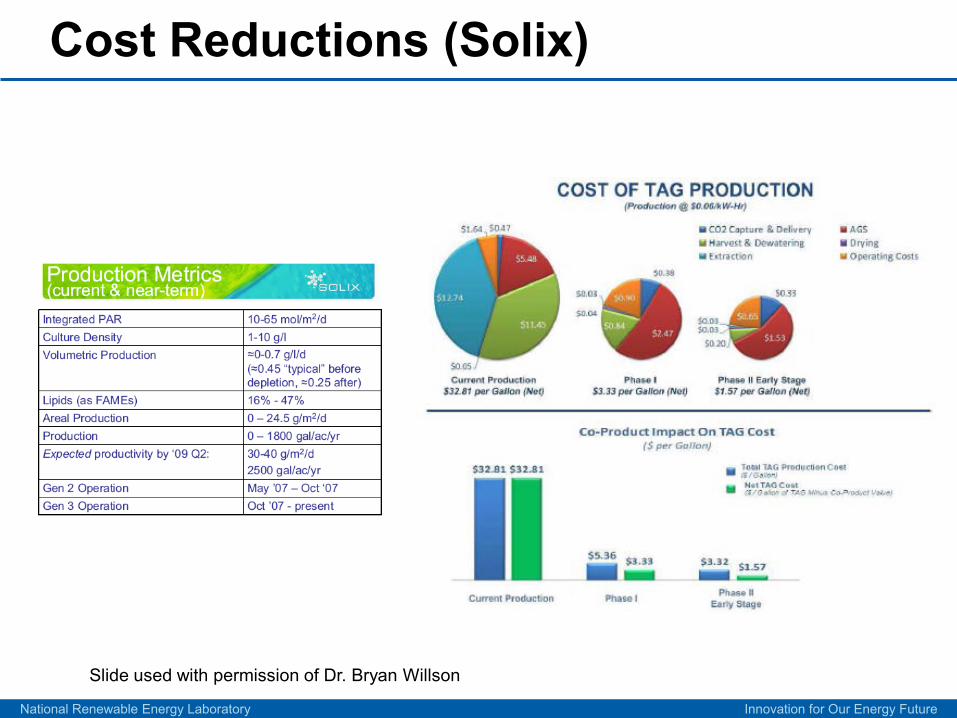
Cost Reductions (Solix)
Slide used with permission of Dr. Bryan Willson

National Renewable Energy Laboratory Innovation for Our Energy Future
Conclusions
• Many things have changed since the last major push for algal biofuels– The price of oil has gone upgone downfluctuated wildly– Energy security is a real issue– Climate change is widely recognized as a significant threat– Real capital is being raised for algal biofuel commercialization– Not many more known knowns but a few more known
unknowns
• Technoeconomic modeling is a critical element to determine:– Best estimate for current cost of algal biofuel production– Fastest road forward to commercialization
• The current state of technoeconomic modeling– Is more dependent upon assumptions than on data – Results in huge variations in cost estimates and uncertainty
National Renewable Energy Laboratory Innovation for Our Energy Future
Conclusions, continued
• Modeling for algal biofuel production is extremely complicated– Alternative approaches to cultivation, harvest, extraction– Different assumptions about input costs and byproduct values– Availability of essential resources (sunlight, land, CO2, and water)
vary significantly across the US and models must take these variations into account
• The H2A program for hydrogen production and storage can provide valuable insight and precedent for improved modeling
• The work initiated for this workshop is a step towards the development of a unified model that can be shared with all stakeholders to provide a common metric to measure progress towards the goal of commercialization of algal biofuels.