Historical Frontiers and the Rise of Inequality. The Case ... · Frontiers have largely shaped the...
46
0 Historical Frontiers and the Rise of Inequality. The Case of the Frontier of Granada Daniel Oto-Peralías & Diego Romero-Ávila St Andrews University, Pablo de Olavide University Accepted for publication at the Journal of the European Economic Association Abstract This paper explores the political economy that leads frontier regions to be unequal. By focusing on the presence of a stable frontier between Castile and the Nasrid Kingdom of Granada in the late Middle Ages, our analysis shows how a historical border may generate differences in inequality that can become extremely persistent. We argue that the dynamics of being a militarily insecure frontier region created the conditions on the Castilian side for a high concentration of economic and political power. Through the application of a border specification and a spatial regression discontinuity design to municipal-level data, we find that municipalities on the Castilian side have a significantly higher percentage of landless workers, a greater accumulation of wealth, and more jurisdictional rights among the privileged orders, as measured in the eighteenth century. We use current indicators of land inequality and development to show that the effect of the frontier of Granada persists even today. Keywords: Historical Frontiers, Political Power, Political and Economic Inequality, Spanish Reconquest, Frontier of Granada, Spatial Regression Discontinuity Analysis. JEL Classification: C14, N2, N9, O1 ---------------------------------------------------------------------------------------- Corresponding Author: Diego Romero-Ávila, Pablo de Olavide University, Department of Economics, Ctra de Utrera, Km. 1, Sevilla, Spain. E-mail: [email protected]. Tel. (+34) 954 348381. Fax: (+34) 954349339. Daniel Oto-Peralías. University of St Andrews, School of Management, Centre for Responsible Banking & Finance. The Gateway, North Haugh, St Andrews, Fife, KY16 9AJ, UK. E-mail: [email protected]. Acknowledgements: The authors are particularly indebted to Nicola Gennaioli (the Editor) and three anonymous referees of this Journal for valuable comments and suggestions that led to a substantial improvement of the original manuscript. We also thank Luis Ángeles, Jesús Crespo-Cuaresma, John O.S. Wilson, Simon Wren-Lewis, and participants at the 2015 Royal Economic Society Meeting held in Manchester, the Norwegian School of Economics, Glasgow University, Halle Institute for Economic Research, Sheffield University, Pablo de Olavide University, and Vienna University of Economics and Business for valuable comments and suggestions. Thanks also go to archival staff of the Provincial Historic Archive of Seville for helping us with the access to some of the data employed in the article. The authors acknowledge financial support from the Spanish Ministry of Science and Technology through grant
Transcript of Historical Frontiers and the Rise of Inequality. The Case ... · Frontiers have largely shaped the...

0
Historical Frontiers and the Rise of Inequality. The Case of the Frontier of
Granada
Daniel Oto-Peralías & Diego Romero-Ávila
St Andrews University, Pablo de Olavide University
Accepted for publication at the Journal of the European Economic Association
Abstract
This paper explores the political economy that leads frontier regions to be unequal. By focusing on the presence of a stable frontier between Castile and the Nasrid Kingdom of Granada in the late Middle Ages, our analysis shows how a historical border may generate differences in inequality that can become extremely persistent. We argue that the dynamics of being a militarily insecure frontier region created the conditions on the Castilian side for a high concentration of economic and political power. Through the application of a border specification and a spatial regression discontinuity design to municipal-level data, we find that municipalities on the Castilian side have a significantly higher percentage of landless workers, a greater accumulation of wealth, and more jurisdictional rights among the privileged orders, as measured in the eighteenth century. We use current indicators of land inequality and development to show that the effect of the frontier of Granada persists even today.
Keywords: Historical Frontiers, Political Power, Political and Economic Inequality, Spanish
Reconquest, Frontier of Granada, Spatial Regression Discontinuity Analysis.
JEL Classification: C14, N2, N9, O1
----------------------------------------------------------------------------------------
Corresponding Author: Diego Romero-Ávila, Pablo de Olavide University, Department of Economics, Ctra de Utrera, Km. 1, Sevilla, Spain. E-mail: [email protected]. Tel. (+34) 954 348381. Fax: (+34) 954349339.
Daniel Oto-Peralías. University of St Andrews, School of Management, Centre for Responsible Banking & Finance. The Gateway, North Haugh, St Andrews, Fife, KY16 9AJ, UK. E-mail: [email protected].
Acknowledgements: The authors are particularly indebted to Nicola Gennaioli (the Editor) and three anonymous referees of this Journal for valuable comments and suggestions that led to a substantial improvement of the original manuscript. We also thank Luis Ángeles, Jesús Crespo-Cuaresma, John O.S. Wilson, Simon Wren-Lewis, and participants at the 2015 Royal Economic Society Meeting held in Manchester, the Norwegian School of Economics, Glasgow University, Halle Institute for Economic Research, Sheffield University, Pablo de Olavide University, and Vienna University of Economics and Business for valuable comments and suggestions. Thanks also go to archival staff of the Provincial Historic Archive of Seville for helping us with the access to some of the data employed in the article. The authors acknowledge financial support from the Spanish Ministry of Science and Technology through grant

1
ECO2009-13357, the Spanish Ministry of Economics and Competitiveness through grant ECO2012-35430 and the Andalusian Council of Innovation and Science under Excellence Project SEJ-4546.
1. Introduction
Frontiers have largely shaped the economic geography of many regions and countries throughout the
world.1 Despite the importance of frontiers in history, few studies have dealt empirically with this
issue. This paper aims to explore the political-economic effects that can lead frontier regions to be
unequal. We argue that frontiers can adversely affect the path of development of societies by leading
to an excessive concentration of power in the hands of the elites. Our hypothesis is that, in the
presence of a military threat, frontiers must be defended and this fact biases the political equilibrium
in favor of the military elite, which ends up accumulating an enormous amount of economic and
political power. We empirically test this hypothesis by exploiting the existence of a stable frontier
between Castile and the Nasrid Kingdom of Granada in the late Middle Ages in the southern
Spanish region of Andalusia. Our results indicate that the frontier of Granada had very persistent
effects on political and economic inequality, which decisively affected subsequent development.
Historically, with the possible exception of the U.S. frontier, which involved individualism, self-
governing forms of political democracy, and aversion to social stratification (Turner, 1920), frontiers have been associated with political and economic inequality. For instance, Hennessy (1978,
p. 26) asserts that “far from stimulating democratic values and creating a democratic myth, the
frontier in Latin America has bred a spirit of lawless anarchy and perpetuated outworn forms of
social and economic organization [...]. It could be argued that it is these frontier regions which have
bred caudillismo or strong man rule; that power and prestige derive from ownership of land and
domination over a serf-like rural following”. Other frontiers, such as those of the Boers in South
Africa, the Russians on the European side and in Siberia, or the German expansion into the region
East of the Elbe, did not introduce significant political institutions providing serious fundaments for
a modern state.
1 There are frontiers not only in the colonization of the New World (e.g., North and South America) –Turner (1920) and Gerhard (1959)– but also in the Old World. Examples of the latter are Hadrian’s Wall, which delimited the northern limits of the Roman Britain, the Great Wall separating the settled Han Chinese from the nomadic tribes of the North for over two millennia, the Arab-Byzantine frontier in the Middle Ages, the frontier that separated Western Europe from al-Andalus during the Christian re-occupation of the Iberian Peninsula, the so-called Reconquista, the border between the Habsburg and Ottoman Empires in Eastern Europe, Russian expansion in Central Asia, and Germany’s expansion eastward, to name just a few. See (supplementary) Appendix A for a more detailed account of frontiers of settlement and defense throughout history.

2
Until now, the only empirical study that deals explicitly with the political economy that leads
frontiers to be unequal is García-Jimeno and Robinson (2011). According to their conditional
frontier hypothesis, the contrasting outcomes obtained from the different frontier experiences on the
American continent must be sought in the initial political equilibrium existing in society at the time
of the frontier’s expansion. When the political equilibrium was biased toward the oligarchies with
political power, as occurred in most of Latin America, frontier land was allocated on an inegalitarian
basis favoring members of the political elite to ensure they remained in power. Closely related is the
existing literature that links the emergence of institutions to frontier experiences. This includes the
prevalence of extractive institutions that took the form of serfdom in the region East of the Elbe due
to a certain configuration of social institutions biased towards the landowning elite at the expense of
the peasant class, as postulated by Brenner (1976).2 More generally, Acemoglu and Robinson (2012)
and Chaney and Hornbeck (2015) hold the view that in pre-industrial times large adverse shocks
leading to persistent labor scarcity created a critical juncture in history that, depending on the initial
balance of power in society, pushed institutions in the direction of either strengthening pre-existing
extractive institutional arrangements (as in Eastern Europe) or of weakening them (as in much of
Western Europe), with feudalism eventually disappearing.3
This article opens a new research avenue on the political-economic effects associated with historical
frontiers. We establish the hypothesis that militarily insecure frontier regions, because of their
defense needs, favor a political equilibrium biased toward the elite groups, which generates political
and economic inequality, thus undermining subsequent economic development. The frontier of
Granada, which was for two and a half centuries the frontier in Europe between Christianity and
Islam, constitutes an excellent opportunity to test this hypothesis. It allows us to compare
municipalities that were conquered and resettled under the influence of an insecure frontier, on the
Castilian side, with municipalities that were organized and repopulated after the dismantlement of
the frontier, on the Granada side.4 On the one hand, the Castilian part was organized and resettled
under the premises of being an insecure frontier region facing the Muslim adversary, which
2 In a similar spirit, Gerhard (1959, p. 223) argues that medieval frontiers such as that of the Eastern colonization were associated with the migration of the medieval feudal organization in full. Due to space considerations, other arguments and references on the Brenner debate are provided in Appendix B. 3 With a focus on African societies, Fenske’s (2012, 2013) land abundance view of African history links the existence of open frontiers in Africa, characterized by large tracts of unoccupied land and low population density (and in turn labor scarcity), to a lack of price and rights over the land, as well as to the prevalence of slavery and other forms of coerced labor across the African continent. 4 The Castilian side of the frontier approximately encompasses the modern provinces of Cadiz, Cordoba, Huelva, Jaen, and Seville, while the Granada side the provinces of Malaga, Granada and Almeria.

3
decisively affected the way the resettlement was done. As illustrated in Figure 1, this created the
conditions for a specific configuration of de facto and de jure political power distribution in favor of
the powerful groups (particularly the nobility, the Church, and military orders), which generated
extractive institutions to exploit the landless peasantry, with negative consequences that persisted
over time right through to the twentieth century.5 More specifically, the need to defend against the
enemy led the nobility and military orders to play a central role in the occupation and protection of
the new territory. This political equilibrium biased towards the privileged orders brought about a
high concentration of de facto political power in the form of great land allocations and de jure
political power through jurisdictional rights along the frontier. Other factors such as the insecurity of
a border area constantly under threat promoted a type of extensive land exploitation based on
pasture and livestock, and the low population density –a consequence of this insecurity– was also
conducive to the accumulation of land in a few hands. On the other hand, the former Nasrid
Kingdom of Granada evolved differently, largely because once it had been conquered, the
phenomenon of the frontier ceased to exist, and the Muslim opponent was no longer a threat. The
territory could be repopulated and organized according to different premises and objectives, and the
distribution of land ended up being relatively more egalitarian.
[Insert Figure 1 about here]
The empirical strategy is operationalized by exploiting municipality-level data to study the effect of
the frontier of Granada on the concentration of economic and political power on the Castilian side.
We compile historical data for the 771 municipalities making up modern-day Andalusia. Our dataset
covers the percentage of landless workers over the total agrarian active population in 1787 –which is
closely related to the extent of land concentration in the hands of the privileged orders– and the
amount of income earned by the wealthiest individual in each city or village in the 1750s, as
measures of de facto political power. As a measure of de jure political power, we employ the
jurisdictional category of each municipality under the Ancien Regime, i.e. those cities and villages
over which nobles, military orders and the Church had jurisdictional rights in 1787. We also collect
data on current land inequality and development outcomes, and many geographic and historical
controls. We then compare observations on both sides of the frontier using a border specification
and a semiparametric spatial regression discontinuity design (RDD). The evidence shows that the
5 According to Acemoglu and Robinson (2010, p. 8), “de jure political power refers to power that originates from the political institutions in society [… and] de facto political power originates from the ability of the group in question to solve its collective action problem and from the economic resources available to the group (which determines their capacity to use force [and influence] against other groups)”.

4
municipalities on the Castilian side have a significantly higher percentage of landless workers, a
higher level of accumulated wealth, and more jurisdictional rights in the hands of the privileged
orders, whereas there are no significant discontinuous shifts across the frontier in a wide array of
climatic and geographic factors, or in pre-existing conditions. In addition, using current indicators of
land inequality measured in the 1980s, we show that the effect of the frontier of Granada persists
today, five centuries after it disappeared. These results are robust to controlling for a wide array of
observable characteristics and employing alternative specifications in the RDD, using microdata for
a sample of almost 129,000 holdings, as well as to a series of falsification tests consisting in either
drawing 1,000 random placebo borders or moving the true frontier northwestward and northward.
Using several outcomes linked to contemporary development, we corroborate Acemoglu and
Robinson’s (2006, 2010) view that historical structural inequality is harmful to economic
development.
Our findings on the negative consequences that the frontier of Granada had for the border region of
Andalusia are consistent with the “conditional frontier thesis” proposed by García-Jimeno and
Robinson (2011).6 For the case of the Castilian expansion into southern Spain in the thirteenth
century, the dynamics of a frontier region with a threatening enemy favored the control of land and
political power by the nobility. Thus, the frontier of Granada is an instance of a more general
phenomenon: a frontier that leads to pernicious effects due to a political equilibrium defined by a
high concentration of power in the hands of a military elite, which is reinforced by the fact of being
an insecure border region. Our results may be applicable to other insecure frontier regions.7
Our study differs in several respects from others analyzing historical borders since it focuses on the
political economy that leads frontiers to be unequal. As such, it primarily centers on the immediate
effects of being a frontier on inequality, and secondarily, it documents the long-term persistence of
the effects. Also, the case of the frontier of Granada is more extreme: the frontier ceased to exist at
6 Their analysis of the frontiers on the American continent points to the existence of higher long-run economic growth and current democracy levels, the greater the constraints on the executive in 1850 and the longer the frontier. 7 While García-Jimeno and Robinson (2011) paint a story in which the central oligarchy wants its affiliates to control frontier regions –which is a resource that is used to ensure the oligarchic elites cement themselves in power–, Hennessy (1978) emphasizes the fact that the center finds it hard to control frontier land and this empowers local strongmen to amass huge power. In either case, the existence of a frontier favors the perpetuation in power of the nondemocratic oligarchy, rather than create a viable rural middle class comparable with that in North America. In principle, both mechanisms would be compatible with our findings. However, our historical account seems to favor the former hypothesis, though placing more emphasis on the center’s final objective of strengthening frontier positions and preventing foreign conquest.
5
the end of the fifteenth century, but its effects are still felt five centuries later.8 Finally, this article
also contributes to the literature on the long-term persistence of historical events by shedding light
on the causes of the long-standing inequality that Andalusia has suffered throughout its modern
history.9 This issue has been emphasized, among others, by Vicens Vives (1969) who pointed out
that along the frontier of Granada the large landholdings of the military orders and the greatest noble
families were consolidated to such an extent that all the nobles that have played an important role in
Spanish history since the fifteenth century have based their power on this latifundia system. This
initial concentration of economic and political power persisted over time, stamping on Andalusia its
hallmark of “the classic land of the latifundia or slave-worked estates” (Brenan, 1950, p. 114) and
caciquismo (Ortega López 1986; Tusell 1976).
The remainder of the paper is organized as follows: Section 2 provides a historical overview.
Section 3 describes the data, and Section 4 provides preliminary statistical evidence on the effect of
the frontier of Granada. Section 5 develops the empirical strategy and presents the empirical
evidence from the estimation of a border specification and a spatial RDD, and also conducts several
robustness checks. Section 6 presents an RDD applied to microdata of agricultural holdings. Section
7 investigates the effect of the Granada frontier on several contemporary development outcomes.
Section 8 puts forward some implications and concludes.
2. Historical Background
2.1. The Frontier of Granada and the Origins of Economic and Political Power Concentration in
Andalusia
The Reconquista is modern Spain’s historical constitutive process. Over a protracted period of
almost eight hundred years (from approximately 722 to 1492), the Christians located in the north
8 The extant literature has mainly focused on historical borders (see, among others, Dell, 2010; Grosjean, 2011a, b; Becker et al., 2015). Borders can be conceptualized as a geographical delimitation (a line) separating two political or administrative units. Historical and modern borders may be very useful to exploit discontinuities (for example in institutions). By contrast, frontiers are a different phenomenon. They represent large geographic areas delimiting major cultural and political blocks, under military insecurity and instability, and with a potential for further territorial expansion. Frontiers develop specific and differentiated cultural, political and economic patterns, giving rise to “frontier societies”. In this sense, our paper is original because it focuses on the dynamics of a frontier society.
9 This line of research pioneered by the seminal papers by Engerman and Sokoloff (1997) and Acemoglu, Johnson, and Robinson (2001) focusing on European colonialism has been followed by a number of different studies investigating historical events such as overseas colonialism, revolutions, or religious reformations. They include, among others, Banerjee and Iyer (2005), Gennaioli and Rainer (2007), Acemoglu et al. (2008), Becker and Woessmann (2009), Gallego (2010), Iyer (2010), Bai and Kung (2011), Bruhn and Gallego (2012), Chaney (2013), Fenske (2014), Oto-Peralías and Romero-Ávila (2014a), Bai and Kung (2015), Cantoni (2015), and Chaney and Hornbeck (2015).

6
gradually conquered the Muslim territory to the south and implemented measures to colonize these
new lands. These measures, aimed at organizing and resettling the conquered territory, were
fundamental to the subsequent development of each region (Oto-Peralías and Romero-Ávila,
2014b). After the battle of Las Navas de Tolosa in 1212, most of the southern third of the peninsula
suddenly fell into Christian hands. The rapid advance of the Christian frontier made it difficult for
the Crown to officially organize the repopulation on such a large scale and altered the balance of
power toward the nobility and military orders, who were required for conducting an effective
occupation and defense of the new lands. Within this context, the fact that the Reconquista was not
fully completed, due to the resistance of the Nasrid Kingdom of Granada, was a factor that
decisively influenced the repopulation of Andalusia, which was a frontier region for two and a half
centuries. The insecurity derived from the existence of the frontier determined the organization of
the new lands by further strengthening the power position of the privileged groups.
In the first place, the continuous warfare between Castile and the Kingdom of Granada forced the
former to make new and important military efforts and reinforce the frontier of Granada, particularly
after the uprising of the mudéjares in 1264 and over the decade following the first incursion of the
Marinids in 1275. To this end, Alfonso X called on the military orders to do their duty of defending
the frontier. However, by the end of the thirteenth century the military orders had lost interest in
frontier warfare and were concentrating on administrating their enormous wealth.10 As a result, from
this point onwards the task of defending and protecting the frontier territories was entrusted to the
great noble families of the region. The frontier was able to fulfill the needs of both the Crown and
the nobles. The former secured frontier positions that were difficult to defend and were at constant
risk, while the latter found in the frontier a means of social, economic, and political empowerment
(Cabrera Muñoz 2006).
Secondly, the low population density that is characteristic of these insecure border regions, the
demographic decline brought about by epidemics,11 and the expulsion of the Muslim population
10 Following the example of the Holy Land crusaders, the Castilians created three great military orders that served as armies for the country to conquer Muslim lands and defend the Christian frontier. The order of Calatrava was founded in 1158, the order of Santiago in 1170, and the order of Alcántara in 1175, during the second half of the twelfth century, a period from which military orders grew in importance due to their key role in the defense of the frontier (Forey, 1984; González Jiménez 1989), with the creation about a century later of the order of Santa María de España (1272). Besides their military activity, these orders played an active role in the resettlement of the conquered lands. 11 Due to lack of data, we are unable to control for the number of casualties that the Black Death caused on each side of the frontier. However, we can conjecture that the Black Death is likely not to be the explanation for the frontier effect found below given that the pest equally acted on both sides of the frontier, as the disease could easily spread across borders.

7
after the 1264 revolt, all favored the establishment of an extensive agricultural system based on
large estates, which were concentrated in the hands of the nobility.12 Thus, the intensive agriculture
that had previously prevailed in the Guadalquivir Valley since Roman times was replaced by an
extensive agrarian sector dominated by olive groves and sheep (Vicens Vives 1969; Malefakis
1970). Thirdly, key to the expansion of the seigneurial system and the consolidation of the high
nobility in Andalusia after the defeat of Peter I was the founding of the Trastamaran dynasty (1369-
1504) in favor of Henry II. The new dynasty again converted the nobility into the main player in the
defense of the frontier and, accordingly, handed out extensive lordships and land allocations.
Fourthly, the relative weakness of the Crown vis-à-vis the high nobility, who controlled town
council positions, facilitated the increase of nobles’ lands through usurpations (Cabrera Muñoz
1989).
In short, all the above factors biased the political equilibrium toward the nobility at the expense of
the peasantry. The former enjoyed enormous political power in the form of jurisdictional rights,
which provided the legal and political apparatus that afforded them de jure political power over the
broad mass of the population. This implied the attachment of the landless peasantry to the land of
landowners –who had to provide the latter with labor services– and the control of the judiciary and
the local council by the nobility. This de jure political power in combination with de facto political
power afforded by the high concentration of land allowed the landed elite to set economic
institutions to their own benefit. Examples are the existence of severe restrictions on land and grain
transactions, labor contracts with caps on agricultural wages, land tenure systems implying short-
term leases, and the obligation to use the nobles’ mill to grind grain and press olives. Nobles also
exploited monopoly rights over public ovens, butcheries, forges, wineries, taverns, and potteries
(Cabrera Muñoz 2006). They were often granted the right of taxation at local level, and they
adjudicated over disputes about property, punishing minor crimes and even imposing death
sentences for capital crimes (Dewald 2004). They could also use their power to buy and control state
offices (Truxillo 2001).
12 Cabrera Muñoz (2006) argues that adverse population shocks like the failure of the initial repartimientos, the expulsion of the Muslim population and epidemics contributed to the expansion of lordships which served as a way to compensate the nobility for the losses incurred and as a means to occupy and repopulate large tracts of depopulated territories. This has some similarities to the strengthening of feudal links through serfdom in Eastern Europe coinciding with the demographic crisis of the late fourteenth century (Brenner, 1976). In the context of the expulsion of 120,000 Moriscos from the Kingdom of Valencia in 1609, Chaney and Hornbeck (2015) argue that the relative land abundance and labor scarcity in former Morisco districts brought an institutional response that, instead of empowering peasants by improving their outside options –as would be expected by the neo-Malthusian view of feudal decline by Postan (1973) and Le Roy Ladurie (1977)–, led to coordinated efforts by the powerful elites to coerce the peasantry –in a similar spirit to Brenner’s account of the second serfdom. These facts can be reconciled under the theoretical framework of Acemoglu and Wolitzky (2011).

8
2.2 Was Economic and Political Power Concentration Second-best?
An interesting question is whether the resulting strategy of colonizing border regions through large
lordships controlled by the privileged orders could potentially be second-best, and whether there
was an alternative way to settle these territories that had less nefarious consequences. The answer is
that there probably was. Indeed, according to González Jiménez (1981a) and Cabrera Muñoz (2006),
after Ferdinand III’s conquest of the lands of Cordoba (1236), Jaen (1246), and Seville (1248), the
Crown initially tried to implement a system of military occupation in Andalusia that allowed the
Muslim population to stay in the conquered territory, since it constituted an abundant labor force
and a stable source of fiscal revenues. A similar “colonial” system had been established in Valencia
and Murcia (Burns, 1976). In addition, the Crown was initially reluctant to employ the nobility and
military orders as the main guarantor of the occupation and defense of the conquered areas, given
the excessive concentration of power they accumulated in central Spain (Extremadura and La
Mancha). Ferdinand III and Alfonso X therefore conducted a repopulation process that sought to
attract the maximum number of settlers who, by obtaining property rights over the lands and
dwellings obtained in the repartimientos, would occupy and defend the territory from the enemy.
This is the reason initially large estates and lordships had limited importance (Cabrera Muñoz,
1989).
However, the repopulation process based on small and medium-size holdings of free peasants came
to a halt due to the mudéjar crisis in 1264 that brought about extreme rural depopulation, the
incursion of the Marinids over the 1275-1285 period, and the continuous frontier wars that would
last until 1350, which forced Christian settlers to concentrate in urban centers that afforded military
protection. Despite the fiscal exemptions offered to attract settlers to the frontier, a lack of
manpower was still evident in the fourteenth century (González Jiménez, 1981b). In this context of
frontier insecurity, Castilian monarchs had no choice but to delegate military and governmental
powers to the nobility and their lordships. As will be shown in the empirical analysis, these
inevitable patterns of conditional settlement would bring about negative long-term consequences in
the distribution of economic and political power, which are still visible even today.
The former Nasrid Kingdom of Granada evolved differently, largely because once reconquered the
phenomenon of the frontier ceased to exist, and Castile’s enemy was no longer a threat. The
repopulation and organization of the territory could be made under different premises and
objectives. Accordingly, although nobles also received generous land allocations, its distribution
ended up being relatively more egalitarian, and the nobility received fewer jurisdictional rights. By

9
the late fifteenth century, the Catholic Monarchs had accumulated enough power to control the
nobles’ pre-eminence (Vicens Vives 1969). This was aimed at preserving the existing balance of
power among the main noble lineages, and between these lineages and the Crown. Hence, once the
frontier ceased to exist, the position of the Crown was strengthened.13 In sum, we can exploit the
discontinuity produced by the frontier; on the Castilian side, the resettlement was conducted under
the circumstances of an insecure frontier region, while on the Granada side, the organization of the
new land was carried out in relative safety.
2.3. The Persistent Concentration of Economic and Political Power and its Implications
Once the point of departure had been established, several mechanisms of persistence perpetuated
and even aggravated the initial level of inequality. One key factor was the proliferation of entailed
estates protected by law (mayorazgos) and other regulations by which land became non-conveyable
such as the communal lands of municipalities and ecclesiastical land in mortmain. In addition,
jurisdictional rights were hereditary, which guaranteed the persistence in the concentration of
disproportionate shares of de jure political power in the hands of the nobility. The nineteenth
century witnessed two major developments that failed to shift the balance of power in favor of the
landless working class. First, several liberal reforms dismantled the legal apparatus of the Old
Regime, but many jurisdictional domains became the property of the nobles in charge of the
jurisdiction (Ruiz-Maya 1979). Second, in the process involving the disentailment of communal and
ecclesiastical landownership, known as desamortización, the financial needs of the state prevailed,
and land was bought up by the rich, the bourgeoisie and the aristocracy (Carrión, 1975). This
ensured the continuation of the previous economic institutions, since the oligarchic structure of the
Ancien Regime remained fairly unaltered. Far from disappearing, the unfavorable situation for the
landless peasantry endured until well into the twentieth century, thereby contributing to the outbreak
of the Civil War in 1936-1939 (Brenan 1950). The situation did not improve during the early years
of General Franco’s regime (1939-1952), in which the strict control of prices and supply in the
markets for goods and factors led to limited factor mobility.14
13 It is well known in Spanish historiography that nobles and military orders were a competing power against the Crown, rather than a simple intermediary between the Crown and the populace. Indeed, before the conquest of Granada, due to the Crown’s dependence on the nobility to protect the frontier, the latter used their power to transform royal jurisdictions into noble jurisdictions (Rodríguez Molina 2000). 14 No major agrarian reform was conducted over the postwar period, with the “agrarian question” being partly resolved thanks to the rural exodus, either to the cities or to the industrialized regions of Spain or Europe (Caro Baroja, 1966). Despite Spain’s integration into the European Union and the associated redistributive policies, a fall in regional disparities has not been observed since the eighties.

10
Regarding the implications for economic development, high land concentration had negative
consequences for agricultural productivity, as highlighted by the enlightened thinkers of the
eighteenth century (Olavide 1768; Jovellanos 1795). It is also argued that the agricultural
population’s low standard of living and lack of purchasing power has been a major factor
responsible for the failure to industrialize in Andalusia (Nadal 1975; Nadal, Carreras and Sudriá
1987).15 Oto-Peralías and Romero-Ávila (2014b) hold the view that under such conditions, broad
segments of the population were excluded from participating in economic activity when the
opportunity to industrialize arrived. As a result, regions with large estates fell behind during the
industrialization period.
3. Data Description
We have compiled a dataset for the 771 municipalities there are in Andalusia. It contains one
indicator measuring whether the town or village belonged to the Castilian part of Andalusia, three
variables related to historical measures of land concentration, wealth accumulation, and
jurisdictional rights, two variables related to current measures of land inequality, several outcomes
linked to contemporary economic development, and a wide array of variables associated with
climatic and geographic factors. To begin with, the frontier of Granada is defined as it was at the
beginning of the War of Granada (1481-1492), which coincides with the subsequent boundaries of
the historical province of Granada. Since the end of the great conquests of Ferdinand III and Alfonso
X in the mid-thirteenth century, the borders of the Kingdom of Granada were quite stable, and only
some territories were lost near the Strait of Gibraltar and around the area of the town of Antequera
(Mestre Campi and Sabaté 1998).16 Since this paper’s hypothesis is that the existence of a frontier
with an enemy was an important factor in the organization and repopulation of the territory, we
prefer to use the 1481 frontier, i.e., the last line that could affect the repopulation of the Christian
territories. Arguably, once the War of Granada began, the new lands conquered during the war could
be organized and resettled according to different purposes. In statistical terms, our treatment group
will include those municipalities that have been exposed to frontier at some point in time; that is, 15 This would agree with Brenner’s (1976, 1982) view that East of the Elbe it was easier for the landlord to squeeze the peasantry rather than invest in agricultural development, as in England. This in turn prevented the emergence of a domestic market for manufactured goods and an industrial labor force. 16 Over the fourteenth century and most of the fifteenth century, the Castilians annexed only a few locations along the frontier, i.e., Teba, Pruna, and Olvera (1327-1330), Alcalá la Real (1341), Antequera (1410), Castellar and Jimena (1431-1434), Huelma and Bélmez (1438-1448) and Archidona (1462), in addition to Algeciras (1344) and Gibraltar (1462) on the Atlantic coast, which also served as a natural frontier with North Africa (see Mestre-Campi and Sabaté 1998, for more details). These conquests were therefore local in nature and constituted relatively small adjustments of the frontier established in the thirteenth century (González Jiménez 2006).

11
those municipalities that have at some stage been part of the Castilian side of the frontier.
Otherwise, an earlier definition of the frontier would make some treated municipalities appear in the
control group. Thus, we take the border in its maximum extension, although for robustness purposes
we also look at various expansion stages below.
Regarding the historical measure of land concentration, we use the percentage of landless workers
over the total active agricultural population in 1787, as recorded by the Floridablanca census. The
total agricultural population is composed of farmers and landless day laborers. The percentage of
landless workers can be considered as a proxy for historical structural inequality. This is referred to
as a type of inequality that is historical in the sense that it has strongly persisted over centuries, and
structural in the sense that it is a class-based inequality. Figure 2 shows the percentage of landless
workers for each municipality. Although the values are very high almost across the board, the
Castilian part of Andalusia has a higher percentage of landless workers (87%), versus 72% in the
former Kingdom of Granada.
Concerning the historical measure of wealth accumulation, we use the total amount of income
earned by the individual earning the most in each municipality. This variable is provided by the
Catastro de Ensenada compiled between 1750 and 1753, and more precisely, by a series of books
known as El Mayor Hacendado. Given the economic structure of that period, with a clear
predominance of agriculture, in the vast majority of cases the mayor hacendado (i.e., the individual
with the highest income) is a landowner, and the bulk of the income comes from land (Artola,
Bernal, and Contreras, 1978). Since this indicator of wealth accumulation can vary depending on the
municipality’s extension, we express it relative to the size of the municipality. Figure 3 shows
remarkable differences between the Castilian part of Andalusia and Granada. The average value for
the former is about 1,550 reales/km2, while for the latter it is about 674 reales/km2.17 The former two
variables can be thought of as measures of de facto political power.
Our third historical variable refers to jurisdictional rights in the Ancien Regime. We use data from
the 1787 Floridablanca census, which identifies each municipality’s jurisdictional category. There
are four types of jurisdictions: municipalities owned directly by the Crown (realengo or royal
jurisdiction), ecclesiastical lordships, noble lordships, and military order lordships.18 Since we are
17 In the empirical analysis, we control for other factors that can also be related to income, such as land quality. 18 By far the most important categories are realengos, accounting for 45% of the municipalities, and noble lordships, representing 49%. However, in terms of population, to the extent that the main towns were under royal jurisdiction, municipalities depending on the Crown represented 59% of the total population, while 37% were under noble

12
interested in a measure of the (de jure) political power of the privileged orders, we use a single
group to consider those jurisdictions depending on the nobility, military orders, and the Church –
while keeping in mind that municipalities belonging to the latter two groups were residual in
Andalusia (only 28 and 12, respectively). Figure 4 depicts the distribution of jurisdictions in
Andalusia. There is a noteworthy presence of jurisdictions belonging to the privileged orders along
the frontier of Granada, particularly in the southwestern and central parts.
[Insert Figures 2-4 about here]
In sum, these three historical variables can be interpreted as measures of the concentration of
political power in the hands of the privileged orders versus the peasantry. In addition, we also
calculate two indicators of current land inequality using the agricultural census of 1982 in order to
analyze whether the effect of the frontier of Granada on inequality has persisted over time, and if
there is still an effect in the second half of the twentieth century. These variables are the percentage
of utilized agricultural area (UAA) in holdings with 200 hectares or more of UAA, and the Gini
coefficient of UAA. We consider private agricultural holdings (owned by private persons or legal
entities).19 To save space, the definitions and sources of the remaining variables are presented in
Table A1, while the descriptive statistics are reported in Appendix D.
4. Preliminary Evidence
On the basis of the historical account presented in Section 2, our hypothesis is that the frontier of
Granada was a factor that significantly increased political and economic inequality on the Castilian
side of Andalusia, but not in the territory of the Kingdom of Granada. We test our hypothesis by
comparing municipalities on both sides of the frontier. As a first approximation, Table 1 (Panel A)
presents tests of mean differences for our three historical indicators related to economic and political
power concentration. Conley (1999) standard errors robust to spatial correlation of unknown form
are used.20 The first three columns show the results for the whole sample. The average value of the
percentage of landless workers in 1787 is higher in the Castilian part of Andalusia than in Granada,
with the difference being highly significant. The accumulation of income as given by the variable
Mayor Hacendado’s income over land area is also significantly higher in the former territory of
Castile. As regards the jurisdiction of privileged orders (measured with a dummy variable), its
jurisdiction. In terms of surface area, royal jurisdiction accounted for 49% of the total land area, with the figure for noble jurisdictions being 45%. 19 See Figures A1 and A2 in Appendix C for maps showing the distribution of these two variables. 20 We employ cutoffs of 1 decimal degree, beyond which the spatial correlation is assumed to be zero.

13
average represents the percentage of cities and villages governed in this way. Again, this percentage
is significantly higher (by almost 23 points) on the Castilian side of Andalusia. In columns 4–6 in
Table 1, we compare municipalities whose centroids are within 50 kilometers of the frontier (i.e., we
set a bandwidth of 100 km), and columns 7–9 restrict the sample to municipalities within 25
kilometers of the frontier. Although this now involves comparing municipalities that are closer to
the frontier and hence more alike in geography and climate, the mean differences in each one of the
three relevant variables between both sides of the frontier remain fairly unaltered and statistically
significant.21
Panel B in Table 1 investigates whether the effect of the frontier of Granada on inequality still
remains today, five centuries after it disappeared. Towards that end, we use the two indicators of
land inequality calculated with the 1982 agricultural census, namely, the percentage of UAA in
holdings ≥ 200 hectares and the Gini coefficient. The results indicate that land concentration is
higher in the Castilian part of Andalusia than in the former Kingdom of Granada, with mean
differences being highly significant in the three samples. It is remarkable that when focusing on
municipalities within 25 kilometers of the frontier, even today we can still observe differences
between both sides of the border. This implies the presence of extraordinary persistence in
inequality over the centuries, and this is so despite the attenuating effects due to spatial integration.22
[Insert Table 1 about here]
5. Econometric Approach
Although the initial evidence from the analysis of mean differences is appealing, it may be plagued
by omitted variables bias. For example, factors related to geographic and climatic conditions left
uncontrolled or unobservable characteristics may differ on both sides of the frontier, and influence
positively the concentration of land on the Castilian side, thus creating an upward bias in the
treatment effect. In dealing with the bias caused by omitted observables we include a wide range of
geographic and climatic characteristics, whereas unobservable heterogeneity is handled through a
twofold strategy. First, we estimate a border specification that compares municipalities within a 25- 21 Figure A3 in Appendix E depicts the sample of municipalities studied in each case. 22 Spatial integration may act against our hypothesis that there are significant differences in economic and political power concentration across the frontier when we narrow the sample down to observations close to the border, especially when the frontier ceased to exist at the end of the fifteenth century, and our dependent variables correspond to the eighteenth century. It is possible that during that period, social and economic factors on one side of the former frontier affected municipalities on the other side. For example, a village in which the initial level of land concentration was high may have increased the level of land concentration in its neighbors if landowners from that village expanded their large estates by purchasing land in neighboring villages.

14
kilometer strip on either side of the frontier of Granada in order to determine the statistically
significant average treatment effect. By limiting the analysis to the area 25 km from the frontier, one
implicitly assumes that any set of unobservable confounders is relatively unimportant when looking
at the subset of data close to the threshold. Second, we apply a spatial RDD in order to shed more
light on the causal effect of the frontier of Granada on the five outcomes considered. This is aimed
at identifying a spatial pattern of economic and political power concentration by showing
discontinuous jumps in the frontier for a sample of municipalities falling within 25 kilometers on
each side of it. The focus on this restricted sample can be considered as the most rigorous way to
test our hypothesis and provides a sufficiently good fit to the polynomials in our forcing variables.23
In addition to spatial integration, the possibility that power concentration was prevalent on both
sides of the frontier may also attenuate any differences in power concentration,24 thus creating a
downward bias in the treatment effect. To the extent that observed and unobserved heterogeneity are
properly accounted for in the empirical analysis, our estimates of the treatment effect can be taken as
a lower bound of the true effect.
5.1 Testing for Geographic, Climatic and Preexisting Differences across the Frontier
The validity of the border specification, and particularly of the spatial RDD, requires all the relevant
factors besides the treatment to vary smoothly at the Granada frontier, and as such there cannot be
any discontinuous jumps in any of these features. We test the existence of statistically significant
differences across both sides of the border in the following geographic and climatic dimensions:
altitude, ruggedness, terrain with a steep slope, direct access to the sea, rainfall, temperature, aridity,
and Mediterranean phytoclimate. We also test for cross-border differences in soil quality and in
several soil dimensions, such as moderate or high erodibility, low topsoil carbon, and fine soil
texture, as well as in the proportion of arable land, and the percentage of land devoted to herbaceous
crops. As shown in Panel A of Table 2, it is worth noting that there are no statistically significant
jumps at the frontier of Granada in any of the eight climatic and geographic features considered.
Likewise, Panel B discards the existence of cross-border differences in soil quality, soil
characteristics, percentage of arable land, or the type of crops.
23 We follow Becker et al. (2015), who recommend the use of this twofold strategy for settings of treatment effects of long-gone borders. This is because in a setting with sharp spatial discontinuities in treatment, the spatial RDD identifies more cleanly (than the border specification) any short-term treatment effects, but is also subject to attenuation bias due to diffusion and interaction effects across the frontier in settings of long-term effects of historical borders that ceased to exist in the distant past. 24 See Section 5.5 for a detailed account of the existence of a relatively high power concentration on the Muslim side of the frontier (though lower than on the Castilian side).

15
Finally, it is necessary to discard the possibility that differences between the two sides of the border
were in place before the formation of the frontier. Accordingly, we check for the existence of
discontinuous jumps in the presence of Roman roads, distance to urban centers in 1200 and 1400,
and in pre-Christian land uses in al-Andalus between the tenth and twelfth centuries measured
through the percentage of surface area in each municipality made up of forest, pastureland, intensive
agriculture, and non-intensive agriculture. The evidence, reported in Panel C, does not support the
existence of statistically significant cross-border differences in either Roman roads or distance to
urban centers, or in any of the four pre-Christian land uses. This dismisses the possibility that
differences in economic and political power concentration between both sides of the frontier merely
reflect a perpetuation of pre-existing differences in land uses or in access to trade routes or
commercial centers.25
[Insert Table 2 about here]
5.2 Border Specification
We next estimate the following border specification:
iiijji XAndalusiaCastilianY εβαφα ++⋅++= '10, _ (1)
where Yi,j is our dependent variable in municipality i along segment j of the Granada frontier, α0 is a
constant term, jφ is a set of four equal-length segments of the frontier (boundary fixed effects)
representing the closest one to the municipality centroid,26 Castilian_Andalusiai is a dummy variable
indicating that the municipality belonged to the Castilian part of Andalusia, Xi represents a vector of
control variables, and εi is the error term. The equation is estimated with ordinary least squares
(OLS).
Regarding the vector of control variables, we first include indicators related to suitability for
agriculture and land productivity, which affect the size and profitability of landholdings. These
25
As a robustness check, Appendix F provides regression discontinuity (RD) figures plotting the actual values and the local averages of each of these factors in terms of their distance to the frontier along with 90% confidence intervals. It also contains the regression counterparts to these graphs, which provide point estimates of the jump using a quadratic polynomial in distance to frontier. In essence, the balancedness testing indicates that balance generally holds across both sides of the border (in only one out of the 21 dimensions considered –the percentage of non-intensive agricultural surface– there is evidence of marginally significant differences at the 10% level). 26 These segments allow us to compare municipalities across the same segment of the frontier. They can be thought of as capturing geographic treatment effect heterogeneity (Dell, 2010), as the treatment effect may vary along the geographic frontier. For other studies incorporating segment fixed effects in the RD specification, see Dell (2010) and Dell, Lane and Querubín (2015).

16
indicators are altitude, ruggedness of the terrain, a direct measure of soil quality, annual rainfall, and
average temperature. We also include a coast dummy that can proxy for access to external markets
in which agricultural products could be sold. The results are reported in Panel A of Table 3 and
appear to confirm the evidence from unconditional mean differences in Table 1.27
[Insert Table 3 about here]
5.3. Spatial Regression Discontinuity Analysis
Once we have determined the existence of a statistically significant average effect of the Castilian
dummy on the concentration of economic and political power through the border specification, we
now shift to the application of a semiparametric spatial RDD, as in Dell (2010) and Becker et al.
(2015). In the presence of a causal impact of the frontier, there must be a spatial pattern of economic
and political power concentration with discontinuous jumps at the frontier. The aim is to identify
causal effects by distinguishing between, on the one hand, the treatment effect of the frontier, which
is nonlinear and discontinuous in terms of both longitude and latitude, distance to the frontier, and
distance to Madrid (depending on the definition of the forcing variable), and on the other, the
smooth effects of the climatic and geographic characteristics (see more details in Angrist and
Pischke 2009, and Dell 2010). The baseline regression in the RDD takes the form:
iiiijji locationgeographicfXAndalusiaCastilianY εβαφα +++⋅++= )(_ '10, (2)
where )( ilocationgeographicf is the RD polynomial, which controls for smooth functions of
geographic location, and the rest is as described in Equation (1). Before presenting the results from
the application of the RDD, we need to determine our baseline specification for the RD polynomial,
i.e., the order of the polynomial. In this regard, Gelman and Imbens (2014) have recently shown that
linear and quadratic polynomials in the forcing variable perform much better than cubic or higher-
order polynomials, which often provide misleading confidence intervals based on such regressions.
For completeness purposes, we present the results for the case of several forcing variables: the
geographic coordinates, distance to the frontier, distance to Madrid and distance to Seville (the latter
appearing in the supplementary appendix). Table 3 presents the estimation of our baseline RD
specifications: one of a quadratic multidimensional RD polynomial in latitude and longitude (Panel
B), and one of a quadratic single-dimensional polynomial in either distance to the frontier (Panel C) 27 The results indicate that the fact a municipality is located on the Castilian side of the frontier (and hence affected by the treatment) is associated with a 10.8% rise in the percentage of landless workers, a rise in mayor hacendado’s income over land area of 1025.4 reales/km2, and a 25.8% increase in the percentage of municipalities under the jurisdiction of privileged orders.

17
or distance to Madrid (Panel D). The basic control set includes the six geographic-climatic controls
and the four segment fixed effects. The analysis is conducted with both heteroskedasticity-consistent
standard errors and Conley (1999) standard errors robust to spatial correlation of unknown form.28
It is worth stressing that the frontier dummy exerts a statistically significant positive effect on the
five outcomes in the case of the single-dimensional RD polynomial in distance to the frontier or
distance to Madrid. In the case of the more flexible, but also more demanding specification, i.e., the
quadratic multidimensional RD polynomial in latitude and longitude, the frontier dummy appears
statistically significant at the 5% level or higher for four outcomes (all but privileged orders
jurisdiction). This pattern of results should not come as a surprise, since the higher flexibility
associated with the multidimensional RD polynomial comes at the expense of fewer degrees of
freedom, which in the case of a relatively small number of observations and measurement errors in
the dependent variables may inflate the standard errors and reduce the precision of the estimation
(see more details in Dell 2010, and references therein).
For robustness purposes, we next provide a full set of specification tests that includes the use of
linear and cubic polynomials in the three forcing variables considered. More specifically, the results
from the estimation of a spatial RD specification of linear and cubic polynomials in latitude and
longitude (Panels A and D in Table 4), and in distance either to the frontier (Panels B and E) or to
Madrid (Panels C and F), fully corroborate the findings from the spatial RD specification of
quadratic form. It is worth noting that when the highly demanding cubic specification in longitude
and latitude is used, the results in favor of a statistically significant treatment effect is slightly lower
(being significant for three outcomes). However, given the simulation evidence by Gelman and
Imbens (2014), we base our conclusions primarily on the linear and quadratic functions of
geographic location. In addition, we let the geographic location function differ on both sides of the
frontier by including interacted quadratic polynomials in distance to the frontier (assessed at
different percentiles of its distribution), distance to Madrid and distance to Seville. As shown in
Table A4 in Appendix G, our baseline findings remain fairly robust to allowing polynomials to have
different coefficients on both sides of the frontier by interacting the frontier dummy with the
respective polynomials.
[Insert Table 4 about here]
28 Thus, we control for spatial correlation through a polynomial in geographic location when using robust standard errors, whereas we double correct for spatial correlation by further using Conley standard errors on top of the RDD.

18
Figures 5 and 6 are RD plots that provide graphical evidence of the discontinuity in outcomes at the
frontier, using the quadratic specification. First, in Figure 5 we follow the standard approach of
ordering observations (expressed as local averages of the outcomes) along a one-dimensional line, in
our case distance to the frontier. It appears that there is a clear jump at the frontier in the percentage
of landless workers, mayor hacendado’s income over land area and privileged orders jurisdiction,
whereas in the current inequality measures the difference across both sides of the frontier is much
less clear.29 Second, Figure 6 presents two-dimensional RD plots that are analogous to the ones in
Dell (2010). Each plot represents dots with the municipality values for the outcome variables, with
each data point being located in the municipality centroid (with its latitude on the y axis and its
longitude on the x axis). The background color in each plot represents the predicted values for a one-
kilometer grid, from a regression on a quadratic polynomial in latitude-longitude and the Castilian
dummy, with a darker color indicating a higher predicted value. In support of our hypothesis, we can
observe that both real and predicted values are higher on the Castilian side of the frontier. As in Dell
(2010), if we compare the shades of the real data points to those of their associated predicted values,
we observe that the RDD properly averages the data across space.
[Insert Figures 5 and 6 about here]
5.4 Additional Robustness Checks
Next, we examine whether the results are robust to controlling for the distribution of land uses
across the Andalusian territory in the period of al-Andalus between the tenth and twelfth centuries.
It may well be the case that large estates are more common in those places where extensive
agriculture was the historical form of land use, while small holdings are more frequent in areas of
previously intensive agriculture. This is also a general check on the importance of initial conditions
in the territory, as areas with intensive agriculture in Muslim times were generally more densely
populated and wealthier. As shown in Appendix H, the inclusion of the historical form of land use
does not overturn our baseline findings.
29 An explanation for this could be that differences –leading to sharp discontinuities just at the border– may have dissipated over time due to spatial integration. Hence, it seems reasonable to assess the existence of an effect a bit further from the frontier. In addition, there are no municipalities whose centroids are just on the border –the closest municipality to the frontier on the Castilian side is 1,300 m and 75% of them are at least 7 km far off the frontier–, which implies that the discontinuity at the border is based on extrapolation. For these reasons, we examine the presence of a frontier effect not only at the frontier, but also at the 25, 50 and 75 percentiles of the distance to the frontier distribution. As shown in Table A4 in Appendix G, the existence of a significant frontier effect at the 25, 50 and 75 percentiles of the distribution of distance to the frontier indicates that the effect of the frontier of Granada on land inequality has persisted over time right through to the present day.

19
In Section 3, we argued in favor of defining the frontier as it was in 1481, before the beginning of
the Granada war and the conquest of Granada itself. We thus ensure that the control group, to which
the Castilian part of Andalusia (forming the treatment group) is compared, does not contain
municipalities that have ever been treated (i.e., exposed to the frontier treatment at some point in
time). Nevertheless, Appendix I checks for the robustness of our baseline results to 1) controlling for
those municipalities that were subjected to treatment for a shorter period, i.e., those conquered
during the fourteenth and fifteenth century, respectively, 2) including the duration of the frontier
treatment, and 3) redefining the frontier circa 1300 and circa 1400. It is remarkable that none of
these sensitivity checks alters our baseline findings. Interestingly, the coefficient on the duration
variable (which measures whether the duration of the frontier treatment changes the impact on the
outcomes) is statistically insignificant. This indicates that what matters is to have ever been part of
the Castilian side of Andalusia, rather than the years under the frontier treatment.
Appendix J provides further robustness checks, such as the use of distance to Seville as an
alternative forcing variable and of alternative bandwidths of 40 and 60 kilometers, controlling for
municipality size and transportation costs measured through distance to roads in the eighteenth
century and distance to the capital city of the respective province, as well as removing the
westernmost segment that covers the area near the Gibraltar Strait which exhibited high instability
(particularly during the second half of the thirteenth century due to Beni Merin incursions). It is
worth noting that they all corroborate our baseline findings.
Another potential concern with the findings presented so far is that rather than capturing a genuine
effect of the frontier of Granada, they might only reflect structural differences in the northwest-
southeast dimension. To dismiss this possibility, we apply a falsification test that consists in moving
the frontier 50 kilometers northwestward, that is, inland. In this way, we again divide Andalusia into
two parts, but this time with a spurious frontier. We then check whether the new “frontier” has any
effect on the dependent variables. The results provided in Appendix K show that this placebo
frontier does not generate statistically significant differences between municipalities located on both
sides of the frontier.30
30 Appendix K also contains a map with the location of this spurious frontier. In addition, we show that very similar results are obtained when moving the frontier 50 kilometers northward.
20
To further examine the possibility that our results might simply be due to chance, we conduct a
more systematic falsification test consisting in drawing 1,000 random placebo borders.31 Then we
run our baseline RD specifications with these placebo frontiers and compare the coefficients
obtained from this exercise with the “true” coefficients reported in Panels B, C and D of Table 3. As
suggested by Abadie, Diamond and Hainmueller (2015), placebo studies constitute an alternative
way to analyze the significance of the results. Applied to our case study, the confidence in our
findings about the effect of the frontier would be undermined if we frequently find effects of similar
or greater magnitudes using placebo borders. Appendix L provides a figure plotting the cumulative
distributions of coefficients from this placebo exercise for the specifications with a polynomial in
the geographic coordinates, distance to frontier and distance to Madrid. The vertical lines indicate
the value of the Castilian dummy in our baseline RD estimations. In all cases but two the “true”
effect is higher than the 95% of the placebo effects. Taking the average of the 15 distributions, the
likelihood of obtaining an estimate greater than or equal to the one obtained for the real frontier is
lower than 5%. This makes us confident that our findings are not due to chance, but to the distinct
influence that the frontier of Granada has exerted on political and economic inequality in Andalusia.
5.5 Discussion
The evidence suggests that the frontier of Granada led to a high concentration of economic and
political power on the Castilian side, and that this effect has persisted down to the present day.
Another possible interpretation of our findings could be that the Muslim Kingdom of Granada was
particularly egalitarian, and that the social structure of this region endured over time, thus failing to
converge with the remainder of Andalusia and Castile. However, this interpretation does not match
the historical facts and empirical evidence. The social order in the Nasrid Kingdom of Granada was
no more equal than in other Muslim kingdoms in al-Andalus prior to their conquest. According to
Lévi-Provençal (1932) and Brenan (1950), the greater part of the land in eleventh and twelfth-
century al-Andalus belonged either to the state or to small peasant farmers. State lands normally had
the best soil, and were cultivated by serfs who handed over two-thirds of their crop to the state, with
private settlers having to deliver an even higher proportion. According to Brenan (1950, p. 127), in
31 More specifically, we draw frontiers between latitudes 37°N and 38°N. For each centesimal fraction of a longitude degree we generate a latitude coordinate following a random walk process. Municipalities are then assigned to the placebo treatment group if their centroids are to the north of the randomly drawn frontier. Given the novelty of this falsification exercise, Appendix L provides the details about how we operationalize it.
21
al-Andalus “nothing was permitted to infringe upon the powers of the central government.”32 This
was indeed the case with the Sultan of the Nasrid Kingdom of Granada, who had absolute power
over his subjects. This power was reflected in a complex tax system fully controlled by the state that
taxed heavily the Nasrid population (Arié, 1992; Viguera Molins, 1995; Molina-López, 2002).33 In
order to control tax collection, the Nasrid territory was divided into large jurisdictional areas (that
were considered as administrative and fiscal units) in which state agents operated. The local powers
controlling these units were not autonomous and depended entirely on the Sultan (Ladero Quesada,
1989). Not surprisingly, the maximum beneficiary of the Nasrid tributary system was the Sultan and
his family, whose personal wealth in terms of land, fortresses and palaces was very high (Viguera
Molins, 2000; Molina-López, 2002).34
Importantly, the Reconquista changed the kind of society and power relations encountered by the
Kingdom of Castile upon the conquest of Granada. This was particularly the case after the forced
conversion of the Muslim population in 1501, by which the Capitulations of Granada were
unilaterally declared to be null. Conversion not only brought about the suppression of the legal,
fiscal and religious status of the Muslim population, but also the replacement of their political
institutions by the legal-administrative order of the rest of Castile (Pérez Boyero, 2002). The new
fiscal system simplified the Nasrid system and was based on the diezmo and alcabala, which were
levied mainly on the Morisco population.35 In addition, the Catholic Monarchs implemented a policy
of fragmenting the former Nasrid jurisdictions, some of which were granted as lordships to nobles.
According to Pérez Boyero (2002), this served as an instrument for breaking the sociopolitical
organization of the Muslim population, which ensured their control. The Crown articulated the
social organization and power relations around major urban centers in which the feudal legal-
administrative apparatus prevalent in the rest of Castile was implanted. The main positions in the
town councils (regidores and jurados) were elected directly by the Crown among the influential
groups, eventually becoming part of the elites’ patrimony. The exploitation of the Morisco
population and its general rejection by the old Christians resulted in a great revolt and the final
expulsion of about 100,000 Moriscos in 1570. With this event, economic equilibrium and fiscal
32 This accords with Blaydes and Chaney (2013), who provide evidence of the high concentration of power in the hands of Muslim sultans during the Middle Ages. 33 According to Trillo San José (2002), religion was considered the key element of social cohesion and obedience to the central power, whose clear manifestation was the payment of taxes. 34 According to Arié (1992), vast large estates in the hands of the Sultan were located in the most fertile part of the Granada’s plain. 35 Under the new feudal structure, the surplus would be appropriated by the lordships, whereas in the tributary society of Nasrid Granada it would be appropriated by the state (Trillo San José, 2002).

22
sufficiency in the former Kingdom of Granada came to a halt (Galán-Sánchez, 2012). The intensive
agrarian system based on irrigated arboriculture and horticulture was fully replaced by the Castilian
model of extensive agriculture based on cereal crops and cattle (Caro Baroja, 1957).
In sum, all these events show that the Nasrid socioeconomic and political apparatus was fully
dismantled at the expense of a feudal structure controlled by the urban oligarchies and landowning
nobility, who would progressively become the main social and political players of the newly
conquered territory. However, a key difference in this case is that the new territory was not a frontier
region (the frontier ceased to exist), and the dynamics affecting a frontier region did not therefore
apply to it. Consequently, despite eventually converging to the Castilian feudal socioeconomic and
political structure, society did not evolve toward such high levels of inequality, as in the case of the
other part of Andalusia. It then becomes apparent that the existence of a frontier played a key role in
generating such high levels of political and economic inequality on the Castilian side. In this regard,
it is important to note that it was the frontier region of Andalusia that recorded particularly high
levels of inequality relative to the rest of Castile, and not that the Kingdom of Granada was
particularly egalitarian. The 1787 census indicates that the Castilian part of Andalusia had the
highest percentage in Spain of landless workers in terms of overall agricultural population (87.4%),
much higher than the Castilian average (51%), while the former Kingdom of Granada also had a
relatively high percentage (72%).
6 Spatial RDD Using Microdata
We next complement the above results obtained for measures of land concentration at municipal
level with an analysis conducted with microdata from the 1982 agricultural census, which provides
us with almost 129,000 observations of agricultural holdings located within 25 kilometers of the
frontier. The two variables used are the size of the respective landholding measured by its UAA, and
a dummy variable indicating whether the agricultural holding is greater than or equal to 200 hectares
in terms of UAA. In both cases, we consider only private agricultural holdings (owned by private
individuals or legal entities). In order to compare the two sides of the frontier (using microdata) in a
meaningful way, individual observations are weighted by the total size of the holding given by its
total surface area. Therefore, in those specifications that use as dependent variable the large estate
dummy, the coefficient on the Castilian dummy represents the difference in the percentage of
agricultural area belonging to large estates on each side of the border. In other words, it indicates the
difference in the probability of being part of a large estate for a randomly selected hectare of land.
Note that what matters is not the number of large estates in absolute terms, but the area occupied by

23
large estates.36 A similar reasoning applies when the dependent variable is a holding’s utilized
agricultural area. In this case, the coefficient on the Castilian dummy represents the expected
difference in landholding size for a randomly selected hectare of land.
Table 5 presents the results for quadratic polynomials in latitude and longitude, as well as in
distance to the frontier and to Madrid. Columns 1 and 2 control for boundary fixed effects. Columns
3 and 4 incorporate a set of individual controls that includes the variable “company”, indicating
whether the holding is managed by a legal entity rather than by a private individual, “the ratio of
utilized agricultural area to total surface area” as an indirect measure of land quality –since it
represents the percentage of the landholding area that is usable–, “pastureland” reflecting whether
the holding has no arable land, and a set of dummies indicating the type of tenure system at micro
level. To this set of individual controls, columns 5 and 6 incorporate the set of municipality-level
geographic and climatic controls, and columns 7 and 8 also add the measures of pre-Christian land
uses in al-Andalus. Standard errors are clustered at municipal level. As shown in Table 5, the
coefficients on both utilized agricultural area and the large estate dummy are positive and highly
significant across different specifications. Taking the coefficients in Panel B, columns 7 and 8, we
find that the Castilian part of Andalusia has landholdings that are 148.4 ha bigger and 11% more
surface area in large estates than the former Kingdom of Granada. This again supports a higher
concentration of land on the Castilian side of the frontier.
[Insert Table 5 about here]
7. The Effect of the Frontier on Contemporary Outcomes
The general thrust of Acemoglu and Robinson’s work is that political and economic inequality is
harmful to development. Given the above results regarding the persistent effect that the presence of
a stable frontier between Castile and the former Kingdom of Granada had on inequality, this
constitutes an opportunity for testing the empirical validity of Acemoglu and Robinson’s hypothesis
within the context of the frontier of Granada. The line of argument is that the frontier of Granada
created a high level of inequality, which persisted over time, thus inhibiting long-term development.
This is operationalized empirically via a two-stage least squares (2SLS) analysis. In a first stage, we
try to explain historical inequality on the basis of the frontier dummy as follows:
36 See Appendix M for an example illustrating this, and the results of the RDD without weighting by the total size of the holding, which appear to confirm the existence of a statistically significant frontier effect.

24
iiii XAndalusiaCastilianinequalityhistorical εβγγ ++⋅+= '10 __ (3)
where iinequalityhistorical _ is our preferred proxy for historical inequality given by the percentage
of landless workers in the eighteenth century,37 iAndalusiaCastilian_ and iX are as described in
Equation 1. In a second stage, several current development outcomes are regressed on the predicted
value of historical inequality and the set of exogenous controls, such that:
iiii Xinequalityhistoricaloutcomescurrent νϕδδ ++⋅+= '10 __ (4)
where ioutcomescurrent _ represent several contemporary outcomes linked to economic
development such as a municipality’s average socieconomic condition, the ratio of cars to
population, the education level of the population between 30 and 39 years, the percentage of labor
force employed in industry and services, and long-term population growth over the 1950-2010
period. In addition, we employ two measures of current political power concentration: the number of
changes in the political party at the local government level affecting the election of the mayor, and
the number of political parties that have controlled the town council since 1979 (with a higher value
implying greater political competition and alternation). We also use the level of local public debt
with financial entities per capita in 2008, with a lower value indicating a more responsible fiscal
management and in turn higher institutional quality. Finally, we use the number of immigrants per
1,000 inhabitants. According to the theoretical setting of regional development in Gennaioli et al.
(2013, 2014), more dynamic and prosperous regions tend to receive more immigrants and only the
most skilled workers choose to migrate.38
At this point, it is important to mention that the purpose of this analysis is only to determine whether
historically rooted inequality has had an adverse effect on current development outcomes. However,
it is not our intention to show that the frontier of Granada is uncorrelated with any determinants of
current development, other than historical inequality. In other words, we acknowledge that the
exclusion restriction that, –conditional on the exogenous control set– the frontier of Granada affects
current development only through its impact on political and economic inequality, is likely to be
violated. In statistical terms, 0),_( ≠ii vAndalusiaCastiliancorr . Therefore, the evidence in this
section can be thought of as correlational, but not causal. Indeed, there could be other channels
37 Note that similar results follow when we measure the extent of inequality through the percentage of UAA in holdings with 200 hectares or more in 1982. The results appear in Table A20 in Appendix N. We prefer to leave in the main text the results obtained with historical inequality, since the exclusion restriction is likely to be violated to a greater extent for current measures of inequality. 38 For our municipalities sample, there is indeed a highly statistically significant and positive correlation between the immigration rate and the other outcome variables related to development.

25
through which the existence of the frontier may have affected current outcomes. They include the
level of trust and social capital that could result from living in frontier areas usually subjected to war
and incursions. Frontier warfare could also affect the preservation of agricultural technologies and
irrigation infrastructure, and it is possible that on the Castilian side they were more severely
destroyed. Since there are no historical data at municipal level to account for all these potential
channels, we focus on the inequality channel, but bearing in mind that the frontier of Granada is
likely to affect contemporary development outcomes also through other channels.
The 2SLS analysis, reported in Table 6 for the nine contemporary development outcomes
considered, provides clear-cut evidence that in the first stage the frontier treatment increases
historical inequality on the Castilian side, as measured by the percentage of landless workers in
1787. In the second stage, the part of historical inequality that is due to the frontier has a highly
significant negative effect on contemporary economic development (as measured by average
socioeconomic condition, cars per capita, education level of the population between 30 and 39 years,
percentage of employment in industry and services, long-term population growth and the
immigration rate) and on our measures of political competition, as well as a positive effect on local
public debt per capita, which indicates lower institutional quality. It is worth noting that the first
stage appears strong across the different specifications of the polynomials in geographic location,39
whereas the second stage’s key coefficient appears highly significant for the specifications with no
polynomial and those with single-dimensional polynomials in distance either to the frontier or to
Madrid.
To have an idea of the magnitudes of the effect, the bottom row of Table 6 provides the average
value of each outcome variable. For instance, column 4 of Panel C indicates that a 1% rise in the
part of the percentage of landless workers that is due to the frontier is associated with a 0.65%
decline in the share of employment in industry and services. In addition, column 9 indicates that a
1% increase in the part of historical inequality that is due to the frontier is associated with a 0.84%
fall in the average immigration rate over the 1988-2014 period. Economically relevant effects are
also found for the other contemporary outcomes.40 Thus, we can conclude that there is evidence
39 The first-stage F-statistic generally exceeds the “rule-of-thumb” value of 10 (Staiger and Stock, 1997), which in a pure instrumental variables framework would indicate the absence of a weak-instrument problem. 40
Table A21 in Appendix N contains the results from a 2SLS exercise in which the frontier dummy is used to predict historical inequality in the first stage, and then current inequality measures are regressed on the predicted value of historical inequality, in both stages controlling for the baseline control set. As expected, there is correlational evidence to support the existence of an adverse effect of the frontier on historical inequality, which has persisted over time right through to the twentieth century. Appendix N also contains Table A22 that presents the estimates of the reduced-form
26
favoring the empirical validity of Acemoglu and Robinson’s hypothesis that structural inequality
caused by arguably exogenous events (in our case the presence of a frontier) inhibits long-term
development.
[Insert Table 6 about here]
8. Conclusions
This paper has explored the political economy that leads frontier regions to be unequal. We establish
the hypothesis that, in the presence of a military threat, frontiers must be defended and this fact
biases the political equilibrium in favor of the military elite, which ends up accumulating an
enormous amount of economic and political power. We empirically test this hypothesis by
exploiting the existence of a frontier between Castile and the Nasrid Kingdom of Granada in the late
Middle Ages. Through the application of a border specification and a spatial RDD, we find that
municipalities on the Castilian side have a significantly higher percentage of landless workers, a
greater accumulation of wealth, and more jurisdictional rights among the privileged orders, as
measured in the eighteenth century. These findings support the argument that the dynamics of being
an insecure frontier region created the conditions on the Castilian side for a high concentration of
power. We use current indicators of land inequality and development to show that the effect of the
frontier of Granada persists even today.
These results are robust to controlling for a large number of observable characteristics, employing a
border specification or a semiparametric spatial RDD, and using microdata for a sample of almost
129,000 holdings. The results are also robust to a series of falsification tests checking for differences
in climatic, geographic, and pre-existing conditions across the two sides of the frontier as well as to
a series of falsification tests consisting in either drawing 1,000 random placebo borders or moving
the true frontier northwestward and northward.
The hypothesis introduced in this paper is consistent with the “conditional frontier thesis” proposed
by García-Jimeno and Robinson (2011), since the negative consequences of the frontier were due to
a political equilibrium characterized by a high concentration of political power in the hands of the
privileged orders (particularly the nobility). As documented above, the fact it was an insecure
frontier region led to a balance of power that clearly favored the nobles’ interests. The consequences
of the frontier decisively affected the repopulation and social organization of the Castilian part of
Andalusia and, in this way, the future of this Spanish region. In conclusion, this article has
effect of the frontier of Granada on contemporary development outcomes. Again, the evidence indicates that the existence of the frontier exerts a statistically significant negative effect on current outcomes.

27
contributed to the still very scarce and novel literature on the political-economic effects of historical
frontiers. It has also contributed to the vibrant literature that seeks to explain the development paths
of societies on the basis of historical events occurring in the distant past, as well as to answer the
question of why Andalusia has suffered such a high level of inequality throughout its modern
history.
References
Abadie, Alberto, Alexis Diamond, and Jens Hainmueller (2015). “Comparative Politics and the Synthetic Control Method.” American Journal of Political Science, 59 (2), 495–510.
Acemoglu, Daron, Maria Angelica Bautista, Pablo Querubin, and James A. Robinson (2008). “Economic and Political Inequality in Development: The Case of Cundinamarca, Colombia.” In Institutions and Economic Performance, edited by Elhanan Helpman, Harvard University Press, Cambridge, MA.
Acemoglu, Daron, Simon Johnson, and James A. Robinson (2001). “The Colonial Origins of Comparative Development: An Empirical Investigation.” American Economic Review, 91 (5), 1369–401.
Acemoglu, Daron, and James A. Robinson. (2006). “De Facto Political Power and Institutional Persistence.” American Economic Review, 96 (2), 325-330.
Acemoglu, Daron, and James A. Robinson. (2010). “The Role of Institutions in Growth and Development.” Review of Economics and Institutions, 1 (2), 1-33.
Acemoglu, Daron, and James A. Robinson. (2012). Why Nations Fail. Crown Publishers, New York.
Acemoglu, Daron, and Alexander Wolitzky. (2011). “The Economics of Labor Coercion.” Econometrica, 79(2), 555–600.
Angrist, Joshua D., and Jörn-Steffen Pischke (2009). Mostly Harmless Econometrics: An Empiricist’s Companion. Princeton University Press, Princeton.
Arié, Rachel. 1992. El Reino Nasrí de Granada (1232-1492). Editorial MAPFRE S.A., Madrid.
Artola, Miguel, Antonio M. Bernal and Jaime Contreras (1978). El Latifundio. Propiedad y Explotación ss. XVIII-XX. Servicio de Publicaciones Agrarias, Madrid.
Bai, Ying, and James Kai-sing Kung (2011). “Climate Shocks and Sino-nomadic Conflict.” Review of Economics and Statistics, 93 (3), 970-981.
Bai, Ying, and James Kai-sing Kung (2015). “Diffusing Knowledge while Spreading God’s Message: Protestantism and Economic Prosperity in China, 1840-1920.” Journal of European Economic Association, 13 (4), 669–698.

28
Banerjee, Abhijit, and Lakshmi Iyer (2005). “History, Institutions, and Economic Performance: The Legacy of Colonial Land Tenure Systems in India.” American Economic Review, 95, 1190-1213.
Becker, Sascha O., Katrin Boeckh, Christa Hainz and Ludger Woessmann (2015). “The Empire Is Dead, Long Live the Empire! Long-Run Persistence of Trust and Corruption in the Bureaucracy.” Economic Journal, forthcoming.
Becker, Sascha O., and Ludger Woessmann (2009). “Was Weber Wrong? A Human Capital Theory of Protestant Economic History.” Quarterly Journal of Economics, 124 (2), 531-596.
Blaydes Lisa, and Eric Chaney (2013). “The Feudal Revolution and Europe’s Rise: Political Divergence of the Christian West and the Muslim World before 1500 CE.” American Political Science Review, 107(1), 16-34.
Brenan, Geral (1950). The Spanish Labyrinth: An Account of the Social and Political Background of the Spanish Civil War. Cambridge University Press, Cambridge.
Brenner, Robert (1976). “Agrarian Class Structure and Economic Development in Pre-Industrial Europe.” Past and Present, 70, 30-75.
Brenner, Robert (1982). “The Agrarian Roots of European Capitalism”, Past and Present, 97, 16-113.
Bruhn, Miriam, and Francisco A. Gallego (2012). “Good, Bad, and Ugly Colonial Activities: Do They Matter for Economic Development?” Review of Economics and Statistics, 94 (2), 433-461.
Burns, Robert I. (1976). Medieval Colonialism: Postcrusade Exploitation of Islamic Valencia. Princeton University Press, Princeton.
Cabrera Muñoz, Emilio (1989). “The Medieval Origins of the Great Landed Estates of the Guadalquivir Valley.” Economic History Review, 42 (4), 465-483.
Cabrera Muñoz, Emilio (2006). “Feudalismo y Señoríos en Andalucía (Siglos XIII al XV).” In Historia de Andalucía IV: El Nacimiento de Andalucía, edited by Manuel González Jiménez, Planeta Editorial, Barcelona, pp. 106-134.
Cantoni, Davide (2015). “The Economic Effects of the Protestant Reformation: Testing the Weber Hypothesis in the German Lands.” Journal of the European Economic Association, 13 (4), 561–598.
Caro Baroja, Julio (1957). Los Moriscos del Reino de Granada. Institutos de Estudios Políticos, Madrid.
Caro Baroja, Julio (1966). “La Despoblación de los Campos.” Revista de Occidente, 40, 19-36.
Carrión, Pascual (1975). Los Latifundios en España. Su importancia, Origen. Consecuencias y Solución. Ariel, Barcelona.

29
Chaney Eric (2013) “Revolt on the Nile: Economic Shocks, Religion and Political Power.” Econometrica, 81(5), 2033-2053.
Chaney, Eric, and Richard Hornbeck (2015). “Economic Dynamics in the Malthusian Era: Evidence from the 1609 Spanish Expulsion of the Moriscos”. Economic Journal, forthcoming.
Conley, Timothy (1999). “GMM Estimation with Cross Sectional Dependence.” Journal of Econometrics, 92, 1-45.
Dell, Melissa (2010). “The Persistent Effects of Peru’s Mining Mita.” Econometrica, 78 (6), 1863-1903.
Dell, Melissa, Nathan Lane, and Pablo Querubín (2015). “State Capacity, Local Governance, and Economic Development in Vietnam.” Harvard University Working Paper.
Dewald, Jonathan (2004). Europe 1450 to 1789: Encyclopedia of the Early Modern World. Charles Scribner's Sons, New York.
Engerman, Stanley L., and Kenneth L. Sokoloff (1997). “Factor Endowments, Institutions, and Differential Paths of Growth among New World Economies.” In How Latin America Fell Behind, edited by Stephen Haber, Stanford University Press, Stanford, CA, pp. 260–304.
Fenske, James (2012). “Land Abundance and Economic Institutions: Egba Land and Slavery, 1830–1914.” The Economic History Review, 65 (2), 527-555.
Fenske, James (2013). “Does Land Abundance Explain African Institutions?” Economic Journal, 123 (573), 1363-1390.
Fenske, James (2014). “Ecology, Trade and States in Precolonial Africa.” Journal of European Economic Association, 12 (3), 612-640.
Forey, Alan J. (1984). “The Military Orders and the Spanish Reconquest in the Twelfth and Thirteenth Centuries.” Traditio, 40, 197-234.
Galán Sánchez, Ángel (2012). “Poder y Fiscalidad en el Reino de Granada Tras la Conquista: Algunas Reflexiones.” Studia historica. Historia Medieval. 30, 67-98.
Gallego, Francisco A. (2010). “Historical origins of schooling: The role of democracy and political decentralization.” Review of Economics and Statistics, 92 (2), 228-243.
García-Jimeno, Camilo, and James A. Robinson (2011). “The Myth of the Frontier.” In Understanding Long-Run Economic Growth, edited by Dora L. Costa and Naomi R. Lamoreaux, University of Chicago Press, Chicago, pp. 49-88.
Gelman, Andrew, and Imbens, Guido. (2014). “Why High-order Polynomials Should Not Be Used in Regression Discontinuity Designs.” NBER Working Paper 20405. National Bureau of Economic Research, Cambridge, Massachusetts.
Gennaioli, Nicola, and Ilia Rainer. (2007). “The Modern Impact of Precolonial Centralization in Africa.” Journal of Economic Growth, 12 (3), 185-234.

30
Gennaioli, Nicola, Rafael La Porta, Florencio López de Silanes, and Andrei Shleifer. (2013). “Human Capital and Regional Development.” Quarterly Journal of Economics, 128 (1), 105-164.
Gennaioli, Nicola, Rafael La Porta, Florencio López de Silanes, and Andrei Shleifer. (2014). “Growth in Regions.” Journal of Economic Growth, 19, 259-309.
Gerhard, Dietrich (1959). “The Frontier in Comparative View.” Comparative Studies in Society and History, 1 (3), 205-229.
González Jiménez, Manuel (1981a). “La Repoblación de Andalucía en el Siglo XIII”, In Historia de Andalucía II. La Andalucía Dividida (1013-1350): Orígenes de la Andalucía Cristiana, edited by José Enrique López de Castañer and Manuel González Jiménez, Editorial Planeta, Barcelona, Chapter 2, pp. 129-150.
González Jiménez, Manuel (1981b). “La Repoblación en el Siglo XIV”, In Historia de Andalucía II. La Andalucía Dividida (1013-1350): Orígenes de la Andalucía Cristiana, edited by José Enrique López de Castañer and Manuel González Jiménez, Editorial Planeta, Barcelona. Chapter 4, 183-200.
González Jiménez, Manuel (1989). “Frontier and Settlement in the Kingdom of Castile (1085-1350).” In Medieval Frontier Societies, edited by Robert Bartlett and Angus MacKay, Clarendon Press, Oxford, pp. 49-74.
González Jiménez, Manuel (2006). “La Conquista y Formación de Andalucía.” In Historia de Andalucía IV: El Nacimiento de Andalucía, edited by Manuel González Jiménez, Chapter 1.1, Ediciones Planeta, Barcelona, pp. 12-47.
Grosjean, Pauline (2011a). “The Institutional Legacy of the Ottoman Empire: Islamic Rule and Financial Development in South Eastern Europe.” Journal of Comparative Economics, 39(1), 1-16.
Grosjean, Pauline (2011b). “The Weight of History on European Cultural Integration: A Gravity Approach.” American Economic Review, 101(3), 504–508.
Hennessy, C. Alistair M. (1978). The Frontier in Latin American History. Edward Arnold, London.
Iyer, Lakshmi (2010). “Direct versus Indirect Colonial Rule in India: Long-term Consequences.” Review of Economics and Statistics, 92 (4), 693-713.
Jovellanos, Gaspar M. de (1795). Escritos Económicos -Gaspar Melchor de Jovellanos. Informe sobre la Ley Agraria. Real Academia de Ciencias Morales y Políticas, Madrid, D.L. 2000.
Ladero Quesada, M. Ángel (1989). Granada, Historia de un País Islámico (1232-1571), Editorial Gredos, Madrid.
Le Roy Ladurie, Emmanuel (1977). The Peasants of Languedoc. University of Illinois Press.
Lévi-Provençal, Evariste (1932). L'Espagne Musulmane au Xiéme Siécle. Institutions et Vie Sociale, Paris.

31
Malefakis, Edward (1970). Agrarian Reform and Peasant Revolution in Spain. Origins of the Civil War. Yale University Press, New Haven.
Mestre-Campi, Jesús, and Flocel Sabaté (1998). Atlas de la Reconquista. La Frontera Peninsular entre los Siglos VIII y XV. Ediciones Península, Barcelona.
Molina López, Emilio (2002). “El Reino Nazarí: La Dinámica Política y Los Fundamentos del Poder.” In Historia del Reino de Granada, Tomo I: De los Orígenes a la Época Mudéjar (hasta 1502), edited by Rafael G. Peinado Santaella. Editorial Universidad de Granada, Granada, pp. 211-248.
Nadal, Jordi (1975). El Fracaso de la Revolución Industrial en España, 1814-1913. Ariel, Barcelona.
Nadal, J., Carreras, A., and Sudriá, C. (1987). La Economía Española del Siglo XX. Una Perspectiva Histórica. Barcelona, Ariel.
Olavide, Pablo de (1768). “Informe sobre la Ley Agraria.” In La Reforma Agraria en Andalucía: el Primer Proyecto Legislativo, edited by Antonio Merchán, Universidad de Sevilla, Sevilla. 1996.
Ortega López, Margarita (1986). La Lucha por la Tierra en la Corona de Castilla al Final del Antiguo Régimen. El Expediente de Ley Agraria. Centro de Publicaciones de la Secretaría General Técnica del Ministerio de Agricultura, Pesca y Alimentación, Madrid.
Oto-Peralías, Daniel, Diego Romero-Ávila (2014a).“The Distribution of Legal Traditions around the World: A Contribution to the Legal Origins Theory.” Journal of Law and Economics, 57 (3), 561-628.
Oto-Peralías, Daniel, Diego Romero-Ávila (2014b). “The Economic Consequences of the Spanish Reconquest: The Long-term Effects of Medieval Conquest and Colonization”. Working Paper, Pablo de Olavide University.
Pérez Boyero, Enrique (2002). “La Época Mudéjar: Los Señoríos y el Mundo Rural.” In Historia del Reino de Granada, Tomo I: De los Orígenes a la Época Mudéjar (hasta 1502), edited by Rafael G. Peinado Santaella. Editorial Universidad de Granada, Granada, pp. 567-610.
Postan, Michael M. (1973). “Economic Relations between Eastern and Western Europe.” In Medieval Trade and Finance, edited by Michael M. Postan. Cambridge University Press, Cambridge, pp. 305-334.
Rodríguez Molina, José (2000). “Convivencia de Musulmanes y Cristianos en la Frontera de Granada.” In La Paz en la Historia, Instituto de la Paz y los Conflictos, Granada, pp. 203-205.
Ruiz-Maya, Luis (1979). “Sobre el Origen Histórico de la Concentración de la Tierra: una Aproximación Estadística.” Agricultura y Sociedad, 10, 9-103.
Staiger, Douglas, and James H. Stock (1997). “Instrumental Variables Regression with Weak Instruments.” Econometrica, 65, 557–86.

32
Trillo San José, Carmen. (2002). “El Reino Nazarí: Las Actividades Económicas y las Estructuras Sociales.” In Historia del Reino de Granada, Tomo I: De los Orígenes a la Época Mudéjar (hasta 1502), edited by Rafael G. Peinado Santaella. Editorial Universidad de Granada, Granada, pp. 292-347.
Truxillo, Charles A. (2001). By the Sword and the Cross: The Historical Evolution of the Catholic World Monarchy in Spain and the New World, 1492-1825. Greenwood Press, London.
Turner, Frederick Jackson (1920). The Frontier in American History. H. Holt and Co., New York.
Tusell, Javier (1976). Oligarquía y Caciquismo en Andalucía (1890-1923). Planeta, Barcelona.
Vicens Vives, Jaime (1969). An Economic History of Spain. Princeton University Press, Princeton.
Viguera Molins, M. Jesús. (1995). De las Taifas al Reino de Granada: Al-Andalus, Siglos XI-XV. Temas de Hoy, Madrid.
Viguera Molins, M. Jesús (2000). “El Soberano, Visires y Secretarios.” In El Reino Nazarí de Granada (1232-1492). Vol. 3: Política. Instituciones. Espacio y Economía, edited by José M. Jover Zamora. Espasa, Madrid, pp. 320-355.

33
TABLES AND FIGURES
Cas
tilia
n pa
rt o
f A
ndal
usia
Form
er
Kin
gdom
of
Gra
nada
Cas
tilia
n pa
rt o
f A
ndal
usia
Form
er
Kin
gdom
of
Gra
nada
Cas
tilia
n pa
rt o
f A
ndal
usia
Form
er
Kin
gdom
of
Gra
nada
(1)
(2)
(3)
(4)
(5)
(6)
(7)
(8)
(9)
Pan
el A
: La
nd a
nd p
olit
ical
pow
er c
once
ntra
tion
in
the
18th
cen
tury
75.5
7568
.925
6.65
**78
.648
71.1
737.
474*
*80
.142
71.3
278.
815*
*40
334
8(3
.241
)17
221
0(3
.621
)87
115
(3.9
17)
1558
.268
674.
068
884.
2**
1639
.222
876.
943
762.
279*
1643
.889
724.
937
918.
952
309
319
(415
.857
)11
719
7(4
44.8
46)
5110
5(5
84.1
86)
0.65
10.
425
0.22
7***
0.73
30.
419
0.31
4***
0.72
20.
415
0.30
7***
413
358
(0.0
85)
176
215
(0.1
04)
9011
8(0
.103
)
Pan
el B
: L
and
conc
entr
atio
n in
198
2
23.0
76.
297
16.7
73**
*19
.183
8.84
210
.341
**19
.299
10.2
519.
049*
*41
235
7(2
.746
)17
621
5(4
.338
)90
118
(4.3
25)
70.7
7359
.491
11.2
82**
*68
.655
62.0
276.
628*
**67
.064
62.2
534.
811*
*41
235
7(1
.567
)17
621
5(1
.794
)90
118
(2.1
15)
Not
es:
Var
iabl
esde
scri
ptio
nsar
epr
ovid
edin
Tab
leA
1.T
henu
mbe
rof
obse
rvat
ions
isin
itali
cs.
Stan
dard
erro
rsco
rrec
ted
for
spat
ial
depe
nden
ce a
re in
par
enth
eses
. *, *
* an
d **
* de
note
sta
tistic
al s
igni
fica
nce
at th
e 10
, 5 a
nd 1
% le
vel,
resp
ectiv
ely.
TA
BLE
1. T
HE
FR
ON
TIE
R O
F G
RA
NA
DA
: AN
ALY
SIS
OF
ME
AN
DIF
FER
EN
CE
S
Land
con
cent
ratio
n in
hol
ding
s ≥
200
ha
Mea
n va
lues
Mea
n va
lues
Who
le s
ampl
e
Mea
n va
lues
With
in 2
5 km
of t
he F
ront
ier
With
in 5
0 km
of t
he F
ront
ier
Mea
n di
ffer
ence
Mea
n di
ffer
ence
Mea
n di
ffer
ence
Gin
i ind
ex o
f lan
d di
stri
butio
n
Perc
enta
ge o
f la
ndle
ss w
orke
rs
May
or H
acen
dado
/ su
rfac
e
Priv
ileg
ed O
rder
s ju
risd
ictio
n

34
Castilian part of Andalusia
Former Kingdom of Granada
Panel A: Differences in geography and climate
622.65 690.47 -67.819(92.691)
152.95 146.78 6.169(40.769)
43.35 49.80 -6.445(12.835)
0.03 0.04 -0.009(0.027)
783.81 780.28 3.533(112.022)
14.84 14.41 0.433(0.399)
0.53 0.52 0.017(0.039)
96.19 98.09 -1.895(2.714)
Panel B: Differences in soil quality
1.78 1.65 0.131(0.229)
76.30 80.95 -4.650(6.981)
81.45 86.66 -5.211(7.744)
49.04 46.60 2.440(8.837)
55.90 54.33 1.565(10.162)
23.63 28.07 -4.435(11.171)
Panel C: Differences in preexisting conditions
0.34 0.25 0.099(0.078)
51.21 46.02 5.196(6.959)
41.65 39.87 1.779(6.361)
7.33 4.51 2.818(4.509)
22.92 18.84 4.087(4.845)
1.66 4.13 -2.466(1.598)
16.69 20.78 -4.083(3.493)
Number of observations 90 118 208
Mean difference
Presence of Roman roads
Distance to urban centers in 1200
Mean values
Soil quality
Moderate or high erodibility (% surface area)
Low topsoil carbon (% surface area)
Fine soil texture (% surface area)
Arable land (% surface area)
TABLE 2. GEOGRAPHIC, CLIMATIC AND PREEXISTING DIFFERENCES ON BOTH SIDES OF THE FRONTIER
Notes : Variables descriptions are provided in Table A1. Sample restricted to municipalities within 25 km of the frontier.Standard errors corrected for spatial dependence are in parentheses. *, ** and *** denote statistical significance at the 10,5 and 1% level, respectively.
Forest (% surface area, in the 10th
-12th
centuries)
Pastureland (% surface area, in the 10th
-12th
centuries)Intensive agriculture and irrigation (% surface
area, in the 10th
-12th
centuries)Non-intensive agriculture (% surface area, in
the 10th
-12th
centuries)
Altitude
Ruggedness
Surface area with a steep slope (%)
Coast dummy
Rainfall
Temperature
Aridity
Mediterranean phytoclimate (%)
Crops (% surface area)
Distance to urban centers in 1400

35
Dependent variablePercentage of
landless workers
Mayor Hacendado/
surface
Privileged Orders
jurisdiction
Land concentration in holdings ≥ 200ha
Gini index of land
distribution
(1) (2) (3) (4) (5)
Panel A: OLS-Border specification
10.788 1025.383 0.258 9.707 4.598(2.888)*** (312.572)*** (0.071)*** (2.61)*** (1.533)***[2.744]*** [325.022]*** [0.106]** [2.376]*** [1.06]***
R2
0.26 0.37 0.22 0.29 0.21
Panel B: Quadratic polynomial in latitude and longitude
9.552 1035.264 0.061 12.149 4.719(3.36)*** (389.623)*** (0.11) (4.311)*** (2.185)**
[3.578]*** [250.194]*** [0.159] [3.751]*** [1.974]**
R2
0.31 0.42 0.29 0.35 0.25
Panel C: Quadratic polynomial in distance to the Frontier
10.523 1104.757 0.245 9.463 4.348(2.838)*** (320.537)*** (0.07)*** (2.666)*** (1.518)***[2.529]*** [345.112]*** [0.103]** [2.372]*** [0.986]***
R2
0.26 0.38 0.24 0.29 0.22
Panel D: Quadratic polynomial in distance to Madrid
15.119 1381.763 0.215 11.910 5.121(3.134)*** (353.718)*** (0.086)** (3.182)*** (1.819)***[2.607]*** [316.83]*** [0.16] [2.652]*** [1.149]***
R2
0.29 0.39 0.23 0.31 0.22
Boundary fixed effects Yes Yes Yes Yes YesGeog.-climatic controls Yes Yes Yes Yes YesNumber of observations 202 156 208 208 208
Notes: Variables descriptions are provided in Table A1. Sample restricted to municipalities within 25 km of thefrontier. The set of geographic-climatic controls includes altitude, ruggedness, soil quality, rainfall, temperatureand a coast dummy. Robust standard errors are in parentheses, and standard errors corrected for spatialdependence are in brackets. *, ** and *** denote statistical significance at the 10, 5 and 1% level, respectively.
TABLE 3. THE EFFECT OF THE FRONTIER OF GRANADA ON INEQUALITY: SPATIAL RDD
Castilian part of Andalusia
Castilian part of Andalusia
Land and political power concentration in
the 18th
centuryLand concentration in 1982
Castilian part of Andalusia
Castilian part of Andalusia

36
Dependent variablePercentage of
landless workers
Mayor Hacendado/
surface
Privileged Orders
jurisdiction
Land concentration in holdings ≥ 200ha
Gini index of land
distribution(1) (2) (3) (4) (5)
Panel A: Linear polynomial in latitude and longitude
9.148 1162.491 0.031 12.098 3.394(3.171)*** (497.23)** (0.1) (4.556)*** (2.003)*[3.455]*** [337.728]*** [0.137] [4.926]** [1.838]*
R2 0.29 0.39 0.26 0.3 0.22
Panel B: Linear polynomial in distance to the Frontier
10.540 1102.671 0.245 9.461 4.348(2.833)*** (321.643)*** (0.071)*** (2.661)*** (1.511)***[2.519]*** [347.081]*** [0.102]** [2.397]*** [0.973]***
R2 0.26 0.38 0.23 0.29 0.22
Panel C: Linear polynomial in distance to MadridCastilian part of Andalusia 13.310 1365.859 0.206 12.901 4.853
(3.048)*** (369.804)*** (0.083)** (3.37)*** (1.76)***[2.713]*** [286.887]*** [0.152] [3.152]*** [1.023]***
R2 0.27 0.39 0.23 0.3 0.21
Panel D: Cubic polynomial in latitude and longitude
9.441 1136.215 0.060 9.519 3.346(3.405)*** (391.143)*** (0.116) (4.26)** (2.207)[3.73]** [348.083]*** [0.227] [4.263]** [2.968]
R2 0.31 0.46 0.32 0.36 0.26
Panel E: Cubic polynomial in distance to the Frontier
10.571 1096.695 0.249 9.453 4.216(2.814)*** (319.741)*** (0.07)*** (2.679)*** (1.507)***[2.473]*** [346.411]*** [0.10]** [2.301]*** [0.956]***
R2 0.26 0.38 0.24 0.29 0.23
Panel F: Cubic polynomial in distance to Madrid
14.252 1398.948 0.243 9.882 4.433(2.987)*** (356.857)*** (0.087)*** (3.231)*** (1.844)**[2.464]*** [327.573]*** [0.162] [2.068]*** [1.065]***
R2 0.29 0.39 0.23 0.33 0.22
Boundary fixed effects Yes Yes Yes Yes YesGeog.-climatic controls Yes Yes Yes Yes YesNumber of observations 202 156 208 208 208
Notes : Variables descriptions are provided in Table A1. Sample restricted to municipalities within 25 km of the frontier.The set of geographic-climatic controls includes altitude, ruggedness, soil quality, rainfall, temperature and a coast dummy.Robust standard errors are in parentheses, and standard errors corrected for spatial dependence are in brackets. *, ** and*** denote statistical significance at the 10, 5 and 1% level, respectively.
Castilian part of Andalusia
Castilian part of Andalusia
TABLE 4. SPECIFICATION TESTS
Land and political power concentration in
the 18th
centuryLand concentration in 1982
Castilian part of Andalusia
Castilian part of Andalusia
Castilian part of Andalusia

37
Dependent variableUtilized
agricultural area
Large estate dummy (≥ 200
ha)
Utilized agricultural
area
Large estate dummy (≥ 200
ha)
Utilized agricultural
area
Large estate dummy (≥ 200
ha)
Utilized agricultural
area
Large estate dummy (≥ 200
ha)
(1) (2) (3) (4) (5) (6) (7) (8)
Panel A: OLS-Border specification
101.043*** 0.108*** 77.318*** 0.085*** 67.923*** 0.089*** 69.649*** 0.087***(31.94) (0.028) (24.411) (0.025) (17.071) (0.022) (16.741) (0.021)
R2
0.10 0.06 0.25 0.12 0.26 0.14 0.26 0.14
Panel B: Quadratic polynomial in latitude and longitude
208.231*** 0.167*** 164.703*** 0.131*** 151.829*** 0.114*** 148.358*** 0.114***(78.58) (0.052) (51.475) (0.043) (44.998) (0.034) (46.879) (0.034)
R2
0.16 0.09 0.28 0.15 0.31 0.16 0.32 0.16
Panel C: Quadratic polynomial in distance to the Frontier
90.842*** 0.098*** 69.048*** 0.077*** 65.03*** 0.087*** 67.297*** 0.085***(26.985) (0.025) (21.349) (0.023) (15.915) (0.02) (15.789) (0.019)
R2
0.11 0.08 0.26 0.13 0.26 0.14 0.27 0.15
Panel D: Quadratic polynomial in distance to Madrid
129.053*** 0.137*** 92.224*** 0.100*** 107.701*** 0.111*** 108.079*** 0.126***(38.655) (0.034) (28.83) (0.03) (23.963) (0.026) (25.107) (0.027)
R2
0.15 0.07 0.27 0.13 0.31 0.15 0.31 0.15
Boundary fixed effects Yes Yes Yes Yes Yes Yes Yes YesIndividual controls No No Yes Yes Yes Yes Yes YesGeog.-climatic controls No No No No Yes Yes Yes YesPreexisting land uses No No No No No No Yes YesNumber of clusters 203 203 203 203 203 203 203 203Number of observations 128,628 128,628 128,628 128,628 128,628 128,628 128,628 128,628
Castilian part of Andalusia
Castilian part of Andalusia
Notes: The units of observation are private agricultural holdings (with legal status of natural person or company). Individual controls are“company” (whether the holding is managed by a company rather than by a natural person), “utilized agricultural area over total surface area (%)”,“pastureland” (whether the holding does not have arable land), and a set of dummies indicating the type of tenure system. Variables descriptionsare provided in Table A1. Sample restricted to municipalities within 25 km of the frontier. Regressions are weighted by holdings’ total surfacearea. The specifications are estimated with a semiparametric RD approach. Robust standard errors clustered at the municipal level are inparentheses. *, ** and *** denote statistical significance at the 10, 5 and 1% level, respectively.
TABLE 5. SPATIAL REGRESSION DISCONTINUITY SPECIFICATIONS- MICRODATA FROM THE 1982 AGRICULTURAL CENSUS
Individual controls
Castilian part of Andalusia
Castilian part of Andalusia
Geog.-climatic controlsPreexisting land uses (10
th to
12th
centuries)
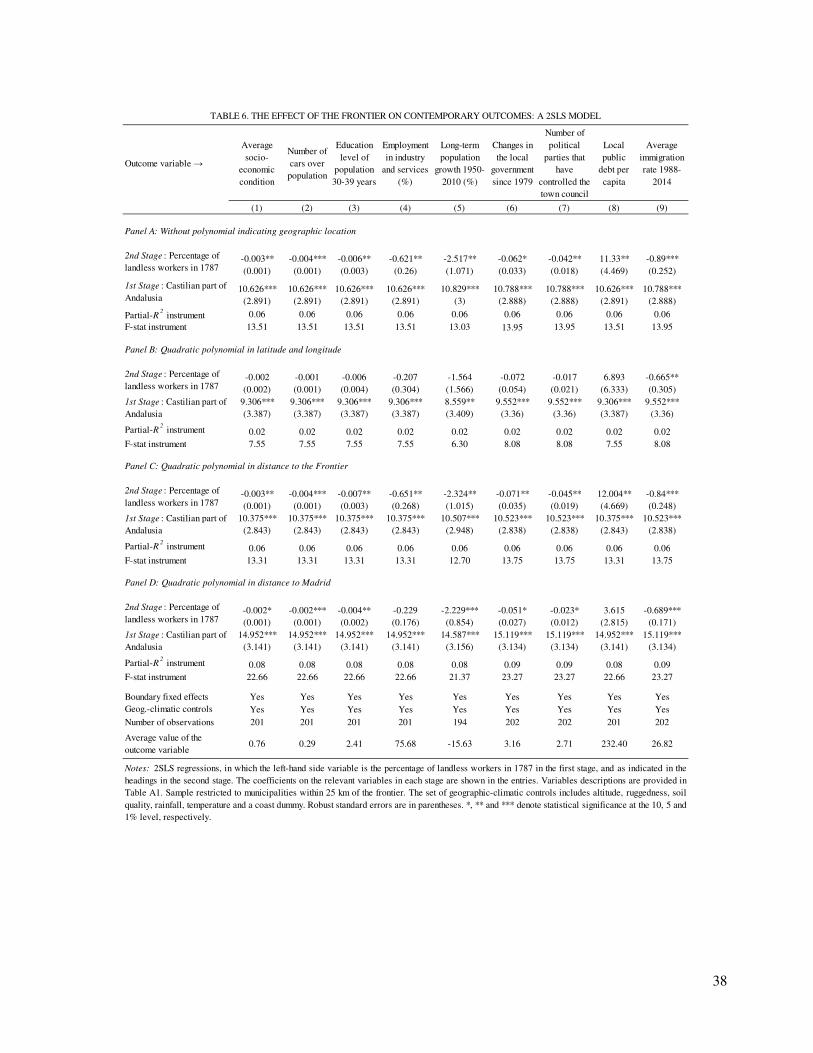
38
Outcome variable →
Average socio-
economic condition
Number of cars over
population
Education level of
population 30-39 years
Employment in industry
and services (%)
Long-term population
growth 1950-2010 (%)
Changes in the local
government since 1979
Number of political
parties that have
controlled the town council
Local public
debt per capita
Average immigration rate 1988-
2014
(1) (2) (3) (4) (5) (6) (7) (8) (9)
Panel A: Without polynomial indicating geographic location
-0.003** -0.004*** -0.006** -0.621** -2.517** -0.062* -0.042** 11.33** -0.89***(0.001) (0.001) (0.003) (0.26) (1.071) (0.033) (0.018) (4.469) (0.252)
10.626*** 10.626*** 10.626*** 10.626*** 10.829*** 10.788*** 10.788*** 10.626*** 10.788***(2.891) (2.891) (2.891) (2.891) (3) (2.888) (2.888) (2.891) (2.888)
Partial-R2 instrument 0.06 0.06 0.06 0.06 0.06 0.06 0.06 0.06 0.06
F-stat instrument 13.51 13.51 13.51 13.51 13.03 13.95 13.95 13.51 13.95
Panel B: Quadratic polynomial in latitude and longitude
-0.002 -0.001 -0.006 -0.207 -1.564 -0.072 -0.017 6.893 -0.665**(0.002) (0.001) (0.004) (0.304) (1.566) (0.054) (0.021) (6.333) (0.305)
9.306*** 9.306*** 9.306*** 9.306*** 8.559** 9.552*** 9.552*** 9.306*** 9.552***(3.387) (3.387) (3.387) (3.387) (3.409) (3.36) (3.36) (3.387) (3.36)
Partial-R2 instrument 0.02 0.02 0.02 0.02 0.02 0.02 0.02 0.02 0.02
F-stat instrument 7.55 7.55 7.55 7.55 6.30 8.08 8.08 7.55 8.08
Panel C: Quadratic polynomial in distance to the Frontier
-0.003** -0.004*** -0.007** -0.651** -2.324** -0.071** -0.045** 12.004** -0.84***(0.001) (0.001) (0.003) (0.268) (1.015) (0.035) (0.019) (4.669) (0.248)
10.375*** 10.375*** 10.375*** 10.375*** 10.507*** 10.523*** 10.523*** 10.375*** 10.523***(2.843) (2.843) (2.843) (2.843) (2.948) (2.838) (2.838) (2.843) (2.838)
Partial-R 2 instrument 0.06 0.06 0.06 0.06 0.06 0.06 0.06 0.06 0.06F-stat instrument 13.31 13.31 13.31 13.31 12.70 13.75 13.75 13.31 13.75
Panel D: Quadratic polynomial in distance to Madrid
-0.002* -0.002*** -0.004** -0.229 -2.229*** -0.051* -0.023* 3.615 -0.689***(0.001) (0.001) (0.002) (0.176) (0.854) (0.027) (0.012) (2.815) (0.171)
14.952*** 14.952*** 14.952*** 14.952*** 14.587*** 15.119*** 15.119*** 14.952*** 15.119***(3.141) (3.141) (3.141) (3.141) (3.156) (3.134) (3.134) (3.141) (3.134)
Partial-R2 instrument 0.08 0.08 0.08 0.08 0.08 0.09 0.09 0.08 0.09
F-stat instrument 22.66 22.66 22.66 22.66 21.37 23.27 23.27 22.66 23.27
Boundary fixed effects Yes Yes Yes Yes Yes Yes Yes Yes YesGeog.-climatic controls Yes Yes Yes Yes Yes Yes Yes Yes YesNumber of observations 201 201 201 201 194 202 202 201 202
Average value of the outcome variable
0.76 0.29 2.41 75.68 -15.63 3.16 2.71 232.40 26.82
TABLE 6. THE EFFECT OF THE FRONTIER ON CONTEMPORARY OUTCOMES: A 2SLS MODEL
Notes: 2SLS regressions, in which the left-hand side variable is the percentage of landless workers in 1787 in the first stage, and as indicated in theheadings in the second stage. The coefficients on the relevant variables in each stage are shown in the entries. Variables descriptions are provided inTable A1. Sample restricted to municipalities within 25 km of the frontier. The set of geographic-climatic controls includes altitude, ruggedness, soilquality, rainfall, temperature and a coast dummy. Robust standard errors are in parentheses. *, ** and *** denote statistical significance at the 10, 5 and1% level, respectively.
2nd Stage : Percentage of landless workers in 1787
1st Stage : Castilian part of Andalusia
2nd Stage : Percentage of landless workers in 1787
2nd Stage : Percentage of landless workers in 1787
2nd Stage : Percentage of landless workers in 1787
1st Stage : Castilian part of Andalusia
1st Stage : Castilian part of Andalusia
1st Stage : Castilian part of Andalusia

39
Variable Description Source
Dependent variables
Gini index of land distribution
The Gini index of utilized agricultural area (UAA) in 1982. We focus on private agricultural holdings (with legal status of natural person or company), which represent 95% of total UAA. This variable is multiplied by 100 so that values range from 0 to 100.
Authors’ elaboration using the 1982 agricultural census (Instituto Nacional de Estadística –INE–, 1982).
Land concentration in holdings ≥ 200ha
Percentage of UAA in holdings equal to or greater than 200 hectares of UAA, in 1982. We focus on private agricultural holdings (with legal status of natural person or company), which represent 95% of total UAA.
Authors’ elaboration using the 1982 agricultural census (INE, 1982).
Mayor Hacendado/Surface Total amount of income earned by the individual that in each
municipality earns the highest income in the middle of the 18th
century (between 1750 and 1753), divided by the surface area of the municipality.
Catastro de Ensenada -Books of El Mayor Hacendado (1750-1753).
Privileged Orders jurisdiction
Dummy variable indicating whether the jurisdiction of the municipality
at the end of the 18th
century (1787) belonged to the nobility, the military orders or the Church.
Authors’ elaboration using the 1787 population census (INE, 1987).
Percentage of landless workers
Percentage of landless workers over the total active agricultural population in 1787, where the total agricultural population is composed of farmers and landless day laborers.
Authors’ elaboration using the 1787 population census (INE, 1987).
Independent variables
Altitude Average altitude in meters, computed using GIS software. Authors’ elaboration using geo-referenced data from Hijmans et al. (2005).
Arable land (% surface area)
Percentage of arable land over the total surface area, corresponding to the 1982 agricultural census.
Instituto de Estadística y Cartografía de Andalucía –IECA– (2014b).
Aridity Average aridity of the municipality surface area, corresponding to the period 1950-2000. The indicator ranges from 0 to 1, with higher values indicating more humid conditions. It is computed using GIS software.
Authors’ elaboration using geo-referenced data Trabucco and Zomer (2009).
Castilian part of Andalusia Dummy variable indicating whether the municipality belonged to the Castilian part of Andalusia.
Authors’ elaboration using maps from Instituto de Cartografía de Andalucía (2009).
Coast dummy Dummy variable indicating whether the municipality has access to the coast.
Authors’ elaboration.
Conquered during the 14th Century/ Conquered during the 15th Century
Dummy variables indicating whether the municipality was conquered during the 14th Century, or during the 15th Century (prior to the beginning of the War of Granada [1481-1492]).
Mestre-Campi and Sabaté (1998), official web pages of municipalities, and the tourism website of the Andalusian Government (http://www.andalucia.org/).
Crops (% surface area) Percentage of land devoted to herbaceous crops over the total surface area, corresponding to the 1982 agricultural census.
IECA (2014b).
Distance to the frontier Linear distance between the centroid of the municipality and the closest point of the former Frontier of Granada (in meters), computed using GIS software. The frontier of Granada is defined as it was at the beginning of the War of Granada (1481-1492).
Authors’ elaboration using maps from Instituto de Cartografía de Andalucía (2009).
Distance to Madrid Linear distance between the centroid of the municipality and Madrid (in meters), computed using GIS software.
Authors’ elaboration.
Distance to urban centers in 1200 and in 1400
Distance to urban centers in 1200 and 1400 (in kilometers), considering an urban center that having at least 5000 inhabitants at some time between 800 and 1800. It is computed using GIS software.
Authors’ elaboration using information from Bairoch (1988).
Fine soil texture (% surface area)
Percentage of land for which the dominant surface textural class is fine (35 % < clay < 60 %), computed using GIS software.
Authors’ elaboration using geo-referenced data from Panagos et a. (2012), Liedekerke et al. (2006) and Panagos (2006).
Latitude Latitude (in decimal degrees) corresponding to the centroid of the municipality urban center.
Geographic Nomenclature of Municipalities and Local Population (IGN, 2012).
TABLE A1 - DESCRIPTION OF VARIABLES

40
Variable Description Source
Longitude Longitude (in decimal degrees) corresponding to the centroid of the municipality urban center.
Geographic Nomenclature of Municipalities and Local Population (IGN, 2012).
Low topsoil carbon (% surface area)
Percentage of area with low or very low topsoil carbon content, computed using GIS software.
Authors’ elaboration using geo-referenced data from Panagos et a. (2012), Liedekerke et al. (2006) and Panagos (2006).
Preexisting land uses (10th
to 12th centuries)
Four indicators indicating the percentage of surface area in each municipality made up of: i) forest, ii) intensive agriculture and irrigation, iii) non-intensive agriculture, and iv) pastureland, in al-
Andalus times (10th to 12th centuries). It is computed using GIS software.
Authors’ elaboration using maps from Instituto de Cartografía de Andalucía (2009).
Presence of Roman roads Dummy variable indicating whether any Roman road passes through the municipality surface area, computed using GIS software.
Authors’ elaboration using geo-referenced data from McCormick et al. (2013).
Rainfall Annual precipitation. It is expressed in hundreds of millimeters, except in Table 2 where it is expressed in millimeters.
Authors’ elaboration using geo-referenced data from IECA (2014a).
Ruggedness Standard deviation of altitude in meters, computed using GIS software. Authors’ elaboration using geo-referenced data from Hijmans et al. (2005).
Soil quality Indicator of soil quality calculated as: 4*(% surface area with excellent soil capacity) + 3*(% surface area with good soil capacity) + 2*(% surface area with moderate soil capacity) + 1*(% surface area with marginal soil capacity), with values ranging from 1 (low soil quality) to 4 (excellent soil quality). It is computed using GIS software.
Consejería de Medio Ambiente. Junta de Andalucía (1996).
Surface area with a steep slope (%)
Percentage of surface area with a steep slope (higher than or equal to 15 percent).
IECA (2014b).
Mediterranean phytoclimate (%)
Percentage of surface area corresponding to Mediterranean phytoclimate, which is related to specific potential types of vegetation such as Quercus ilex rotundifolia or Quercus ilex ilex. It is computed using GIS software.
Authors’ elaboration using geo-referenced data from Allué (1990).
Moderate or high erodibility (% surface area)
Percentage of surface area with moderate or high erodibility, computed using GIS software.
Authors’ elaboration using geo-referenced data from Panagos et a. (2012), Liedekerke et al. (2006) and Panagos (2006).
Temperature Annual average temperature (in degrees Celsius). Authors’ elaboration using geo-referenced data from IECA (2014a).
Years under the frontier effect
Number of years between the conquest of the municipality by Castile and the beginning of the War of Granada (1481-1492). Municipalities conquered during the War of Granada have a value equal to 0.
Mestre-Campi and Sabaté (1998), official web pages of municipalities, and the tourism website of the Andalusian Government (http://www.andalucia.org/).
Contemporary outcomes indicators
Average socioeconomic condition
Average of class marks of socioeconomic conditions of individuals, combining information from occupation, activity and professional situation. To illustrate the construction of this variable, a (maximum) class mark of 3 is given to non-agricultural entrepreneurs with employees, and a (minimun) class mark of 0 to those unemployed who have not worked previously. Year 2001.
Censos de Población y Viviendas, INE (2001).
Number of cars over population
Cars registered in the municipality over population. Year 2001. IECA (2014b).
Education level of population 30-39 years
Average of class marks of the education level of individuals, with class marks ranging from 0 (illiterate) to 4.5 (PhD). Year 2001.
Censos de Población y Viviendas, INE (2001).
Employment in industry and services (%)
Percentage of workers in the industrial and service sectors over the total economy.
Censos de Población y Viviendas, INE (2001).
TABLE A1 - DESCRIPTION OF VARIABLES (Continued)

41
Variable Description Source
Long-term population growth 1950-2010
Population growth over the period 1950-2010. 1950 population census and 2010 municipal census, INE (ww.ine.es)
Changes in the local government since 1979
Number of changes (alternation) in the political party of the town mayor since the first local democratic elections in 1979 (until 2014).
Database of Mayors, Ministerio de Hacienda y Administraciones Públicas (2015a).
Number of political parties that have controlled the town council
Number of different political parties that have controlled the town council since the first local democratic elections in 1979 (until 2014).
Database of Mayors, Ministerio de Hacienda y Administraciones Públicas (2015a).
Local public debt per capita Debt of the town council with financial entities divided by population. Year 2008 (first year of availability of data).
Debt of Local Authorities, Ministerio de Hacienda y Administraciones Públicas (2015b).
Average immigration rate 1988-2014
Average immigration rate during the period 1988-2014. Immigration rate is equal to the number of people entering the municipality each year per 1,000 inhabitants.
IECA (2014b).
Variables at the agricultural holding level
Utilized agricultural area UAA of the agricultural holding measured in hectares. We only consider private agricultural holdings (with legal status of natural person or company).
Authors’ elaboration using the 1982 agricultural census (INE, 1982).
Large estate dummy (>= 200 ha)
Dummy variable indicating whether the agricultural holding is equal to or greater than 200 ha in UAA. We only consider private agricultural holdings (with legal status of natural person or company).
Authors’ elaboration using the 1982 agricultural census (INE, 1982).
Individual controls Individual controls are “company” (whether the holding is managed by a company rather than by a natural person), “utilized agricultural area over total surface area (%)”, “pastureland” (whether the holding has no arable land), and a set of dummies indicating the type of tenure system.
Authors’ elaboration using the 1982 agricultural census (INE, 1982).
Van Liedekerke, Marc Van, Arwyn Jones and Panos Panagos, 2006. ESDBv2 Raster Library - a set of rasters derived from the European Soil Database distribution v2.0. European Commission and the European Soil Bureau Network, CD-ROM.
Panagos, Panos, Marc Van Liedekerke, Arwyn Jones and L. Montanarella, 2012. “European Soil Data Centre: Response to European policy support and public data requirements.” Land Use Policy , 29 (2), 329-338.
Panagos, Panos, 2006. “The European soil database.” GEO: connexion , 5 (7), 32-33.
McCormick, Michael , Guoping Huang, Giovanni Zambotti and Jessica Lavash, 2013. “Roman Road Network (version 2008).” DARMC Scholarly Data Series, Data Contribution Series #2013-5. DARMC, Center for Geographic Analysis, Harvard University, Cambridge MA 02138.
Instituto Geográfico Nacional, 2014. Nomenclátor Geográfico de Municipios y Entidades de Población. Available at http://www.ign.es/
Trabucco, A., and Zomer, R.J. 2009. Global Aridity Index (Global-Aridity) and Global Potential Evapo-Transpiration (Global-PET) Geospatial Database. CGIAR Consortium for Spatial Information. Published online, available from the CGIAR-CSI GeoPortal at: http://www.csi.cgiar.org.
Ministerio de Hacienda y Administraciones Públicas (2015a). Base de datos de Alcaldes. Elecciones 1979 - 2015. Available at http://www.seap.minhap.gob.es/
Ministerio de Hacienda y Administraciones Públicas (2015b). Deuda Viva de las Entidades Locales. Available at http://www.minhap.gob.es/
Instituto Nacional de Estadística, 2001. Censos de Población y Viviendas 2001. Available at www.ine.es.
Instituto Nacional de Estadística, 1987. Censo de 1787 “Floridablanca”. Tomo I, Prolegómenos; Comunidades autónomas meridionales . Madrid:Instituto Nacional de Estadística.
Instituto Nacional de Estadística, 1982. Censo Agrario de 1982. Microdatos. Available at http://www.ine.es/
Instituto de Estadística y Cartografía de Andalucía, 2014a. Datos Espaciales de Referencia de Andalucía. Available at http://www.juntadeandalucia.es/institutodeestadisticaycartografia/
Instituto de Estadística y Cartografía de Andalucía, 2014b. Sistema de Información Multiterritorial de Andalucía. Available at http://www.juntadeandalucia.es/institutodeestadisticaycartografia/
The basic layer with the administrative limits of the Andalusian municipalities, used in the variables computed with GIS software, comes from IECA (2014a).
Hijmans, R.J., S.E. Cameron, J.L. Parra, P.G. Jones and A. Jarvis, 2005. “Very high resolution interpolated climate surfaces for global land areas.” International Journal of Climatology 25: 1965-1978.
Consejería de Medio Ambiente, 1996. Mapa de Capacidad de Uso General y Erosión de las tierras de Andalucía a escala 1:400.000. Consejería de Medio Ambiente. Junta de Andalucía. Año 1996.
Allué, J. L., 1990. Mapa de Subregiones Fitoclimáticas de España Peninsular y Balear . Dirección General de Medio Natural y Política Forestal. Ministerio de Medio Ambiente, y Medio Rural y Marino.Bairoch, Paul. 1988. Cities and Economic Development: From the Dawn of History to the Present. Chicago, IL: University of Chicago Press.
Notes and additional references:
TABLE A1 - DESCRIPTION OF VARIABLES (Continued)

42
Frontier under military threat→ Defense
needs
Balance of power biased
toward the priviledged
orders
Distribution of economic resources:
Large estates
Political institutions:
Jurisdictional rights
Distribution of de facto
politicalpower
Distribution of de jure politicalpower
Extractive institutions to exploit
the landlesspeasantry
Negative effect on economic inequality
and development
Figure 1. A sketch of the mechanisms at work
Figure 2. Andalusia, the frontier of Granada and the percentage of landless workers in 1787

43
Figure 3. Andalusia, the frontier of Granada and “Mayor hacendado/surface” in the 1750s
Figure 4. Andalusia, the frontier of Granada and Privileged Orders jurisdiction in 1787

44
Figure 5. One-Dimensional RDD graphs in distance to the frontier
020
4060
8010
0
-25000 -20000 -15000 -10000 -5000 0 5000 10000 15000 20000 25000
Distance to the frontier in meters (Former Kingdom of Granada in negative values)
Landless workers in 1787
020
0040
0060
00
-25000 -20000 -15000 -10000 -5000 0 5000 10000 15000 20000 25000
Distance to the frontier in meters (Former Kingdom of Granada in negative values)
Mayor Hacendado/surface in the 1750s
0.5
1
-25000 -20000 -15000 -10000 -5000 0 5000 10000 15000 20000 25000
Distance to the frontier in meters (Former Kingdom of Granada in negative values)
Privileged Orders jurisdiction in 1787
020
4060
80
-25000 -20000 -15000 -10000 -5000 0 5000 10000 15000 20000 25000
Distance to the frontier in meters (Former Kingdom of Granada in negative values)
Land concentration in holdings >= 200ha in 1982
2040
6080
100
-25000 -20000 -15000 -10000 -5000 0 5000 10000 15000 20000 25000
Distance to the frontier in meters (Former Kingdom of Granada in negative values)
Gini index of land distribution in 1982
Notes: Black lines represent 90% confidence intervals for the quadratic polynomial in distance to the frontier. Gray linesindicate the global average value on each side of the frontier. Dots show the local average of the variable for municipalitiesin 1,5 km bins of their distance to the frontier. The actual values for each municipality are represented through light greydots.

45
Figure 6- Two-Dimensional RDD graphs in latitude and longitude
(a) Landless workers in 1787 (b) Mayor Hacendado/surface in the 1750s
(c) Privileged Orders jurisdiction in 1787 (d) Land concentration in holdings ≥ 200 ha in 1982
(e) Gini index of land distribution in 1982
Notes: Dots represent the municipality values for the outcome variables, with each data point being located in themunicipality centroid. The background color represents the predicted values for a 1-km grid, from a regression on aquadratic polynomial in latitude-longitude and the Castilian dummy, with a darker color indicating a higher predicted value.