Historical droughts recorded in extended Juniperus procera ...
15
ORIGINAL PAPER Historical droughts recorded in extended Juniperus procera ring-width chronologies from the Ethiopian Highlands E. Gebrehiwot Gebregeorgis 1,2 & I. Robertson 3 & M. Koprowski 1 & L. P. Zhou 4 & P. Gao 4 & A. P. Williams 5 & Z. Eshetu 6 & T. H. G. Wils 7 Received: 10 June 2019 /Revised: 27 November 2019 /Accepted: 9 January 2020 # The Author(s) 2020 Abstract In the Horn of Africa, little is known about temporal changes in hydroclimate owing to the influence of multiple weather systems, the complex terrain, and the sparse instrumental records. Absolutely dated tree-ring records offer the potential to extend our understanding of climate into the pre-instrumental era, but tree-ring studies in this region, and indeed all of tropical Africa, have been rare largely due to lack of an annual climate cycle that reliably produces annual tree-rings. In this study, 40 cores were obtained from 31 Juniperus procera trees growing in the grounds of Ethiopian Orthodox Tewahedo churches in the Gonder region of Ethiopia. The samples were cross-dated using a re-iterative process involving identifying anatomical features from high-resolution images. The tentative ring-width chronologies were revised after the determination of bomb-peak accelerator mass spectrometry radiocarbon dates. Individual series were significantly correlated to the respective master chronologies (r > 0.55; P < 0.05), and expressed population signal values ranged from 0.55 to 0.92. Historical drought years were successfully traced in the chronologies by pointer year analysis. This study confirms that Juniperus procera growing in areas of unimodal precipitation exhibits annual tree-rings and offers the potential as an indirect measure of past climate. Keywords Annual tree-rings . Tropical dendrochronology . Radiocarbon dating . Pointer years . The Blue Nile River basin Introduction Ethiopia and its neighboring countries in the Horn of Africa are highly dependent on the rainfall-fed agricultural econo- my and have suffered from repeated droughts in recent de- cades (Makombe et al. 2007). The climate of Ethiopia is largely controlled by the seasonal migration of the Intertropical Convergence Zone (ITCZ) and associated weather systems with precipitation originating from both the Indian and Atlantic Oceans. In the boreal summer when the ITCZ moves northwards, most of Ethiopia receives pre- cipitation during the main monsoon-type rainy season from approximately June to September (Kiremt). These Kiremt rains support 85–95% of crop growth in Ethiopia, beginning in the southeast and migrating to the northernmost part of the country by mid-July before gradually returning south (Degefu 1988). Some parts of northern and central Ethiopia also experience a less intense secondary rainy season during the spring from approximately February to May (Belg). Southern regions of Ethiopia usually experience two distinct rainy seasons as the ITCZ migrates southwards while the east of the country receives very little precipitation at all Electronic supplementary material The online version of this article (https://doi.org/10.1007/s00484-020-01863-7) contains supplementary material, which is available to authorized users. * E. Gebrehiwot Gebregeorgis [email protected] 1 Department of Ecology and Biogeography, Faculty of Biology and Environment Protection, Nicolaus Copernicus University, Lwowska 1, 87-100 Torun, Poland 2 Department of Plant Biology and Biodiversity Management, Addis Ababa University, P.O.Box 3434, Addis Ababa, Ethiopia 3 Department of Geography, College of Science, Swansea University, Singleton Campus, Swansea SA2 8PP, UK 4 Department of Geography, Peking University, Beijing 100871, China 5 Lamont-Doherty Earth Observatory, Columbia University, Palisades, NY, USA 6 Department of Earth Science, College of Life Science, Climate Science Center, Addis Ababa University, Addis Ababa, Ethiopia 7 Department of Geography, School of Teacher Training for Secondary Education, Fontys University of Applied Sciences, Tilburg, The Netherlands https://doi.org/10.1007/s00484-020-01863-7 International Journal of Biometeorology (2020) 64:739–753 /Published online: 1 2020 February
Transcript of Historical droughts recorded in extended Juniperus procera ...

ORIGINAL PAPER
Historical droughts recorded in extended Juniperus proceraring-width chronologies from the Ethiopian Highlands
E. Gebrehiwot Gebregeorgis1,2 & I. Robertson3& M. Koprowski1 & L. P. Zhou4
& P. Gao4& A. P. Williams5 & Z. Eshetu6
&
T. H. G. Wils7
Received: 10 June 2019 /Revised: 27 November 2019 /Accepted: 9 January 2020# The Author(s) 2020
AbstractIn the Horn of Africa, little is known about temporal changes in hydroclimate owing to the influence of multiple weather systems,the complex terrain, and the sparse instrumental records. Absolutely dated tree-ring records offer the potential to extend ourunderstanding of climate into the pre-instrumental era, but tree-ring studies in this region, and indeed all of tropical Africa, havebeen rare largely due to lack of an annual climate cycle that reliably produces annual tree-rings. In this study, 40 cores wereobtained from 31 Juniperus procera trees growing in the grounds of Ethiopian Orthodox Tewahedo churches in the Gonderregion of Ethiopia. The samples were cross-dated using a re-iterative process involving identifying anatomical features fromhigh-resolution images. The tentative ring-width chronologies were revised after the determination of bomb-peak acceleratormass spectrometry radiocarbon dates. Individual series were significantly correlated to the respective master chronologies (r >0.55; P < 0.05), and expressed population signal values ranged from 0.55 to 0.92. Historical drought years were successfullytraced in the chronologies by pointer year analysis. This study confirms that Juniperus procera growing in areas of unimodalprecipitation exhibits annual tree-rings and offers the potential as an indirect measure of past climate.
Keywords Annual tree-rings . Tropical dendrochronology . Radiocarbon dating . Pointer years . The Blue Nile River basin
Introduction
Ethiopia and its neighboring countries in the Horn of Africaare highly dependent on the rainfall-fed agricultural econo-my and have suffered from repeated droughts in recent de-cades (Makombe et al. 2007). The climate of Ethiopia islargely controlled by the seasonal migration of theIntertropical Convergence Zone (ITCZ) and associatedweather systems with precipitation originating from boththe Indian and Atlantic Oceans. In the boreal summer whenthe ITCZ moves northwards, most of Ethiopia receives pre-cipitation during the main monsoon-type rainy season fromapproximately June to September (Kiremt). These Kiremtrains support 85–95% of crop growth in Ethiopia, beginningin the southeast and migrating to the northernmost part of thecountry by mid-July before gradually returning south(Degefu 1988). Some parts of northern and central Ethiopiaalso experience a less intense secondary rainy season duringthe spring from approximately February to May (Belg).Southern regions of Ethiopia usually experience two distinctrainy seasons as the ITCZmigrates southwards while the eastof the country receives very little precipitation at all
Electronic supplementary material The online version of this article(https://doi.org/10.1007/s00484-020-01863-7) contains supplementarymaterial, which is available to authorized users.
* E. Gebrehiwot [email protected]
1 Department of Ecology and Biogeography, Faculty of Biology andEnvironment Protection, Nicolaus Copernicus University, Lwowska1, 87-100 Torun, Poland
2 Department of Plant Biology and Biodiversity Management, AddisAbaba University, P.O.Box 3434, Addis Ababa, Ethiopia
3 Department of Geography, College of Science, Swansea University,Singleton Campus, Swansea SA2 8PP, UK
4 Department of Geography, PekingUniversity, Beijing 100871, China5 Lamont-Doherty Earth Observatory, Columbia University,
Palisades, NY, USA6 Department of Earth Science, College of Life Science, Climate
Science Center, Addis Ababa University, Addis Ababa, Ethiopia7 Department of Geography, School of Teacher Training for Secondary
Education, Fontys University of Applied Sciences,Tilburg, The Netherlands
https://doi.org/10.1007/s00484-020-01863-7International Journal of Biometeorology (2020) 64:739–753
/Published online: 1 2020February

(Berhanu et al. 2014; Fazzini et al. 2015; Lamb et al. 2018).The determination of Ethiopian hydroclimate on sub-regional scales is hindered by the complex terrain and thesparse network of meteorological stations (Tierney et al.2013; Nicholson 2014; Nash et al. 2016). Many of the ex-treme drought events recorded in Ethiopian history havebeen attributed to the absence of Belg and Kiremt rains.
As the instrumental climate data do not exceed 70 yearsand existing global climate models have little skill at recreat-ing seasonal rainfall variations in eastern Africa (Funk et al.2014; Mwangi et al. 2014), there is need for an indirect mea-sure of past climates to improve our knowledge of the com-plex climate in this region. Although the hydroclimate of theregion has been investigated extensively (Williams and Funk2011; Williams et al. 2012; Tierney et al. 2013; Lamb et al.2018), tree-ring records are exceptionally important to consid-er as potential proxies for inter-annual hydroclimate variabil-ity in these region (Fritts 1976; Schongart et al. 2006;Woodborne et al. 2016). The procedure has been widelyadopted in temperate regions where trees usually form clearlyvisible annual tree-rings, a characteristic that is not easy to findin tropics (Worbes et al. 2003; Speer 2010; Pallardy 2013).Tropical dendrochronology is not necessarily a new field sinceit has been investigated for over a century (Worbes 2002).However, many scientists believed that it would not work inthe tropics due to lack of an explicit annual growth cycle withone growing season and one dormant season (Tomlinson andLongman 1981; Détienne 1989; Jacoby 1989). Today, there isa much greater acceptance of tropical dendrochronology, es-pecially in sub-Sahara Africa after the publication of severalsuccessful scientific studies (Schweingruber 1992; Wils et al.2010, 2011a, b; Eshete and Stahl 1998; Worbes 2002;Gebrekirstos et al. 2009; Battipaglia et al. 2015;Gebregeorgis et al. 2018).
The genus Juniperus has been used to successfully recon-struct climate over the arid and semiarid zones of theMediterranean (Touchan et al. 2005, 2007), as well as semi-arid climatic zones of High-mountain Asia (Bräuning 2001),and semiarid, temperate areas of North America (Derose et al.2016). In this study, we have targeted Juniperus procera(Mill.), which has more recently been used to successfullyreconstruct climate and Nile river flow in the Horn of Africa(Wils et al. 2010;Mokria et al. 2017, 2018). Cross-dating treesfrom tropical regions is already a challenge, and is confoundedin J. procera by the fact that its rings might be confused withdensity fluctuation or pith flecks that are induced by indistinctseasonality of the climate (Schweingruber et al. 1990) and thefact that it is an endangered species that has limitation ofsampling (Farjon 2013). Our study area is located in theBlue Nile River basin, the area known to have been affectedby recurrent drought (Keller 1992) but with a low spatial andtemporal coverage of climate records (Gasse 2000). The aimof this study is to develop tree-ring width chronologies with a
higher dating accuracy than in the existing J. procera tree-ringchronologies from the Blue Nile River basin using a combi-nation of more accurate dating methods by increasing thenumber of samples used for radiocarbon dating and by run-ning pointer year analysis. The resulting ring-width chronol-ogies will lay the foundation for further dendrochronologicalstudies to be conducted in the region.
Materials and methods
Description of the study area
The core samples were collected from the enclosed com-pounds of four ancient Ethiopian Orthodox Tewahedochurches (Fig. 1) located in northern Gonder administrativezone of Amhara region of Ethiopia (Fig. 2). Two of thechurches, Qusquam (Kuskuam) and Rise Adbarat AzezoTeklehaimanot, are located in Gonder, while the remainingtwo, Dabat Dequa Kidane-Mihret and Weken WeybilaMaryam, are located in the towns of Dabat and Weken, locat-ed about 73 and 80 km, respectively, to the north of Gonder.These two towns are classified as the most drought-prone andfood-insecure areas of Ethiopia even though they are in theSemien Mountain chain. In the compounds of the churches,trees are usually preserved for centuries, unless they are need-ed to construct or maintain structures (Alemayehu 2007;Mosissa and Abraha 2018). Church grounds therefore func-tion similarly to arboreta (Fig. 1), preserving old and nativetrees such as Juniperus procera.
Sampling sites: church grounds
Gonder Qusquam church Located in Gonder city (12°37′20.32″N; 37°26′48.32″E) at an elevation of 2254 m a.s.l. Ithas a flat terrain with a vegetation comprising freestandingand high-pruned trees, mostly Juniperus procera, Oleaeuropea, and sparse grasses. The compound is mainly usedfor spiritual gatherings during mass services and tourism andthe back yards for cattle grazing. It is one of the ancientchurches in the area believed to be built in the early 1740s.
Rise Adbarat Azezo Teklehaimanot church Located 7.2 kmfrom Gonder and 1 km from Gonder airport (12°32′26.65″N; 37°26′04.73″E) at an elevation of 2750 m a.s.l. It has a flatterrain with poor vegetation cover comprising of fewJ. procera and O. europaea trees. The church is surroundedby substantial smallholder farms and sparsely populated set-tlement. The farming is rain-fed cultivation of crops andvegetables.
Dabat Dequa Kidane-Mihret church Located in a rural areaat 80 km distance from Gonder (13°01′42.34″N; 37°50′
Int J Biometeorol (2020) 64:739–753740
54.51″E) on a flat terrain at an elevation of 2664 m a.s.l.It has sparsely populated trees of J. procera within itscompound. It is surrounded by substantial smallholderfarmlands where there is a rain-fed cultivation of cropsand vegetables.
WekenWeybila Maryam church Located in a rural area, 80 kmfrom Gonder and 7 km southwest of Debark (13°04′20.82″N;37°49′42.18″E) at an elevation of 2750 m.a.s.l. in the SemienMountains. The terrain is almost flat and vegetation consistsof freestanding J. trees with their lower branches cut-off toallow movement of people and sparse grasses. The compoundis used for spiritual gatherings and cattle grazing. The churchis located in the vicinity of the Semien Mountains NationalPark (Fig. 2b). The park is home to many endemic plant andanimal species and has the highest mountain of Ethiopia,Mount Ras Dashen.
Climate
The climate data for the study sites for the period 1901–2013were obtained from the gridded climate database of ClimateResearch Unit (CRU) (Harris et al. 2014). The spatial cover-age of a single grid cell is 50 km2, whereas the distance be-tween Gonder and Dabat is about 70 km. Thus, climate datawere downloaded for the respective CRU grid numbers, i.e.,for the area around Gonder (206,436) and that of Dabat(205,434) (Fig. 2b). Gonder has a unimodal rainfall distribu-tion pattern with the main rainy season occurring betweenJune and September (Kiremt in Amharic) and accounting for81% (897 mm) of the total annual rainfall (1098 mm). Julyhosts the highest mean precipitation (330 mm) followed byAugust (307 mm) (Fig. 3). Occasional rainfall in Decembermay occur due to the northern airflow from the Red Sea (Wils2009). The amount of rainfall in December increases from
Fig. 2 Map of the area of Gonderadministrative zone relative toriver Blue Nile and neighboringcountries (a) and the location ofthe Ethiopian OrthodoxTewahedo church grounds fromwhere the Juniperus procera coresamples were taken (b), i.e., S1 =Gonder Qusquam church, S2 =Rise Adbarat AzezoTeklehaimanot church, S3 =Dabat Dequa Kidane-Mihretchurch, and S4 =Weken WeybilaMaryam church
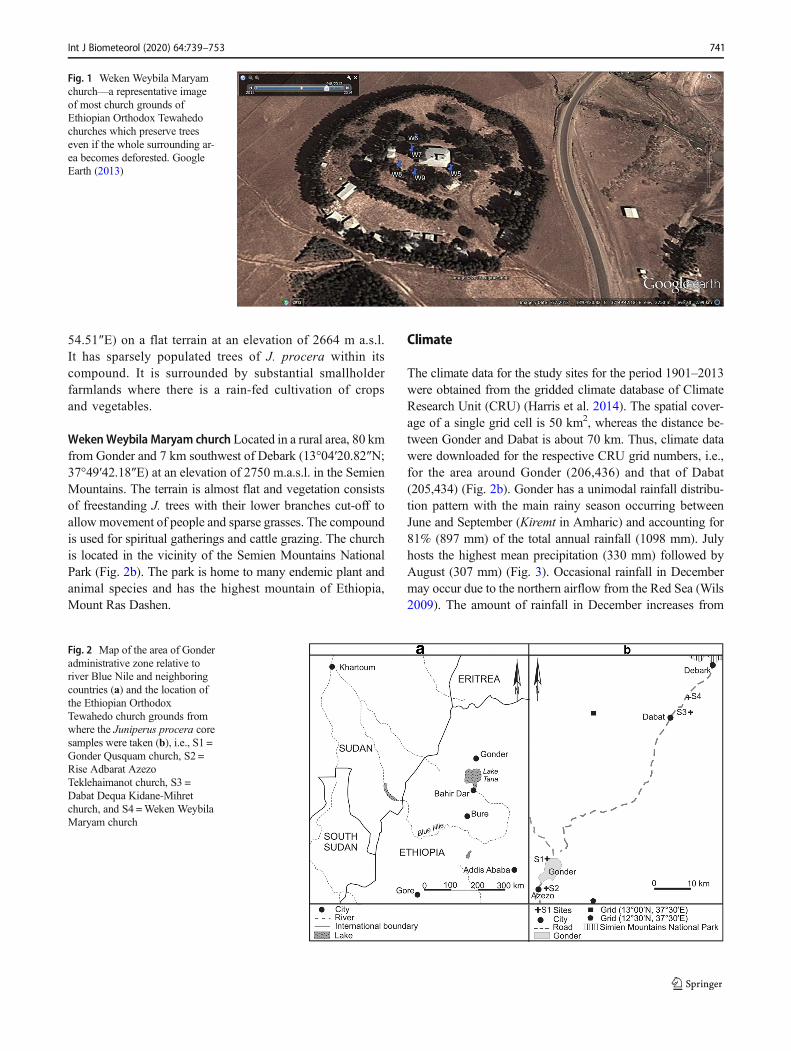
Fig. 1 Weken Weybila Maryamchurch—a representative imageof most church grounds ofEthiopian Orthodox Tewahedochurches which preserve treeseven if the whole surrounding ar-ea becomes deforested. GoogleEarth (2013)
Int J Biometeorol (2020) 64:739–753 741

Gonder northwards while intra-annual variability decreases.The mean monthly temperature varies from 18.0 °C inAugust to 22.5 °C in April (Fig. 3a). Dabat has mean monthlytemperature varying between 18.5 °C in April and 12.0 °C inAugust (Fig. 3b). Dabat receives its maximum rainfall of
345 mm in July followed by a rainfall of 336 mm in Augustwith a total mean annual rainfall of 1240 mm.
Sampling and sample preparation
Thirty-one J. procera trees were sampled from the four an-cient Ethiopian Orthodox church grounds around Gonder ad-ministrative zone. The sample size was limited due to the factthat J. procera is one of the endangered tree species in thisregion (Farjon 2013). Using a 5-mm-diameter Haglöf incre-ment borer, two cores per tree were taken at a height of ap-proximately 1.3 m above ground level. Eighteen trees fromGonder Qusquam church, three trees from Rise AdbaratAzezo Teklehaimanot church, four trees from Dabat DequaKidane-Mihret church, and six trees from Weken WeybilaMaryam church were sampled. The cores were rolled in mois-ture absorbent papers to prevent decay and placed in rigidplastic conduits to protect them from physical damage. Thecores were air dried and sanded with progressively finergrades of abrasive paper (Orvis and Grissino-Mayer 2002).
Tree-ring boundary detection, cross-dating,and tree-ring width measurement
The main purpose of cross-dating was to find the bestmatch between annual growth patterns to enable the es-tablishment of a site chronology with absolute confidencein the assigned dates (Friis 1992; Wils et al. 2011a).Cross-dating supported by the determination of wood an-atomical features (Stokes and Smiley 1968) leads us tofocus on pointer year analysis which may be better suitedto these challenging samples, where a re-iterative processis required (Wils et al. 2011a).
Each tree-ring was photographed using an opto-digitalmicroscope (Leica M205 C) with camera (Leica DFC495). For samples with features that were difficult to iden-tify (Fig. 5b), the wood was marked with a scalpel andfreehand sketches were made to illustrate the area of con-cern. This procedure helped with the identification offalse and missing rings (de Micco et al. 2016), which inturn strengthened the re-iterative process of cross-dating(Wils et al. 2011a).
The sample cores were scanned using (Epson PerfectionV700) photo scanner at a resolution of 1200 dpi. The widthsof the tree-rings were measured on the scanned images usingthe program, CooRecorder V7.5 (Larsson 2003a).Measurements were determined parallel to medullary rays.In case of the arc-shaped nature of some of the tree-rings(Fig. 4b), tree-rings were measured at the centers of the arcsthey formed (Bryukhanova and Fonti 2013).
The measured tree-ring width series were saved in“.pos” file format for each radius and imported to thecross-dating program, CDENDRO V7.5 (Larsson
Fig. 3. Gridded climate diagrams for the area of Gonder city (a), i.e., gridcell 1 (pentagon), and Dabat (b), i.e., grid cell 2 (rectangle), over theperiod 1901-–2013. Each tick mark along the abscissa indicates amonth where J represents January, etc. The left ordinate illustratestemperature (°C) with mean daily minimum and maximumtemperatures represented by black numbers. The right ordinate indicatesmonthly precipitation (mm). The blue line represents the precipitationcurve with an annual precipitation in Gonder (a) and in Dabat (b) at thetop of the graph. The red line represents the mean monthly temperature,with the average annual monthly temperature at Gonder (a) and at Dabat(b) indicated at the top of the graph. The solid blue coloured area indicatesa period when the meanmonthly precipitation exceeds 100 mm. The areacoloured with red dots indicates the months with drought stress. Datafrom CRU database (https://climatedataguide.ucar.edu/climate-data/cru-ts-gridded-precipitationandother-meteorological-variables-1901 (Harriset al. 2014))
Int J Biometeorol (2020) 64:739–753742

2003a). Within tree cross-dating was conducted by visualcomparison of growth curves (Pilcher 1990) and statisticalmeasures, i.e., cross-correlation and t-values, where eachpair of cores were tested individually. In this process,samples were frequently re-measured, false and doublerings were excluded through the process of trial-and-error frequently referring to the pictures and the notesprepared during initial tree-ring identification. After assur-ing that all the pairs of cores were cross-dated, the meantree-ring width values were calculated. As up to two coresper tree were collected and then after excluding some ofthem for their low coherence with the rest of the sample,40 cores from 31 J. procera trees were included in thefinal site tree-ring chronologies.
Age and physical disturbance related trends were removedfrom individual ring-width measurements by fitting negativeexponential curve (Cook and Kairiukstis 1990). Eachdetrended series was then standardized using a cubic smooth-ing spline with a frequency cut-off of 50% and rigidity of two-thirds of the total series curve length within theDendrochronology Program Library in R (dplR) (Bunn2008) (Cook and Peters 1981). The adequacy of sample sizewas checked by computing expressed population signal (EPS)(Wigley et al. 1984) in R (dplR) (Bunn 2008). Other summarystatistics which evaluate the validity of the tree-ring chronol-ogies such as mean sensitivity (MS) (Douglass 1920) andmean inter-series correlation (Cook and Kairiukstis 1990)were calculated. Similarity of site tree ring chronologies wastested by running a correlation calculus based on P2YrsL:proportion of last 2 years growth LIMITED in C Dendro9.3.1 that gives their correlation and t-test values (Larsson2003b).
Radiocarbon dating
As a part of the re-iterative process of cross-dating (Wilset al. 2010, 2011a), radiocarbon dating was employed totest the developed provisional ring-width chronologies.Seven samples from cores with the highest inter and intratree correlations, i.e., samples 14B and 17A from GonderQusquam church and the core sample 8A, from WekenWeybila Maryam church, were selected for acceleratormass spectrometer (AMS) radiocarbon dating conductedat Peking University, China. Bomb-peak radiocarbon dat-ing may be used to determine elevated 14C values origi-nally derived from atmospheric carbon dioxide to datesamples to the nearest year from approximately AD1955 to present (Vogel et al. 1989; Campana and Jones1998; Kaplan 2003; Reimer et al. 2004; Robertson et al.2004; Andreu-Hayles et al. 2015). α-Cellulose was isolat-ed from annual late-wood slivers using standard tech-niques (Loader et al. 1997; Rinne et al. 2005) and homog-enized using a Hielscher ultrasonic probe (Laumer et al.2009) to yield a homogenous sample. The sample wascombusted to carbon dioxide and reduced to graphite onan iron catalyst using the zinc reduction method (Xu et al.2007). 14C/12C and 13C/12C ratios were determined usingthe compact 14C AMS system developed by the NationalElectrostatics Corporation based upon the Model1.55SDH-1 Pelletron accelerator with a terminal voltageof 0.6MV (Liu et al. 2007). Values were corrected forisotopic fractionation using the AMS-derived 13C/12C ra-tio and converted to fraction modern 14C (F14C) values(Stuiver and Polach 1977; Reimer et al . 2004).Calibration of dates was achieved using the Calibomb
Fig. 4 Various types of Juniperusprocera tree-rings: normal (a) arc-shaped (not perpendicular to therays; b), showing dark brownishtracheid lumens (of the heartwoodpredominantly; b, c) and micro-rings (d)
Int J Biometeorol (2020) 64:739–753 743

function in Calib 7.1 (Reimer et al. 2004; Stuiver et al.2017) using atmospheric radiocarbon measurements fromthe Northern Hemisphere Zone 3 (Hua et al. 2013) sup-ported by the limited atmospheric radiocarbon measure-ments from Debre Zeit in Ethiopia (Nydal and Lövseth1996). A smoothing function of 1 year was selected tominimize inter-annual variability (Stuiver et al. 2017).As part of the re-iterative dating process, the AMS radio-carbon dates were used to correct ring-width dates wherethere was a deviation from the tentative initial chronology.
Pointer year analysis
After developing the final site chronologies, pointer yearanalysis was conducted where abrupt negative or positivechanges in tree growth were used to cross check the va-lidity of dating and indicate extreme events recorded inthe chronologies (Schweingruber et al. 1990; Lebourgeoiset al. 2005; Neuwirth et al. 2007). To identify pointeryears, the indexed site tree-ring chronologies wereimported in to the program, Weiser (Gonzales 2001), toallow the identification of extreme years. Considering thesensitivity of J. procera to climate at the Blue Nile Riverbasin (Wils et al. 2010), the pointer year window widthwas set to 5 years with the pointer year interval set to75 years as recommended for such sensitive tree species(Gonzales 2001). The pointer year statistics analysis ac-counts the variation within a sample of trees. It only re-veals signals common to most trees and is less affected byoutliers. It is applied on normalized series and it sets neg-ative and positive threshold values of standard deviationfor negative and positive pointer years respectively(Meyer 1998–1999). Thus, the negative values of thepointer year statistics are sourced from the negative valuesof standard deviation.
The pointer year statistic can be calculated based on thefollowing equation:
PSi ¼ mean RWIið Þ*log nið Þ=stdev RWIið Þwhere PSi is an indexed value in a year i; i is the year offocus; mean (RWIi) = arithmetic mean of the year ringwidth index (RWI) among ni samples in the year i; log(ni) is a common (base ten) logarithm of the number oftree-ring samples in the year i and stdev (RWIi) is thestandard deviation of the tree-ring width of ni samples inthe year i (Meyer 1998–1999).
In the sub-Saharan climate, the most commonly occurringclimate-induced catastrophe is drought. Thus, the analysis fo-cused on the negative pointer years in order to compare themalongside the list of historical drought years (Webb et al. 1991;Comenetz and Caviedes 2002; Viste et al. 2012). The list ofhistorical drought years (Degefu 1988) was crosschecked
against the negative pointer years identified within the timeperiod AD 1757–2013. Where the pointer year values fellbetween − 1 and − 3, the year was classed as likely to be adrought-linked pointer year. The identification of negativepointer years confirmed cross-dating. To avoid circularity,the historical drought data were regarded as independent andnot used to correct the ring-width chronologies.
Results
Tree-ring identification, properties, and cross-dating
Among the frequently observed tree-ring anatomy features ofJ. procera in this study are extremely narrow micro-rings(Figs. 4d and 5a) (Bryukhanova and Fonti 2013); in tree-rings close to the pith where tree-ring boundaries were dom-inated by dark brown stains, which made the entire tree-ringresemble late-wood (Fig. 5a); and the presence of many darkdots and coloured cells tangentially distributed throughout thetree-rings (Figs. 4b and 5a).
Moreover, during the study micro-rings with damagedor dark brownish look of tracheids, mostly on the tree-ring boundaries were observed as demonstrated inFigs. 4d and 5b).
Radiocarbon dating
For sample 14B from the Gonder Qusquam church, threesamples were selected for radiocarbon dating (Table 1).The date of the inner sample initially allocated to the yearAD 1965 (radiocarbon sample QAS-3619) was confirmed.Calibration of the “middle” sample initially allocated toAD 1976 (radiocarbon sample QAS-3620) gave two pos-sible dates AD 1976–78 and AD 1963, at two sigma er-rors. Through a process of elimination, the date of AD1963 can be rejected as this sample cannot be youngerthan QAS-3619. Similarly, calibration of the outer sampleinitially allocated to AD 2001 (radiocarbon sample QAS-3622) gave two possible dates AD 2000–2004 and AD1958 at two sigma errors. As this outer sample cannotbe older than QAS-3619 and QAS-3620, the approximatedate of AD 2001 was confirmed.
For sample 17A, also from the Gonder Qusquamchurch, two samples were selected for radiocarbon dat-ing (Table 1). The date of the inner sample, initiallyallocated to the year AD 1965 (radiocarbon sampleQAS-3618), was confirmed by calibrating the F14Cvalues using Northern Hemisphere zone 3 (NH3) atmo-spheric radiocarbon measurements with no smoothing(Fig. 6a) and a smoothing filter set to 1 year to mini-mize inter-annual variability (Fig. 6b; Stuiver et al.2017). Using a similar approach, the outer sample,
Int J Biometeorol (2020) 64:739–753744

initially allocated to the year AD 2001 (radiocarbonsample QAS-3621), gave two possible dates AD 2002–2006 and AD 1957–58 at two sigma errors. As thisouter sample cannot be older than QAS-3618, the dateof AD 1957–58 can be rejected. However, the AMSradiocarbon date for the outer sample appeared to beoffset by 1 year. Re-inspection of the samples and woodanatomical features revealed a false ring that was re-moved from the ring count, and the chronologies werere-calculated taking this change into account.
Two samples were selected for radiocarbon dating fromcore 8A from Weken Weybila Maryam church (Table 1).Adopting the same procedure, the inner sample initially allo-cated to the year AD 1965 was offset by 1 year. Re-inspectionof the cores and images revealed that the presence of a falsering that was either an intra-annual density fluctuation (IADF)or a dating error and the initial tentative chronology weresubsequently revised.
Tree-ring width measurement statistics
Tree-ring data of 40 cores from 31 trees were successfullycross-dated; statistically characterized and site chronolo-gies were developed (Table 2; Fig. 7). The oldest sampleswere from Gonder Qusquam church and the youngestones were from Weken Weybila Maryam church. Themean sensitivity varied across all the four sampling sites.The lowest value was observed on the samples collectedfrom Dabat Dequa Kidane-Mihret church and the highestones were from Rise Adbarat Azezo Teklehaimanotchurch and Weken Weybila Maryam church. The correla-tion of each tree-ring series with their respective masterchronologies per site was strong (r > 0.55; P < 0.05) in allthe four chronologies. The average first order autocorre-lation was high (r > 0.40; P < 0.05) (Wigley et al. 1987) inall chronologies (Table 2). The expressed population sig-nal (EPS) is a measure of the degree to which a chronol-ogy is representative of a perfect chronology (Cropper
Table 1 Calibration of radiocarbon dates using the Calibomb functionin Calib 7.1 (Reimer et al. 2004; Stuiver et al. 2017). The dates werenormalized to δ13C = -25.0‰ and reported with the conventional onesigma (Stuiver and Polach 1977) and two sigma (2σ) errors.
Atmospheric radiocarbon measurements from the Northern HemisphereZone 3 (Hua et al. 2013) were used. A smoothing function of one-yearwas selected to minimize inter-annual variability
Core Laboratory no. Provisional age (AD) Most probable age (AD) F14C 1σ (F14C) Calibrated dates (2σ range); probability
8A QAS-3617 1965 1964–1966 1.673127 0.0064 [cal AD 1963.80: cal AD 1964.79] 0.374
[cal AD 1965.46: cal AD 1966.95] 0.626
QAS-3623 2006 2006–2008 1.057803 0.0032 [cal AD 1957.62: cal AD 1957.85] 0.062
[cal AD 2005.70: cal AD 2008.15] 0.938
14B QAS-3619 1965 1964–1966 1.692033 0.0049 [cal AD 1964.23: cal AD 1966.43] 1.000
QAS-3620 1976 1976–1978 1.345576 0.0050 [cal AD 1962.61: cal AD 1962.78] 0.074
[cal AD 1976.01: cal AD 1978.16] 0.926
QAS-3622 2001 2000–2004 1.084570 0.0036 [cal AD 1957.89: cal AD 1958.15] 0.055
[cal AD 2000.46: cal AD 2003.74] 0.945
17A QAS-3618 1965 1964–1965 1.723082 0.0048 [cal AD 1964.57: cal AD 1965.90] 1.000
QAS-3621 2001 2002–2006 1.073875 0.0031 [cal AD 1957.78: cal AD 1958.03] 0.048
[cal AD 2002.35: cal AD 2005.83] 0.952
Fig. 5 Micro-rings observedduring the study (GonderQusquam church 17Ayear’s 1937to 1943). The two arrows in thepicture on the left demonstrate themicro-rings with dark brownishshade, which made distinguishingtree-ring boundaries difficult (a).The micro-rings can be confusedwith false rings (b)
Int J Biometeorol (2020) 64:739–753 745

1982; Wigley et al. 1984). In other words, it is a measureof similarity of a chronology and a hypothetical chronol-ogy based on all trees in a population (Briffa et al. 1990).In this study, EPS values for the chronologies fromGonder Qusquam church ranged between 0.55 and 0.92(Briffa and Jones 1990; Wigley et al. 1984).
The chronologies from all the four sites showed similarpatterns and significantly correlated to each other (P < 0.05)(Table 3). The narrowest as well as the widest tree-rings wereobserved on samples from Weken Weybila Maryam church(Table 2). On the other hand, looking at the general trend, it isnoticeable that the oldest samples and of the most uniformgrowth were observed at Gonder Qusquam church. The sec-ond oldest samples were from Rise Adbarat AzezoTeklehaimanot church, and they had the second widest tree-
rings on average, following samples from Dabat DequaKidane-Mihret church (Fig. 7; Table 2).
Pointer and drought years
The list of negative and positive pointer years was obtainedfrom the computation byWEISER (Gonzales 2001). The out-put appears in a tabular form showing the negative and posi-tive pointer years to the left and right of the neutral years (0values) with their equivalent degrees of intensity ranging from− 3 to 3. The list of historical drought years compared along-side the negative pointer years in each site chronologies isshown (Fig. 8). On average, about 85% of correspondencebetween the list of negative pointer years and historicaldrought years was observed over the four site chronologies.
Table 2 Summary statistics for the Juniperus procera site ring-width chronologies
Variables (unfiltered) GonderQusquam
Dabat Degua-Kidanemihret
Rise Adbarat Azezo Teklehaimanot WekenWeybilaMaryam
Expressed population signal (EPS) 0.919 0.767 0.550 0.761
Age (time period) 86–257(1758–2013)
102–209(1804–2013)
77–152(1861–2013)
137(1878–2013)
Mean sensitivity 0.400 0.366 0.454 0.426
Auto correlation 0.481 0.546 0.638 0.466
Correlation with master 0.633 0.562 0.551 0.647
Standard deviation of ring width index 0.695 0.933 1.135 1.008
Number of trees 18 6 3 4
Number of cores 23 7 5 5
Residual ring-width index 0.997(0.156–2.063)
1.003(0.496–2.177)
0.980(0.248–2.849)
0.973(0.028–3.738)
Standard ring-width index 0.997(0.110–2.070)
0.994(0.436–2.360)
0.978(0.178–3.482)
0.973(0.028–3.738)
Fig. 6 Calibration of radiocarbon dates using the Calibomb function inCalib 7.1 (Reimer et al. 2004; Stuiver et al. 2017) with F14C = 1.7230 ±0.0048 (ordinate) (a, b). Atmospheric radiocarbon measurements fromthe Northern Hemisphere Zone 3 (Hua et al. 2013) were used withoutsmoothing (blue line) (a) and a smoothing function of oneyear was
selected to minimise inter-annual variability (blue line) (b). The 2σ cali-brated probability ranges (green shading) are shown on the calendar axis(cal AD) (abscissa) (a, b). The 2σ calibrated probability ranges (greenshading) are shown on the calendar axis (cal AD) (abscissa) (a, b)
Int J Biometeorol (2020) 64:739–753746

This in turn means there are negative pointer years which arenot drought years.
In a similar manner to other studies, these trees recordedhistorical drought years (Verschuren et al. 2000; Nicholson2001; Legesse et al. 2002; Lamb et al. 2007; Umer et al.2007). However, it is important to realize that it does notnecessarily mean that all the negative pointer years were onlyrecorded during the historical drought years (Neuwirth et al.2007).
Discussion
Tree-ring formation and cross-dating
Tree-ring series of 40 cores from 31 Juniperus procera treesfrom four church grounds at Gonder and Dabat in Ethiopiawere successfully cross-dated and confirmed by AMS radio-carbon dating and incorporated into four separate site chronol-ogies (Fig. 7; Table 2). Subsequently, historically knowndrought years were traced in the chronologies (Fig. 8).Similarly, in our earlier study on different sample trees,cross-dated tree-ring chronologies of J. procera at the Blue
Nile River basin were also built at Gonder where historicaldrought years were used as indicator years to assist the re-iterative cross-dating procedure of J. procera at Gonder.Similar results have also been found at lake Tana andGonder areas, i.e., at the Blue Nile River basin by Mokriaet al. (2017, 2018), who constructed a multi-centuryJ. procera ring-width chronology from living and dead treesto reconstruct precipitation (Mokria et al. 2017) and the flowdynamics of the river Blue Nile during AD 1784–2014(Mokria et al. 2018).
The sanding method employed contributed towards thesuccessful identification of false rings by enhancing the visi-bility of individual tracheids and degree of sharpness of thereturn to earlywood as reported by Vaganov et al. (2009). There-iterative approach to dating shared many characteristicswith skeleton plotting, with ring identification, marking, andthe graphical comparison of ring width patterns being used ina similar manner until the time-series attained the minimumacceptable statistical value (Cropper 1979; Swetnam et al.1985; Cook and Holmes 1986).
Cross-dating the J. procera tree-rings at Gonder was acomplex and challenging task due to the unusual tree-ringand tracheidal properties, including frequent wedging, miss-ing rings, and false rings (Fig. 5). Similar challenges havebeen reported by numerous studies conducted in tropical andMediterranean tree species (Schweingruber et al. 1990;Cherubini et al. 2003; Campelo et al. 2016; Nabais et al.2014; Kurz-Besson et al. 2016), including J. procera(Couralet et al. 2007; Wils et al. 2011a). This challenge ismore pronounced for conifers grown in semiarid regions(Schweingruber 1988) such as in the Gonder region(Couralet et al. 2005) (Fig. 3). Further, this region is tropical,and tropical climates promote the formation of non-annualrings, i.e., double and missing rings are common (Tomlinsonand Longman 1981; Wils et al. 2011b).
Fig. 7 Residual chronology(RWI) of each site, i.e., GonderQusquam church (GQC), RiseAdbarat Azezo Teklehaimanotchurch (RAATC), Dabat DequaKidane-Mihret church(DDKMC), and Weken WeybilaMaryam church (WWMC) withtheir sample depths (Shaded ar-ea). Their respective EPS and rbarfor 50-year window with 25-yearlag where dashed line shows themiddle of the window and EPSand rbar values represent 50-yearwindow with 25 years before andafter dashed line
Table 3 Correlation coefficient and t-test values of the four sitechronologies, i.e., S1 = Gonder Qusquam church, S2 = Rise AdbaratAzezo Teklehaimanot church, S3 = Dabat Dequa Kidane-Mihret churchand S4 =Weken Weybila Maryam church
Dated 2013 2013 2013
Corr TTest S1 S2 S3 S4
S1 0.35 0.35 0.46
S2 4.6 0.28 0.71
S3 5.4 3.6 0.41
S4 6.0 11.8 5.2
Int J Biometeorol (2020) 64:739–753 747

The arc-shaped nature of some tree-rings of J. procera hasalso resulted in non-perpendicular intersection between tree-rings and rays (Fig. 4b), which is uncommon (Speer 2010;Schweingruber et al. 1990). The appearance of curling-up(twisting) stems of J. procera trees must have contributed tothis observation. It may have also been created by externalforces of gravity and wind (Schweingruber et al. 1990).
The highly frequent appearance ofmicro-rings observed onthe J. procera samples (Figs. 4d and 5b) can easily be con-fused with false rings. False ring occurrence is common inmany trees, especially conifers (Schweingruber et al. 1990;Campelo et al. 2016). Thus, recent studies have suggestedthe adoption of independent and reliable dating techniquessuch as radiocarbon dating to help improve the reliability oftropical tree-ring chronologies (Herrera-Ramirez et al. 2017;Worbes et al. 2017). Considering these challenges, the analy-sis of disc samples would have been better (Worbes 2002), butJ. procera is an endangered tree species (Azene 2007) anddestructive sampling of trees was not allowed from thegrounds of Ethiopian Orthodox Tewahedo churches.
Radiocarbon dating
Radiocarbon dating was helpful in validating the tentative datesobtained by cross-dating (Table 1), and this technique has beenutilized elsewhere (Hua et al. 1999; Fichtler et al. 2004; Biondiet al. 2007). The elimination of the least probable date from theprior and post bomb-peak period (Tans 1981; Vogel et al. 1989;Levin and Kromer 1997) increased the reliability of the overalldating process (Biondi and Fessenden 1999; Andreu-Hayleset al. 2015). Although the calibration of radiocarbon dates usesthe closest available regional atmospheric 14C data to reduce theinfluence of external factors such as fossil fuel combustion(Levin and Hesshaimer 2000; Levin et al. 2003), the atmo-spheric radiocarbon concentrations measured from Debre Zeitin Ethiopia were also utilized to confirm results (Nydal and
Lövseth 1966). Most of the radiocarbon dates exactly matchedthe tentative dendrochronological calendar dates (Table 1).Similar results have been observed for trees growing in tropicalenvironments. Pinus rigida from Madidi National Park inBolivia showed strictly annual tree-rings and their dendrochro-nological dates exactly matched with the results of the radiocar-bon dates (Andreu-Hayles et al. 2015). In the wet tropical for-ests of Central Africa, it was reported that four out of five treespecies tested showed an annual periodicity in their tree-rings(Groenendijk et al. 2014).
On the other hand, differences were observed between ra-diocarbon dates and tentative ring-width dates on radiocarbonsamples QAS3621 and QAS3617 from tree-ring samples,17A-2001 and 8A-1965 respectively (Table 1). These differ-ences were caused due to missing rings and the presence offalse rings. This is also consistent with the results of severaltropical radiocarbon studies where differences were observedbetween radiocarbon dates and tentative dendrochronologicaldates. For example, the initial J. procera chronology from theBlue Nile River basin showed a 1-year difference from bombradiocarbon dates and the chronology was revised (Wils et al.2010). In another tropical study, Linares et al. (2017) showedthat in some years, the radiocarbon dating revealed 7–12miss-ing rings between two consecutive dendrochronologically dat-ed tree-rings. False rings can also lead to incorrect dating, asseveral false rings can occur within 2 years. Worbes et al.(2017) investigated 27 tropical peat swamp forest trees inKalimantan, Indonesia, and found that some species exhibitmultiple tree-rings per year. Similarly, Wils et al. (2009) usedbomb-peak radiocarbon dating to show that J. procera fromDoba forest, northern Ethiopia, had multiple tree-rings peryear, and Herrera-Ramirez et al. (2017) found that Prioriacopaifera from Atrato River, Colombia, formed multipletree-rings in certain years, which made radiocarbon datingessential for validating the annual periodicity of tree-ringsespecially in the tropics.
Fig. 8 Presence of historicaldrought years appearing asnegative pointer years (blackbars) and that of non-droughtnegative pointer years (red bars)in the four-site chronologies de-veloped in this study. GonderQusquam church (GQC), RiseAdbarat Azezo Teklehaimanotchurch (RAATC), Dabat DequaKidane-Mihret church(DDKMC), and Weken WeybilaMaryam church (WWMC)
Int J Biometeorol (2020) 64:739–753748

Tree-ring width analysis
The tree-ring width chronology from Gonder Qusquamchurch was built from living trees and is one of the longestchronologies from tropical Africa (Mokria et al. 2017, 2018;de Ridder et al. 2014; Schongart et al. 2006; Fichtler et al.2004; Gebrekirstos et al. 2008). As the tree-rings are annual,their age must be at least equal to the number of their tree-rings and older as several rings are missed when sampling ata height of 1.3 m above the ground (Worbes 1999).
Although the sample size is relatively small, the high de-gree of temporal autocorrelation among ring widths (Table 2)indicates that the tree-ring width is influenced by the climateof several years (Carrer and Urbinati 2004). Generally, in thetropics, the main growth determinant climatic variable is pre-cipitation (Worbes 2002; Cleaveland et al. 2003; Brienen andZuidema 2005). The autocorrelation in the tree-ring widthchronology from Rise Adbarat Azezo Teklehaimanot andDabat Dequa Kidane-Mihret (Table 2) church exceeded theacceptable thresholds (Cook 1985). Additionally, evergreenneedles involving in photosynthesis for multiple years mightalso have contributed for the higher autocorrelation (Fan et al.2009). At these sites, the trees grew in church grounds wherethere was considerable spacing between trees and higherground disturbance by cattle grazing that could have increasedautocorrelation (Holmes 1983). At Gonder Qusquam andWeken Weybila Maryam, the autocorrelation was lowerreflecting lower ground disturbance as the churches havewider compounds even though they are located closer to cityand densely populated areas. A similar result was observed onthe drought-sensitive tree-ring chronologies from Kyrgyzstanand China indicating low effect of previous years’ climate onthe current year’s growth (Wang et al. 2017).
The EPS values of the four tree-ring width chronologies ofJ. procera varied among sites, and it showed direct propor-tionality to sample depth and inverse proportionality to eleva-tion of sampling sites (Table 2). A similar result was found byMérian et al. (2013). The highest value of EPS was obtainedfor the Gonder Qusquam church chronology, whichwas partlyrelated to the higher sample depth. Many studies havemisinterpreted the concept and purpose of EPS and even seta minimum requirement of 0.85 (Buras 2017). But, there is nominimum or optimum value to be stated as a statistical re-quirement of a chronology to be accepted or to do not(Wigley et al. 1984; Buras 2017). Thus, an EPS value ofbelow 0.85 cannot necessarily be the only reason to excludesite chronologies from further dendroclimatic analysis. Thechronology at each site significantly correlatedwith the masterchronology which is composed of all trees per site (Table 2)indicating a high degree of common forcing. Moreover, thesechronologies were developed using expensive and labor-intensive methodologies with an intension of compromisingthe lower sample depth. However, in this exploratory study,
the sample depth was relatively low, and care must be takennot to over interpret these preliminary results.
Pointer year analysis
Most of the known historical drought years coincided with thenegative pointer years in our four new J. procera chronologies(Fig. 8), confirming that pointer years can be used to indepen-dently verify the re-iterative cross-dating of J. procera sam-ples. However, not all the narrow rings were drought induced(Eilmann et al. 2009) and not every pointer year could bedirectly associated with a drought (Fig. 8). This could reflecta lag in the negative effect of drought on tree growth whichwas supported by the relatively high autocorrelation in the sitechronologies (Matisons et al. 2013). It has been demonstratedthat J. procera is sensitive to climatic variability (Wils et al.2010), and such trees show more pointer years than other treespecies in the same area (Slimani et al. 2014).
Conclusions
The sample preparation and cross-dating approachesemployed in this study enabled the successful cross-datingof Juniperus procera. The detailed high-resolution observa-tion of tree-ring anatomical features helped the identificationof false rings, which aided cross-dating. Bomb-peak acceler-ator mass spectrometry radiocarbon dating was used to checkthe initial ring-width chronologies and revise after re-examining the ring widths. Buras (2017) inferred that lowEPS is often observed in shrubs or anatomical chronologies;our study shows that in some cases to this list, chronologiesfrom tropical trees should be included. Pointer years associ-ated with historically recorded drought were identified andused to check the dating of the final chronology. This studyconfirms that J. procera growing in the Gonder region withunimodal precipitation has annual tree-rings and can be usedto reconstruct historical variability in precipitation.
Acknowledgments We thank the Ethiopian Orthodox Tewahedo Churchfor granting permission to sample the preserved trees. Logistical supportduring sampling was coordinated by the Climate Science Center of AddisAbaba University. We thank Professor Krystof Szpila for giving us per-mission to use the opto-digital microscope (Leica M205 C) with camera(Leica DFC 495). We acknowledge Damian Jednak and Justyna Jasinskafor helping to prepare Figs. 4 and 5 respectively. Last but not least, wethank the anonymous reviewers for their valuable comments that helpedto improve the quality of the manuscript.Funding information Field sampling and part of laboratory analysis wasfinancially supported by a National Geographic Global Exploration Fundgrant GEFNE80-13 (Drought reconstruction in the Horn of Africa).
Open Access This article is licensed under a Creative CommonsAttribution 4.0 International License, which permits use, sharing,adaptation, distribution and reproduction in any medium or format, aslong as you give appropriate credit to the original author(s) and the
Int J Biometeorol (2020) 64:739–753 749

source, provide a link to the Creative Commons licence, and indicate ifchanges weremade. The images or other third party material in this articleare included in the article's Creative Commons licence, unless indicatedotherwise in a credit line to the material. If material is not included in thearticle's Creative Commons licence and your intended use is notpermitted by statutory regulation or exceeds the permitted use, you willneed to obtain permission directly from the copyright holder. To view acopy of this licence, visit http://creativecommons.org/licenses/by/4.0/.
References
Alemayehu W (2007) Ethiopian church forests opportunities and chal-lenges for restoration. Dissertation, Wageningen University
Andreu-Hayles L, Santos G, Herrera Ramírez D et al (2015) Matchingdendrochronological dates with the southern hemisphere 14C bombcurve to confirm annual tree rings in Pseudolmedia Rigida fromBolivia. Radiocarbon 57:1–13. https://doi.org/10.2458/azu_rc.57.18192
Azene B-T (2007) Useful trees and shrubs of Ethiopia: identification,propagation, and management for 17 agroclimatic zones. RELMAin ICRAF Project, Nairobi
Battipaglia G, Zalloni E, Castaldi S, Marzaioli F, Cazzolla-Gatti R,Lasserre B et al (2015) Long tree-ring chronologies provide evi-dence of recent tree growth decrease in a Central African tropicalforest. PLoS One 10(3):e0120962. https://doi.org/10.1371/journal.pone.0120962
Berhanu B, Seleshi Y, Melesse AM (2014) Nile River Basin. In: MelesseAM, Abtew W, Setegn SG (eds) Surface water and groundwaterresources of Ethiopia: potentials and challenges of water resourcesdevelopment. Springer International Publishing, Cham, pp 98–117
Biondi F, Fessenden JE (1999) Radiocarbon analysis of Pinus lagunaetree rings: implications for tropical dendrochronology. Radiocarbon41:241–249. https://doi.org/10.1017/S0033822200057118
Biondi F, Strachan SDJ, Mensing S, Piovesan G (2007) Radiocarbonanalysis confirms the annual nature of sagebrush growth rings.Radiocarbon 49:1231–1240. ht tps: / /doi .org/10.1017/S0033822200043149
Bräuning A (2011) Editorial note for the special issue on ‘tropicalDendroecology’. Trees 25:1–2. https://doi.org/10.1007/s00468-010-0530-x
Brienen RJW, Zuidema PA (2005) Relating tree growth to rainfall inBolivian rain forests: a test for six species using tree ring analysis.Oecologia 146:1–12. https://doi.org/10.1007/s00442-005-0160-y
Briffa KR, Jones PD (1990) Basic chronology statistics and assessment.In: Cook ER, Kairiukstis LA (eds) Methods of dendrochronology:applications in the environmental sciences. Kluwer Acad (Springer),Dordrecht, pp 137–152
Briffa KR, Bartholin TS, Eckstein D et al (1990) A 1,400-year tree-ringrecord of summer temperatures in Fennoscandia. Nature 346:434
Bryukhanova M, Fonti P (2013) Xylem plasticity allows rapid hydraulicadjustment to annual climatic variability. Trees 27:485–496. https://doi.org/10.1007/s00468-012-0802-8
Bunn AG (2008) A dendrochronology program library in R (dplR).Dendrochronologia 26:115–124. https://doi.org/10.1016/j.dendro.2008.01.002
Buras A (2017) A comment on the expressed population signal.Dendrochronologia 44:130–132. https://doi.org/10.1016/j.dendro.2017.03.005
Campana SE, Jones CM (1998) Radiocarbon from nuclear testing appliedto age validation of black drum, Pogonias cromis. Fish Bull 96:185–192. https://doi.org/10.1007/3-540-28084-7_69
Campelo F, Nabais C, Carvalho A, Vieira J (2016) tracheideR-an R pack-age to standardize tracheidograms. Dendrochronologia 37:64–68.https://doi.org/10.1016/j.dendro.2015.12.006
Carrer M, Urbinati C (2004) Age-dependent tree-ring growth responsesto climate in Larix decidua and Pinus cembra. Ecology 85:730–740.https://doi.org/10.1890/02-0478
Cherubini P, Gartner BL, Tognetti R, Bräker OU, Schoch W, Innes JL(2003) Identification, measurement and interpretation of tree rings inwoody species from mediterranean climates. Biol Rev Camb PhilosSoc 78:119–148. https://doi.org/10.1017/S1464793102006000
Cleaveland MK, Stahle DW, Therrell MD et al (2003) Tree-ring recon-structed winter precipitation and tropical teleconnections inDurango, Mexico. Clim Chang 59:369–388. https://doi.org/10.1023/A:1024835630188
Comenetz J, Caviedes C (2002) Climate variability, political crises, andhistorical population displacements in Ethiopia. Environ Hazards 4:113–127. https://doi.org/10.1016/j.hazards.2003.08.001
Cook ER (1985) A time series analysis approach to tree ring standardi-zation. Dissertation, University of Arizona https://doi.org/10.1108/eb050773
Cook ER, Holmes RL (1986) Guide for computer program ARSTAN.University of Arizona, Tucson
Cook ER, Kairiukstis LA (1990) Methods of dendrochronology: applica-tions in the environmental sciences. Kluwer Acad (Springer),Dordrecht
Cook E, Peters K (1981) The smoothing spline: a new approach to stan-dardizing forest interior tree-ring width series for dendroclimaticstudies. Tree-Ring Bull 44:45–53
Couralet C, Sass-Klaassen U, Sterck F et al (2005) Combining dendro-chronology and matrix modelling in demographic studies: an eval-uation for Juniperus procera in Ethiopia. For Ecol Manag 216:317–330. https://doi.org/10.1016/j.foreco.2005.05.065
Couralet C, Sass-Klaassen U, Sahle Y et al (2007) Dendrochronologicalinvestigations on Juniperus procera from Ethiopian dry afromontaneforests. TRACE Dendrosymposium 2006. ForschungszentrumJülich:73–79
Cropper JP (1979) Tree-ring skeleton plotting by computer. Tree-RingBull 39:47–59
Cropper, J.P. (1982) Comment on Response Functions In: M.K. Hugheset al. (eds.), Olimate from Tree Rings. Cambridge University Press,Cambridge, UK.
Degefu W (1988) Some aspects of meteorological drought in Ethiopia.In: Glantz M (ed) Drought and hunger in Africa: Denying famine afuture. Cambridge University Press, pp 23–36
Derose RJ, Bekker MF, Kjelgren R et al (2016) Dendrochronology ofUtah Juniper ( Juniperus osteosperma (Torr.) little). Tree Ring Res72:1–14. https://doi.org/10.3959/1536-1098-72.01.01
de Micco V, Campelo F, De Luis M, et al (2016) Intra-annual densityfluctuations in tree rings: How, when, where, and why? IAWA J 37:232–259. https://doi.org/10.1163/22941932-20160132
de Ridder M, Toirambe B, van den Bulcke J, et al (2014)Dendrochronological potential in a semi-deciduous rainforest: Thecase of Pericopsis elata in Central Africa. Forests 5:3087–3106.https://doi.org/10.3390/f5123087
Détienne P (1989) Appearance and periodicity of growth rings in sometropical woods. IAWA Bull 10:123–132. https://doi.org/10.1163/22941932-90000480
Douglass AE (1920) Evidence of climatic effects in the annual rings oftrees. Ecology 1:24–32. https://doi.org/10.2307/1929253
Eilmann B, Zweifel R, Buchmann N et al (2009) Drought-induced adap-tation of the xylem in scots pine and pubescent oak. Tree Physiol 29:1011–1020. https://doi.org/10.1093/treephys/tpp035
Eshete G, Stahl G (1998) Tree rings as indicators of growth periodicity ofacacias in the Rift Valley of Ethiopia. For Ecol Manag 116:107–117
Fan ZX, Bräuning A, Cao KF, Zhu SD (2009) Growth-climate responsesof high-elevation conifers in the central Hengduan Mountains,southwestern China. For Ecol Manag 258:306–313. https://doi.org/10.1016/j.foreco.2009.04.017
Int J Biometeorol (2020) 64:739–753750

Farjon A. (2013) Juniperus procera. The IUCN Red List of ThreatenedSpecies 2013: e.T33217A2835242. https://doi.org/10.2305/IUCN.UK.2013-1.RLTS.T33217A2835242.en. Downloaded on 26November 2019
Fazzini M, Bisci C, Billi P (2015) Landscapes and landforms of Ethiopia.https://doi.org/10.1007/978-94-017-8026-1
Fichtler E, Trouet V, Beeckman H et al (2004) Climatic signals in treerings of Burkea africana and Pterocarpus angolensis from semiaridforests in Namibia. Trees 18:442–451. https://doi.org/10.1007/s00468-004-0324-0
Friis I (1992) Forests and forest trees of northeast tropical Africa: theirnatural habitats and distribution patterns in Ethiopia, Djibouti andSomalia. HMSO, London
Fritts HC (1976) Tree rings and climate. Academic Press, San DiegoFunk C, Hoell A, Shukla S et al (2014) Predicting east African spring
droughts using Pacific and Indian Ocean Sea surface temperatureindices. Hydrol Earth Syst Sci 18:4965–4978. https://doi.org/10.5194/hess-18-4965-2014
Gasse F (2000) Hydrological changes in the African tropics since the lastglacial maximum. Quat Sci Rev 19(1–5):189–211 http://linkinghub.elsevier.com/retrieve/pii/S027737919900061X. Accessed Jan 2000
Gebregeorgis EG, Zewdie S, Wils THG et al (2018) Precipitation as themain driver of the radial growth of cupressus lusitanica (Mill.) atWondo genet, Ethiopia. Balt For 24:77–85
Gebrekirstos A, Mitlöhner R, Teketay D, Worbes M (2008) Climate-growth relationships of the dominant tree species from semi-aridsavanna woodland in Ethiopia. Trees 22:631–641. https://doi.org/10.1007/s00468-008-0221-z
Gebrekirstos A, Worbes M, Teketay D et al (2009) Stable carbon isotoperatios in tree rings of co-occurring species from semi-arid tropics inAfrica: patterns and climatic signals. Glob Planet Chang 66:253–260. https://doi.org/10.1016/j.gloplacha.2009.01.002
Gonzales IG (2001) WEISER: a computer program to identify event andpointer years in dendrochronological series. Dendrochronologia 19:239–244
Google Earth (2013) Version 7.1.2.2041. Weken Weybila Maryamchurch, 13° 04′ 20.82”N, 37° 49′ 42.18″E, Eye alt 2.99km.DigitalGlobe 2015. http://www.earth.google.com [April 10, 2015]
Groenendijk P, Sass-Klaassen U, Bongers F, Zuidema PA (2014)Potential of tree-ring analysis in a wet tropical forest: a case studyon 22 commercial tree species in Central Africa. For Ecol Manage323:65–68. https://doi.org/10.1016/j.foreco.2014.03.037
Harris I, Jones PD, Osborn TJ, Lister DH (2014) Updated high-resolutiongrids of monthly climatic observations - the CRU TS3.10 Dataset.Int J Climatol 34:623–642. https://doi.org/10.1002/joc.3711
Herrera-Ramirez D, Andreu-Hayles L, del Valle JI, Santos GM, GonzalezPLM (2017) Nonannual tree rings in a climate-sensitive Prioriacopaifera chronology in the Atrato River, Colombia. Ecol Evol 7:6334–6345. https://doi.org/10.1002/ece3.2905
Holmes RL (1983) Computer-assisted quality control in tree- ring datingand measurement. Tree-Ring Bull 43:69–78
Hua Q, Barbetti M, Worbes M et al (1999) Review of radiocarbon datafrom atmospheric and tree ring samples for the period 1950-1977AD. IAWA J 20:261–284
Hua Q, Barbetti M, Rakowski AZ (2013) Atmospheric radiocarbon forthe period 1950–2010. Radiocarbon 55:2059–2072. https://doi.org/10.2458/azu_js_rc.v55i2.16177
Jacoby GC (1989) Overview of tree-ring analysis in tropical regions. IntAssoc Wood Anat Bull 10:99–108. https://doi.org/10.1163/22941932-90000478
Kaplan IR (2003) Age dating of environmental organic residues. EnvironForensic 4:95–141. https://doi.org/10.1080/15275920303495
Keller EJ (1992) Drought, war, and the politics of famine in Ethiopia andEritrea. J Mod Afr Stud 30(4):609–624
Kurz-Besson CB, Lousada JL, Gaspar MJ et al (2016) Effects of recentminimum temperature and water deficit increases on Pinus pinaster
radial growth andwood density in southern Portugal. Front Plant Sci7:2005–2009. https://doi.org/10.3389/fpls.2016.01170
Lamb HF, Bates CR, Coombes PVet al (2007) Late Pleistocene desicca-tion of Lake Tana, source of the Blue Nile. Quat Sci Rev 26:287–299. https://doi.org/10.1016/j.quascirev.2006.11.020
Lamb HF, Bates CR, Bryant CL, Davies SJ, Huws DG, Marshall MH,Roberts HM, Toland H (2018) 150,000-year palaeoclimate recordfrom northern Ethiopia supports early, multiple dispersals of modernhumans from Africa. Sci Rep 8:1–7. https://doi.org/10.1038/s41598-018-19601-w
Larsson L-A (2003a) CooRecorder: image co-ordinate recording pro-gram. Cybis Dendrochronology. http://www.cybis.se. Accessed 20April 2016
Larsson L-A (2003b) CDendro: Cybis Dendro dating program. CybisDendrochronology. http://www.cybis.se. Accessed 20 April 2016
LaumerW, Andreu L, Helle G, Schleser GH,Wieloch T,Wissel H (2009)A novel approach for the homogenization of cellulose to use micro-amounts for stable isotope analyses. Rapid Commun MassSpectrom 23:1934–1940. https://doi.org/10.1002/rcm.4105
Lebourgeois F, Bréda N, Ulrich E, Granier A (2005) Climate-tree-growthrelationships of European beech (Fagus sylvatica L.) in the Frenchpermanent plot network (RENECOFOR). Trees 19:385–401.https://doi.org/10.1007/s00468-004-0397-9
Legesse D, Gasse F, Radakovitch O et al (2002) Environmental changesin a tropical lake (lake Abiyata, Ethiopia) during recent centuries.Palaeogeogr Palaeoclimatol Palaeoecol 187:233–258
Levin I, Hesshaimer V (2000) Radiocarbon – a unique tracer of globalcarbon cycle dynamics. Radiocarbon 42:69–80. https://doi.org/10.2458/azu_js_rc.42.3855
Levin I, Kromer B (1997) Twenty years of atmospheric 14CO2 observa-tions at Schauinsland Station, Germany. Radiocarbon 39:205–218.https://doi.org/10.2458/azu_js_rc.39.1942
Levin I, Kromer B, Schmidt M, Sartorius H (2003) A novel approach forindependent budgeting of fossil fuel CO 2 over Europe by 14CO2observations. Geophys Res Lett 30:2194. https://doi.org/10.1029/2003GL018477
Linares R, Santos HC, Brandes AFN et al (2017) Exploring the 14Cbomb peak with tree rings of tropical species from the Amazonforest. Radiocarbon 59:303–313. https://doi.org/10.1017/RDC.2017.10
Liu P, Deng R, Smith K, et al (2007) Transmission efficiency of anaerodynamic focusing lens system: Comparison of model calcula-tions and laboratory measurements for the Aerodyne Aerosol MassSpectrometer. Aerosol Sci Technol 41:721–733. https://doi.org/10.1080/02786820701422278
Loader NJ, Robertson I, Barker AC, et al (1997) An improved techniquefor the batch processing of small wholewood samples toα-cellulose.Chem Geol 136:313–317. https://doi.org/10.1016/S0009-2541(96)00133-7
Makombe G, Kelemework D, Aredo D (2007) A comparative analysis ofrainfed and irrigated agricultural production in Ethiopia. Irrig DrainSyst 21:35–44. https://doi.org/10.1007/s10795-007-9018-2
Matisons R, Elferts D, Brumelis G (2013) Pointer years in tree-ring widthand earlywood-vessel area time series of Quercus robur-relationwith climate factors near its northern distribution limit.Dendrochronologia 31:129–139. https://doi.org/10.1016/j.dendro.2012.10.001
Mérian P, Pierrat JC, Lebourgeois F (2013) Effect of sampling effort onthe regional chronology statistics and climate-growth relationshipsestimation. Dendrochronologia 31:58–67. https://doi.org/10.1016/j.dendro.2012.07.001
Meyer FD (1998–1999) Pointer year analysis in dendroecology: a com-parison of methods. Dendrochronologia 16–17:193–204
Mokria M, Gebrekirstos A, Abiyu A, van Noordwijk M, Bräuning A(2017) Multi-century tree-ring precipitation record reveals increas-ing frequency of extreme dry events in the upper Blue Nile River
Int J Biometeorol (2020) 64:739–753 751

catchment. Glob Chang Biol 23:5436–5454. https://doi.org/10.1111/gcb.13809
Mokria M, Gebrekirstos A, Abiyu A, Bräuning A (2018) Upper NileRiver flow reconstructed to a.D. 1784 from tree-rings for a long-term perspective on hydrologic-extremes and effective water re-source management. Quat Sci Rev 199:126–143. https://doi.org/10.1016/j.quascirev.2018.09.011
Mosissa D, Abraha B (2018) A review of conservation of biodiversity insacred natural sites in Ethiopia : the role of Ethiopian orthodoxTewahedo church. J Plant Sci Res 5:1–9
Mwangi E,Wetterhall F, Dutra E et al (2014) Forecasting droughts in EastAfrica. 18:611–620. https://doi.org/10.5194/hess-18-611-2014
Nabais C, Campelo F, Vieira J, Cherubini P (2014) Climatic signals oftree-ring width and intra-annual density fluctuations in Pinuspinaster and Pinus pinea along a latitudinal gradient in Portugal.Forestry 87:598–605. https://doi.org/10.1093/forestry/cpu021
Nash DJ, De Cort G, Chase BM et al (2016) African hydroclimatic var-iability during the last 2000 years. Quat Sci Rev 154:1–22
Neuwirth B, Schweingruber FH, Winiger M (2007) Spatial patterns ofcent ra l European poin ter years f rom 1901 to 1971.Dendrochronologia 24:79–89. https://doi.org/10.1016/j.dendro.2006.05.004
Nicholson SE (2001) Climatic and environmental change in Africa dur-ing the last two centuries. Clim Res 17:123–144. https://doi.org/10.3354/cr017123
Nicholson SE (2014) The predictability of rainfall over the greater horn ofAfrica. Part I: prediction of seasonal rainfall. J Hydrometeorol 15:1011–1027. https://doi.org/10.1175/JHM-D-13-062.1
Nydal R, Lövseth K (1966) Carbon-14 measurements in atmosphericCO2 from northern and southern hemisphere sites, 1962-1963. JChem Inf Model 53:1689–1699. https://doi.org/10.1017/CBO9781107415324.004
Orvis KH, Grissino-Mayer HD (2002) Standardizing the reporting ofabrasive papers used to surface tree-ring samples. Tree Ring Res58:47–50
Pallardy S (2013) Physiology of woody plants. J Chem Inf Model 53:1689–1699. https://doi.org/10.1017/CBO9781107415324.004
Pilcher J (1990) Sample preparation, cross-dating and measurement. In:Cook E, Kairiukstis L (eds) Methods of dendrochronology.Applications in the environmental sciences. Kluwer Acad(Springer), Dordrecht, pp 40–51
Reimer PJ, Brown TA, Reimer RW (2004) Discussion: reporting andcalibration of post-bomb 14C data. Radiocarbon 46:1299–1304.https://doi.org/10.2458/azu_js_rc.46.4183
Rinne KT, Boettger T, Loader NJ et al (2005) On the purification ofalpha-cellulose from resinous wood for stable isotope. Chem Geol:75–82
Robertson I, Froyd CA,Walsh RPD et al (2004) The dating of dipterocarptree rings: establishing a record of carbon cycling and climaticchange in the tropics. J Quat Sci 19:657–664. https://doi.org/10.1002/jqs.885
Schongart J, Orthmann B, Hennenberg KJ et al (2006) Climate-growthrelationships of tropical tree species in West Africa and their poten-tial for climate reconstruction. Glob Chang Biol 12:1139–1150.https://doi.org/10.1111/j.1365-2486.2006.01154.x
Schweingruber FH (1988) Tree rings: basics and applications of dendro-chronology. Kluwer Academic Publishers (Springer), Dordrecht,Netherlands. https://doi.org/10.1007/978-94-009-1273-1_5
Schweingruber FH (1992) Annual growth rings and growth zones inwoody plants in southern Australia. IAWA J 13:359–379
Schweingruber FH, Eckstein D, Serre-Bachet F, Bräker OU (1990)Identification, presentation and interpretation of event years andpointer years in dendrochronology. Dendrochronologia 8:9–38
Slimani S, Derridj A, Gutierrez E (2014) Ecological response of cedrusatlantica to climate variability in the massif of guetiane (Algeria).For Syst 23:448–460. https://doi.org/10.5424/fs/2014233-05175
Speer JH (2010) Fundamentals of tree ring research. University ofArizona Press, Tucson
Stokes MA, Smiley TL (1968) An introduction to tree-ring dating.University of Chicago Press, Illinois
Stuiver M, Polach H (1977) Reporting of 14C data. Radiocarbon 19:355–363. https://doi.org/10.1016/j.forsciint.2010.11.013
Stuiver M, Reimer PJ, Reimer RW (2017) CALIB 7.1. In: [WWW pro-gram] http://calib.org. Accessed Sept 2017
Swetnam TW, ThompsonMA, Sutherland EK (1985) Using dendrochro-nology to measure radial growth of defoliated trees. Agric Handb,US Department of Agriculture, Forest Service
Tans P (1981) A compilation of bomb 14C data for use in global carbonmodel calculations. In: Bolin B (ed) Carbon cycle modeling (scope16). Wiley, New York, pp 131–157
Tierney JE, Smerdon JE, Anchukaitis KJ, Seager R (2013) Multidecadalvariability in east African hydroclimate. Nature 493:389–392.https://doi.org/10.1038/nature11785
Tomlinson P, Longman K (1981) Growth phenology of tropical trees inrelation to cambial activity. In: Bormann FH, Beryl G (eds) Age andgrowth rate of tropical trees: new dimensions for research. YaleUniversity, New Haven, pp 7–19
Touchan R, Funkhouser G, Hughes MK, Erkan N (2005) Standardizedprecipitation index reconstructed from Turkish tree-ring widths.Clim Chang 72:339–353. https://doi.org/10.1007/s10584-005-5358-9
Touchan R, Akkemik Ü, Hughes MK, Erkan N (2007) May-June precip-itation reconstruction of southwestern Anatolia, Turkey during thelast 900 years from tree rings. Quat Res 68(2):196–202. https://doi.org/10.1016/j.yqres.2007.07.001
Umer M, Lamb HF, Bonnefille R et al (2007) Late Pleistocene andHolocene vegetation history of the Bale Mountains, Ethiopia. QuatSci Rev 26:2229–2246. https://doi.org/10.1016/j.quascirev.2007.05.004
Vaganov EA, Schulze E-D, Skomarkova MV, Knohl A, Brand WA,Roscher C (2009) Intra-annual variability of anatomical structureand d13C values within tree rings of spruce and pine in alpine,temperate and boreal Europe. Oecologia 161:729–745. https://doi.org/10.1007/s00442-009-1421-y
Verschuren D, Laird K, Cumming BF (2000) Rainfall and drought inequatorial East Africa during the past 1100 years. Nature 403:410–414. https://doi.org/10.1038/35000179
Viste E, Korecha D, Sorteberg A (2012) Recent drought and precipitationtendencies in Ethiopia. Theor Appl Climatol 112:535–551. https://doi.org/10.1007/s00704-012-0746-3
Vogel JS, Nelson DE, Southon JR (1989) Accuracy and precision indating microgram carbon samples. Radiocarbon 31:145–149.https://doi.org/10.1017/S0033822200044799
Wang HQ, Chen F, Ermenbaev B, Satylkanov R (2017) Comparison ofdrought-sensitive tree-ring records from the Tien Shan ofKyrgyzstan and Xinjiang (China) during the last six centuries.Adv Clim Chang Res 8:18–25. https://doi.org/10.1016/j.accre.2017.03.004
Webb P, von Braun J, Teklu T (1991) Drought and famine in Ethiopia andSudan: an ongoing tragedy. Nat Hazards 4:85–86. https://doi.org/10.1007/BF00126561
Wigley TML, Briffa KR, Jones PD (1984) On the average value of cor-related time series, with applications in dendroclimatology and hy-drometeorology. J Clim Appl Meteorol 23:201–213. https://doi.org/10.1175/1520-0450(1984)023<0201:OTAVOC>2.0.CO;2
Wigley TML, Jones PD, Briffa KR (1987) Cross-dating methods in den-drochronology. J Archaeol Sci 14:51–64. https://doi.org/10.1016/S0305-4403(87)80005-5
Williams AP, Funk C (2011) A westward extension of the warm poolleads to a westward extension of the Walker circulation, dryingeastern Africa. Clim Dyn 37:2417–2435. https://doi.org/10.1007/s00382-010-0984-y
Int J Biometeorol (2020) 64:739–753752

Williams AP, Funk C, Michaelsen J et al (2012) Recent summer precip-itation trends in the Greater Horn of Africa and the emerging role ofIndian Ocean sea surface temperature. Clim Dyn 39:2307–2328
Wils THG, Robertson I, Eshetu Z et al (2009) Periodicity of growth ringsin Juniperus procera from Ethiopia inferred from crossdating andradiocarbon dating. Dendrochronologia 27:45–58. https://doi.org/10.1016/j.dendro.2008.08.002
Wils THG, Robertson I, Eshetu Z et al (2010) Towards a reconstruction ofBlue Nile baseflow from Ethiopian tree rings. Holocene 20:837–848. https://doi.org/10.1177/0959683610365940
Wils THG, Robertson I, Eshetu Z et al (2011a) Crossdating Juniperusprocera from North Gondar, Ethiopia. Trees 25:71–82. https://doi.org/10.1007/s00468-010-0475-0
Wils THG, Sass-Klaassen UGW, Eshetu Z et al (2011b)Dendrochronology in the dry tropics: the Ethiopian case. Trees 25:345–354. https://doi.org/10.1007/s00468-010-0521-y
Woodborne S, Gandiwa P, Hall G et al (2016) A regional stable carbonisotope dendro-climatology from the South African summer rainfallarea. PLoS One 11:1–15. https://doi.org/10.1371/journal.pone.0159361
Worbes M (1999) Annual growth rings , rainfall-dependent growth andlong-term growth patterns of tropical trees from the Caparo Forest
Reserve in Venezuela. Br Ecol Soc 87:391–403. https://doi.org/10.1046/j.1365-2745.1999.00361.x
Worbes M (2002) One hundred years of tree-ring research in the tropics –a brief his tory and an outlook to future chal lenges.Dendrochronologia 20:217–231. https://doi.org/10.1078/1125-7865-00018
Worbes M, Staschel R, Roloff A, Junk WJ (2003) Tree ring analysisreveals age structure, dynamics and wood production of a naturalforest stand in Cameroon. For EcolManag 173:105–123. https://doi.org/10.1016/S0378-1127(01)00814-3
Worbes M, Herawati H, Martius C (2017) Tree growth rings in tropicalpeat swamp forests of Kalimantan, Indonesia. Forests 8:1–15.https://doi.org/10.3390/f8090336
Xu X, Trumbore SE, Zheng S et al (2007) Modifying a sealed tube zincreduction method for preparation of AMS graphite targets: reducingbackground and attaining high precision. NIM B: Beam Interactionswith Materials and Atoms 259(1):320–329. https://doi.org/10.1016/j.nimb.2007.01.175
Publisher’s note Springer Nature remains neutral with regard to jurisdic-tional claims in published maps and institutional affiliations.
Int J Biometeorol (2020) 64:739–753 753