Historical Cartography of Rio de Janeiro: Spatial and Temporal Reconstitution of Downtown
31
Historical Cartography of Rio de Janeiro: Spatial and Temporal Reconstitution of Downtown Douglas Corbari Corrêa, DSc Brazilian Army – Geographic Service – 5 th DL [email protected] Paulo Márcio Leal de Menezes , DSc UFRJ – Geography Department [email protected]
description
Historical Cartography of Rio de Janeiro: Spatial and Temporal Reconstitution of Downtown. Douglas Corbari Corrêa, DSc Brazilian Army – Geographic Service – 5 th DL [email protected] Paulo Márcio Leal de Menezes , DSc UFRJ – Geography Department [email protected]. - PowerPoint PPT Presentation
Transcript of Historical Cartography of Rio de Janeiro: Spatial and Temporal Reconstitution of Downtown

Historical Cartography of Rio de Janeiro:
Spatial and Temporal Reconstitution of Downtown
Douglas Corbari Corrêa, DScBrazilian Army – Geographic Service – 5th DL
Paulo Márcio Leal de Menezes, DScUFRJ – Geography Department
2
Summary
IntroductionCartography and Rio de Janeiro CityDowntown RioMethodological ProceduresConclusion
3
Introduction
Past and Present: streets of downtown Observation through the maps Center of the City of Rio de Janeiro:
– transformations– more then 400 years– heart of the city– maps from 1700 until 2000

4
Goals
To build maps of comparison of historical maps of Downtown Rio dating from different and significant periods, considering the features corresponding to the streets and shoreline; andTo propose a methodology for registration of those maps in pairs, even when they do not have well defined scale, projection or coordinates.

5
Old maps x historical maps Foundation of the city: 1565 Initial selection of maps:
– Historical highlights– Cartographical highlights
Cartography and Rio de Janeiro City

6
André Thevet Chart (1560)
• French contribution

7
Jacques de Vaulx Chart (1579)
• French contribution• First plan of the city• First economic and topographic map of ‘Carioca’ land

8
Chart of Rio de Janeiro, by Luiz Teixeira (1586)
• First specialized Portugese chart of Guanabara region
• Beginning of the expansion of the city toward the meadow, between Castelo and São Bento hills.

9
Reys-Boeck Chart (1624)
• Dutch activity• Expansion through the meadow among Castelo, São Bento, Conceição and Santo Antônio hills.

10
Albernaz I Chart (1626)
• Strong iconographic representation

11Appearance of Rio de Janeiro, by Albernaz II (1666)
• Incorrect geometry• Ocupation of the city

12
18th Century: – Scientific mapping– Astronomy and surveying– Orthogonal projection
Cartography and Rio de Janeiro City
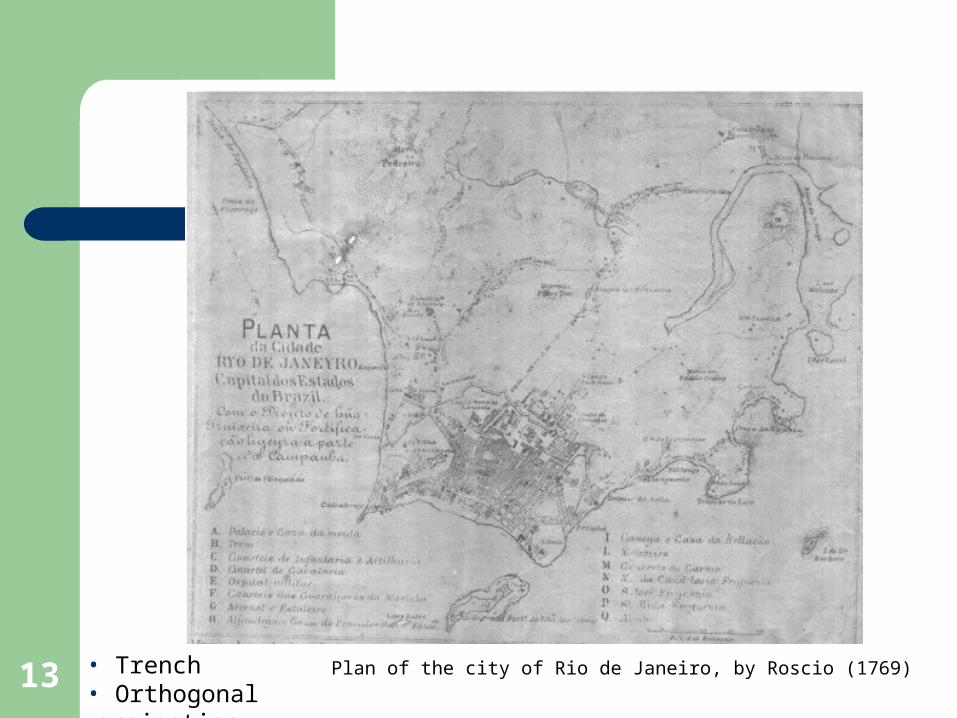
13 Plan of the city of Rio de Janeiro, by Roscio (1769) • Trench• Orthogonal projection

14 Plan of the city, by order of the Regent Prince (1812) • Influence of the arrival of the royal family.

15 Map of Downtown Rio (1838)• Shadow techniques• Geometric details
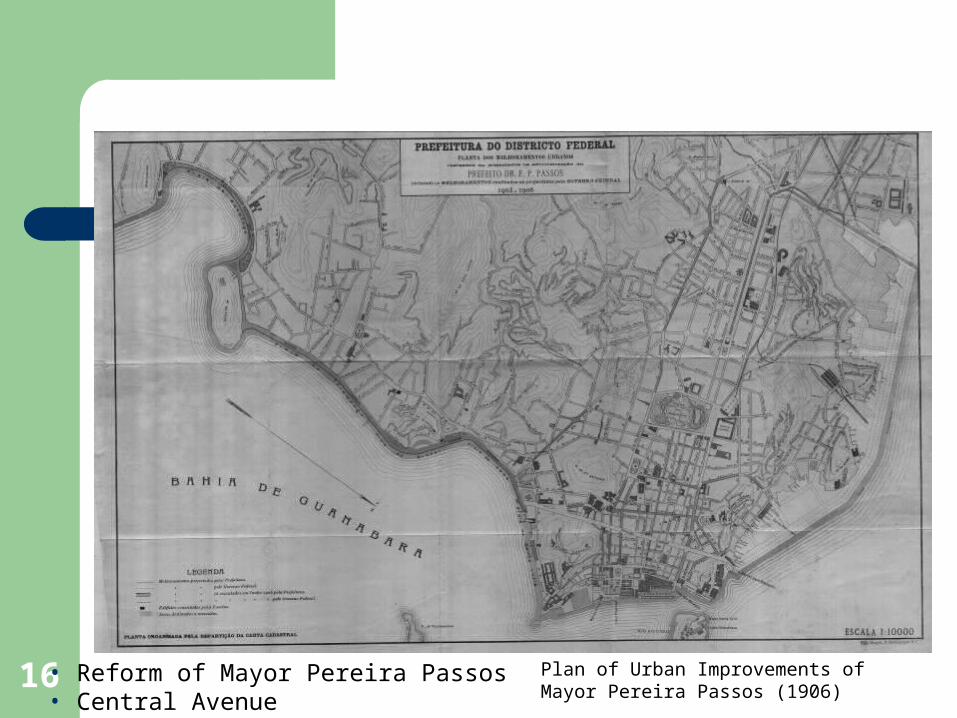
16 Plan of Urban Improvements of Mayor Pereira Passos (1906)
• Reform of Mayor Pereira Passos• Central Avenue
17
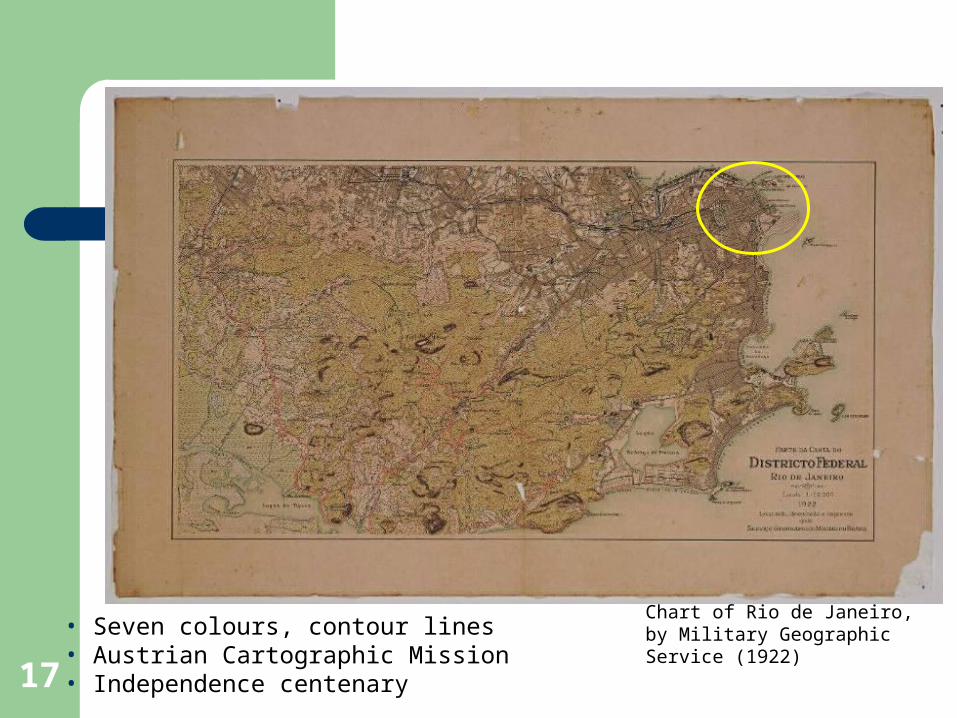
Chart of Rio de Janeiro, by Military Geographic Service (1922)
• Seven colours, contour lines• Austrian Cartographic Mission• Independence centenary

18
Topographic Chart, by DSG (1987)
• Legend, projection, coordinates, ...• Expansion of the city

19Ortophoto of Downtown Rio (East Side). Date of flight: 1999.Source: IPP (2008).
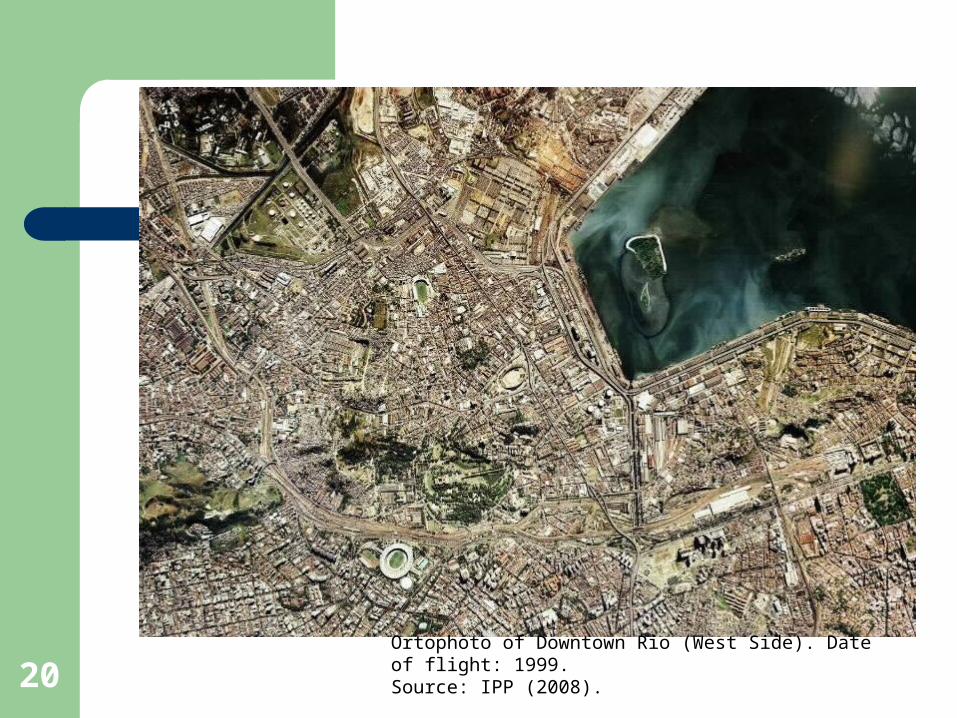
20Ortophoto of Downtown Rio (West Side). Date of flight: 1999.Source: IPP (2008).
21
Downtown Rio
The Center of Rio or Downtown Rio was not always where it is today
– Sugar Loaf/Cara de Cão Hill; Carioca River; Castelo Hill; plain among the hills Castelo, São Bento, Conceição and Santo Antônio
– Anchorage; proximity to water; security/defense– Center as a pole, which attracts political, social and economical
activities.
Description and delimitation of the center: decree – July 23rd 1981
The Center of Rio went through many transformations in its landscape, involving construction and demolition over time

22
Downtown Rio (Centro) and Adjacent Neighborhoods
Source: Adapted from IPP (2008)
Glória
Santa TeresaCatumbi
Estácio
Cidade Nova
Santo Cristo Gamboa Saúde
CENTRO

23
Construction / Demolition– Dinamism– Relief / Urban Network– Reasons:
Air, hygiene, sanitary, esthetic, modernity, economical interests
Examples:– Construction of Central Avenue (1905)– Demolition of Castelo Hill (1922)– Construction of Presidente Vargas Avenue (1944)
Downtown Rio
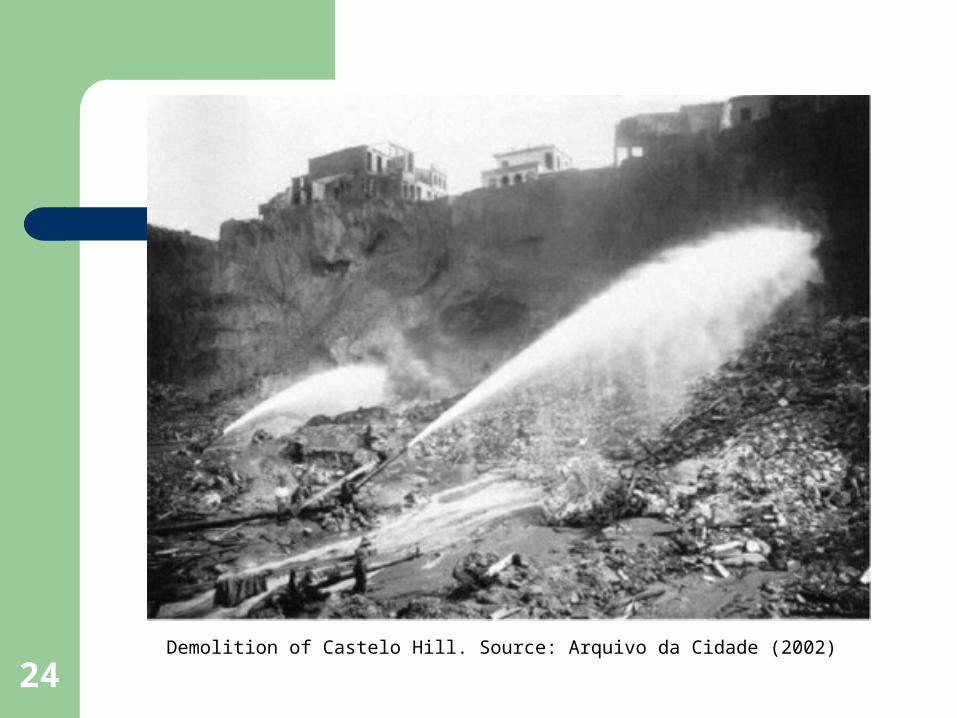
24Demolition of Castelo Hill. Source: Arquivo da Cidade (2002)

25Flowchart of Stages
Methodological Procedures
Methodological Procedures
26
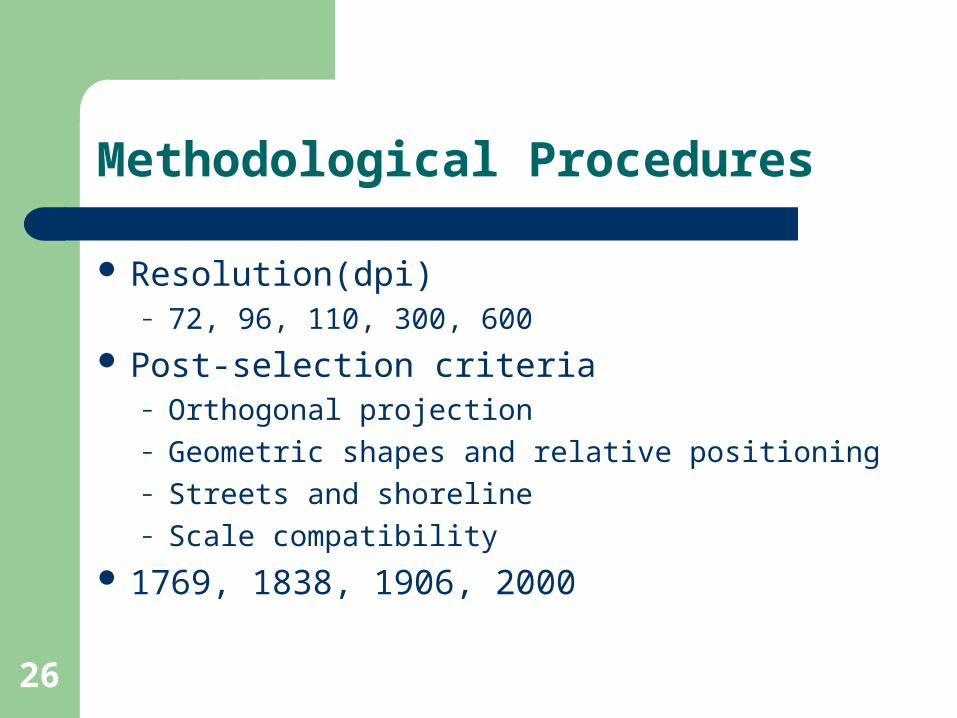
Resolution(dpi)– 72, 96, 110, 300, 600
Post-selection criteria– Orthogonal projection– Geometric shapes and relative positioning– Streets and shoreline– Scale compatibility
1769, 1838, 1906, 2000
Methodological Procedures

27
Georeferencing– Afine x Adjust
Comparison of Maps– Comparison in pairs between vectorial
subsequent maps, from the most recent to the oldest one.
– Historical Sync Analysis
Methodological Procedures

28
Synthesis Map [1906 x 2000]
Streets_2000 ________Streets_1906 ________Shoreline_2000 ________Shoreline_1906 ________

29
Synthesis Map [1838 x 1906]
Streets_1906 ________Streets_1838 ________Shoreline_1906 ________Shoreline_1838 ________

30
Synthesis Map [1769 x 1838]
Streets_1838 ________Streets_1769 ________Shoreline_1838 ________Shoreline_1769 ________

31
Conclusion
Quality concerning resolution in scaning process– Control points identification– Vectorial digitalization
French invasions, construction of fortifications, royal family in Brazil, construction of avenues, and demolition of Castelo Hill, ...
Chalenges: scale, coordinates system, projection, low resolution Synthesis Maps
– Spatial-temporal evolution can be reconstituted– Planning policy– Expasion of the urban network– High density at Downtown– Extension of shoreline, and, then, its stagnation